Exhibit 99.1

|
Press Contact: |
|
Investor Contact: |
||
|
Trinseo |
|
Trinseo |
||
|
Matthew Cassidy |
|
Andy Myers |
||
|
Tel : +1 610-240-3264 |
|
Tel : +1 610-240-3221 |
||
|
Email: [email protected] |
Email: [email protected] |
Trinseo Reports First Quarter 2020 Financial Results; Provides COVID-19 Update
First Quarter 2020 and Other Highlights
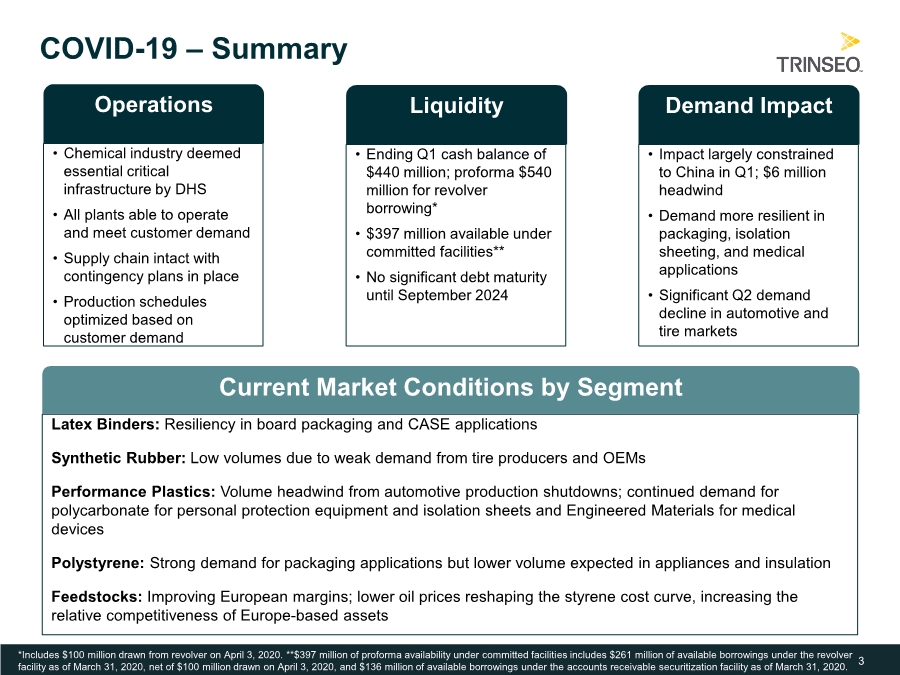
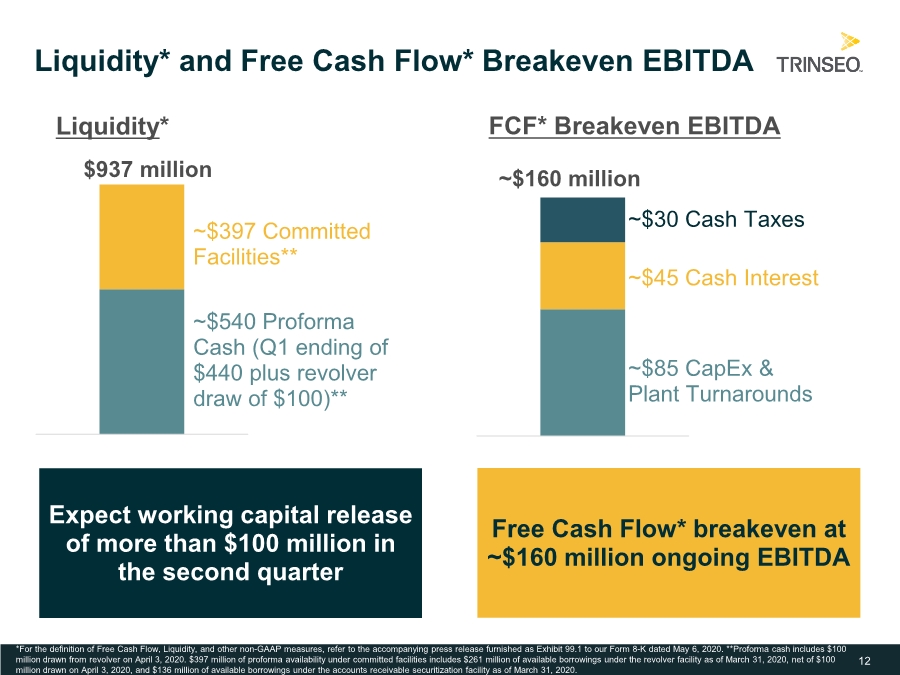
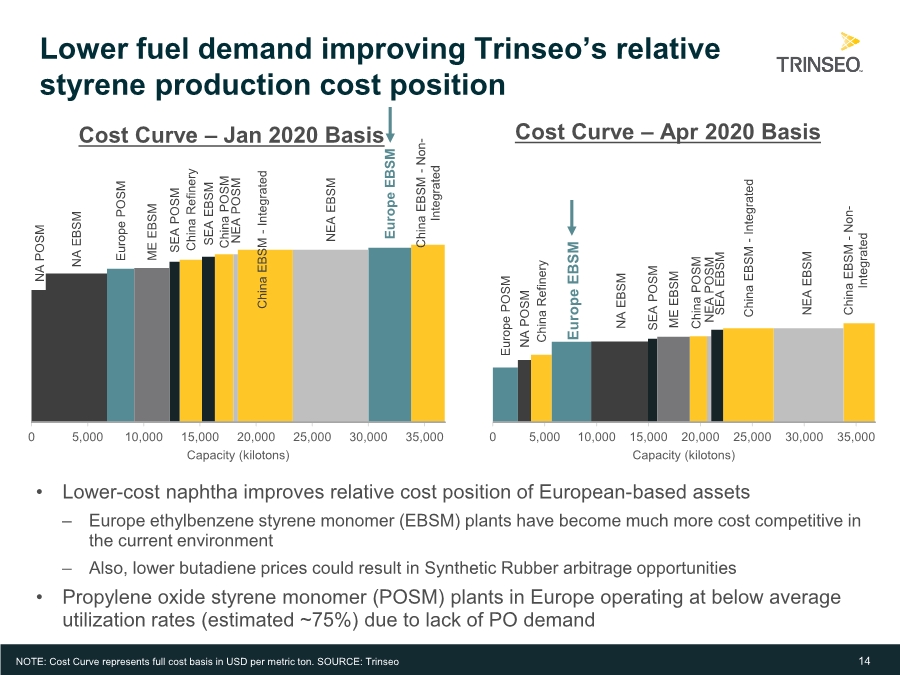
Liquidity-focused actions taken in response to COVID-19 to improve the already strong position, including the reduction of capital spending, operating expenses, and working capital, which resulted in quarter-ending cash and cash equivalents of $440 million and Liquidity* of $937 million
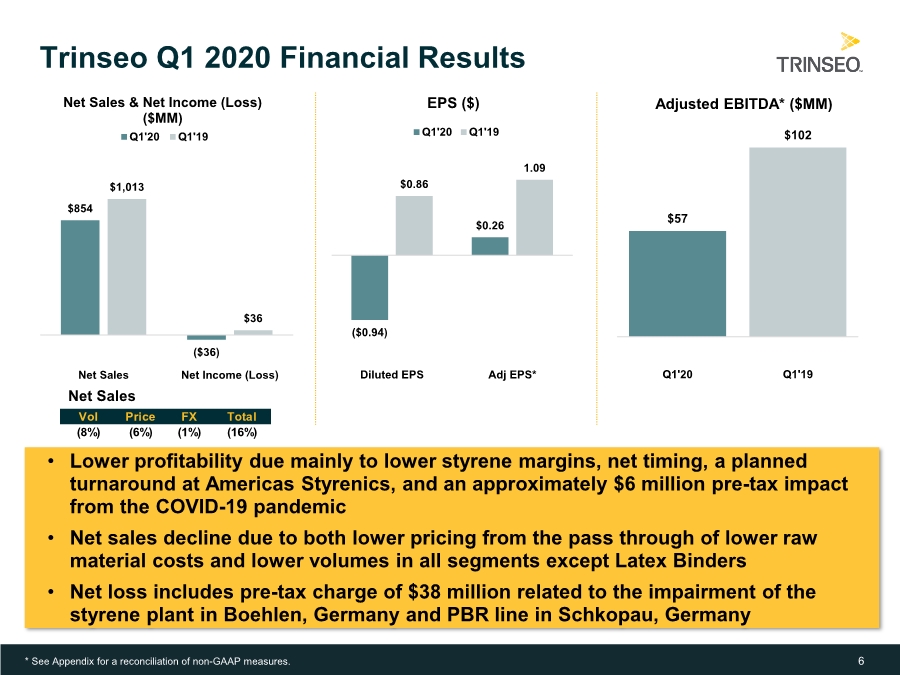
Net loss of $36 million and diluted EPS of ($0.94), inclusive of a one-time pre-tax $38 million charge related to the impairment of certain long-lived assets in Boehlen, Germany and Schkopau, Germany, aligned to management’s ongoing strategy implementation; Adjusted EPS of $0.26
Adjusted EBITDA of $57 million, including a $15 million unfavorable impact from net timing
|
|
|
Three Months Ended |
||||
|
|
|
March 31, |
||||
|
$millions, except per share data |
|
2020 |
|
2019 |
||
|
Net Sales |
|
$ |
854 |
|
$ |
1,013 |
|
Net Income (Loss) |
|
|
(36) |
|
|
36 |
|
EPS (Diluted) ($) |
|
|
(0.94) |
|
|
0.86 |
|
Adjusted Net Income* |
|
|
10 |
|
|
46 |
|
Adjusted EPS ($)* |
|
|
0.26 |
|
|
1.09 |
|
EBITDA* |
|
|
(2) |
|
|
91 |
|
Adjusted EBITDA* |
|
|
57 |
|
|
102 |
*For a reconciliation of EBITDA, Adjusted EBITDA, and Adjusted Net Income, all of which are non-GAAP measures, to Net Income, as well as a reconciliation of Adjusted EPS and Liquidity, see Notes 2 and 3 to the financial statements included below.
BERWYN, Pa — May 6, 2020 — Trinseo (NYSE: TSE), a global materials company and manufacturer of plastics, latex binders and synthetic rubber, today reported its first quarter 2020 financial results.
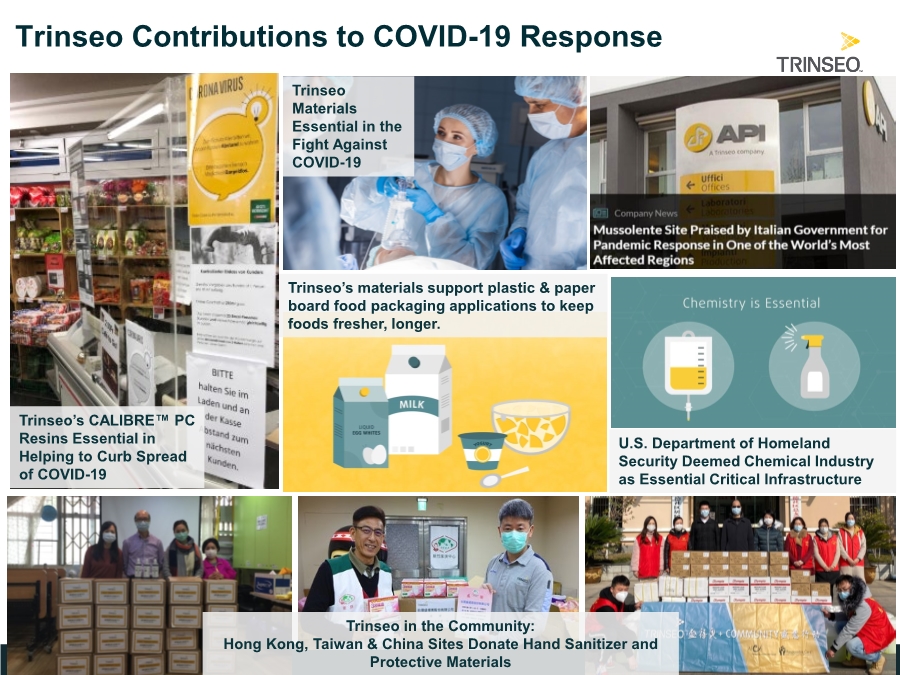
“Trinseo has taken proactive steps to minimize the potential impact of the COVID-19 crisis on our employees and other stakeholders, as well as the financial impacts to the Company. Our primary focus has been maintaining a safe and healthy workplace for our approximately 2,700 employees and other stakeholders,” said Frank Bozich, President and Chief Executive Officer of Trinseo. “I’m extremely grateful for our operational personnel and business partners who have enabled the continued, safe operation of all of our facilities that are meeting customer demand, including products that are essential to the recovery from this pandemic.”
Net sales in the first quarter decreased 16% versus prior year. Lower volumes in the Polystyrene, Performance Plastics, Feedstocks, and Synthetic Rubber segments led to an 8% decrease. Lower prices, mainly due to the pass through of lower raw material costs, resulted in a 6% decrease. First quarter net loss of $36 million was $72 million below prior year net income and first quarter Adjusted EBITDA of $57 million, including an unfavorable net timing impact of $15 million, was $45 million below prior year. The net loss included a pre-tax charge of approximately $38 million related to the impairment of certain long-lived assets in Boehlen, Germany and Schkopau, Germany. In March, unrelated to COVID-19, the Company initiated a consultation process with the Economic Council and
Works Councils of Trinseo Deutschland regarding the disposition of these assets. Operationally, profitability was lower than prior year due mainly to lower styrene margins, which impacted the Feedstocks and Americas Styrenics segments, as well as a large planned turnaround at Americas Styrenics’ St. James, Louisiana styrene monomer facility that lasted the majority of the quarter.
Cash used in operating activities for the first quarter was $6 million and capital expenditures were $24 million, resulting in Free Cash Flow for the quarter of negative $30 million. This result included approximately $30 million of spending for our systems and process transition from Dow, which is now largely complete, as well as for plant turnarounds, restructuring, and manufacturing systems upgrades. It also reflected a $15 million increase in net working capital from inventory builds ahead of second quarter turnarounds. The Company repurchased approximately 0.8 million shares in the first quarter for approximately $25 million. The cash balance at the end of the quarter was $440 million. For a reconciliation of Free Cash Flow to cash provided by operating activities, see Note 3 below.
Commenting on the Company’s first quarter performance, Bozich said, “We saw sequential improvements across all of our derivative businesses to start the year, which were partially offset by lower styrene margins and the planned turnaround at Americas Styrenics. The first quarter COVID-19 impacts, which had an adverse impact of approximately $6 million, were primarily related to lower Synthetic Rubber demand in China. I am very proud of our employees as we were able to work safely and meet customer demand under some challenging conditions.”
First Quarter Results and Commentary by Business Segment
|
· |
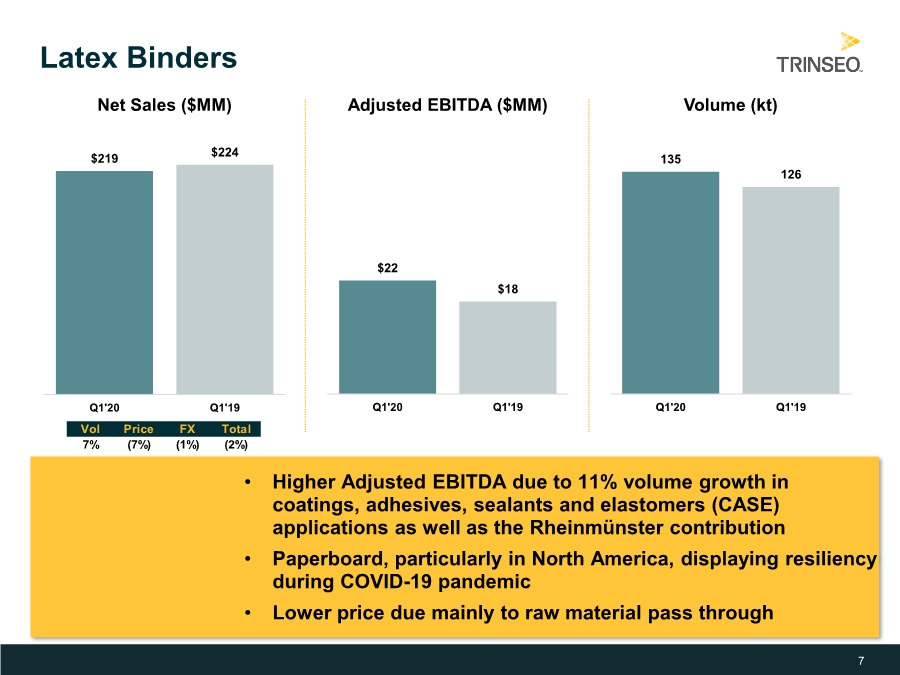
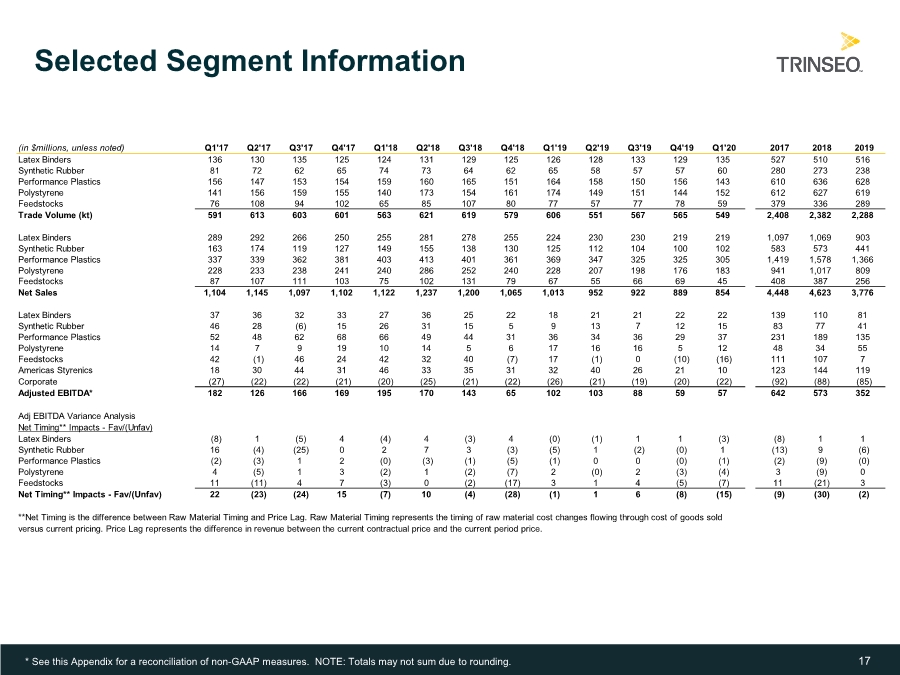
Latex Binders net sales of $219 million for the quarter decreased 2% versus prior year as higher volume was more than offset by lower price from the pass through of lower raw material costs. Adjusted EBITDA of $22 million was $4 million higher than prior year due to higher volume in coatings, adhesives, sealants, and elastomers (CASE) applications, which increased 11%, as well as contribution from the Rheinmünster acquisition. |
|
· |
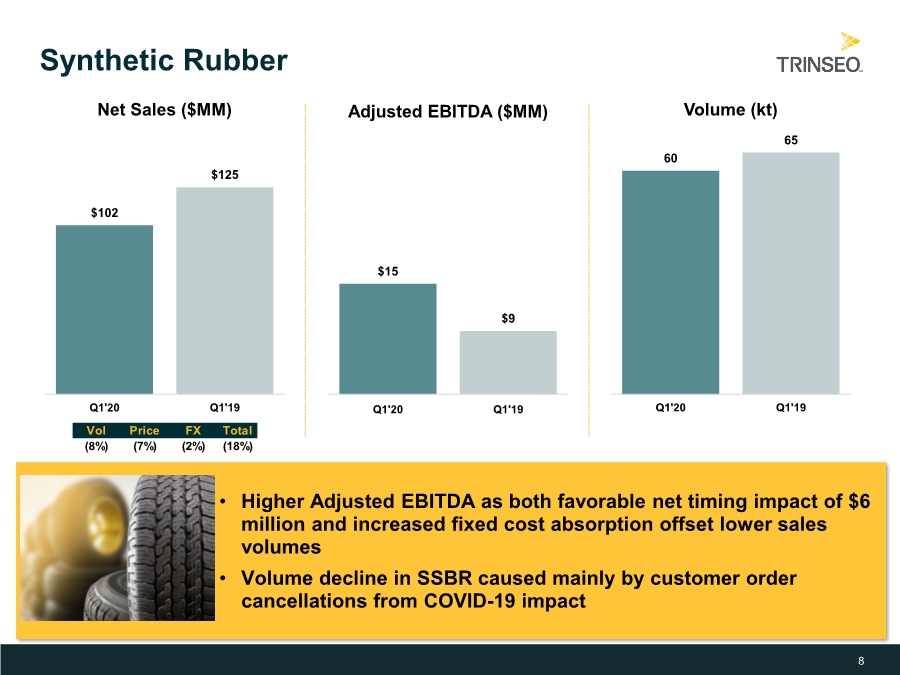
Synthetic Rubber net sales of $102 million for the quarter decreased 18% versus prior year. This was due to both a volume decline of 8%, primarily caused by COVID-19, and a price decline of 7%, mainly from the pass through of lower raw material costs. Adjusted EBITDA of $15 million was $6 million above prior year due mainly to favorable year-over-year net timing as well as higher fixed cost absorption ahead of the planned second quarter turnaround. These impacts were partially offset by lower sales volume. |
|
· |
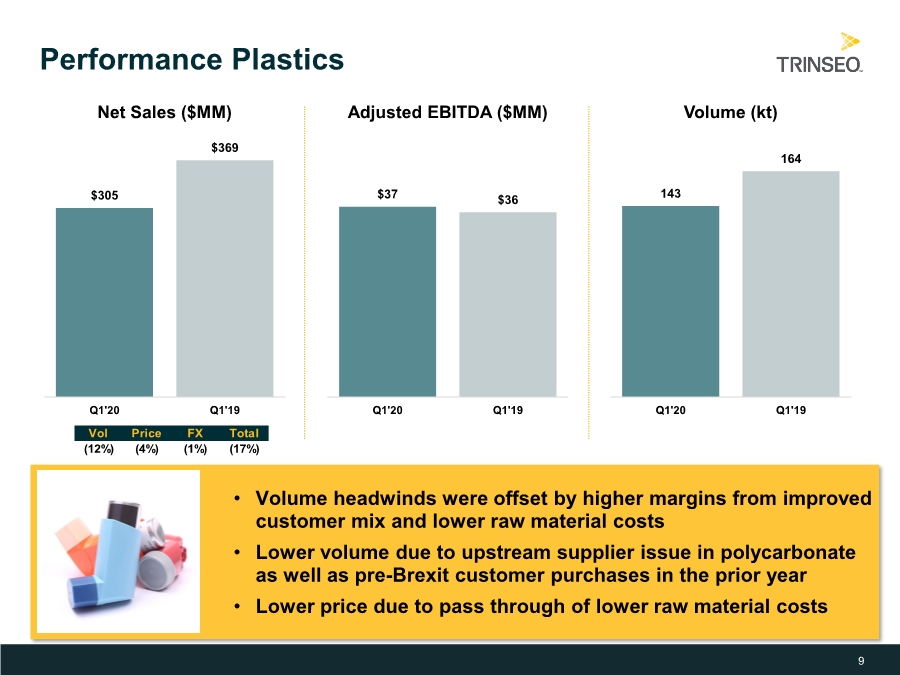
Performance Plastics net sales of $305 million for the quarter were 17% below prior year due mainly to lower sales volume from an upstream supplier issue in polycarbonate as well as pre-Brexit customer purchases in the prior year. Adjusted EBITDA of $37 million was slightly higher than prior year as higher margins from improved customer mix and lower raw material costs were largely offset by lower volume. Engineered Materials sales volumes were 1% higher than prior year. |
|
· |
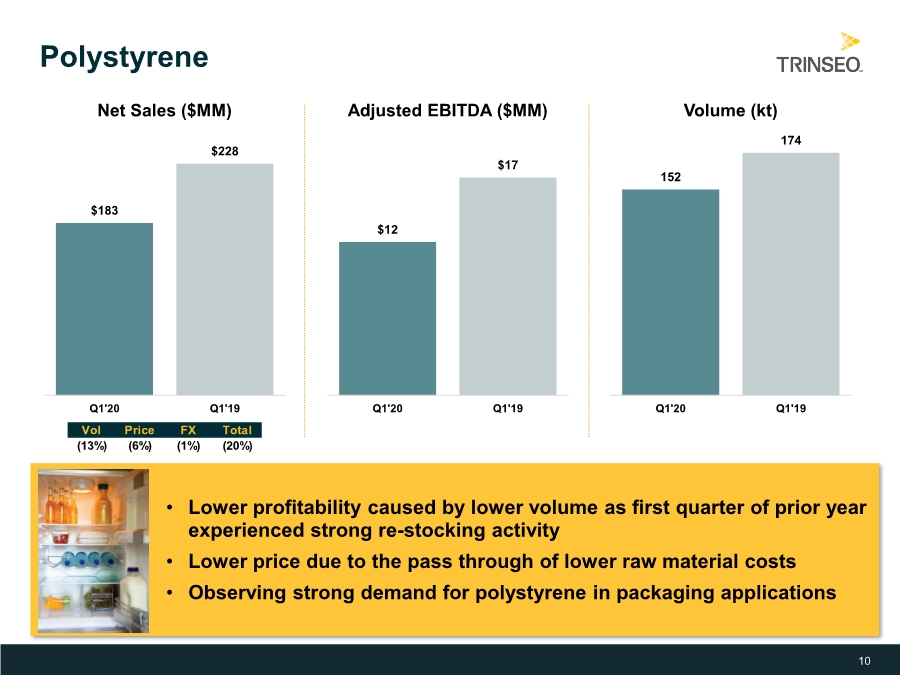
Polystyrene net sales of $183 million for the quarter were 20% below prior year. Lower sales volume impacted net sales by 13% due primarily from strong re-stocking activity in the first quarter of last year. Lower price from the pass through of lower raw material costs impacted net sales by 6%. Adjusted EBITDA of $12 million was $5 million lower than prior year due mainly to lower sales volume. |
|
· |
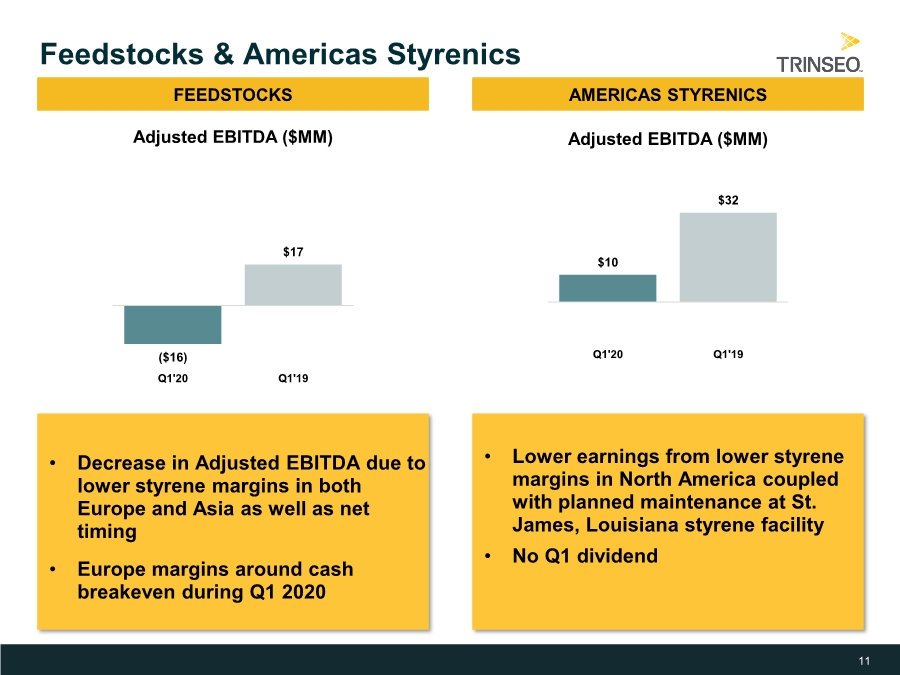
Feedstocks net sales of $45 million for the quarter were 33% below prior year due mainly to lower styrene-related net sales. Adjusted EBITDA of negative $16 million was $33 million lower than prior year due to lower margins in Europe and Asia from weaker market conditions as well as an unfavorable net timing impact of $10 million. |
|
· |
Americas Styrenics Adjusted EBITDA of $10 million for the quarter was $22 million below prior year due mainly to lower styrene margins and the impact from the planned styrene turnaround. |
COVID-19 Response and Outlook
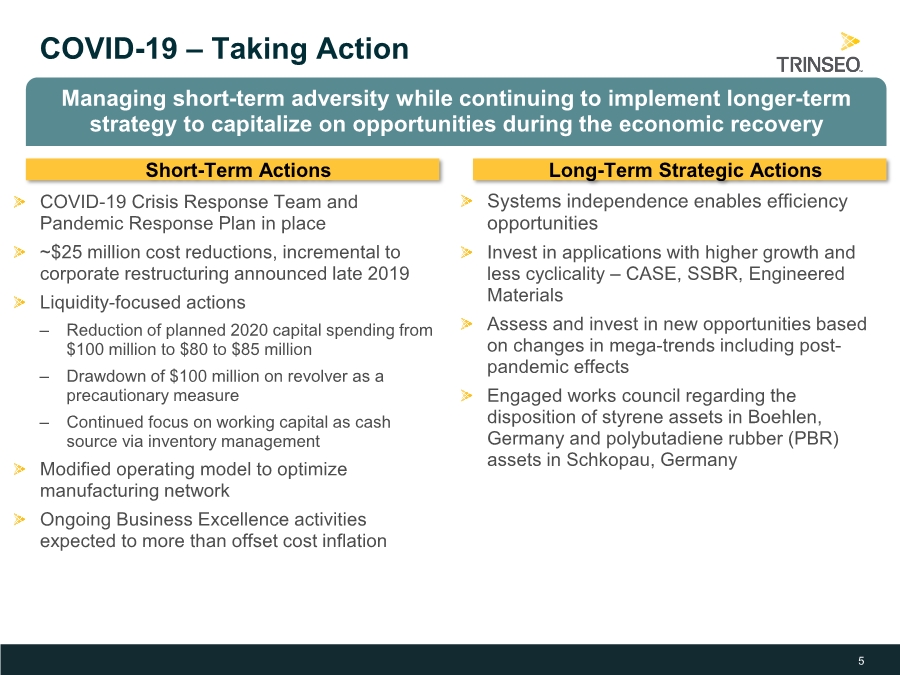
The Company previously withdrew its full-year 2020 guidance due to market uncertainty from the COVID-19 pandemic. In response to the pandemic, it took various actions to ensure employee safety, meet customer demand, and improve its operating and liquidity position, including:
|
· |
Formation of a COVID-19 crisis response team and pandemic response plan |
|
· |
Implementation of actions that are expected to result in 2020 cost savings of approximately $25 million; this is incremental to the expected savings from the corporate restructuring program announced in late 2019 |
|
· |
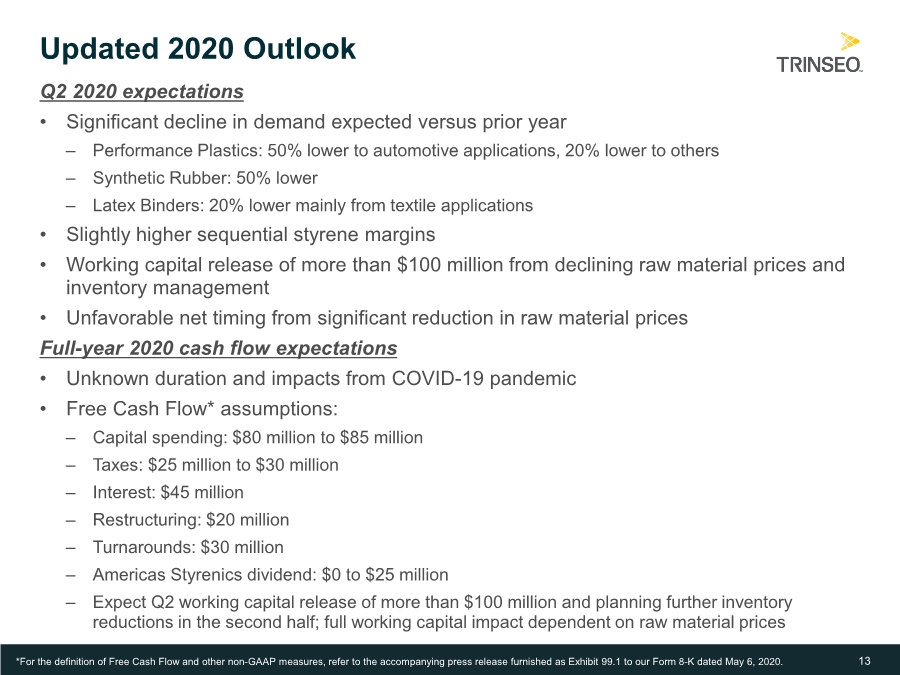
Reduction in anticipated 2020 capital spending from $100 million to $80 to $85 million |
|
· |
Drawdown of $100 million on revolving credit facility, as a precautionary measure |
|
· |
Continued focus on working capital optimization as a cash source |
Commenting on the outlook for 2020, Bozich said, “So far in the second quarter we are seeing sustained demand for polystyrene and latex binders for food packaging, polycarbonate for isolation sheeting, and engineered materials for medical applications. However, there has been a significant decline in demand in other applications, particularly in automotive, tires, and textiles, and we anticipate that this will have a more pronounced impact on second quarter performance.”
Bozich continued, “As we look out into the second half of the year, the duration of these impacts and the rate of recovery are unknown. Regardless, we’ve already taken actions to reduce operating costs and improve our existing strong liquidity position. In addition, we continue to remain focused on investing in the higher growth applications we previously outlined – CASE, Engineered Materials, and SSBR – so that we are better positioned to accelerate growth and profitability when the recovery occurs.”
Conference Call and Webcast Information
Trinseo will host a conference call to discuss its first quarter 2020 financial results on Thursday, May 7, 2020 at 10 a.m. Eastern Time.
Commenting on results will be Frank Bozich, President and Chief Executive Officer, David Stasse, Executive Vice President and Chief Financial Officer, and Andy Myers, Director of Investor Relations. The conference call will be available by phone at:
Participant Toll Free Dial-In Number: +1 (833) 979-2709
Participant International Dial-In Number: +1 (236) 714-2177
Conference ID: 6927967
The Company will also offer a live Webcast of the conference call with question and answer session via the registration page of the Trinseo Investor Relations website.
Trinseo has posted its first quarter 2020 financial results on the Company’s Investor Relations website. The presentation slides will also be made available in the webcast player prior to the conference call. The Company will also furnish copies of the financial results press release and presentation slides to investors by means of a Form 8-K filing with the U.S. Securities and Exchange Commission.
A replay of the conference call and transcript will be archived on the Company’s Investor Relations website shortly following the conference call. The replay will be available until May 7, 2021.
About Trinseo
Trinseo (NYSE:TSE) is a global materials solutions provider and manufacturer of plastics, latex binders, and synthetic rubber. We are focused on delivering innovative and sustainable solutions to help our customers create products that touch lives every day — products that are intrinsic to how we live our lives — across a wide range of end-markets, including automotive, consumer electronics, appliances, medical devices, lighting, electrical, carpet, paper and board, building and construction, and tires. Trinseo had approximately $3.8 billion in net sales in 2019, with 17 manufacturing sites around the world, and approximately 2,700 employees. For more information visit www.trinseo.com.
Use of non-GAAP measures
In addition to using standard measures of performance and liquidity that are recognized in accordance with accounting principles generally accepted in the United States of America (“GAAP”), we use additional measures of income excluding certain GAAP items (“non-GAAP measures”), such as Adjusted Net Income, EBITDA, Adjusted EBITDA and Adjusted EPS and measures of liquidity excluding certain GAAP items, such as Free Cash Flow. We believe these measures are useful for investors and management in evaluating business trends and performance each period. These measures are also used to manage our business and assess current period profitability, as well as to provide an appropriate basis to evaluate the effectiveness of our pricing strategies. Such measures are not recognized in accordance with GAAP and should not be viewed as an alternative to GAAP measures of performance or liquidity, as applicable. The definitions of each of these measures, further discussion of usefulness, and reconciliations of non-GAAP measures to GAAP measures are provided in the Notes to Condensed Consolidated Financial Information presented herein.
Cautionary Note on Forward-Looking Statements
This press release may contain “forward-looking statements” including, without limitation, statements concerning plans, objectives, goals, projections, expectations, strategies, future events or performance, and underlying assumptions and other statements, which are not statements of historical facts. Forward-looking statements may be identified by the use of words like “expect,” “estimate,” “will,” “may,” or expressions of similar meaning. Forward-looking statements reflect management’s evaluation of information currently available and are based on the Company’s current expectations and assumptions regarding the impact from the COVID-19 pandemic, the Company’s business, the economy and other future conditions. Specific factors that could cause future results to differ
from those expressed by the forward-looking statements include, but are not limited to, risks related to the ongoing impact of the COVID-19 pandemic and those discussed in the Company’s Annual Report for the year ended December 31, 2019 filed with the Securities and Exchange Commission (“SEC”), in subsequent Quarterly Reports on Form 10-Q and in other filings and furnishings made by the Company with the SEC from time to time. Other unknown or unpredictable factors could also have material adverse effects on the Company’s performance. As a result of these or other factors, the Company’s actual results may differ materially from those contemplated by the forward-looking statements. The forward-looking statements included in this press release are made only as of the date hereof and are not a guarantee of future performance. The Company undertakes no obligation to publicly update or revise any forward-looking statement as a result of new information, future events or otherwise, except as otherwise required by law.
TRINSEO S.A.
Condensed Consolidated Statements of Operations
(In millions, except per share data)
(Unaudited)
|
|
|
Three Months Ended |
|
||||
|
|
|
March 31, |
|
||||
|
|
|
2020 |
|
2019 |
|
||
|
Net sales |
|
$ |
853.5 |
|
$ |
1,013.1 |
|
|
Cost of sales |
|
|
783.8 |
|
|
915.7 |
|
|
Gross profit |
|
|
69.7 |
|
|
97.4 |
|
|
Selling, general and administrative expenses |
|
|
77.5 |
|
|
68.8 |
|
|
Equity in earnings of unconsolidated affiliates |
|
|
9.8 |
|
|
32.2 |
|
|
Impairment charges |
|
|
38.3 |
|
|
— |
|
|
Operating income (loss) |
|
|
(36.3) |
|
|
60.8 |
|
|
Interest expense, net |
|
|
10.3 |
|
|
10.2 |
|
|
Other expense, net |
|
|
1.6 |
|
|
4.0 |
|
|
Income (loss) before income taxes |
|
|
(48.2) |
|
|
46.6 |
|
|
Provision for (benefit from) income taxes |
|
|
(11.9) |
|
|
10.8 |
|
|
Net income (loss) |
|
$ |
(36.3) |
|
$ |
35.8 |
|
|
Weighted average shares- basic |
|
|
38.5 |
|
|
41.3 |
|
|
Net income (loss) per share- basic |
|
$ |
(0.94) |
|
$ |
0.87 |
|
|
Weighted average shares- diluted |
|
|
38.5 |
|
|
41.8 |
|
|
Net income (loss) per share- diluted |
|
$ |
(0.94) |
|
$ |
0.86 |
|
TRINSEO S.A.
Condensed Consolidated Balance Sheets
(In millions)
(Unaudited)
|
|
|
March 31, |
|
December 31, |
||
|
|
|
2020 |
|
2019 |
||
|
Assets |
|
|
|
|
|
|
|
Cash and cash equivalents |
|
$ |
440.1 |
|
$ |
456.2 |
|
Accounts receivable, net |
|
|
576.0 |
|
|
570.8 |
|
Inventories |
|
|
405.5 |
|
|
438.2 |
|
Other current assets |
|
|
16.6 |
|
|
25.9 |
|
Investments in unconsolidated affiliates |
|
|
197.9 |
|
|
188.1 |
|
Property, plant, equipment, goodwill, and other intangible assets, net |
|
|
826.7 |
|
|
885.0 |
|
Right-of-use assets - operating |
|
|
77.2 |
|
|
71.4 |
|
Total other assets |
|
|
117.4 |
|
|
123.2 |
|
Total assets |
|
$ |
2,657.4 |
|
$ |
2,758.8 |
|
Liabilities and shareholders’ equity |
|
|
|
|
|
|
|
Current liabilities |
|
|
481.5 |
|
|
527.6 |
|
Long-term debt, net |
|
|
1,162.2 |
|
|
1,162.6 |
|
Noncurrent lease liabilities - operating |
|
|
64.1 |
|
|
58.0 |
|
Other noncurrent obligations |
|
|
346.6 |
|
|
341.7 |
|
Shareholders’ equity |
|
|
603.0 |
|
|
668.9 |
|
Total liabilities and shareholders’ equity |
|
$ |
2,657.4 |
|
$ |
2,758.8 |
TRINSEO S.A.
Condensed Consolidated Statements of Cash Flows
(In millions)
(Unaudited)
|
|
|
Three Months Ended |
||||
|
|
|
March 31, |
||||
|
|
|
2020 |
|
2019 |
||
|
Cash flows from operating activities |
|
|
|
|
|
|
|
Cash provided by (used in) operating activities |
|
$ |
(5.8) |
|
$ |
153.2 |
|
|
|
|
|
|
|
|
|
Cash flows from investing activities |
|
|
|
|
|
|
|
Capital expenditures |
|
|
(24.3) |
|
|
(25.0) |
|
Net cash received for asset and business acquisitions, net of cash acquired |
|
|
0.2 |
|
|
— |
|
Proceeds from capital expenditures subsidy |
|
|
— |
|
|
0.7 |
|
Proceeds from the sale of businesses and other assets |
|
|
11.6 |
|
|
— |
|
Proceeds from the settlement of hedging instruments |
|
|
51.6 |
|
|
— |
|
Cash provided by (used in) investing activities |
|
|
39.1 |
|
|
(24.3) |
|
|
|
|
|
|
|
|
|
Cash flows from financing activities |
|
|
|
|
|
|
|
Short-term borrowings, net |
|
|
(3.5) |
|
|
(0.1) |
|
Purchase of treasury shares |
|
|
(25.0) |
|
|
(37.4) |
|
Dividends paid |
|
|
(15.9) |
|
|
(17.4) |
|
Proceeds from exercise of option awards |
|
|
— |
|
|
0.1 |
|
Withholding taxes paid on restricted share units |
|
|
(0.6) |
|
|
(3.8) |
|
Repayments of 2024 Term Loan B |
|
|
(1.7) |
|
|
(1.8) |
|
Cash used in financing activities |
|
|
(46.7) |
|
|
(60.4) |
|
Effect of exchange rates on cash |
|
|
(2.7) |
|
|
(1.6) |
|
Net change in cash, cash equivalents, and restricted cash |
|
|
(16.1) |
|
|
66.9 |
|
Cash, cash equivalents, and restricted cash—beginning of period |
|
|
457.4 |
|
|
452.3 |
|
Cash, cash equivalents, and restricted cash—end of period |
|
$ |
441.3 |
|
$ |
519.2 |
|
Less: Restricted cash, included in "Other current assets" |
|
|
(1.2) |
|
|
(2.8) |
|
Cash and cash equivalents—end of period |
|
$ |
440.1 |
|
$ |
516.4 |
TRINSEO S.A.
Notes to Condensed Consolidated Financial Information
(Unaudited)
Note 1: Net sales by Segment
|
|
|
Three Months Ended |
|
||||
|
|
|
March 31, |
|
||||
|
(In millions) |
|
2020 |
|
2019 |
|
||
|
Latex Binders |
|
$ |
219.1 |
|
$ |
223.9 |
|
|
Synthetic Rubber |
|
|
101.7 |
|
|
124.6 |
|
|
Performance Plastics |
|
|
305.1 |
|
|
369.3 |
|
|
Polystyrene |
|
|
182.8 |
|
|
228.5 |
|
|
Feedstocks |
|
|
44.8 |
|
|
66.8 |
|
|
Americas Styrenics* |
|
|
— |
|
|
— |
|
|
Total Net Sales |
|
$ |
853.5 |
|
$ |
1,013.1 |
|
* The results of this segment are comprised entirely of earnings from Americas Styrenics, our 50%-owned equity method investment. As such, we do not separately report net sales of Americas Styrenics within our condensed consolidated statements of operations.
Note 2: Reconciliation of Non-GAAP Performance Measures to Net Income
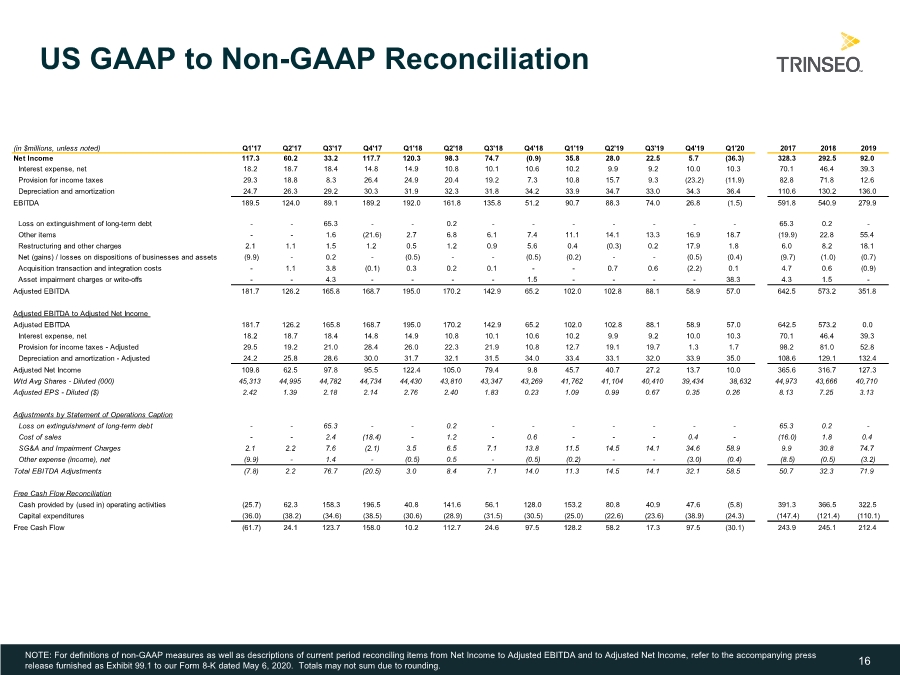
EBITDA is a non-GAAP financial performance measure, which is defined as income from continuing operations before interest expense, net; income tax provision; depreciation and amortization expense. We refer to EBITDA in making operating decisions because we believe it provides our management as well as our investors with meaningful information regarding the Company’s operational performance. We believe the use of EBITDA as a metric assists our board of directors, management and investors in comparing our operating performance on a consistent basis.
We also present Adjusted EBITDA as a non-GAAP financial performance measure, which we define as income from continuing operations before interest expense, net; income tax provision; depreciation and amortization expense; loss on extinguishment of long-term debt; asset impairment charges; gains or losses on the dispositions of businesses and assets; restructuring charges; acquisition related costs and benefits, and other items. In doing so, we are providing management, investors, and credit rating agencies with an indicator of our ongoing performance and business trends, removing the impact of transactions and events that we would not consider a part of our core operations.
Lastly, we present Adjusted Net Income and Adjusted EPS as additional performance measures. Adjusted Net Income is calculated as Adjusted EBITDA (defined beginning with net income, above), less interest expense, less the provision for income taxes and depreciation and amortization, tax affected for various discrete items, as appropriate. Adjusted EPS is calculated as Adjusted Net Income per weighted average diluted shares outstanding for a given period. We believe that Adjusted Net Income and Adjusted EPS provide transparent and useful information to management, investors, analysts and other stakeholders in evaluating and assessing our operating results from period-to-period after removing the impact of certain transactions and activities that affect comparability and that are not considered part of our core operations.
There are limitations to using the financial performance measures noted above. These performance measures are not intended to represent net income or other measures of financial performance. As such, they should not be used as alternatives to net income as indicators of operating performance. Other companies in our industry may define these performance measures differently than we do. As a result, it may be difficult to use these or similarly-named financial measures that other companies may use, to compare the performance of those companies to our performance. We compensate for these limitations by providing reconciliations of these performance measures to our net income, which is determined in accordance with GAAP.
|
|
|
Three Months Ended |
|
||||
|
|
|
March 31, |
|
||||
|
(In millions, except per share data) |
|
2020 |
|
2019 |
|
||
|
Net income (loss) |
|
$ |
(36.3) |
|
$ |
35.8 |
|
|
Interest expense, net |
|
|
10.3 |
|
|
10.2 |
|
|
Provision for (benefit from) income taxes |
|
|
(11.9) |
|
|
10.8 |
|
|
Depreciation and amortization |
|
|
36.4 |
|
|
33.9 |
|
|
EBITDA |
|
$ |
(1.5) |
|
$ |
90.7 |
|
|
Net gain on disposition of businesses and assets (a) |
|
|
(0.4) |
|
|
(0.2) |
Other expense, net |
|
Restructuring and other charges (b) |
|
|
1.8 |
|
|
0.4 |
Selling, general, and administrative expenses; Other expense, net |
|
Acquisition transaction and integration net costs |
|
|
0.1 |
|
|
— |
Selling, general, and administrative expenses |
|
Asset impairment charges or write-offs (c) |
|
|
38.3 |
|
|
— |
Impairment charges |
|
Other items (d) |
|
|
18.7 |
|
|
11.1 |
Selling, general, and administrative expenses |
|
Adjusted EBITDA |
|
$ |
57.0 |
|
$ |
102.0 |
|
|
Adjusted EBITDA to Adjusted Net Income: |
|
|
|
|
|
|
|
|
Adjusted EBITDA |
|
|
57.0 |
|
|
102.0 |
|
|
Interest expense, net |
|
|
10.3 |
|
|
10.2 |
|
|
Provision for (benefit from) income taxes - Adjusted (e) |
|
|
1.7 |
|
|
12.7 |
|
|
Depreciation and amortization - Adjusted (f) |
|
|
35.0 |
|
|
33.4 |
|
|
Adjusted Net Income |
|
$ |
10.0 |
|
$ |
45.7 |
|
|
Adjusted EPS |
|
$ |
0.26 |
|
$ |
1.09 |
|
|
|
|
|
|
|
|
|
|
|
Adjusted EBITDA by Segment: |
|
|
|
|
|
|
|
|
Latex Binders |
|
$ |
21.5 |
|
$ |
17.5 |
|
|
Synthetic Rubber |
|
|
15.3 |
|
|
8.8 |
|
|
Performance Plastics |
|
|
36.7 |
|
|
35.5 |
|
|
Polystyrene |
|
|
11.8 |
|
|
16.8 |
|
|
Feedstocks |
|
|
(16.2) |
|
|
17.2 |
|
|
Americas Styrenics |
|
|
9.8 |
|
|
32.2 |
|
|
Corporate unallocated |
|
|
(21.9) |
|
|
(26.0) |
|
|
Adjusted EBITDA |
|
$ |
57.0 |
|
$ |
102.0 |
|
|
(a) |
The net gain on disposition of businesses and assets for the three months ended March 31, 2020 relates to the sale of land in Livorno, Italy as well as consideration earned for the performance of our former latex business in Brazil, which we divested in 2016. The net gain on disposition of businesses and assets for the three months ended March 31, 2019 relates to consideration earned for the performance of our former latex business in Brazil. |
|
(b) |
Restructuring and other charges for the three months ended March 31, 2020 primarily relate to employee termination benefit charges as well as contract termination charges incurred in connection with the Company’s corporate restructuring program. The remainder of restructuring and other charges for the three months ended March 31, 2020 and restructuring and other charges for the three months ended March 31, 2019 primarily relate to decommissioning charges incurred in connection with the upgrade and replacement of our compounding facility in Terneuzen, The Netherlands as well as our decision to cease manufacturing activities at our latex binders manufacturing facility in Livorno, Italy. |
Note that the accelerated depreciation charges incurred as part of both the Company’s corporate restructuring program and the upgrade and replacement of the Company’s compounding facility in Terneuzen, The Netherlands are included within the “Depreciation and amortization” caption above, and therefore are not included as a separate adjustment within this caption.
|
(c) |
Asset impairment charges or write-offs for the three months ended March 31, 2020 relate to the impairment of the Company’s styrene monomer assets in Boehlen, Germany and polybutadiene rubber (nickel and neodymium-PBR) assets in Schkopau, Germany. |
|
(d) |
Other items for the three months ended March 31, 2020 and 2019 primarily relate to advisory and professional fees incurred in conjunction with our initiative to transition business services from Dow, including certain administrative services such as accounts payable, logistics, and IT services. Also included within other items for the three months ended March 31, 2020 are fees incurred in conjunction with certain of the Company’s strategic initiatives. |
|
(e) |
Adjusted to remove the tax impact of the items noted in (a), (b), (c), (d), and (f). The income tax expense (benefit) related to these items was determined utilizing either (1) the estimated annual effective tax rate on our ordinary income based upon our forecasted ordinary income for the full year or, (2) for items treated discretely for tax purposes we utilized the applicable rates in the taxing jurisdictions in which these adjustments occurred. |
|
(f) |
Amounts exclude accelerated depreciation of $1.3 million for the three months ended March 31, 2020 related to the shortening of the useful life of certain fixed assets related to the Company’s corporate restructuring program. The amounts exclude $0.5 million for the three months ended March 31, 2019 related to the shortening of the useful life of certain information technology assets related to the transition of business services from The Dow Chemical Company (noted in (d) above). |
Note 3: Reconciliation of Non-GAAP Liquidity Measures to Cash from Operations
The Company uses certain measures, such as Free Cash Flow and Liquidity, as non-GAAP measures, to evaluate and discuss its liquidity position and results. Free Cash Flow is defined as cash from operating activities, less capital expenditures. Liquidity is defined as total cash and cash equivalents plus unused borrowing capacity on the Company’s revolving debt and accounts receivable securitization facility. We believe that Free Cash Flow and Liquidity provide indicators of the Company’s ongoing ability to generate cash through core operations, as it excludes the cash impacts of various financing transactions as well as cash flows from business combinations that are not considered organic in nature. We also believe that Free Cash Flow and Liquidity provide management and investors with a useful analytical indicator of our ability to service our indebtedness, pay dividends (when declared), and meet our ongoing cash obligations.
Free Cash Flow and Liquidity are not intended to represent cash flows from operations as defined by GAAP, and therefore, should not be used as an alternative for that measure. Other companies in our industry may define Free Cash Flow and Liquidity differently than we do. As a result, it may be difficult to use these or similarly-named financial measures that other companies may use, to compare the liquidity and cash generation of those companies to our own. The Company compensates for these limitations by providing the following detail, which is determined in accordance with GAAP.
Free Cash Flow
|
|
|
Three Months Ended |
||||
|
|
|
March 31, |
||||
|
(In millions) |
|
2020 |
|
2019 |
||
|
Cash provided by (used in) operating activities |
|
$ |
(5.8) |
|
$ |
153.2 |
|
Capital expenditures |
|
|
(24.3) |
|
|
(25.0) |
|
Free Cash Flow |
|
$ |
(30.1) |
|
$ |
128.2 |
Liquidity
|
|
|
|
As of |
|
|
|
|
March 31, |
|
(In millions) |
|
|
2020 |
|
Cash and cash equivalents |
|
$ |
440.1 |
|
Available borrowings under the accounts receivable securitization facility |
|
|
135.6 |
|
Available borrowings under the revolving credit facility |
|
|
360.9 |
|
Liquidity |
|
$ |
936.6 |