Exhibit 99.1

Press Contact: | | Investor Contact: | ||
Trinseo | | Trinseo | ||
Dina Pokedoff | | Andy Myers | ||
Tel : +1 610-240-3307 | | Tel : +1 610-240-3221 | ||
Email: [email protected] | | Email: [email protected] |
Trinseo Reports Fourth Quarter and Full Year 2020 Financial Results
Full Year 2020 Summary
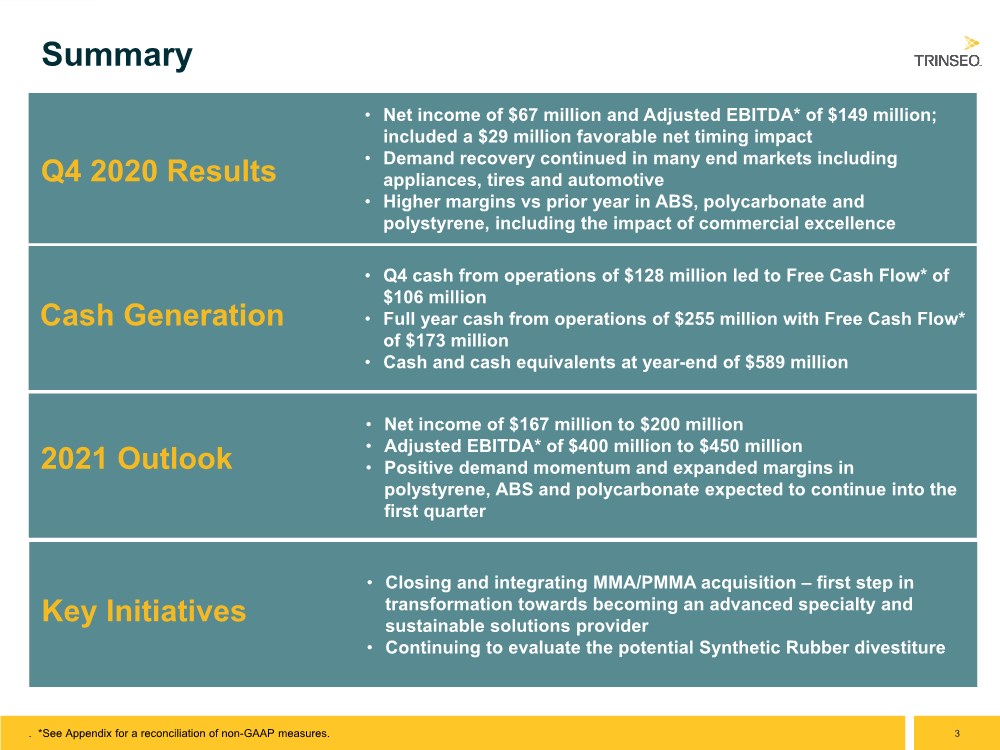
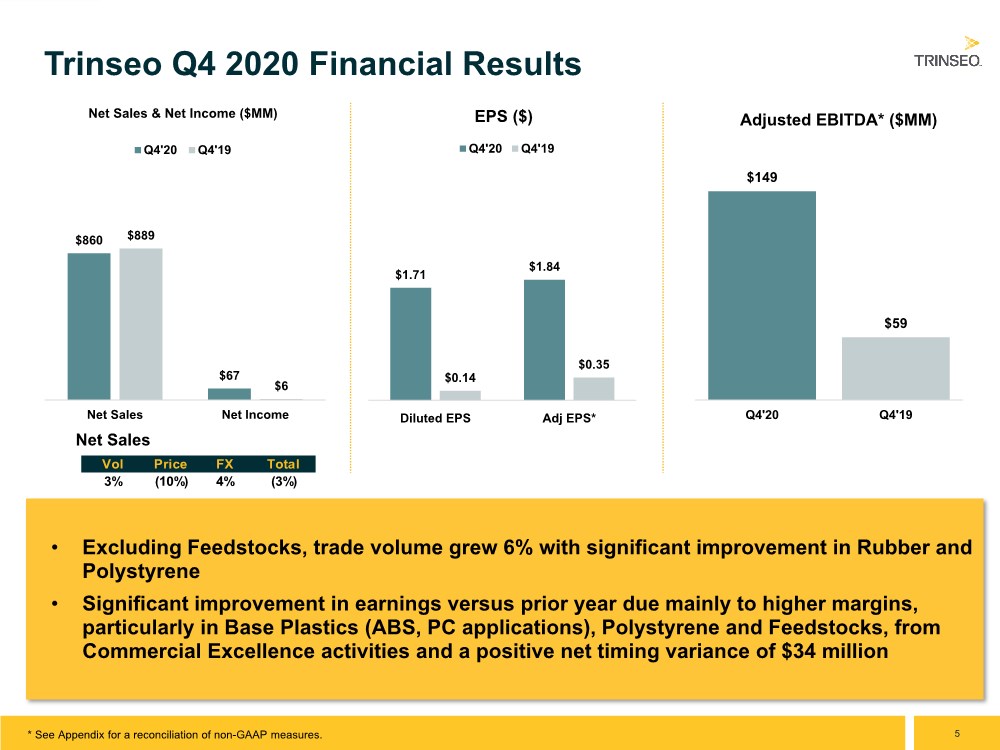
● | Net income of $67 million and diluted EPS of $1.71; Adjusted EBITDA* of $149 million and Adjusted EPS* of $1.84, inclusive of a pre-tax favorable net timing impact of $29 million |
● | Cash from operations of $128 million; Free Cash Flow* of $106 million |
Full Year 2020 Summary
● | Net income of $8 million and diluted EPS of $0.20; Adjusted EBITDA* of $299 million and Adjusted EPS* of $2.05, inclusive of a pre-tax unfavorable net timing impact of $27 million |
● | Cash from operations of $255 million, Free Cash Flow* of $173 million, and year-ending cash and cash equivalents of $589 million |
| | Three Months Ended | | Year Ended | ||||||||
| | December 31, | | December 31, | ||||||||
$millions, except per share data | | 2020 |
| 2019 |
| 2020 |
| 2019 | ||||
Net Sales |
| $ | 860 |
| $ | 889 |
| $ | 3,036 |
| $ | 3,776 |
Net Income | |
| 67 | |
| 6 | | | 8 | | | 92 |
EPS (Diluted) ($) | |
| 1.71 | |
| 0.14 | | | 0.20 | | | 2.26 |
Adjusted Net Income* | |
| 72 | |
| 14 | | | 79 | | | 127 |
Adjusted EPS ($)* | |
| 1.84 | |
| 0.35 | | | 2.05 | | | 3.13 |
EBITDA* | |
| 145 | |
| 27 | | | 224 | | | 280 |
Adjusted EBITDA* | |
| 149 | |
| 59 | | | 299 | | | 352 |
*For a reconciliation of EBITDA, Adjusted EBITDA, and Adjusted Net Income, all of which are non-GAAP measures, to Net Income, as well as a reconciliation of Free Cash Flow and Adjusted EPS, see Notes 2 and 3 to the financial statements included below.
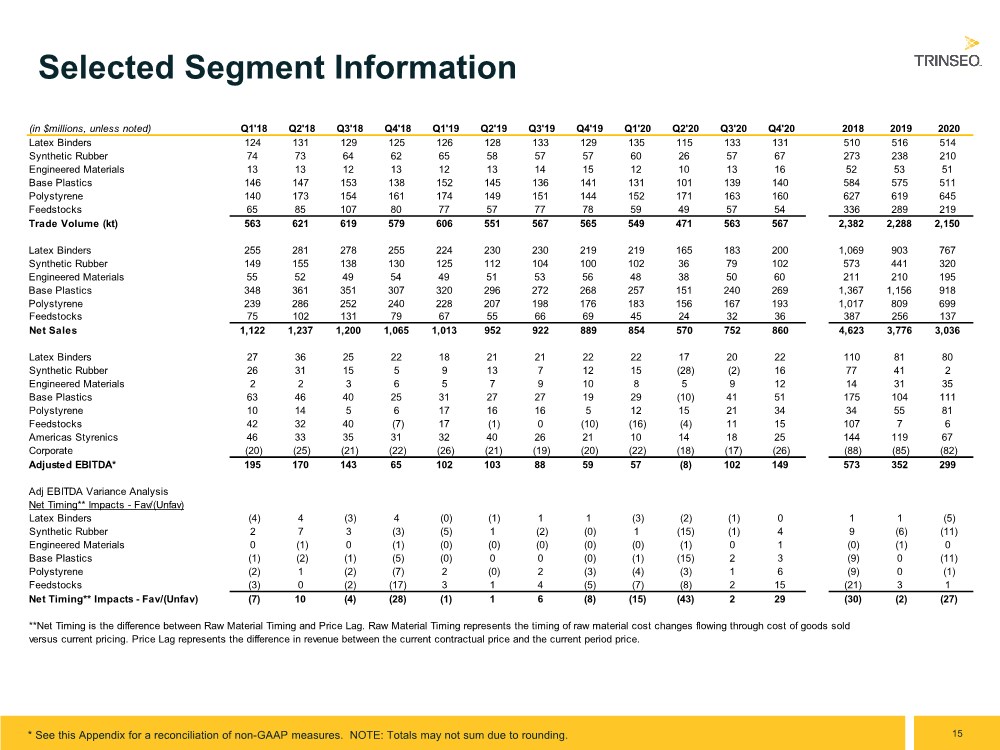
BERWYN, Pa — February 3, 2021 — Trinseo (NYSE: TSE), a global materials company and manufacturer of plastics, latex binders and synthetic rubber, today reported its fourth quarter and full-year 2020 financial results. Net sales in the fourth quarter decreased 3% versus prior year. Lower prices, mainly due to the pass through of lower raw material costs, resulted in a 10% sales decrease which was partially offset by higher volume across all segments with the exception of Feedstocks. Fourth quarter net income of $67 million was $61 million above prior year and fourth quarter Adjusted EBITDA of $149 million was $90 million above prior year. The increase in earnings was due mainly to higher volume and margin, particularly within the Polystyrene and Base Plastics segments, as well as a favorable pre-tax net timing variance of $37 million.
Net sales in the full year decreased 20% versus prior year from lower volume, due to COVID-19 impacts, and the pass through of lower raw material costs. Full-year net income of $8 million was $84 million below prior year and full-year Adjusted EBITDA of
$299 million was $53 million below prior year. Lower earnings were due mainly to lower volume as a result of COVID-19 impacts as well as a $25 million unfavorable net timing variance. These impacts were partially offset by lower fixed costs as a result of restructuring and other cost reduction initiatives.
Commenting on the Company’s fourth quarter and full-year performance, Frank Bozich, President and Chief Executive Officer of Trinseo, said, “2020 was a challenging year but I am extremely proud of how our team responded. During the peak of the COVID-19 pandemic in the second quarter we were able to meet all customer demand and we undertook cost and capital expenditure reduction initiatives to maximize liquidity. Demand recovery in end markets like appliances and automotive in the second half of the year, as well as commercial excellence initiatives, resulted in robust earnings in the third and fourth quarters. In fact, the fourth quarter Adjusted EBITDA was our highest result in over two years and we ended the year in a very strong liquidity position. In addition, we announced a transformative acquisition in December and continued to improve our position to compete in an increasingly sustainability-focused economy. All of this could not have been accomplished without the hard work and dedication of our employees.”
Fourth quarter Results and Commentary by Business Segment
Effective October 1, 2020, the Company realigned its reporting segments to reflect the new model under which the business will be managed, which will provide increased clarity within the Performance Plastics segment. Following this change, the number of reporting segments has increased from six to seven. Five of the segments remain unchanged: Latex Binders, Synthetic Rubber, Feedstocks, Polystyrene, and Americas Styrenics. Performance Plastics has been reorganized into two separate reporting segments: Engineered Materials and Base Plastics. The new Engineered Materials segment includes the Company’s compounds and blends products sold into applications such as consumer electronics and medical, as well as thermoplastic elastomer products sold into a variety of applications including footwear and automotive. The new Base Plastics segment contains the results of the remaining product lines, including ABS, SAN and polycarbonate, as well as compounds and blends for automotive and other applications.
This new structure is aligned with the Company’s strategy to invest its efforts and resources into product offerings serving applications that tend to be less cyclical and offer significantly higher growth and margin potential. In 2019 and 2020, Engineered Materials delivered margins that were more than two times the average of products serving all applications within the Company’s former Performance Plastics segment. Prior period amounts herein have been recast to reflect this new segmentation.
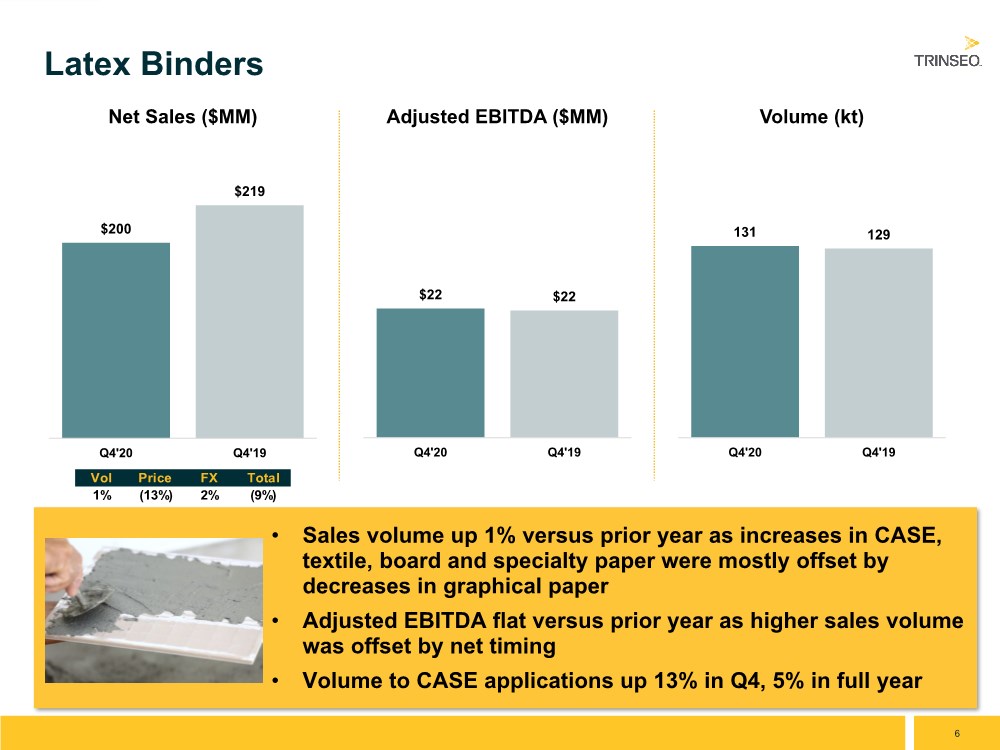
| ● | Latex Binders net sales of $200 million for the quarter decreased 9% versus prior year due to the passthrough of lower raw materials. Volumes were slightly higher than prior year as sales increases to CASE, textile, board and specialty paper applications were mostly offset by sales decreases to graphical paper applications. Adjusted EBITDA of $22 million was flat to prior year as higher sales volume was offset by net timing. In comparison to prior year, volume to CASE applications increased 13% in the fourth quarter and 5% in the full year. |
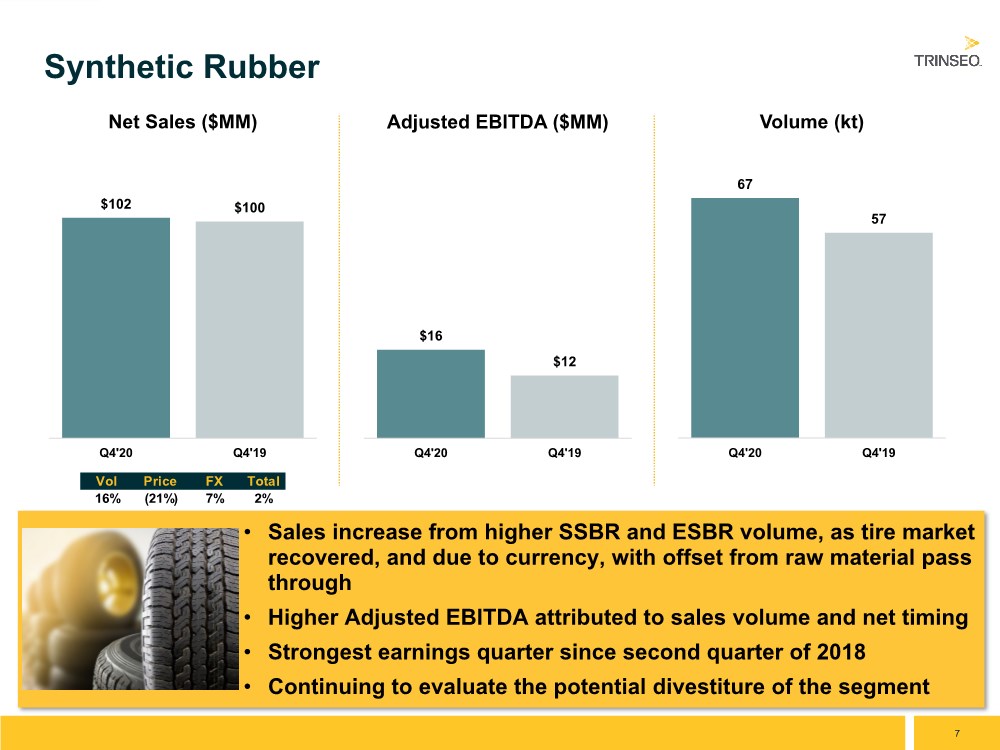
| ● | Synthetic Rubber net sales of $102 million for the quarter increased 2% versus prior year. Higher SSBR and ESBR sales volume and favorable currency increased sales by 16% and 7%, respectively. These impacts were mostly offset by lower pricing from the pass through of lower raw materials. Demand in the tire market was consistent with the third quarter. Adjusted EBITDA of $16 million, the strongest result since the second quarter of 2018, was $4 million higher than prior year as a favorable net timing variance of $4 million and higher sales volume were partially offset by lower fixed cost absorption. The Company continues to evaluate the potential divestiture of the segment. |
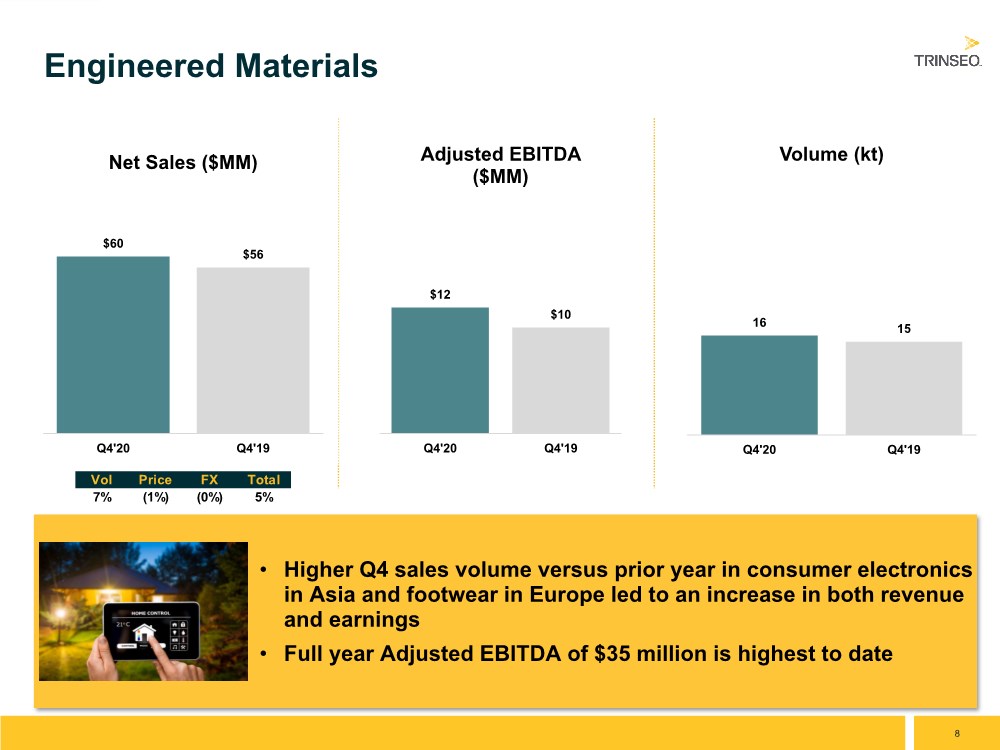
| ● | Engineered Materials net sales of $60 million for the quarter increased 5% versus prior year due mainly to higher sales volume to consumer electronics applications in Asia and TPE applications in Europe. Adjusted EBITDA of $12 million was $2 million higher than prior year due mainly to higher sales volume. Sales volume increased 7% versus prior year in the fourth quarter and decreased 5% for the full year. |
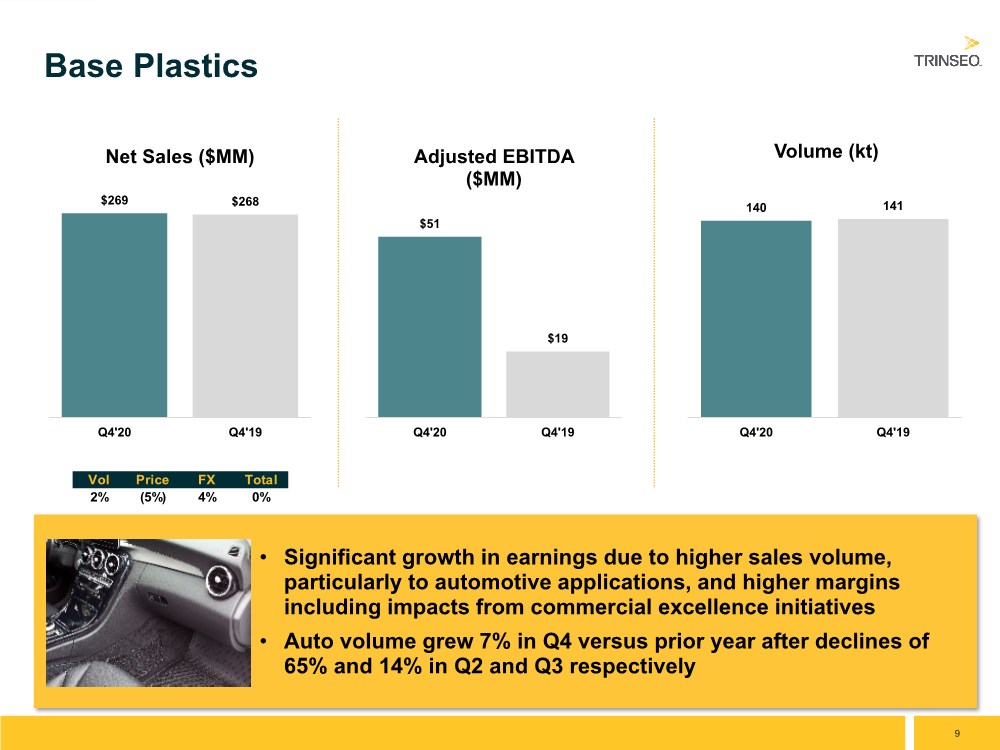
| ● | Base Plastics net sales of $269 million for the quarter were essentially flat versus prior year as higher sales volume to automotive applications as well as favorable currency impacts were offset by lower pricing, which resulted from the pass through of lower raw materials. Adjusted EBITDA of $51 million was $32 million favorable versus prior year due to higher ABS, polycarbonate and compounding margins as well as higher sales volume. |
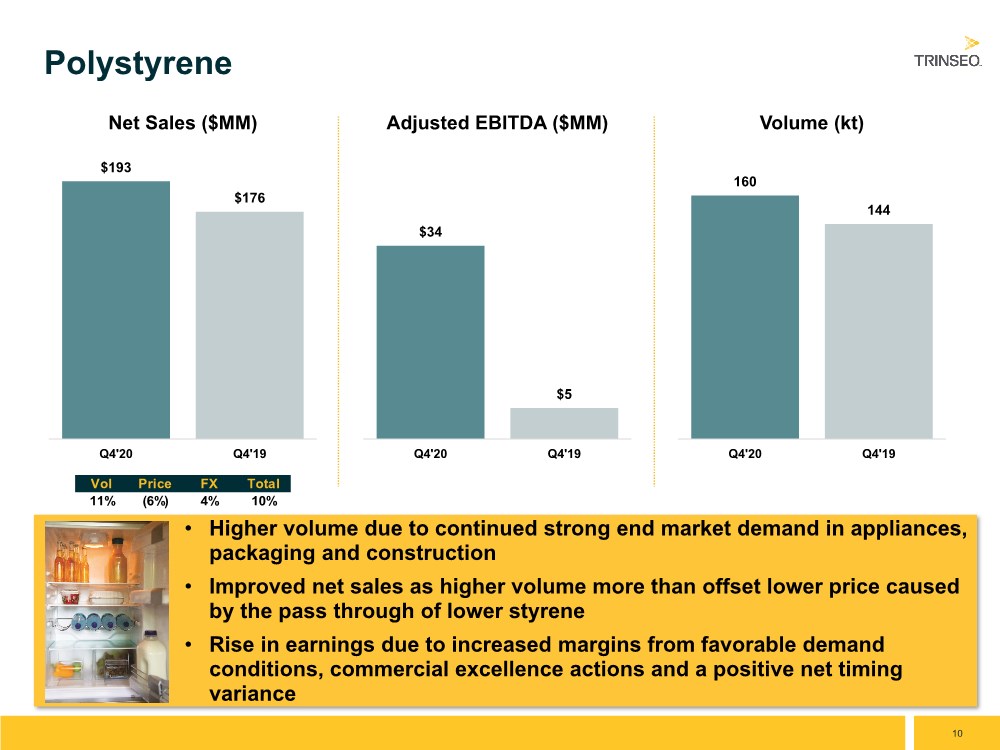
| ● | Polystyrene net sales of $193 million for the quarter were 10% above prior year from higher sales volume as demand in applications like appliances, construction and packaging remained strong. Adjusted EBITDA of $34 million was $29 million higher than prior year due to higher margins, particularly in Asia, resulting from commercial excellence initiatives, higher sales volume, and a favorable net timing variance of $9 million. |
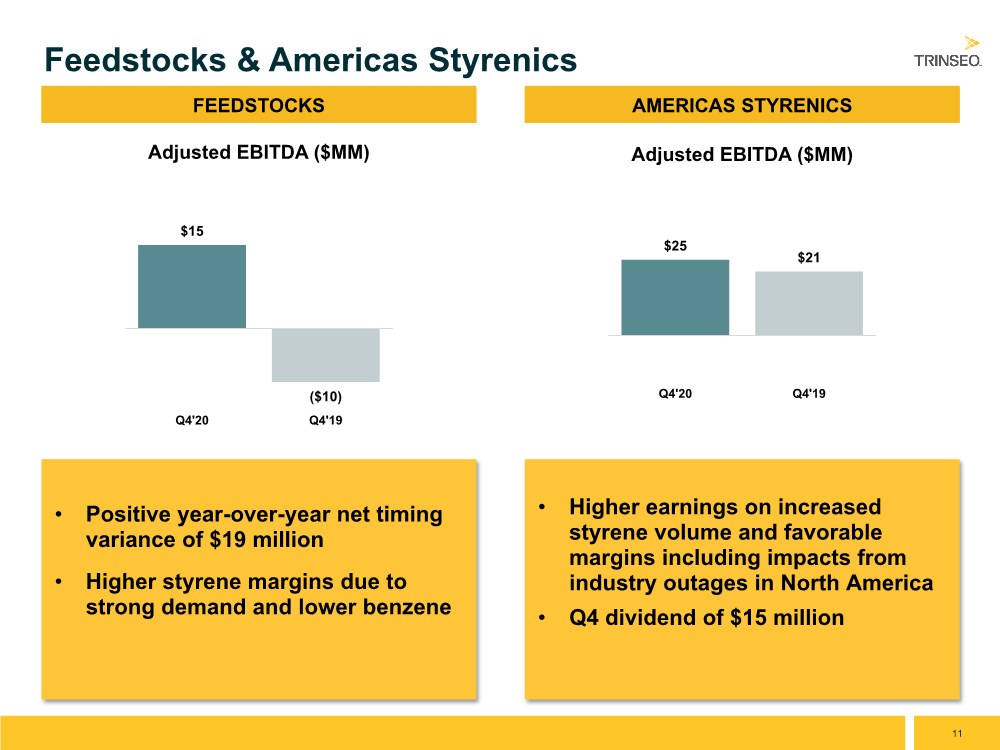
| ● | Feedstocks net sales of $36 million for the quarter were 47% below prior year due to lower styrene pricing as well as lower styrene-related sales volume. Adjusted EBITDA of $15 million was $25 million higher than prior year due to higher styrene margins in Europe as well as a $19 million favorable net timing variance. |
| ● | Americas Styrenics Adjusted EBITDA of $25 million for the quarter was $4 million above prior year due mainly to higher styrene volume and margin in North America, partially due to industry outages in the region. |
2021 Full-Year Outlook
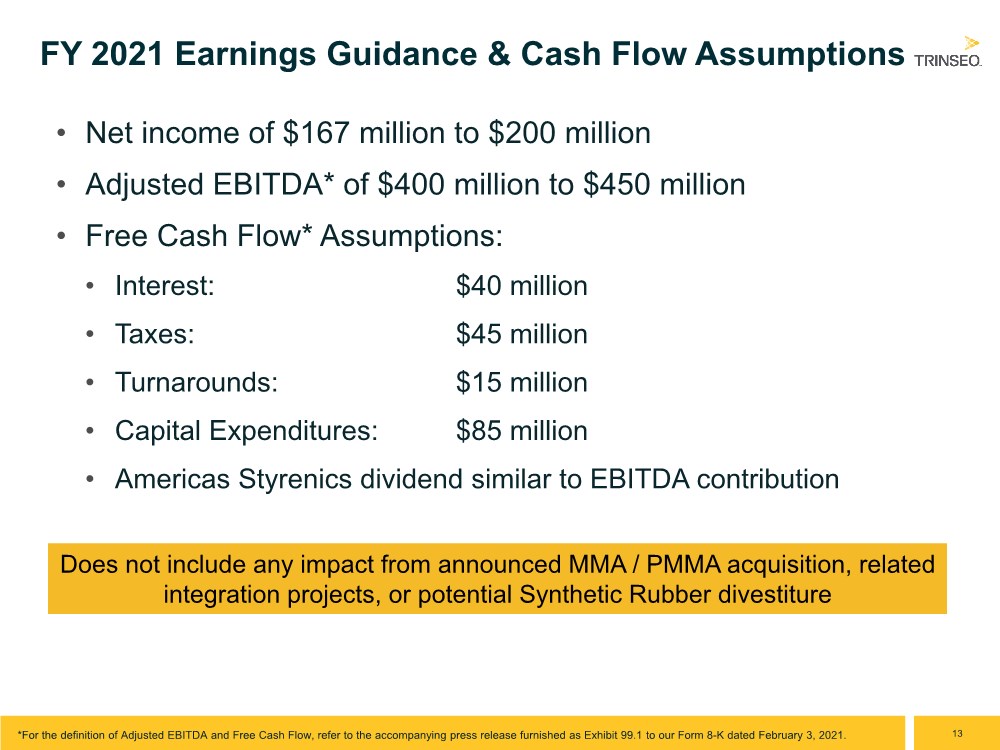
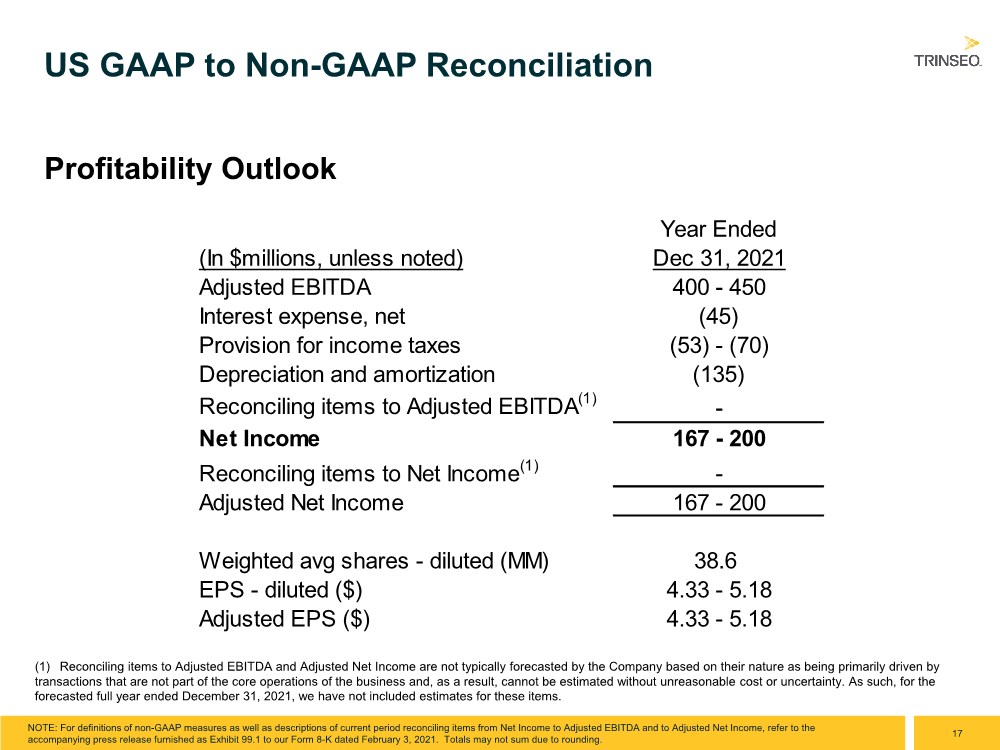
● | Full-year 2021 net income of $167 million to $200 million and Adjusted EBITDA* of $400 million to $450 million, excluding any impact from net timing, the announced acquisition of Arkema’s MMA/PMMA business or the potential Synthetic Rubber divestiture |
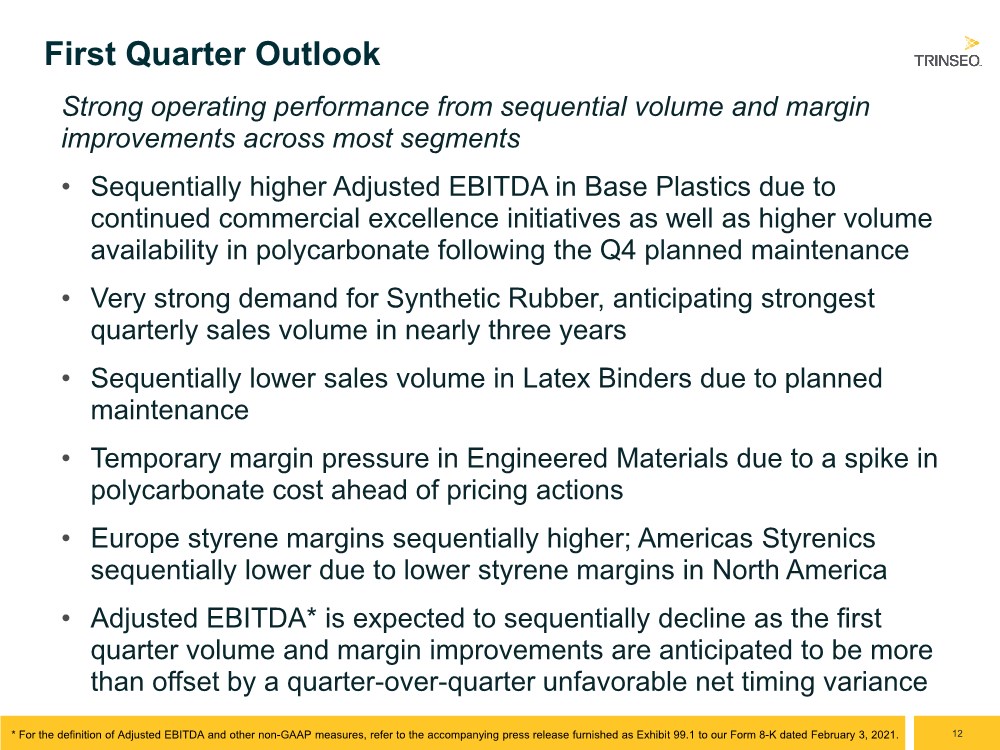
| ● | First quarter results are expected to benefit from a continuation of positive trends in both volume, such as in automotive and appliances, and margins, such as in ABS and polystyrene |
Commenting on the outlook for 2021, Bozich said, “We look forward to 2021 as an exciting time for Trinseo. Despite the continued economic impact risk of COVID-19, which we are closely monitoring, we expect significant earnings improvement in 2021. We are starting the year with a very strong balance sheet on the heels of a solid quarter of earnings with the expectation of continued strong demand in the first quarter, particularly in tires, automotive and appliances.”
Bozich continued, “We will continue to act on our strategy of growing the business in areas with higher margins and less cyclicality by investing in Engineered Materials and CASE applications, including the acquisition of Arkema’s MMA/PMMA business. We are still on track to close this transaction by mid-year, at which time we also hope to have concluded our efforts around the exploration of a potential sale of the Synthetic Rubber business. Our strategy, along with a continued focus on our 2030 sustainability goals, will position Trinseo as an advanced specialty and sustainable solutions provider.”
Conference Call and Webcast Information
Trinseo will host a conference call to discuss its fourth quarter and full year 2020 financial results on Thursday, February 4, 2021 at 10 a.m. Eastern Time.
Commenting on results will be Frank Bozich, President and Chief Executive Officer, David Stasse, Executive Vice President and Chief Financial Officer, and Andy Myers, Director of Investor Relations. To register for this conference call, please use the following links:
| ● | Conference Call Registration – for those interested in asking questions during the Q&A session |
| ● | Webcast Registration – for those interested in listening only |
After registering, you will receive a confirmation email with a meeting invitation and information for entry. Registration is open through the live call, but it is advised that you register at least one day in advance to ensure you are connected for the full call.
Trinseo has posted its fourth quarter and full year 2020 financial results on the Company’s Investor Relations website. The presentation slides will also be made available in the webcast player prior to the conference call. The Company will also furnish copies of the financial results press release and presentation slides to investors by means of a Form 8-K filing with the U.S. Securities and Exchange Commission.
A replay of the conference call and transcript will be archived on the Company’s Investor Relations website shortly following the conference call. The replay will be available until February 4, 2022.
About Trinseo
Trinseo (NYSE:TSE) is a global materials solutions provider and manufacturer of plastics, latex binders, and synthetic rubber. We are focused on delivering innovative and sustainable solutions to help our customers create products that touch lives every day — products that are intrinsic to how we live our lives — across a wide range of end-markets, including automotive, consumer electronics, appliances, medical devices, lighting, electrical, carpet, paper and board, building and construction, and tires. Trinseo had approximately $3.0 billion in net sales in 2020, with 32 manufacturing sites around the world and approximately 2,600 employees. For more information visit www.trinseo.com.
Use of non-GAAP measures
In addition to using standard measures of performance and liquidity that are recognized in accordance with accounting principles generally accepted in the United States of America (“GAAP”), we use additional measures of income excluding certain GAAP items (“non-GAAP measures”), such as Adjusted Net Income, EBITDA, Adjusted EBITDA and Adjusted EPS and measures of liquidity excluding certain GAAP items, such as Free Cash Flow. We believe these measures are useful for investors and management in evaluating business trends and performance each period. These measures are also used to manage our business and assess current
period profitability, as well as to provide an appropriate basis to evaluate the effectiveness of our pricing strategies. Such measures are not recognized in accordance with GAAP and should not be viewed as an alternative to GAAP measures of performance or liquidity, as applicable. The definitions of each of these measures, further discussion of usefulness, and reconciliations of non-GAAP measures to GAAP measures are provided in the Notes to Condensed Consolidated Financial Information presented herein.
Cautionary Note on Forward-Looking Statements
This press release may contain “forward-looking statements” including, without limitation, statements concerning plans, objectives, goals, projections, expectations, strategies, future events or performance, and underlying assumptions and other statements, which are not statements of historical facts. Forward-looking statements may be identified by the use of words like “expect,” “estimate,” “will,” “may,” or expressions of similar meaning. Forward-looking statements reflect management’s evaluation of information currently available and are based on the Company’s current expectations and assumptions regarding the Company’s business, the timing of the proposed acquisition of the Arkema MMA and PMMA business (the “Acquisition”); estimated and future results of operations, business strategies, competitive position, industry environment and potential growth opportunities and cost synergies relating to the Acquisition, the impact from the COVID-19 pandemic, the economy and other future conditions. Specific factors that could cause future results to differ from those expressed by the forward-looking statements include, but are not limited to, risks related to the occurrence of any event, change or other circumstances that could give rise to the termination of or failure to complete the Acquisition or the agreements and transactions contemplated thereby; the failure of the Company to meet the conditions to closing of the Acquisition, including those conditions related to antitrust, works council and other regulatory approvals; the failure to obtain the financing necessary, at terms acceptable to the Company to fund the Acquisition; costs related to the proposed Acquisition and the impact of the substantial indebtedness to be incurred to finance the Acquisition; the ability of the post-Acquisition company to meet its financial and strategic goals, due to, among other things, its ability to grow and manage growth profitability, maintain relationships with customers and retain its key employees; the possibility that the post-Acquisition Company may be adversely affected by other economic, business, and/or competitive factors; the Company’s ability to successfully integrate the acquired businesses or generate expected cost savings and synergies from the Acquisition; the ongoing impact of the COVID-19 pandemic and those factors discussed in the Company’s Annual Report for the year ended December 31, 2019 filed with the Securities and Exchange Commission (“SEC”), in subsequent Quarterly Reports on Form 10-Q and in other filings and furnishings made by the Company with the SEC from time to time. Other unknown or unpredictable factors could also have material adverse effects on the Company’s performance. As a result of these or other factors, the Company’s actual results may differ materially from those contemplated by the forward-looking statements. The forward-looking statements included in this press release are made only as of the date hereof and are not a guarantee of future performance. The Company undertakes no obligation to publicly update or revise any forward-looking statement as a result of new information, future events or otherwise, except as otherwise required by law.
TRINSEO S.A.
Condensed Consolidated Statements of Operations
(In millions, except per share data)
(Unaudited)
| | Three Months Ended | | Year Ended | ||||||||
| | December 31, | | December 31, | ||||||||
|
| 2020 |
| 2019 |
| 2020 |
| 2019 | ||||
Net sales |
| $ | 860.2 |
| $ | 888.8 |
| $ | 3,035.5 |
| $ | 3,775.8 |
Cost of sales | |
| 710.6 | |
| 828.8 | |
| 2,719.9 | |
| 3,446.9 |
Gross profit | |
| 149.6 | |
| 60.0 | |
| 315.6 | |
| 328.9 |
Selling, general and administrative expenses | |
| 62.9 | |
| 92.0 | |
| 252.4 | |
| 300.0 |
Equity in earnings of unconsolidated affiliates | |
| 24.6 | |
| 20.8 | |
| 67.0 | |
| 119.0 |
Impairment charges | | | 0.8 | | | — | | | 39.1 | | | — |
Operating income (loss) | |
| 110.5 | |
| (11.2) | |
| 91.1 | |
| 147.9 |
Interest expense, net | |
| 11.6 | |
| 10.0 | |
| 43.6 | |
| 39.3 |
Other expense (income), net | |
| (2.2) | |
| (3.7) | |
| 1.8 | |
| 4.0 |
Income (loss) before income taxes | |
| 101.2 | |
| (17.5) | |
| 45.7 | |
| 104.6 |
Provision for (benefit from) income taxes | |
| 34.4 | |
| (23.2) | |
| 37.8 | |
| 12.6 |
Net income | | $ | 66.7 | | $ | 5.7 | | $ | 7.9 | | $ | 92.0 |
Weighted average shares- basic | | | 38.3 | | | 39.2 | | | 38.3 | | | 40.3 |
Net income per share- basic | | $ | 1.74 | | $ | 0.14 | | $ | 0.20 | | $ | 2.28 |
Weighted average shares- diluted | |
| 39.0 | |
| 39.4 | |
| 38.6 | |
| 40.7 |
Net income per share- diluted | | $ | 1.71 | | $ | 0.14 | | $ | 0.20 | | $ | 2.26 |
TRINSEO S.A.
Condensed Consolidated Balance Sheets
(In millions)
(Unaudited)
| | December 31, | | December 31, | ||
|
| 2020 | | 2019 | ||
Assets |
| | | | |
|
Cash and cash equivalents | | $ | 588.7 | | $ | 456.2 |
Accounts receivable, net | |
| 529.2 | |
| 570.8 |
Inventories | |
| 384.1 | |
| 438.2 |
Other current assets | |
| 15.1 | |
| 25.9 |
Investments in unconsolidated affiliates | |
| 240.1 | |
| 188.1 |
Property, plant, equipment, goodwill, and other intangible assets, net | |
| 858.4 | | | 885.0 |
Right-of-use assets - operating, net | | | 78.3 | | | 71.4 |
Other long-term assets | |
| 151.3 | |
| 123.2 |
Total assets | | $ | 2,845.2 | | $ | 2,758.8 |
Liabilities and shareholders’ equity | | | | | | |
Current liabilities | | | 533.3 | | | 527.6 |
Long-term debt, net | |
| 1,158.7 | |
| 1,162.6 |
Noncurrent lease liabilities - operating | | | 65.7 | | | 58.0 |
Other noncurrent obligations | |
| 497.2 | |
| 341.7 |
Shareholders’ equity | | | 590.3 | | | 668.9 |
Total liabilities and shareholders’ equity | | $ | 2,845.2 | | $ | 2,758.8 |
TRINSEO S.A.
Condensed Consolidated Statements of Cash Flows
(In millions)
(Unaudited)
| | Year Ended | ||||
| | December 31, | ||||
|
| 2020 |
| 2019 | ||
Cash flows from operating activities |
| |
|
| |
|
Cash provided by operating activities | | $ | 255.4 | | $ | 322.5 |
| | | | | | |
Cash flows from investing activities | | | | | | |
Capital expenditures | |
| (82.3) | |
| (110.1) |
Net cash received for asset and business acquisitions | | | 0.1 | | | 0.1 |
Cash paid for cost method investment | | | (5.5) | | | — |
Proceeds from the sale of businesses and other assets | |
| 11.9 | |
| 0.7 |
Proceeds from the settlement of hedging instruments | | | 51.6 | | | — |
Cash used in investing activities | |
| (24.2) | |
| (109.3) |
| | | | | | |
Cash flows from financing activities | | | | | | |
Short-term borrowings, net | |
| (12.6) | |
| (10.6) |
Purchase of treasury shares | | | (25.0) | | | (119.7) |
Dividends paid | | | (61.8) | | | (65.7) |
Proceeds from exercise of option awards | | | 2.6 | | | 0.9 |
Withholding taxes paid on restricted share units | | | (0.6) | | | (4.6) |
Repayments of 2024 Term Loan B | | | (6.9) | | | (7.0) |
Net proceeds from draw on 2022 Revolving Facility | | | 100.0 | | | — |
Repayments of 2022 Revolving Facility | | | (100.0) | | | — |
Cash used in financing activities | |
| (104.3) | |
| (206.7) |
Effect of exchange rates on cash | |
| 4.4 | |
| (1.4) |
Net change in cash, cash equivalents, and restricted cash | |
| 131.3 | |
| 5.1 |
Cash, cash equivalents, and restricted cash—beginning of period | |
| 457.4 | |
| 452.3 |
Cash, cash equivalents, and restricted cash—end of period | | $ | 588.7 | | $ | 457.4 |
Less: Restricted cash, included in "Other current assets" | | | — | | | (1.2) |
Cash and cash equivalents—end of period | | $ | 588.7 | | $ | 456.2 |
TRINSEO S.A.
Notes to Condensed Consolidated Financial Information
(Unaudited)
Note 1: Net sales by Segment
| | Three Months Ended | | Year Ended | ||||||||
| | December 31, | | December 31, | ||||||||
(In millions) | | 2020 |
| 2019 |
| 2020 |
| 2019 | ||||
Latex Binders |
| $ | 199.9 |
| $ | 219.0 |
| $ | 767.1 |
| $ | 902.8 |
Synthetic Rubber | |
| 102.1 | |
| 100.4 | |
| 319.7 | |
| 441.3 |
Engineered Materials | |
| 59.5 | |
| 56.4 | |
| 194.8 | |
| 209.9 |
Base Plastics | | | 269.2 | | | 268.2 | | | 918.2 | | | 1,156.3 |
Polystyrene | |
| 193.0 | |
| 176.1 | |
| 698.9 | |
| 809.4 |
Feedstocks | |
| 36.5 | |
| 68.7 | |
| 136.8 | |
| 256.1 |
Americas Styrenics* | |
| — | |
| — | |
| — | |
| — |
Total Net Sales | | $ | 860.2 | | $ | 888.8 | | $ | 3,035.5 | | $ | 3,775.8 |
* The results of this segment are comprised entirely of earnings from Americas Styrenics, our 50%-owned equity method investment. As such, we do not separately report net sales of Americas Styrenics within our condensed consolidated statements of operations.
Note 2: Reconciliation of Non-GAAP Performance Measures to Net Income
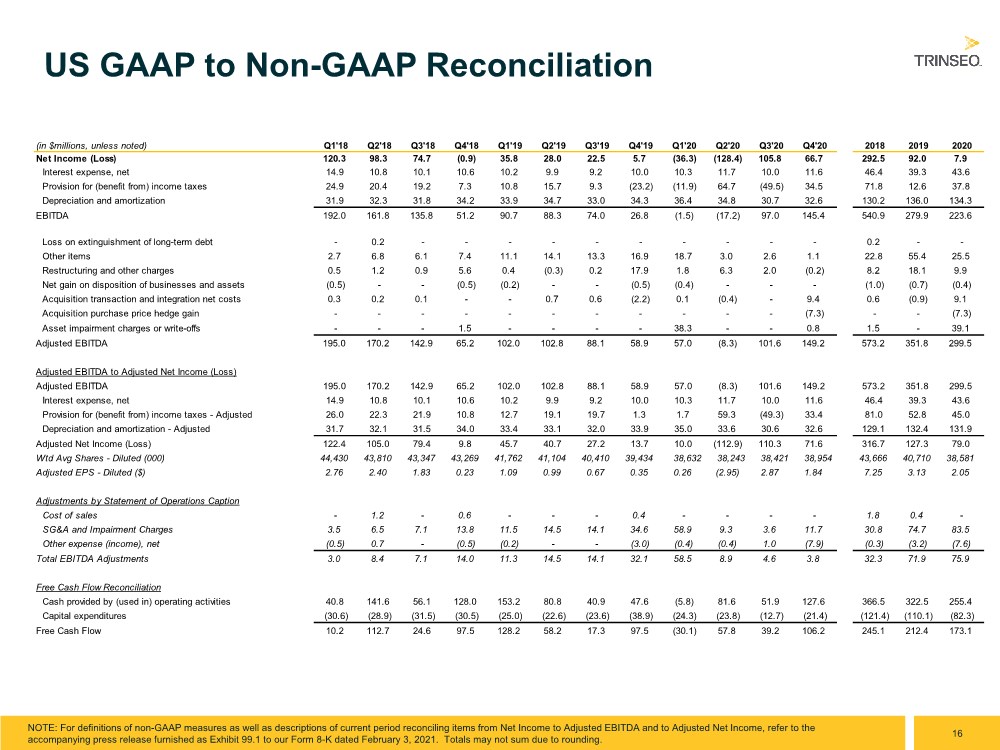
EBITDA is a non-GAAP financial performance measure, which is defined as income from continuing operations before interest expense, net; income tax provision; depreciation and amortization expense. We refer to EBITDA in making operating decisions because we believe it provides our management as well as our investors with meaningful information regarding the Company’s operational performance. We believe the use of EBITDA as a metric assists our board of directors, management and investors in comparing our operating performance on a consistent basis.
We also present Adjusted EBITDA as a non-GAAP financial performance measure, which we define as income from continuing operations before interest expense, net; income tax provision; depreciation and amortization expense; loss on extinguishment of long-term debt; asset impairment charges; gains or losses on the dispositions of businesses and assets; restructuring charges; acquisition related costs and benefits, and other items. In doing so, we are providing management, investors, and credit rating agencies with an indicator of our ongoing performance and business trends, removing the impact of transactions and events that we would not consider a part of our core operations.
Lastly, we present Adjusted Net Income and Adjusted EPS as additional performance measures. Adjusted Net Income is calculated as Adjusted EBITDA (defined beginning with net income, above), less interest expense, less the provision for income taxes and depreciation and amortization, tax affected for various discrete items, as appropriate. Adjusted EPS is calculated as Adjusted Net Income per weighted average diluted shares outstanding for a given period. We believe that Adjusted Net Income and Adjusted EPS provide transparent and useful information to management, investors, analysts and other stakeholders in evaluating and assessing our operating results from period-to-period after removing the impact of certain transactions and activities that affect comparability and that are not considered part of our core operations.
There are limitations to using the financial performance measures noted above. These performance measures are not intended to represent net income or other measures of financial performance. As such, they should not be used as alternatives to net income as indicators of operating performance. Other companies in our industry may define these performance measures differently than we do. As a result, it may be difficult to use these or similarly-named financial measures that other companies may use, to compare the performance of those companies to our performance. We compensate for these limitations by providing reconciliations of these performance measures to our net income, which is determined in accordance with GAAP.
| | Three Months Ended | | Year Ended | | ||||||||
| | December 31, | | December 31, | | ||||||||
(In millions, except per share data) |
| 2020 |
| 2019 |
| 2020 |
| 2019 | | ||||
Net income | | $ | 66.7 |
| $ | 5.7 |
| $ | 7.9 |
| $ | 92.0 | |
Interest expense, net | |
| 11.6 | |
| 10.0 | | | 43.6 | | | 39.3 | |
Provision for (benefit from) income taxes | |
| 34.5 | |
| (23.2) | | | 37.8 | | | 12.6 | |
Depreciation and amortization | |
| 32.6 | |
| 34.3 | | | 134.3 | | | 136.0 | |
EBITDA | | $ | 145.4 | | $ | 26.8 | | $ | 223.6 | | $ | 279.9 | |
Net gain on disposition of businesses and assets | |
| — | |
| (0.5) | | | (0.4) | |
| (0.7) | Other expense (income), net |
Restructuring and other charges (a) | |
| (0.2) | |
| 17.9 | | | 9.9 | |
| 18.1 | Selling, general, and administrative expenses; Other expense (income), net |
Acquisition transaction and integration net costs (benefit) (b) | | | 9.4 | | | (2.2) | | | 9.1 | | | (0.9) | Selling, general, and administrative expenses |
Acquisition purchase price hedge gain (c) | | | (7.3) | | | — | | | (7.3) | | | — | Other expense (income), net |
Asset impairment charges or write-offs (d) | | | 0.8 | | | — | | | 39.1 | | | — | Impairment charges |
Other items (e) | |
| 1.1 | |
| 16.9 | | | 25.5 | |
| 55.4 | Selling, general, and administrative expenses; Other expense (income), net |
Adjusted EBITDA | | $ | 149.2 | | $ | 58.9 | | $ | 299.5 | | $ | 351.8 | |
Adjusted EBITDA to Adjusted Net Income: | | | | | | | | | | | | | |
Adjusted EBITDA | | | 149.2 | | | 58.9 | | | 299.5 | | | 351.8 | |
Interest expense, net | | | 11.6 | | | 10.0 | | | 43.6 | | | 39.3 | |
Provision for (benefit from) income taxes - Adjusted (f) | | | 33.4 | | | 1.3 | | | 45.0 | | | 52.8 | |
Depreciation and amortization - Adjusted (g) | | | 32.6 | | | 33.9 | | | 131.9 | | | 132.4 | |
Adjusted Net Income | | $ | 71.6 | | $ | 13.7 | | $ | 79.0 | | $ | 127.3 | |
Weighted average shares- diluted | | | 39.0 | | | 39.4 | | | 38.6 | | | 40.7 | |
Adjusted EPS | | $ | 1.84 | | $ | 0.35 | | $ | 2.05 | | $ | 3.13 | |
| | | | | | | | | | | | | |
Adjusted EBITDA by Segment: | | | | | | | | | | | | | |
Latex Binders | | $ | 22.3 | | $ | 21.7 | | $ | 80.4 | | $ | 80.8 | |
Synthetic Rubber | | | 16.4 | | | 11.6 | | | 1.7 | | | 40.7 | |
Engineered Materials | | | 12.4 | | | 10.2 | | | 34.8 | | | 31.5 | |
Base Plastics | | | 51.5 | | | 18.8 | | | 111.2 | | | 103.5 | |
Polystyrene | | | 33.5 | | | 5.2 | | | 80.9 | | | 54.6 | |
Feedstocks | | | 14.5 | | | (9.7) | | | 5.6 | | | 7.0 | |
Americas Styrenics | | | 24.6 | | | 20.8 | | | 67.0 | | | 119.0 | |
Corporate unallocated | | | (26.0) | | | (19.8) | | | (82.1) | | | (85.4) | |
Adjusted EBITDA | | $ | 149.2 | | $ | 58.8 | | $ | 299.5 | | $ | 351.7 | |
| (a) | Restructuring and other charges for the 2020 and 2019 periods presented above primarily relate to charges incurred in connection with the Company’s corporate and other restructuring programs. Additionally, a portion of the restructuring and other charges for the 2020 and 2019 periods presented above relate to decommissioning, contract termination, and employee termination benefit charges incurred in connection with the upgrade and replacement of our compounding facility in Terneuzen, The Netherlands as well as our decision to cease manufacturing activities at our latex binders manufacturing facility in Livorno, Italy. |
Note that the accelerated depreciation charges incurred as part of both the Company’s corporate restructuring program and the upgrade and replacement of the Company’s compounding facility in Terneuzen, The Netherlands are included within the “Depreciation and amortization” caption above, and therefore are not included as a separate adjustment within this caption.
| (b) | Acquisition transaction and integration net costs for the 2020 periods presented above primarily relate to expenses incurred for the Company’s pending acquisition of the PMMA business from Arkema. Acquisition transaction and integration net benefit amounts for the 2019 periods presented above are primarily comprised of the bargain purchase gain recorded in conjunction |
| with our acquisition of latex binders production assets and related site infrastructure in Rheinmünster, Germany, partially offset by certain jurisdictional asset transfer taxes and advisory and professional fees incurred related to this acquisition. |
| (c) | The acquisition purchase price hedge gain for the 2020 periods relates to the change in fair value of the Company’s forward currency hedge arrangement that economically hedges the euro-denominated purchase price of the proposed acquisition of Arkema’s PMMA business, which is projected to close in mid-2021. |
| (d) | Asset impairment charges or write-offs for the 2020 periods presented above relate to the impairment of the Company’s styrene monomer assets in Boehlen, Germany and polybutadiene rubber (nickel and neodymium-PBR) assets in Schkopau, Germany. |
| (e) | Other items for the three months ended December 31, 2020 primarily relate to fees incurred in conjunction with certain of the Company’s strategic initiatives. Other items for the year ended December 31, 2020 and the three months and year ended December 31, 2019 primarily relate to advisory and professional fees incurred in conjunction with our initiative to transition business services from Dow, including certain administrative services such as accounts payable, logistics, and IT services, , which was substantially completed in 2020, as well as fees incurred in conjunction with certain of the Company’s strategic initiatives. |
| (f) | Adjusted to remove the tax impact of the items noted in (a), (b), (c), (d), (e) and (g). For the three months and full year periods, the income tax expense (benefit) related to these items was determined utilizing the applicable rates in the taxing jurisdictions in which these adjustments occurred. |
The three months ended December 31, 2020 excludes $1.3 million of tax expense related to provision to return adjustments. The year ended December 31, 2020 excludes $4.0 million of tax expense, which primarily relates to provision to return adjustments. The three months ended December 31, 2019 excludes a net $24.1 million tax benefit, which primarily relates to a $32.7 million benefit recorded in connection with the remeasurement of the Company’s deferred tax assets and liabilities in Switzerland due to changes in the Swiss Cantonal and Federal tax rules enacted in 2019, partially offset by a $6.2 million charge recorded to increase the Company’s reserves for uncertain tax provisions. The year ended December 31, 2019 excludes a net $31.5 million tax benefit, which primarily relates to a $40.1 million tax benefit related to the remeasurement of the Company’s deferred tax assets and liabilities in Switzerland due to changes in the aforementioned Swiss tax rules in 2019, partially offset by a $6.2 million charge recorded to increase the Company’s reserves for uncertain tax provisions.
| (g) | Amounts exclude accelerated depreciation of $2.5 million for the year ended December 31, 2020 and $0.4 million for the three months and year ended December 31, 2019 related to the shortening of the useful life of certain fixed assets related to the Company’s corporate restructuring program. The amounts also exclude $3.1 million for the year ended December 31, 2019 related to the shortening of the useful life of certain information technology assets related to the transition of business services from The Dow Chemical Company (noted in (e) above). |
For the same reasons discussed above, we are providing the following reconciliation of forecasted net income to forecasted Adjusted EBITDA and Adjusted EPS for the full year ended December 31, 2021. See “Note on Forward-Looking Statements” above for a discussion of the limitations of these forecasts.
| | Year Ended |
| | December 31, |
(In millions, except per share data) | | 2021 |
Adjusted EBITDA | $ | 400 - 450 |
Interest expense, net |
| (45) |
Provision for income taxes |
| (53) - (70) |
Depreciation and amortization |
| (135) |
Reconciling items to Adjusted EBITDA (h) |
| - |
Net Income |
| 167 - 200 |
Reconciling items to Adjusted Net Income (h) |
| - |
Adjusted Net Income | | 167 - 200 |
| | |
Weighted average shares - diluted (i) | | 38.6 |
EPS - diluted ($) | $ | 4.33 - 5.18 |
Adjusted EPS ($) | $ | 4.33 - 5.18 |
| (h) | Reconciling items to Adjusted EBITDA and Adjusted Net Income are not typically forecasted by the Company based on their nature as being primarily driven by transactions that are not part of the core operations of the business and, as a result, cannot be estimated without unreasonable cost or uncertainty. As such, for the forecasted full year ended December 31, 2021, we have not included estimates for these items. |
| (i) | Weighted average shares calculated for the purpose of forecasting EPS and Adjusted EPS do not forecast significant future share transactions or events, such as repurchases, significant share-based compensation award grants, and changes in the Company’s share price. These are all factors which could have a significant impact on the calculation of EPS and Adjusted EPS during actual future periods. |
Note 3: Reconciliation of Non-GAAP Liquidity Measures to Cash from Operations
The Company uses certain measures, such as Free Cash Flow as non-GAAP measures, to evaluate and discuss its liquidity position and results. Free Cash Flow is defined as cash from operating activities, less capital expenditures. We believe that Free Cash Flow provides an indicator of the Company’s ongoing ability to generate cash through core operations, as it excludes the cash impacts of various financing transactions as well as cash flows from business combinations that are not considered organic in nature. We also believe that Free Cash Flow provides management and investors with useful analytical indicators of our ability to service our indebtedness, pay dividends (when declared), and meet our ongoing cash obligations.
Free Cash Flow is not intended to represent cash flows from operations as defined by GAAP, and therefore, should not be used as alternatives for that measure. Other companies in our industry may define Free Cash Flow differently than we do. As a result, it may be difficult to use this or similarly-named financial measures that other companies may use, to compare the liquidity and cash generation of those companies to our own. The Company compensates for these limitations by providing the following detail, which is determined in accordance with GAAP.
Free Cash Flow
| | Three Months Ended | | Year Ended | ||||||||
| | December 31, | | December 31, | ||||||||
(In millions) | | 2020 | | 2019 | | 2020 |
| 2019 | ||||
Cash provided by operating activities |
| $ | 127.6 |
| $ | 47.6 |
| $ | 255.4 |
| $ | 322.5 |
Capital expenditures | |
| (21.4) | |
| (38.9) | |
| (82.3) | |
| (110.1) |
Free Cash Flow | | $ | 106.2 | | $ | 8.7 | | $ | 173.1 | | $ | 212.4 |