tsn-20241112
0000100493falseiso4217:USDxbrli:shares00001004932024-11-122024-11-12


UNITED STATES
SECURITIES AND EXCHANGE COMMISSION
WASHINGTON, D.C. 20549
FORM 8-K

Current Report Pursuant to Section 13 or 15(d) of the
Securities Exchange Act of 1934

Date of Report (Date of Earliest Event Reported): November 12, 2024
TYSON FOODS, INC.
(Exact name of Registrant as specified in its charter)

Delaware
001-14704
71-0225165
(State or other jurisdiction of incorporation or organization)
(Commission File Number)
(I.R.S. Employer Identification No.)
2200 West Don Tyson Parkway,
Springdale,
Arkansas
72762-6999
(Address of Principal Executive Offices)
(Zip Code)
(479) 290-4000
(Registrant's telephone number, including area code)

Not applicable
(Former name or former address, if changed since last report)
___________________________________
Check the appropriate box below if the Form 8-K filing is intended to simultaneously satisfy the filing obligation of the registrant under any of the following provisions (see General Instruction A.2. below):
    Written communications pursuant to Rule 425 under the Securities Act (17 CFR 230.425)
    Soliciting material pursuant to Rule 14a-12 under the Exchange Act (17 CFR 240.14a-12)
    Pre-commencement communications pursuant to Rule 14d-2(b) under the Exchange Act (17 CFR 240.14d-2(b))
    Pre-commencement communications pursuant to Rule 13e-4(c) under the Exchange Act (17 CFR 240.13e-4(c))

Securities Registered Pursuant to Section 12(b) of the Act:
Title of Each ClassTrading SymbolName of Each Exchange on Which Registered
Class A Common StockPar Value$0.10TSNNew York Stock Exchange
Class B stock is not publicly listed for trade on any exchange or market system. However, Class B stock is convertible into Class A stock on a share-for-share basis.

Indicate by check mark whether the registrant is an emerging growth company as defined in Rule 405 of the Securities Act of 1933 (§230.405 of this chapter) or Rule 12b-2 of the Securities Exchange Act of 1934 (§240.12b-2 of this chapter). Emerging growth company

If an emerging growth company, indicate by check mark if the registrant has elected not to use the extended transition period for complying with any new or revised financial accounting standards provided pursuant to Section 13(a) of the Exchange Act.


Item 2.02. Results of Operations and Financial Condition

On November 12, 2024, Tyson Foods, Inc. issued a press release announcing results of operations for its fourth quarter and fiscal year ended September 28, 2024, and made available a financial results presentation for that same quarter and fiscal year. A copy of the press release and presentation are furnished as Exhibits 99.1 and 99.2 to this Current Report on Form 8-K, respectively, and are incorporated herein by reference.
The information in the preceding paragraph, as well as Exhibits 99.1 and 99.2, shall not be deemed “filed” for purposes of Section 18 of the Securities Exchange Act of 1934, as amended (the “Exchange Act”), or otherwise subject to the liabilities of that section. It may only be incorporated by reference into another filing under the Exchange Act or the Securities Act of 1933, as amended, if such subsequent filing specifically references this Current Report on Form 8-K.

Item 9.01. Financial Statements and Exhibits

(d)Exhibits

Exhibit
Number
Description
99.1
99.2
104Cover Page Interactive Data File formatted in iXBRL.
2


SIGNATURE
Pursuant to the requirements of the Securities Exchange Act of 1934, the registrant has duly caused this report to be signed on its behalf by the undersigned hereunto duly authorized.

TYSON FOODS, INC.
Date: November 12, 2024By:/s/ Curt T. Calaway
Name:Curt T. Calaway
Title:Chief Financial Officer

3

tflogo_fullcolorxrgba.jpg
TYSON FOODS REPORTS FOURTH QUARTER AND FISCAL 2024 RESULTS
Achieved Significant Improvements in Profitability for Fourth Quarter and Full Year
Springdale, Arkansas – November 12, 2024 Tyson Foods, Inc. (NYSE: TSN), one of the world’s largest food companies and a recognized leader in protein with leading brands including Tyson, Jimmy Dean, Hillshire Farm, Ball Park, Wright, Aidells, ibp and State Fair, reported the following results:
(in millions, except per share data)Fourth QuarterTwelve Months Ended
2024202320242023
Sales$13,565 $13,348 $53,309 $52,881 
Operating Income (Loss)$525 $(463)$1,409 $(395)
Adjusted1 Operating Income (non-GAAP)
$512 $236 $1,820 $933 
Net Income (Loss) Per Share Attributable to Tyson$1.00 $(1.31)$2.25 $(1.87)
Adjusted1 Net Income Per Share Attributable to Tyson (non-GAAP)
$0.92 $0.37 $3.10 $1.34 
1 The Company reports its financial results in accordance with U.S. generally accepted accounting principles (GAAP). As used in this table and throughout this earnings release, adjusted operating income and adjusted net income per share attributable to Tyson (Adjusted EPS) are non-GAAP financial measures. Refer to the end of this release for an explanation and reconciliation of these and other non-GAAP financial measures used in this release to comparable GAAP measures.
Fiscal 2024 Highlights
Sales of $53,309 million, up 0.8% from prior year
GAAP operating income of $1,409 million, up $1,804 million from prior year
Adjusted operating income of $1,820 million, up 95% from prior year
GAAP EPS of $2.25, up $4.12 from prior year
Adjusted EPS of $3.10, up 131% from prior year
Total Company GAAP operating margin of 2.6%
Total Company adjusted operating margin (non-GAAP) of 3.4%
Cash provided by operating activities of $2,590 million, up 48% from prior year
Free cash flow (non-GAAP) of $1,458 million, up $1,645 million from prior year
Fourth Quarter Highlights
Sales of $13,565 million, up 1.6% from prior year
GAAP operating income of $525 million, up $988 million from prior year
Adjusted operating income of $512 million, up 117% from prior year
GAAP EPS of $1.00, up $2.31 from prior year
Adjusted EPS of $0.92, up 149% from prior year
Total Company GAAP operating margin of 3.9%
Total Company adjusted operating margin (non-GAAP) of 3.8%
Liquidity of approximately $4.0 billion as of September 28, 2024

"We delivered significant improvement in profitability for the fourth quarter and full year. We also strengthened our financial position, with solid cash flow generation and a substantial reduction of our net leverage ratio,” stated Donnie King, President & CEO of Tyson Foods. "Looking ahead, we are optimistic about our outlook and our ability to deliver long-term value to our shareholders. Our multi-protein, multi-channel portfolio, combined with our best-in-class team, iconic brands and focus on operational excellence positions us well for Fiscal 2025 and beyond."

1


SEGMENT RESULTS (in millions)
Sales
(for the fourth quarter and twelve months ended September 28, 2024, and September 30, 2023)
Fourth QuarterTwelve Months Ended
VolumeAvg. PriceVolumeAvg. Price
20242023Change
Change2
20242023Change
Change2
Beef$5,261 $5,029 3.7 %0.9 %$20,479 $19,325 1.6 %4.4 %
Pork1,438 1,494 3.2 %(6.9)%5,903 5,768 3.8 %(0.7)%
Chicken4,251 4,155 (0.7)%0.2 %16,425 17,060 (2.2)%(2.4)%
Prepared Foods2,472 2,502 (1.4)%0.2 %9,851 9,845 0.9 %(0.8)%
International/Other609 636 1.3 %(5.5)%2,353 2,515 3.2 %(9.6)%
Intersegment Sales(466)(468)n/an/a(1,702)(1,632)n/an/a
Total$13,565 $13,348 0.5 %0.2 %$53,309 $52,881  %0.6 %
Operating Income (Loss)
(for the fourth quarter and twelve months ended September 28, 2024, and September 30, 2023)
Fourth QuarterTwelve Months Ended
Operating MarginOperating Margin
20242023202420232024202320242023
Beef$(71)$(323)(1.3)%(6.4)%$(381)$(91)(1.9)%(0.5)%
Pork(16)(11)(1.1)%(0.7)%(40)(139)(0.7)%(2.4)%
Chicken409 (267)9.6 %(6.4)%988 (770)6.0 %(4.5)%
Prepared Foods203 118 8.2 %4.7 %879 823 8.9 %8.4 %
International/Other— 20 n/an/a(37)(218)n/an/a
Total$525 $(463)3.9 %(3.5)%$1,409 $(395)2.6 %(0.7)%
ADJUSTED SEGMENT RESULTS (in millions)
Adjusted Operating Income (Loss) (Non-GAAP)1
(for the fourth quarter and twelve months ended September 28, 2024, and September 30, 2023)
Fourth QuarterTwelve Months Ended
Adjusted Operating Margin (Non-GAAP)Adjusted Operating Margin (Non-GAAP)
20242023
20242
20232
20242023
20242
20232
Beef$(71)$17 (1.3)%0.3 %$(291)$233 (1.4)%1.2 %
Pork19 (8)1.3 %(0.5)%142 (128)2.4 %(2.2)%
Chicken356 75 8.4 %1.8 %1,015 (77)6.2 %(0.4)%
Prepared Foods205 151 8.3 %6.0 %905 889 9.2 %9.0 %
International/Othern/an/a49 16 n/an/a
Total$512 $236 3.8 %1.8 %$1,820 $933 3.4 %1.8 %
2 Average Price Change and Adjusted Operating Margin (Non-GAAP) exclude $118 million and $156 million in the Chicken segment and Total Company for the three and twelve months ended September 30, 2023, respectively, and $45 million in the Pork segment and Total Company for the twelve months ended September 28, 2024 of legal contingency accruals recognized as reductions to Sales.


2


OUTLOOK
For fiscal 2025, the United States Department of Agriculture (USDA) indicates domestic protein production (beef, pork, chicken and turkey) should increase compared to fiscal 2024 levels. The following is a summary of the updated outlook for each of our segments, as well as an outlook for revenue, capital expenditures, net interest expense, liquidity, free cash flow, tax rate and dividends for fiscal 2025. Certain of the outlook numbers include adjusted operating income (loss) (a non-GAAP metric) for each segment. The Company is not able to reconcile its full-year fiscal 2025 projected adjusted results to its fiscal 2025 projected GAAP results because certain information necessary to calculate such measures on a GAAP basis is unavailable or dependent on the timing of future events outside of our control. Therefore, because of the uncertainty and variability of the nature of and the amount of any potential applicable future adjustments, which could be significant, the Company is unable to provide a reconciliation for these forward-looking non-GAAP measures without unreasonable effort. Adjusted operating income (loss) should not be considered a substitute for operating income (loss) or any other measures of financial performance reported in accordance with GAAP. Investors should rely primarily on the Company’s GAAP results and use non-GAAP financial measures only supplementally in making investment decisions.
Beef
USDA projects domestic production will decrease approximately 2% in fiscal 2025 as compared to fiscal 2024. We anticipate adjusted operating loss between $(0.4) billion and $(0.2) billion in fiscal 2025.
Pork
USDA projects domestic production will increase approximately 2% in fiscal 2025 as compared to fiscal 2024. We anticipate adjusted operating income of $0.1 billion to $0.2 billion in fiscal 2025.
Chicken
USDA projects chicken production will increase approximately 3% in fiscal 2025 as compared to fiscal 2024. We anticipate adjusted operating income of $1.0 billion to $1.2 billion for fiscal 2025.
Prepared Foods
We anticipate adjusted operating income of $0.9 billion to $1.1 billion in fiscal 2025.
International/Other
We anticipate improved results from our foreign operations in fiscal 2025 on an adjusted basis.
Total Company
We anticipate total company adjusted operating income of $1.8 billion to $2.2 billion for fiscal 2025.
Revenue
We expect sales to be down 1% to flat in fiscal 2025 as compared to fiscal 2024.
Capital Expenditures
We expect capital expenditures between $1.0 billion and $1.2 billion for fiscal 2025. Capital expenditures include investments in profit improvement projects as well as projects for maintenance and repair.
Net Interest Expense
We expect net interest expense to approximate $380 million for fiscal 2025.
Liquidity
We expect total liquidity, which was $4.0 billion as of September 28, 2024, to remain above our minimum liquidity target of $1.0 billion.
Free Cash Flow
We expect free cash flow to be greater than dividends for fiscal 2025.
Tax Rate
We currently expect our adjusted effective tax rate to be 24% to 25% for fiscal 2025
Dividends
Effective November 8, 2024, the Board of Directors increased the quarterly dividend previously declared on August 8, 2024, to $0.50 per share on our Class A common stock and $0.45 per share on our Class B common stock. The increased quarterly dividend is payable on December 13, 2024, to shareholders of record at the close of business on November 29, 2024. The Board also declared on November 8, 2024 a quarterly dividend of $0.50 per share on our Class A common stock and $0.45 per share on our Class B common stock, payable on March 14, 2025, to shareholders of record at the close of business on February 28, 2025. We anticipate the remaining quarterly dividends in fiscal 2025 will be $0.50 and $0.45 per share of our Class A and Class B common stock, respectively. This results in an annual dividend rate in fiscal 2025 of $2.00 for Class A shares and $1.80 for Class B shares, or a 2% increase compared to the fiscal 2024 annual dividend rate.
3


TYSON FOODS, INC.
CONSOLIDATED CONDENSED STATEMENTS OF INCOME
(In millions, except per share data)
(Unaudited)
Three Months EndedTwelve Months Ended
September 28, 2024September 30, 2023September 28, 2024September 30, 2023
Sales$13,565 $13,348 $53,309 $52,881 
Cost of Sales12,505 12,889 49,682 50,250 
Gross Profit1,060 459 3,627 2,631 
Selling, General and Administrative535 589 2,218 2,245 
Goodwill Impairment— 333 — 781 
Operating Income (Loss)525 (463)1,409 (395)
Other (Income) Expense:
Interest income(29)(8)(89)(30)
Interest expense130 93 481 355 
Other, net(51)(75)(42)
Total Other (Income) Expense50 93 317 283 
Income (Loss) before Income Taxes475 (556)1,092 (678)
Income Tax Expense (Benefit)111 (113)270 (29)
Net Income (Loss)364 (443)822 (649)
Less: Net Income (Loss) Attributable to Noncontrolling Interests22 (1)
Net Income (Loss) Attributable to Tyson$357 $(450)$800 $(648)
Net Income (Loss) Per Share Attributable to Tyson:
Class A Basic$1.03 $(1.31)$2.31 $(1.87)
Class B Basic$0.92 $(1.17)$2.06 $(1.68)
Diluted$1.00 $(1.31)$2.25 $(1.87)
Dividends Declared Per Share:
Class A$0.490 $0.480 $1.970 $1.940 
Class B$0.441 $0.432 $1.773 $1.746 
Sales Growth1.6 %0.8 %
Margins: (Percent of Sales)
Gross Profit7.8 %3.4 %6.8 %5.0 %
Operating Income (Loss)3.9 %(3.5)%2.6 %(0.7)%
Net Income (Loss) Attributable to Tyson2.6 %(3.4)%1.5 %(1.2)%
Effective Tax Rate 3
23.3 %20.2 %24.8 %4.3 %
3 The effective tax rate for the three and twelve months ended September 30, 2023 was impacted by a $333 million and $781 million goodwill impairment, respectively, as the impairment charge is non-deductible for income tax purposes.


4


TYSON FOODS, INC.
CONSOLIDATED CONDENSED BALANCE SHEETS
(In millions)
(Unaudited)

September 28, 2024September 30, 2023
Assets
Current Assets:
Cash and cash equivalents$1,717 $573 
Accounts receivable, net2,406 2,476 
Inventories5,195 5,328 
Other current assets433 345 
Total Current Assets9,751 8,722 
Net Property, Plant and Equipment9,442 9,634 
Goodwill9,819 9,878 
Intangible Assets, net5,875 6,098 
Other Assets2,213 1,919 
Total Assets$37,100 $36,251 
Liabilities and Shareholders’ Equity
Current Liabilities:
Current debt$74 $1,895 
Accounts payable2,402 2,594 
Other current liabilities2,311 2,010 
Total Current Liabilities4,787 6,499 
Long-Term Debt9,713 7,611 
Deferred Income Taxes2,285 2,308 
Other Liabilities1,801 1,578 
Total Tyson Shareholders’ Equity18,390 18,133 
Noncontrolling Interests124 122 
Total Shareholders’ Equity18,514 18,255 
Total Liabilities and Shareholders’ Equity$37,100 $36,251 

5


TYSON FOODS, INC.
CONSOLIDATED CONDENSED STATEMENTS OF CASH FLOWS
(In millions)
(Unaudited)

Twelve Months Ended
September 28, 2024September 30, 2023
Cash Flows From Operating Activities:
Net income (loss)$822 $(649)
Depreciation and amortization1,400 1,339 
Deferred income taxes(45)(183)
Impairment of goodwill— 781 
Other, net189 277 
Net changes in operating assets and liabilities224 187 
Cash Provided by Operating Activities2,590 1,752 
Cash Flows From Investing Activities:
Additions to property, plant and equipment(1,132)(1,939)
Purchases of marketable securities(38)(34)
Proceeds from sale of marketable securities35 32 
Proceeds from sale of business174 — 
Acquisitions, net of cash acquired— (262)
Acquisition of equity investments(29)(115)
Other, net102 19 
Cash Used for Investing Activities(888)(2,299)
Cash Flows From Financing Activities:
Proceeds from issuance of debt2,415 1,130 
Payments on debt(1,641)(603)
Proceeds from issuance of commercial paper1,694 7,693 
Repayments of commercial paper(2,285)(7,103)
Purchases of Tyson Class A common stock(49)(354)
Dividends(684)(670)
Stock options exercised14 11 
Other, net(45)(16)
Cash Provided by (Used for) Financing Activities(581)88 
Effect of Exchange Rate Changes on Cash23 
Increase (Decrease) in Cash and Cash Equivalents and Restricted Cash1,144 (458)
Cash and Cash Equivalents and Restricted Cash at Beginning of Year573 1,031 
Cash and Cash Equivalents and Restricted Cash at End of Period1,717 573 
Less: Restricted Cash at End of Period— — 
Cash and Cash Equivalents at End of Period$1,717 $573 
6


Non-GAAP Financial Measures
Adjusted Operating Income (Loss), Adjusted Income (Loss) before Income Taxes, Adjusted Income Tax Expense (Benefit), Adjusted Net Income (Loss) Attributable to Tyson and Adjusted EPS, EBITDA, Adjusted EBITDA, net debt to EBITDA, net debt to Adjusted EBITDA and Free Cash Flow are presented as supplemental financial measures in the evaluation of our business that are not required by, or presented in accordance with GAAP. The non-GAAP financial measures are tools intended to assist our management and investors in comparing our performance on a consistent basis for purposes of business decision-making by removing the impact of certain items that management believes do not directly reflect our core operations on an ongoing basis. These non-GAAP measures should not be a substitute for their comparable GAAP financial measures. Investors should rely primarily on our GAAP results and use non-GAAP financial measures only supplementally in making investment decisions. We believe the presentation of these non-GAAP financial measures helps management and investors to assess our operating performance from period to period, including our ability to generate earnings sufficient to service our debt, enhances understanding of our financial performance and highlights operational trends. These measures are widely used by investors and rating agencies in the valuation, comparison, rating and investment recommendations of companies. Our calculation of non-GAAP measures may not be comparable to similarly titled measures reported by other companies and other companies may not define these non-GAAP financial measures in the same way, which may limit their usefulness of comparative measures.
Definitions
EBITDA is defined as net income (loss) before interest, income taxes (benefits), depreciation and amortization. Net debt to EBITDA (Adjusted EBITDA) represents the ratio of our debt, net of cash, cash equivalents and short-term investments, to EBITDA (and to Adjusted EBITDA). EBITDA, Adjusted EBITDA, net debt to EBITDA and net debt to Adjusted EBITDA are presented as supplemental financial measurements in the evaluation of our business.
Adjusted EBITDA, Adjusted Operating Income (Loss), Adjusted Income (Loss) before Income Taxes, Adjusted Income Tax Expense (Benefit), Adjusted Net Income (Loss) Attributable to Tyson and Adjusted EPS are defined as EBITDA, Operating Income (Loss), Income (Loss) before Income Taxes, Income Tax Expense (Benefit), Net Income (Loss) Attributable to Tyson and diluted earnings per share, respectively, excluding the impacts of any items that management believes do not directly reflect our core operations on an ongoing basis.
Free Cash Flow is defined as Cash Provided by Operating Activities minus payments for Property, Plant and Equipment.
7


TYSON FOODS, INC.
GAAP Results to Non-GAAP Results Reconciliations
(In millions, except per share data)
(Unaudited)
Results for the fourth quarter ended September 28, 2024
SalesCost of SalesSelling, General and AdministrativeGoodwill ImpairmentOperating
Income (Loss)
Other (Income) ExpenseIncome (Loss) before Income TaxesIncome Tax Expense (Benefit)Net Income (Loss) Attributable to TysonEPS Impact
GAAP Results$525 $475 $111 $357 $1.00 
Production facility fire insurance proceeds, net of costs8
— (51)— — (51)(31)(82)(19)(63)(0.18)
Plant closures and disposals— 27 — — 27 — 27 (10)37 0.10 
The Netherlands facility9
— — — — 11 (8)(0.02)
Brand discontinuation— — — — 0.02 
Adjusted Non-GAAP Results$512 $431 $95 $329 $0.92 
Results for the fourth quarter ended September 30, 2023
SalesCost of SalesSelling, General and AdministrativeGoodwill ImpairmentOperating
Income (Loss)
Other (Income) ExpenseIncome (Loss) before Income TaxesIncome Tax Expense (Benefit)Net Income (Loss) Attributable to TysonEPS Impact
GAAP Results$(463)$(556)$(113)$(450)$(1.31)
Production facilities fire costs, net of insurance proceeds8
— — — — 0.01 
Restructuring and related charges— 25 — 31 — 31 23 0.06 
Plant closures and disposals— 215 — — 215 — 215 55 160 0.45 
Legal contingency accruals118 — — — 118 — 118 30 88 0.25 
China plant relocation remuneration4
— (19)— — (19)— (19)(5)(11)(0.03)
Product line discontinuation— 17 — — 17 — 17 13 0.04 
Goodwill Impairment5
— — — 333 333 — 333 — 333 0.93 
Remeasurement of net deferred tax liabilities at lower enacted state tax rates— — — — — — — 26 (26)(0.07)
Impact of antidilutive securities6
— — — — — — — — — 0.04 
Adjusted Non-GAAP Results$236 $143 $$133 $0.37 
Results for the twelve months ended September 28, 2024
SalesCost of SalesSelling, General and AdministrativeGoodwill ImpairmentOperating
Income (Loss)
Other (Income) ExpenseIncome (Loss) before Income TaxesIncome Tax Expense (Benefit)Net Income (Loss) Attributable to TysonEPS Impact
GAAP Results$1,409 $1,092 $270 $800 $2.25 
Production facility fire insurance proceeds, net of costs8
— (70)— — (70)(34)(104)(24)(80)(0.23)
Restructuring and related charges— — 31 — 31 — 31 23 0.06 
Plant closures and disposals— 182 — — 182 — 182 36 146 0.41 
Legal contingency accruals45 129 — — 174 — 174 41 133 0.38 
The Netherlands facility9
— 86 — — 86 — 86 11 75 0.21 
Brand discontinuation— — — — 0.02 
Adjusted Non-GAAP Results$1,820 $1,469 $344 $1,103 $3.10 
Results for the twelve months ended September 30, 2023
SalesCost of SalesSelling, General and AdministrativeGoodwill ImpairmentOperating
Income (Loss)
Other (Income) ExpenseIncome (Loss) before Income TaxesIncome Tax Expense (Benefit)Net Income (Loss) Attributable to TysonEPS Impact
GAAP Results$(395)$(678)$(29)$(648)$(1.87)
Production facilities fire insurance proceeds, net of costs8
— (53)— — (53)(22)(75)(17)(58)(0.16)
Restructuring and related charges— 29 95 — 124 — 124 29 95 0.26 
Plant closures and disposals— 322 — — 322 — 322 82 240 0.67 
Legal contingency accruals156 — — — 156 — 156 39 117 0.33 
China plant relocation remuneration4
— (19)— — (19)— (19)(5)(11)(0.03)
Product line discontinuation— 17 — — 17 — 17 13 0.04 
Goodwill Impairment5
— — — 781 781 — 781 — 757 2.13 
Remeasurement of net deferred tax liabilities at lower enacted state tax rates— — — — — — — 26 (26)(0.07)
Impact of antidilutive securities6
— — — — — — — — — 0.04 
Adjusted Non-GAAP Results$933 $628 $129 $479 $1.34 
8


TYSON FOODS, INC.
Adjusted Operating Income (Loss) Non-GAAP Reconciliations
(In millions)
(Unaudited)
Adjusted Operating Income (Loss)
(for the fourth quarter ended September 28, 2024)
BeefPorkChickenPrepared FoodsInternational/OtherTotal
Reported operating income (loss)$(71)$(16)$409 $203 $— $525 
Less: Production facility fire insurance proceeds, net of costs8
— — (51)— — (51)
Add/(Less): Plant closures and disposals— 35 (8)— — 27 
Add: the Netherlands facility9
— — — — 
Add: Brand discontinuation— — — 
Adjusted operating income (loss)$(71)$19 $356 $205 $$512 
Adjusted Operating Income (Loss)
(for the fourth quarter ended September 30, 2023)
BeefPorkChickenPrepared FoodsInternational/OtherTotal
Reported operating income (loss)$(323)$(11)$(267)$118 $20 $(463)
Add: Production facility fire costs, net of insurance proceeds8
— — — — 
Add: Restructuring and related charges16 — 31 
Add: Plant closures and disposals— — 215 — — 215 
Add: Legal contingency accruals— — 118 — — 118 
Less: China plant relocation remuneration— — — — (19)(19)
Add: Product line discontinuation— — — 17 — 17 
Add: Goodwill Impairment333 — — — — 333 
Adjusted operating income (loss) $17 $(8)$75 $151 $$236 
Adjusted Operating Income (Loss)
(for the twelve months ended September 28, 2024)
BeefPorkChickenPrepared FoodsInternational/OtherTotal
Reported operating income (loss)$(381)$(40)$988 $879 $(37)$1,409 
Less: Production facility fire insurance proceeds, net of costs8
— — (70)— — (70)
Add: Restructuring and related charges24 — 31 
Add: Plant closures and disposals41 108 33 — — 182 
Add: Legal contingency accruals45 73 56 — — 174 
Add: the Netherlands facility9
— — — — 86 86 
Add: Brand discontinuation— — — 
Adjusted operating income (loss)$(291)$142 $1,015 $905 $49 $1,820 
Adjusted Operating Income (Loss)
(for the twelve months ended September 30, 2023)
BeefPorkChickenPrepared FoodsInternational/OtherTotal
Reported operating income (loss)$(91)$(139)$(770)$823 $(218)$(395)
Less: Production facility fire insurance proceeds, net of costs8
(42)— (11)— — (53)
Add: Restructuring and related charges33 11 16 49 15 124 
Add: Plant closures and disposals— — 322 — — 322 
Add: Legal contingency accruals— — 156 — — 156 
Less: China plant relocation remuneration— — — — (19)(19)
Add: Product line discontinuation— — — 17 — 17 
Add: Goodwill Impairment333 — 210 — 238 781 
Adjusted operating income (loss) $233 $(128)$(77)$889 $16 $933 
9


TYSON FOODS, INC.
EBITDA and Adjusted EBITDA Non-GAAP Reconciliations
(In millions)
(Unaudited)
Twelve Months Ended
September 28, 2024September 30, 2023
Net income (loss)$822 $(649)
Less: Interest income(89)(30)
Add: Interest expense481 355 
Add/(Less): Income tax expense (benefit)270 (29)
Add: Depreciation1,159 1,100 
Add: Amortization7
229 229 
EBITDA$2,872 $976 
Adjustments to EBITDA:
Less: Production facilities fire insurance proceeds, net of costs8
$(104)$(75)
Add: Restructuring and related charges31 124 
Add: Plant closures and disposals182 322 
Add: Legal contingency accruals174 156 
Add: The Netherlands facility9
86 — 
Add: Brand discontinuation— 
Add: Goodwill impairment— 781 
Less: China plant relocation remuneration— (19)
Add: Product line discontinuation— 17 
Less: Depreciation and amortization included in EBITDA adjustments10
(129)(133)
Total Adjusted EBITDA$3,120 $2,149 
Total gross debt$9,787 $9,506 
Less: Cash and cash equivalents(1,717)(573)
Less: Short-term investments(10)(15)
Total net debt$8,060 $8,918 
Ratio Calculations:
Gross debt/EBITDA3.4x9.7x
Net debt/EBITDA2.8x9.1x
Gross debt/Adjusted EBITDA3.1x4.4x
Net debt/Adjusted EBITDA2.6x4.1x
4 The China plant relocation remuneration EPS impact was net of $3 million associated with Net Income (Loss) Attributable to Noncontrolling Interests.
5 Goodwill impairment was non-deductible for income tax purposes and the EPS impact was net of $24 million associated with Net Income (Loss) Attributable to Noncontrolling Interests.
6 GAAP EPS, Net Income (Loss) Per Share Attributable to Tyson, excluded the impact of certain antidilutive securities given the Company incurring a net loss for fiscal 2023. Adjusted Non-GAAP EPS is in a net income position, and thus, the impact of the otherwise antidilutive securities under GAAP EPS were added back in the calculation of Adjusted Non-GAAP EPS.
7 Excludes the amortization of debt issuance and debt discount expense of $12 million and $10 million for the twelve months ended September 28, 2024 and September 30, 2023, respectively, as it is included in interest expense.
8 Relates to fires at production facilities in Chicken in the fourth quarter of fiscal 2021 and Beef in the fourth quarter of fiscal 2019.
9 Relates to a fire at our production facility in the Netherlands in the first quarter of fiscal 2024 and subsequent decision to sell the facility.
10 Removal of accelerated depreciation of $127 million related to plant closures and disposals for the twelve months ended September 28, 2024 and $19 million related to restructuring and related charges and $114 million related to plant closures and disposals for the twelve months ended September 30, 2023 as they are already included in depreciation expense. Removal of accelerated amortization of $2 million related to brand discontinuation for the twelve months ended September 28, 2024 as it is already included in amortization expense.


10


TYSON FOODS, INC.
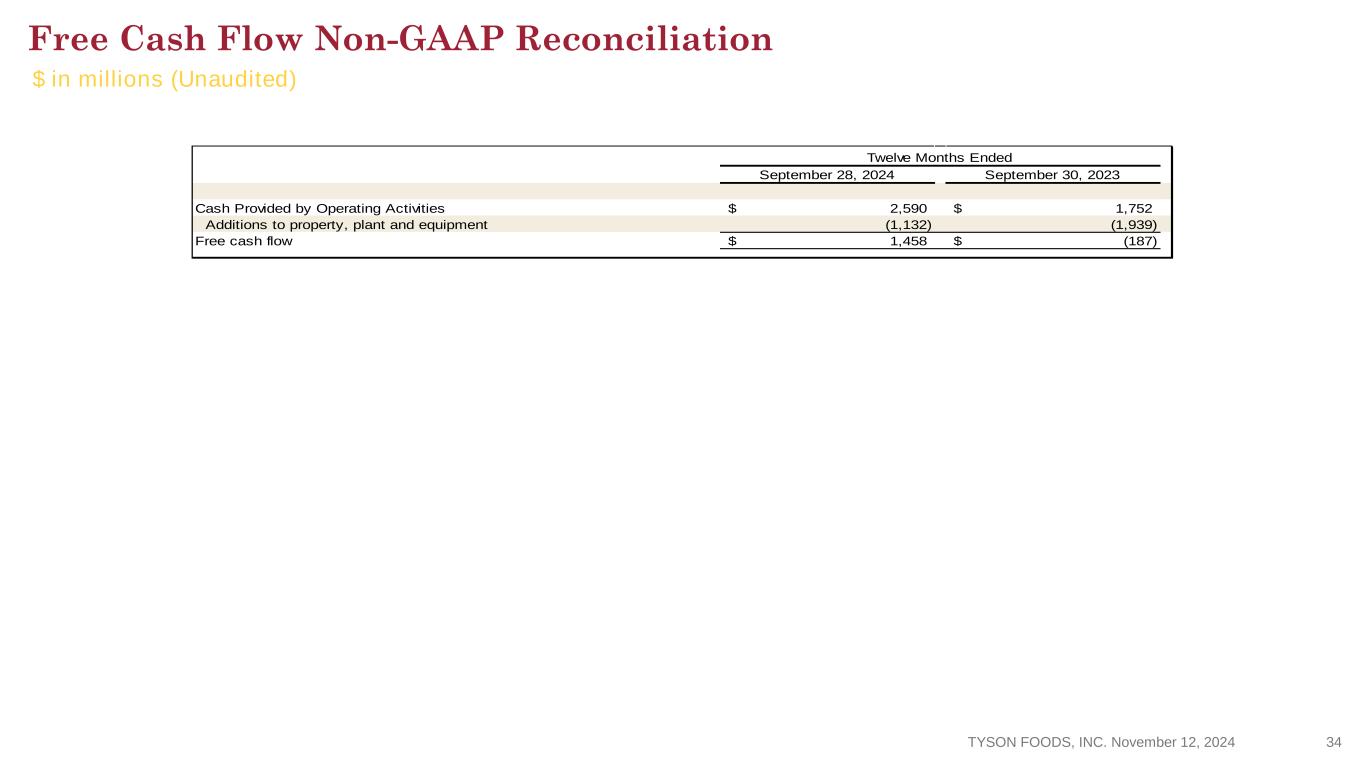
Free Cash Flow Non-GAAP Reconciliation
(In millions)
(Unaudited)
Twelve Months Ended
September 28, 2024September 30, 2023
Cash Provided by Operating Activities$2,590 $1,752 
Additions to property, plant and equipment(1,132)(1,939)
Free cash flow$1,458 $(187)


11


About Tyson Foods, Inc.
Tyson Foods, Inc. (NYSE: TSN) is a world-class food company and recognized leader in protein. Founded in 1935 by John W. Tyson, it has grown under four generations of family leadership. The Company is unified by this purpose: Tyson Foods. We Feed the World Like Family™ and has a broad portfolio of iconic products and brands including Tyson®, Jimmy Dean®, Hillshire Farm®, Ball Park®, Wright®, State Fair®, Aidells® and ibp®. Tyson Foods is dedicated to bringing high-quality food to every table in the world, safely, sustainably, and affordably, now and for future generations. Headquartered in Springdale, Arkansas, the company had approximately 138,000 team members on September 28, 2024. Visit www.tysonfoods.com.
Conference Call Information and Other Selected Data
A conference call to discuss the Company's financial results will be held at 9 a.m. Eastern Monday, November 12, 2024. A link for the webcast of the conference call is available on the Tyson Investor Relations website at https://ir.tyson.com. The webcast also can be accessed by the following direct link: https://events.q4inc.com/attendee/102078426. For those who cannot participate at the scheduled time, a replay of the live webcast and the accompanying slides will be available at https://ir.tyson.com. A telephone replay will also be available until December 12, 2024, toll free at 1-877-344-7529, international toll 1-412-317-0088 or Canada toll free 855-669-9658. The replay access code is 1806944. Financial information, such as this news release, as well as other supplemental data, can be accessed from the Company's web site at https://ir.tyson.com.
Forward-Looking Statements
Certain information in this release constitutes forward-looking statements as contemplated by the Private Securities Litigation Reform Act of 1995. Such forward-looking statements include, but are not limited to, current views and estimates of our outlook for fiscal 2025, other future economic circumstances, industry conditions in domestic and international markets, our performance and financial results (e.g., debt levels, return on invested capital, value-added product growth, capital expenditures, tax rates, access to foreign markets and dividend policy). These forward-looking statements are subject to a number of factors and uncertainties that could cause our actual results and experiences to differ materially from anticipated results and expectations expressed in such forward-looking statements. We wish to caution readers not to place undue reliance on any forward-looking statements, which are expressly qualified in their entirety by this cautionary statement and speak only as of the date made. We undertake no obligation to update any forward-looking statements, whether as a result of new information, future events or otherwise. Among the factors that may cause actual results and experiences to differ from anticipated results and expectations expressed in such forward-looking statements are the following: (i) global pandemics have had, and may in the future have, an adverse impact on our business and operations; (ii) the effectiveness of financial excellence programs; (iii) access to foreign markets together with foreign economic conditions, including currency fluctuations, import/export restrictions and foreign politics; (iv) cyber attacks, other cyber incidents, security breaches or other disruptions of our information technology systems; (v) risks associated with our failure to consummate favorable acquisition transactions or integrate certain acquisitions’ operations; (vi) the Tyson Limited Partnership’s ability to exercise significant control over the Company; (vii) fluctuations in the cost and availability of inputs and raw materials, such as live cattle, live swine, feed grains (including corn and soybean meal) and energy; (viii) market conditions for finished products, including competition from other global and domestic food processors, supply and pricing of competing products and alternative proteins and demand for alternative proteins; (ix) outbreak of a livestock disease (such as African swine fever (ASF), avian influenza (AI) or bovine spongiform encephalopathy (BSE)), which could have an adverse effect on livestock we own, the availability of livestock we purchase, consumer perception of certain protein products or our ability to conduct our operations; (x) changes in consumer preference and diets and our ability to identify and react to consumer trends; (xi) effectiveness of advertising and marketing programs; (xii) significant marketing plan changes by large customers or loss of one or more large customers; (xiii) our ability to leverage brand value propositions; (xiv) changes in availability and relative costs of labor and contract farmers and our ability to maintain good relationships with team members, labor unions, contract farmers and independent producers providing us livestock; (xv) issues related to food safety, including costs resulting from product recalls, regulatory compliance and any related claims or litigation; (xvi) compliance with and changes to regulations and laws (both domestic and foreign), including changes in accounting standards, tax laws, environmental laws, agricultural laws and occupational, health and safety laws; (xvii) the effect of climate change and any legal or regulatory response thereto; (xviii) adverse results from litigation; (xix) risks associated with leverage, including cost increases due to rising interest rates or changes in debt ratings or outlook; (xx) impairment in the carrying value of our goodwill or indefinite life intangible assets; (xxi) our participation in a multiemployer pension plan; (xxii) volatility in capital markets or interest rates; (xxiii) risks associated with our commodity purchasing activities; (xxiv) the effect of, or changes in, general economic conditions; (xxv) impacts on our operations caused by factors and forces beyond our control, such as natural disasters, fire, bioterrorism, pandemics, armed conflicts or extreme weather; (xxvi) failure to maximize or assert our intellectual property rights; (xxvii) effects related to changes in tax rates, valuation of deferred tax assets and liabilities, or tax laws and their interpretation; and (xxviii) the other risks and uncertainties detailed from time to time in our filings with the Securities and Exchange Commission, including those included under the captions "Risk Factors" and "Management's Discussion and Analysis of Financial Condition and Results of Operations" in our most recent Annual Report on Form 10-K and Quarterly reports on Form 10-Q.
Media Contact: Laura Burns, 479-713-9890
Investor Contact: Sean Cornett, 479-466-0401
Source: Tyson Foods, Inc.
Category: IR, Newsroom
12
Q4 Fiscal 2024 Supplemental Information November 12, 2024


Certain information in this presentation constitutes forward-looking statements as contemplated by the Private Securities Litigation Reform Act of 1995. Such forward-looking statements include, but are not limited to, current views and estimates of our outlook for fiscal 2025, other future economic circumstances, industry conditions in domestic and international markets, our performance and financial results (e.g., debt levels, return on invested capital, value-added product growth, capital expenditures, tax rates, access to foreign markets and dividend policy). These forward-looking statements are subject to a number of factors and uncertainties that could cause our actual results and experiences to differ materially from anticipated results and expectations expressed in such forward-looking statements. We wish to caution readers not to place undue reliance on any forward-looking statements, which are expressly qualified in their entirety by this cautionary statement and speak only as of the date made. We undertake no obligation to update any forward-looking statements, whether as a result of new information, future events or otherwise. Among the factors that may cause actual results and experiences to differ from anticipated results and expectations expressed in such forward-looking statements are the following: (i) global pandemics have had, and may in the future have, an adverse impact on our business and operations; (ii) the effectiveness of restructuring or financial excellence programs; (iii) access to foreign markets together with foreign economic conditions, including currency fluctuations, import/export restrictions and foreign politics; (iv) cyber attacks, other cyber incidents, security breaches or other disruptions of our information technology systems; (v) risks associated with our failure to consummate favorable acquisition transactions or integrate certain acquisitions' operations; (vi) the Tyson Limited Partnership’s ability to exercise significant control over the Company; (vii) fluctuations in the cost and availability of inputs and raw materials, such as live cattle, live swine, feed grains (including corn and soybean meal) and energy; (viii) market conditions for finished products, including competition from other global and domestic food processors, supply and pricing of competing products and alternative proteins and demand for alternative proteins; (ix) outbreak of a livestock disease (such as African swine fever (ASF), avian influenza (AI) or bovine spongiform encephalopathy (BSE)), which could have an adverse effect on livestock we own, the availability of livestock we purchase, consumer perception of certain protein products or our ability to conduct our operations; (x) changes in consumer preference and diets and our ability to identify and react to consumer trends; (xi) effectiveness of advertising and marketing programs; (xii) significant marketing plan changes by large customers or loss of one or more large customers; (xiii) our ability to leverage brand value propositions; (xiv) changes in availability and relative costs of labor and contract farmers and our ability to maintain good relationships with team members, labor unions, contract farmers and independent producers providing us livestock; (xv) issues related to food safety, including costs resulting from product recalls, regulatory compliance and any related claims or litigation; (xvi) compliance with and changes to regulations and laws (both domestic and foreign), including changes in accounting standards, tax laws, environmental laws, agricultural laws and occupational, health and safety laws; (xvii) the effect of climate change and any legal or regulatory response thereto; (xviii) adverse results from litigation; (xix) risks associated with leverage, including cost increases due to rising interest rates or changes in debt ratings or outlook; (xx) impairment in the carrying value of our goodwill or indefinite life intangible assets; (xxi) our participation in a multiemployer pension plan; (xxii) volatility in capital markets or interest rates; (xxiii) risks associated with our commodity purchasing activities; (xxiv) the effect of, or changes in, general economic conditions; (xxv) impacts on our operations caused by factors and forces beyond our control, such as natural disasters, fire, bioterrorism, pandemics, armed conflicts or extreme weather; (xxvi) failure to maximize or assert our intellectual property rights; (xxvii) effects related to changes in tax rates, valuation of deferred tax assets and liabilities, or tax laws and their interpretation; and (xxviii) the other risks and uncertainties detailed from time to time in our filings with the Securities and Exchange Commission, including those included under the captions “Risk Factors” and “Management's Discussion and Analysis of Financial Condition and Results of Operations” in our most recent Annual Report on Form 10-K and Quarterly reports on Form 10-Q. This presentation contains the financial measures “EBITDA,” “Adjusted EBITDA,” “Adjusted EPS”, “Adjusted Operating Income”, “Adjusted Operating Margin” and “Free Cash Flow” which are not calculated in accordance with U.S. GAAP. A reconciliation of non-GAAP financial measures to the most directly comparable GAAP financial measure has been provided in the Appendix. Non-GAAP financial measures should be considered in addition to, but not as a substitute for, the Company's reported GAAP results. Forward-Looking Statements Non-GAAP Financial Measures


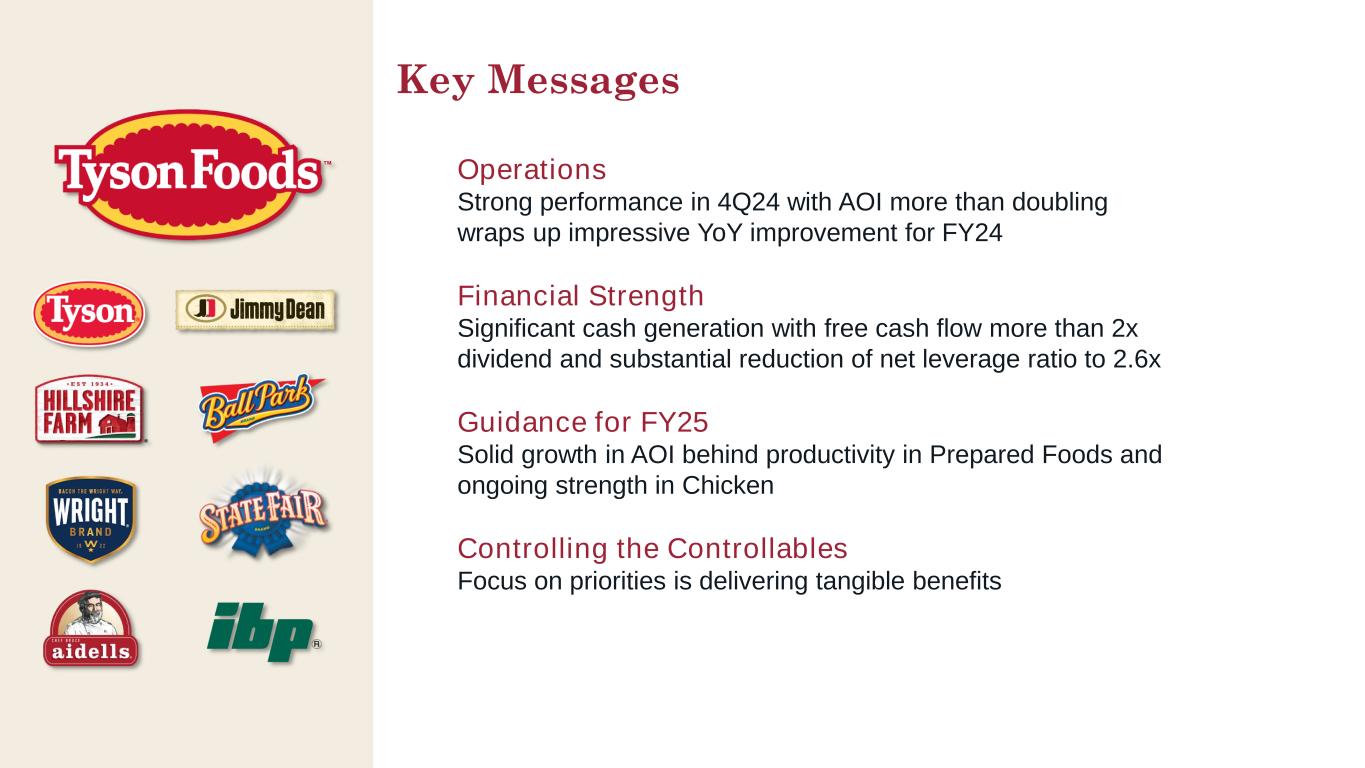
Key Messages Operations Strong performance in 4Q24 with AOI more than doubling wraps up impressive YoY improvement for FY24 Financial Strength Significant cash generation with free cash flow more than 2x dividend and substantial reduction of net leverage ratio to 2.6x Guidance for FY25 Solid growth in AOI behind productivity in Prepared Foods and ongoing strength in Chicken Controlling the Controllables Focus on priorities is delivering tangible benefits


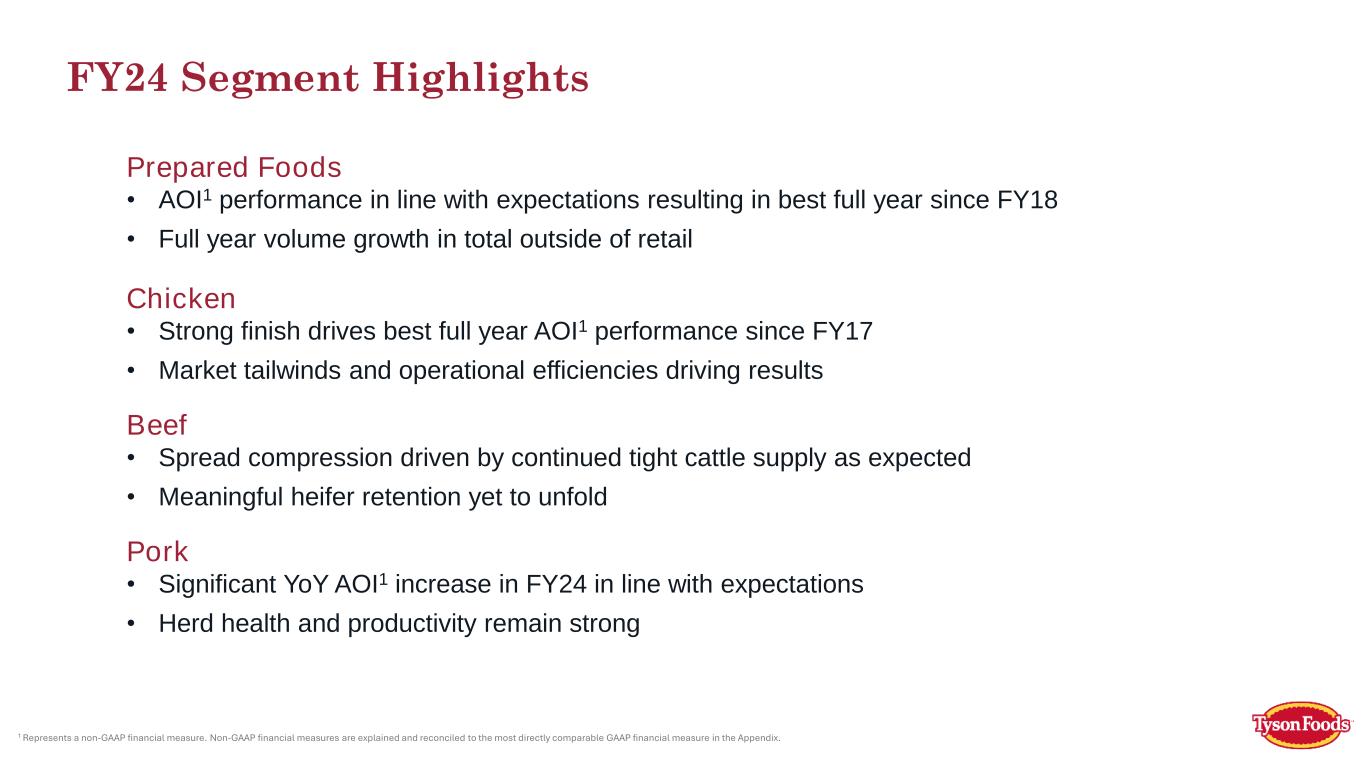
Prepared Foods • AOI1 performance in line with expectations resulting in best full year since FY18 • Full year volume growth in total outside of retail FY24 Segment Highlights 1 Represents a non-GAAP financial measure. Non-GAAP financial measures are explained and reconciled to the most directly comparable GAAP financial measure in the Appendix. Beef • Spread compression driven by continued tight cattle supply as expected • Meaningful heifer retention yet to unfold Pork • Significant YoY AOI1 increase in FY24 in line with expectations • Herd health and productivity remain strong Chicken • Strong finish drives best full year AOI1 performance since FY17 • Market tailwinds and operational efficiencies driving results


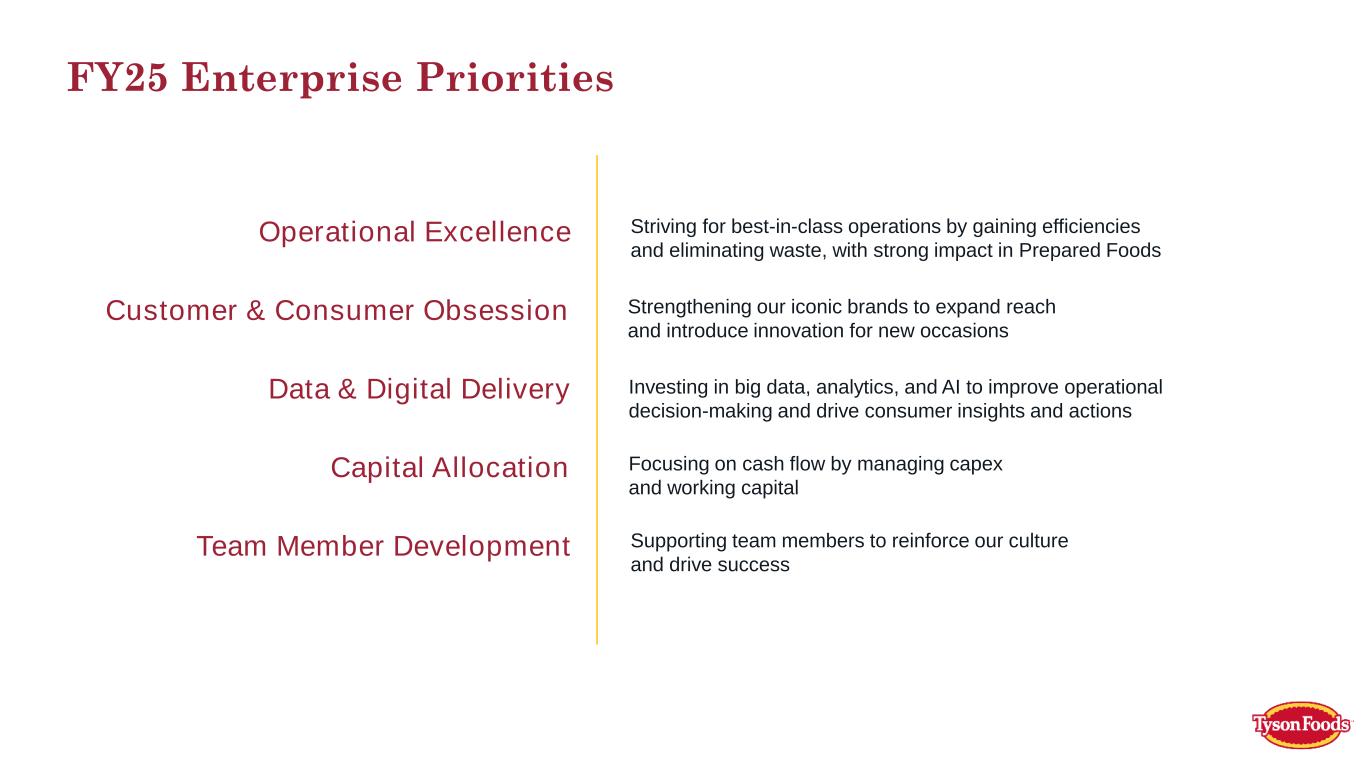
FY25 Enterprise Priorities Strengthening our iconic brands to expand reach and introduce innovation for new occasions Investing in big data, analytics, and AI to improve operational decision-making and drive consumer insights and actions Focusing on cash flow by managing capex and working capital Supporting team members to reinforce our culture and drive success Striving for best-in-class operations by gaining efficiencies and eliminating waste, with strong impact in Prepared Foods Team Member Development Customer & Consumer Obsession Data & Digital Delivery Capital Allocation Operational Excellence


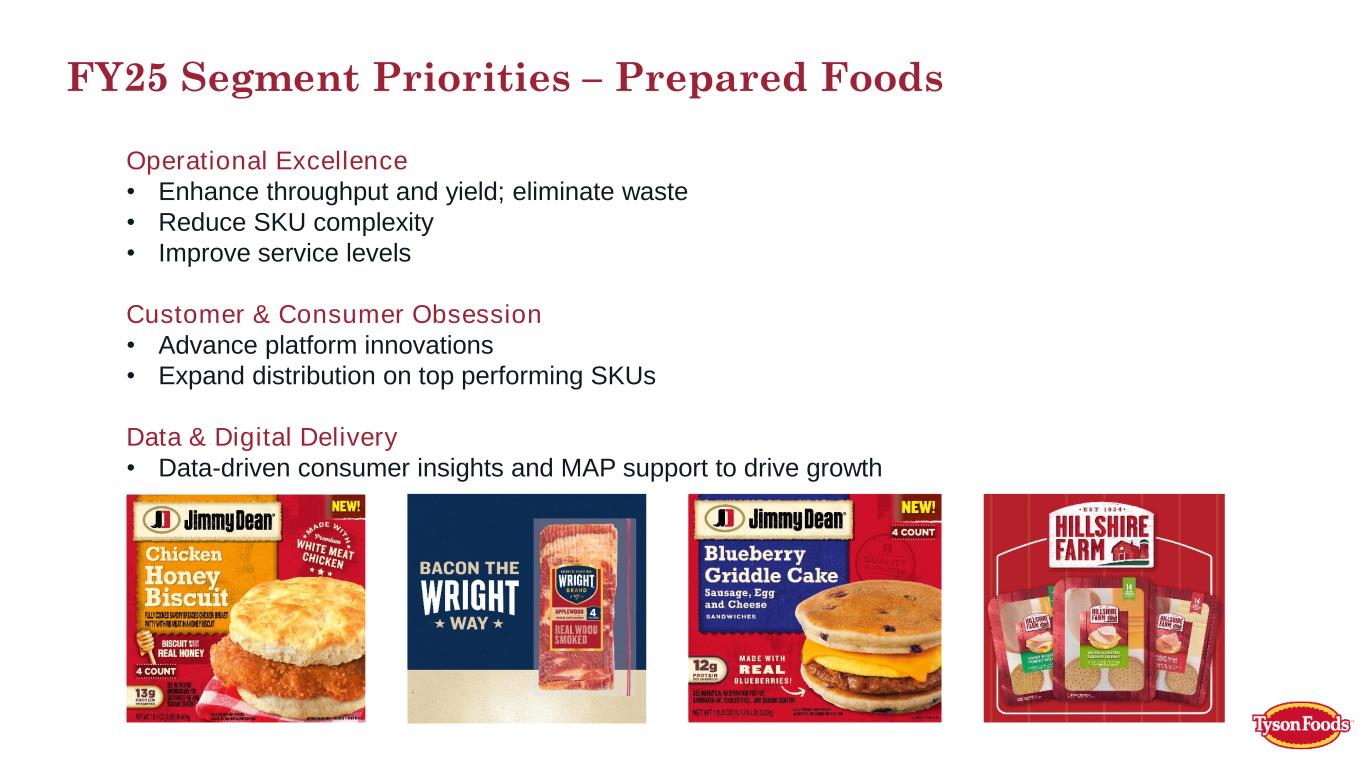
FY25 Segment Priorities – Prepared Foods Operational Excellence • Enhance throughput and yield; eliminate waste • Reduce SKU complexity • Improve service levels Customer & Consumer Obsession • Advance platform innovations • Expand distribution on top performing SKUs Data & Digital Delivery • Data-driven consumer insights and MAP support to drive growth


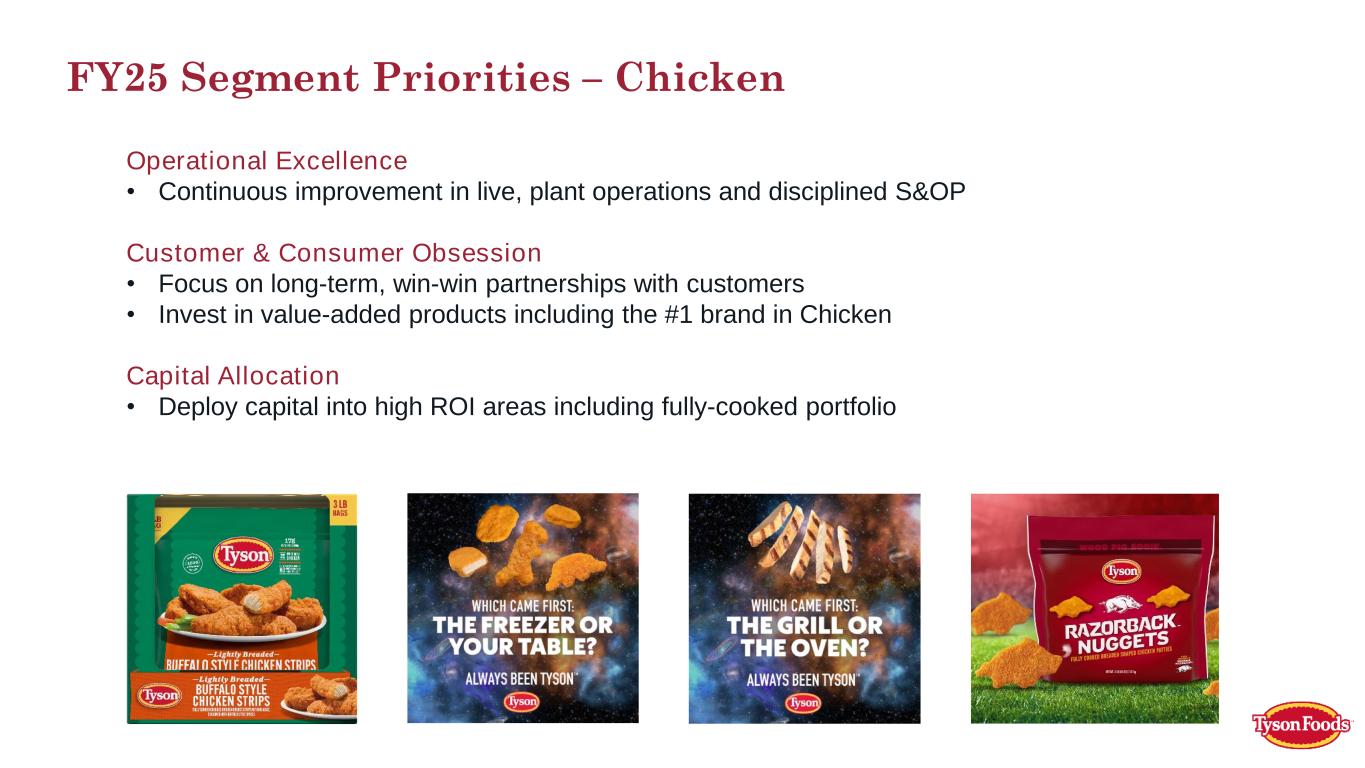
FY25 Segment Priorities – Chicken Operational Excellence • Continuous improvement in live, plant operations and disciplined S&OP Customer & Consumer Obsession • Focus on long-term, win-win partnerships with customers • Invest in value-added products including the #1 brand in Chicken Capital Allocation • Deploy capital into high ROI areas including fully-cooked portfolio


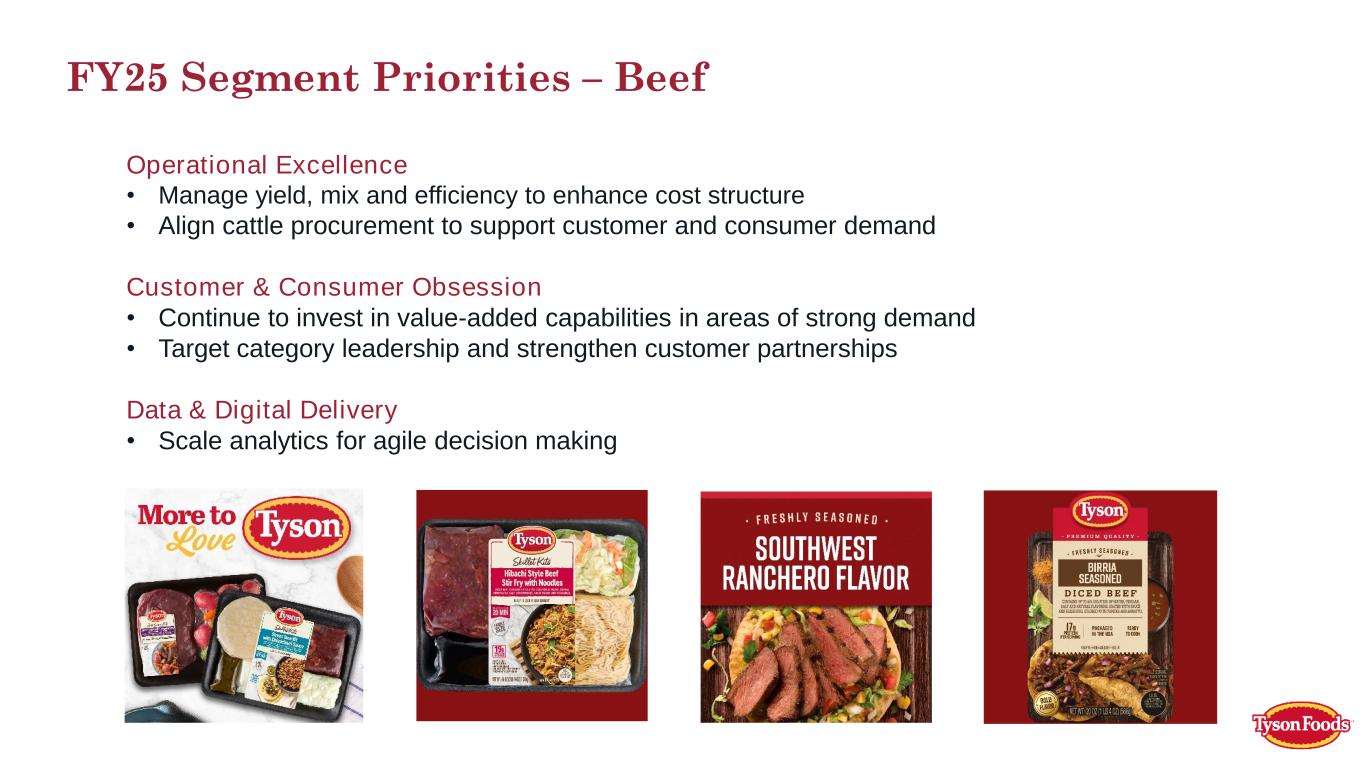
FY25 Segment Priorities – Beef Operational Excellence • Manage yield, mix and efficiency to enhance cost structure • Align cattle procurement to support customer and consumer demand Customer & Consumer Obsession • Continue to invest in value-added capabilities in areas of strong demand • Target category leadership and strengthen customer partnerships Data & Digital Delivery • Scale analytics for agile decision making


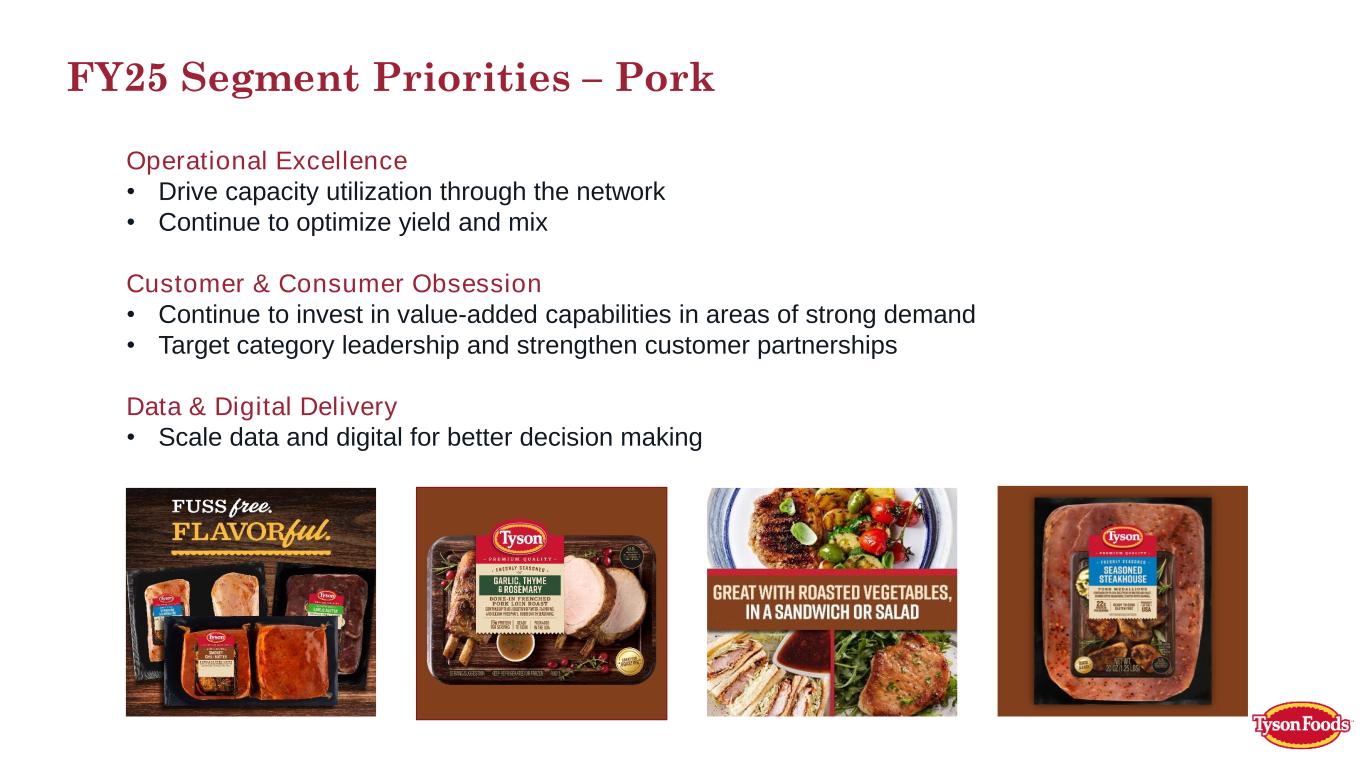
FY25 Segment Priorities – Pork Operational Excellence • Drive capacity utilization through the network • Continue to optimize yield and mix Customer & Consumer Obsession • Continue to invest in value-added capabilities in areas of strong demand • Target category leadership and strengthen customer partnerships Data & Digital Delivery • Scale data and digital for better decision making


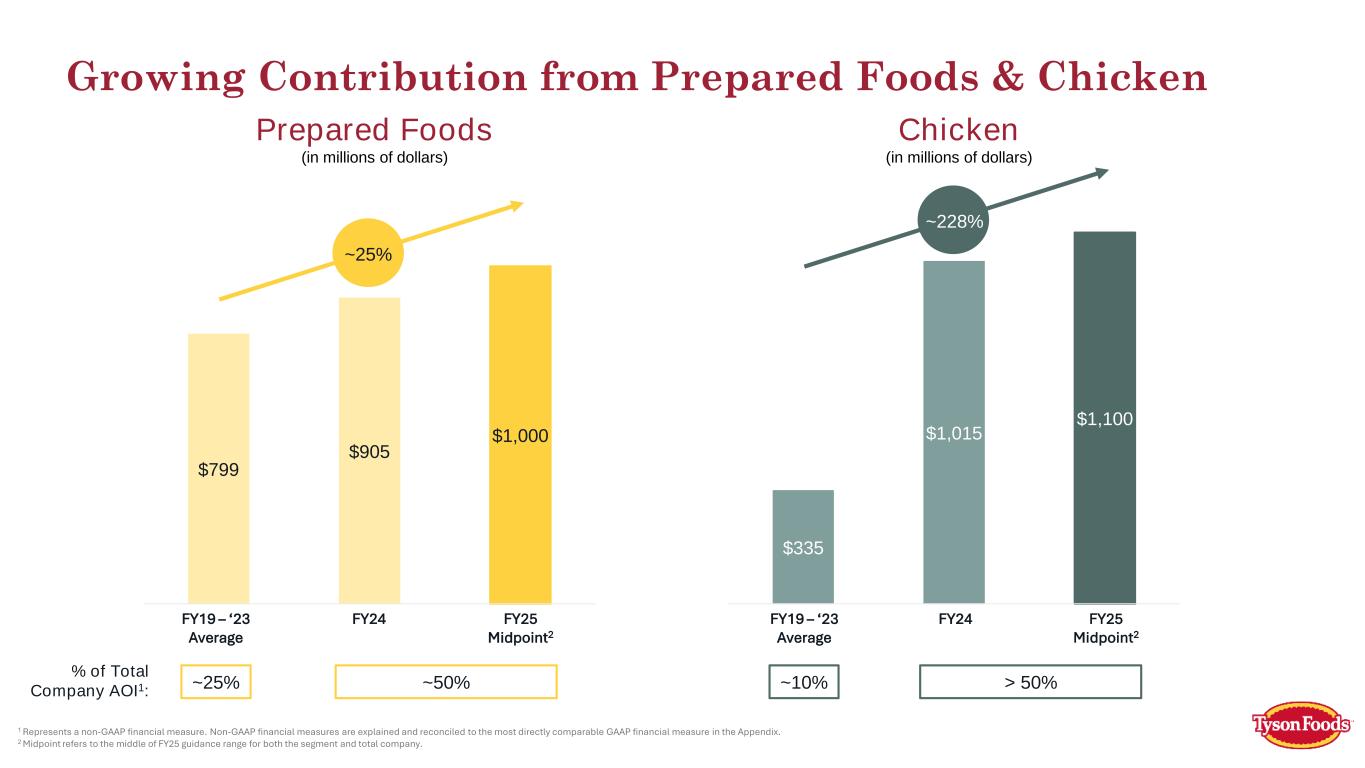
$799 $905 $1,000 1 Represents a non-GAAP financial measure. Non-GAAP financial measures are explained and reconciled to the most directly comparable GAAP financial measure in the Appendix. 2 Midpoint refers to the middle of FY25 guidance range for both the segment and total company. Growing Contribution from Prepared Foods & Chicken FY19 – ‘23 Average FY24 ~25% FY25 Midpoint2 ~50% % of Total Company AOI1: ~25% $335 $1,015 $1,100 ~10% > 50% FY19 – ‘23 Average FY24 FY25 Midpoint2 ~228% Prepared Foods (in millions of dollars) Chicken (in millions of dollars)


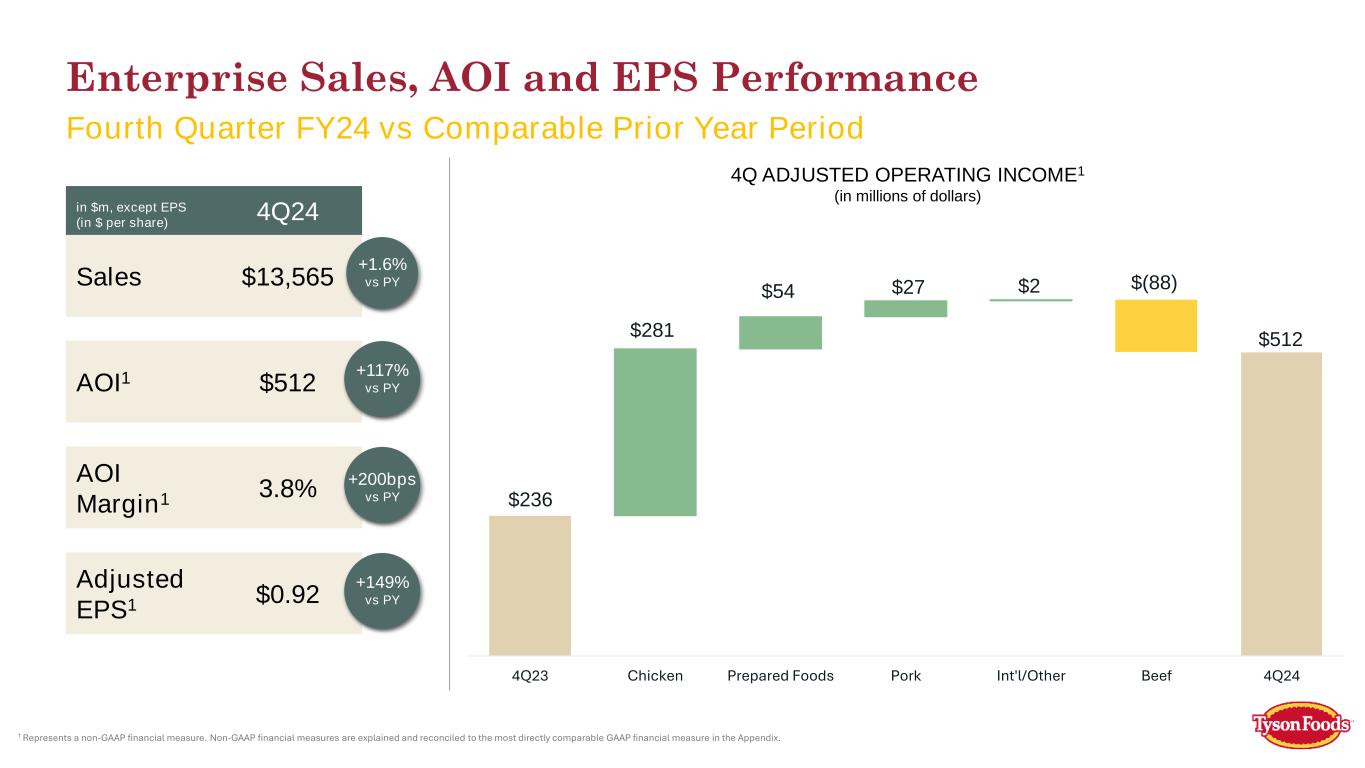
4Q ADJUSTED OPERATING INCOME1 (in millions of dollars) $236 $512 $2 $281 $54 $27 $(88) 4Q23 Chicken Prepared Foods Pork Int'l/Other Beef 4Q24 1 Represents a non-GAAP financial measure. Non-GAAP financial measures are explained and reconciled to the most directly comparable GAAP financial measure in the Appendix. in $m, except EPS (in $ per share) 4Q24 Sales $13,565 AOI1 $512 AOI Margin1 3.8% Adjusted EPS1 $0.92 +1.6% vs PY +117% vs PY +149% vs PY +200bps vs PY Enterprise Sales, AOI and EPS Performance Fourth Quarter FY24 vs Comparable Prior Year Period


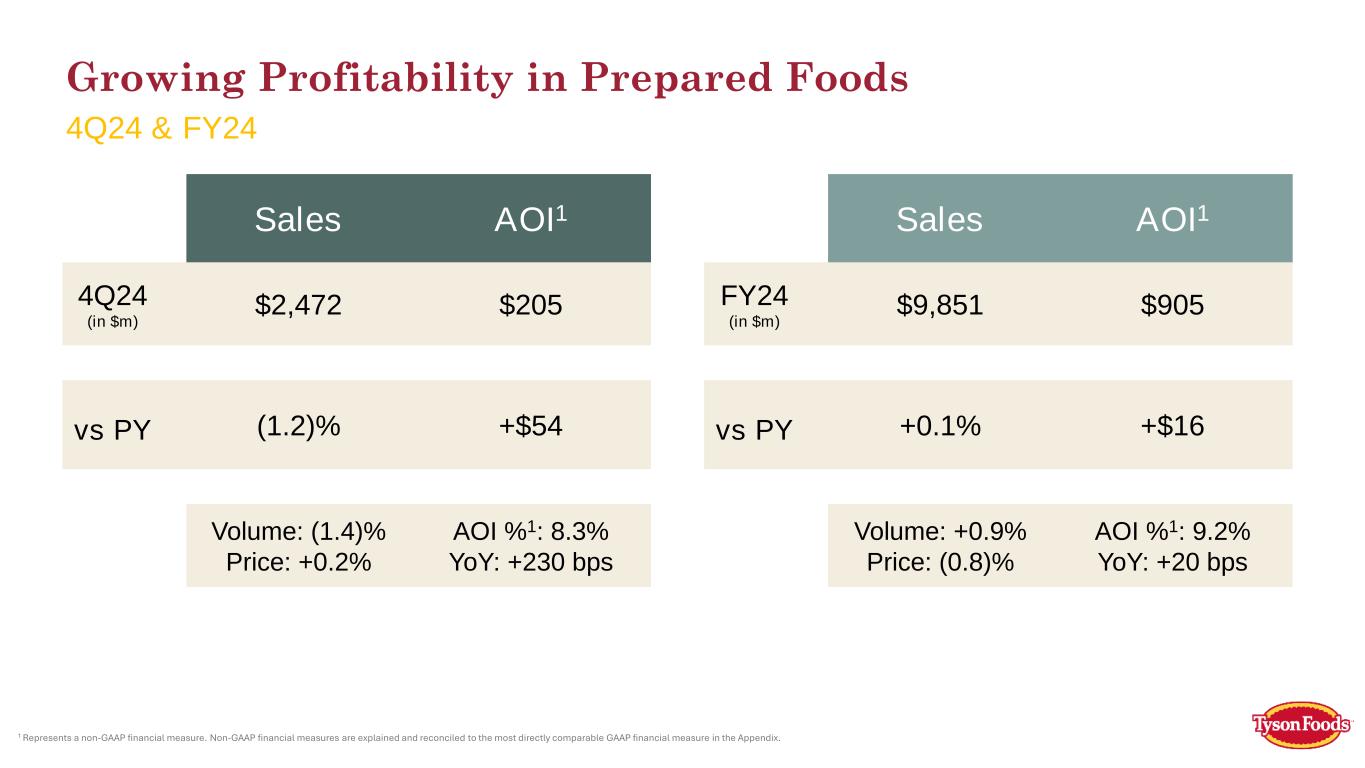
1 Represents a non-GAAP financial measure. Non-GAAP financial measures are explained and reconciled to the most directly comparable GAAP financial measure in the Appendix. Sales AOI1 FY24 (in $m) $9,851 $905 vs PY +0.1% +$16 Volume: +0.9% Price: (0.8)% AOI %1: 9.2% YoY: +20 bps Sales AOI1 4Q24 (in $m) $2,472 $205 vs PY (1.2)% +$54 Volume: (1.4)% Price: +0.2% AOI %1: 8.3% YoY: +230 bps Growing Profitability in Prepared Foods 4Q24 & FY24


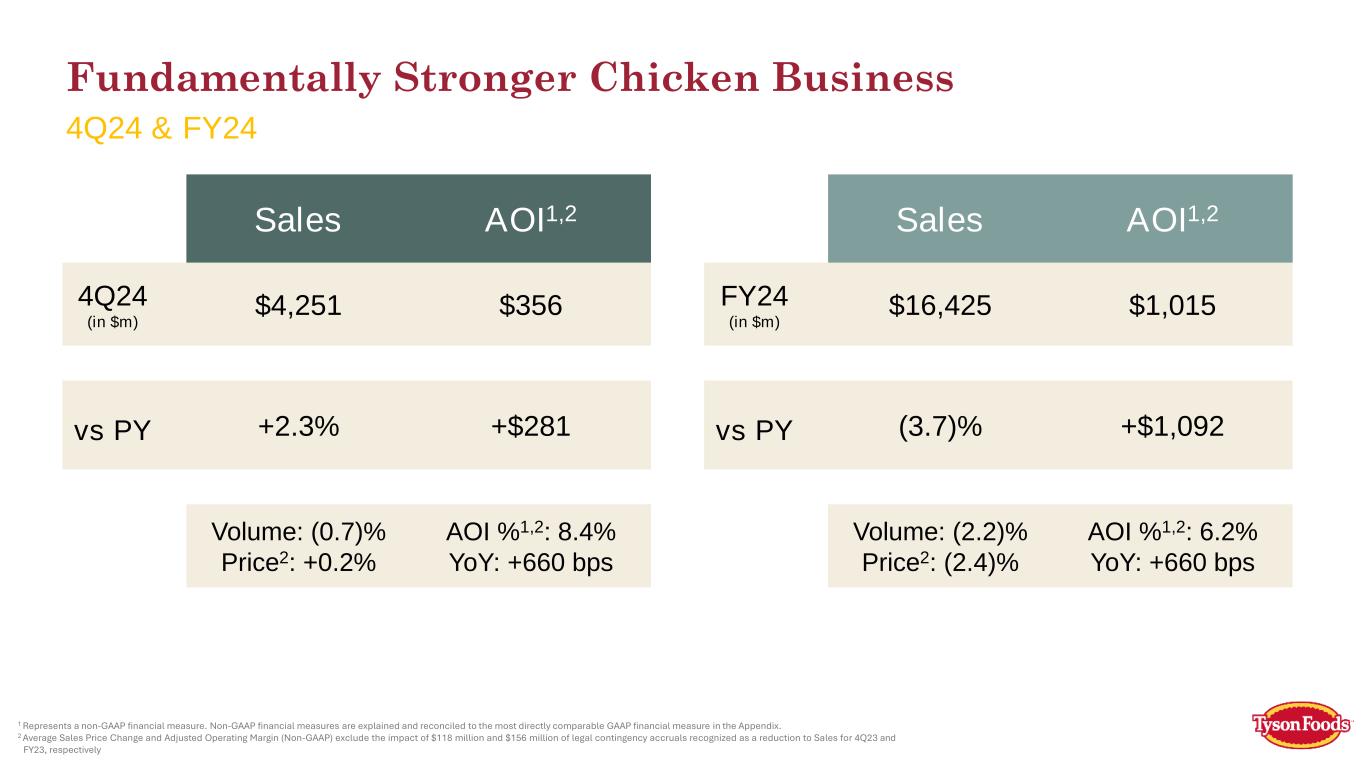
1 Represents a non-GAAP financial measure. Non-GAAP financial measures are explained and reconciled to the most directly comparable GAAP financial measure in the Appendix. 2 Average Sales Price Change and Adjusted Operating Margin (Non-GAAP) exclude the impact of $118 million and $156 million of legal contingency accruals recognized as a reduction to Sales for 4Q23 and FY23, respectively Sales AOI1,2 FY24 (in $m) $16,425 $1,015 vs PY (3.7)% +$1,092 Volume: (2.2)% Price2: (2.4)% AOI %1,2: 6.2% YoY: +660 bps Sales AOI1,2 4Q24 (in $m) $4,251 $356 vs PY +2.3% +$281 Volume: (0.7)% Price2: +0.2% AOI %1,2: 8.4% YoY: +660 bps Fundamentally Stronger Chicken Business 4Q24 & FY24


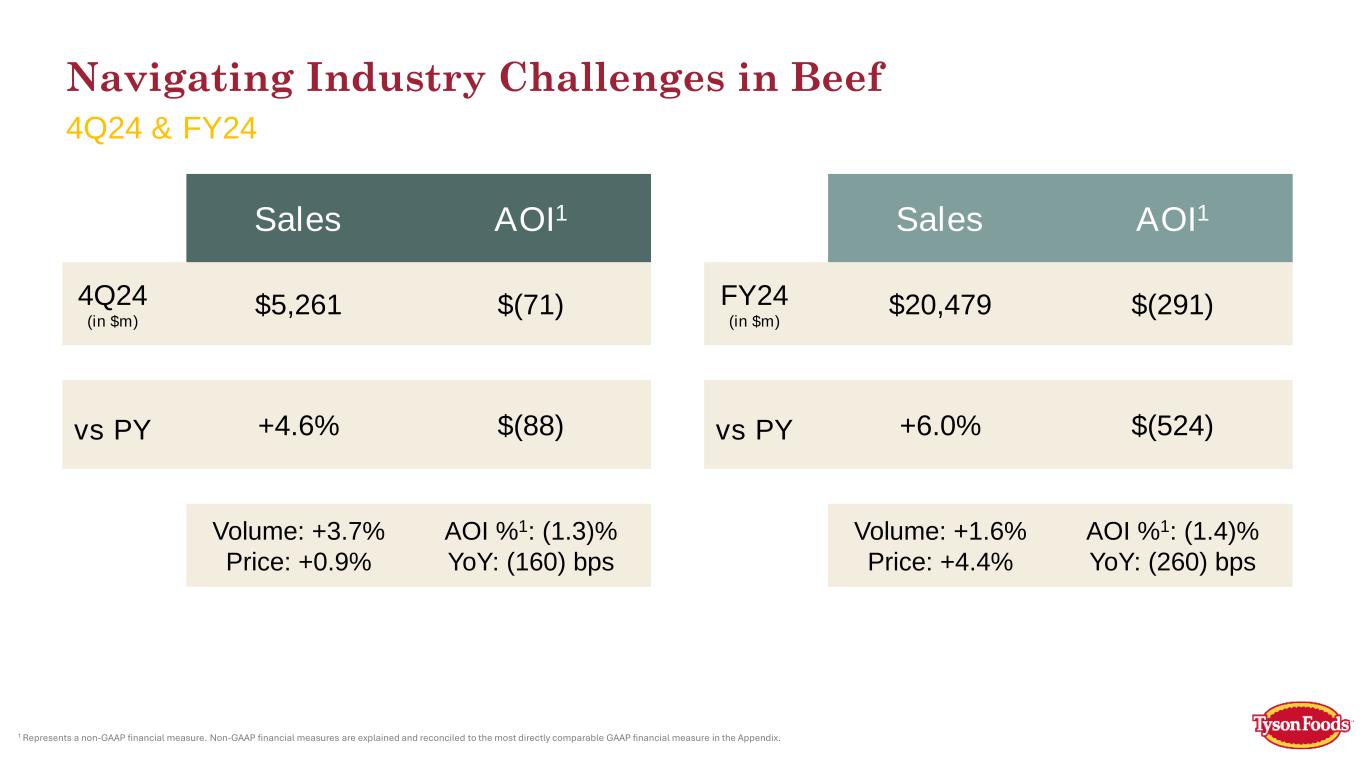
1 Represents a non-GAAP financial measure. Non-GAAP financial measures are explained and reconciled to the most directly comparable GAAP financial measure in the Appendix. Sales AOI1 FY24 (in $m) $20,479 $(291) vs PY +6.0% $(524) Volume: +1.6% Price: +4.4% AOI %1: (1.4)% YoY: (260) bps Sales AOI1 4Q24 (in $m) $5,261 $(71) vs PY +4.6% $(88) Volume: +3.7% Price: +0.9% AOI %1: (1.3)% YoY: (160) bps Navigating Industry Challenges in Beef 4Q24 & FY24


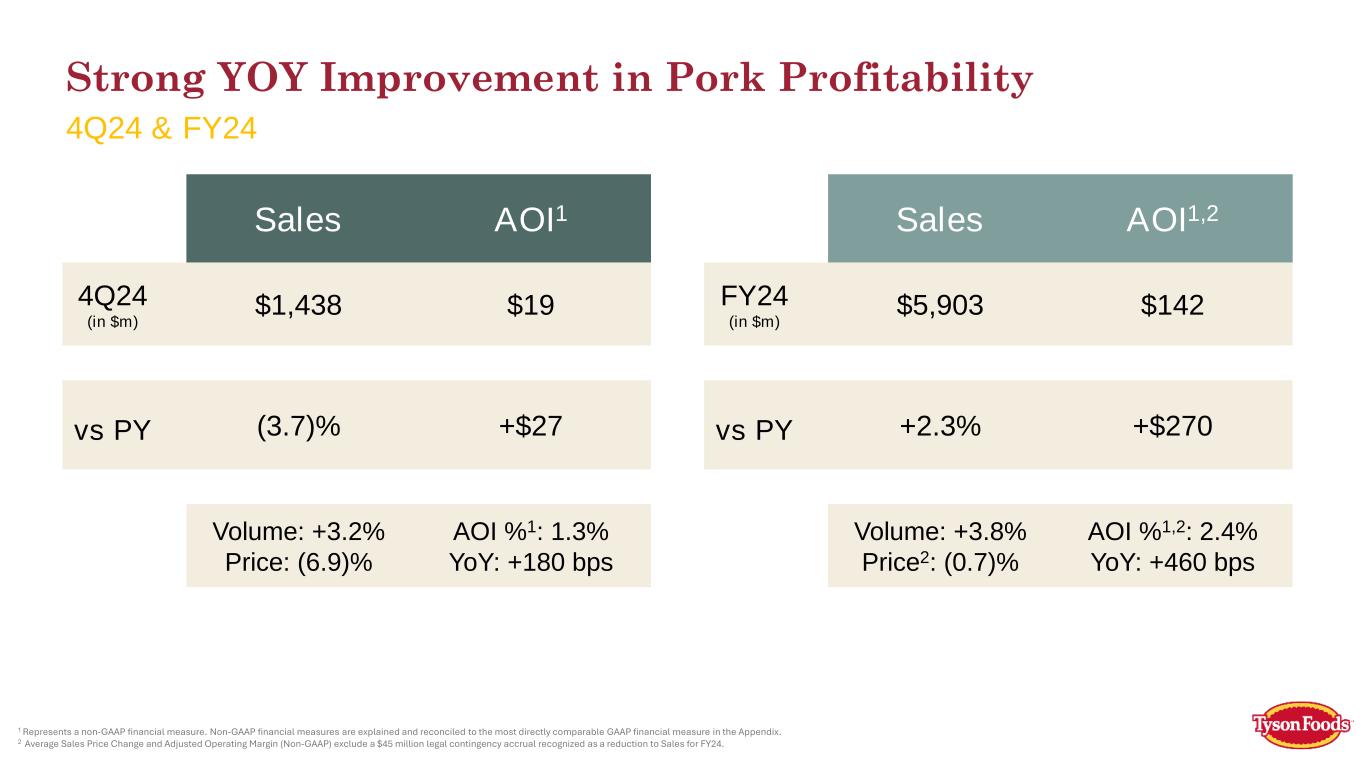
1 Represents a non-GAAP financial measure. Non-GAAP financial measures are explained and reconciled to the most directly comparable GAAP financial measure in the Appendix. 2 Average Sales Price Change and Adjusted Operating Margin (Non-GAAP) exclude a $45 million legal contingency accrual recognized as a reduction to Sales for FY24. Sales AOI1,2 FY24 (in $m) $5,903 $142 vs PY +2.3% +$270 Volume: +3.8% Price2: (0.7)% AOI %1,2: 2.4% YoY: +460 bps Sales AOI1 4Q24 (in $m) $1,438 $19 vs PY (3.7)% +$27 Volume: +3.2% Price: (6.9)% AOI %1: 1.3% YoY: +180 bps Strong YOY Improvement in Pork Profitability 4Q24 & FY24


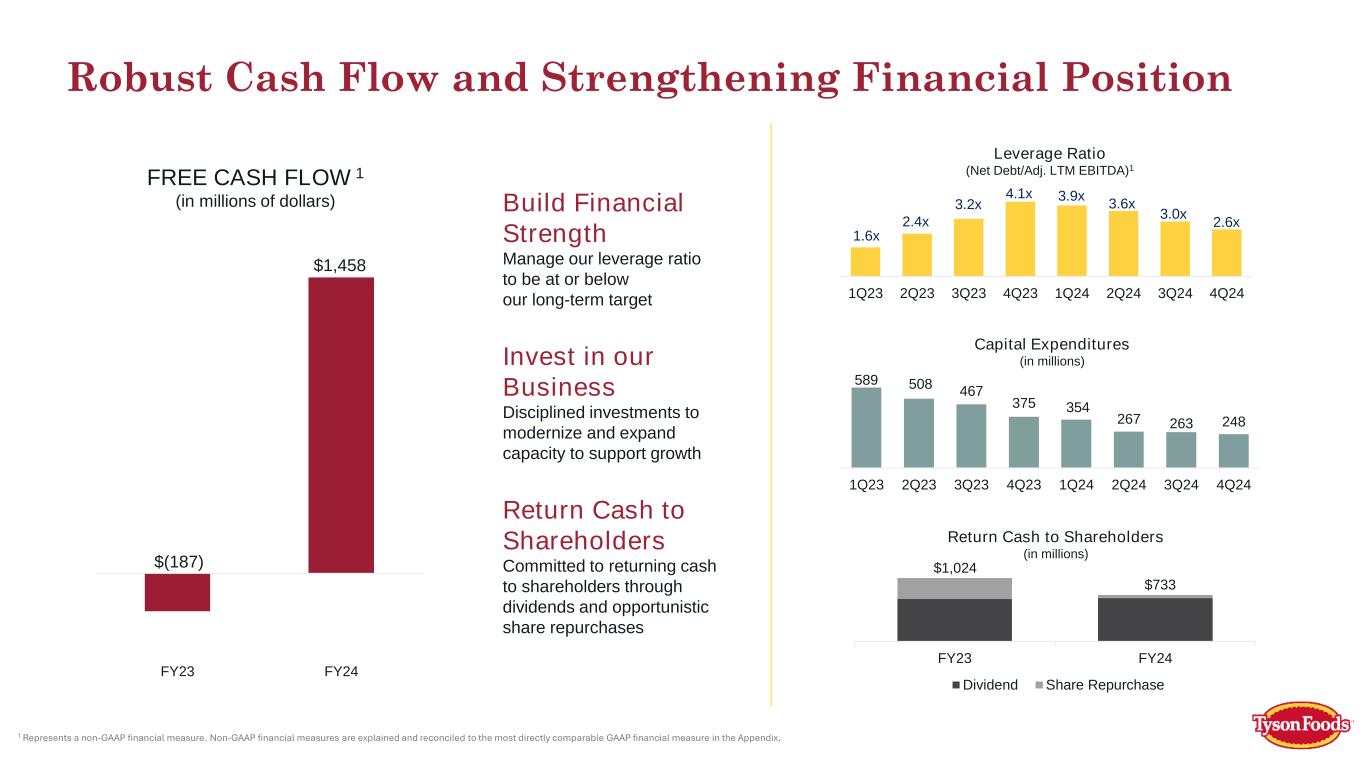
589 508 467 375 354 267 263 248 1Q23 2Q23 3Q23 4Q23 1Q24 2Q24 3Q24 4Q24 1.6x 2.4x 3.2x 4.1x 3.9x 3.6x 3.0x 2.6x 1Q23 2Q23 3Q23 4Q23 1Q24 2Q24 3Q24 4Q24 $(187) $1,458 FY23 FY24 $1,024 $733 FY23 FY24 Dividend Share Repurchase FREE CASH FLOW 1 (in millions of dollars) Leverage Ratio (Net Debt/Adj. LTM EBITDA)1 Capital Expenditures (in millions) Return Cash to Shareholders (in millions) 1 Represents a non-GAAP financial measure. Non-GAAP financial measures are explained and reconciled to the most directly comparable GAAP financial measure in the Appendix. Build Financial Strength Manage our leverage ratio to be at or below our long-term target Invest in our Business Disciplined investments to modernize and expand capacity to support growth Return Cash to Shareholders Committed to returning cash to shareholders through dividends and opportunistic share repurchases Robust Cash Flow and Strengthening Financial Position


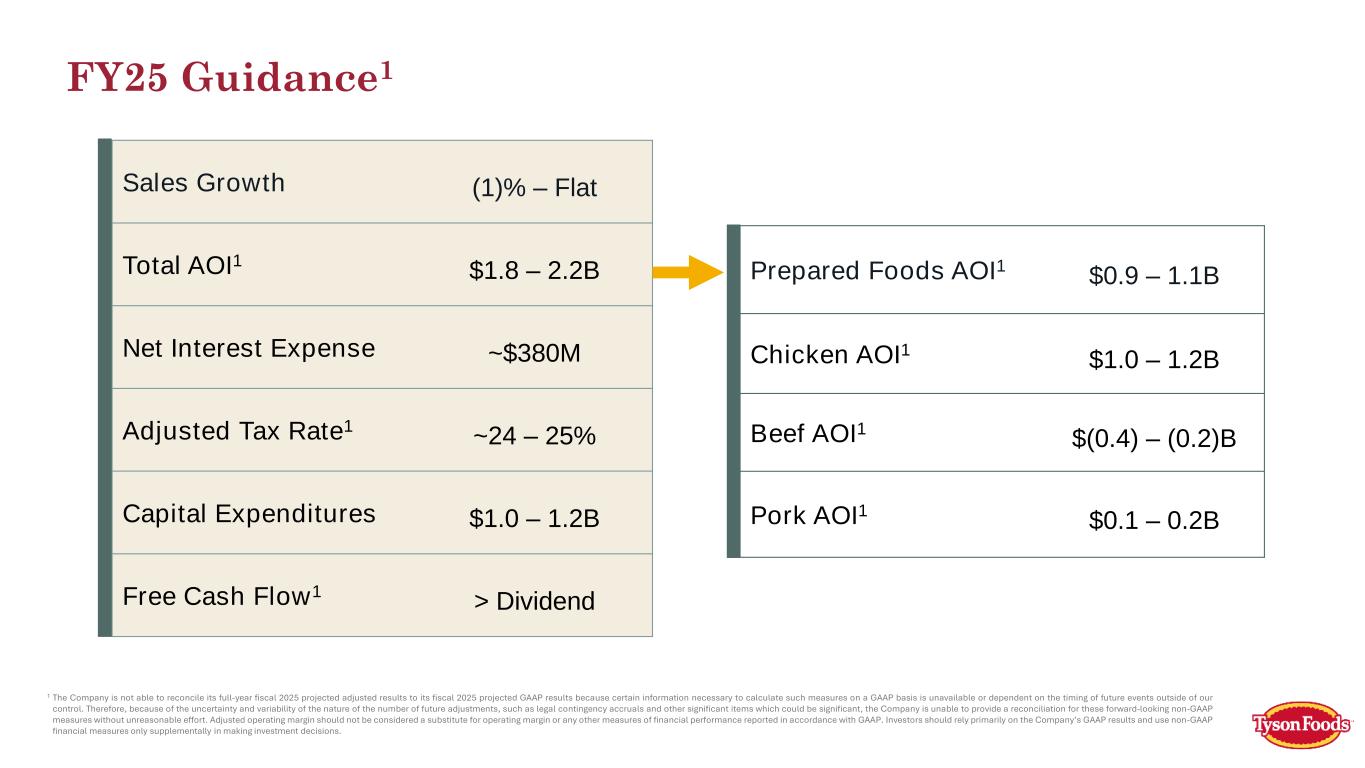
1 The Company is not able to reconcile its full-year fiscal 2025 projected adjusted results to its fiscal 2025 projected GAAP results because certain information necessary to calculate such measures on a GAAP basis is unavailable or dependent on the timing of future events outside of our control. Therefore, because of the uncertainty and variability of the nature of the number of future adjustments, such as legal contingency accruals and other significant items which could be significant, the Company is unable to provide a reconciliation for these forward-looking non-GAAP measures without unreasonable effort. Adjusted operating margin should not be considered a substitute for operating margin or any other measures of financial performance reported in accordance with GAAP. Investors should rely primarily on the Company’s GAAP results and use non-GAAP financial measures only supplementally in making investment decisions. Prepared Foods AOI1 $0.9 – 1.1B Chicken AOI1 $1.0 – 1.2B Beef AOI1 $(0.4) – (0.2)B Pork AOI1 $0.1 – 0.2B Sales Growth (1)% – Flat Total AOI1 $1.8 – 2.2B Net Interest Expense ~$380M Adjusted Tax Rate1 ~24 – 25% Capital Expenditures $1.0 – 1.2B Free Cash Flow1 > Dividend FY25 Guidance1


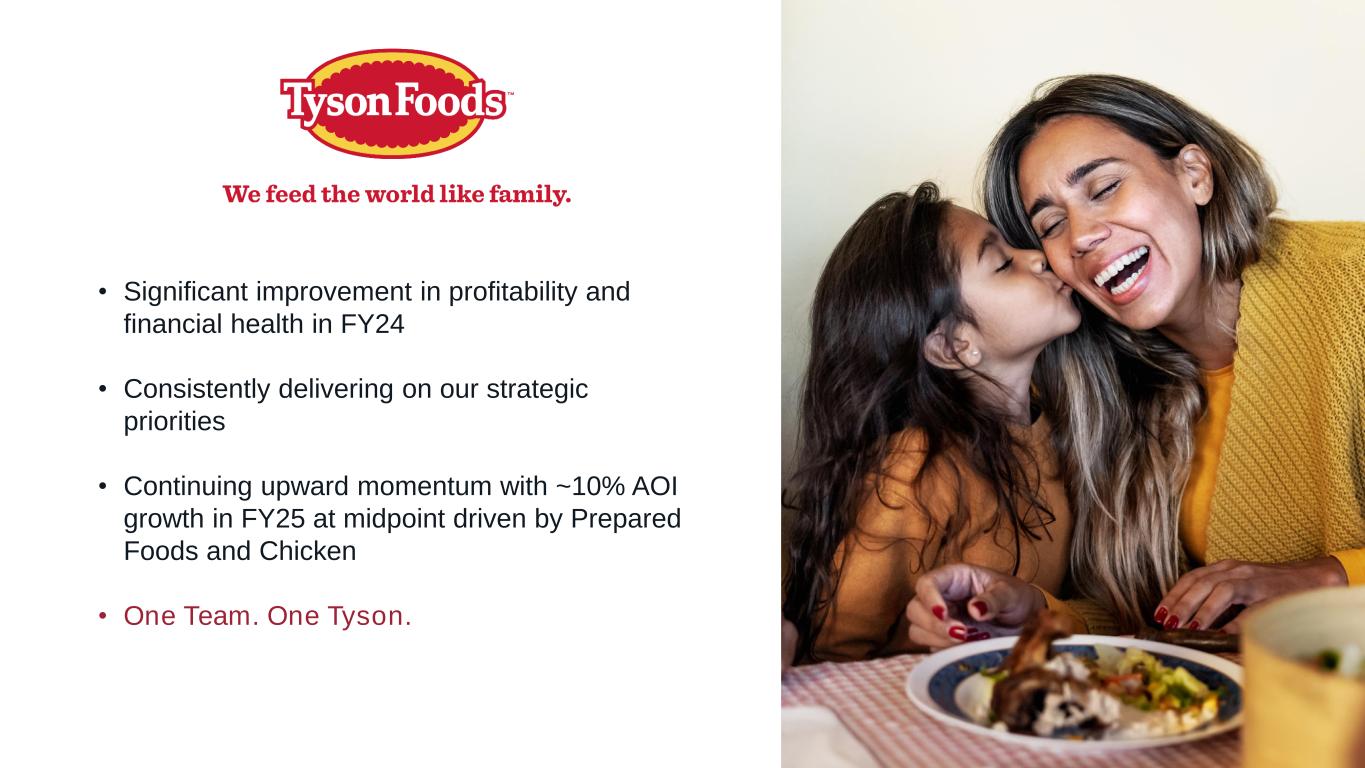
• Significant improvement in profitability and financial health in FY24 • Consistently delivering on our strategic priorities • Continuing upward momentum with ~10% AOI growth in FY25 at midpoint driven by Prepared Foods and Chicken • One Team. One Tyson.


Appendix


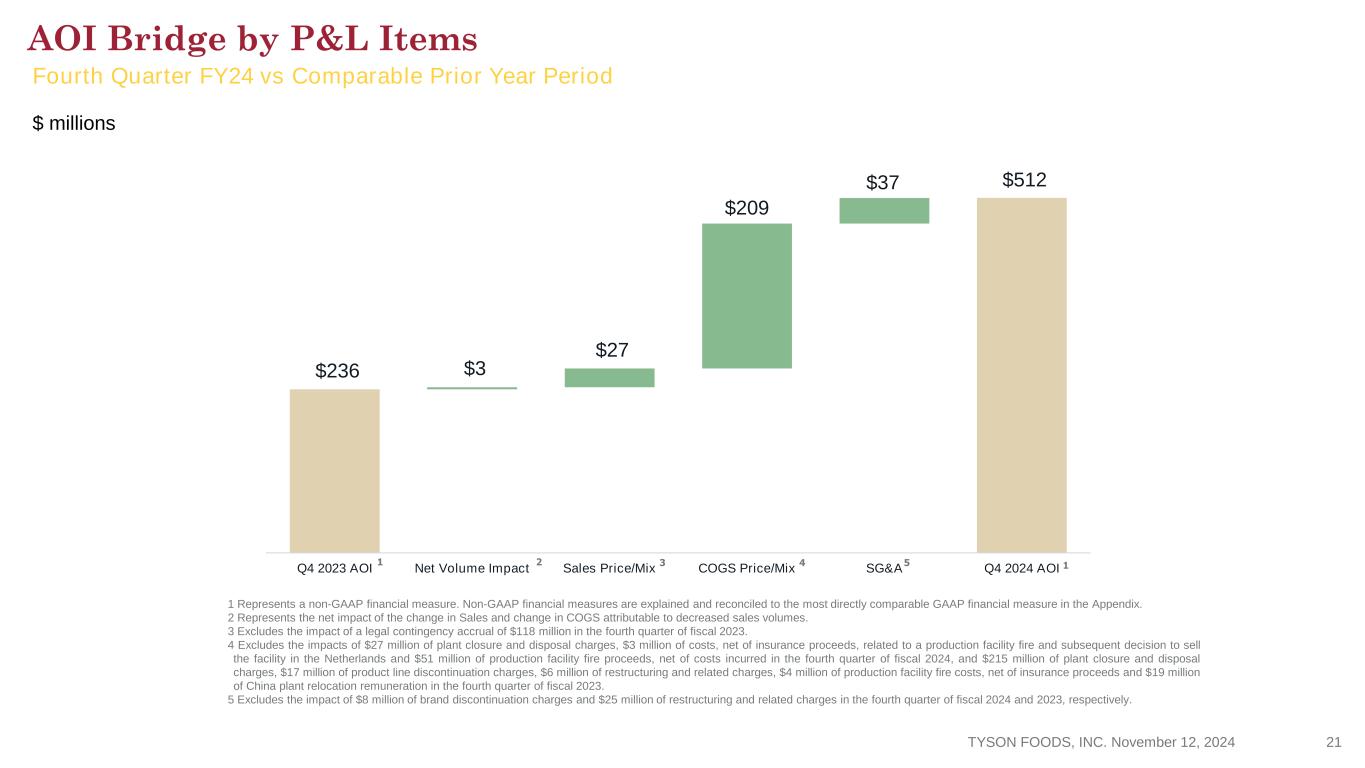
$ millions $236 $512 $3 $27 $209 $37 Q4 2023 AOI Net Volume Impact Sales Price/Mix COGS Price/Mix SG&A Q4 2024 AOI 1 2 4 5 TYSON FOODS, INC. November 12, 2024 21 AOI Bridge by P&L Items Fourth Quarter FY24 vs Comparable Prior Year Period 1 3 1 Represents a non-GAAP financial measure. Non-GAAP financial measures are explained and reconciled to the most directly comparable GAAP financial measure in the Appendix. 2 Represents the net impact of the change in Sales and change in COGS attributable to decreased sales volumes. 3 Excludes the impact of a legal contingency accrual of $118 million in the fourth quarter of fiscal 2023. 4 Excludes the impacts of $27 million of plant closure and disposal charges, $3 million of costs, net of insurance proceeds, related to a production facility fire and subsequent decision to sell the facility in the Netherlands and $51 million of production facility fire proceeds, net of costs incurred in the fourth quarter of fiscal 2024, and $215 million of plant closure and disposal charges, $17 million of product line discontinuation charges, $6 million of restructuring and related charges, $4 million of production facility fire costs, net of insurance proceeds and $19 million of China plant relocation remuneration in the fourth quarter of fiscal 2023. 5 Excludes the impact of $8 million of brand discontinuation charges and $25 million of restructuring and related charges in the fourth quarter of fiscal 2024 and 2023, respectively.


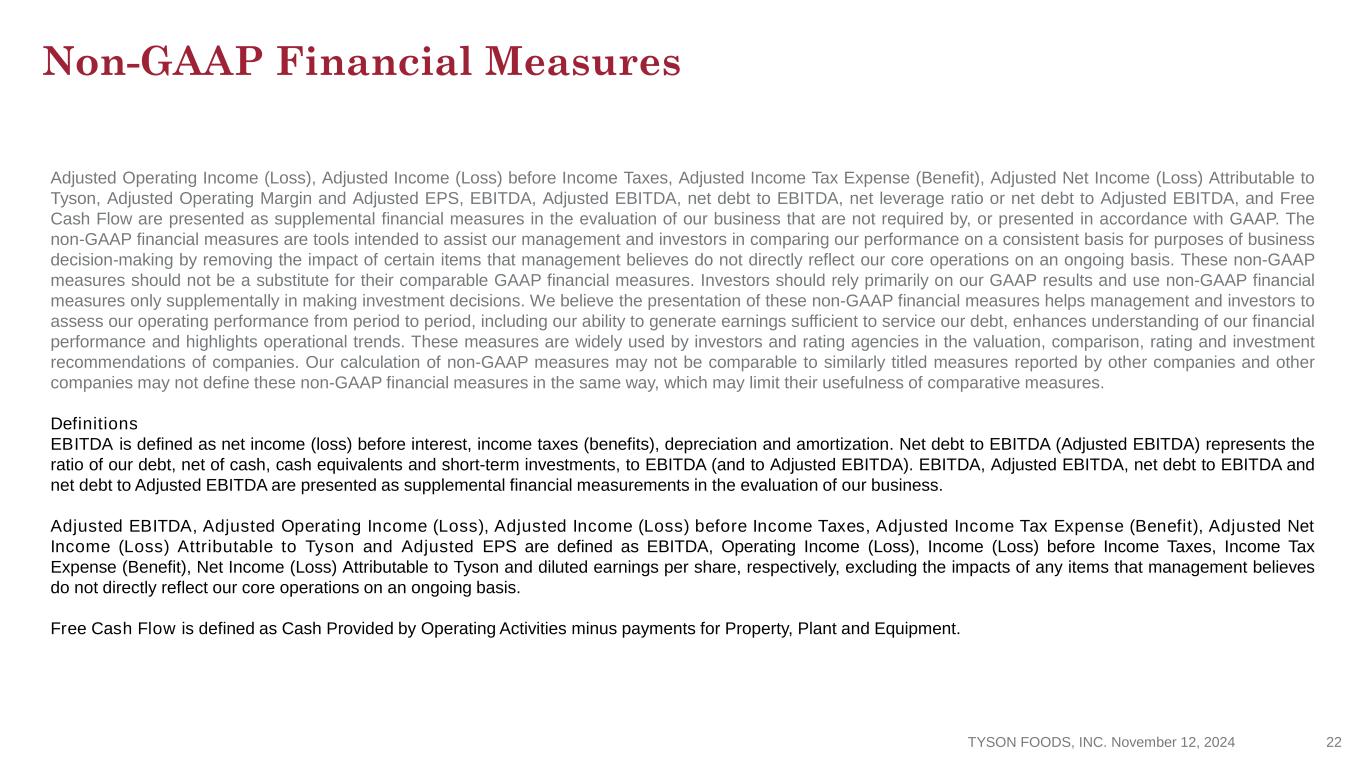
Adjusted Operating Income (Loss), Adjusted Income (Loss) before Income Taxes, Adjusted Income Tax Expense (Benefit), Adjusted Net Income (Loss) Attributable to Tyson, Adjusted Operating Margin and Adjusted EPS, EBITDA, Adjusted EBITDA, net debt to EBITDA, net leverage ratio or net debt to Adjusted EBITDA, and Free Cash Flow are presented as supplemental financial measures in the evaluation of our business that are not required by, or presented in accordance with GAAP. The non-GAAP financial measures are tools intended to assist our management and investors in comparing our performance on a consistent basis for purposes of business decision-making by removing the impact of certain items that management believes do not directly reflect our core operations on an ongoing basis. These non-GAAP measures should not be a substitute for their comparable GAAP financial measures. Investors should rely primarily on our GAAP results and use non-GAAP financial measures only supplementally in making investment decisions. We believe the presentation of these non-GAAP financial measures helps management and investors to assess our operating performance from period to period, including our ability to generate earnings sufficient to service our debt, enhances understanding of our financial performance and highlights operational trends. These measures are widely used by investors and rating agencies in the valuation, comparison, rating and investment recommendations of companies. Our calculation of non-GAAP measures may not be comparable to similarly titled measures reported by other companies and other companies may not define these non-GAAP financial measures in the same way, which may limit their usefulness of comparative measures. Definitions EBITDA is defined as net income (loss) before interest, income taxes (benefits), depreciation and amortization. Net debt to EBITDA (Adjusted EBITDA) represents the ratio of our debt, net of cash, cash equivalents and short-term investments, to EBITDA (and to Adjusted EBITDA). EBITDA, Adjusted EBITDA, net debt to EBITDA and net debt to Adjusted EBITDA are presented as supplemental financial measurements in the evaluation of our business. Adjusted EBITDA, Adjusted Operating Income (Loss), Adjusted Income (Loss) before Income Taxes, Adjusted Income Tax Expense (Benefit), Adjusted Net Income (Loss) Attributable to Tyson and Adjusted EPS are defined as EBITDA, Operating Income (Loss), Income (Loss) before Income Taxes, Income Tax Expense (Benefit), Net Income (Loss) Attributable to Tyson and diluted earnings per share, respectively, excluding the impacts of any items that management believes do not directly reflect our core operations on an ongoing basis. Free Cash Flow is defined as Cash Provided by Operating Activities minus payments for Property, Plant and Equipment. Non-GAAP Financial Measures TYSON FOODS, INC. November 12, 2024 22


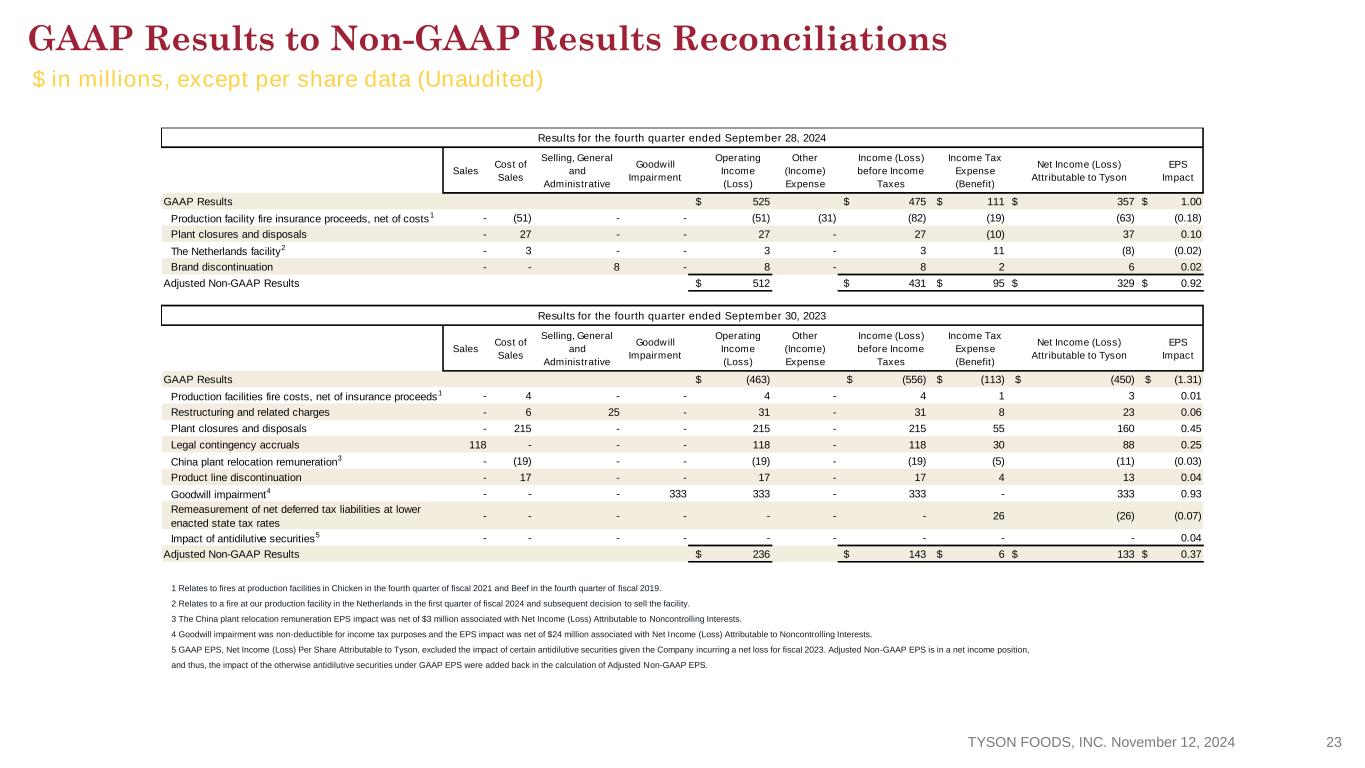
Sales Cost of Sales Selling, General and Administrative Goodwill Impairment Operating Income (Loss) Other (Income) Expense Income (Loss) before Income Taxes Income Tax Expense (Benefit) Net Income (Loss) Attributable to Tyson EPS Impact GAAP Results $ 525 $ 475 $ 111 $ 357 $ 1.00 Production facility fire insurance proceeds, net of costs1 - (51) - - (51) (31) (82) (19) (63) (0.18) Plant closures and disposals - 27 - - 27 - 27 (10) 37 0.10 The Netherlands facility2 - 3 - - 3 - 3 11 (8) (0.02) Brand discontinuation - - 8 - 8 - 8 2 6 0.02 Adjusted Non-GAAP Results $ 512 $ 431 $ 95 $ 329 $ 0.92 Sales Cost of Sales Selling, General and Administrative Goodwill Impairment Operating Income (Loss) Other (Income) Expense Income (Loss) before Income Taxes Income Tax Expense (Benefit) Net Income (Loss) Attributable to Tyson EPS Impact GAAP Results $ (463) $ (556) $ (113) $ (450) $ (1.31) Production facilities fire costs, net of insurance proceeds1 - 4 - - 4 - 4 1 3 0.01 Restructuring and related charges - 6 25 - 31 - 31 8 23 0.06 Plant closures and disposals - 215 - - 215 - 215 55 160 0.45 Legal contingency accruals 118 - - - 118 - 118 30 88 0.25 China plant relocation remuneration3 - (19) - - (19) - (19) (5) (11) (0.03) Product line discontinuation - 17 - - 17 - 17 4 13 0.04 Goodwill impairment4 - - - 333 333 - 333 - 333 0.93 Remeasurement of net deferred tax liabilities at lower enacted state tax rates - - - - - - - 26 (26) (0.07) Impact of antidilutive securities5 - - - - - - - - - 0.04 Adjusted Non-GAAP Results $ 236 $ 143 $ 6 $ 133 $ 0.37 Results for the fourth quarter ended September 28, 2024 Results for the fourth quarter ended September 30, 2023 GAAP Results to Non-GAAP Results Reconciliations $ in millions, except per share data (Unaudited) 1 Relates to fires at production facilities in Chicken in the fourth quarter of fiscal 2021 and Beef in the fourth quarter of fiscal 2019. 2 Relates to a fire at our production facility in the Netherlands in the first quarter of fiscal 2024 and subsequent decision to sell the facility. 3 The China plant relocation remuneration EPS impact was net of $3 million associated with Net Income (Loss) Attributable to Noncontrolling Interests. 4 Goodwill impairment was non-deductible for income tax purposes and the EPS impact was net of $24 million associated with Net Income (Loss) Attributable to Noncontrolling Interests. 5 GAAP EPS, Net Income (Loss) Per Share Attributable to Tyson, excluded the impact of certain antidilutive securities given the Company incurring a net loss for fiscal 2023. Adjusted Non-GAAP EPS is in a net income position, and thus, the impact of the otherwise antidilutive securities under GAAP EPS were added back in the calculation of Adjusted Non-GAAP EPS. TYSON FOODS, INC. November 12, 2024 23


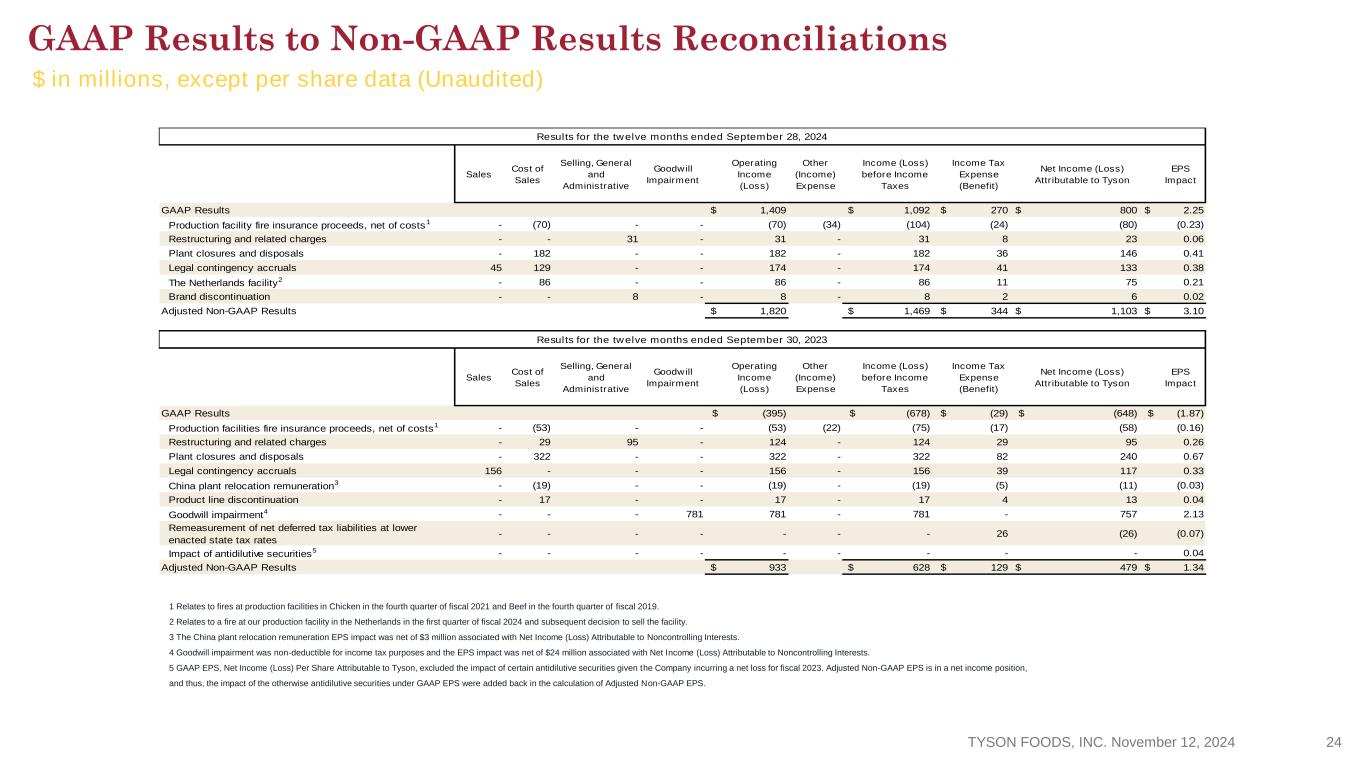
GAAP Results to Non-GAAP Results Reconciliations $ in millions, except per share data (Unaudited) Sales Cost of Sales Selling, General and Administrative Goodwill Impairment Operating Income (Loss) Other (Income) Expense Income (Loss) before Income Taxes Income Tax Expense (Benefit) Net Income (Loss) Attributable to Tyson EPS Impact GAAP Results $ 1,409 $ 1,092 $ 270 $ 800 $ 2.25 Production facility fire insurance proceeds, net of costs1 - (70) - - (70) (34) (104) (24) (80) (0.23) Restructuring and related charges - - 31 - 31 - 31 8 23 0.06 Plant closures and disposals - 182 - - 182 - 182 36 146 0.41 Legal contingency accruals 45 129 - - 174 - 174 41 133 0.38 The Netherlands facility2 - 86 - - 86 - 86 11 75 0.21 Brand discontinuation - - 8 - 8 - 8 2 6 0.02 Adjusted Non-GAAP Results $ 1,820 $ 1,469 $ 344 $ 1,103 $ 3.10 Sales Cost of Sales Selling, General and Administrative Goodwill Impairment Operating Income (Loss) Other (Income) Expense Income (Loss) before Income Taxes Income Tax Expense (Benefit) Net Income (Loss) Attributable to Tyson EPS Impact GAAP Results $ (395) $ (678) $ (29) $ (648) $ (1.87) Production facilities fire insurance proceeds, net of costs1 - (53) - - (53) (22) (75) (17) (58) (0.16) Restructuring and related charges - 29 95 - 124 - 124 29 95 0.26 Plant closures and disposals - 322 - - 322 - 322 82 240 0.67 Legal contingency accruals 156 - - - 156 - 156 39 117 0.33 China plant relocation remuneration3 - (19) - - (19) - (19) (5) (11) (0.03) Product line discontinuation - 17 - - 17 - 17 4 13 0.04 Goodwill impairment4 - - - 781 781 - 781 - 757 2.13 Remeasurement of net deferred tax liabilities at lower enacted state tax rates - - - - - - - 26 (26) (0.07) Impact of antidilutive securities5 - - - - - - - - - 0.04 Adjusted Non-GAAP Results $ 933 $ 628 $ 129 $ 479 $ 1.34 Results for the twelve months ended September 28, 2024 Results for the twelve months ended September 30, 2023 1 Relates to fires at production facilities in Chicken in the fourth quarter of fiscal 2021 and Beef in the fourth quarter of fiscal 2019. 2 Relates to a fire at our production facility in the Netherlands in the first quarter of fiscal 2024 and subsequent decision to sell the facility. 3 The China plant relocation remuneration EPS impact was net of $3 million associated with Net Income (Loss) Attributable to Noncontrolling Interests. 4 Goodwill impairment was non-deductible for income tax purposes and the EPS impact was net of $24 million associated with Net Income (Loss) Attributable to Noncontrolling Interests. 5 GAAP EPS, Net Income (Loss) Per Share Attributable to Tyson, excluded the impact of certain antidilutive securities given the Company incurring a net loss for fiscal 2023. Adjusted Non-GAAP EPS is in a net income position, and thus, the impact of the otherwise antidilutive securities under GAAP EPS were added back in the calculation of Adjusted Non-GAAP EPS. TYSON FOODS, INC. November 12, 2024 24


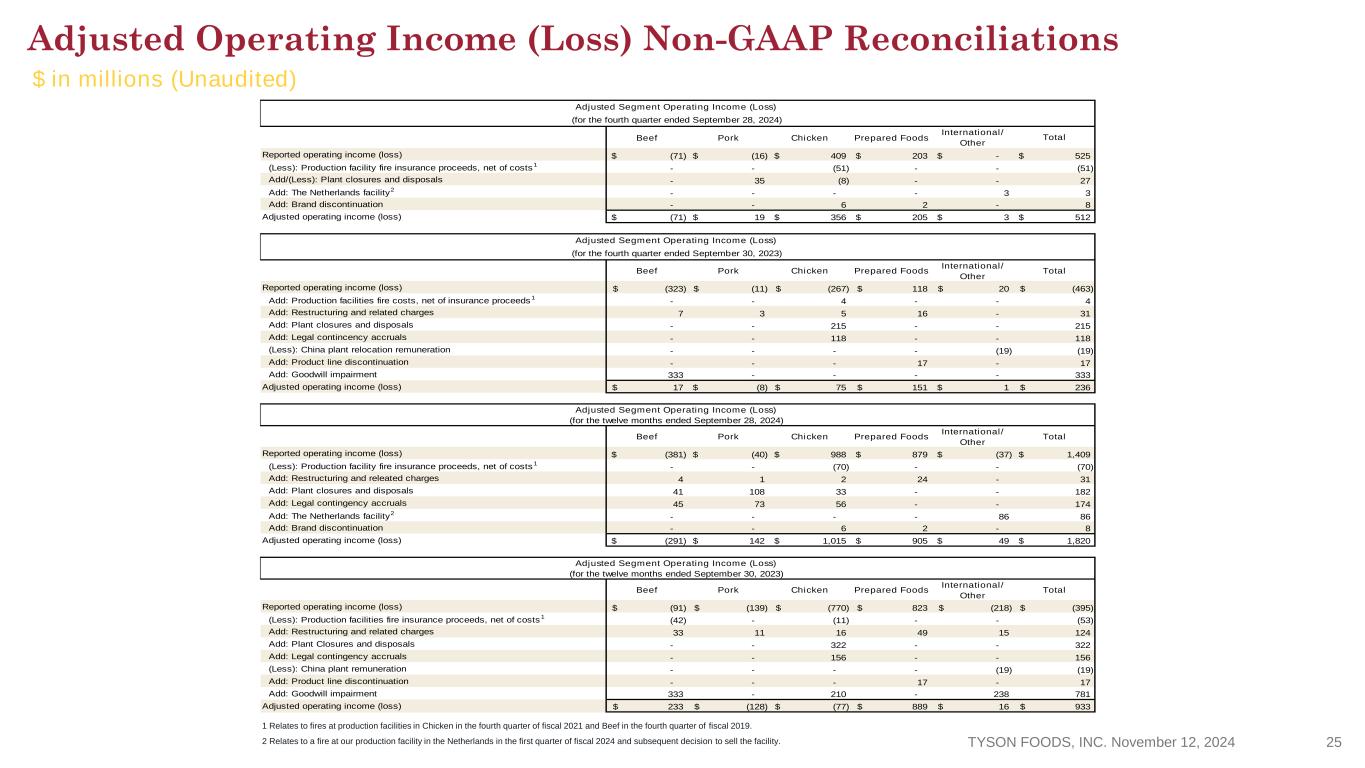
Beef Pork Chicken Prepared Foods International/ Other Reported operating income (loss) (71)$ (16)$ 409$ 203$ -$ 525$ (Less): Production facility fire insurance proceeds, net of costs1 - - (51) - - (51) Add/(Less): Plant closures and disposals - 35 (8) - - 27 Add: The Netherlands facility2 - - - - 3 3 Add: Brand discontinuation - - 6 2 - 8 Adjusted operating income (loss) (71)$ 19$ 356$ 205$ 3$ 512$ Beef Pork Chicken Prepared Foods International/ Other Total Reported operating income (loss) (323)$ (11)$ (267)$ 118$ 20$ (463)$ Add: Production facilities fire costs, net of insurance proceeds1 - - 4 - - 4 Add: Restructuring and related charges 7 3 5 16 - 31 Add: Plant closures and disposals - - 215 - - 215 Add: Legal contincency accruals - - 118 - - 118 (Less): China plant relocation remuneration - - - - (19) (19) Add: Product line discontinuation - - - 17 - 17 Add: Goodwill impairment 333 - - - - 333 Adjusted operating income (loss) 17$ (8)$ 75$ 151$ 1$ 236$ Beef Pork Chicken Prepared Foods International/ Other Total Reported operating income (loss) (381)$ (40)$ 988$ 879$ (37)$ 1,409$ (Less): Production facility fire insurance proceeds, net of costs1 - - (70) - - (70) Add: Restructuring and releated charges 4 1 2 24 - 31 Add: Plant closures and disposals 41 108 33 - - 182 Add: Legal contingency accruals 45 73 56 - - 174 Add: The Netherlands facility2 - - - - 86 86 Add: Brand discontinuation - - 6 2 - 8 Adjusted operating income (loss) (291)$ 142$ 1,015$ 905$ 49$ 1,820$ Beef Pork Chicken Prepared Foods International/ Other Total Reported operating income (loss) (91)$ (139)$ (770)$ 823$ (218)$ (395)$ (Less): Production facilities fire insurance proceeds, net of costs1 (42) - (11) - - (53) Add: Restructuring and related charges 33 11 16 49 15 124 Add: Plant Closures and disposals - - 322 - - 322 Add: Legal contingency accruals - - 156 - - 156 (Less): China plant remuneration - - - - (19) (19) Add: Product line discontinuation - - - 17 - 17 Add: Goodwill impairment 333 - 210 - 238 781 Adjusted operating income (loss) 233$ (128)$ (77)$ 889$ 16$ 933$ Adjusted Segment Operating Income (Loss)  Adjusted Segment Operating Income (Loss)  (for the twelve months ended September 28, 2024) Adjusted Segment Operating Income (Loss)  (for the twelve months ended September 30, 2023) Adjusted Segment Operating Income (Loss)  (for the fourth quarter ended September 30, 2023) (for the fourth quarter ended September 28, 2024) Total Adjusted Operating Income (Loss) Non-GAAP Reconciliations $ in millions (Unaudited) 1 Relates to fires at production facilities in Chicken in the fourth quarter of fiscal 2021 and Beef in the fourth quarter of fiscal 2019. 2 Relates to a fire at our production facility in the Netherlands in the first quarter of fiscal 2024 and subsequent decision to sell the facility. TYSON FOODS, INC. November 12, 2024 25


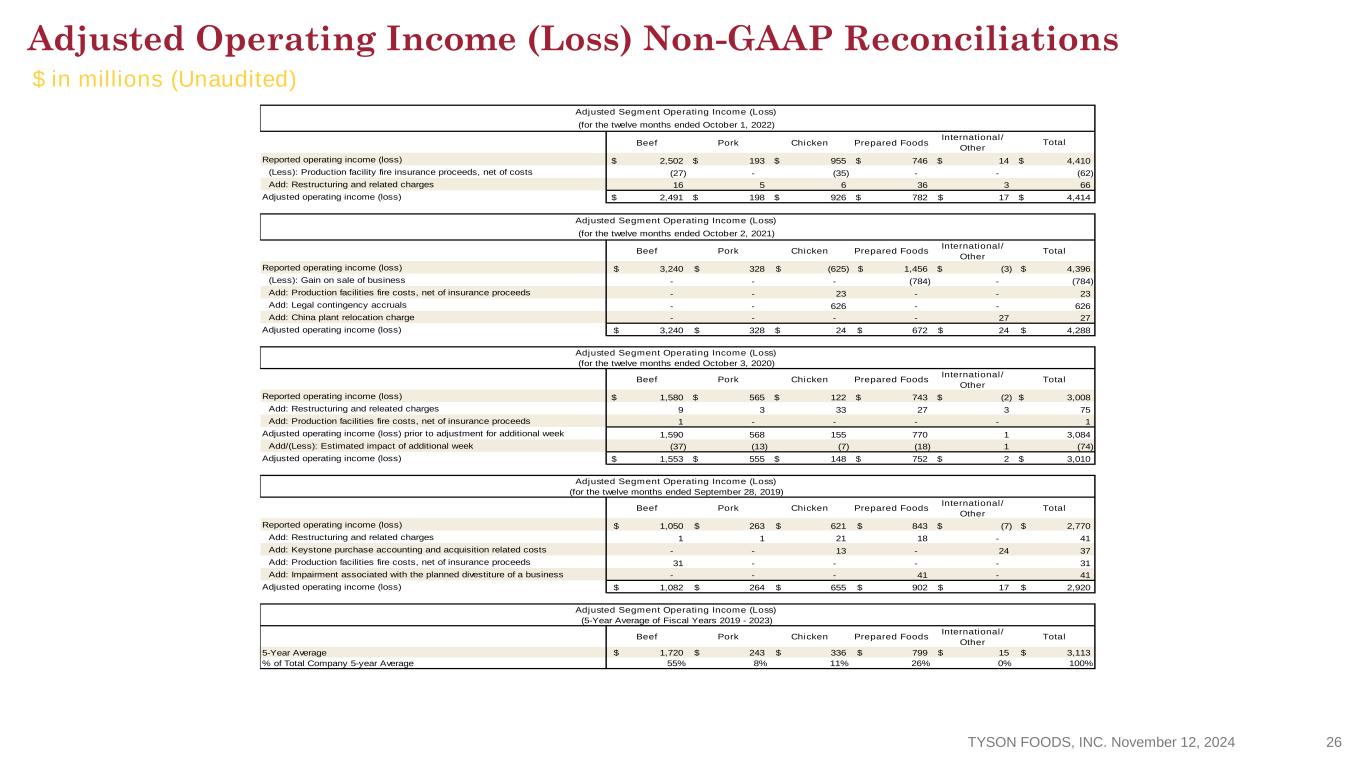
Beef Pork Chicken Prepared Foods International/ Other Reported operating income (loss) 2,502$ 193$ 955$ 746$ 14$ 4,410$ (Less): Production facility fire insurance proceeds, net of costs (27) - (35) - - (62) Add: Restructuring and related charges 16 5 6 36 3 66 Adjusted operating income (loss) 2,491$ 198$ 926$ 782$ 17$ 4,414$ Beef Pork Chicken Prepared Foods International/ Other Total Reported operating income (loss) 3,240$ 328$ (625)$ 1,456$ (3)$ 4,396$ (Less): Gain on sale of business - - - (784) - (784) Add: Production facilities fire costs, net of insurance proceeds - - 23 - - 23 Add: Legal contingency accruals - - 626 - - 626 Add: China plant relocation charge - - - - 27 27 Adjusted operating income (loss) 3,240$ 328$ 24$ 672$ 24$ 4,288$ Beef Pork Chicken Prepared Foods International/ Other Total Reported operating income (loss) 1,580$ 565$ 122$ 743$ (2)$ 3,008$ Add: Restructuring and releated charges 9 3 33 27 3 75 Add: Production facilities fire costs, net of insurance proceeds 1 - - - - 1 Adjusted operating income (loss) prior to adjustment for additional week 1,590 568 155 770 1 3,084 Add/(Less): Estimated impact of additional week (37) (13) (7) (18) 1 (74) Adjusted operating income (loss) 1,553$ 555$ 148$ 752$ 2$ 3,010$ Beef Pork Chicken Prepared Foods International/ Other Total Reported operating income (loss) 1,050$ 263$ 621$ 843$ (7)$ 2,770$ Add: Restructuring and related charges 1 1 21 18 - 41 Add: Keystone purchase accounting and acquisition related costs - - 13 - 24 37 Add: Production facilities fire costs, net of insurance proceeds 31 - - - - 31 Add: Impairment associated with the planned divestiture of a business - - - 41 - 41 Adjusted operating income (loss) 1,082$ 264$ 655$ 902$ 17$ 2,920$ Beef Pork Chicken Prepared Foods International/ Other Total 5-Year Average 1,720$ 243$ 336$ 799$ 15$ 3,113$ % of Total Company 5-year Average 55% 8% 11% 26% 0% 100% Adjusted Segment Operating Income (Loss)  (5-Year Average of Fiscal Years 2019 - 2023) Adjusted Segment Operating Income (Loss)  Adjusted Segment Operating Income (Loss)  (for the twelve months ended October 3, 2020) Adjusted Segment Operating Income (Loss)  (for the twelve months ended September 28, 2019) Adjusted Segment Operating Income (Loss)  (for the twelve months ended October 2, 2021) (for the twelve months ended October 1, 2022) Total Adjusted Operating Income (Loss) Non-GAAP Reconciliations $ in millions (Unaudited) TYSON FOODS, INC. November 12, 2024 26


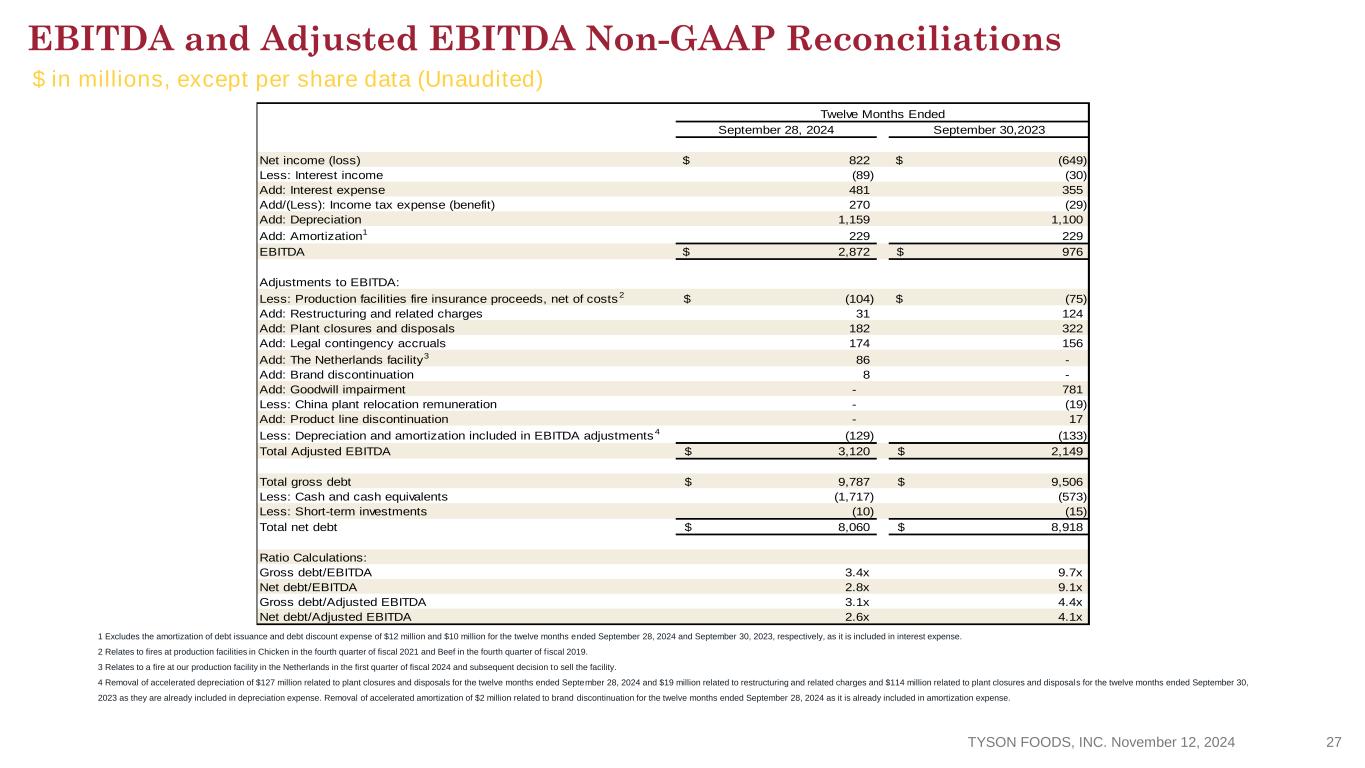
1 Excludes the amortization of debt issuance and debt discount expense of $12 million and $10 million for the twelve months ended September 28, 2024 and September 30, 2023, respectively, as it is included in interest expense. 2 Relates to fires at production facilities in Chicken in the fourth quarter of fiscal 2021 and Beef in the fourth quarter of f iscal 2019. 3 Relates to a fire at our production facility in the Netherlands in the first quarter of fiscal 2024 and subsequent decision to sell the facility. 4 Removal of accelerated depreciation of $127 million related to plant closures and disposals for the twelve months ended September 28, 2024 and $19 million related to restructuring and related charges and $114 million related to plant closures and disposals for the twelve months ended September 30, 2023 as they are already included in depreciation expense. Removal of accelerated amortization of $2 million related to brand discontinuation for the twelve months ended September 28, 2024 as it is already included in amortization expense. September 28, 2024 September 30,2023 Net income (loss) 822$ (649)$ Less: Interest income (89) (30) Add: Interest expense 481 355 Add/(Less): Income tax expense (benefit) 270 (29) Add: Depreciation 1,159 1,100 Add: Amortization1 229 229 EBITDA 2,872$ 976$ Adjustments to EBITDA: Less: Production facilities fire insurance proceeds, net of costs2 (104)$ (75)$ Add: Restructuring and related charges 31 124 Add: Plant closures and disposals 182 322 Add: Legal contingency accruals 174 156 Add: The Netherlands facility3 86 - Add: Brand discontinuation 8 - Add: Goodwill impairment - 781 Less: China plant relocation remuneration - (19) Add: Product line discontinuation - 17 Less: Depreciation and amortization included in EBITDA adjustments4 (129) (133) Total Adjusted EBITDA 3,120$ 2,149$ Total gross debt 9,787$ 9,506$ Less: Cash and cash equivalents (1,717) (573) Less: Short-term investments (10) (15) Total net debt 8,060$ 8,918$ Ratio Calculations: Gross debt/EBITDA 3.4x 9.7x Net debt/EBITDA 2.8x 9.1x Gross debt/Adjusted EBITDA 3.1x 4.4x Net debt/Adjusted EBITDA 2.6x 4.1x Twelve Months Ended EBITDA and Adjusted EBITDA Non-GAAP Reconciliations $ in millions, except per share data (Unaudited) TYSON FOODS, INC. November 12, 2024 27


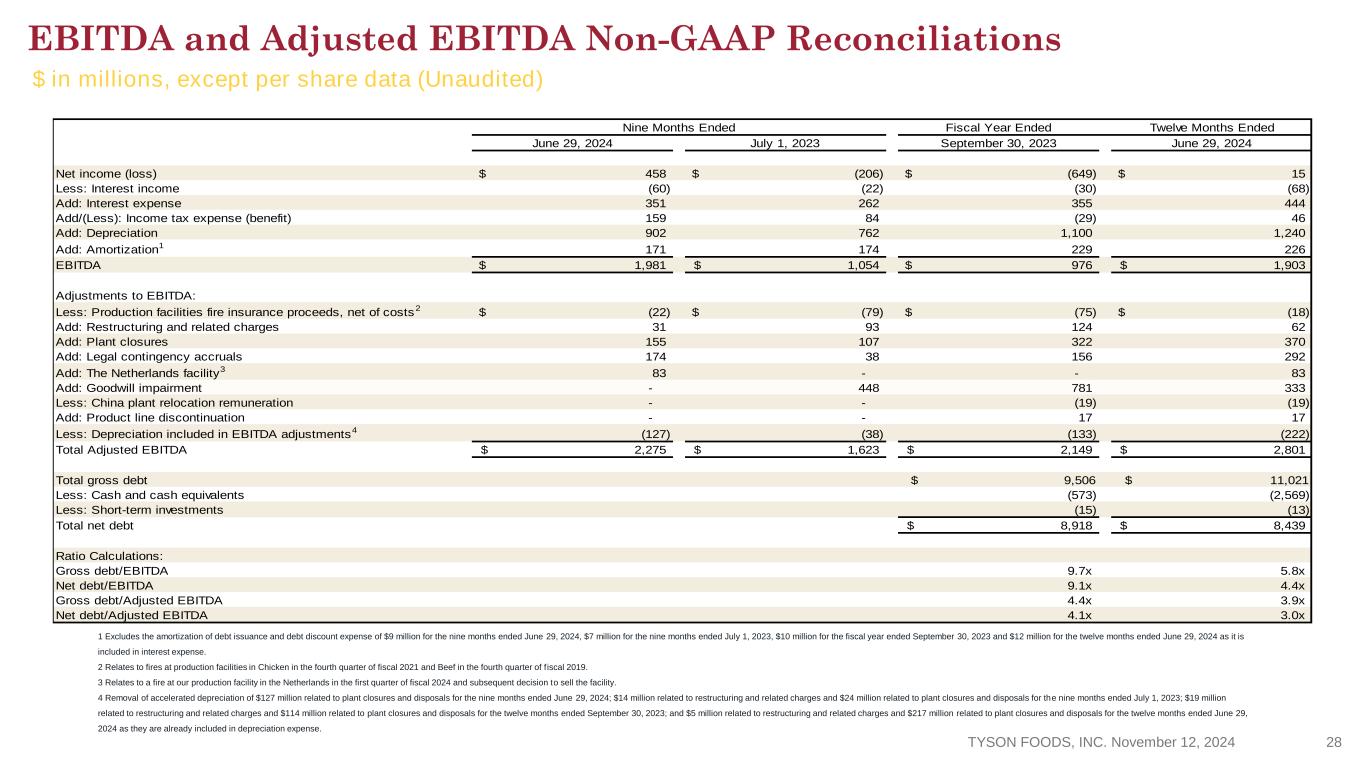
1 Excludes the amortization of debt issuance and debt discount expense of $9 million for the nine months ended June 29, 2024, $7 million for the nine months ended July 1, 2023, $10 million for the fiscal year ended September 30, 2023 and $12 million for the twelve months ended June 29, 2024 as it is included in interest expense. 2 Relates to fires at production facilities in Chicken in the fourth quarter of fiscal 2021 and Beef in the fourth quarter of f iscal 2019. 3 Relates to a fire at our production facility in the Netherlands in the first quarter of fiscal 2024 and subsequent decision to sell the facility. 4 Removal of accelerated depreciation of $127 million related to plant closures and disposals for the nine months ended June 29, 2024; $14 million related to restructuring and related charges and $24 million related to plant closures and disposals for the nine months ended July 1, 2023; $19 million related to restructuring and related charges and $114 million related to plant closures and disposals for the twelve months ended September 30, 2023; and $5 million related to restructuring and related charges and $217 million related to plant closures and disposals for the twelve months ended June 29, 2024 as they are already included in depreciation expense. Fiscal Year Ended Twelve Months Ended June 29, 2024 July 1, 2023 September 30, 2023 June 29, 2024 Net income (loss) 458$ (206)$ (649)$ 15$ Less: Interest income (60) (22) (30) (68) Add: Interest expense 351 262 355 444 Add/(Less): Income tax expense (benefit) 159 84 (29) 46 Add: Depreciation 902 762 1,100 1,240 Add: Amortization1 171 174 229 226 EBITDA 1,981$ 1,054$ 976$ 1,903$ Adjustments to EBITDA: Less: Production facilities fire insurance proceeds, net of costs2 (22)$ (79)$ (75)$ (18)$ Add: Restructuring and related charges 31 93 124 62 Add: Plant closures 155 107 322 370 Add: Legal contingency accruals 174 38 156 292 Add: The Netherlands facility3 83 - - 83 Add: Goodwill impairment - 448 781 333 Less: China plant relocation remuneration - - (19) (19) Add: Product line discontinuation - - 17 17 Less: Depreciation included in EBITDA adjustments4 (127) (38) (133) (222) Total Adjusted EBITDA 2,275$ 1,623$ 2,149$ 2,801$ Total gross debt $ 9,506 $ 11,021 Less: Cash and cash equivalents (573) (2,569) Less: Short-term investments (15) (13) Total net debt 8,918$ 8,439$ Ratio Calculations: Gross debt/EBITDA 9.7x 5.8x Net debt/EBITDA 9.1x 4.4x Gross debt/Adjusted EBITDA 4.4x 3.9x Net debt/Adjusted EBITDA 4.1x 3.0x Nine Months Ended EBITDA and Adjusted EBITDA Non-GAAP Reconciliations $ in millions, except per share data (Unaudited) TYSON FOODS, INC. November 12, 2024 28


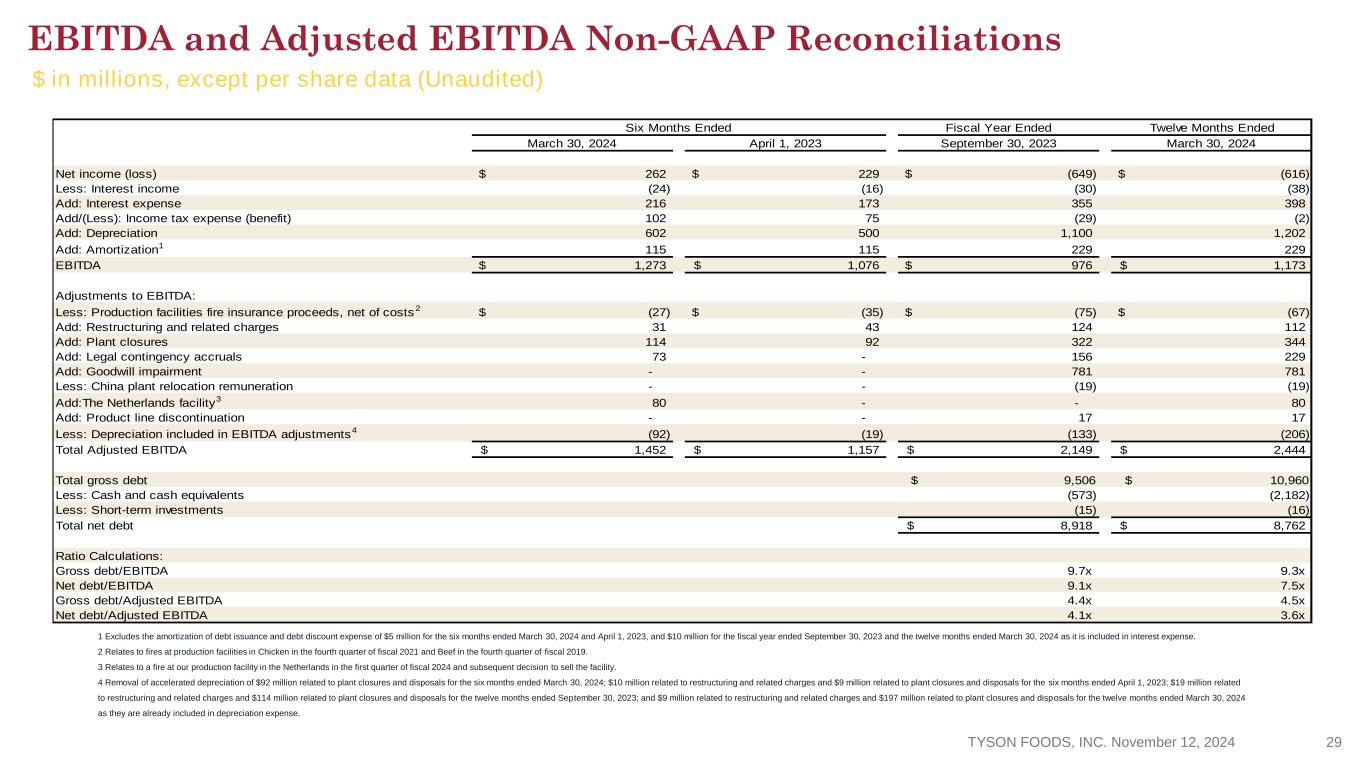
1 Excludes the amortization of debt issuance and debt discount expense of $5 million for the six months ended March 30, 2024 and April 1, 2023, and $10 million for the fiscal year ended September 30, 2023 and the twelve months ended March 30, 2024 as it is included in interest expense. 2 Relates to fires at production facilities in Chicken in the fourth quarter of fiscal 2021 and Beef in the fourth quarter of fiscal 2019. 3 Relates to a fire at our production facility in the Netherlands in the first quarter of fiscal 2024 and subsequent decision to sell the facility. 4 Removal of accelerated depreciation of $92 million related to plant closures and disposals for the six months ended March 30, 2024; $10 million related to restructuring and related charges and $9 million related to plant closures and disposals for the six months ended April 1, 2023; $19 million related to restructuring and related charges and $114 million related to plant closures and disposals for the twelve months ended September 30, 2023; and $9 million related to restructuring and related charges and $197 million related to plant closures and disposals for the twelve months ended March 30, 2024 as they are already included in depreciation expense. Fiscal Year Ended Twelve Months Ended March 30, 2024 April 1, 2023 September 30, 2023 March 30, 2024 Net income (loss) 262$ 229$ (649)$ (616)$ Less: Interest income (24) (16) (30) (38) Add: Interest expense 216 173 355 398 Add/(Less): Income tax expense (benefit) 102 75 (29) (2) Add: Depreciation 602 500 1,100 1,202 Add: Amortization1 115 115 229 229 EBITDA 1,273$ 1,076$ 976$ 1,173$ Adjustments to EBITDA: Less: Production facilities fire insurance proceeds, net of costs2 (27)$ (35)$ (75)$ (67)$ Add: Restructuring and related charges 31 43 124 112 Add: Plant closures 114 92 322 344 Add: Legal contingency accruals 73 - 156 229 Add: Goodwill impairment - - 781 781 Less: China plant relocation remuneration - - (19) (19) Add:The Netherlands facility3 80 - - 80 Add: Product line discontinuation - - 17 17 Less: Depreciation included in EBITDA adjustments4 (92) (19) (133) (206) Total Adjusted EBITDA 1,452$ 1,157$ 2,149$ 2,444$ Total gross debt $ 9,506 $ 10,960 Less: Cash and cash equivalents (573) (2,182) Less: Short-term investments (15) (16) Total net debt 8,918$ 8,762$ Ratio Calculations: Gross debt/EBITDA 9.7x 9.3x Net debt/EBITDA 9.1x 7.5x Gross debt/Adjusted EBITDA 4.4x 4.5x Net debt/Adjusted EBITDA 4.1x 3.6x Six Months Ended EBITDA and Adjusted EBITDA Non-GAAP Reconciliations $ in millions, except per share data (Unaudited) TYSON FOODS, INC. November 12, 2024 29


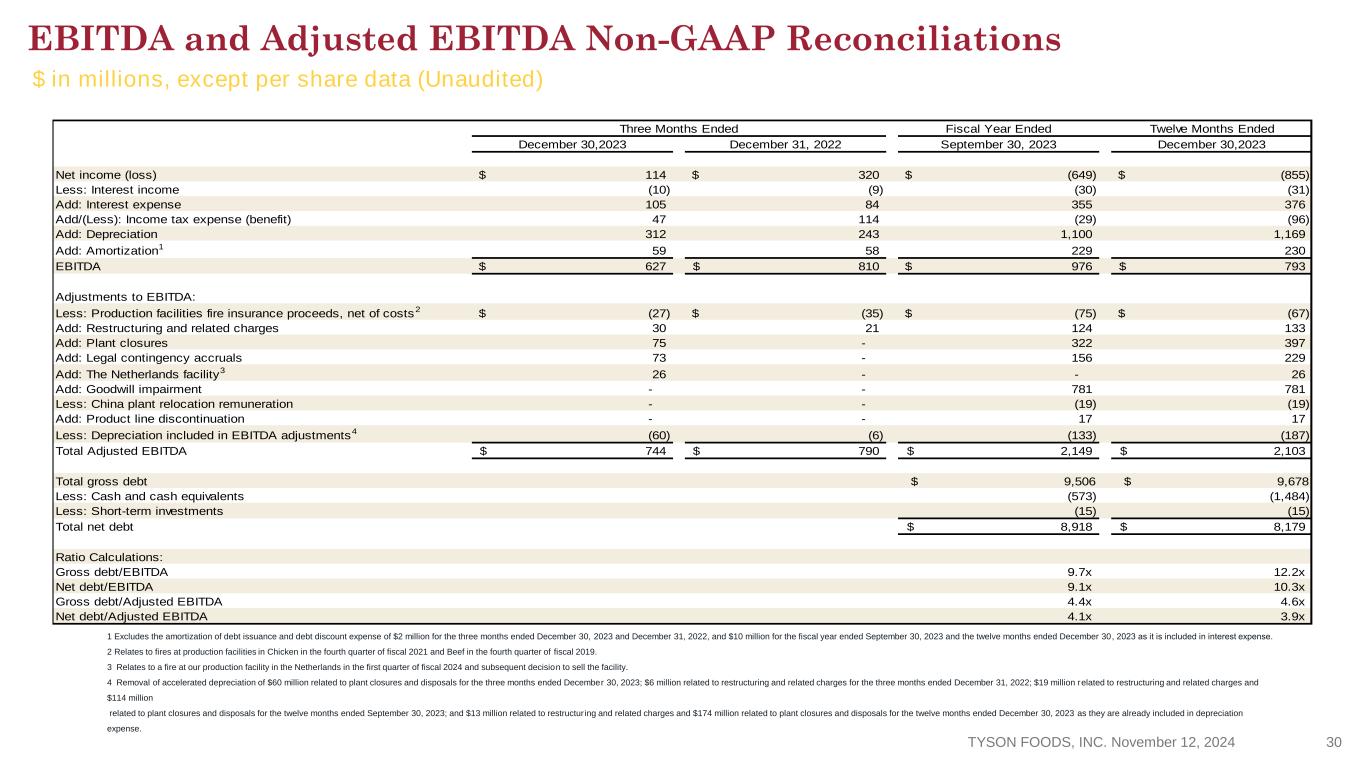
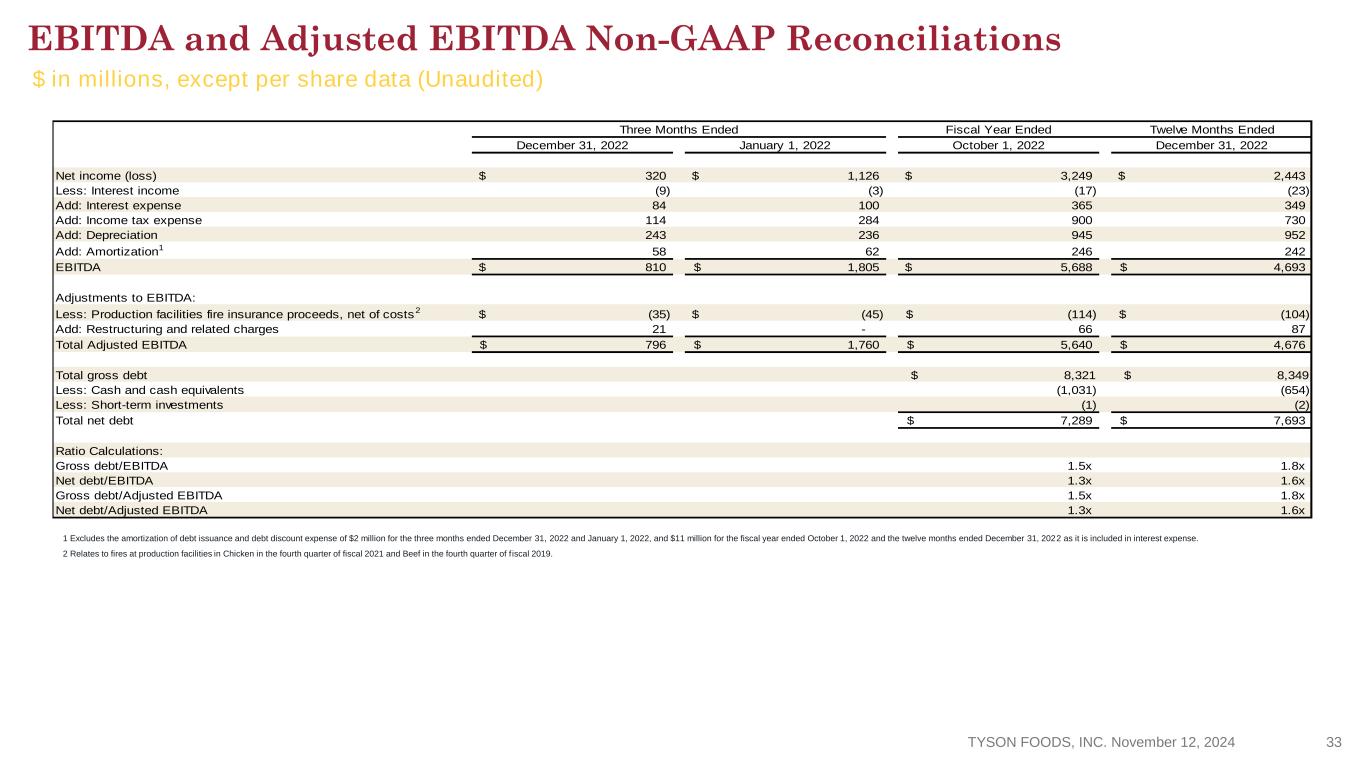
1 Excludes the amortization of debt issuance and debt discount expense of $2 million for the three months ended December 30, 2023 and December 31, 2022, and $10 million for the fiscal year ended September 30, 2023 and the twelve months ended December 30, 2023 as it is included in interest expense.​ 2 Relates to fires at production facilities in Chicken in the fourth quarter of fiscal 2021 and Beef in the fourth quarter of fiscal 2019. 3 Relates to a fire at our production facility in the Netherlands in the first quarter of fiscal 2024 and subsequent decision to sell the facility. 4 Removal of accelerated depreciation of $60 million related to plant closures and disposals for the three months ended December 30, 2023; $6 million related to restructuring and related charges for the three months ended December 31, 2022; $19 million related to restructuring and related charges and $114 million related to plant closures and disposals for the twelve months ended September 30, 2023; and $13 million related to restructur ing and related charges and $174 million related to plant closures and disposals for the twelve months ended December 30, 2023 as they are already included in depreciation expense. Fiscal Year Ended Twelve Months Ended December 30,2023 December 31, 2022 September 30, 2023 December 30,2023 Net income (loss) 114$ 320$ (649)$ (855)$ Less: Interest income (10) (9) (30) (31) Add: Interest expense 105 84 355 376 Add/(Less): Income tax expense (benefit) 47 114 (29) (96) Add: Depreciation 312 243 1,100 1,169 Add: Amortization1 59 58 229 230 EBITDA 627$ 810$ 976$ 793$ Adjustments to EBITDA: Less: Production facilities fire insurance proceeds, net of costs2 (27)$ (35)$ (75)$ (67)$ Add: Restructuring and related charges 30 21 124 133 Add: Plant closures 75 - 322 397 Add: Legal contingency accruals 73 - 156 229 Add: The Netherlands facility3 26 - - 26 Add: Goodwill impairment - - 781 781 Less: China plant relocation remuneration - - (19) (19) Add: Product line discontinuation - - 17 17 Less: Depreciation included in EBITDA adjustments4 (60) (6) (133) (187) Total Adjusted EBITDA 744$ 790$ 2,149$ 2,103$ Total gross debt $ 9,506 $ 9,678 Less: Cash and cash equivalents (573) (1,484) Less: Short-term investments (15) (15) Total net debt 8,918$ 8,179$ Ratio Calculations: Gross debt/EBITDA 9.7x 12.2x Net debt/EBITDA 9.1x 10.3x Gross debt/Adjusted EBITDA 4.4x 4.6x Net debt/Adjusted EBITDA 4.1x 3.9x Three Months Ended EBITDA and Adjusted EBITDA Non-GAAP Reconciliations TYSON FOODS, INC. November 12, 2024 30 $ in millions, except per share data (Unaudited)


1 Excludes the amortization of debt issuance and discount expense of $7 million for the nine months ended July 1, 2023 and July 2, 2022, and $11 million for the fiscal year ended October 1, 2022, and the twelve months ended July 1, 2023 as it is included in interest expense. 2 Relates to fires at production facilities in Chicken in the fourth quarter of fiscal 2021 and Beef in the fourth quarter of f iscal 2019. 3 Removal of accelerated depreciation of $14 million related to restructuring and related charges and $24 million related to the plant closures and disposals for the nine months ended July 1, 2023 as it is already included in depreciation expense. Fiscal Year Ended Twelve Months Ended July 1, 2023 July 2, 2022 October 1, 2022 July 1, 2023 Net income (loss) (206)$ 2,712$ 3,249$ 331$ Less: Interest income (22) (10) (17) (29) Add: Interest expense 262 282 365 345 Add: Income tax expense 84 771 900 213 Add: Depreciation 762 699 945 1,008 Add: Amortization1 174 186 246 234 EBITDA 1,054$ 4,640$ 5,688$ 2,102$ Adjustments to EBITDA: Less: Production facilities fire insurance proceeds, net of costs2 (79)$ (107)$ (114)$ (86)$ Add: Restructuring and related charges 93 - 66 159 Add: Plant closures 107 - - 107 Add: Legal contingency accrual 38 - - 38 Add: Goodwill impairment 448 - - 448 Less: Depreciation included in EBITDA adjustments3 (38) - - (38) Total Adjusted EBITDA 1,623$ 4,533$ 5,640$ 2,730$ Total gross debt $ 8,321 $ 9,320 Less: Cash and cash equivalents (1,031) (699) Less: Short-term investments (1) (7) Total net debt 7,289$ 8,614$ Ratio Calculations: Gross debt/EBITDA 1.5x 4.4x Net debt/EBITDA 1.3x 4.1x Gross debt/Adjusted EBITDA 1.5x 3.4x Net debt/Adjusted EBITDA 1.3x 3.2x Nine Months Ended EBITDA and Adjusted EBITDA Non-GAAP Reconciliations TYSON FOODS, INC. November 12, 2024 31 $ in millions, except per share data (Unaudited)


1 Excludes the amortization of debt issuance and debt discount expense of $5 million for the six months ended April 1, 2023 and April 2, 2022, and $11 million for the fiscal year ended October 1, 2022 and the twelve months ended April 1, 2023 as it is included in interest expense. 2 Relates to fires at production facilities in Chicken in the fourth quarter of fiscal 2021 and Beef in the fourth quarter of f iscal 2019. 3 Removal of accelerated depreciation of $10 million related to restructuring and related charges and $9 million related to the plant closures and disposals for the six months ended April 1, 2023 as it is already included in depreciation expense. Fiscal Year Ended Twelve Months Ended April 1, 2023 April 2, 2022 October 1, 2022 April 1, 2023 Net income (loss) 229$ 1,959$ 3,249$ 1,519$ Less: Interest income (16) (6) (17) (27) Add: Interest expense 173 197 365 341 Add: Income tax expense 75 538 900 437 Add: Depreciation 500 466 945 979 Add: Amortization1 115 124 246 237 EBITDA 1,076$ 3,278$ 5,688$ 3,486$ Adjustments to EBITDA: Less: Production facilities fire insurance proceeds, net of costs2 (35)$ (40)$ (114)$ (109)$ Add: Restructuring and related charges 43 - 66 109 Add: Plant closures 92 - - 92 Less: Depreciation included in EBITDA adjustments3 (19) - - (19) Total Adjusted EBITDA 1,157$ 3,238$ 5,640$ 3,559$ Total gross debt $ 8,321 $ 8,930 Less: Cash and cash equivalents (1,031) (543) Less: Short-term investments (1) (7) Total net debt 7,289$ 8,380$ Ratio Calculations: Gross debt/EBITDA 1.5x 2.6x Net debt/EBITDA 1.3x 2.4x Gross debt/Adjusted EBITDA 1.5x 2.5x Net debt/Adjusted EBITDA 1.3x 2.4x Six Months Ended EBITDA and Adjusted EBITDA Non-GAAP Reconciliations TYSON FOODS, INC. November 12, 2024 32 $ in millions, except per share data (Unaudited)


1 Excludes the amortization of debt issuance and debt discount expense of $2 million for the three months ended December 31, 2022 and January 1, 2022, and $11 million for the fiscal year ended October 1, 2022 and the twelve months ended December 31, 2022 as it is included in interest expense. 2 Relates to fires at production facilities in Chicken in the fourth quarter of fiscal 2021 and Beef in the fourth quarter of f iscal 2019. Fiscal Year Ended Twelve Months Ended December 31, 2022 January 1, 2022 October 1, 2022 December 31, 2022 Net income (loss) 320$ 1,126$ 3,249$ 2,443$ Less: Interest income (9) (3) (17) (23) Add: Interest expense 84 100 365 349 Add: Income tax expense 114 284 900 730 Add: Depreciation 243 236 945 952 Add: Amortization1 58 62 246 242 EBITDA 810$ 1,805$ 5,688$ 4,693$ Adjustments to EBITDA: Less: Production facilities fire insurance proceeds, net of costs2 (35)$ (45)$ (114)$ (104)$ Add: Restructuring and related charges 21 - 66 87 Total Adjusted EBITDA 796$ 1,760$ 5,640$ 4,676$ Total gross debt $ 8,321 $ 8,349 Less: Cash and cash equivalents (1,031) (654) Less: Short-term investments (1) (2) Total net debt 7,289$ 7,693$ Ratio Calculations: Gross debt/EBITDA 1.5x 1.8x Net debt/EBITDA 1.3x 1.6x Gross debt/Adjusted EBITDA 1.5x 1.8x Net debt/Adjusted EBITDA 1.3x 1.6x Three Months Ended EBITDA and Adjusted EBITDA Non-GAAP Reconciliations TYSON FOODS, INC. November 12, 2024 33 $ in millions, except per share data (Unaudited)


September 28, 2024 September 30, 2023 Cash Provided by Operating Activities 2,590$ 1,752$ Additions to property, plant and equipment (1,132) (1,939) Free cash flow 1,458$ (187)$ Twelve Months Ended Free Cash Flow Non-GAAP Reconciliation $ in millions (Unaudited) TYSON FOODS, INC. November 12, 2024 34