-1-
Ingersoll Rand Reports Fourth-Quarter and Annual 2019 Results
Highlights (fourth quarter 2019 versus fourth quarter 2018, unless otherwise noted):
l | Reported revenues up 7 percent; organic revenues* up 5 percent led by the Climate segment |
l | Exceptional cash conversion for full-year 2019; cash flow from continuing operating activities of $2 billion; free cash flow* of $1.8 billion, 118 percent of adjusted net earnings* |
l | Fiscal 2019 capital deployment of $510 million in dividends, $1.5 billion in acquisitions and $750 million in share repurchases |
l | GAAP full-year continuing EPS of $5.61; adjusted continuing EPS* of $6.37, up 14 percent |
l | Reverse Morris Trust transaction with GDI on track for early 2020 |
*This news release contains non-GAAP financial measures. Definitions of the non-GAAP financial measures can be found in the footnotes of this news release. See attached tables for additional details and reconciliations. | |
Swords, Ireland, January 29, 2020 - Ingersoll-Rand plc (NYSE:IR), a world leader in creating comfortable, sustainable and efficient environments, today reported diluted earnings per share (EPS) from continuing operations of $1.12 for the fourth quarter of 2019. Adjusted continuing EPS of $1.40 excludes planned restructuring costs of $22 million primarily related to ongoing footprint optimization, and $56 million of anticipated Industrial segment separation and acquisition related costs consistent with expectations.
Fourth-quarter 2019 Results
Financial Comparisons - Fourth-Quarter Continuing Operations
$, millions except EPS | Q4 2019 | Q4 2018 | Y-O-Y Change | Organic Y-O-Y Change |
Bookings | $3,975 | $4,142 | (4)% | (6)% |
Net Revenues | $4,151 | $3,895 | 7% | 5% |
GAAP Operating Income | $425 | $447 | (5)% | |
GAAP Operating Margin | 10.2% | 11.5% | (130 bps) | |
Adjusted Operating Income* | $502 | $469 | 7% | |
Adjusted Operating Margin | 12.1% | 12.0% | 10 bps | |
GAAP Continuing EPS | $1.12 | $1.00 | 12% | |
Adjusted Continuing EPS | $1.40 | $1.32 | 6% | |
Restructuring Cost | ($22.1) | ($21.8) | ($0.3) | |
-more-
-2-
“We marked another year of top quartile financial performance in 2019 with 6 percent revenue growth, 14 percent EPS growth and free cash flow of 118 percent of net earnings, successfully navigating a rapidly evolving global economic and geopolitical landscape,” said Michael W. Lamach, chairman and chief executive officer of Ingersoll Rand. “Our highly engaged team consistently executed our strategy focused on global energy efficiency and sustainability mega trends to deliver strong and differentiated results for our customers and shareholders.
While we grew in all of our Climate businesses, our Commercial HVAC business growth was truly outstanding, with high-single digit percentage growth globally and low-teens percentage growth in North America. It was a challenging year for our Industrial businesses with a decline in short cycle industrial spending globally; however, our team ended 2019 with better than expected fourth quarter revenues and operating income.”
Lamach continued, “Our businesses are well-positioned as we progress toward the close of the Reverse Morris Trust transaction with Gardner Denver, and the establishment of a pure-play global leader in climate technologies along with a global leader in mission-critical flow creation and industrial solutions. We’re excited about the potential for both companies to unlock value for shareholders.
Looking at 2020 and the new Trane Technologies, we remain confident that we have the fundamental ingredients for another year of strong financial performance. We’ve entered the year with broadly favorable end markets, strong backlog and a proven business operating system that enables us to continue navigating ongoing global uncertainties, drive strong earnings per share growth and deliver powerful cash flow to execute our balanced capital allocation strategy.”
Highlights from the Fourth Quarter of 2019 (all comparisons against the fourth quarter of 2018 unless otherwise noted)
• | Strong enterprise reported revenue growth in both segments led by exceptional growth in the Climate segment's North America Commercial HVAC business, up high-teens. |
• | Enterprise reported bookings were down 4 percent and organic bookings were down 6 percent. However, organic bookings were up high-single digits excluding the Transport business, which has faced very difficult comparisons throughout 2019 given the exceptional North American trailer and auxiliary power unit growth in 2018. High-single digit enterprise organic bookings growth also excludes the impact of the company's previously disclosed large Commercial HVAC order of approximately $200 million in the fourth quarter of 2018. |
• | GAAP operating margin down 130 basis points; adjusted operating margin up 10 basis points. Fourth quarter operating leverage was lower than company expectations driven by three primary impacts: 1) gross margin de-leverage associated with the high-single digit revenue decline in the Transport business, 2) increased incentive compensation tied to the company significantly exceeding its free cash flow generation expectations in the fourth quarter, and 3) unplanned year-end inventory adjustments in the Climate segment. |
• | GAAP continuing EPS was up 12 percent. Adjusted continuing EPS growth was up 6 percent compounding on 29 percent growth in the fourth quarter of 2018. |
-more-
-3-
Fourth-Quarter Business Review (all comparisons against the fourth quarter of 2018 unless otherwise noted)
Climate Segment: delivers energy-efficient products and innovative energy services. The segment includes Trane® and American Standard® Heating & Air Conditioning which provide heating, ventilation and air conditioning (HVAC) systems, and commercial and residential building services, parts, support and controls; energy services and building automation through Trane Building Advantage™ and Nexia™; and Thermo King® transport temperature control solutions.
$, millions | Q4 2019 | Q4 2018 | Y-O-Y Change | Organic Y-O-Y Change |
Bookings | $3,057 | $3,274 | (7)% | (6)% |
Net Revenues | $3,184 | $3,002 | 6% | 7% |
GAAP Operating Income | $398 | $388 | 3% | |
GAAP Operating Margin | 12.5% | 12.9% | (40 bps) | |
Adjusted Operating Income | $414 | $399 | 4% | |
Adjusted Operating Margin | 13.0% | 13.3% | (30 bps) | |
• | The Climate segment delivered strong reported and organic revenue growth, up 6 percent and 7 percent, respectively, compounding on a tough comparison of 9 percent organic growth in the prior year. |
• | Underlying Climate bookings continued to be very strong in the quarter. Climate reported bookings were down 7 percent and organic bookings were down 6 percent. However, organic bookings were up low-teens excluding the Transport business and the aforementioned 4Q18 large Commercial HVAC order. |
• | Climate reported operating margin was down 40 basis points and adjusted operating margin was down 30 basis points. Operating leverage in the fourth quarter was below company expectations, impacted by the three factors outlined in the fourth quarter highlights section above. |
Industrial Segment: delivers products and services that enhance energy efficiency, productivity and operations. The segment includes compressed air and gas systems and services, power tools, material handling systems, fluid management systems, as well as Club Car® golf, utility and consumer low-speed vehicles.
$, millions | Q4 2019 | Q4 2018 | Y-O-Y Change | Organic Y-O-Y Change |
Bookings | $918 | $867 | 6% | (4)% |
Net Revenues | $967 | $894 | 8% | (2)% |
GAAP Operating Income | $145 | $114 | 27% | |
GAAP Operating Margin | 15.0% | 12.7% | 230 bps | |
Adjusted Operating Income | $155 | $121 | 28% | |
Adjusted Operating Margin | 16.0% | 13.6% | 240 bps | |
• | Bookings were up 6 percent and revenues were up 8 percent. Organic bookings were down 4 percent and organic revenues were down 2 percent. Solid organic bookings and revenue growth in Small Electric Vehicles was more than offset by continued softness for short-cycle equipment driven by lower short-cycle investment spending. |
• | GAAP operating margin up 230 basis points; adjusted operating margin up 240 basis points. The company's restructuring efforts, footprint optimization and execution of commercial strategies are delivering strong margin improvement and a more resilient business for the long term. |
-more-
-4-
Full-Year 2019 Results (all comparisons against the full-year 2018 unless otherwise noted)
Financial Comparisons - Full-year Continuing Operations
$, millions except EPS | 2019 | 2018 | Y-O-Y Change | Organic Y-O-Y |
Bookings | $16,327 | $16,650 | (2)% | (2)% |
Net Revenues | $16,599 | $15,668 | 6% | 6% |
GAAP Operating Income | $2,018 | $1,917 | 5% | |
GAAP Operating Margin | 12.2% | 12.2% | - | |
Adjusted Operating Income | $2,234 | $2,011 | 11% | |
Adjusted Operating Margin | 13.5% | 12.8% | 70 bps | |
GAAP Continuing EPS | $5.61 | $5.43 | 3% | |
Adjusted Continuing EPS | $6.37 | $5.61 | 14% | |
• | The company delivered strong enterprise revenue growth in 2019. |
• | Organic revenue growth was led by continued exceptional growth in North America Commercial HVAC which was up low-teens for the year. Execution of the company's strategy squarely aimed at sustainability and energy efficiency for customers paired with healthy end markets are delivering differentiated performance. |
• | Enterprise reported and organic bookings were down 2 percent. However, underlying organic bookings remained strong, up mid-single digits for the year excluding the Transport business as previously outlined and the aforementioned 4Q18 large Commercial HVAC order. |
• | GAAP operating margin flat; adjusted operating margin up 70 basis points with 24 percent operating leverage, in-line with company's leverage target. |
• | GAAP continuing EPS was up 3 percent. Adjusted continuing EPS growth was strong, up 14 percent building on 24 percent growth in 2018. |
Balance Sheet, Cash Flow and Capital Allocation
$, millions | 2019 | 2018 | Y-O-Y Change |
Cash From Continuing Operating Activities (Y-T-D) | $1,956 | $1,475 | $481 |
Free Cash Flow (Y-T-D)* | $1,839 | $1,149 | $690 |
Working Capital/Revenue* | 3.8% | 4.2% | 40 bps decrease |
Cash Balance 31 December | $1,304 | $903 | $401 |
Debt Balance 31 December | $5,573 | $4,091 | $1,482 |
• | The company delivered high quality earnings and exceptional free cash flow of $1.8 billion, or 118 percent of adjusted net earnings. |
• | In addition to funding high return-on-investment opportunities, the company executed a balanced capital allocation strategy, deploying significant capital of $1.5 billion in acquisitions, $510 million in dividends and $750 million in share repurchases. |
• | The company remains on track to complete its proposed Reverse Morris Trust transaction in early 2020 to combine the Industrial segment with Gardner Denver, creating a global leader in mission-critical flow creation and industrial solutions. The transaction will simultaneously create a pure-play global leader in climate technologies for buildings, homes and transportation, named Trane Technologies plc**. It is anticipated that Trane Technologies will trade on the New York Stock Exchange under the symbol "TT." |
-more-
-5-
Full-Year 2020 Guidance
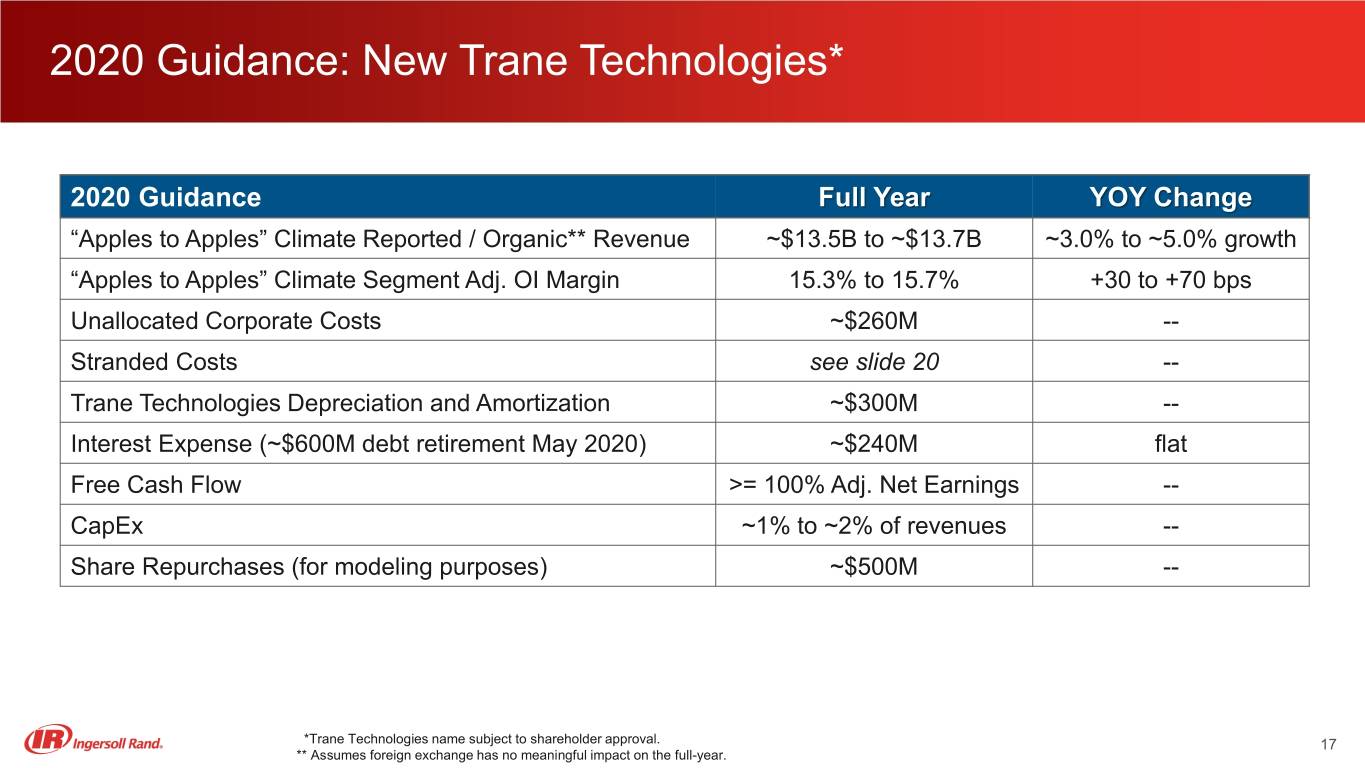
• | Full year 2020 guidance for Trane Technologies is included in the company's earnings presentation found at www.ingersollrand.com in the Investor Relations section. |
• | The company's 2020 guidance excludes the Industrial segment. Industrial segment guidance for 2020 will be given by the combined Industrial segment / Gardner Denver business after completion of the proposed transaction. |
**Trane Technologies name subject to shareholder approval.
# # #
This news release includes “forward-looking statements” which are statements that are not historical facts, including statements that relate to the mix of and demand for our products; performance of the markets in which we operate; our share repurchase program including the amount of shares to be repurchased and timing of such repurchases; our capital allocation strategy including projected acquisitions; restructuring activity; our name change; our projected 2020 full-year financial performance and targets including assumptions regarding our effective tax rate and other factors described in our guidance. Forward-looking statements also include statements that relate to the proposed Reverse Morris Trust transaction with Gardner Denver Holdings, Inc. (GDI). These forward-looking statements are based on GDI’s and Ingersoll Rand’s current expectations and are subject to risks and uncertainties, which may cause actual results to differ materially from GDI’s and Ingersoll Rand’s current expectations. Should one or more of these risks or uncertainties materialize, or should underlying assumptions prove incorrect, actual results may vary materially from those indicated or anticipated by such forward-looking statements. The inclusion of such statements should not be regarded as a representation that such plans, estimates or expectations will be achieved. Important factors that could cause actual results to differ materially from such plans, estimates or expectations include, among others, (1) that one or more closing conditions to the transaction, including certain regulatory approvals, may not be satisfied or waived, on a timely basis or otherwise, including that a governmental entity may prohibit, delay or refuse to grant approval for the consummation of the proposed transaction, may require conditions, limitations or restrictions in connection with such approvals or that the required approval by the stockholders of GDI may not be obtained; (2) the risk that the proposed transaction may not be completed on the terms or in the time frame expected by Ingersoll Rand or GDI, or at all, (3) unexpected costs, charges or expenses resulting from the proposed transaction, (4) uncertainty of the expected financial performance of the combined company following completion of the proposed transaction; (5) failure to realize the anticipated benefits of the proposed transaction, including as a result of delay in completing the proposed transaction or integrating the businesses of GDI and Ingersoll Rand Industrial, or at all, (6) the ability of the combined company to implement its business strategy; (7) difficulties and delays in the combined company and ClimateCo achieving revenue and cost synergies; (8) inability of the combined company and ClimateCo to retain and hire key personnel; (9) the occurrence of any event that could give rise to termination of the proposed transaction; (10) the risk that stockholder litigation in connection with the proposed transaction or other settlements or investigations may affect the timing or occurrence of the proposed transaction or result in significant costs of defense, indemnification and liability, (11) evolving legal, regulatory and tax regimes; (12) changes in general economic and/or industry specific conditions; (13) actions by third parties, including government agencies; and (14) other risk factors detailed from time to time in Ingersoll Rand’s and GDI’s
-more-
-6-
reports filed with the SEC, including Ingersoll Rand’s and GDI’s annual reports on Form 10-K and subsequent 10-Qs. We assume no obligation to update these forward-looking statements.
This news release also includes non-GAAP financial information which should be considered supplemental to, not a substitute for, or superior to, the financial measure calculated in accordance with GAAP. The definitions of our non-GAAP financial information and reconciliation to GAAP is attached to this news release. All data beyond the fourth quarter of 2019 are estimates.
All amounts reported within the earnings release above related to net earnings (loss), earnings (loss) from continuing operations, earnings (loss) from discontinued operations, and per share amounts are attributed to Ingersoll Rand’s ordinary shareholders.
Ingersoll Rand (NYSE:IR) advances the quality of life by creating comfortable, sustainable and efficient environments. Our people and our family of brands - including Club Car®, Ingersoll Rand®, Thermo King® and Trane® - work together to enhance the quality and comfort of air in homes and buildings; transport and protect food and perishables; and increase industrial productivity and efficiency. We are a global business committed to a world of sustainable progress and enduring results. For more information, visit ingersollrand.com.
(See Accompanying Tables)
• | Table 1: Condensed Consolidated Income Statement |
• | Table 2: Business Review |
• | Tables 3 - 8: Reconciliation of GAAP to Non-GAAP |
• | Table 9: Condensed Consolidated Balance Sheets |
• | Table 10: Condensed Consolidated Statement of Cash Flows |
• | Table 11: Balance Sheet Metrics and Free Cash Flow |
Contacts: | |
Media: | Investors: |
Perri Richman | Zac Nagle |
732-319-1024, [email protected] | 704-990-3913, [email protected] |
*Q4 Non-GAAP measures definitions
Organic bookings is defined as reported orders in the current period adjusted for the impact of currency and acquisitions. Organic revenue is defined as GAAP net revenues adjusted for the impact of currency and acquisitions.
• | Currency impacts on net revenues and bookings are measured by applying the prior year’s foreign currency exchange rates to the current period’s net revenues and bookings reported in local currency. This measure allows for a direct comparison of operating results excluding the year-over-year impact of foreign currency translation. |
-more-
-7-
Adjusted operating income in 2019 is defined as GAAP operating income plus restructuring costs, PFS acquisition-related transaction costs, PFS inventory step-up and backlog amortization and Industrial Segment separation-related costs. Adjusted operating income in 2018 is defined as GAAP operating income plus restructuring costs. Please refer to the reconciliation of GAAP to non-GAAP measures on tables 3 and 4 of the news release.
Adjusted operating margin is defined as the ratio of adjusted operating income divided by net revenues.
Adjusted earnings from continuing operations attributable to Ingersoll Rand plc (Adjusted net earnings) in 2019 is defined as GAAP earnings from continuing operations attributable to Ingersoll Rand plc plus restructuring costs, PFS acquisition-related transaction costs, PFS inventory step-up and backlog amortization, Industrial Segment separation-related costs and Industrial Segment separation activities resulting in foreign exchange losses, net of tax impacts. Adjusted net earnings in 2018 is defined as GAAP earnings from continuing operations attributable to Ingersoll Rand plc plus restructuring costs, net of tax impacts less Tax Reform non-cash measurement period adjustments and a U.S. discrete non-cash tax adjustment. Please refer to the reconciliation of GAAP to non-GAAP measures on tables 3 and 4 of the news release.
Adjusted continuing EPS in 2019 is defined as GAAP continuing EPS plus restructuring costs, PFS acquisition-related transaction costs, PFS inventory step-up and backlog amortization, Industrial Segment separation-related costs and Industrial Segment separation activities resulting in foreign exchange losses, net of tax impacts. Adjusted continuing EPS in 2018 is defined as GAAP continuing EPS plus restructuring costs, net of tax impacts plus Tax Reform non-cash measurement period adjustments less a U.S. discrete non-cash tax adjustment. Please refer to the reconciliation of GAAP to non-GAAP measures on tables 3 and 4 of the news release.
Adjusted EBITDA is defined as Adjusted operating income plus depreciation and amortization expense plus or minus other income / (expense), net.
Free cash flow in 2019 is defined as net cash provided by continuing operating activities, less capital expenditures, plus cash payments for PFS acquisition-related transaction costs, Industrial Segment separation-related costs and restructuring. Free cash flow in 2018 is defined as net cash provided by continuing operating activities, less capital expenditures plus cash payments for restructuring. In 2018, the Company updated its definition of free cash flow to exclude the impacts of discontinued operations. Please refer to the free cash flow reconciliation on table 11 of the news release.
Working capital measures a firm’s operating liquidity position and its overall effectiveness in managing the enterprises’ current accounts.
• | Working capital is calculated by adding net accounts and notes receivables and inventories and subtracting total current liabilities that exclude short term debt, dividend payables and income tax payables. |
-more-
-8-
• | Working capital as a percent of revenue is calculated by dividing the working capital balance (e.g. as of December 31) by the annualized revenue for the period (e.g. reported revenues for the three months ended December 31) multiplied by 4 to annualize for a full year. |
Adjusted effective tax rate for 2019 is defined as the ratio of income tax expense plus the tax effect of adjustments for restructuring costs, PFS acquisition-related transaction costs, PFS inventory step-up and backlog amortization, Industrial Segment separation-related costs and Industrial Segment separation activities resulting in foreign exchange losses divided by earnings from continuing operations before income taxes plus restructuring costs, PFS acquisition-related transaction costs, PFS inventory step-up and backlog amortization, Industrial Segment separation-related costs and Industrial Segment separation activities resulting in foreign exchange losses. Adjusted effective tax rate for 2018 is defined as the ratio of income tax expense minus the tax effect of Tax Reform non-cash measurement period adjustments plus a U.S. discrete non-cash tax adjustment and the tax effect of restructuring costs divided by earnings from continuing operations before income taxes plus restructuring costs. This measure allows for a direct comparison of the effective tax rate between periods.
Operating leverage is defined as the ratio of the change in adjusted operating income for the current period (e.g. Q4 2019) less the prior period (e.g. Q4 2018), divided by the change in net revenues for the current period less the prior period.
-more-
Table 1
INGERSOLL-RAND PLC
Condensed Consolidated Income Statement
(In millions, except per share amounts)
UNAUDITED
For the quarter | For the year | ||||||||||||||
ended December 31, | ended December 31, | ||||||||||||||
2019 | 2018 | 2019 | 2018 | ||||||||||||
Net revenues | $ | 4,150.9 | $ | 3,895.1 | $ | 16,598.9 | $ | 15,668.2 | |||||||
Cost of goods sold | (2,904.3 | ) | (2,745.0 | ) | (11,451.5 | ) | (10,847.6 | ) | |||||||
Selling & administrative expenses | (821.2 | ) | (703.4 | ) | (3,129.8 | ) | (2,903.2 | ) | |||||||
Operating income | 425.4 | 446.7 | 2,017.6 | 1,917.4 | |||||||||||
Interest expense | (63.3 | ) | (49.0 | ) | (243.0 | ) | (220.7 | ) | |||||||
Other income/(expense), net | (10.4 | ) | (20.4 | ) | (33.0 | ) | (36.4 | ) | |||||||
Earnings before income taxes | 351.7 | 377.3 | 1,741.6 | 1,660.3 | |||||||||||
Benefit (provision) for income taxes | (74.5 | ) | (121.3 | ) | (353.7 | ) | (281.3 | ) | |||||||
Earnings from continuing operations | 277.2 | 256.0 | 1,387.9 | 1,379.0 | |||||||||||
Discontinued operations, net of tax | 23.9 | 5.4 | 40.6 | (21.5 | ) | ||||||||||
Net earnings | 301.1 | 261.4 | 1,428.5 | 1,357.5 | |||||||||||
Less: Net earnings attributable to noncontrolling interests | (5.0 | ) | (7.4 | ) | (17.6 | ) | (19.9 | ) | |||||||
Net earnings attributable to Ingersoll-Rand plc | $ | 296.1 | $ | 254.0 | $ | 1,410.9 | $ | 1,337.6 | |||||||
Amounts attributable to Ingersoll-Rand plc | |||||||||||||||
ordinary shareholders: | |||||||||||||||
Continuing operations | $ | 272.2 | $ | 248.6 | $ | 1,370.3 | $ | 1,359.1 | |||||||
Discontinued operations | 23.9 | 5.4 | 40.6 | (21.5 | ) | ||||||||||
Net earnings | $ | 296.1 | $ | 254.0 | $ | 1,410.9 | $ | 1,337.6 | |||||||
Diluted earnings (loss) per share attributable to | |||||||||||||||
Ingersoll-Rand plc ordinary shareholders: | |||||||||||||||
Continuing operations | $ | 1.12 | $ | 1.00 | $ | 5.61 | $ | 5.43 | |||||||
Discontinued operations | 0.10 | 0.03 | 0.16 | (0.08 | ) | ||||||||||
Net earnings | $ | 1.22 | $ | 1.03 | $ | 5.77 | $ | 5.35 | |||||||
Weighted-average number of common shares outstanding | |||||||||||||||
Diluted | 242.9 | 247.7 | 244.4 | 250.1 | |||||||||||
SEE ATTACHED RELEASE FOR ADDITIONAL INFORMATION
Table 2
INGERSOLL-RAND PLC
Business Review
(In millions, except percentages)
UNAUDITED
For the quarter | For the year | ||||||||||||||
ended December 31, | ended December 31, | ||||||||||||||
2019 | 2018 | 2019 | 2018 | ||||||||||||
Climate | |||||||||||||||
Net revenues | $ | 3,183.7 | $ | 3,001.5 | $ | 13,075.9 | $ | 12,343.8 | |||||||
Segment operating income * | 398.4 | 387.5 | 1,908.5 | 1,766.2 | |||||||||||
and as a % of Net revenues | 12.5 | % | 12.9 | % | 14.6 | % | 14.3 | % | |||||||
Industrial | |||||||||||||||
Net revenues | 967.2 | 893.6 | 3,523.0 | 3,324.4 | |||||||||||
Segment operating income * | 144.7 | 113.5 | 455.0 | 405.3 | |||||||||||
and as a % of Net revenues | 15.0 | % | 12.7 | % | 12.9 | % | 12.2 | % | |||||||
Unallocated corporate expense | (117.7 | ) | (54.3 | ) | (345.9 | ) | (254.1 | ) | |||||||
Total | |||||||||||||||
Net revenues | $ | 4,150.9 | $ | 3,895.1 | $ | 16,598.9 | $ | 15,668.2 | |||||||
Consolidated operating income | $ | 425.4 | $ | 446.7 | $ | 2,017.6 | $ | 1,917.4 | |||||||
and as a % of Net revenues | 10.2 | % | 11.5 | % | 12.2 | % | 12.2 | % | |||||||
* Segment operating income is the measure of profit and loss that the Company uses to evaluate the financial performance of the business and as the basis for performance reviews, compensation and resource allocation. For these reasons, the Company believes that Segment operating income represents the most relevant measure of segment profit and loss.
SEE ATTACHED RELEASE FOR ADDITIONAL INFORMATION
Table 3
INGERSOLL-RAND PLC
Reconciliation of GAAP to non-GAAP
(In millions, except per share amounts)
UNAUDITED
For the quarter ended December 31, 2019 | For the year ended December 31, 2019 | |||||||||||||||||||||||
As | As | As | As | |||||||||||||||||||||
Reported | Adjustments | Adjusted | Reported | Adjustments | Adjusted | |||||||||||||||||||
Net revenues | $ | 4,150.9 | $ | — | $ | 4,150.9 | $ | 16,598.9 | $ | — | $ | 16,598.9 | ||||||||||||
Operating income | 425.4 | 76.2 | (a,b,c,d) | 501.6 | 2,017.6 | 216.0 | (a,b,c,d) | 2,233.6 | ||||||||||||||||
Operating margin | 10.2 | % | 12.1 | % | 12.2 | % | 13.5 | % | ||||||||||||||||
Earnings from continuing operations before income taxes | 351.7 | 78.1 | (a,b,c,d,e) | 429.8 | 1,741.6 | 217.9 | (a,b,c,d,e) | 1,959.5 | ||||||||||||||||
Provision for income taxes | (74.5 | ) | (11.3 | ) | (f) | (85.8 | ) | (353.7 | ) | (30.5 | ) | (f) | (384.2 | ) | ||||||||||
Tax rate | 21.2 | % | 20.0 | % | 20.3 | % | 19.6 | % | ||||||||||||||||
Earnings from continuing operations attributable to Ingersoll-Rand plc | $ | 272.2 | $ | 66.8 | (g) | $ | 339.0 | $ | 1,370.3 | $ | 187.4 | (g) | $ | 1,557.7 | ||||||||||
Diluted earnings per common share | ||||||||||||||||||||||||
Continuing operations | $ | 1.12 | $ | 0.28 | $ | 1.40 | $ | 5.61 | $ | 0.76 | $ | 6.37 | ||||||||||||
Weighted-average number of common shares outstanding | ||||||||||||||||||||||||
Diluted | 242.9 | — | 242.9 | 244.4 | — | 244.4 | ||||||||||||||||||
Detail of Adjustments: | ||||||||||||||||||||||||
(a) | Restructuring costs (COGS & SG&A) | $ | 22.1 | $ | 90.1 | |||||||||||||||||||
(b) | PFS acquisition-related transaction costs (SG&A) | 0.2 | 12.9 | |||||||||||||||||||||
(c) | PFS inventory step-up and backlog amortization (COGS & SG&A) | 4.4 | 18.4 | |||||||||||||||||||||
(d) | Industrial Segment separation-related costs (SG&A) | 49.5 | 94.6 | |||||||||||||||||||||
(e) | Industrial Segment separation activities resulting in foreign exchange losses | 1.9 | 1.9 | |||||||||||||||||||||
(f) | Tax impact of adjustments (a,b,c,d,e) | (11.3 | ) | (30.5 | ) | |||||||||||||||||||
(g) | Impact of adjustments on earnings from continuing operations attributable to Ingersoll-Rand plc | $ | 66.8 | $ | 187.4 | |||||||||||||||||||
Total impact of adjustments on cost of goods sold | 15.0 | 80.1 | ||||||||||||||||||||||
Total impact of adjustments on selling & administrative expenses | 61.2 | 135.9 | ||||||||||||||||||||||
Total impact of adjustments on operating income | $ | 76.2 | $ | 216.0 | ||||||||||||||||||||
SEE ATTACHED RELEASE FOR ADDITIONAL INFORMATION
Table 4
INGERSOLL-RAND PLC
Reconciliation of GAAP to non-GAAP
(In millions, except per share amounts)
UNAUDITED
For the quarter ended December 31, 2018 | For the year ended December 31, 2018 | |||||||||||||||||||||||
As | As | As | As | |||||||||||||||||||||
Reported | Adjustments | Adjusted | Reported | Adjustments | Adjusted | |||||||||||||||||||
Net revenues | $ | 3,895.1 | $ | — | $ | 3,895.1 | $ | 15,668.2 | $ | — | $ | 15,668.2 | ||||||||||||
Operating income | 446.7 | 21.8 | (a) | 468.5 | 1,917.4 | 93.4 | (a) | 2,010.8 | ||||||||||||||||
Operating margin | 11.5 | % | 12.0 | % | 12.2 | % | 12.8 | % | ||||||||||||||||
Earnings from continuing operations before income taxes | 377.3 | 21.8 | (a,b) | 399.1 | 1,660.3 | 110.0 | (a,b) | 1,770.3 | ||||||||||||||||
Benefit (provision) for income taxes | (121.3 | ) | 55.4 | (c,d,e) | (65.9 | ) | (281.3 | ) | (66.0 | ) | (c,d,e) | (347.3 | ) | |||||||||||
Tax rate | 32.1 | % | 16.5 | % | 16.9 | % | 19.6 | % | ||||||||||||||||
Earnings from continuing operations attributable to Ingersoll-Rand plc | $ | 248.6 | $ | 77.2 | (f) | $ | 325.8 | $ | 1,359.1 | $ | 44.0 | (f) | $ | 1,403.1 | ||||||||||
Diluted earnings per common share | ||||||||||||||||||||||||
Continuing operations | $ | 1.00 | $ | 0.32 | $ | 1.32 | $ | 5.43 | $ | 0.18 | $ | 5.61 | ||||||||||||
Weighted-average number of common shares outstanding | ||||||||||||||||||||||||
Diluted | 247.7 | — | 247.7 | 250.1 | — | 250.1 | ||||||||||||||||||
Detail of Adjustments: | ||||||||||||||||||||||||
(a) | Restructuring costs (COGS & SG&A) | $ | 21.8 | $ | 93.4 | |||||||||||||||||||
(b) | Debt redemption premium and related charges | — | 16.6 | |||||||||||||||||||||
(c) | Tax impact of adjustments (a,b) | (4.6 | ) | (22.0 | ) | |||||||||||||||||||
(d) | Tax Reform non-cash measurement period adjustments | 66.5 | (9.0 | ) | ||||||||||||||||||||
(e) | U.S. discrete non-cash tax adjustment | (6.5 | ) | (35.0 | ) | |||||||||||||||||||
(f) | Impact of adjustments on earnings from continuing operations attributable to Ingersoll-Rand plc | $ | 77.2 | $ | 44.0 | |||||||||||||||||||
Total impact of adjustments on cost of goods sold | 17.5 | 72.3 | ||||||||||||||||||||||
Total impact of adjustments on selling & administrative expenses | 4.3 | 21.1 | ||||||||||||||||||||||
Total impact of adjustments on operating income | $ | 21.8 | $ | 93.4 | ||||||||||||||||||||
SEE ATTACHED RELEASE FOR ADDITIONAL INFORMATION
Table 5
INGERSOLL-RAND PLC
Reconciliation of GAAP to non-GAAP
(In millions)
UNAUDITED
For the quarter ended December 31, 2019 | For the quarter ended December 31, 2018 | ||||||||||||
As Reported | Margin | As Reported | Margin | ||||||||||
Climate | |||||||||||||
Net revenues | $ | 3,183.7 | $ | 3,001.5 | |||||||||
Segment operating income | $ | 398.4 | 12.5 | % | $ | 387.5 | 12.9 | % | |||||
Restructuring | 15.6 | 0.5 | % | 11.1 | 0.4 | % | |||||||
Adjusted operating income * | 414.0 | 13.0 | % | 398.6 | 13.3 | % | |||||||
Depreciation and amortization | 65.8 | 2.1 | % | 62.3 | 2.1 | % | |||||||
Other income/(expense), net | 0.1 | — | % | (3.9 | ) | (0.2 | )% | ||||||
Adjusted EBITDA * | $ | 479.9 | 15.1 | % | $ | 457.0 | 15.2 | % | |||||
Industrial | |||||||||||||
Net revenues | $ | 967.2 | $ | 893.6 | |||||||||
Segment operating income | $ | 144.7 | 15.0 | % | $ | 113.5 | 12.7 | % | |||||
Restructuring/Other (1) | 9.9 | 1.0 | % | 7.9 | 0.9 | % | |||||||
Adjusted operating income | 154.6 | 16.0 | % | 121.4 | 13.6 | % | |||||||
Depreciation and amortization (2) | 28.2 | 2.9 | % | 18.6 | 2.1 | % | |||||||
Other income/(expense), net | (0.6 | ) | (0.1 | )% | (2.9 | ) | (0.4 | )% | |||||
Adjusted EBITDA | $ | 182.2 | 18.8 | % | $ | 137.1 | 15.3 | % | |||||
Corporate | |||||||||||||
Unallocated corporate expense | $ | (117.7 | ) | $ | (54.3 | ) | |||||||
Restructuring/Other (1) | 50.7 | 2.8 | |||||||||||
Adjusted corporate expense | (67.0 | ) | (51.5 | ) | |||||||||
Depreciation and amortization | 7.2 | 7.6 | |||||||||||
Other income/(expense), net (3) | (8.0 | ) | (13.6 | ) | |||||||||
Adjusted EBITDA | $ | (67.8 | ) | $ | (57.5 | ) | |||||||
Total Company | |||||||||||||
Net revenues | $ | 4,150.9 | $ | 3,895.1 | |||||||||
Operating income | $ | 425.4 | 10.2 | % | $ | 446.7 | 11.5 | % | |||||
Restructuring/Other (1) | 76.2 | 1.9 | % | 21.8 | 0.5 | % | |||||||
Adjusted operating income | 501.6 | 12.1 | % | 468.5 | 12.0 | % | |||||||
Depreciation and amortization (2) | 101.2 | 2.4 | % | 88.5 | 2.3 | % | |||||||
Other income/(expense), net (3) | (8.5 | ) | (0.2 | )% | (20.4 | ) | (0.5 | )% | |||||
Adjusted EBITDA | $ | 594.3 | 14.3 | % | $ | 536.6 | 13.8 | % | |||||
*Represents a non-GAAP measure, refer to pages 6-8 in the Earnings Release for definitions.
(1)Other within Industrial includes PFS inventory step-up and backlog amortization. Other within Corporate includes PFS acquisition-related transaction costs and Industrial Segment separation-related costs.
(2)Depreciation and amortization excludes PFS backlog amortization of $4.4 million which has been accounted for in the Restructuring/Other line.
(3)Other income/(expense), net adjusted to exclude Industrial Segment separation activities resulting in foreign exchange losses of $1.9 million.
SEE ATTACHED RELEASE FOR ADDITIONAL INFORMATION
Table 6
INGERSOLL-RAND PLC
Reconciliation of GAAP to non-GAAP
(In millions)
UNAUDITED
For the year ended December 31, 2019 | For the year ended December 31, 2018 | ||||||||||||
As Reported | Margin | As Reported | Margin | ||||||||||
Climate | |||||||||||||
Net revenues | $ | 13,075.9 | $ | 12,343.8 | |||||||||
Segment operating income | $ | 1,908.5 | 14.6 | % | $ | 1,766.2 | 14.3 | % | |||||
Restructuring | 50.8 | 0.4 | % | 34.1 | 0.3 | % | |||||||
Adjusted operating income * | 1,959.3 | 15.0 | % | 1,800.3 | 14.6 | % | |||||||
Depreciation and amortization | 258.0 | 2.0 | % | 252.0 | 2.0 | % | |||||||
Other income/(expense), net | (24.7 | ) | (0.2 | )% | (10.9 | ) | (0.1 | )% | |||||
Adjusted EBITDA * | $ | 2,192.6 | 16.8 | % | $ | 2,041.4 | 16.5 | % | |||||
Industrial | |||||||||||||
Net revenues | $ | 3,523.0 | $ | 3,324.4 | |||||||||
Segment operating income | $ | 455.0 | 12.9 | % | $ | 405.3 | 12.2 | % | |||||
Restructuring/Other (1) | 55.9 | 1.6 | % | 49.9 | 1.5 | % | |||||||
Adjusted operating income | 510.9 | 14.5 | % | 455.2 | 13.7 | % | |||||||
Depreciation and amortization (2) | 97.6 | 2.8 | % | 79.2 | 2.4 | % | |||||||
Other income/(expense), net | (5.0 | ) | (0.2 | )% | (8.3 | ) | (0.3 | )% | |||||
Adjusted EBITDA | $ | 603.5 | 17.1 | % | $ | 526.1 | 15.8 | % | |||||
Corporate | |||||||||||||
Unallocated corporate expense | $ | (345.9 | ) | $ | (254.1 | ) | |||||||
Restructuring/Other (1) | 109.3 | 9.4 | |||||||||||
Adjusted corporate expense | (236.6 | ) | (244.7 | ) | |||||||||
Depreciation and amortization | 30.8 | 30.3 | |||||||||||
Other income/(expense), net (3) | (1.4 | ) | (17.2 | ) | |||||||||
Adjusted EBITDA | $ | (207.2 | ) | $ | (231.6 | ) | |||||||
Total Company | |||||||||||||
Net revenues | $ | 16,598.9 | $ | 15,668.2 | |||||||||
Operating income | $ | 2,017.6 | 12.2 | % | $ | 1,917.4 | 12.2 | % | |||||
Restructuring/Other (1) | 216.0 | 1.3 | % | 93.4 | 0.6 | % | |||||||
Adjusted operating income | 2,233.6 | 13.5 | % | 2,010.8 | 12.8 | % | |||||||
Depreciation and amortization (2) | 386.4 | 2.3 | % | 361.5 | 2.3 | % | |||||||
Other income/(expense), net (3) | (31.1 | ) | (0.2 | )% | (36.4 | ) | (0.2 | )% | |||||
Adjusted EBITDA | $ | 2,588.9 | 15.6 | % | $ | 2,335.9 | 14.9 | % | |||||
*Represents a non-GAAP measure, refer to pages 6-8 in the Earnings Release for definitions.
(1)Other within Industrial includes PFS inventory step-up and backlog amortization. Other within Corporate includes PFS acquisition-related transaction costs and Industrial Segment separation-related costs.
(2)Depreciation and amortization excludes PFS backlog amortization of $11 million which has been accounted for in the Restructuring/Other line.
(3)Other income/(expense), net adjusted to exclude Industrial Segment separation activities resulting in foreign exchange losses of $1.9 million.
SEE ATTACHED RELEASE FOR ADDITIONAL INFORMATION
Table 7
INGERSOLL-RAND PLC
Reconciliation of GAAP to non-GAAP
(In millions)
UNAUDITED
For the quarter | |||||||
ended December 31, | |||||||
2019 | 2018 | ||||||
Total Company | |||||||
Adjusted EBITDA * | $ | 594.3 | $ | 536.6 | |||
Less: items to reconcile adjusted EBITDA to net earnings attributable to Ingersoll-Rand plc | |||||||
Depreciation and amortization (1) | (101.2 | ) | (88.5 | ) | |||
Interest expense | (63.3 | ) | (49.0 | ) | |||
Benefit (provision) for income taxes | (74.5 | ) | (121.3 | ) | |||
Restructuring | (22.1 | ) | (21.8 | ) | |||
PFS acquisition-related transaction costs | (0.2 | ) | — | ||||
PFS inventory step-up and backlog amortization | (4.4 | ) | — | ||||
Industrial Segment separation-related costs | (49.5 | ) | — | ||||
Industrial Segment separation activities resulting in foreign exchange losses | (1.9 | ) | — | ||||
Discontinued operations, net of tax | 23.9 | 5.4 | |||||
Net earnings attributable to noncontrolling interests | (5.0 | ) | (7.4 | ) | |||
Net earnings attributable to Ingersoll-Rand plc | $ | 296.1 | $ | 254.0 | |||
*Represents a non-GAAP measure, refer to pages 6-8 in the Earnings Release for definitions.
(1)Depreciation and amortization excludes PFS backlog amortization of $4.4 million which has been accounted for in the PFS inventory step-up and backlog amortization line.
SEE ATTACHED RELEASE FOR ADDITIONAL INFORMATION
Table 8
INGERSOLL-RAND PLC
Reconciliation of GAAP to non-GAAP
(In millions)
UNAUDITED
For the year | |||||||
ended December 31, | |||||||
2019 | 2018 | ||||||
Total Company | |||||||
Adjusted EBITDA * | $ | 2,588.9 | $ | 2,335.9 | |||
Less: items to reconcile adjusted EBITDA to net earnings attributable to Ingersoll-Rand plc | |||||||
Depreciation and amortization (1) | (386.4 | ) | (361.5 | ) | |||
Interest expense | (243.0 | ) | (220.7 | ) | |||
Benefit (provision) for income taxes | (353.7 | ) | (281.3 | ) | |||
Restructuring | (90.1 | ) | (93.4 | ) | |||
PFS acquisition-related transaction costs | (12.9 | ) | — | ||||
PFS inventory step-up and backlog amortization | (18.4 | ) | — | ||||
Industrial Segment separation-related costs | (94.6 | ) | — | ||||
Industrial Segment separation activities resulting in foreign exchange losses | (1.9 | ) | — | ||||
Discontinued operations, net of tax | 40.6 | (21.5 | ) | ||||
Net earnings attributable to noncontrolling interests | (17.6 | ) | (19.9 | ) | |||
Net earnings attributable to Ingersoll-Rand plc | $ | 1,410.9 | $ | 1,337.6 | |||
*Represents a non-GAAP measure, refer to pages 6-8 in the Earnings Release for definitions.
(1)Depreciation and amortization excludes PFS backlog amortization of $11 million which has been accounted for in the PFS inventory step-up and backlog amortization line.
SEE ATTACHED RELEASE FOR ADDITIONAL INFORMATION
Table 9
INGERSOLL-RAND PLC
Condensed Consolidated Balance Sheets
(In millions)
December 31, | December 31, | ||||||
2019 | 2018 | ||||||
ASSETS | UNAUDITED | ||||||
Cash and cash equivalents | $ | 1,303.6 | $ | 903.4 | |||
Accounts and notes receivable, net | 2,798.1 | 2,679.2 | |||||
Inventories | 1,712.2 | 1,677.8 | |||||
Other current assets | 403.3 | 471.6 | |||||
Total current assets | 6,217.2 | 5,732.0 | |||||
Property, plant and equipment, net | 1,806.2 | 1,730.8 | |||||
Goodwill | 6,783.1 | 5,959.5 | |||||
Intangible assets, net | 4,148.8 | 3,634.7 | |||||
Other noncurrent assets | 1,537.0 | 857.9 | |||||
Total assets | $ | 20,492.3 | $ | 17,914.9 | |||
LIABILITIES AND EQUITY | |||||||
Accounts payable | $ | 1,809.2 | $ | 1,705.3 | |||
Accrued expenses and other current liabilities | 2,402.2 | 2,259.8 | |||||
Short-term borrowings and current maturities of long-term debt | 650.5 | 350.6 | |||||
Total current liabilities | 4,861.9 | 4,315.7 | |||||
Long-term debt | 4,922.9 | 3,740.7 | |||||
Other noncurrent liabilities | 3,395.1 | 2,793.7 | |||||
Shareholders' Equity | 7,312.4 | 7,064.8 | |||||
Total liabilities and equity | $ | 20,492.3 | $ | 17,914.9 | |||
SEE ATTACHED RELEASE FOR ADDITIONAL INFORMATION
Table 10
INGERSOLL-RAND PLC
Condensed Consolidated Statement of Cash Flows
(In millions)
UNAUDITED
For the year | |||||||
ended December 31, | |||||||
2019 | 2018 | ||||||
Operating Activities | |||||||
Earnings from continuing operations | $ | 1,387.9 | $ | 1,379.0 | |||
Depreciation and amortization | 397.4 | 361.5 | |||||
Changes in assets and liabilities and other non-cash items | 171.0 | (266.0 | ) | ||||
Net cash provided by (used in) continuing operating activities | 1,956.3 | 1,474.5 | |||||
Net cash provided by (used in) discontinued operating activities | (36.8 | ) | (66.7 | ) | |||
Net cash provided by (used in) operating activities | 1,919.5 | 1,407.8 | |||||
Investing Activities | |||||||
Capital expenditures | (254.1 | ) | (365.6 | ) | |||
Acquisition and equity method investments, net of cash acquired, and other | (1,525.9 | ) | (263.8 | ) | |||
Net cash provided by (used in) investing activities | (1,780.0 | ) | (629.4 | ) | |||
Financing Activities | |||||||
Short-term borrowings, net | — | (6.4 | ) | ||||
Long-term borrowings, net of payments | 1,490.4 | 24.0 | |||||
Dividends paid to ordinary shareholders | (510.1 | ) | (479.5 | ) | |||
Repurchase of ordinary shares | (750.1 | ) | (900.2 | ) | |||
Other financing activities, net | 40.3 | (16.7 | ) | ||||
Net cash provided by (used in) financing activities | 270.5 | (1,378.8 | ) | ||||
Effect of exchange rate changes on cash and cash equivalents | (9.8 | ) | (45.6 | ) | |||
Net increase (decrease) in cash and cash equivalents | 400.2 | (646.0 | ) | ||||
Cash and cash equivalents - beginning of period | 903.4 | 1,549.4 | |||||
Cash and cash equivalents - end of period | $ | 1,303.6 | $ | 903.4 | |||
SEE ATTACHED RELEASE FOR ADDITIONAL INFORMATION
Table 11
INGERSOLL-RAND PLC
Balance Sheet Metrics and Free Cash Flow
($ in millions)
UNAUDITED
December 31, | December 31, | |||||||
2019 | 2018 | |||||||
Net Receivables | $ | 2,798 | $ | 2,679 | ||||
Days Sales Outstanding | 61.5 | 62.8 | ||||||
Net Inventory | $ | 1,712 | $ | 1,678 | ||||
Inventory Turns | 6.8 | 6.5 | ||||||
Accounts Payable | $ | 1,809 | $ | 1,705 | ||||
Days Payable Outstanding | 56.8 | 56.7 | ||||||
-------------------------------------------------------------------------------------------------------------------------------------------------------------------- | ||||||||
Year ended | Year ended | |||||||
December 31, 2019 | December 31, 2018 | |||||||
Cash flow provided by continuing operating activities | $ | 1,956.3 | $ | 1,474.5 | ||||
Capital expenditures | (254.1 | ) | (365.6 | ) | ||||
Cash payments for PFS acquisition-related transaction costs | 12.6 | — | ||||||
Cash payments for Industrial Segment separation-related costs | 39.2 | — | ||||||
Cash payments for restructuring | 84.7 | 39.8 | ||||||
Free cash flow* | $ | 1,838.7 | $ | 1,148.7 | ||||
Adjusted earnings from continuing operations attributable to Ingersoll-Rand plc | $ | 1,557.7 | $ | 1,403.1 | ||||
Free cash flow as a percent of adjusted net earnings | 118 | % | 82 | % | ||||
*Represents a non-GAAP measure, refer to pages 6-8 in the Earnings Release for definitions.
SEE ATTACHED RELEASE FOR ADDITIONAL INFORMATION