Two Harbors Investment Corp. Reports Fourth Quarter 2021 Financial Results
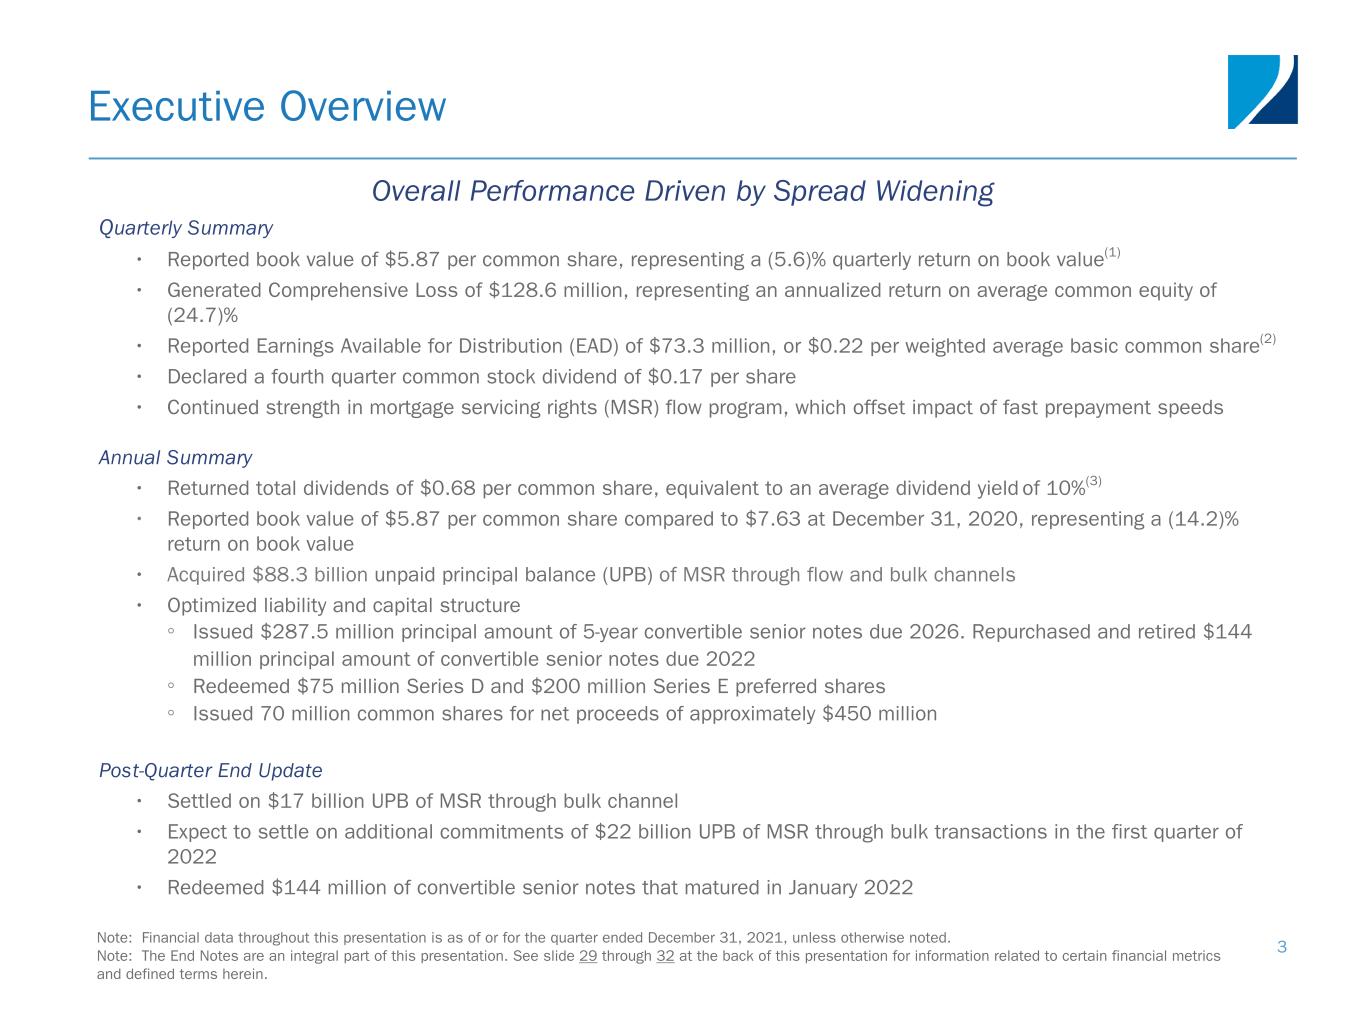
Overall Performance Driven by Spread Widening
NEW YORK, February 9, 2022 - Two Harbors Investment Corp. (NYSE: TWO), an Agency + MSR mortgage real estate investment trust (REIT), today announced its financial results for the quarter ended December 31, 2021.
Quarterly Summary
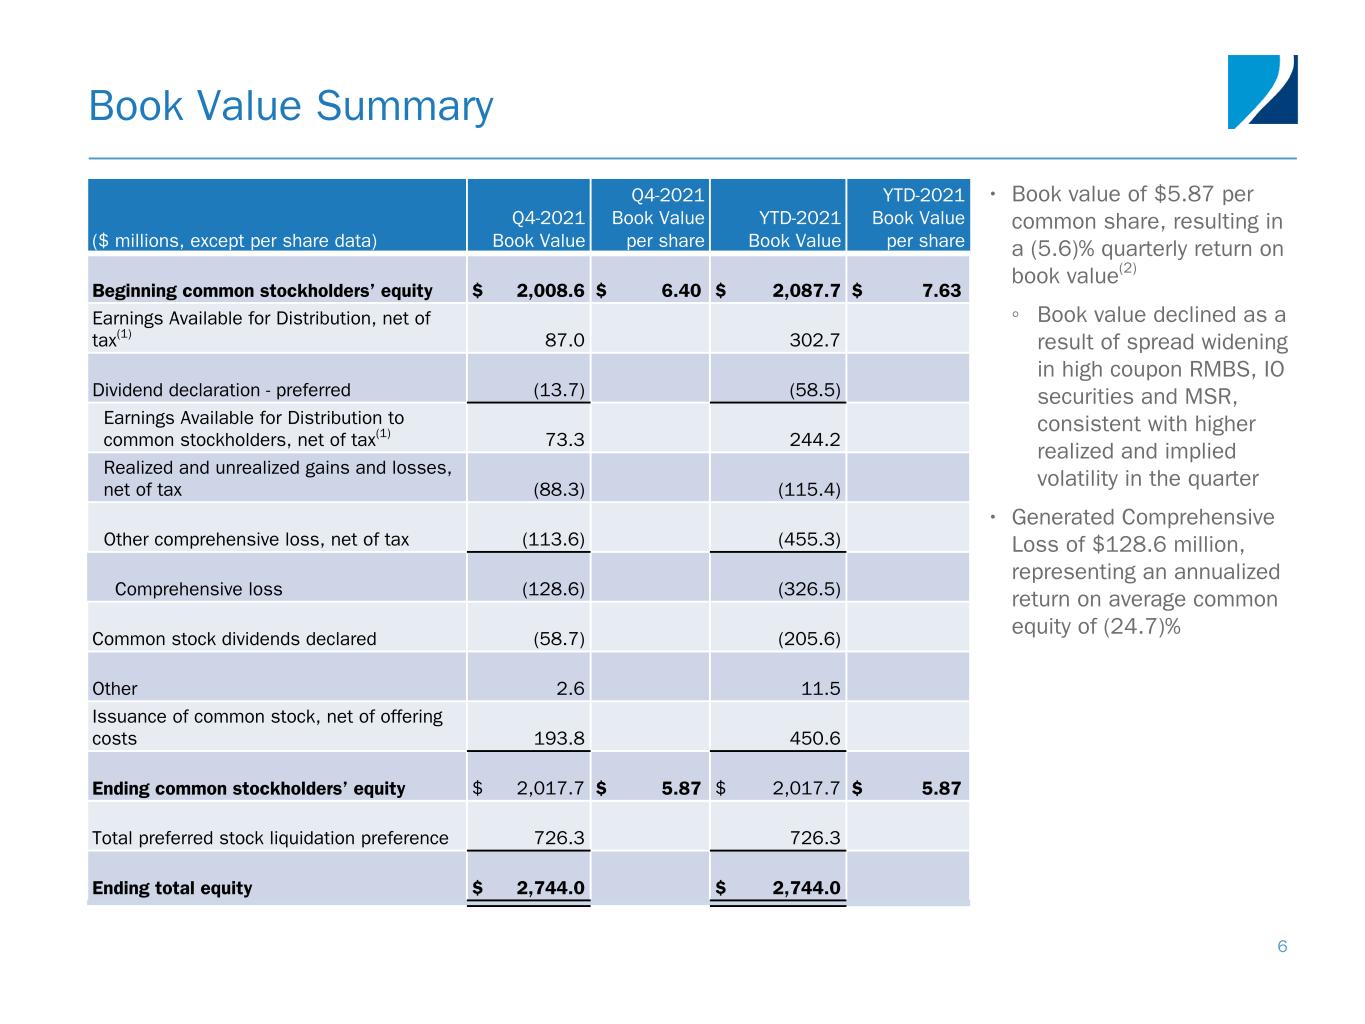
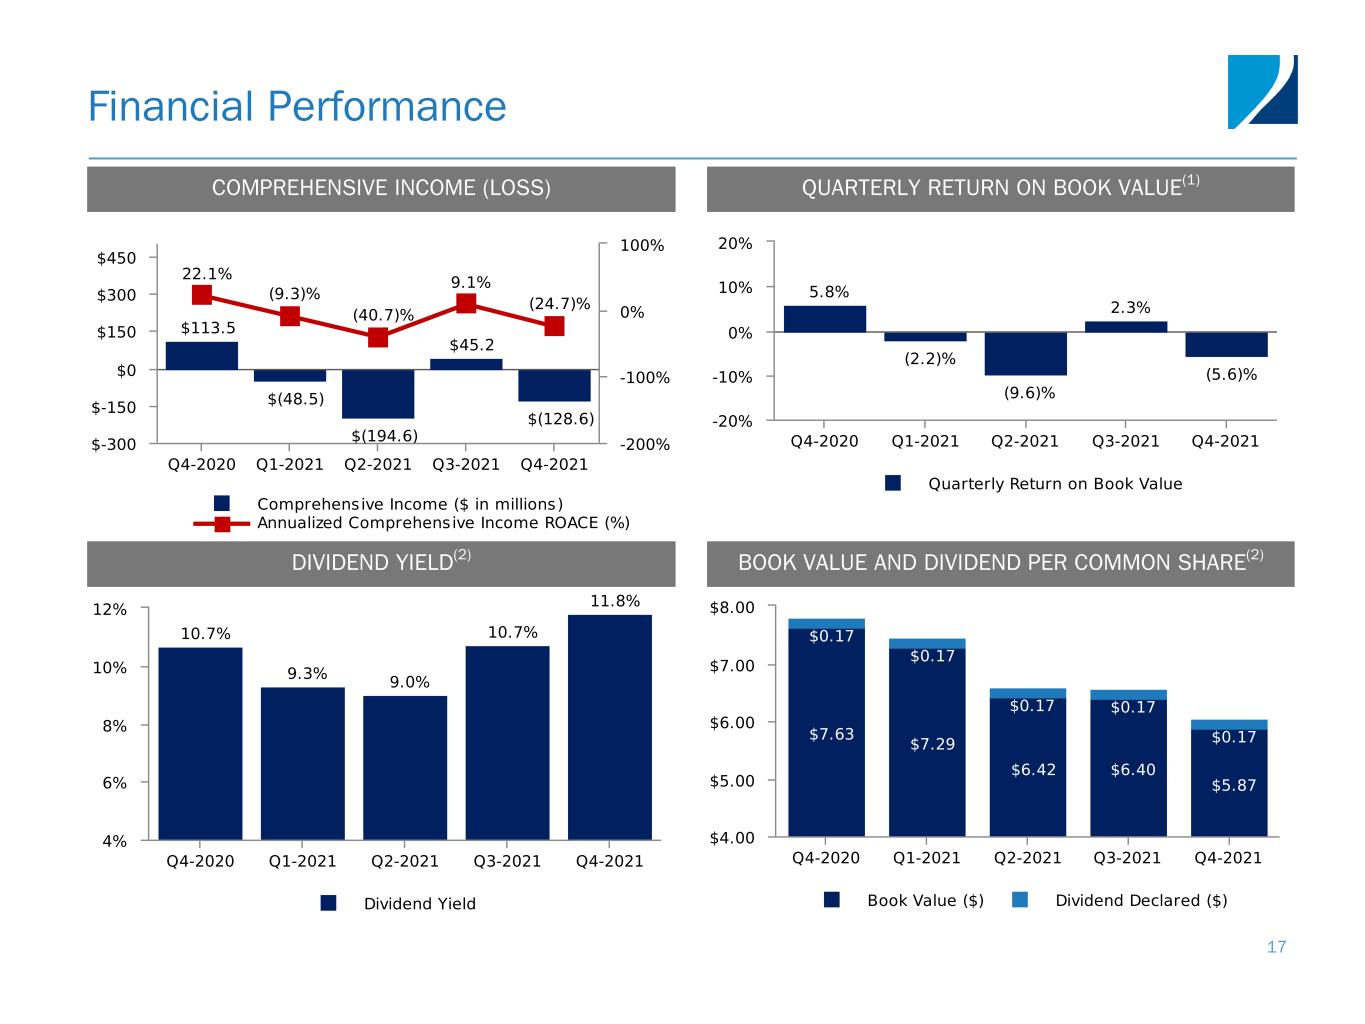
•Reported book value of $5.87 per common share, representing a (5.6)% quarterly return on book value(1)
•Generated Comprehensive Loss of $128.6 million, representing an annualized return on average common equity of (24.7)%
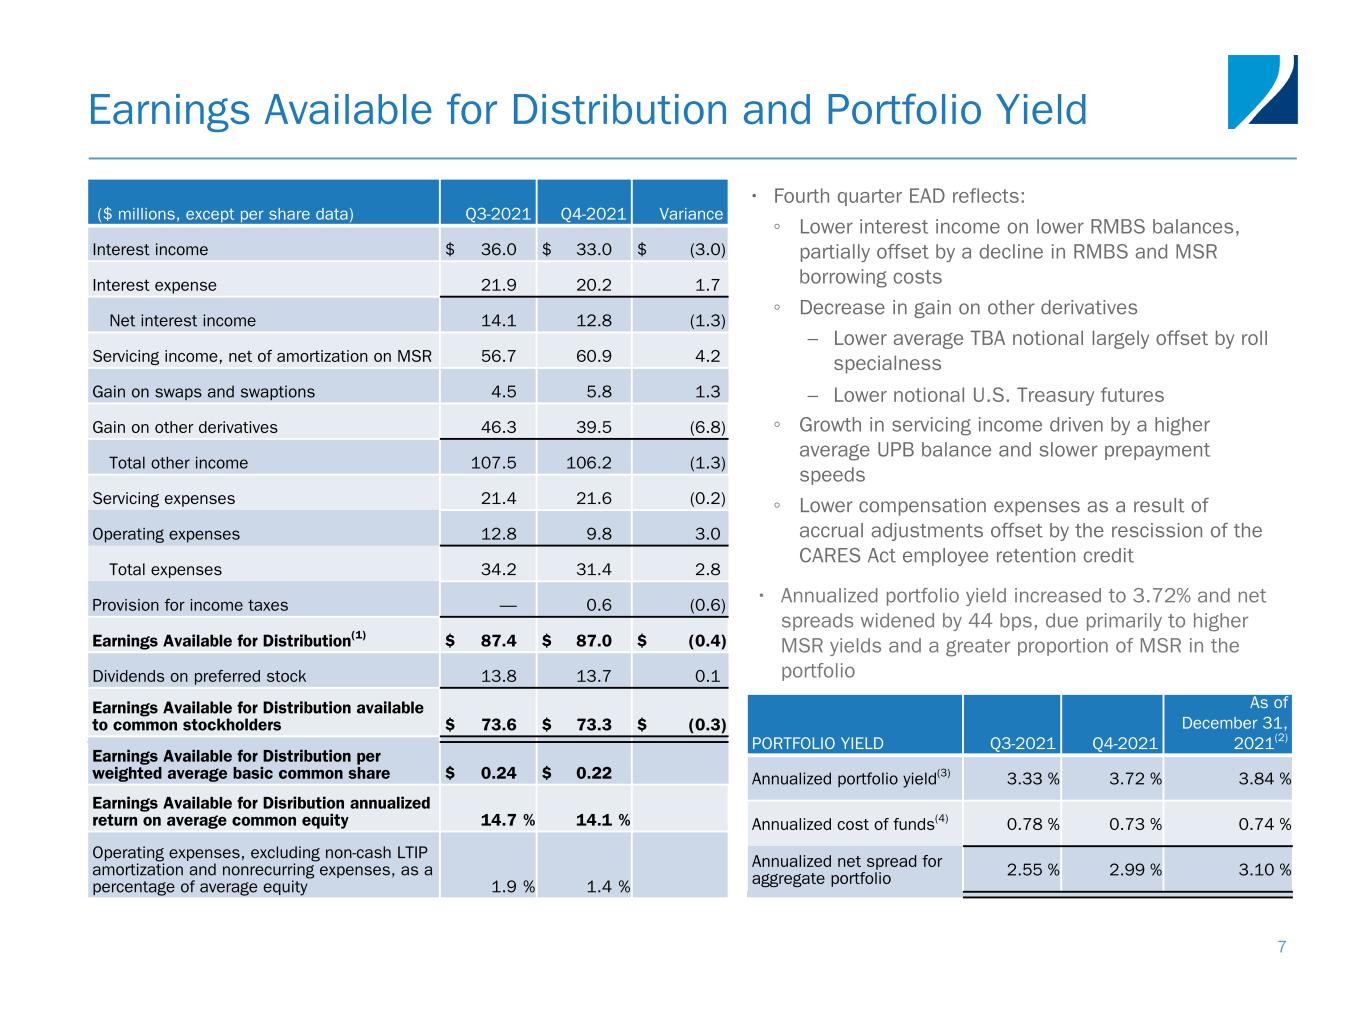
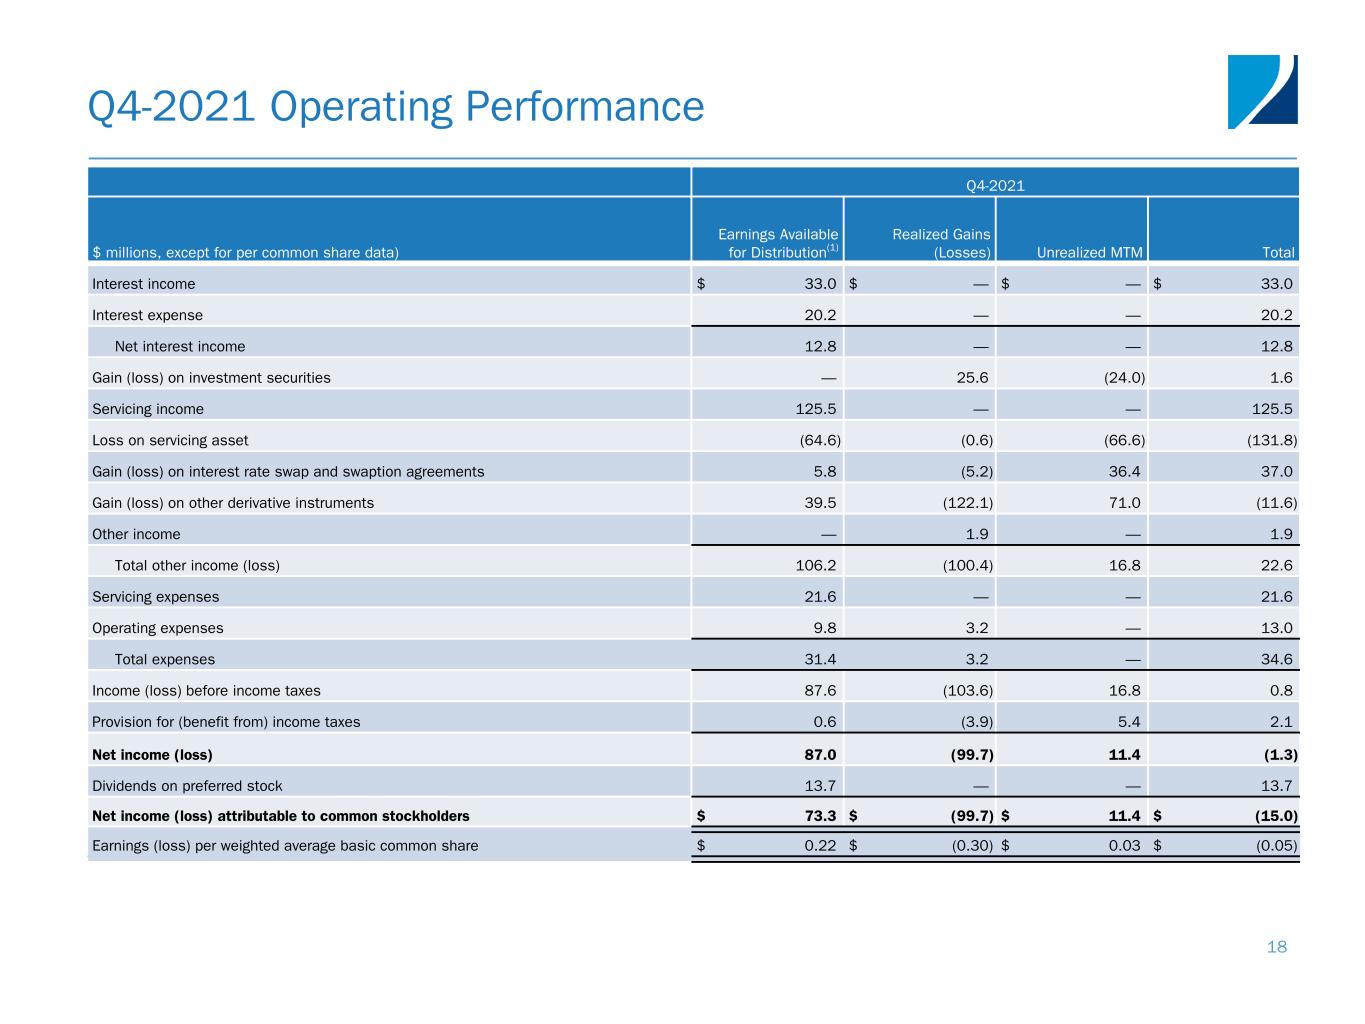
•Reported Earnings Available for Distribution (EAD) of $73.3 million, or $0.22 per weighted average basic common share(2)
•Declared a fourth quarter common stock dividend of $0.17 per share
•Continued strength in mortgage servicing rights (MSR) flow sale program, which offset impact of fast prepayment speeds
Annual Summary
•Returned total dividends of $0.68 per common share, equivalent to an average dividend yield of 10%(3)
•Reported book value of $5.87 per common share compared to $7.63 at December 31, 2020, representing a (14.2)% return on book value
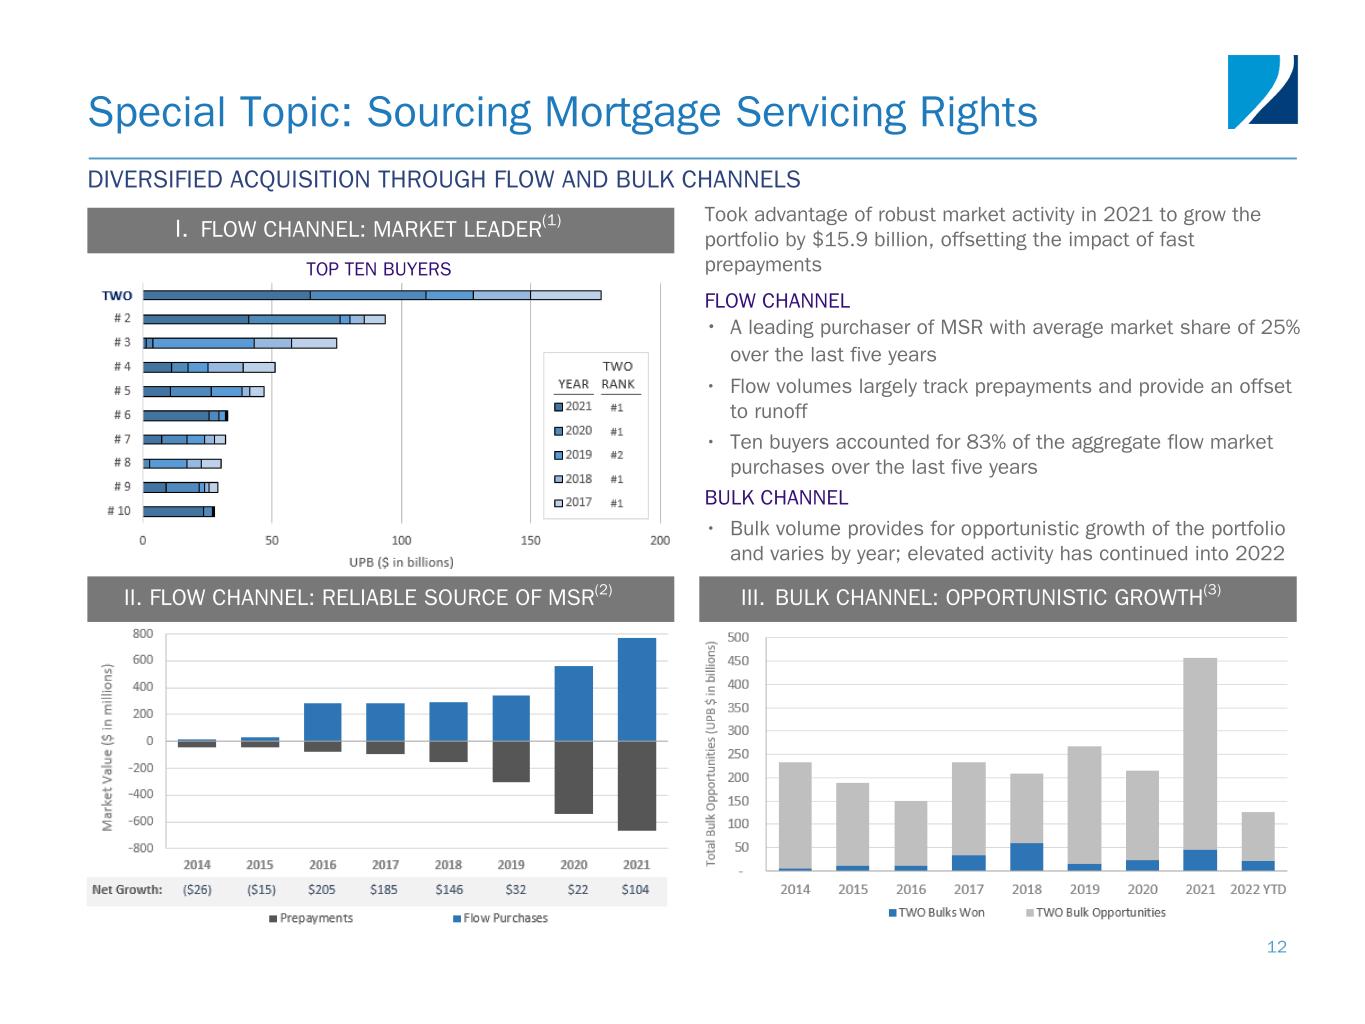
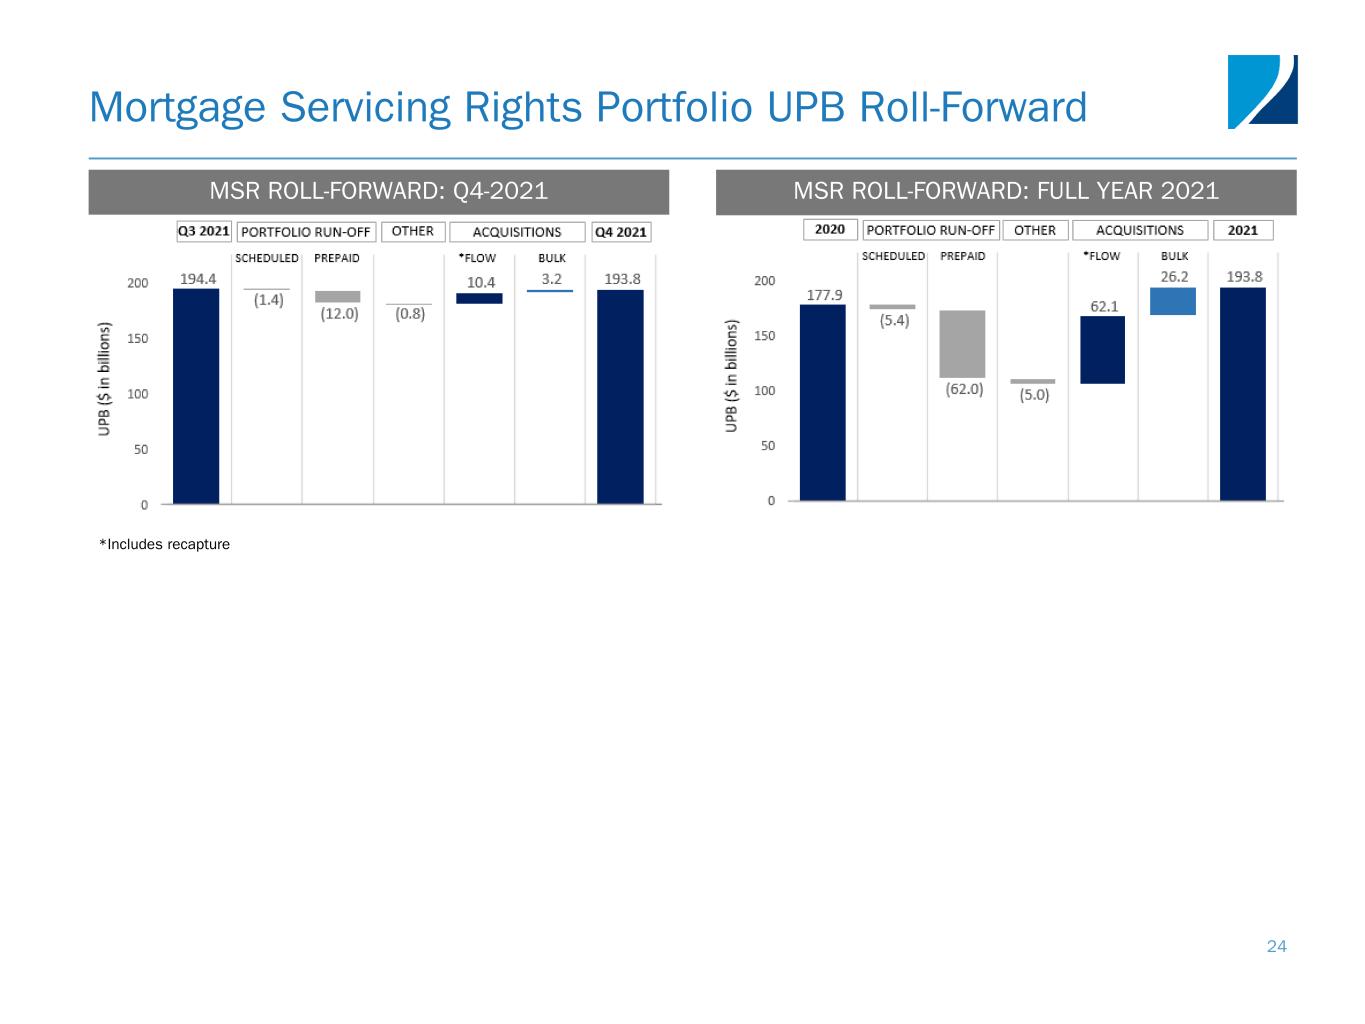
•Acquired $88.3 billion unpaid principal balance (UPB) of MSR through flow and bulk channels
•Optimized liability and capital structure
◦Issued $287.5 million principal amount of 5-year convertible senior notes due 2026. Repurchased and retired $144 million principal amount of convertible senior notes due 2022
◦Redeemed $75 million Series D and $200 million Series E preferred shares
◦Issued 70 million of common shares for net proceeds of approximately $450 million
Post-Quarter End Update
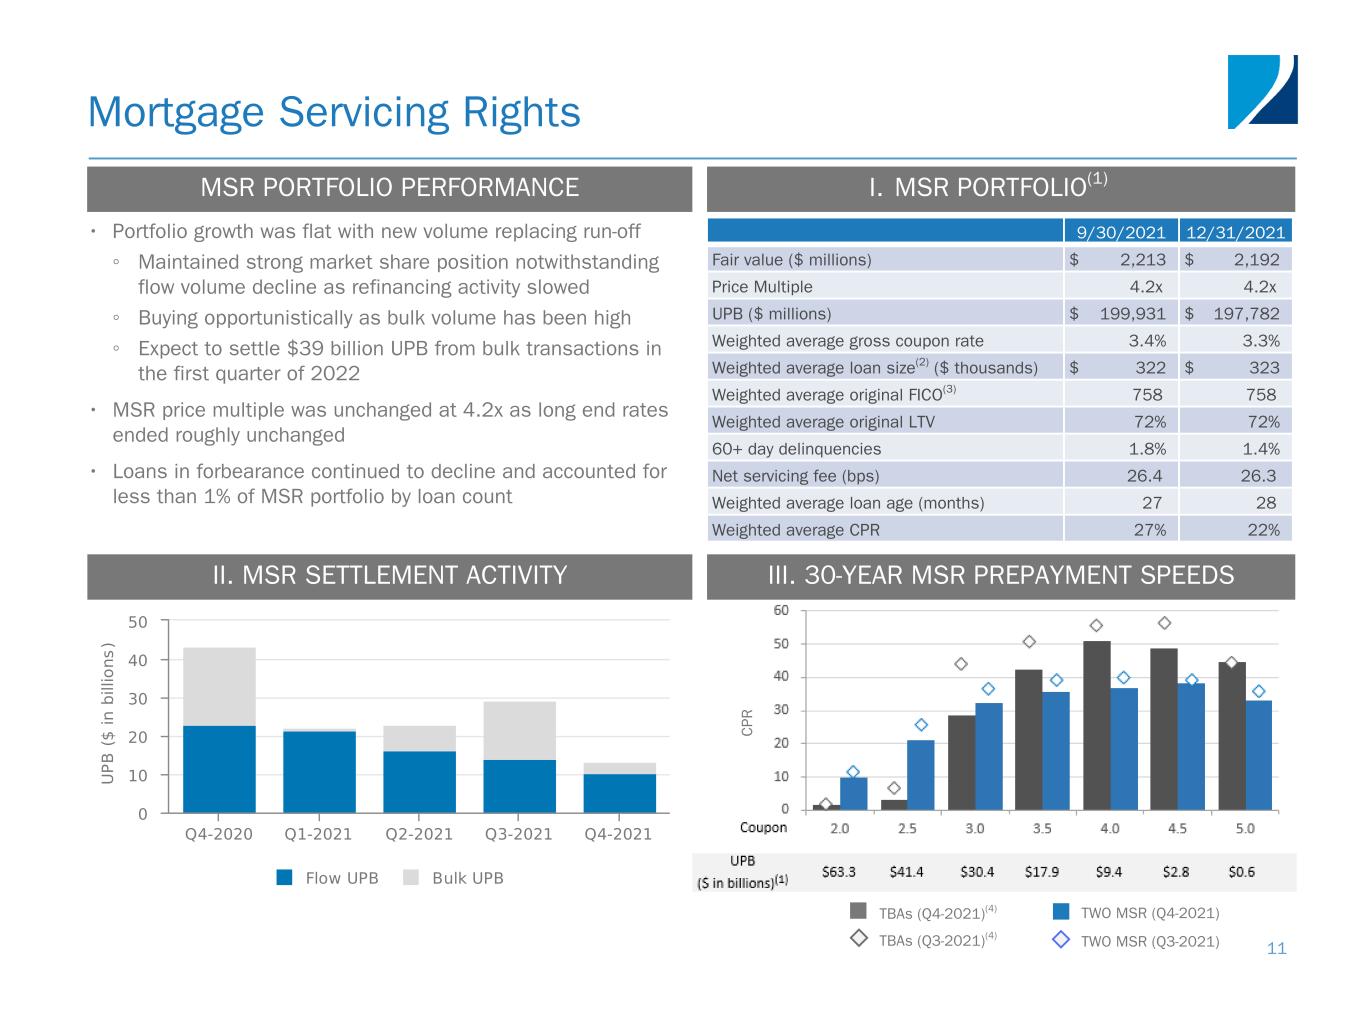
•Settled on $17 billion UPB of MSR through bulk channel
•Expect to settle on additional commitments of $22 billion UPB of MSR through bulk transactions in the first quarter of 2022
•Redeemed $144 million of convertible notes that matured in January 2022
“Our portfolio performance was impacted by spread widening and higher volatility during the fourth quarter. While the investment environment for RMBS was challenging, we capitalized on opportunities to purchase MSR at attractive levels.” stated Bill Greenberg, Two Harbors’ President, Chief Executive Officer and Chief Investment Officer. “With the Federal Reserve firmly on the path of quantitative tightening, we are well-positioned to deploy capital into a more constructive investing environment and are optimistic about the forward outlook for Two Harbors and our paired Agency + MSR strategy.”
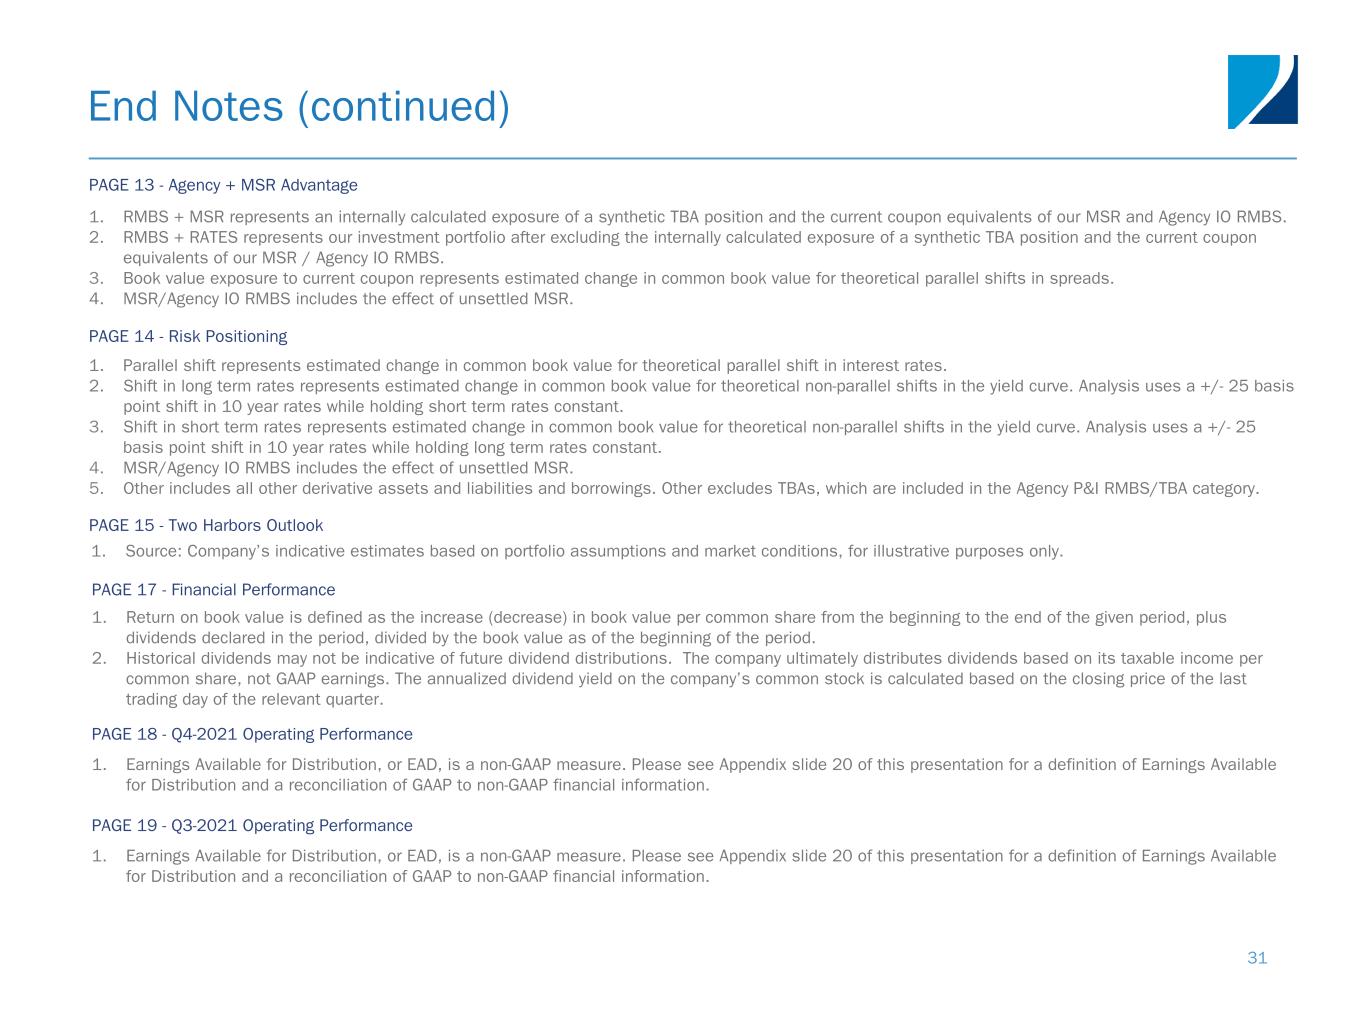
(1) Return on book value is defined as the increase (decrease) in book value per common share from the beginning to the end of the given period, plus dividends declared in the period, divided by book value as of the beginning of the period.
(2) Earnings Available for Distribution is a non-GAAP measure. Please see page 11 for a definition of Earnings Available for Distribution and a reconciliation of GAAP to non-GAAP financial information.
(3) Average dividend yield is calculated based on the dividends declared in the given period, divided by the average daily closing share price during the given period.
- 1 -
Operating Performance
The following table summarizes the company’s GAAP and non-GAAP earnings measurements and key metrics for the fourth quarter of 2021 and third quarter of 2021:
Two Harbors Investment Corp. Operating Performance (unaudited) | |||||||||||||||||||||||||||||||||||
(dollars in thousands, except per common share data) | |||||||||||||||||||||||||||||||||||
| Three Months Ended December 31, 2021 | Three Months Ended September 30, 2021 | ||||||||||||||||||||||||||||||||||
Earnings attributable to common stockholders | Earnings | Per weighted average basic common share | Annualized return on average common equity | Earnings | Per weighted average basic common share | Annualized return on average common equity | |||||||||||||||||||||||||||||
| Comprehensive (Loss) Income | $ | (128,594) | $ | (0.38) | (24.7) | % | $ | 45,226 | $ | 0.15 | 9.1 | % | |||||||||||||||||||||||
| GAAP Net (Loss) Income | $ | (15,041) | $ | (0.05) | (2.9) | % | $ | 52,576 | $ | 0.17 | 10.5 | % | |||||||||||||||||||||||
Earnings Available for Distribution(1) | $ | 73,276 | $ | 0.22 | 14.1 | % | $ | 73,607 | $ | 0.24 | 14.7 | % | |||||||||||||||||||||||
Operating Metrics | |||||||||||||||||||||||||||||||||||
| Dividend per common share | $ | 0.17 | $ | 0.17 | |||||||||||||||||||||||||||||||
Annualized dividend yield(2) | 11.8 | % | 10.7 | % | |||||||||||||||||||||||||||||||
| Book value per common share at period end | $ | 5.87 | $ | 6.40 | |||||||||||||||||||||||||||||||
Return on book value(3) | (5.6) | % | 2.3 | % | |||||||||||||||||||||||||||||||
Operating expenses, excluding non-cash LTIP amortization and nonrecurring expenses(4) | $ | 9,854 | $ | 12,858 | |||||||||||||||||||||||||||||||
Operating expenses, excluding non-cash LTIP amortization and nonrecurring expenses, as a percentage of average equity(4) | 1.4 | % | 1.9 | % | |||||||||||||||||||||||||||||||
________________
(1)Earnings Available for Distribution, or EAD, is a non-GAAP measure. Please see page 11 for a definition of Earnings Available for Distribution and a reconciliation of GAAP to non-GAAP financial information.
(2)Dividend yield is calculated based on annualizing the dividends declared in the given period, divided by the closing share price as of the end of the period.
(3)Return on book value is defined as the increase (decrease) in book value per common share from the beginning to the end of the given period, plus dividends declared in the period, divided by the book value as of the beginning of the period.
(4)Excludes non-cash equity compensation expense of $2.5 million for the fourth quarter of 2021 and $2.6 million for the third quarter of 2021 and nonrecurring expenses of $0.7 million for the fourth quarter of 2021 and $1.2 million for the third quarter of 2021.
- 2 -
Portfolio Summary
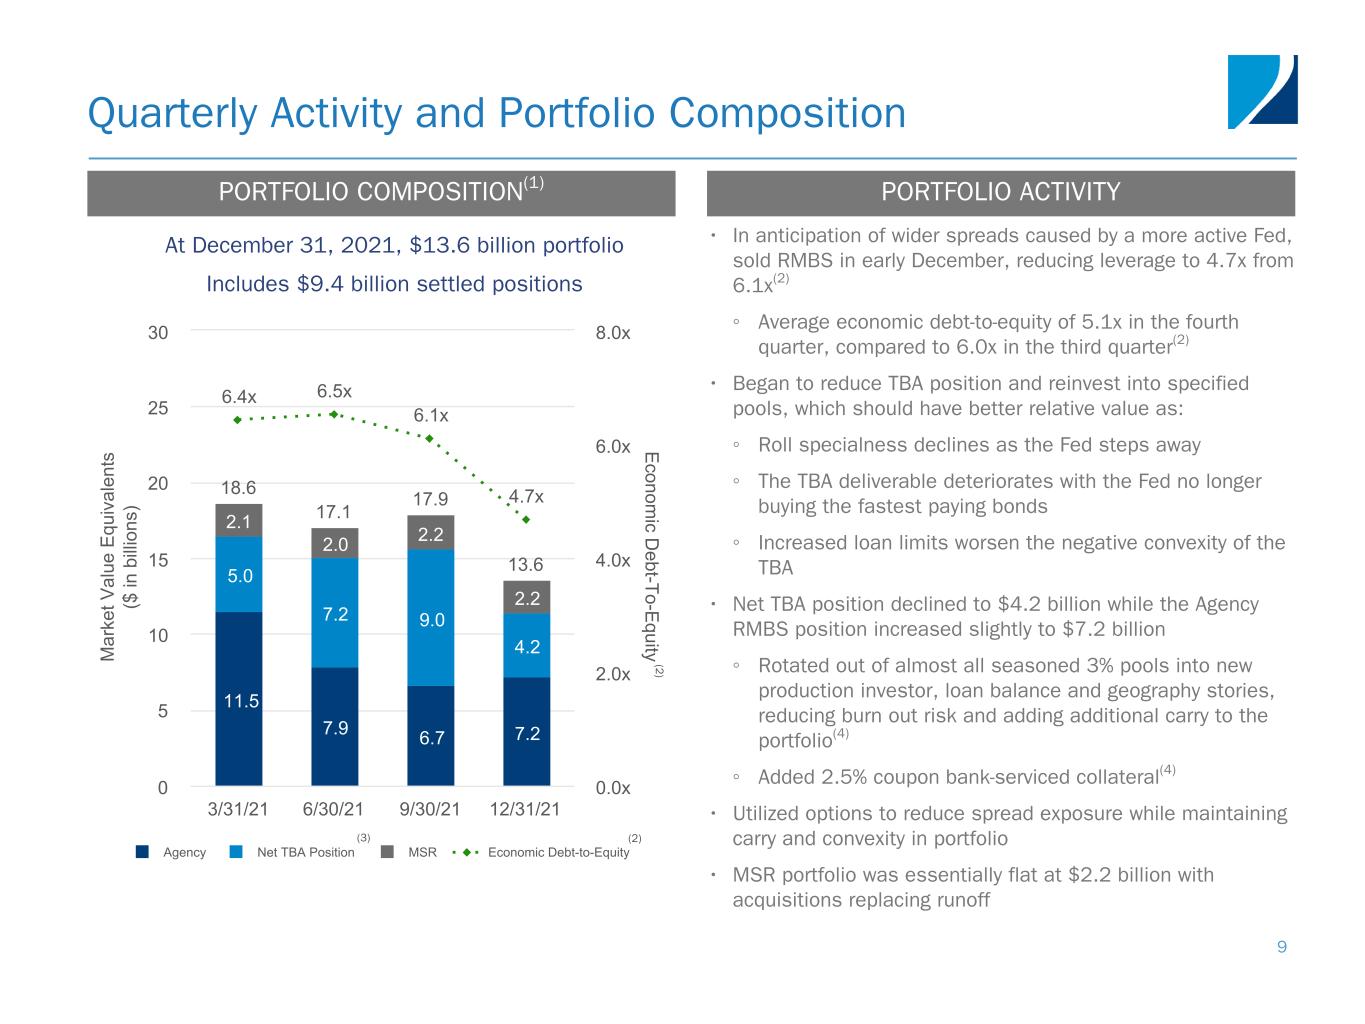
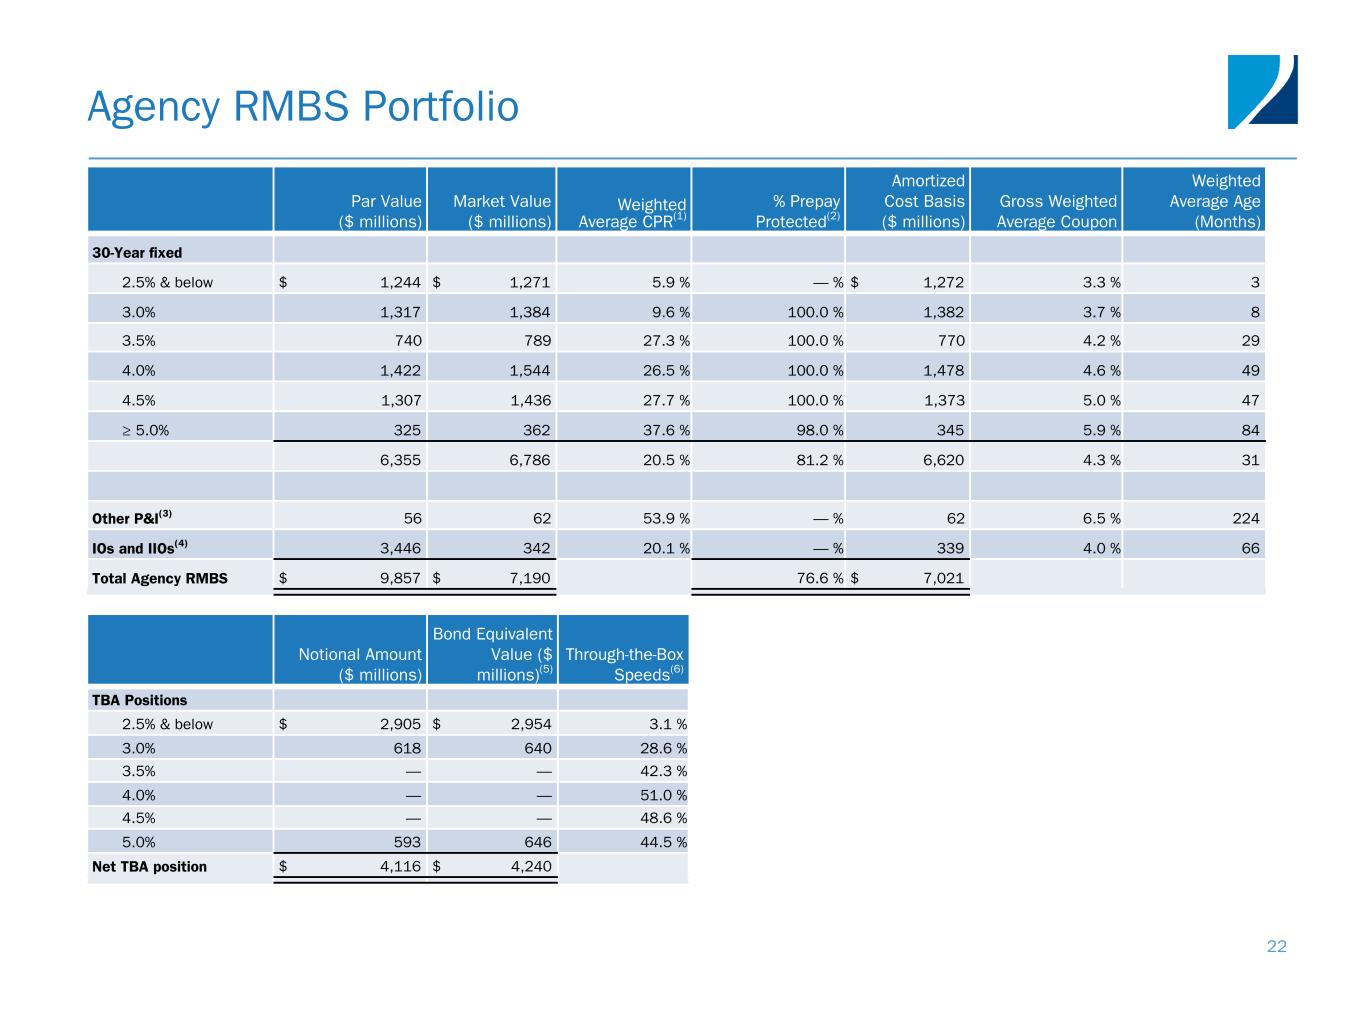
As of December 31, 2021, the company’s portfolio was comprised of $9.4 billion of Agency residential mortgage-backed securities (RMBS), Agency Derivatives and MSR as well as their associated notional hedges. Additionally, the company held $4.2 billion bond equivalent value of net long to-be-announced securities (TBAs).
The following tables summarize the company’s investment portfolio as of December 31, 2021 and September 30, 2021:
| Two Harbors Investment Corp. Portfolio | ||||||||||||||||||||||||||
| (dollars in thousands) | ||||||||||||||||||||||||||
| Portfolio Composition | As of December 31, 2021 | As of September 30, 2021 | ||||||||||||||||||||||||
| (unaudited) | (unaudited) | |||||||||||||||||||||||||
| Agency | ||||||||||||||||||||||||||
| Fixed Rate | $ | 7,140,913 | 76.0 | % | $ | 6,647,517 | 74.5 | % | ||||||||||||||||||
Other Agency(1) | 49,397 | 0.6 | % | 54,291 | 0.6 | % | ||||||||||||||||||||
| Total Agency | 7,190,310 | 76.6 | % | 6,701,808 | 75.1 | % | ||||||||||||||||||||
Mortgage servicing rights(2) | 2,191,578 | 23.3 | % | 2,213,312 | 24.8 | % | ||||||||||||||||||||
| Other | 12,304 | 0.1 | % | 8,173 | 0.1 | % | ||||||||||||||||||||
| Aggregate Portfolio | 9,394,192 | 8,923,293 | ||||||||||||||||||||||||
Net TBA position(3) | 4,240,371 | 8,973,364 | ||||||||||||||||||||||||
| Total Portfolio | $ | 13,634,563 | $ | 17,896,657 | ||||||||||||||||||||||
Portfolio Metrics | Three Months Ended December 31, 2021 | Three Months Ended September 30, 2021 | ||||||||||||
(unaudited) | (unaudited) | |||||||||||||
Annualized portfolio yield during the quarter(4) | 3.72 | % | 3.33 | % | ||||||||||
Annualized cost of funds on average borrowing balance during the quarter(5) | 0.73 | % | 0.78 | % | ||||||||||
Annualized net yield for aggregate portfolio during the quarter | 2.99 | % | 2.55 | % | ||||||||||
________________
(1)Other Agency includes hybrid ARMs and Agency derivatives.
(2)Based on the loans underlying the MSR reported by subservicers on a month lag, adjusted for current month purchases.
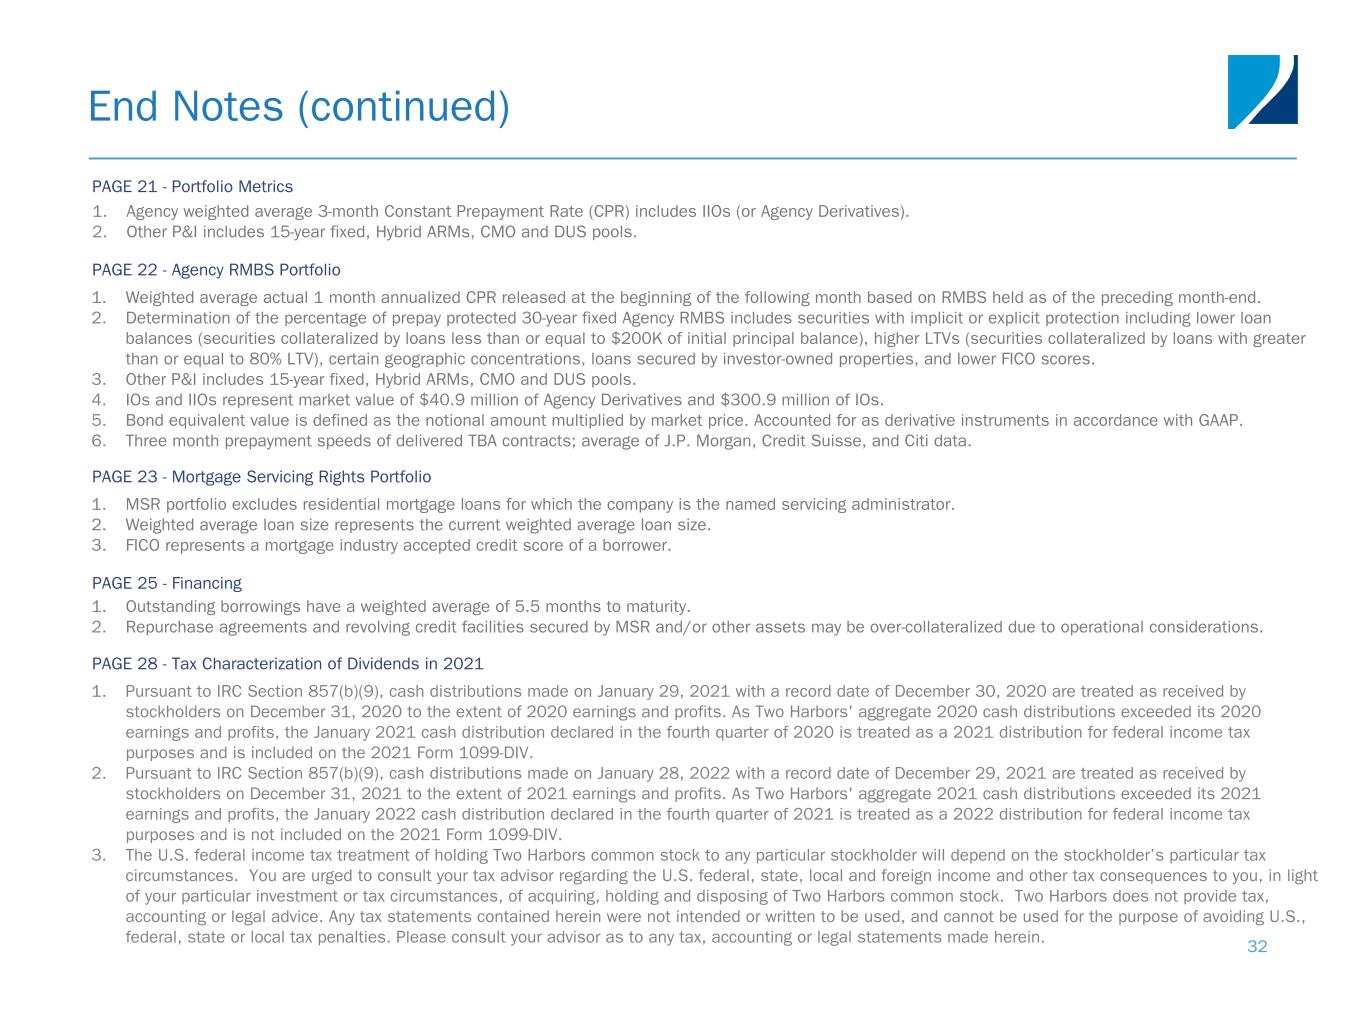
(3)Represents bond equivalent value of TBA position. Bond equivalent value is defined as notional amount multiplied by market price. Accounted for as derivative instruments in accordance with GAAP.
(4)Includes interest income on RMBS and servicing income, net of servicing expenses and amortization on MSR.
(5)Cost of funds includes interest spread income/expense associated with the portfolio's interest rate swaps.
Portfolio Metrics Specific to RMBS and Agency Derivatives | As of December 31, 2021 | As of September 30, 2021 | ||||||||||||
(unaudited) | (unaudited) | |||||||||||||
Weighted average cost basis of Agency principal and interest securities(1) | $ | 104.66 | $ | 104.86 | ||||||||||
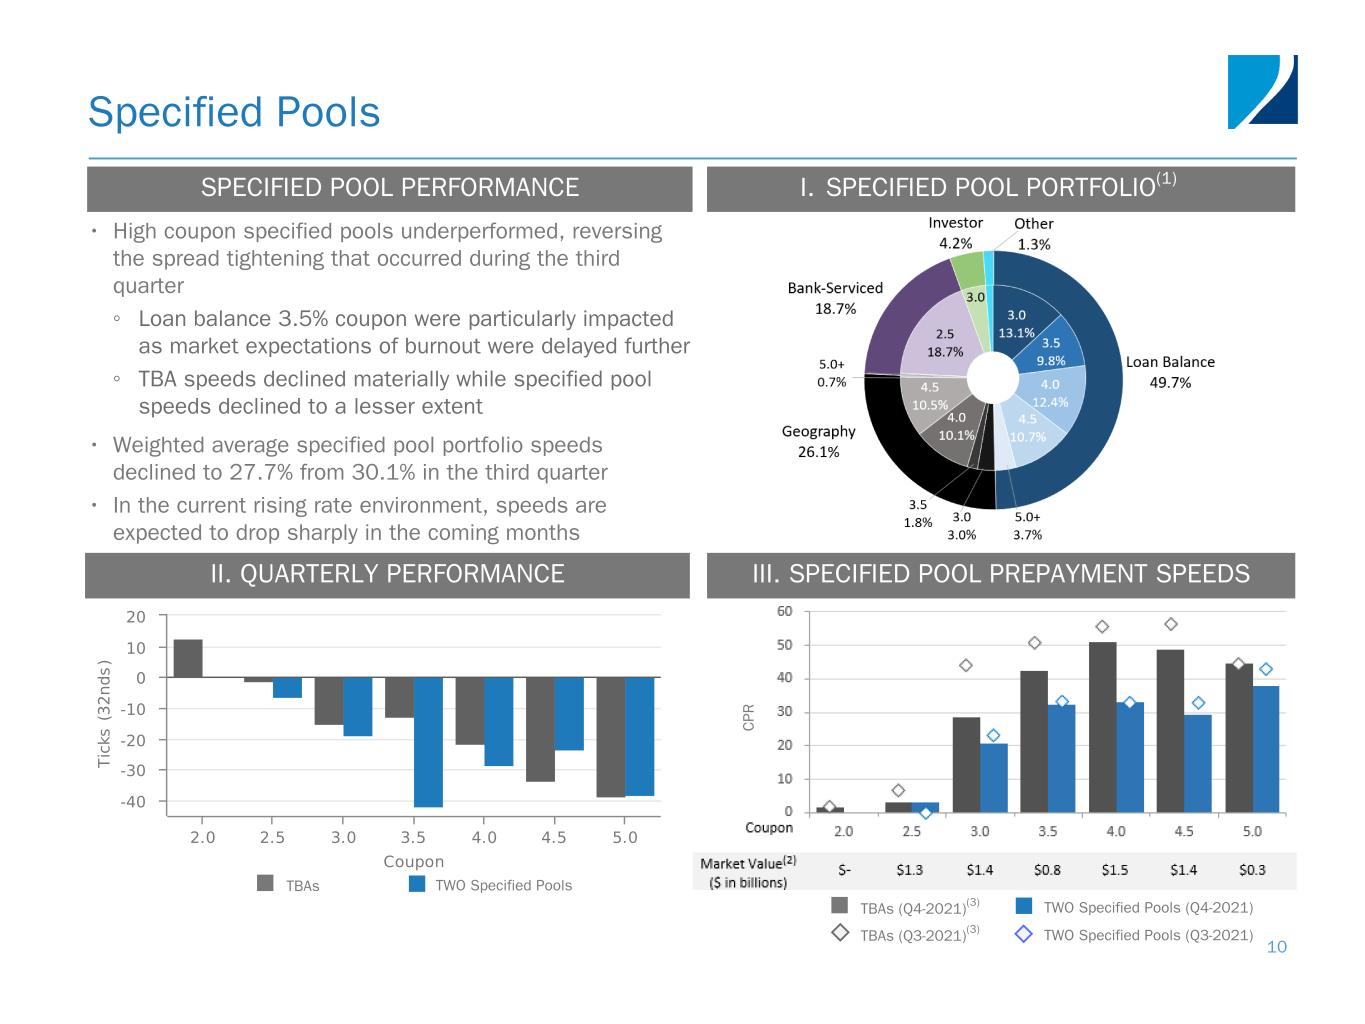
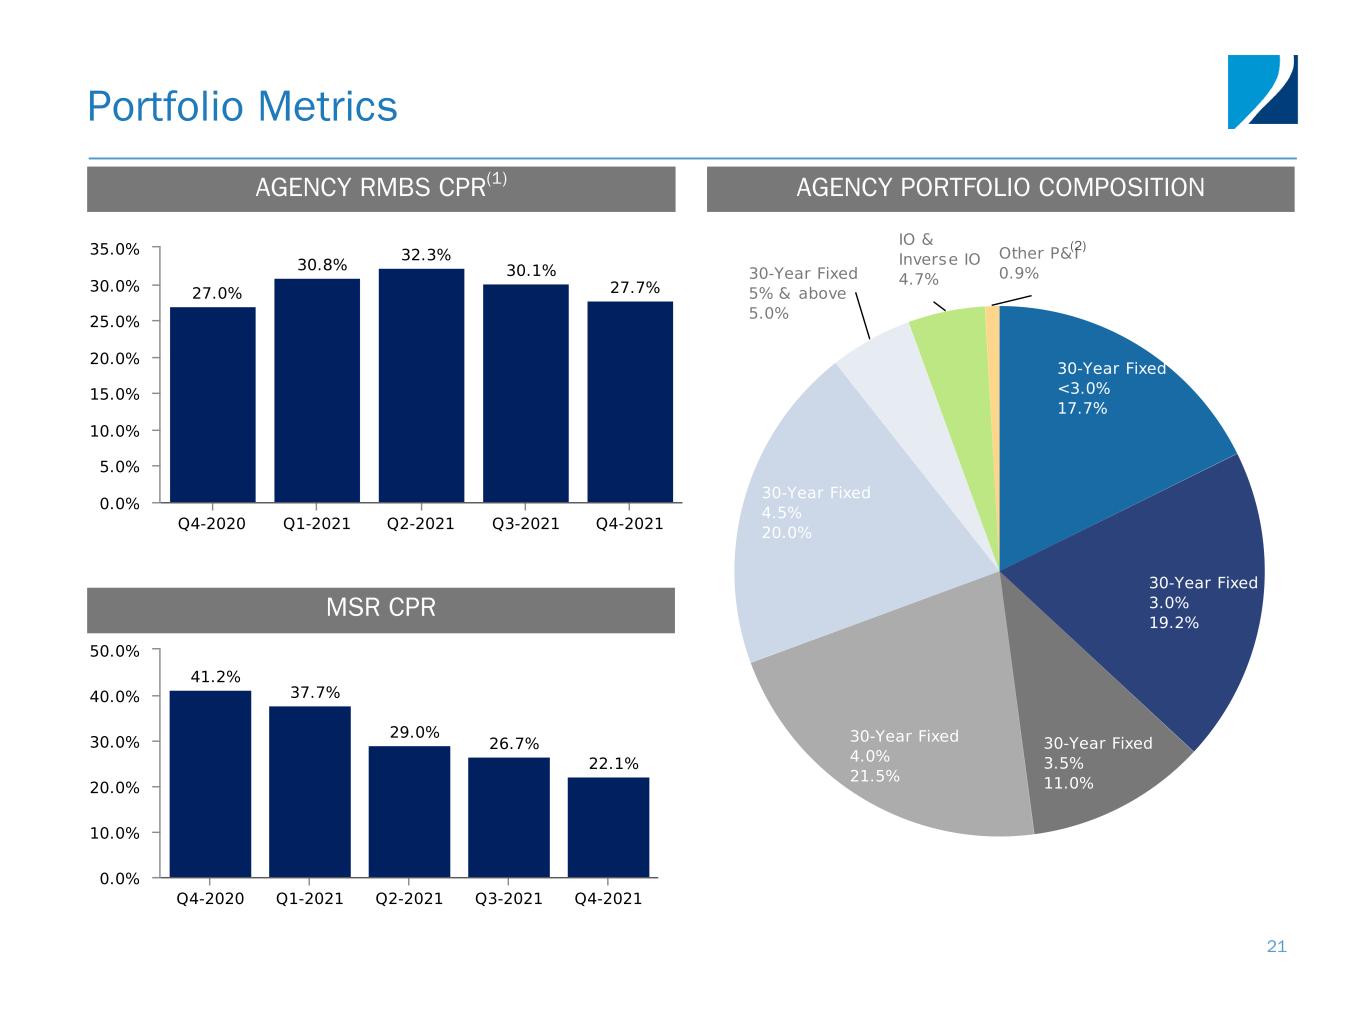
Weighted average three month CPR on Agency RMBS | 27.7 | % | 30.1 | % | ||||||||||
Fixed-rate investments as a percentage of aggregate RMBS and Agency Derivatives portfolio | 99.1 | % | 99.1 | % | ||||||||||
Adjustable-rate investments as a percentage of aggregate RMBS and Agency Derivatives portfolio | 0.9 | % | 0.9 | % | ||||||||||
______________
(1)Weighted average cost basis includes RMBS principal and interest securities only. Average purchase price utilized carrying value for weighting purposes.
- 3 -
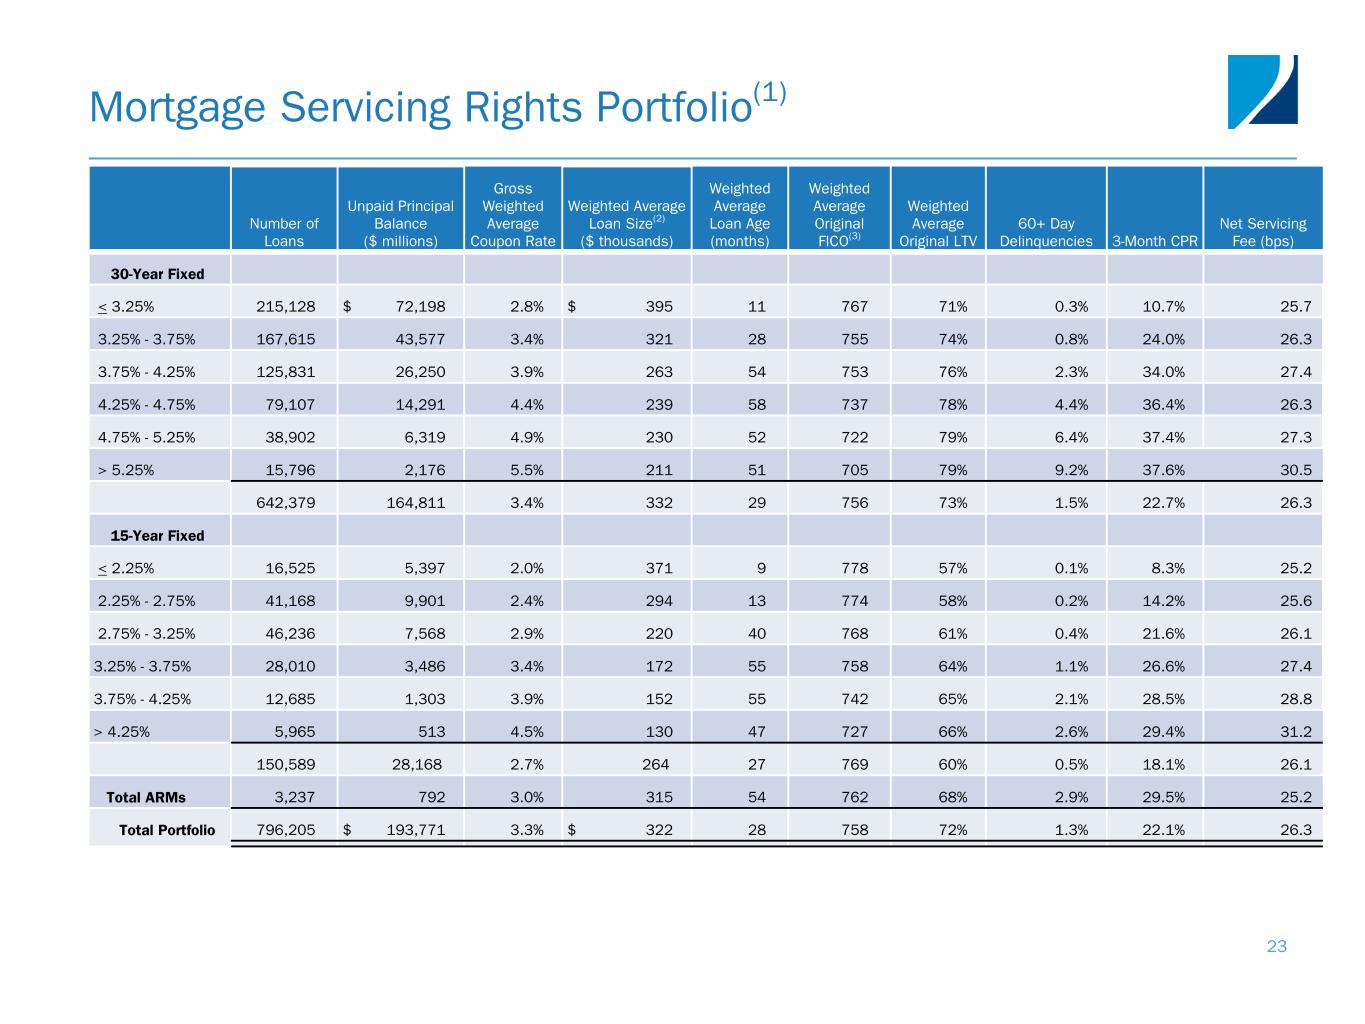
Portfolio Metrics Specific to MSR(1) | As of December 31, 2021 | As of September 30, 2021 | ||||||||||||
(dollars in thousands) | (unaudited) | (unaudited) | ||||||||||||
| Unpaid principal balance | $ | 193,770,566 | $ | 194,393,942 | ||||||||||
| Weighted average gross coupon | 3.3 | % | 3.4 | % | ||||||||||
| Weighted average current loan size | $ | 322 | $ | 321 | ||||||||||
Weighted average original FICO score(2) | 758 | 758 | ||||||||||||
| Weighted average original LTV | 72 | % | 72 | % | ||||||||||
| 60+ day delinquencies | 1.3 | % | 1.7 | % | ||||||||||
| Net servicing fee | 26.3 basis points | 26.4 basis points | ||||||||||||
| Three Months Ended December 31, 2021 | Three Months Ended September 30, 2021 | |||||||||||||
| (unaudited) | (unaudited) | |||||||||||||
| Fair value losses | $ | (131,828) | $ | (42,500) | ||||||||||
| Servicing income | $ | 125,511 | $ | 122,960 | ||||||||||
| Servicing expenses | $ | 21,605 | $ | 21,401 | ||||||||||
| Change in servicing reserves | $ | (23) | $ | (378) | ||||||||||
________________
Note: The company does not directly service mortgage loans, but instead contracts with appropriately licensed subservicers to handle substantially all servicing functions in the name of the subservicer for the loans underlying the company’s MSR.
(1)Metrics exclude residential mortgage loans in securitization trusts for which the company is the named servicing administrator.
(2)FICO represents a mortgage industry accepted credit score of a borrower.
Other Investments and Risk Management Metrics | As of December 31, 2021 | As of September 30, 2021 | ||||||||||||
(dollars in thousands) | (unaudited) | (unaudited) | ||||||||||||
Net long TBA notional amount(3) | $ | 4,116,000 | $ | 8,742,000 | ||||||||||
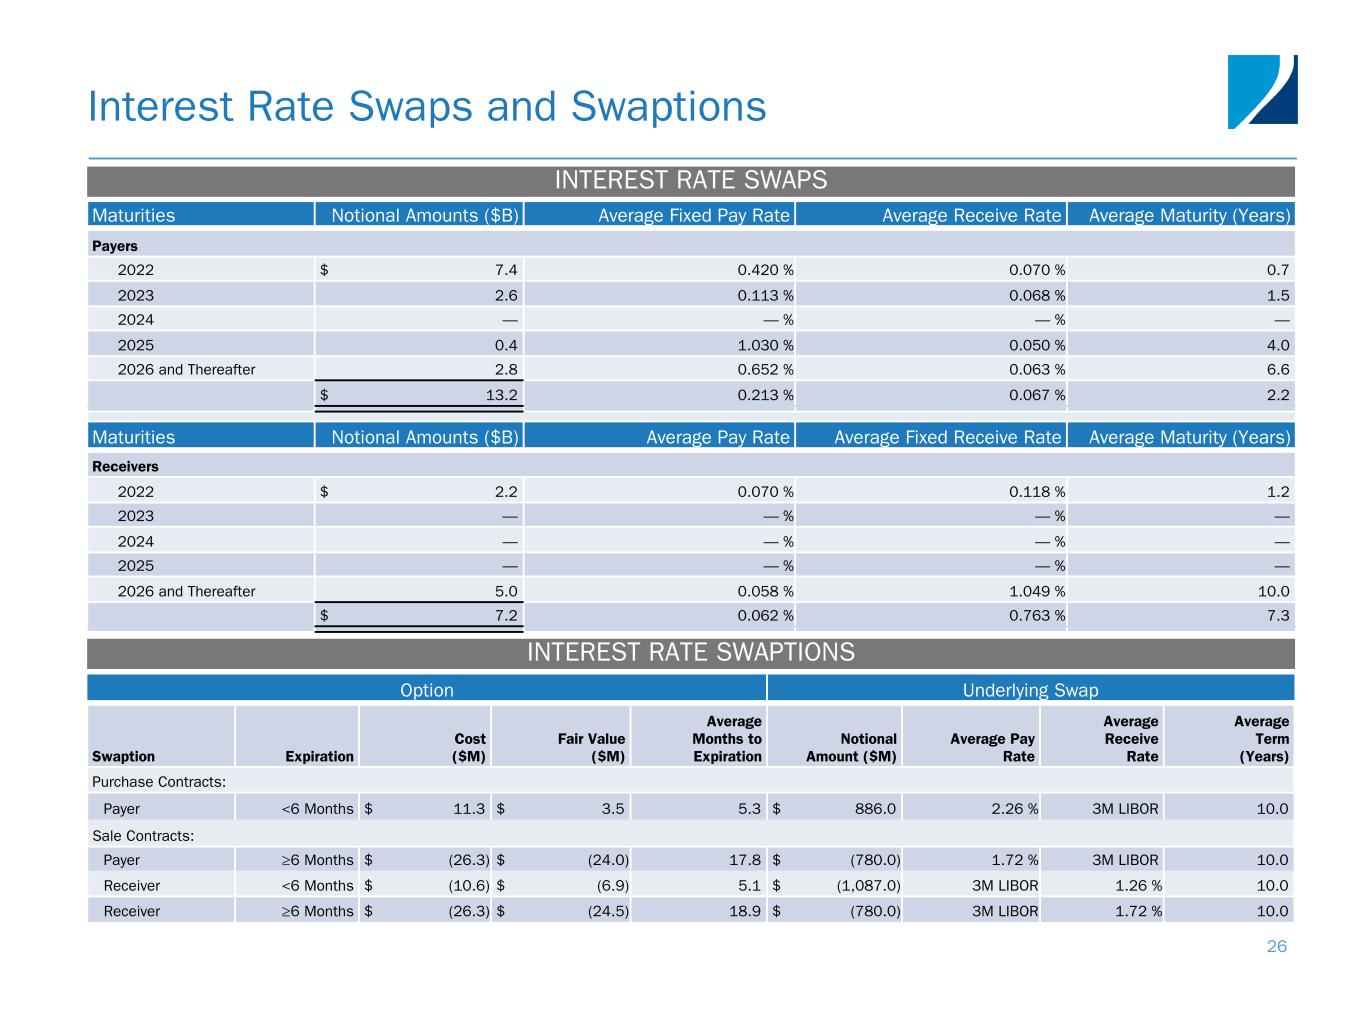
Interest rate swaps notional, utilized to economically hedge interest rate exposure (or duration) | $ | 20,387,300 | $ | 17,036,595 | ||||||||||
| Swaptions net notional, utilized as macroeconomic hedges | (1,761,000) | (941,000) | ||||||||||||
| Total interest rate swaps and swaptions notional | $ | 18,626,300 | $ | 16,095,595 | ||||||||||
________________
(3)Accounted for as derivative instruments in accordance with GAAP.
Financing Summary
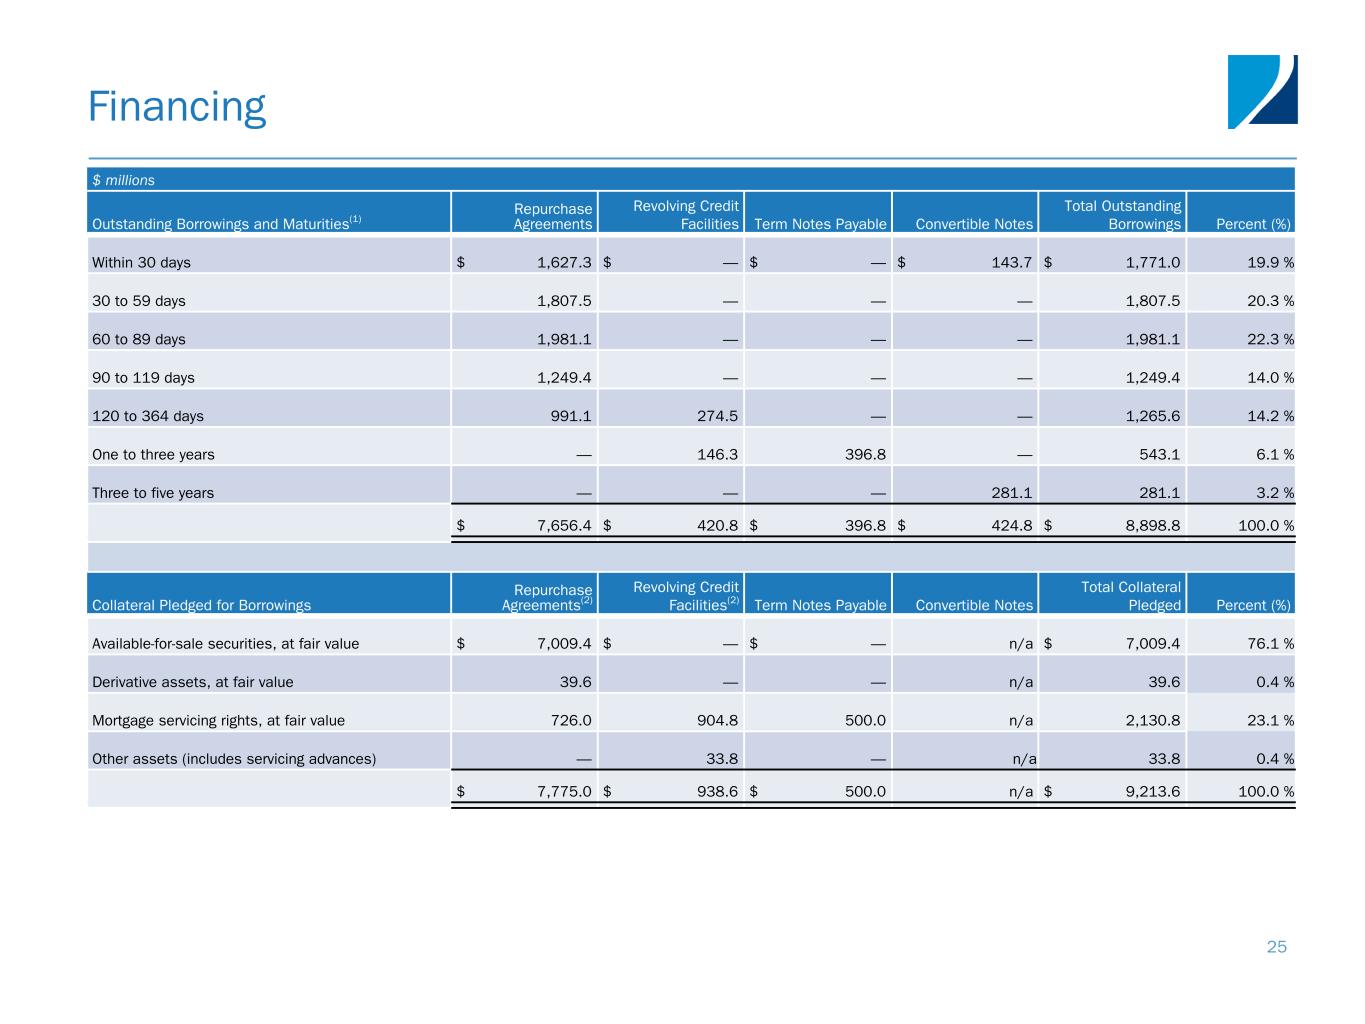
The following tables summarize the company’s financing metrics and outstanding repurchase agreements, revolving credit facilities, term notes and convertible senior notes as of December 31, 2021 and September 30, 2021:
| December 31, 2021 | Balance | Weighted Average Borrowing Rate | Weighted Average Months to Maturity | Number of Distinct Counterparties | ||||||||||||||||||||||
| (dollars in thousands, unaudited) | ||||||||||||||||||||||||||
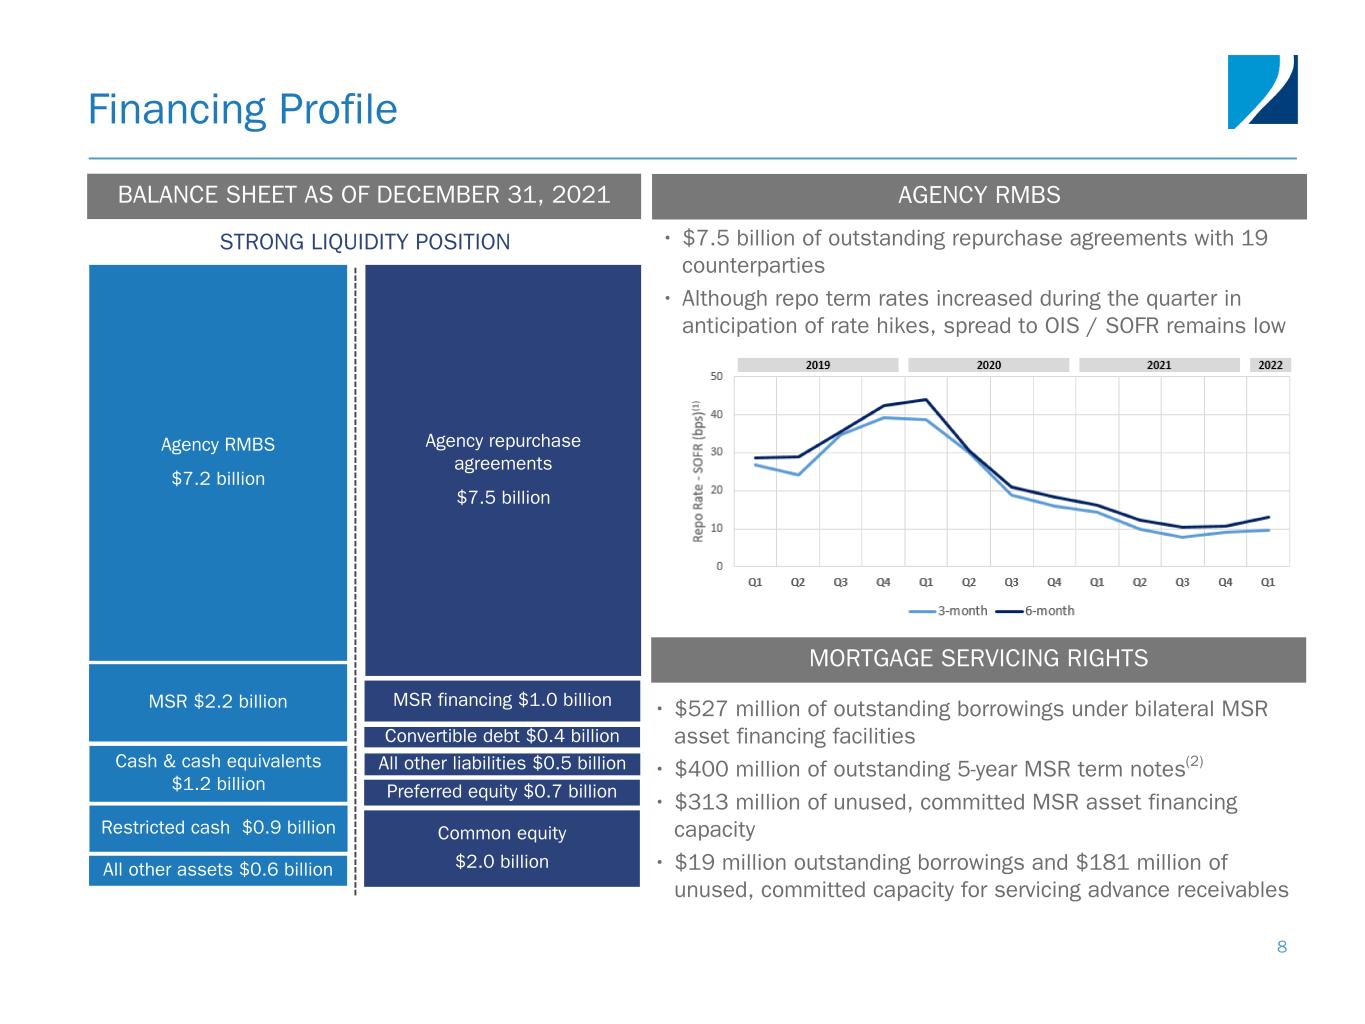
| Repurchase agreements collateralized by RMBS | $ | 7,531,445 | 0.17 | % | 2.15 | 19 | ||||||||||||||||||||
| Repurchase agreements collateralized by MSR | 125,000 | 4.00 | % | 5.95 | 1 | |||||||||||||||||||||
| Total repurchase agreements | 7,656,445 | 0.24 | % | 2.21 | 20 | |||||||||||||||||||||
Revolving credit facilities collateralized by MSR and related servicing advance obligations | 420,761 | 3.46 | % | 14.50 | 4 | |||||||||||||||||||||
| Term notes payable collateralized by MSR | 396,776 | 2.90 | % | 29.82 | n/a | |||||||||||||||||||||
| Unsecured convertible senior notes | 424,827 | 6.25 | % | 32.34 | n/a | |||||||||||||||||||||
| Total borrowings | $ | 8,898,809 | ||||||||||||||||||||||||
- 4 -
| September 30, 2021 | Balance | Weighted Average Borrowing Rate | Weighted Average Months to Maturity | Number of Distinct Counterparties | ||||||||||||||||||||||
| (dollars in thousands, unaudited) | ||||||||||||||||||||||||||
| Repurchase agreements collateralized by RMBS | $ | 6,998,701 | 0.18 | % | 3.61 | 16 | ||||||||||||||||||||
| Repurchase agreements collateralized by MSR | 125,000 | 4.00 | % | 5.98 | 1 | |||||||||||||||||||||
| Total repurchase agreements | 7,123,701 | 0.25 | % | 3.65 | 17 | |||||||||||||||||||||
Revolving credit facilities collateralized by MSR and related servicing advance obligations | 420,761 | 3.42 | % | 17.52 | 4 | |||||||||||||||||||||
| Term notes payable collateralized by MSR | 396,479 | 2.89 | % | 32.84 | n/a | |||||||||||||||||||||
| Unsecured convertible senior notes | 424,270 | 6.25 | % | 35.33 | n/a | |||||||||||||||||||||
| Total borrowings | $ | 8,365,211 | ||||||||||||||||||||||||
| Borrowings by Collateral Type | As of December 31, 2021 | As of September 30, 2021 | ||||||||||||
(dollars in thousands) | (unaudited) | (unaudited) | ||||||||||||
Collateral type: | ||||||||||||||
Agency RMBS and Agency Derivatives | $ | 7,531,274 | $ | 6,997,972 | ||||||||||
| Mortgage servicing rights and related servicing advance obligations | 942,537 | 942,240 | ||||||||||||
| Other - secured | 171 | 729 | ||||||||||||
Other - unsecured(1) | 424,827 | 424,270 | ||||||||||||
| Total | $ | 8,898,809 | $ | 8,365,211 | ||||||||||
Debt-to-equity ratio at period-end(2) | 3.2 | :1.0 | 3.1 | :1.0 | ||||||||||
Economic debt-to-equity ratio at period-end(3) | 4.7 | :1.0 | 6.1 | :1.0 | ||||||||||
Cost of Funds Metrics | Three Months Ended December 31, 2021 | Three Months Ended September 30, 2021 | ||||||||||||
(unaudited) | (unaudited) | |||||||||||||
Annualized cost of funds on average borrowings during the quarter: | 1.0 | % | 1.0 | % | ||||||||||
Agency RMBS and Agency Derivatives | 0.2 | % | 0.2 | % | ||||||||||
Mortgage servicing rights and related servicing advance obligations(4) | 4.2 | % | 4.4 | % | ||||||||||
| Other - secured | 1.8 | % | 1.8 | % | ||||||||||
Other - unsecured(1)(4) | 6.9 | % | 6.9 | % | ||||||||||
____________________
(1)Unsecured convertible senior notes.
(2)Defined as total borrowings to fund RMBS, MSR and Agency Derivatives, divided by total equity.
(3)Defined as total borrowings to fund RMBS, MSR and Agency Derivatives, plus the implied debt on net TBA positions, divided by total equity.
(4)Includes amortization of debt issuance costs.
- 5 -
Conference Call
Two Harbors Investment Corp. will host a conference call on February 10, 2022 at 9:00 a.m. ET to discuss fourth quarter 2021 financial results and related information. The conference call will be webcast live and accessible in the Investors section of the company’s website at www.twoharborsinvestment.com/investors. To participate in the teleconference, please call toll-free (877) 502-7185, approximately 10 minutes prior to the above start time. For those unable to attend, a telephone playback will be available beginning at 12:00 p.m. ET on February 10, 2022, through 12:00 p.m. ET on February 24, 2022. The playback can be accessed by calling (877) 660-6853, conference code 13723524. The call will also be archived on the company’s website in the News & Events section.
Two Harbors Investment Corp.
Two Harbors Investment Corp., a Maryland corporation, is an internally managed real estate investment trust that invests in residential mortgage-backed securities, mortgage servicing rights and other financial assets. Two Harbors is headquartered in St. Louis Park, MN. Additional information is available at www.twoharborsinvestment.com.
Forward-Looking Statements
This presentation includes “forward-looking statements” within the meaning of the safe harbor provisions of the United States Private Securities Litigation Reform Act of 1995. Actual results may differ from expectations, estimates and projections and, consequently, readers should not rely on these forward-looking statements as predictions of future events. Words such as “expect,” “target,” “assume,” “estimate,” “project,” “budget,” “forecast,” “anticipate,” “intend,” “plan,” “may,” “will,” “could,” “should,” “believe,” “predicts,” “potential,” “continue,” and similar expressions are intended to identify such forward-looking statements. These forward-looking statements involve significant risks and uncertainties that could cause actual results to differ materially from expected results, including, among other things, those described in our Annual Report on Form 10-K for the year ended December 31, 2020, and any subsequent Quarterly Reports on Form 10-Q, under the caption “Risk Factors.” Factors that could cause actual results to differ include, but are not limited to: the state of credit markets and general economic conditions; the ongoing impact of the COVID-19 pandemic, and the actions taken by federal and state governmental authorities and GSEs in response, on the U.S. economy, financial markets and our target assets; changes in interest rates and the market value of our assets; changes in prepayment rates of mortgages underlying our target assets; the rates of default or decreased recovery on the mortgages underlying our target assets; declines in home prices; our ability to establish, adjust and maintain appropriate hedges for the risks in our portfolio; the availability and cost of our target assets; the availability and cost of financing; changes in the competitive landscape within our industry; our ability to effectively execute and to realize the benefits of strategic transactions and initiatives we have pursued or may in the future pursue; our decision to terminate our management agreement with PRCM Advisers LLC and the ongoing litigation with PRCM Advisers related to such termination; our ability to manage various operational risks and costs associated with our business; interruptions in or impairments to our communications and information technology systems; our ability to acquire MSR and successfully operate our seller-servicer subsidiary and oversee our subservicers; the impact of any deficiencies in the servicing or foreclosure practices of third parties and related delays in the foreclosure process; our exposure to legal and regulatory claims; legislative and regulatory actions affecting our business; the impact of new or modified government mortgage refinance or principal reduction programs; our ability to maintain our REIT qualification; and limitations imposed on our business due to our REIT status and our exempt status under the Investment Company Act of 1940.
Readers are cautioned not to place undue reliance upon any forward-looking statements, which speak only as of the date made. Two Harbors does not undertake or accept any obligation to release publicly any updates or revisions to any forward-looking statement to reflect any change in its expectations or any change in events, conditions or circumstances on which any such statement is based. Additional information concerning these and other risk factors is contained in Two Harbors’ most recent filings with the Securities and Exchange Commission (SEC). All subsequent written and oral forward-looking statements concerning Two Harbors or matters attributable to Two Harbors or any person acting on its behalf are expressly qualified in their entirety by the cautionary statements above.
- 6 -
Non-GAAP Financial Measures
In addition to disclosing financial results calculated in accordance with United States generally accepted accounting principles (GAAP), this press release and the accompanying investor presentation present non-GAAP financial measures, such as earnings available for distribution and earnings available for distribution per basic common share that exclude certain items. The non-GAAP financial measures presented by the company provide supplemental information to assist investors in analyzing the company’s results of operations and help facilitate comparisons to industry peers. However, because these measures are not calculated in accordance with GAAP, they should not be considered a substitute for, or superior to, the financial measures calculated in accordance with GAAP. The company’s GAAP financial results and the reconciliations from these results should be carefully evaluated. See the GAAP to non-GAAP reconciliation table on page 11 of this release.
Additional Information
Stockholders of Two Harbors and other interested persons may find additional information regarding the company at the SEC’s Internet site at www.sec.gov or by directing requests to: Two Harbors Investment Corp., Attn: Investor Relations, 1601 Utica Avenue South, Suite 900, St. Louis Park, MN, 55416, telephone (612) 453-4100.
Contact
Paulina Sims, Senior Director, Investor Relations, Two Harbors Investment Corp., (612)-446-5431, [email protected]
# # #
- 7 -
| TWO HARBORS INVESTMENT CORP. | |||||||||||
CONSOLIDATED BALANCE SHEETS | |||||||||||
| (dollars in thousands, except share data) | |||||||||||
| December 31, 2021 | December 31, 2020 | ||||||||||
| (unaudited) | |||||||||||
| ASSETS | |||||||||||
Available-for-sale securities, at fair value (amortized cost $7,005,013 and $14,043,175, respectively; allowance for credit losses $14,238 and $22,528, respectively) | $ | 7,161,703 | $ | 14,650,922 | |||||||
| Mortgage servicing rights, at fair value | 2,191,578 | 1,596,153 | |||||||||
| Cash and cash equivalents | 1,153,856 | 1,384,764 | |||||||||
| Restricted cash | 934,814 | 1,261,667 | |||||||||
| Accrued interest receivable | 26,266 | 47,174 | |||||||||
| Due from counterparties | 168,449 | 146,433 | |||||||||
| Derivative assets, at fair value | 80,134 | 95,937 | |||||||||
| Reverse repurchase agreements | 134,682 | 91,525 | |||||||||
| Other assets | 262,823 | 241,346 | |||||||||
| Total Assets | $ | 12,114,305 | $ | 19,515,921 | |||||||
| LIABILITIES AND STOCKHOLDERS’ EQUITY | |||||||||||
| Liabilities: | |||||||||||
| Repurchase agreements | $ | 7,656,445 | $ | 15,143,898 | |||||||
| Revolving credit facilities | 420,761 | 283,830 | |||||||||
| Term notes payable | 396,776 | 395,609 | |||||||||
| Convertible senior notes | 424,827 | 286,183 | |||||||||
| Derivative liabilities, at fair value | 53,658 | 11,058 | |||||||||
| Due to counterparties | 196,627 | 135,838 | |||||||||
| Dividends payable | 72,412 | 65,480 | |||||||||
| Accrued interest payable | 18,382 | 21,666 | |||||||||
| Other liabilities | 130,464 | 83,433 | |||||||||
| Total Liabilities | 9,370,352 | 16,426,995 | |||||||||
| Stockholders’ Equity: | |||||||||||
| Preferred stock, par value $0.01 per share; 100,000,000 shares authorized and 29,050,000 and 40,050,000 shares issued and outstanding, respectively ($726,250 and $1,001,250 liquidation preference, respectively) | 702,550 | 977,501 | |||||||||
| Common stock, par value $0.01 per share; 700,000,000 shares authorized and 343,911,324 and 273,703,882 shares issued and outstanding, respectively | 3,439 | 2,737 | |||||||||
| Additional paid-in capital | 5,625,179 | 5,163,794 | |||||||||
| Accumulated other comprehensive income | 186,346 | 641,601 | |||||||||
| Cumulative earnings | 1,212,983 | 1,025,756 | |||||||||
| Cumulative distributions to stockholders | (4,986,544) | (4,722,463) | |||||||||
| Total Stockholders’ Equity | 2,743,953 | 3,088,926 | |||||||||
| Total Liabilities and Stockholders’ Equity | $ | 12,114,305 | $ | 19,515,921 | |||||||
- 8 -
| TWO HARBORS INVESTMENT CORP. | |||||||||||||||||||||||
CONSOLIDATED STATEMENTS OF COMPREHENSIVE (LOSS) INCOME | |||||||||||||||||||||||
| (dollars in thousands) | |||||||||||||||||||||||
| Certain prior period amounts have been reclassified to conform to the current period presentation | |||||||||||||||||||||||
| Three Months Ended December 31, | Year Ended December 31, | ||||||||||||||||||||||
| 2021 | 2020 | 2021 | 2020 | ||||||||||||||||||||
| (unaudited) | (unaudited) | ||||||||||||||||||||||
| Interest income: | |||||||||||||||||||||||
| Available-for-sale securities | $ | 32,729 | $ | 72,071 | $ | 167,310 | $ | 515,685 | |||||||||||||||
| Other | 276 | 429 | 1,287 | 9,365 | |||||||||||||||||||
| Total interest income | 33,005 | 72,500 | 168,597 | 525,050 | |||||||||||||||||||
| Interest expense: | |||||||||||||||||||||||
| Repurchase agreements | 4,562 | 11,001 | 25,774 | 233,069 | |||||||||||||||||||
| Revolving credit facilities | 5,050 | 3,513 | 22,425 | 12,261 | |||||||||||||||||||
| Term notes payable | 3,251 | 3,296 | 12,936 | 14,974 | |||||||||||||||||||
| Convertible senior notes | 7,295 | 4,831 | 28,038 | 19,197 | |||||||||||||||||||
| Federal Home Loan Bank advances | — | — | — | 1,747 | |||||||||||||||||||
| Total interest expense | 20,158 | 22,641 | 89,173 | 281,248 | |||||||||||||||||||
| Net interest income | 12,847 | 49,859 | 79,424 | 243,802 | |||||||||||||||||||
| Other income (loss): | |||||||||||||||||||||||
| Gain (loss) on investment securities | 1,626 | 37,363 | 121,617 | (999,859) | |||||||||||||||||||
| Servicing income | 125,511 | 100,549 | 468,406 | 443,351 | |||||||||||||||||||
| (Loss) gain on servicing asset | (131,828) | 2,522 | (114,941) | (935,697) | |||||||||||||||||||
| Gain (loss) on interest rate swap and swaption agreements | 36,989 | (14,689) | 42,091 | (310,806) | |||||||||||||||||||
| (Loss) gain on other derivative instruments | (11,565) | 81,289 | (251,283) | 90,023 | |||||||||||||||||||
| Other income (loss) | 1,856 | 474 | (3,845) | 1,422 | |||||||||||||||||||
| Total other income (loss) | 22,589 | 207,508 | 262,045 | (1,711,566) | |||||||||||||||||||
| Expenses: | |||||||||||||||||||||||
| Management fees | — | — | — | 31,738 | |||||||||||||||||||
| Servicing expenses | 21,582 | 24,217 | 86,250 | 94,266 | |||||||||||||||||||
| Compensation and benefits | 6,396 | 11,220 | 35,041 | 37,723 | |||||||||||||||||||
| Other operating expenses | 6,648 | 7,237 | 28,759 | 28,626 | |||||||||||||||||||
| Restructuring charges | — | (294) | — | 5,706 | |||||||||||||||||||
| Total expenses | 34,626 | 42,380 | 150,050 | 198,059 | |||||||||||||||||||
| Income (loss) before income taxes | 810 | 214,987 | 191,419 | (1,665,823) | |||||||||||||||||||
| Provision for (benefit from) income taxes | 2,104 | 3,816 | 4,192 | (35,688) | |||||||||||||||||||
| Net (loss) income | (1,294) | 211,171 | 187,227 | (1,630,135) | |||||||||||||||||||
| Dividends on preferred stock | 13,747 | 18,951 | 58,458 | 75,802 | |||||||||||||||||||
| Net (loss) income attributable to common stockholders | $ | (15,041) | $ | 192,220 | $ | 128,769 | $ | (1,705,937) | |||||||||||||||
| Basic (loss) earnings per weighted average common share | $ | (0.04) | $ | 0.70 | $ | 0.43 | $ | (6.24) | |||||||||||||||
| Diluted (loss) earnings per weighted average common share | $ | (0.04) | $ | 0.68 | $ | 0.43 | $ | (6.24) | |||||||||||||||
| Dividends declared per common share | $ | 0.17 | $ | 0.17 | $ | 0.68 | $ | 0.50 | |||||||||||||||
| Weighted average number of shares of common stock: | |||||||||||||||||||||||
| Basic | 335,100,737 | 273,699,079 | 297,772,001 | 273,600,947 | |||||||||||||||||||
| Diluted | 335,100,737 | 291,870,229 | 298,043,538 | 273,600,947 | |||||||||||||||||||
- 9 -
| TWO HARBORS INVESTMENT CORP. | |||||||||||||||||||||||
| (dollars in thousands) | |||||||||||||||||||||||
| Certain prior period amounts have been reclassified to conform to the current period presentation | |||||||||||||||||||||||
| Three Months Ended December 31, | Year Ended December 31, | ||||||||||||||||||||||
| 2021 | 2020 | 2021 | 2020 | ||||||||||||||||||||
| (unaudited) | (unaudited) | ||||||||||||||||||||||
| Comprehensive (loss) income: | |||||||||||||||||||||||
| Net (loss) income | $ | (1,294) | $ | 211,171 | $ | 187,227 | $ | (1,630,135) | |||||||||||||||
| Other comprehensive loss, net of tax: | |||||||||||||||||||||||
| Unrealized loss on available-for-sale securities | (113,553) | (78,739) | (455,255) | (47,799) | |||||||||||||||||||
| Other comprehensive loss | (113,553) | (78,739) | (455,255) | (47,799) | |||||||||||||||||||
| Comprehensive (loss) income | (114,847) | 132,432 | (268,028) | (1,677,934) | |||||||||||||||||||
| Dividends on preferred stock | 13,747 | 18,951 | 58,458 | 75,802 | |||||||||||||||||||
| Comprehensive (loss) income attributable to common stockholders | $ | (128,594) | $ | 113,481 | $ | (326,486) | $ | (1,753,736) | |||||||||||||||
- 10 -
TWO HARBORS INVESTMENT CORP. | |||||||||||
RECONCILIATION OF GAAP TO NON-GAAP FINANCIAL INFORMATION | |||||||||||
(dollars in thousands, except share data) | |||||||||||
Certain prior period amounts have been reclassified to conform to the current period presentation | |||||||||||
| Three Months Ended December 31, | Three Months Ended September 30, | ||||||||||
| 2021 | 2021 | ||||||||||
(unaudited) | (unaudited) | ||||||||||
| Reconciliation of Comprehensive (loss) income to Earnings Available for Distribution: | |||||||||||
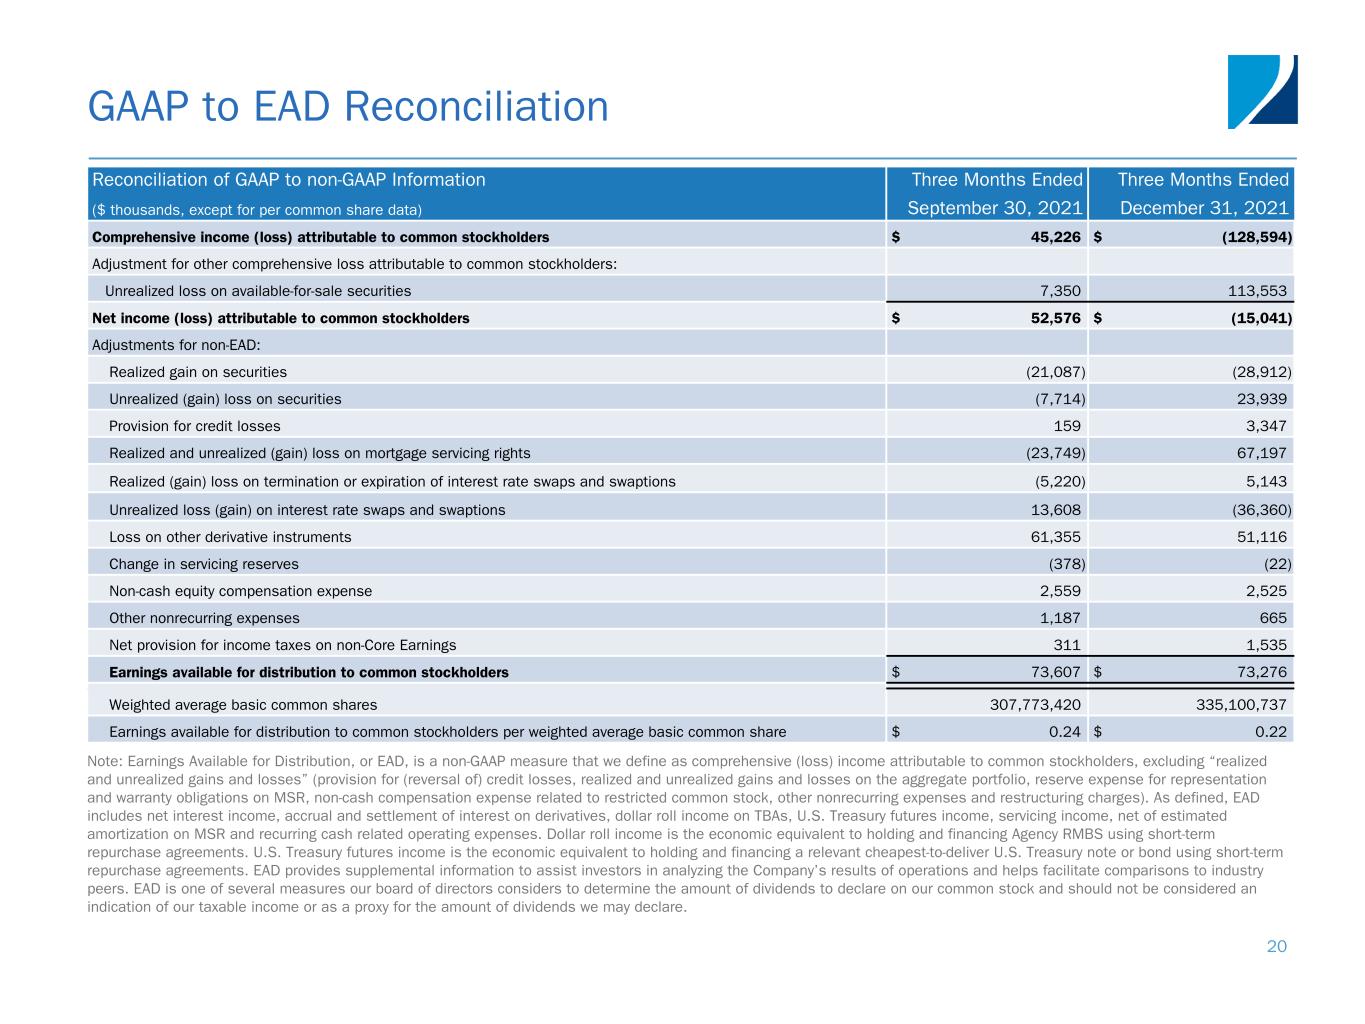
| Comprehensive (loss) income attributable to common stockholders | $ | (128,594) | $ | 45,226 | |||||||
| Adjustment for other comprehensive loss attributable to common stockholders: | |||||||||||
| Unrealized loss on available-for-sale securities | 113,553 | 7,350 | |||||||||
| Net (loss) income attributable to common stockholders | $ | (15,041) | $ | 52,576 | |||||||
| Adjustments for non-EAD: | |||||||||||
| Realized gain on securities | (28,912) | (21,087) | |||||||||
| Unrealized loss (gain) on securities | 23,939 | (7,714) | |||||||||
| Provision for credit losses | 3,347 | 159 | |||||||||
| Realized and unrealized loss (gain) on mortgage servicing rights | 67,197 | (23,749) | |||||||||
| Realized loss (gain) on termination or expiration of interest rate swaps and swaptions | 5,143 | (5,220) | |||||||||
| Unrealized (gain) loss on interest rate swaps and swaptions | (36,360) | 13,608 | |||||||||
| Loss on other derivative instruments | 51,116 | 61,355 | |||||||||
Change in servicing reserves | (22) | (378) | |||||||||
Non-cash equity compensation expense | 2,525 | 2,559 | |||||||||
Other nonrecurring expenses | 665 | 1,187 | |||||||||
| Net provision for income taxes on non-EAD | 1,535 | 311 | |||||||||
Earnings available for distribution to common stockholders(1) | $ | 73,276 | $ | 73,607 | |||||||
Weighted average basic common shares | 335,100,737 | 307,773,420 | |||||||||
Earnings available for distribution to common stockholders per weighted average basic common share | $ | 0.22 | $ | 0.24 | |||||||
_____________
(1)EAD is a non-GAAP measure that we define as comprehensive (loss) income attributable to common stockholders, excluding “realized and unrealized gains and losses” (provision for (reversal of) credit losses, realized and unrealized gains and losses on the aggregate portfolio, reserve expense for representation and warranty obligations on MSR, non-cash compensation expense related to restricted common stock, other nonrecurring expenses and restructuring charges). As defined, EAD includes net interest income, accrual and settlement of interest on derivatives, dollar roll income on TBAs, U.S. Treasury futures income, servicing income, net of estimated amortization on MSR and recurring cash related operating expenses. Dollar roll income is the economic equivalent to holding and financing Agency RMBS using short-term repurchase agreements. U.S. Treasury futures income is the economic equivalent to holding and financing a relevant cheapest-to-deliver U.S. Treasury note or bond using short-term repurchase agreements. EAD provides supplemental information to assist investors in analyzing the Company’s results of operations and helps facilitate comparisons to industry peers. EAD is one of several measures our board of directors considers to determine the amount of dividends to declare on our common stock and should not be considered an indication of our taxable income or as a proxy for the amount of dividends we may declare.
- 11 -
| TWO HARBORS INVESTMENT CORP. | |||||||||||||||||||||||||||||
| SUMMARY OF QUARTERLY EARNINGS AVAILABLE FOR DISTRIBUTION | |||||||||||||||||||||||||||||
| (dollars in millions, except per share data) | |||||||||||||||||||||||||||||
| Certain prior period amounts have been reclassified to conform to the current period presentation | |||||||||||||||||||||||||||||
| Three Months Ended | |||||||||||||||||||||||||||||
| December 31, 2021 | September 30, 2021 | June 30, 2021 | March 31, 2021 | December 31, 2020 | |||||||||||||||||||||||||
| (unaudited) | |||||||||||||||||||||||||||||
| Net Interest Income: | |||||||||||||||||||||||||||||
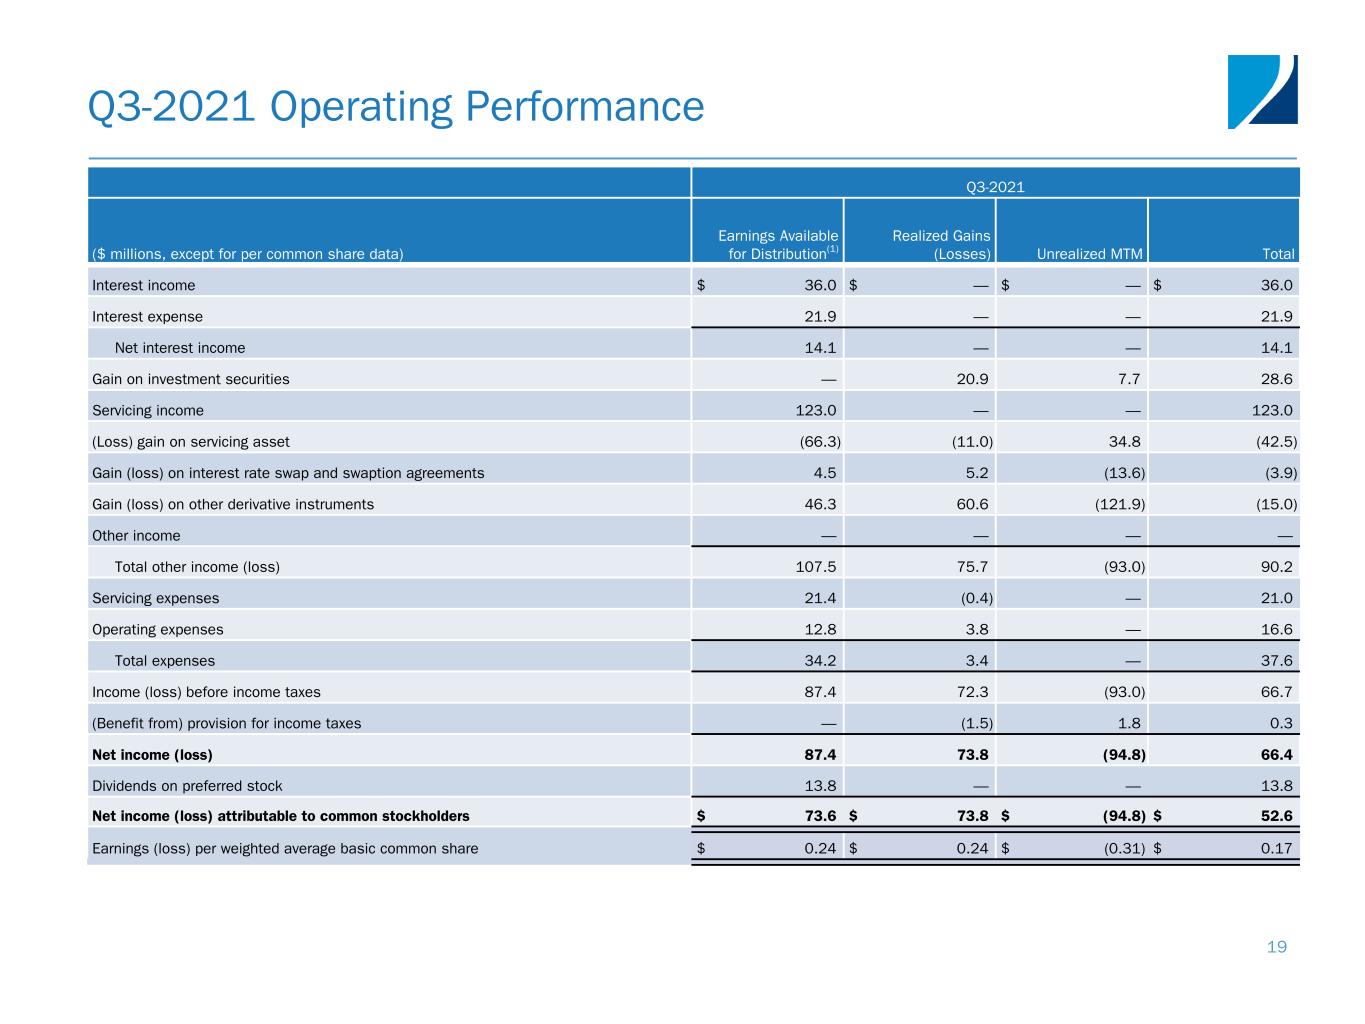
| Interest income | $ | 33.0 | $ | 36.0 | $ | 43.4 | $ | 56.1 | $ | 72.5 | |||||||||||||||||||
| Interest expense | 20.2 | 21.9 | 24.4 | 22.7 | 22.6 | ||||||||||||||||||||||||
| Net interest income | 12.8 | 14.1 | 19.0 | 33.4 | 49.9 | ||||||||||||||||||||||||
| Other income: | |||||||||||||||||||||||||||||
Servicing income, net of amortization(1) | 60.9 | 56.7 | 47.4 | 43.8 | 41.1 | ||||||||||||||||||||||||
| Interest spread on interest rate swaps | 5.8 | 4.5 | 2.4 | 1.7 | 2.0 | ||||||||||||||||||||||||
| Gain on other derivative instruments | 39.5 | 46.3 | 26.6 | 18.9 | 43.5 | ||||||||||||||||||||||||
| Other income | — | — | — | 0.1 | 0.1 | ||||||||||||||||||||||||
| Total other income | 106.2 | 107.5 | 76.4 | 64.5 | 86.7 | ||||||||||||||||||||||||
| Expenses: | |||||||||||||||||||||||||||||
| Servicing expenses | 21.6 | 21.4 | 18.5 | 24.3 | 22.6 | ||||||||||||||||||||||||
| Operating expenses | 9.8 | 12.8 | 12.5 | 11.9 | 14.7 | ||||||||||||||||||||||||
| Total expenses | 31.4 | 34.2 | 31.0 | 36.2 | 37.3 | ||||||||||||||||||||||||
Earnings available for distribution before income taxes | 87.6 | 87.4 | 64.4 | 61.7 | 99.3 | ||||||||||||||||||||||||
| Income tax (benefit) expense | 0.6 | — | (0.8) | (1.3) | (1.7) | ||||||||||||||||||||||||
| Earnings available for distribution | 87.0 | 87.4 | 65.2 | 63.0 | 101.0 | ||||||||||||||||||||||||
| Dividends on preferred stock | 13.7 | 13.8 | 13.7 | 17.2 | 19.0 | ||||||||||||||||||||||||
Earnings available for distribution to common stockholders(2) | $ | 73.3 | $ | 73.6 | $ | 51.5 | $ | 45.8 | $ | 82.0 | |||||||||||||||||||
Earnings available for distribution to common stockholders per weighted average basic common share(3) | $ | 0.22 | $ | 0.24 | $ | 0.19 | $ | 0.17 | $ | 0.30 | |||||||||||||||||||
Earnings available for distribution return on average common equity | 14.1 | % | 14.7 | % | 10.8 | % | 8.8 | % | 15.9 | % | |||||||||||||||||||
________________
(1)Amortization refers to the portion of change in fair value of MSR primarily attributed to the realization of expected cash flows (runoff) of the portfolio. This amortization has been deducted from Earnings Available for Distribution. Amortization of MSR is deemed a non-GAAP measure due to the company’s decision to account for MSR at fair value.
(2)Earnings Available for Distribution, or EAD, is a non-GAAP measure. Please see page 11 for a definition of Earnings Available for Distribution and a reconciliation of GAAP to non-GAAP financial information.
(3)EAD includes U.S. Treasury futures income of $0.01 per basic common share for the three months ended December 31, 2021 and $0.03 per basic common share for the three months ended September 30, 2021. Had U.S. Treasury futures income been included for the three months ended June 30, 2021 and March 31, 2021, EAD would have been $0.02 higher, or $0.21 per basic common share, and $0.01 higher, or $0.18 per basic common share, respectively. U.S. Treasury futures income was de minimis in prior quarters.
- 12 -