Exhibit 99.1
![]()
For Immediate Release
For more information:
Jefferson Harralson
Chief Financial Officer
(864) 240-6208
United Community Banks, Inc. Reports First Quarter Earnings
Growth, Margin Expansion, and Disciplined Expense Control Drive Results
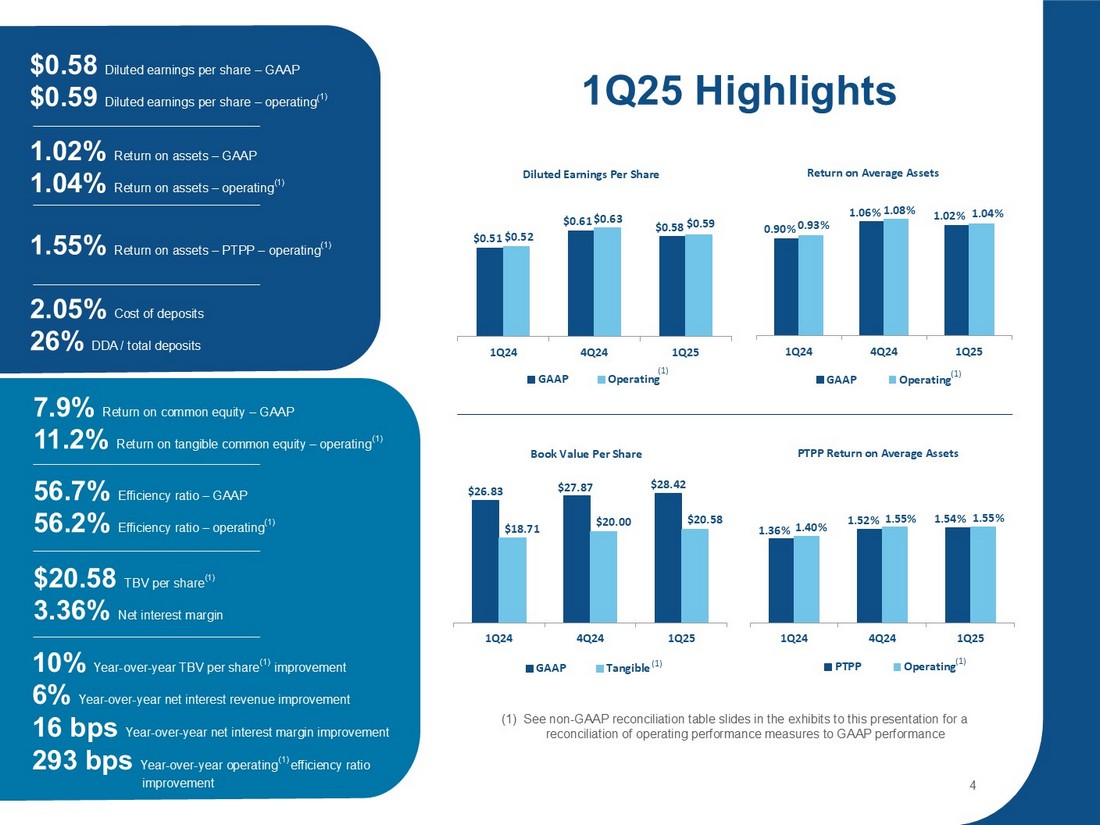
GREENVILLE, SC – April 22, 2025 – United Community Banks, Inc. (NYSE: UCB) (United) today announced net income for the first quarter of 2025 of $71.4 million and pre-tax, pre-provision income of $106.6 million. Diluted earnings per share of $0.58 for the quarter represented an increase of $0.07 from the first quarter a year ago and a decrease of $0.03 from the fourth quarter of 2024.
On an operating basis, United’s diluted earnings per share of $0.59 were up 13% from the year-ago quarter. The primary drivers of the increased earnings per share year-over-year were higher net interest income and lower noninterest expenses, partly offset by lower noninterest income and a higher provision for credit losses.
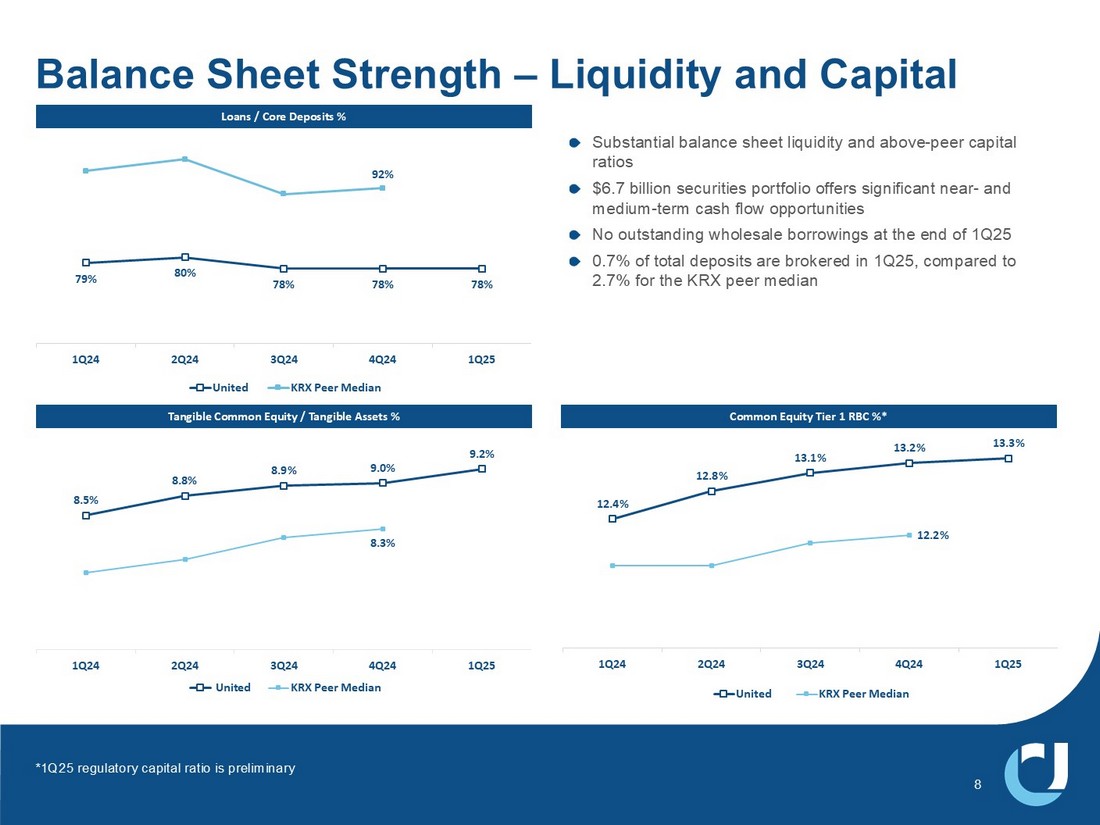
United’s return on assets was 1.02%, or 1.04% on an operating basis. Return on common equity was 7.9%, and return on tangible common equity on an operating basis was 11.2%. On a pre-tax, pre-provision basis, operating return on assets was 1.55% for the quarter. At quarter-end, tangible common equity to tangible assets was 9.18%, up 21 basis points from the fourth quarter of 2024.
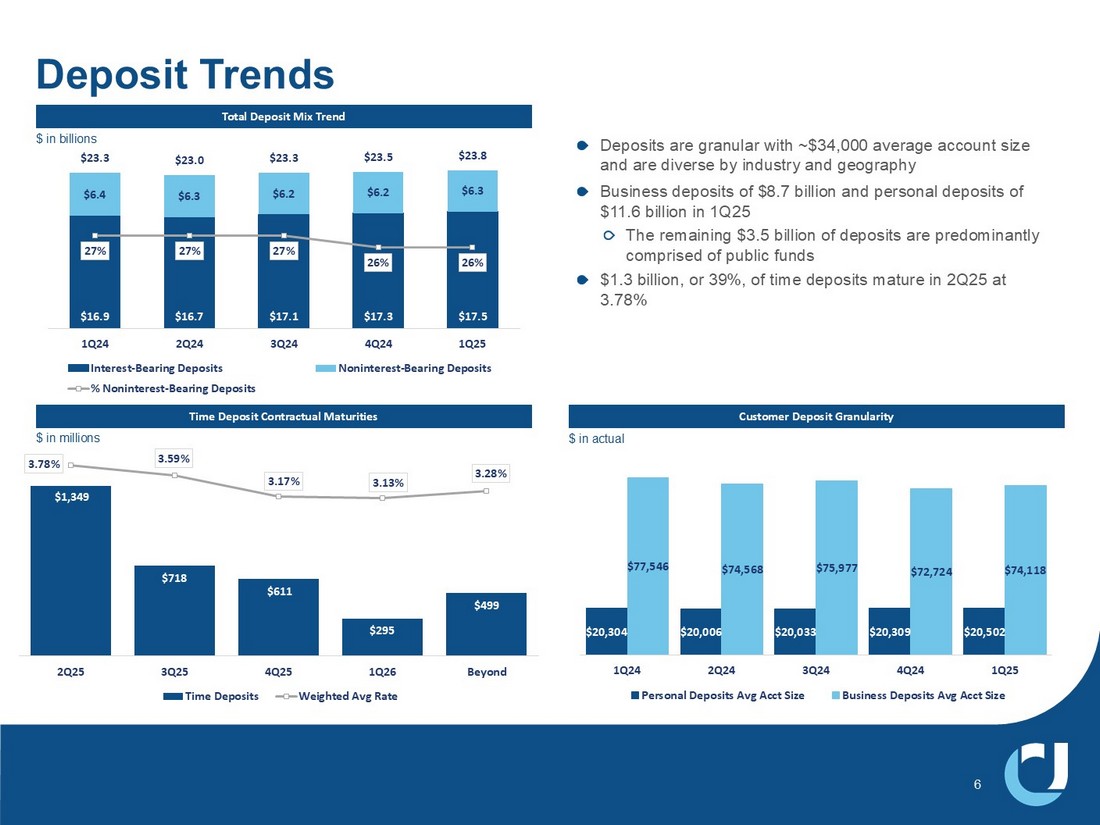
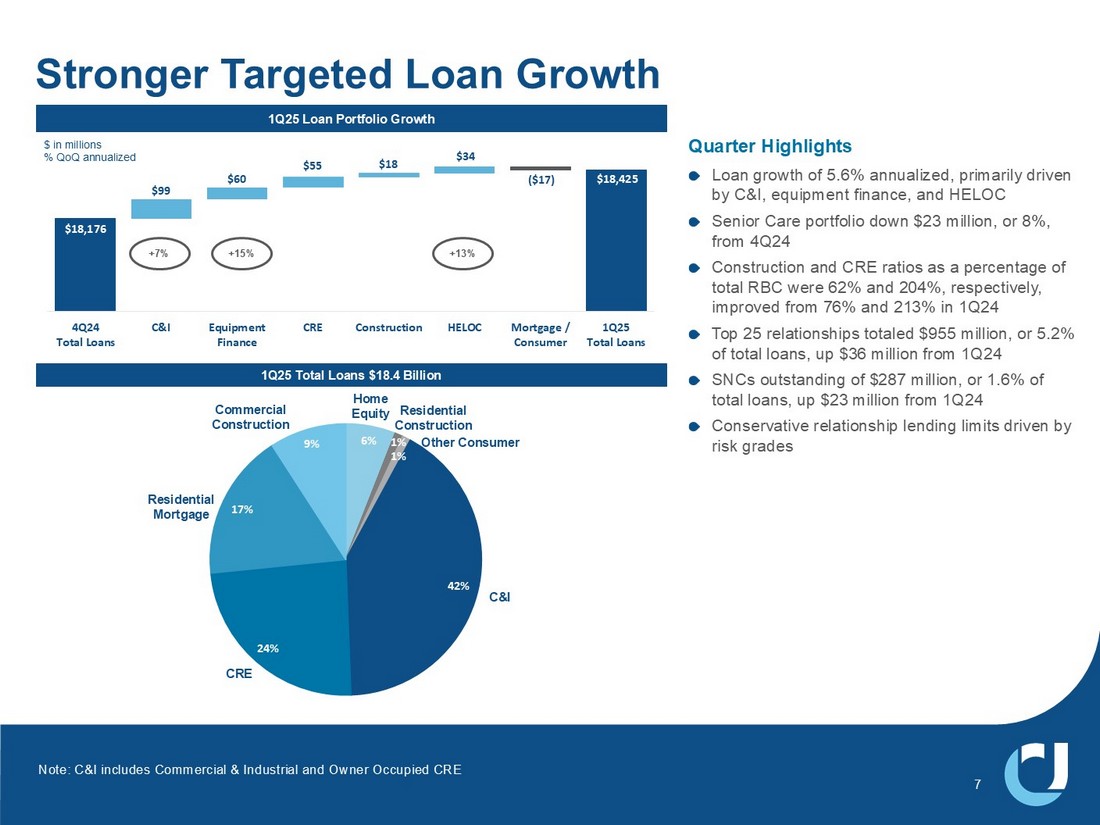
Chairman and CEO Lynn Harton stated, “The first quarter was a strong start to the year. Our teams delivered solid loan and deposit growth in what has typically been a seasonally weak quarter. Loans grew by $249 million, or 5.6% annualized, and customer deposits increased $309 million, or 5.4% annualized. Our net interest margin expanded by 10 basis points, helping us to grow net interest income by $1.7 million from the fourth quarter, despite two fewer accruing days. Credit quality remained stable, with first quarter net charge-offs holding steady at 0.21% of average loans. Our provision for credit losses increased by $4.0 million from the fourth quarter, covering first quarter net charge-offs as well as loan growth, slightly increasing our allowance for credit losses to 1.21% of loans, up from 1.20% on December 31, 2024. Expenses improved on an absolute basis from both the fourth and first quarters of 2024, reflecting our ongoing efforts to control costs.”
Harton continued, “We are particularly excited that our bankers were recognized once again by J.D. Power as #1 in Customer Satisfaction in the Southeast, along with #1 in Trust and #1 in People. This year marks our 75th anniversary, and we’re off to a strong start. I’m proud to make this milestone meaningful for our customers, employees, and shareholders. We’re also excited to continue growing our presence in Florida with the recent announcement of our planned acquisition of American National Bank, headquartered in Oakland Park. This expansion will strengthen our footprint in the fast-growing South Florida market. Our teams have been collaborating closely for several months, and we expect to close the transaction on May 1.”
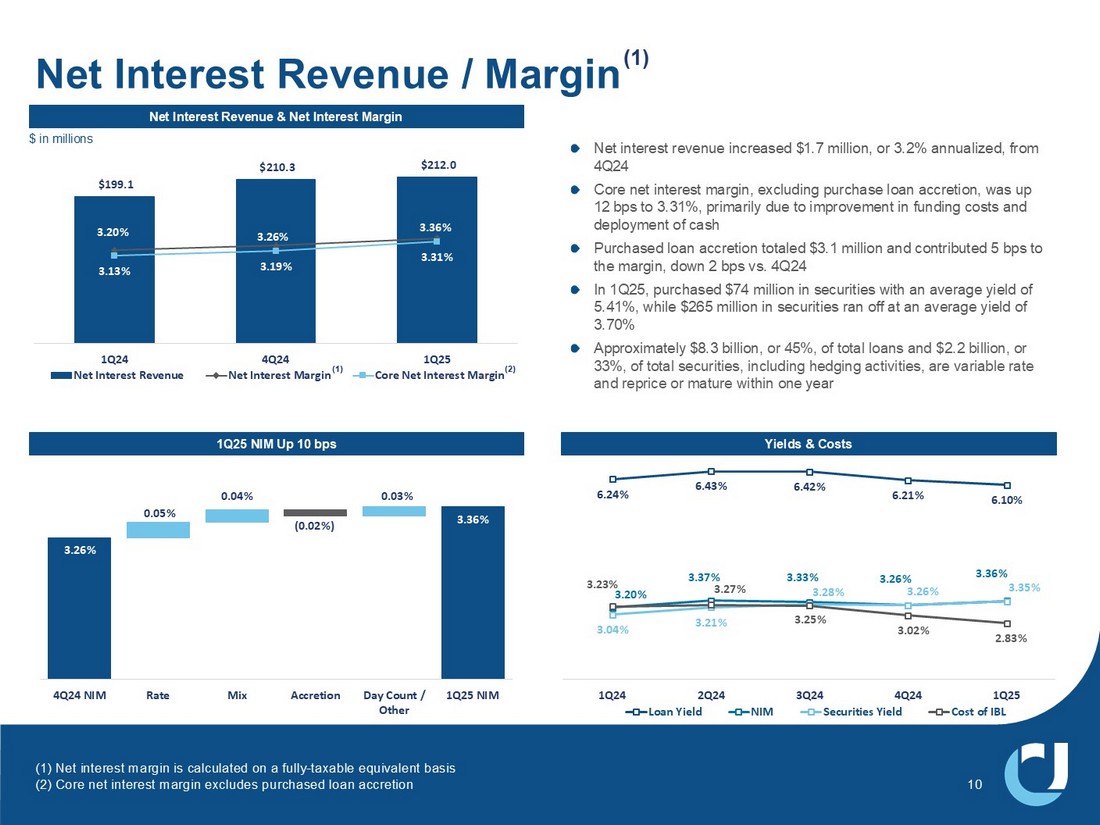
United’s net interest margin increased 10 basis points to 3.36% from the fourth quarter. The average yield on interest-earning assets was down four basis points to 5.29%, while the cost of interest-bearing liabilities decreased 19 basis points, leading to a 15-basis-point increase in the net interest spread. The 10-basis-point increase in net interest margin reflects progress in lowering the cost of funds through reduction in deposit rates and redemption of debt instruments, and to a lesser extent, the seasonal outflow of higher-priced public funds deposits.
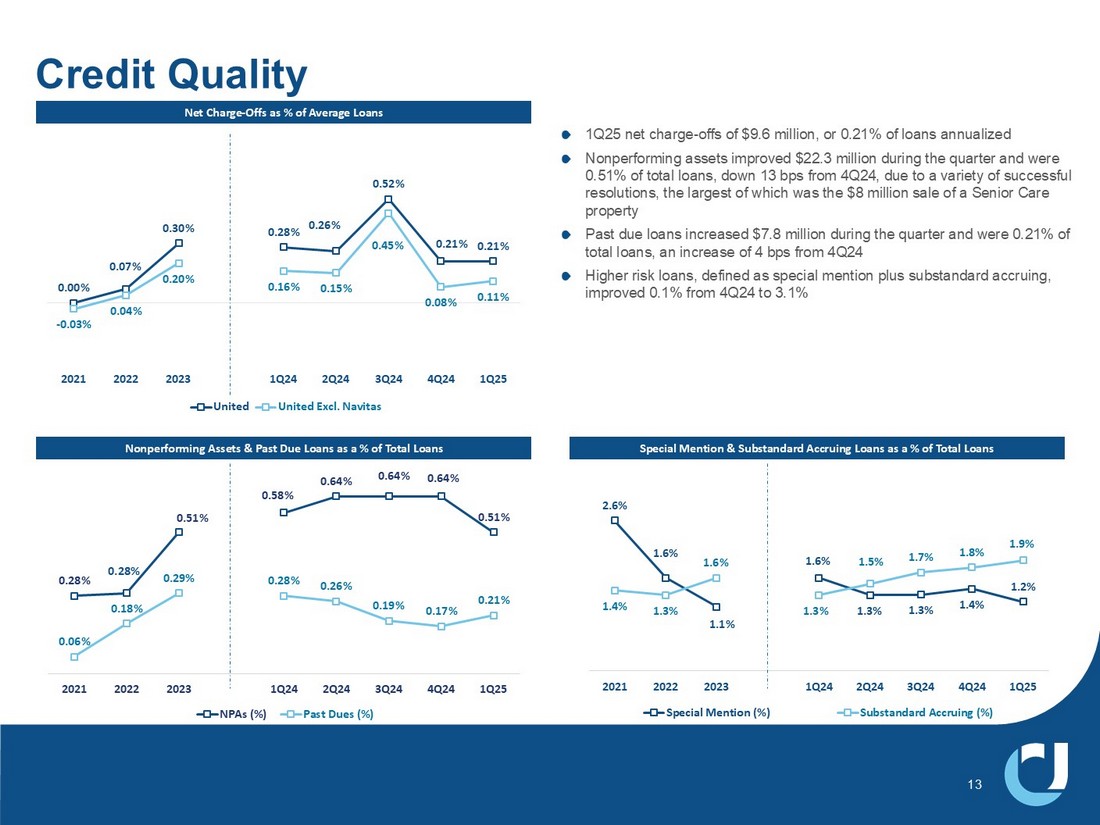
Net charge-offs were $9.6 million, or 0.21% of average loans, during the quarter, equal to the fourth quarter of 2024. Nonperforming assets were 33 basis points relative to total assets, improved from 42 basis points for the fourth quarter.
First Quarter 2025 Financial Highlights:
| • | EPS up $0.07 compared to first quarter 2024 on a GAAP basis and up $0.07, or 13%, on an operating basis; EPS down $0.03 compared to the fourth quarter on a GAAP basis and down $0.04, or 6%, on an operating basis |
| • | Total revenue improved $8.9 million, or 3.7%, year-over-year |
| • | Net interest margin of 3.36% increased by 10 basis points from the fourth quarter, reflecting a lower cost of funds |
| • | Loan production of $2.0 billion led to loan growth of $249 million, up 5.6% annualized, from the fourth quarter |
| • | Customer deposits were up $309 million from the fourth quarter, with most of the growth in money market deposits |
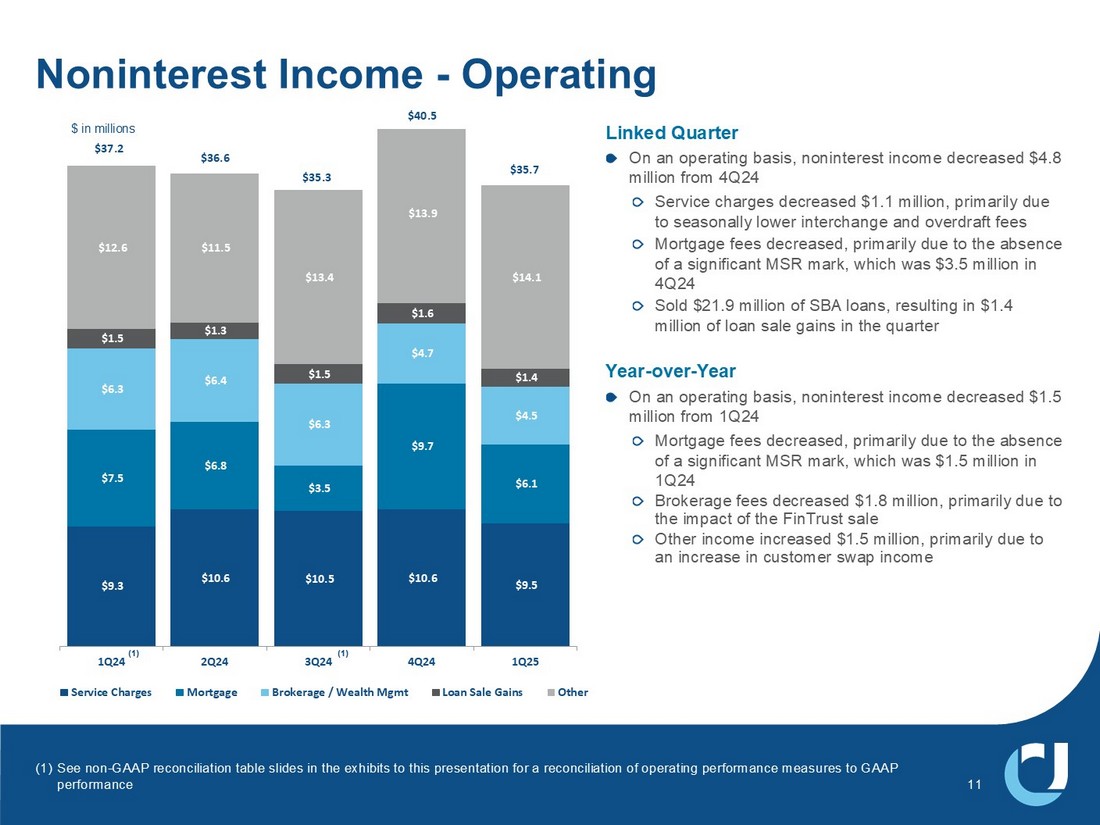
| • | Noninterest income was down $4.9 million on a linked quarter basis mostly due to the absence of unusual fourth quarter gains in the form of a mortgage servicing right write-up and other unusual gains |
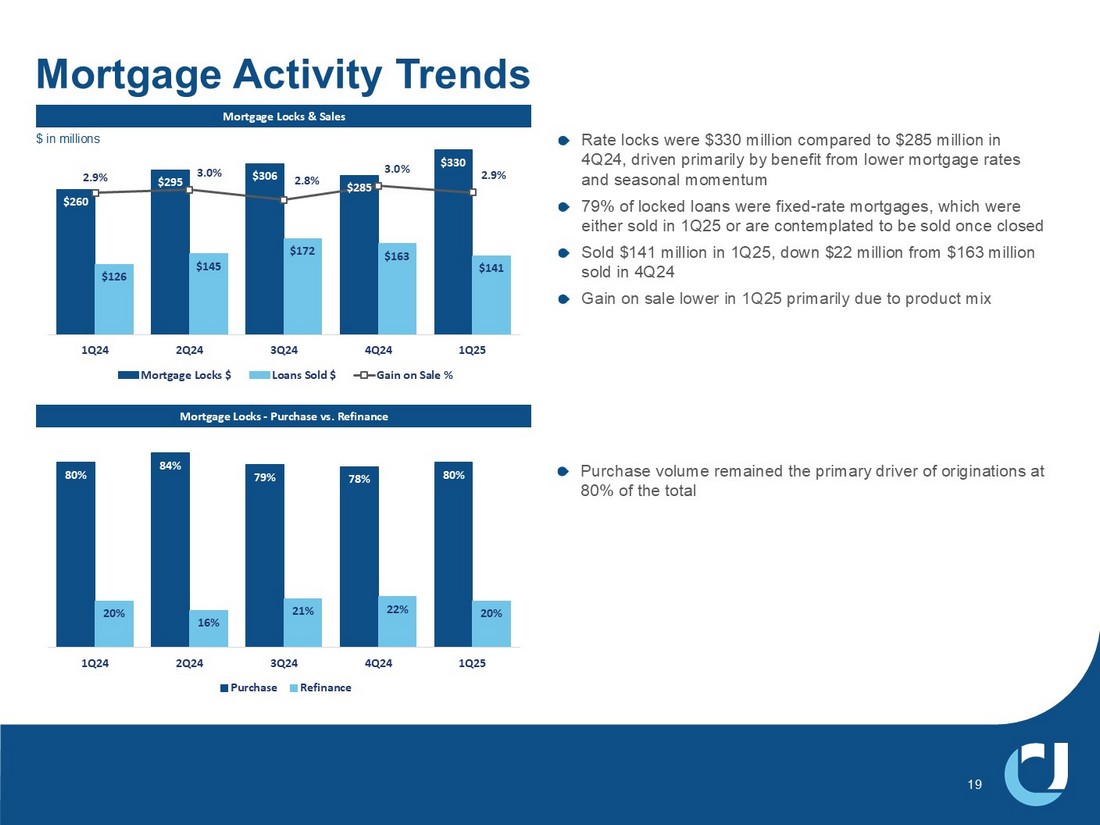
| • | Mortgage closings of $187 million compared to $171 million a year ago; mortgage rate locks of $330 million compared to $260 million a year ago |
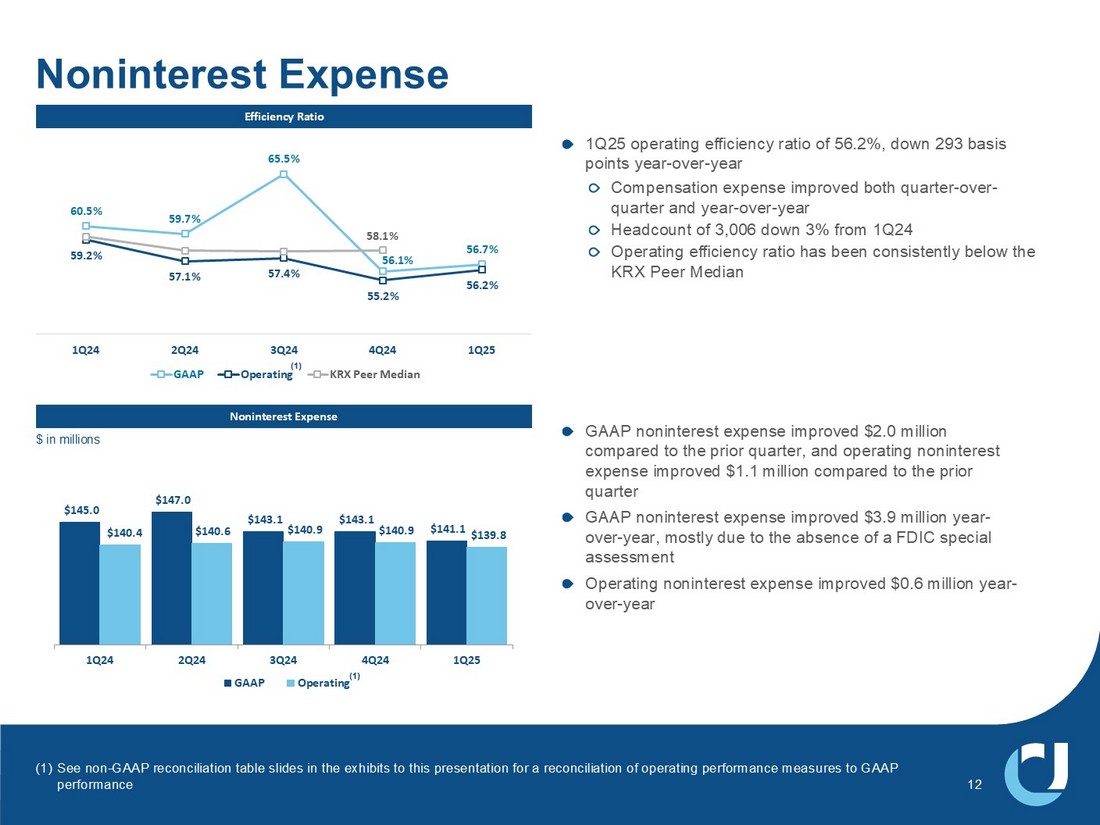
| • | Noninterest expenses improved $2.0 million compared to the fourth quarter on a GAAP basis and down $1.1 million on an operating basis |
| • | Efficiency ratio of 56.7%, or 56.2% on an operating basis |
| • | Net income of $71.4 million and pre-tax, pre-provision income of $106.6 million |
| • | Return on assets of 1.02%, or 1.04% on an operating basis |
| • | Pre-tax, pre-provision return on assets of 1.55% on an operating basis |
| • | Return on common equity of 7.9% |
| • | Return on tangible common equity of 11.2% on an operating basis |
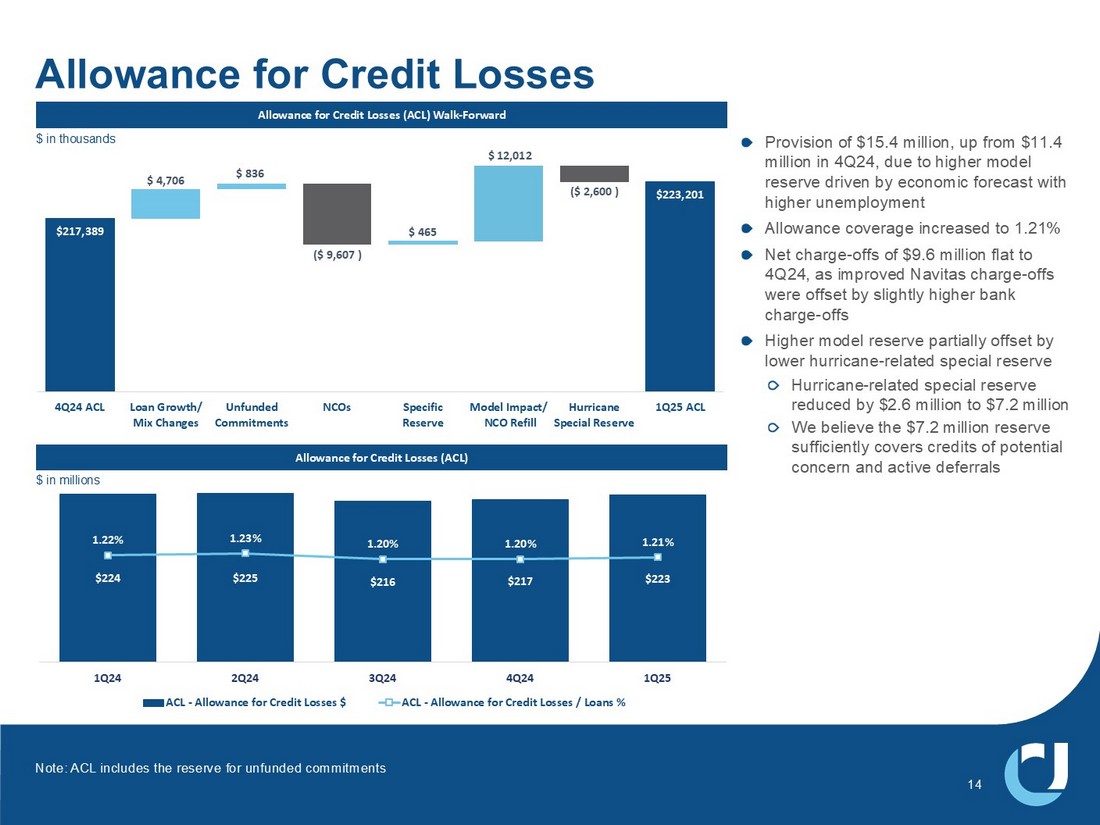
| • | Provision for credit losses was $15.4 million; allowance for credit losses coverage up slightly to 1.21% of total loans |
| • | Net charge-offs of $9.6 million, or 21 basis points as a percent of average loans |
| • | Nonperforming assets improved $22 million from December 31, 2024, to 0.33% of total assets |
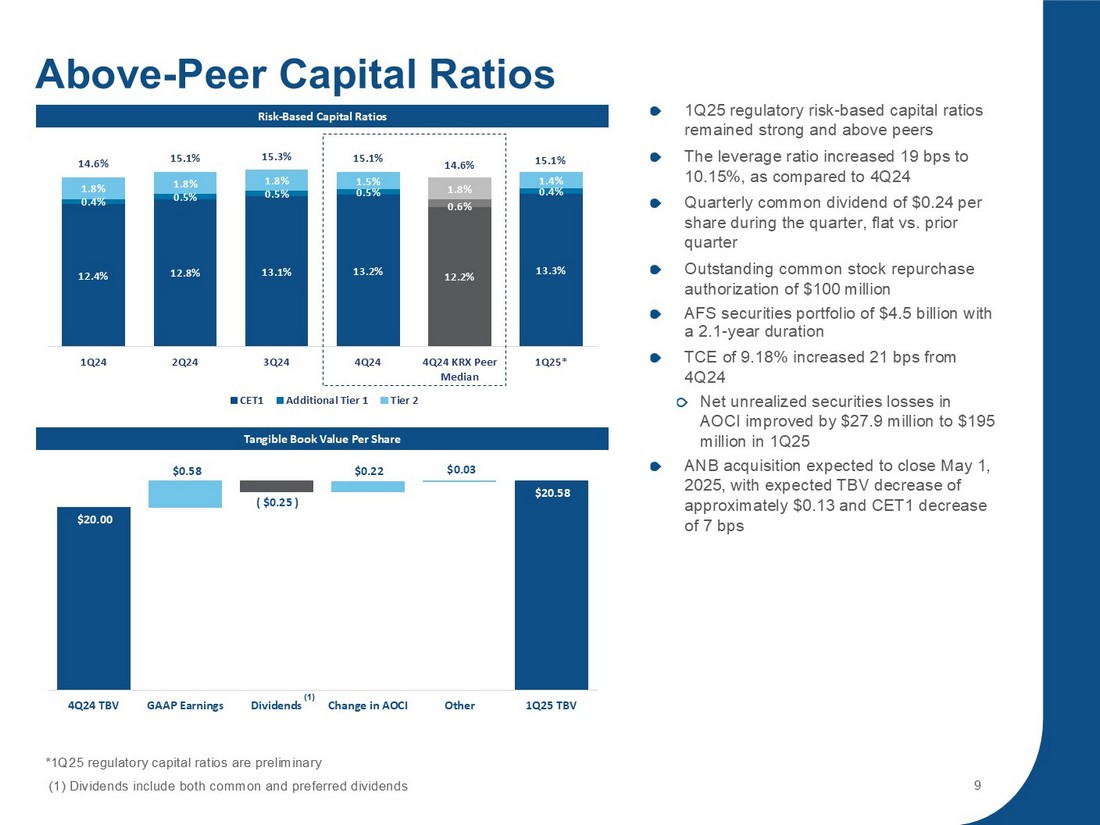
| • | Maintained robust capital ratios with preliminary Common Equity Tier 1 increasing to 13.3% |
| • | Quarterly common dividend of $0.24 per share declared during the quarter, up 4% year-over-year |
Conference Call
United will hold a conference call on Tuesday, April 22 at 9:00 a.m. ET to discuss the contents of this press release and to share business highlights for the quarter. Participants can pre-register for the conference call by navigating to https://dpregister.com/sreg/10198403/fed7e1f137. Those without internet access or unable to pre-register may dial in by calling 1-844-676-1337. Participants are encouraged to dial in 15 minutes prior to the call start time. The conference call also will be webcast and can be accessed by selecting “Events and Presentations” under “News and Events” within the Investor Relations section of the company's website, ucbi.com.
| UNITED COMMUNITY BANKS, INC. | |
| Selected Financial Information | |
| (in thousands, except per share data) |
| 2025 | 2024 | First Quarter | ||||||||||||||||||||||
First Quarter | Fourth Quarter | Third Quarter | Second Quarter | First Quarter | 2025 - 2024 Change | |||||||||||||||||||
| INCOME SUMMARY | ||||||||||||||||||||||||
| Interest revenue | $ | 335,357 | $ | 344,962 | $ | 349,086 | $ | 346,965 | $ | 336,728 | ||||||||||||||
| Interest expense | 123,336 | 134,629 | 139,900 | 138,265 | 137,579 | |||||||||||||||||||
| Net interest revenue | 212,021 | 210,333 | 209,186 | 208,700 | 199,149 | 6 | % | |||||||||||||||||
| Noninterest income | 35,656 | 40,522 | 8,091 | 36,556 | 39,587 | (10 | ) | |||||||||||||||||
| Total revenue | 247,677 | 250,855 | 217,277 | 245,256 | 238,736 | 4 | ||||||||||||||||||
| Provision for credit losses | 15,419 | 11,389 | 14,428 | 12,235 | 12,899 | |||||||||||||||||||
| Noninterest expenses | 141,099 | 143,056 | 143,065 | 147,044 | 145,002 | (3 | ) | |||||||||||||||||
| Income before income tax expense | 91,159 | 96,410 | 59,784 | 85,977 | 80,835 | 13 | ||||||||||||||||||
| Income tax expense | 19,746 | 20,606 | 12,437 | 19,362 | 18,204 | 8 | ||||||||||||||||||
| Net income | 71,413 | 75,804 | 47,347 | 66,615 | 62,631 | 14 | ||||||||||||||||||
| Non-operating items | 1,297 | 2,203 | 29,385 | 6,493 | 2,187 | |||||||||||||||||||
| Income tax benefit of non-operating items | (281 | ) | (471 | ) | (6,276 | ) | (1,462 | ) | (493 | ) | ||||||||||||||
| Net income - operating (1) | $ | 72,429 | $ | 77,536 | $ | 70,456 | $ | 71,646 | $ | 64,325 | 13 | |||||||||||||
| Pre-tax pre-provision income (5) | $ | 106,578 | $ | 107,799 | $ | 74,212 | $ | 98,212 | $ | 93,734 | 14 | |||||||||||||
| PERFORMANCE MEASURES | ||||||||||||||||||||||||
| Per common share: | ||||||||||||||||||||||||
| Diluted net income - GAAP | $ | 0.58 | $ | 0.61 | $ | 0.38 | $ | 0.54 | $ | 0.51 | 14 | |||||||||||||
| Diluted net income - operating (1) | 0.59 | 0.63 | 0.57 | 0.58 | 0.52 | 13 | ||||||||||||||||||
| Cash dividends declared | 0.24 | 0.24 | 0.24 | 0.23 | 0.23 | 4 | ||||||||||||||||||
| Book value | 28.42 | 27.87 | 27.68 | 27.18 | 26.83 | 6 | ||||||||||||||||||
| Tangible book value (3) | 20.58 | 20.00 | 19.66 | 19.13 | 18.71 | 10 | ||||||||||||||||||
| Key performance ratios: | ||||||||||||||||||||||||
| Return on common equity - GAAP (2)(4) | 7.89 | % | 8.40 | % | 5.20 | % | 7.53 | % | 7.14 | % | ||||||||||||||
| Return on common equity - operating (1)(2)(4) | 8.01 | 8.60 | 7.82 | 8.12 | 7.34 | |||||||||||||||||||
| Return on tangible common equity - operating (1)(2)(3)(4) | 11.21 | 12.12 | 11.17 | 11.68 | 10.68 | |||||||||||||||||||
| Return on assets - GAAP (4) | 1.02 | 1.06 | 0.67 | 0.97 | 0.90 | |||||||||||||||||||
| Return on assets - operating (1)(4) | 1.04 | 1.08 | 1.01 | 1.04 | 0.93 | |||||||||||||||||||
| Return on assets - pre-tax pre-provision, excluding non-operating items(1)(4)(5) | 1.55 | 1.55 | 1.50 | 1.54 | 1.40 | |||||||||||||||||||
| Net interest margin (fully taxable equivalent) (4) | 3.36 | 3.26 | 3.33 | 3.37 | 3.20 | |||||||||||||||||||
| Efficiency ratio - GAAP | 56.74 | 56.05 | 65.51 | 59.70 | 60.47 | |||||||||||||||||||
| Efficiency ratio - operating (1) | 56.22 | 55.18 | 57.37 | 57.06 | 59.15 | |||||||||||||||||||
| Equity to total assets | 12.56 | 12.38 | 12.45 | 12.35 | 12.06 | |||||||||||||||||||
| Tangible common equity to tangible assets (3) | 9.18 | 8.97 | 8.93 | 8.78 | 8.49 | |||||||||||||||||||
| ASSET QUALITY | ||||||||||||||||||||||||
| Nonperforming assets ("NPAs") | $ | 93,290 | $ | 115,635 | $ | 114,960 | $ | 116,722 | $ | 107,230 | (13 | ) | ||||||||||||
| Allowance for credit losses - loans | 211,974 | 206,998 | 205,290 | 213,022 | 210,934 | — | ||||||||||||||||||
| Allowance for credit losses - total | 223,201 | 217,389 | 215,517 | 224,740 | 224,119 | — | ||||||||||||||||||
| Net charge-offs | 9,607 | 9,517 | 23,651 | 11,614 | 12,908 | |||||||||||||||||||
| Allowance for credit losses - loans to loans | 1.15 | % | 1.14 | % | 1.14 | % | 1.17 | % | 1.15 | % | ||||||||||||||
| Allowance for credit losses - total to loans | 1.21 | 1.20 | 1.20 | 1.23 | 1.22 | |||||||||||||||||||
| Net charge-offs to average loans (4) | 0.21 | 0.21 | 0.52 | 0.26 | 0.28 | |||||||||||||||||||
| NPAs to total assets | 0.33 | 0.42 | 0.42 | 0.43 | 0.39 | |||||||||||||||||||
| AT PERIOD END ($ in millions) | ||||||||||||||||||||||||
| Loans | $ | 18,425 | $ | 18,176 | $ | 17,964 | $ | 18,211 | $ | 18,375 | — | |||||||||||||
| Investment securities | 6,661 | 6,804 | 6,425 | 6,038 | 5,859 | 14 | ||||||||||||||||||
| Total assets | 27,874 | 27,720 | 27,373 | 27,057 | 27,365 | 2 | ||||||||||||||||||
| Deposits | 23,762 | 23,461 | 23,253 | 22,982 | 23,332 | 2 | ||||||||||||||||||
| Shareholders’ equity | 3,501 | 3,432 | 3,407 | 3,343 | 3,300 | 6 | ||||||||||||||||||
| Common shares outstanding (thousands) | 119,514 | 119,364 | 119,283 | 119,175 | 119,137 | — | ||||||||||||||||||
(1) Excludes non-operating items as detailed on Non-GAAP Performance Measures Reconciliation on next page. (2) Net income less preferred stock dividends, divided by average realized common equity, which excludes accumulated other comprehensive income (loss). (3) Excludes effect of acquisition related intangibles and associated amortization. (4) Annualized. (5) Excludes income tax expense and provision for credit losses.
| UNITED COMMUNITY BANKS, INC. |
| Non-GAAP Performance Measures Reconciliation |
| (in thousands, except per share data) |
| 2025 | 2024 | |||||||||||||||||||
First Quarter | Fourth Quarter | Third Quarter | Second Quarter | First Quarter | ||||||||||||||||
| Noninterest income reconciliation | ||||||||||||||||||||
| Noninterest income (GAAP) | $ | 35,656 | $ | 40,522 | $ | 8,091 | $ | 36,556 | $ | 39,587 | ||||||||||
| Loss on sale of manufactured housing loans | — | — | 27,209 | — | — | |||||||||||||||
| Gain on lease termination | — | — | — | — | (2,400 | ) | ||||||||||||||
| Noninterest income - operating | $ | 35,656 | $ | 40,522 | $ | 35,300 | $ | 36,556 | $ | 37,187 | ||||||||||
| Noninterest expense reconciliation | ||||||||||||||||||||
| Noninterest expenses (GAAP) | $ | 141,099 | $ | 143,056 | $ | 143,065 | $ | 147,044 | $ | 145,002 | ||||||||||
| Loss on FinTrust (goodwill impairment) | — | — | — | (5,100 | ) | — | ||||||||||||||
| FDIC special assessment | — | — | — | 764 | (2,500 | ) | ||||||||||||||
| Merger-related and other charges | (1,297 | ) | (2,203 | ) | (2,176 | ) | (2,157 | ) | (2,087 | ) | ||||||||||
| Noninterest expenses - operating | $ | 139,802 | $ | 140,853 | $ | 140,889 | $ | 140,551 | $ | 140,415 | ||||||||||
| Net income to operating income reconciliation | ||||||||||||||||||||
| Net income (GAAP) | $ | 71,413 | $ | 75,804 | $ | 47,347 | $ | 66,615 | $ | 62,631 | ||||||||||
| Loss on sale of manufactured housing loans | — | — | 27,209 | — | — | |||||||||||||||
| Gain on lease termination | — | — | — | — | (2,400 | ) | ||||||||||||||
| Loss on FinTrust (goodwill impairment) | — | — | — | 5,100 | — | |||||||||||||||
| FDIC special assessment | — | — | — | (764 | ) | 2,500 | ||||||||||||||
| Merger-related and other charges | 1,297 | 2,203 | 2,176 | 2,157 | 2,087 | |||||||||||||||
| Income tax benefit of non-operating items | (281 | ) | (471 | ) | (6,276 | ) | (1,462 | ) | (493 | ) | ||||||||||
| Net income - operating | $ | 72,429 | $ | 77,536 | $ | 70,456 | $ | 71,646 | $ | 64,325 | ||||||||||
| Net income to pre-tax pre-provision income reconciliation | ||||||||||||||||||||
| Net income (GAAP) | $ | 71,413 | $ | 75,804 | $ | 47,347 | $ | 66,615 | $ | 62,631 | ||||||||||
| Income tax expense | 19,746 | 20,606 | 12,437 | 19,362 | 18,204 | |||||||||||||||
| Provision for credit losses | 15,419 | 11,389 | 14,428 | 12,235 | 12,899 | |||||||||||||||
| Pre-tax pre-provision income | $ | 106,578 | $ | 107,799 | $ | 74,212 | $ | 98,212 | $ | 93,734 | ||||||||||
| Diluted income per common share reconciliation | ||||||||||||||||||||
| Diluted income per common share (GAAP) | $ | 0.58 | $ | 0.61 | $ | 0.38 | $ | 0.54 | $ | 0.51 | ||||||||||
| Loss on sale of manufactured housing loans | — | — | 0.18 | — | — | |||||||||||||||
| Gain on lease termination | — | — | — | — | (0.02 | ) | ||||||||||||||
| Loss on FinTrust (goodwill impairment) | — | — | — | 0.03 | — | |||||||||||||||
| FDIC special assessment | — | — | — | — | 0.02 | |||||||||||||||
| Merger-related and other charges | 0.01 | 0.02 | 0.01 | 0.01 | 0.01 | |||||||||||||||
| Diluted income per common share - operating | $ | 0.59 | $ | 0.63 | $ | 0.57 | $ | 0.58 | $ | 0.52 | ||||||||||
| Book value per common share reconciliation | ||||||||||||||||||||
| Book value per common share (GAAP) | $ | 28.42 | $ | 27.87 | $ | 27.68 | $ | 27.18 | $ | 26.83 | ||||||||||
| Effect of goodwill and other intangibles | (7.84 | ) | (7.87 | ) | (8.02 | ) | (8.05 | ) | (8.12 | ) | ||||||||||
| Tangible book value per common share | $ | 20.58 | $ | 20.00 | $ | 19.66 | $ | 19.13 | $ | 18.71 | ||||||||||
| Return on tangible common equity reconciliation | ||||||||||||||||||||
| Return on common equity (GAAP) | 7.89 | % | 8.40 | % | 5.20 | % | 7.53 | % | 7.14 | % | ||||||||||
| Loss on sale of manufactured housing loans | — | — | 2.43 | — | — | |||||||||||||||
| Gain on lease termination | — | — | — | — | (0.22 | ) | ||||||||||||||
| Loss on FinTrust (goodwill impairment) | — | — | — | 0.46 | — | |||||||||||||||
| FDIC special assessment | — | — | — | (0.07 | ) | 0.23 | ||||||||||||||
| Merger-related and other charges | 0.12 | 0.20 | 0.19 | 0.20 | 0.19 | |||||||||||||||
| Return on common equity - operating | 8.01 | 8.60 | 7.82 | 8.12 | 7.34 | |||||||||||||||
| Effect of goodwill and other intangibles | 3.20 | 3.52 | 3.35 | 3.56 | 3.34 | |||||||||||||||
| Return on tangible common equity - operating | 11.21 | % | 12.12 | % | 11.17 | % | 11.68 | % | 10.68 | % | ||||||||||
| Return on assets reconciliation | ||||||||||||||||||||
| Return on assets (GAAP) | 1.02 | % | 1.06 | % | 0.67 | % | 0.97 | % | 0.90 | % | ||||||||||
| Loss on sale of manufactured housing loans | — | — | 0.31 | — | — | |||||||||||||||
| Gain on lease termination | — | — | — | — | (0.03 | ) | ||||||||||||||
| Loss on FinTrust (goodwill impairment) | — | — | — | 0.06 | — | |||||||||||||||
| FDIC special assessment | — | — | — | (0.01 | ) | 0.03 | ||||||||||||||
| Merger-related and other charges | 0.02 | 0.02 | 0.03 | 0.02 | 0.03 | |||||||||||||||
| Return on assets - operating | 1.04 | % | 1.08 | % | 1.01 | % | 1.04 | % | 0.93 | % | ||||||||||
| Return on assets to return on assets- pre-tax pre-provision reconciliation | ||||||||||||||||||||
| Return on assets (GAAP) | 1.02 | % | 1.06 | % | 0.67 | % | 0.97 | % | 0.90 | % | ||||||||||
| Income tax expense | 0.29 | 0.30 | 0.19 | 0.29 | 0.27 | |||||||||||||||
| Provision for credit losses | 0.23 | 0.16 | 0.21 | 0.18 | 0.19 | |||||||||||||||
| UNITED COMMUNITY BANKS, INC. |
| Non-GAAP Performance Measures Reconciliation |
| (in thousands, except per share data) |
| 2025 | 2024 | |||||||||||||||||||
First Quarter | Fourth Quarter | Third Quarter | Second Quarter | First Quarter | ||||||||||||||||
| Loss on sale of manufactured housing loans | — | — | 0.40 | — | — | |||||||||||||||
| Gain on lease termination | — | — | — | — | (0.04 | ) | ||||||||||||||
| Loss on FinTrust (goodwill impairment) | — | — | — | 0.08 | — | |||||||||||||||
| FDIC special assessment | — | — | — | (0.01 | ) | 0.04 | ||||||||||||||
| Merger-related and other charges | 0.01 | 0.03 | 0.03 | 0.03 | 0.04 | |||||||||||||||
| Return on assets - pre-tax pre-provision - operating | 1.55 | % | 1.55 | % | 1.50 | % | 1.54 | % | 1.40 | % | ||||||||||
| Efficiency ratio reconciliation | ||||||||||||||||||||
| Efficiency ratio (GAAP) | 56.74 | % | 56.05 | % | 65.51 | % | 59.70 | % | 60.47 | % | ||||||||||
| Loss on sale of manufactured housing loans | — | — | (7.15 | ) | — | — | ||||||||||||||
| Gain on lease termination | — | — | — | — | 0.60 | |||||||||||||||
| Loss on FinTrust (goodwill impairment) | — | — | — | (2.07 | ) | — | ||||||||||||||
| FDIC special assessment | — | — | — | 0.31 | (1.05 | ) | ||||||||||||||
| Merger-related and other charges | (0.52 | ) | (0.87 | ) | (0.99 | ) | (0.88 | ) | (0.87 | ) | ||||||||||
| Efficiency ratio - operating | 56.22 | % | 55.18 | % | 57.37 | % | 57.06 | % | 59.15 | % | ||||||||||
| Tangible common equity to tangible assets reconciliation | ||||||||||||||||||||
| Equity to total assets (GAAP) | 12.56 | % | 12.38 | % | 12.45 | % | 12.35 | % | 12.06 | % | ||||||||||
| Effect of goodwill and other intangibles | (3.06 | ) | (3.09 | ) | (3.20 | ) | (3.24 | ) | (3.25 | ) | ||||||||||
| Effect of preferred equity | (0.32 | ) | (0.32 | ) | (0.32 | ) | (0.33 | ) | (0.32 | ) | ||||||||||
| Tangible common equity to tangible assets | 9.18 | % | 8.97 | % | 8.93 | % | 8.78 | % | 8.49 | % | ||||||||||
| UNITED COMMUNITY BANKS, INC. | |||||||||||
| Loan Portfolio Composition at Period-End |
| 2025 | 2024 | Linked | Year over | |||||||||||||||||||||||||
| (in millions) | First Quarter | Fourth Quarter | Third Quarter | Second Quarter | First Quarter | Quarter Change | Year Change | |||||||||||||||||||||
| LOANS BY CATEGORY | ||||||||||||||||||||||||||||
| Owner occupied commercial RE | $ | 3,419 | $ | 3,398 | $ | 3,323 | $ | 3,297 | $ | 3,310 | $ | 21 | $ | 109 | ||||||||||||||
| Income producing commercial RE | 4,416 | 4,361 | 4,259 | 4,058 | 4,206 | 55 | 210 | |||||||||||||||||||||
| Commercial & industrial | 2,506 | 2,428 | 2,313 | 2,299 | 2,405 | 78 | 101 | |||||||||||||||||||||
| Commercial construction | 1,681 | 1,656 | 1,785 | 2,014 | 1,936 | 25 | (255 | ) | ||||||||||||||||||||
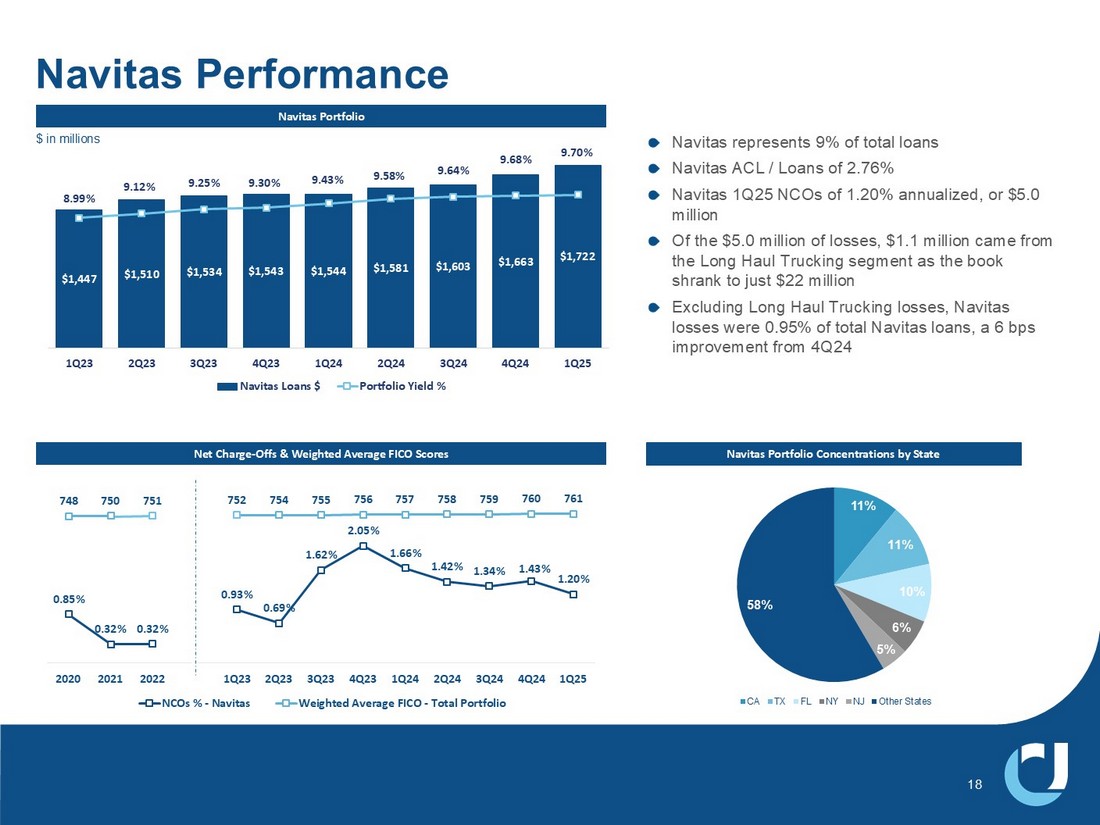
| Equipment financing | 1,723 | 1,663 | 1,603 | 1,581 | 1,544 | 60 | 179 | |||||||||||||||||||||
| Total commercial | 13,745 | 13,506 | 13,283 | 13,249 | 13,401 | 239 | 344 | |||||||||||||||||||||
| Residential mortgage | 3,218 | 3,232 | 3,263 | 3,266 | 3,240 | (14 | ) | (22 | ) | |||||||||||||||||||
| Home equity | 1,099 | 1,065 | 1,015 | 985 | 969 | 34 | 130 | |||||||||||||||||||||
| Residential construction | 171 | 178 | 189 | 211 | 257 | (7 | ) | (86 | ) | |||||||||||||||||||
| Manufactured housing (1) | — | 2 | 2 | 321 | 328 | (2 | ) | (328 | ) | |||||||||||||||||||
| Consumer | 183 | 186 | 188 | 183 | 180 | (3 | ) | 3 | ||||||||||||||||||||
| Other | 9 | 7 | 24 | (4 | ) | — | 2 | 9 | ||||||||||||||||||||
| Total loans | $ | 18,425 | $ | 18,176 | $ | 17,964 | $ | 18,211 | $ | 18,375 | $ | 249 | $ | 50 | ||||||||||||||
| LOANS BY MARKET | ||||||||||||||||||||||||||||
| Georgia | $ | 4,484 | $ | 4,447 | $ | 4,470 | $ | 4,411 | $ | 4,356 | $ | 37 | $ | 128 | ||||||||||||||
| South Carolina | 2,821 | 2,815 | 2,782 | 2,779 | 2,804 | 6 | 17 | |||||||||||||||||||||
| North Carolina | 2,666 | 2,644 | 2,586 | 2,591 | 2,566 | 22 | 100 | |||||||||||||||||||||
| Tennessee | 1,880 | 1,799 | 1,848 | 2,144 | 2,209 | 81 | (329 | ) | ||||||||||||||||||||
| Florida | 2,572 | 2,527 | 2,423 | 2,407 | 2,443 | 45 | 129 | |||||||||||||||||||||
| Alabama | 1,009 | 996 | 996 | 1,021 | 1,068 | 13 | (59 | ) | ||||||||||||||||||||
| Commercial Banking Solutions | 2,993 | 2,948 | 2,859 | 2,858 | 2,929 | 45 | 64 | |||||||||||||||||||||
| Total loans | $ | 18,425 | $ | 18,176 | $ | 17,964 | $ | 18,211 | $ | 18,375 | $ | 249 | $ | 50 | ||||||||||||||
(1) At March 31, 2025, manufactured housing loans are included with consumer loans.
| UNITED COMMUNITY BANKS, INC. | |||||||
| Credit Quality | |||||||
| (in thousands) |
| 2025 | 2024 | |||||||||||
First Quarter | Fourth Quarter | Third Quarter | ||||||||||
| NONACCRUAL LOANS | ||||||||||||
| Owner occupied RE | $ | 8,949 | $ | 11,674 | $ | 7,783 | ||||||
| Income producing RE | 16,536 | 25,357 | 31,222 | |||||||||
| Commercial & industrial | 22,396 | 29,339 | 28,856 | |||||||||
| Commercial construction | 5,558 | 7,400 | 7,356 | |||||||||
| Equipment financing | 8,818 | 8,925 | 9,123 | |||||||||
| Total commercial | 62,257 | 82,695 | 84,340 | |||||||||
| Residential mortgage | 22,756 | 24,615 | 21,851 | |||||||||
| Home equity | 4,091 | 4,630 | 4,111 | |||||||||
| Residential construction | 811 | 57 | 118 | |||||||||
| Manufactured housing (2) | — | 1,444 | 1,808 | |||||||||
| Consumer | 1,423 | 138 | 152 | |||||||||
| Total nonaccrual loans | 91,338 | 113,579 | 112,380 | |||||||||
| OREO and repossessed assets | 1,952 | 2,056 | 2,580 | |||||||||
| Total NPAs | $ | 93,290 | $ | 115,635 | $ | 114,960 | ||||||
| 2025 | 2024 | |||||||||||||||||||||||
| First Quarter | Fourth Quarter | Third Quarter | ||||||||||||||||||||||
| (in thousands) | Net Charge-Offs | Net Charge-Offs to Average Loans (1) | Net Charge-Offs | Net Charge-Offs to Average Loans (1) | Net Charge-Offs | Net Charge-Offs to Average Loans (1) | ||||||||||||||||||
| NET CHARGE-OFFS (RECOVERIES) BY CATEGORY | ||||||||||||||||||||||||
| Owner occupied RE | $ | 126 | 0.02 | % | $ | (184 | ) | (0.02 | )% | $ | (184 | ) | (0.02 | )% | ||||||||||
| Income producing RE | 718 | 0.07 | (1,001 | ) | (0.09 | ) | 1,409 | 0.13 | ||||||||||||||||
| Commercial & industrial | 2,447 | 0.40 | 4,075 | 0.69 | 4,577 | 0.79 | ||||||||||||||||||
| Commercial construction | (138 | ) | (0.03 | ) | 2 | — | 36 | 0.01 | ||||||||||||||||
| Equipment financing | 5,042 | 1.21 | 5,812 | 1.43 | 5,268 | 1.32 | ||||||||||||||||||
| Total commercial | 8,195 | 0.24 | 8,704 | 0.26 | 11,106 | 0.33 | ||||||||||||||||||
| Residential mortgage | (1 | ) | — | 145 | 0.02 | 32 | — | |||||||||||||||||
| Home equity | (62 | ) | (0.02 | ) | (33 | ) | (0.01 | ) | 36 | 0.01 | ||||||||||||||
| Residential construction | 219 | 0.51 | 7 | 0.02 | 111 | 0.22 | ||||||||||||||||||
| Manufactured housing (2) | — | — | 114 | 23.41 | 11,556 | 28.51 | ||||||||||||||||||
| Consumer | 1,256 | 2.76 | 580 | 1.24 | 810 | 1.74 | ||||||||||||||||||
| Total | $ | 9,607 | 0.21 | $ | 9,517 | 0.21 | $ | 23,651 | 0.52 | |||||||||||||||
(1) Annualized.
(2) At March 31, 2025, manufactured housing loans are included with consumer loans.
| UNITED COMMUNITY BANKS, INC. |
| Consolidated Balance Sheets (Unaudited) |
| (in thousands, except share and per share data) | March 31, 2025 | December 31, 2024 | ||||||
| ASSETS | ||||||||
| Cash and due from banks | $ | 198,287 | $ | 296,161 | ||||
| Interest-bearing deposits in banks | 438,425 | 223,712 | ||||||
| Cash and cash equivalents | 636,712 | 519,873 | ||||||
| Debt securities available-for-sale | 4,322,644 | 4,436,291 | ||||||
| Debt securities held-to-maturity (fair value $1,952,235 and $1,944,126, respectively) | 2,338,571 | 2,368,107 | ||||||
| Loans held for sale | 37,344 | 57,534 | ||||||
| Loans and leases held for investment | 18,425,365 | 18,175,980 | ||||||
| Less allowance for credit losses - loans and leases | (211,974 | ) | (206,998 | ) | ||||
| Loans and leases, net | 18,213,391 | 17,968,982 | ||||||
| Premises and equipment, net | 391,020 | 394,264 | ||||||
| Bank owned life insurance | 346,410 | 346,234 | ||||||
| Goodwill and other intangible assets, net | 953,357 | 956,643 | ||||||
| Other assets | 634,269 | 672,330 | ||||||
| Total assets | $ | 27,873,718 | $ | 27,720,258 | ||||
| LIABILITIES AND SHAREHOLDERS' EQUITY | ||||||||
| Liabilities: | ||||||||
| Deposits: | ||||||||
| Noninterest-bearing demand | $ | 6,257,032 | $ | 6,211,182 | ||||
| NOW and interest-bearing demand | 6,155,141 | 6,141,342 | ||||||
| Money market | 6,637,506 | 6,398,144 | ||||||
| Savings | 1,105,374 | 1,100,591 | ||||||
| Time | 3,446,567 | 3,441,424 | ||||||
| Brokered | 160,785 | 168,292 | ||||||
| Total deposits | 23,762,405 | 23,460,975 | ||||||
| Short-term borrowings | — | 195,000 | ||||||
| Long-term debt | 254,287 | 254,152 | ||||||
| Accrued expenses and other liabilities | 356,130 | 378,004 | ||||||
| Total liabilities | 24,372,822 | 24,288,131 | ||||||
| Shareholders' equity: | ||||||||
| Preferred stock; $1 par value; 10,000,000 shares authorized; 3,662 shares Series I issued and outstanding; $25,000 per share liquidation preference | 88,266 | 88,266 | ||||||
| Common stock, $1 par value; 200,000,000 shares authorized, 119,514,298 and 119,364,110 shares issued and outstanding, respectively | 119,514 | 119,364 | ||||||
| Common stock issuable; 584,083 and 600,168 shares, respectively | 12,983 | 12,999 | ||||||
| Capital surplus | 2,711,721 | 2,710,279 | ||||||
| Retained earnings | 754,971 | 714,138 | ||||||
| Accumulated other comprehensive loss | (186,559 | ) | (212,919 | ) | ||||
| Total shareholders' equity | 3,500,896 | 3,432,127 | ||||||
| Total liabilities and shareholders' equity | $ | 27,873,718 | $ | 27,720,258 | ||||
| UNITED COMMUNITY BANKS, INC. |
| Consolidated Statements of Income (Unaudited) |
Three Months Ended March 31, | ||||||||
| (in thousands, except per share data) | 2025 | 2024 | ||||||
| Interest revenue: | ||||||||
| Loans, including fees | $ | 274,056 | $ | 283,983 | ||||
| Investment securities, including tax exempt of $1,678 and $1,721, respectively | 58,850 | 46,436 | ||||||
| Deposits in banks and short-term investments | 2,451 | 6,309 | ||||||
| Total interest revenue | 335,357 | 336,728 | ||||||
| Interest expense: | ||||||||
| Deposits: | ||||||||
| NOW and interest-bearing demand | 37,390 | 46,211 | ||||||
| Money market | 49,541 | 50,478 | ||||||
| Savings | 624 | 706 | ||||||
| Time | 31,379 | 36,389 | ||||||
| Deposits | 118,934 | 133,784 | ||||||
| Short-term borrowings | 1,107 | — | ||||||
| Federal Home Loan Bank advances | 433 | — | ||||||
| Long-term debt | 2,862 | 3,795 | ||||||
| Total interest expense | 123,336 | 137,579 | ||||||
| Net interest revenue | 212,021 | 199,149 | ||||||
| Noninterest income: | ||||||||
| Service charges and fees | 9,535 | 9,264 | ||||||
| Mortgage loan gains and other related fees | 6,122 | 7,511 | ||||||
| Wealth management fees | 4,465 | 6,313 | ||||||
| Net gains from sales of other loans | 1,396 | 1,537 | ||||||
| Lending and loan servicing fees | 4,165 | 4,210 | ||||||
| Securities gains, net | 6 | — | ||||||
| Other | 9,967 | 10,752 | ||||||
| Total noninterest income | 35,656 | 39,587 | ||||||
| Provision for credit losses | 15,419 | 12,899 | ||||||
| Noninterest expenses: | ||||||||
| Salaries and employee benefits | 84,267 | 84,985 | ||||||
| Communications and equipment | 13,699 | 11,920 | ||||||
| Occupancy | 10,929 | 11,099 | ||||||
| Advertising and public relations | 1,881 | 1,901 | ||||||
| Postage, printing and supplies | 2,561 | 2,648 | ||||||
| Professional fees | 5,931 | 5,988 | ||||||
| Lending and loan servicing expense | 1,987 | 1,827 | ||||||
| Outside services - electronic banking | 2,763 | 2,918 | ||||||
| FDIC assessments and other regulatory charges | 4,642 | 7,566 | ||||||
| Amortization of intangibles | 3,286 | 3,887 | ||||||
| Merger-related and other charges | 1,297 | 2,087 | ||||||
| Other | 7,856 | 8,176 | ||||||
| Total noninterest expenses | 141,099 | 145,002 | ||||||
| Income before income taxes | 91,159 | 80,835 | ||||||
| Income tax expense | 19,746 | 18,204 | ||||||
| Net income | 71,413 | 62,631 | ||||||
| Preferred stock dividends | 1,573 | 1,573 | ||||||
| Earnings allocated to participating securities | 411 | 345 | ||||||
| Net income available to common shareholders | $ | 69,429 | $ | 60,713 | ||||
| Net income per common share: | ||||||||
| Basic | $ | 0.58 | $ | 0.51 | ||||
| Diluted | 0.58 | 0.51 | ||||||
| Weighted average common shares outstanding: | ||||||||
| Basic | 120,043 | 119,662 | ||||||
| Diluted | 120,201 | 119,743 | ||||||
| UNITED COMMUNITY BANKS, INC. |
| Average Consolidated Balance Sheets and Net Interest Analysis |
| For the Three Months Ended March 31, |
| 2025 | 2024 | |||||||||||||||||||||||
| (dollars in thousands, fully taxable equivalent (FTE)) | Average Balance | Interest | Average Rate | Average Balance | Interest | Average Rate | ||||||||||||||||||
| Assets: | ||||||||||||||||||||||||
| Interest-earning assets: | ||||||||||||||||||||||||
| Loans, net of unearned income (FTE) (1)(2) | $ | 18,213,501 | $ | 273,930 | 6.10 | % | $ | 18,299,739 | $ | 283,960 | 6.24 | % | ||||||||||||
| Taxable securities (3) | 6,737,658 | 57,172 | 3.39 | 5,828,391 | 44,715 | 3.07 | ||||||||||||||||||
| Tax-exempt securities (FTE) (1)(3) | 356,712 | 2,245 | 2.52 | 366,350 | 2,311 | 2.52 | ||||||||||||||||||
| Federal funds sold and other interest-earning assets | 400,592 | 3,001 | 3.04 | 674,594 | 6,805 | 4.06 | ||||||||||||||||||
| Total interest-earning assets (FTE) | 25,708,463 | 336,348 | 5.29 | 25,169,074 | 337,791 | 5.39 | ||||||||||||||||||
| Noninterest-earning assets: | ||||||||||||||||||||||||
| Allowance for credit losses | (210,169 | ) | (212,996 | ) | ||||||||||||||||||||
| Cash and due from banks | 219,540 | 221,203 | ||||||||||||||||||||||
| Premises and equipment | 396,443 | 386,021 | ||||||||||||||||||||||
| Other assets (3) | 1,610,104 | 1,618,315 | ||||||||||||||||||||||
| Total assets | $ | 27,724,381 | $ | 27,181,617 | ||||||||||||||||||||
| Liabilities and Shareholders' Equity: | ||||||||||||||||||||||||
| Interest-bearing liabilities: | ||||||||||||||||||||||||
| Interest-bearing deposits: | ||||||||||||||||||||||||
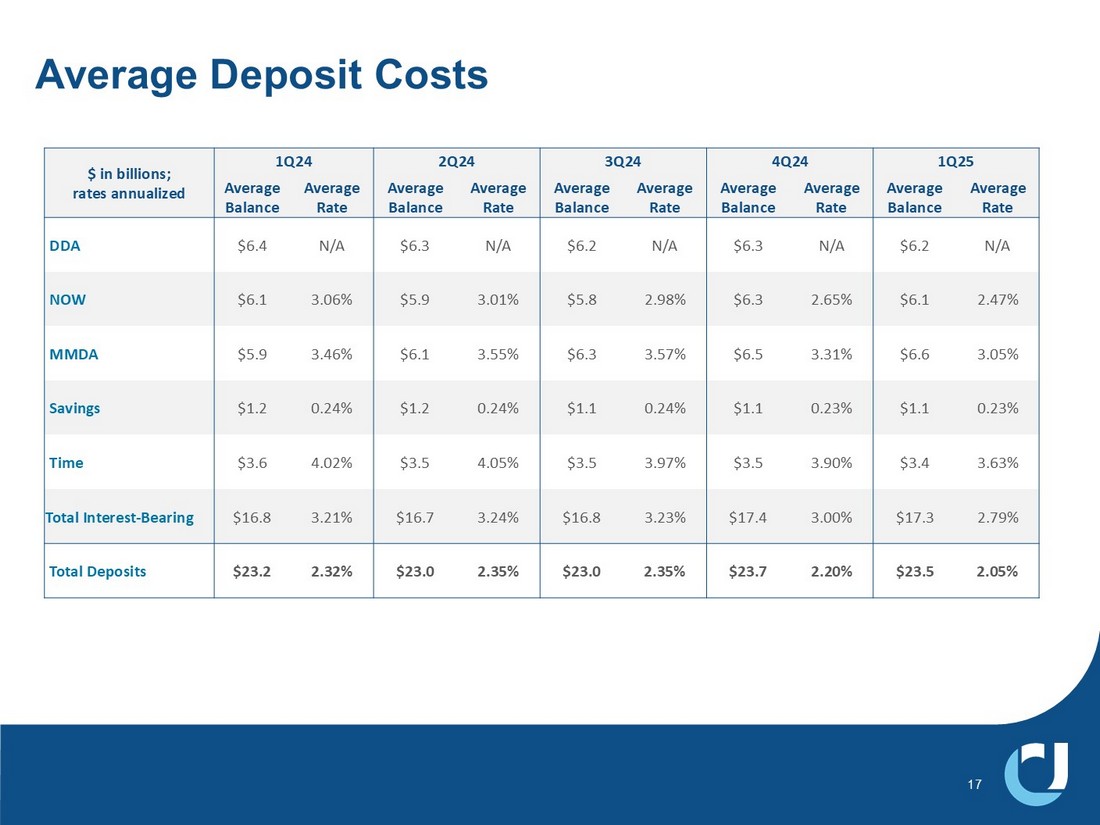
| NOW and interest-bearing demand | $ | 6,134,004 | 37,390 | 2.47 | $ | 6,078,090 | 46,211 | 3.06 | ||||||||||||||||
| Money market | 6,583,963 | 49,541 | 3.05 | 5,864,217 | 50,478 | 3.46 | ||||||||||||||||||
| Savings | 1,096,308 | 624 | 0.23 | 1,192,828 | 706 | 0.24 | ||||||||||||||||||
| Time | 3,446,048 | 30,831 | 3.63 | 3,596,486 | 35,944 | 4.02 | ||||||||||||||||||
| Brokered time deposits | 50,447 | 548 | 4.41 | 50,343 | 445 | 3.56 | ||||||||||||||||||
| Total interest-bearing deposits | 17,310,770 | 118,934 | 2.79 | 16,781,964 | 133,784 | 3.21 | ||||||||||||||||||
| Federal funds purchased and other borrowings | 80,760 | 1,107 | 5.56 | 13 | — | — | ||||||||||||||||||
| Federal Home Loan Bank advances | 38,900 | 433 | 4.51 | 4 | — | — | ||||||||||||||||||
| Long-term debt | 254,220 | 2,862 | 4.57 | 324,838 | 3,795 | 4.70 | ||||||||||||||||||
| Total borrowed funds | 373,880 | 4,402 | 4.77 | 324,855 | 3,795 | 4.70 | ||||||||||||||||||
| Total interest-bearing liabilities | 17,684,650 | 123,336 | 2.83 | 17,106,819 | 137,579 | 3.23 | ||||||||||||||||||
| Noninterest-bearing liabilities: | ||||||||||||||||||||||||
| Noninterest-bearing deposits | 6,194,217 | 6,398,079 | ||||||||||||||||||||||
| Other liabilities | 369,939 | 390,451 | ||||||||||||||||||||||
| Total liabilities | 24,248,806 | 23,895,349 | ||||||||||||||||||||||
| Shareholders' equity | 3,475,575 | 3,286,268 | ||||||||||||||||||||||
| Total liabilities and shareholders' equity | $ | 27,724,381 | $ | 27,181,617 | ||||||||||||||||||||
| Net interest revenue (FTE) | $ | 213,012 | $ | 200,212 | ||||||||||||||||||||
| Net interest-rate spread (FTE) | 2.46 | % | 2.16 | % | ||||||||||||||||||||
| Net interest margin (FTE) (4) | 3.36 | % | 3.20 | % | ||||||||||||||||||||
| (1) | Interest revenue on tax-exempt securities and loans includes a taxable-equivalent adjustment to reflect comparable interest on taxable securities and loans. The FTE adjustment totaled $991,000 and $1.06 million, respectively, for the three months ended March 31, 2025 and 2024. The tax rate used to calculate the adjustment was 26%, reflecting the statutory federal income tax rate and the federal tax adjusted state income tax rate. |
| (2) | Included in the average balance of loans outstanding are loans on which the accrual of interest has been discontinued and loans that are held for sale. |
| (3) | Unrealized gains and losses on AFS securities, including those related to the transfer from AFS to HTM, have been reclassified to other assets. Pretax unrealized losses of $269 million in 2025 and $322 million in 2024 are included in other assets for purposes of this presentation. |
| (4) | Net interest margin is taxable equivalent net interest revenue divided by average interest-earning assets. |
About United Community Banks, Inc.
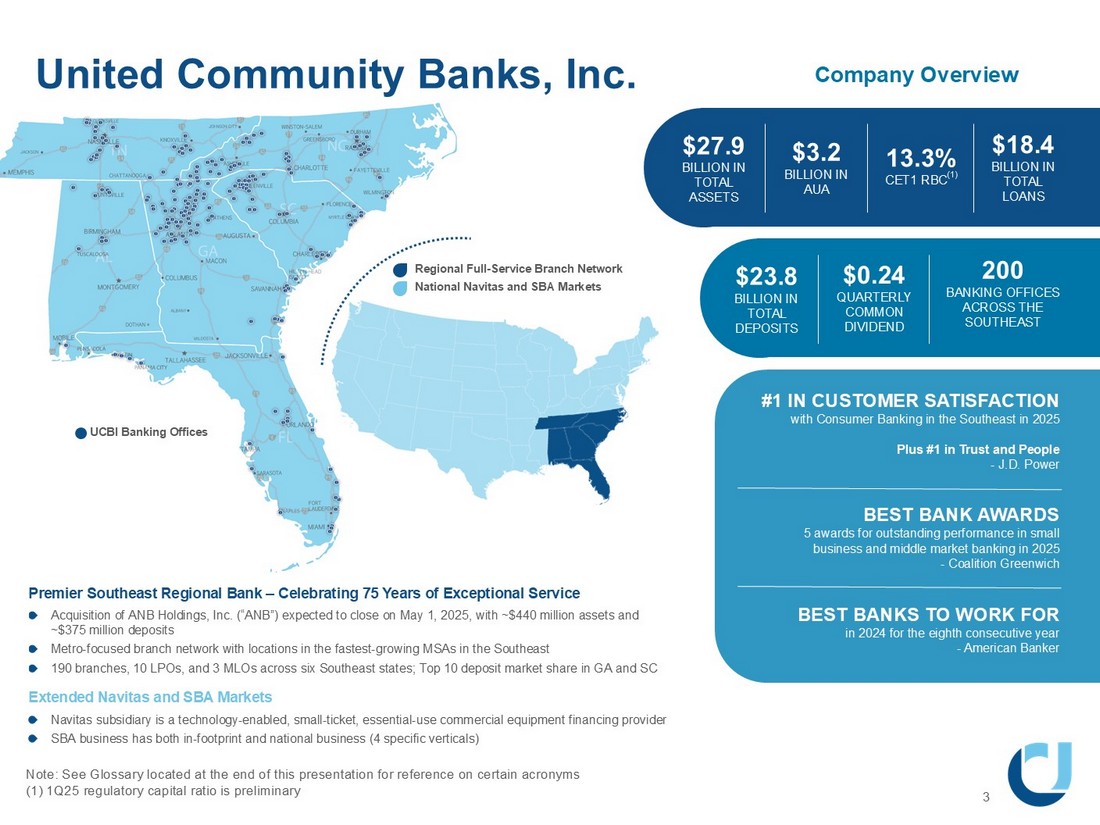
United Community Banks, Inc. (NYSE: UCB) is the financial holding company for United Community, a top 100 U.S. financial institution committed to building stronger communities and improving the financial health and well-being of its customers. United Community offers a full range of banking, mortgage and wealth management services. As of March 31, 2025, United Community Banks, Inc. had $27.9 billion in assets and operated 200 offices across Alabama, Florida, Georgia, North Carolina, South Carolina and Tennessee. The company also manages a nationally recognized SBA lending franchise and a national equipment finance subsidiary, extending its reach to businesses across the country. United is an 11-time winner of J.D. Power’s award for highest customer satisfaction among consumer banks in the Southeast and was named the most trusted bank in the region in 2025. The company has also been recognized eight consecutive years by American Banker as one of the “Best Banks to Work For.” In commercial banking, United earned five 2025 Greenwich Best Brand awards, including national honors for middle market satisfaction. Forbes has consistently named United among the World’s Best and America’s Best Banks. Learn more at ucbi.com.
Non-GAAP Financial Measures
This press release, including the accompanying financial statement tables, contains financial information determined by methods other than in accordance with generally accepted accounting principles, or GAAP. This financial information includes certain operating performance measures, which exclude merger-related and other charges that are not considered part of recurring operations, such as “noninterest income – operating”, “noninterest expense - operating”, “operating net income,” “pre-tax, pre-provision income,” “operating net income per diluted common share,” “operating earnings per share,” “tangible book value per common share,” “operating return on common equity,” “operating return on tangible common equity,” “operating return on assets,” “return on assets - pre-tax, pre-provision - operating,” “return on assets - pre-tax, pre-provision,” “operating efficiency ratio,” and “tangible common equity to tangible assets.” These non-GAAP measures are included because United believes they may provide useful supplemental information for evaluating United’s underlying performance trends. These measures should be viewed in addition to, and not as an alternative to or substitute for, measures determined in accordance with GAAP, and are not necessarily comparable to non-GAAP measures that may be presented by other companies. To the extent applicable, reconciliations of these non-GAAP measures to the most directly comparable measures as reported in accordance with GAAP are included with the accompanying financial statement tables.
Caution About Forward-Looking Statements
This press release contains “forward-looking statements” within the meaning of Section 27A of the Securities Act of 1933, as amended, and Section 21E of the Securities Exchange Act of 1934, as amended. In general, forward-looking statements usually may be identified through use of words such as “may,” “believe,” “expect,” “anticipate,” “intend,” “will,” “should,” “plan,” “estimate,” “predict,” “continue” and “potential,” or the negative of these terms or other comparable terminology, and include statements related to the expected benefits of the acquisition of ANB Holdings, Inc. (“ANB”). Forward-looking statements are not historical facts and represent management’s beliefs, based upon information available at the time the statements are made, with regard to the matters addressed; they are not guarantees of future performance. Actual results may prove to be materially different from the results expressed or implied by the forward-looking statements. Forward-looking statements are subject to numerous assumptions, risks and uncertainties that change over time and could cause actual results or financial condition to differ materially from those expressed in or implied by such statements.
Factors that could cause or contribute to such differences include, but are not limited to (1) the risk that the cost savings and any revenue synergies from the ANB acquisition may not be realized or take longer than anticipated to be realized, (2) disruption from the ANB acquisition of customer, supplier, employee or other business partner relationships, (3) the possibility that the costs, fees, expenses and charges related to the ANB acquisition may be greater than anticipated, (4) reputational risk and the reaction of each of the companies’ customers, suppliers, employees or other business partners to the ANB acquisition, (5) the failure of the ANB acquisition to close or any unexpected delay in closing the ANB acquisition, (6) the risks relating to the integration of ANB’s operations into the operations of United, including the risk that such integration will be materially delayed or will be more costly or difficult than expected, (7) the risks associated with United’s pursuit of future acquisitions, (8) the risk associated with expansion into new geographic or product markets, (9) the dilution caused by United’s issuance of additional shares of its common stock in the ANB acquisition, and (10) general competitive, economic, political and market conditions. Further information regarding additional factors which could affect the forward-looking statements contained in this press release can be found in the cautionary language included under the headings “Cautionary Note Regarding Forward-Looking Statements” and “Risk Factors” in United’s Annual Report on Form 10-K for the year ended December 31, 2024, and other documents subsequently filed by United with the United States Securities and Exchange Commission (“SEC”).
Many of these factors are beyond United’s ability to control or predict. If one or more events related to these or other risks or uncertainties materialize, or if the underlying assumptions prove to be incorrect, actual results may differ materially from the forward-looking statements. Accordingly, shareholders and investors should not place undue reliance on any such forward-looking statements. Any forward-looking statement speaks only as of the date of this communication, and United undertakes no obligation to update or revise any forward-looking statements, whether as a result of new information, future events or otherwise, except as required by law. New risks and uncertainties may emerge from time to time, and it is not possible for United to predict their occurrence or how they will affect United.
United qualifies all forward-looking statements by these cautionary statements.
# # #