Exhibit 99.1

UMB Financial Corporation News Release
1010 Grand Boulevard
Kansas City, MO 64106
816.860.7000
umb.com
//FOR IMMEDIATE RELEASE//
Media Contact: Stephanie Hague: 816.860.5088
Investor Relations Contact: Kay Gregory: 816.860.7106
UMB Financial Corporation Reports First Quarter Net Income of $92.6 Million
First Quarter 2021 Financial Highlights (all comparisons to prior year)
|
|
• |
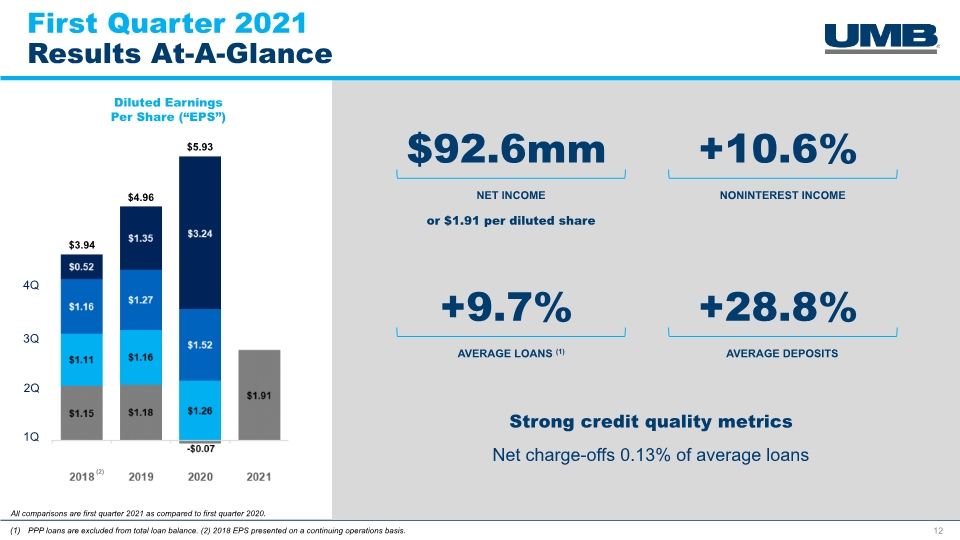
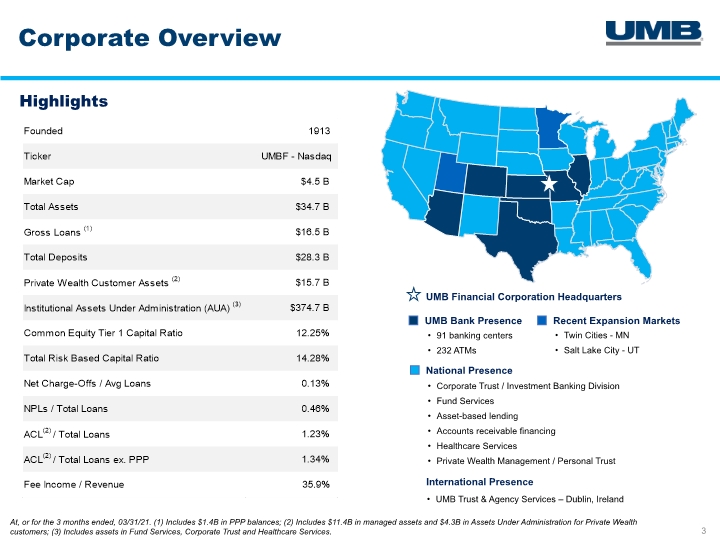
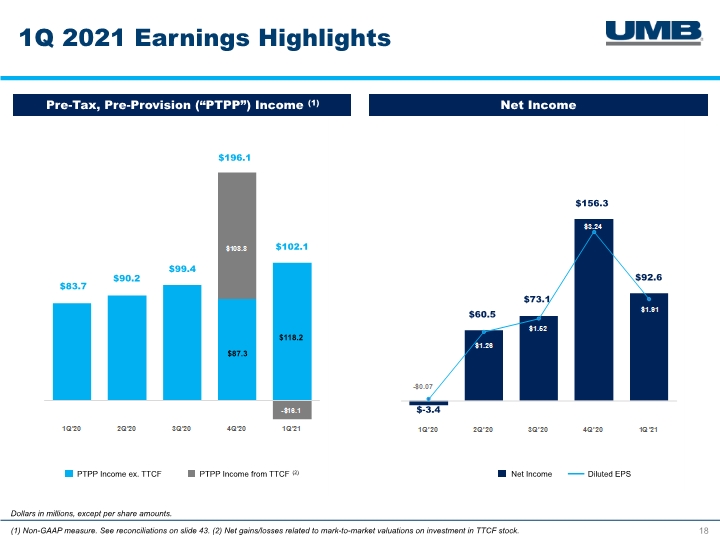
GAAP net income of $92.6 million, or $1.91 per diluted share; net operating income of $92.8 million, or $1.91 per diluted share. |
|
|
• |
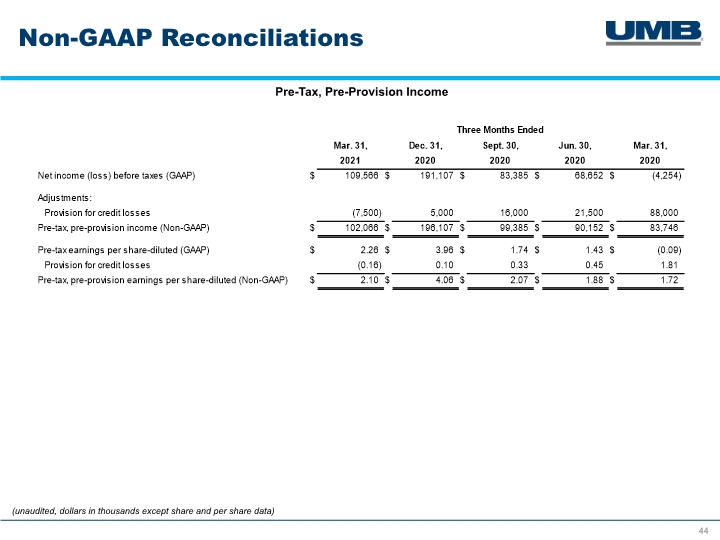
Pre-tax, pre-provision (PTPP) income of $102.1 million, an increase of $18.3 million. |
|
|
• |
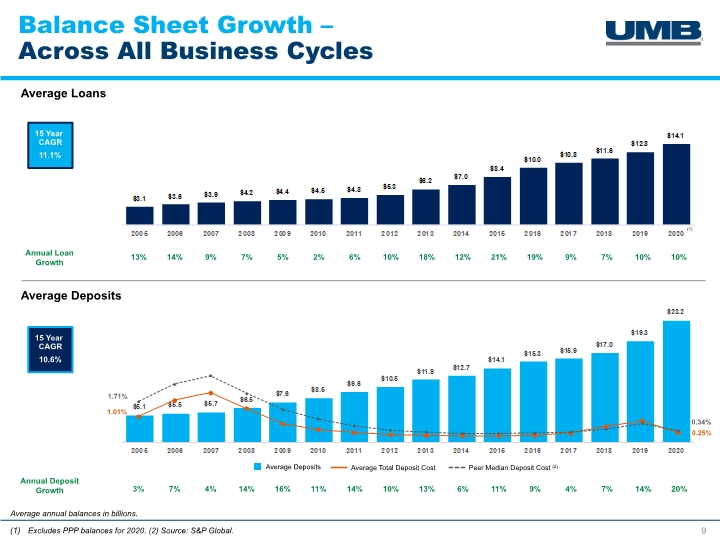
Quarterly average loan balances increased $2.6 billion, or 19.3%. |
|
|
• |
Quarterly average deposits grew 28.8% to $26.8 billion. |
|
|
• |
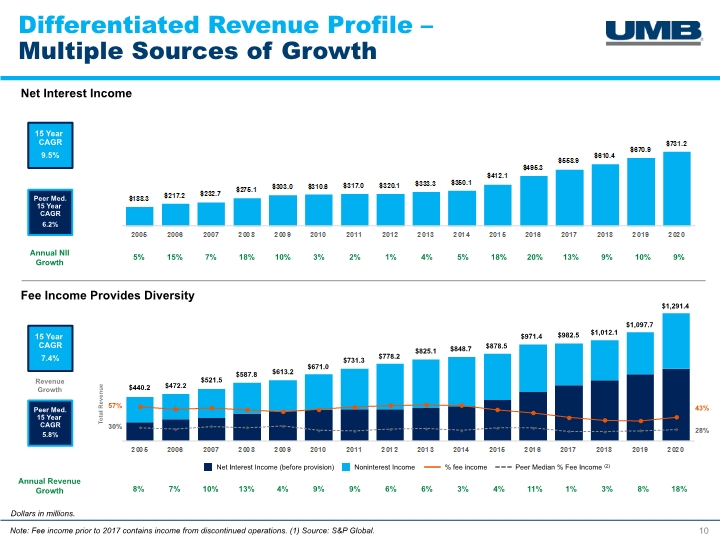
Noninterest income increased 10.6% and comprised 35.9% of revenue. |
|
|
• |
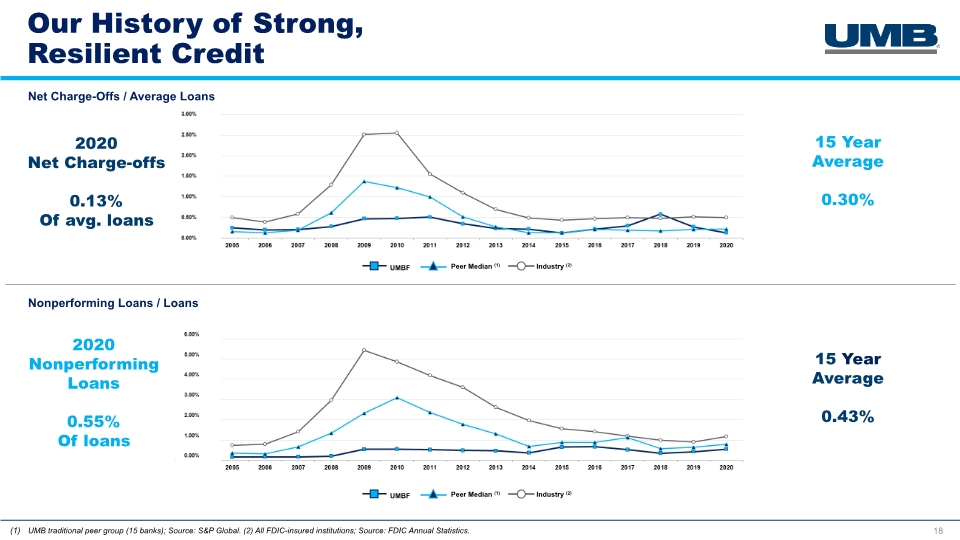
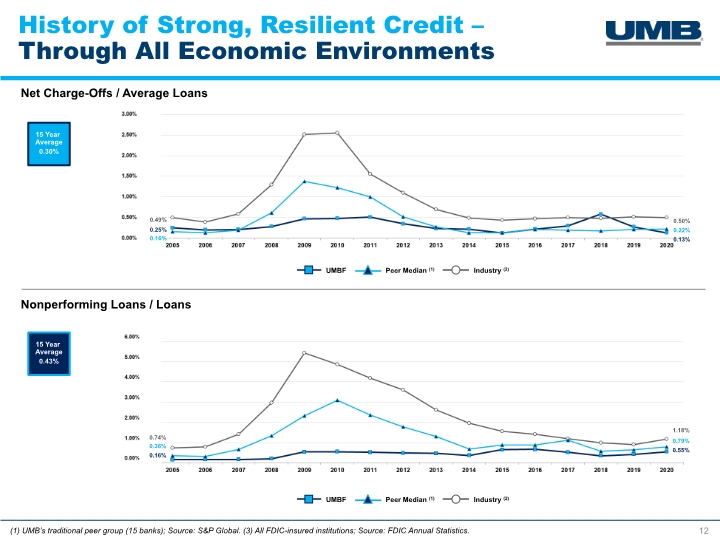
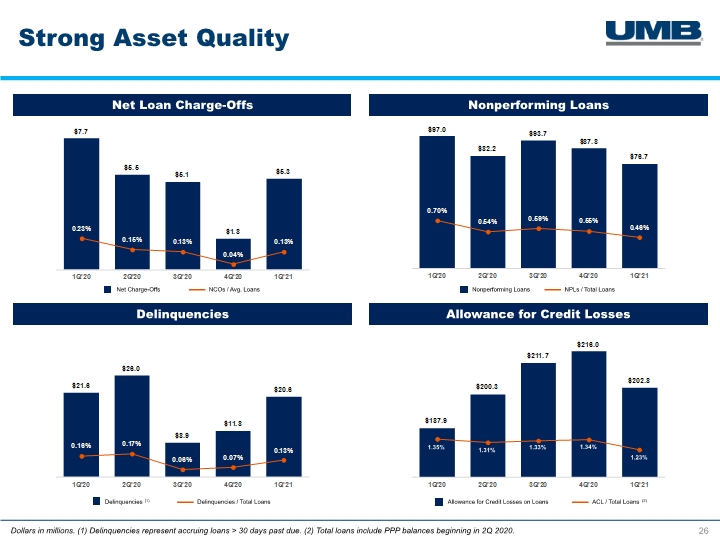
Credit quality remained strong, with net charge-offs of just 0.13% of average loans, consistent with the company’s historical performance. |
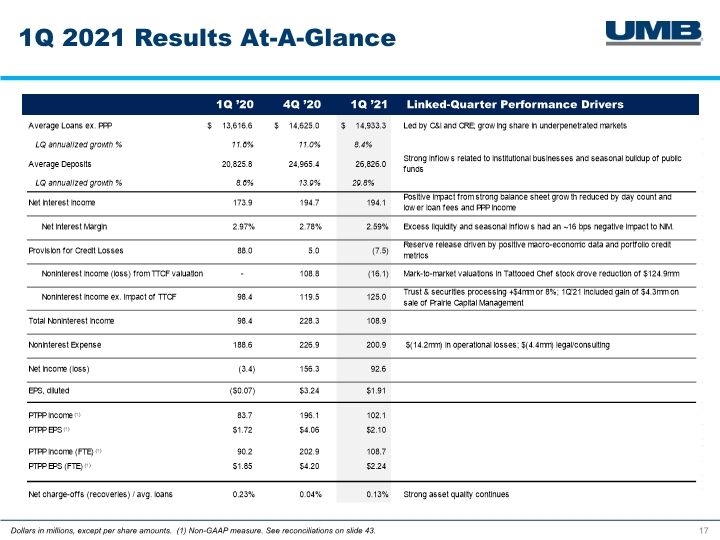
KANSAS CITY, Mo. (April 27, 2021) – UMB Financial Corporation (Nasdaq: UMBF), a financial services company, announced net income for the first quarter of 2021 of $92.6 million, or $1.91 per diluted share, compared to net income of $156.3 million, or $3.24 per diluted share, in the fourth quarter of 2020 (linked quarter) and net loss of $3.4 million, or $0.07 per diluted share, in the first quarter of 2020.
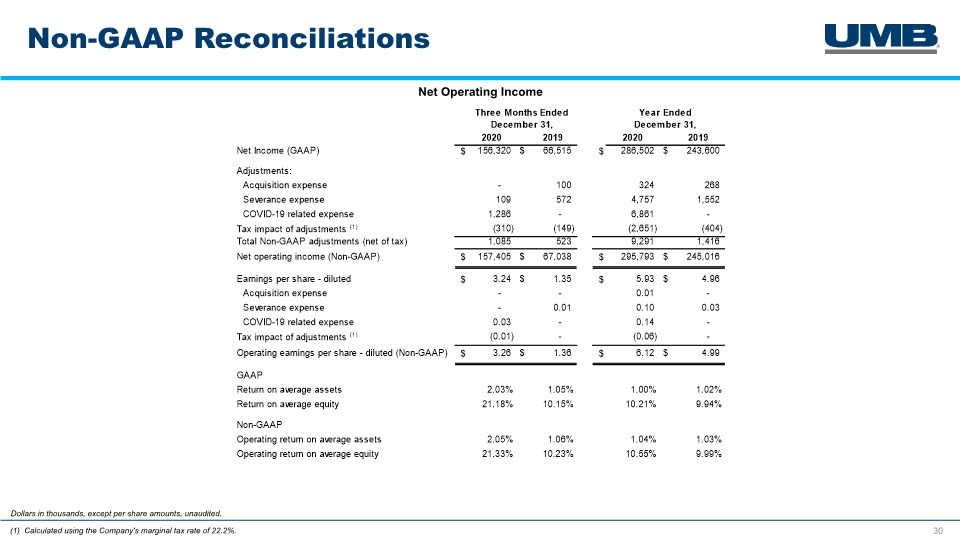
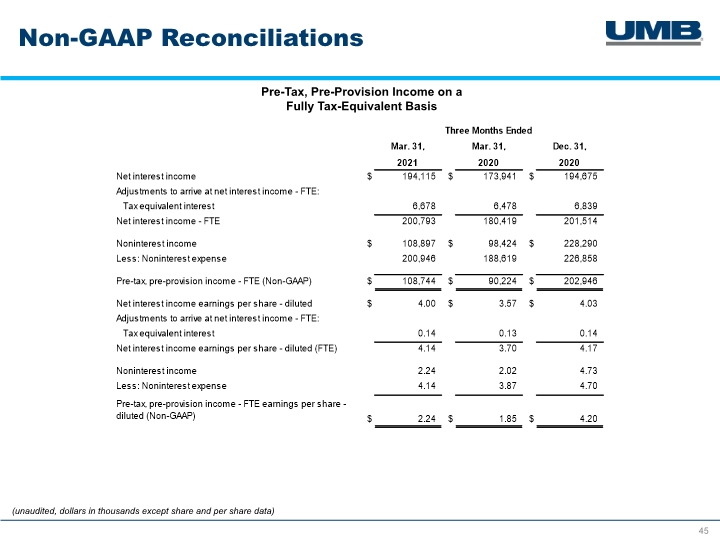
Net operating income, a non-GAAP financial measure reconciled to net income, the nearest comparable GAAP measure, later in this release, was $92.8 million, or $1.91 per diluted share, for the first quarter of 2021, compared to $157.4 million, or $3.26 per diluted share, for the linked quarter and net operating loss of $1.9 million, or $0.04 per diluted share, for the first quarter of 2020. Pre-tax, pre-provision income on a fully tax equivalent basis (PTPP-FTE), a non-GAAP measure reconciled to the components of net income before taxes, the nearest comparable GAAP measure, later in this release, was $108.7 million, or $2.24 per diluted share, for the first quarter of 2021, compared to $202.9 million, or $4.20 per diluted share, for the linked quarter, and $90.2 million, or $1.85 per diluted share, for the first quarter of 2020. These PTPP-FTE results represent a decrease of 46.4% on a linked-quarter basis and an increase of 20.5% compared to the first quarter of 2020.
Net income comparisons to the linked quarter were primarily impacted by an $108.8 million pre-tax gain recognized in the prior period on the company’s equity investment in Tattooed Chef, Inc. (TTCF), and a subsequent $16.1 million pre-tax mark-to-market loss on those investments in the current period. Net income comparisons to the first quarter of 2020 were primarily impacted by the significantly higher provision expense in the prior period related to the implementation of the current expected credit loss (CECL) methodology for estimating allowance for credit losses as well as the $16.1 million pre-tax mark-to-market adjustment on TTCF shares.
|
Summary of quarterly financial results |
|
UMB Financial Corporation |
|
|||||||||
|
|
|
|
|
|
|
|
|
|
|
|
|
|
|
|
|
Q1 |
|
|
Q4 |
|
|
Q1 |
|
|||
|
|
|
2021 |
|
|
2020 |
|
|
2020 |
|
|||
|
Net income (loss) (GAAP) |
|
$ |
92,643 |
|
|
$ |
156,320 |
|
|
$ |
(3,439 |
) |
|
Earnings (losses) per share (diluted) |
|
|
1.91 |
|
|
|
3.24 |
|
|
|
(0.07 |
) |
|
|
|
|
|
|
|
|
|
|
|
|
|
|
|
Pre-tax, pre-provision income (Non-GAAP) |
|
|
102,066 |
|
|
|
196,107 |
|
|
|
83,746 |
|
|
Pre-tax, pre-provision earnings per share (diluted) |
|
|
2.10 |
|
|
|
4.06 |
|
|
1.72 |
|
|
|
|
|
|
|
|
|
|
|
|
|
|
|
|
|
Pre-tax, pre-provision income - FTE (Non-GAAP) |
|
|
108,744 |
|
|
|
202,946 |
|
|
|
90,224 |
|
|
Pre-tax, pre-provision earnings per share - FTE (diluted) |
|
|
2.24 |
|
|
|
4.20 |
|
|
1.85 |
|
|
|
|
|
|
|
|
|
|
|
|
|
|
|
|
|
Net operating income (loss) (Non-GAAP) |
|
|
92,780 |
|
|
|
157,405 |
|
|
|
(1,881 |
) |
|
Operating earnings (losses) per share (diluted) |
|
|
1.91 |
|
|
|
3.26 |
|
|
|
(0.04 |
) |
|
|
|
|
|
|
|
|
|
|
|
|
|
|
|
GAAP |
|
|
|
|
|
|
|
|
|
|
|
|
|
Return on average assets |
|
|
1.14 |
% |
|
|
2.03 |
% |
|
|
(0.05 |
)% |
|
Return on average equity |
|
|
12.56 |
|
|
|
21.18 |
|
|
|
(0.51 |
) |
|
Efficiency ratio |
|
|
66.46 |
|
|
|
53.44 |
|
|
|
68.93 |
|
|
|
|
|
|
|
|
|
|
|
|
|
|
|
|
Non-GAAP |
|
|
|
|
|
|
|
|
|
|
|
|
|
Operating return on average assets |
|
|
1.14 |
% |
|
|
2.05 |
% |
|
|
(0.03 |
)% |
|
Operating return on average equity |
|
|
12.58 |
|
|
|
21.33 |
|
|
|
(0.28 |
) |
|
Operating efficiency ratio |
|
|
66.40 |
|
|
|
53.11 |
|
|
|
68.19 |
|
“Our team continued to deliver and execute on core tenets that differentiate our story and value proposition for our shareholders,” said Mariner Kemper, chairman, president and chief executive officer. “During the first quarter, we saw optimistic signs of an improving operating environment. Strong balance sheet growth funded by a growing core deposit base, robust fee income generation from our diversified business lines, and solid asset quality metrics drove our strong financial results. Average loans, excluding Paycheck Protection Program (PPP) balances, increased 8.4% annualized on a linked-quarter basis. Net charge-offs averaged just 13 basis points of loans, while levels of non-performing assets and delinquencies improved from the end of the prior period. The 19-basis-point decline in net interest margin on a linked-quarter basis was due in part to excess liquidity as well as seasonal inflows in some of our businesses, which had approximately a 16 basis-point impact to our margin.”
|
Summary of revenue |
|
UMB Financial Corporation |
|
|||||||||||||||||
|
(unaudited, dollars in thousands) |
|
|
|
|
|
|
|
|
|
|
|
|
|
|
|
|
|
|
|
|
|
|
|
Q1 |
|
|
Q4 |
|
|
Q1 |
|
|
CQ vs. |
|
|
CQ vs. |
|
|||||
|
|
|
2021 |
|
|
2020 |
|
|
2020 |
|
|
LQ |
|
|
PY |
|
|||||
|
Net interest income |
|
$ |
194,115 |
|
|
$ |
194,675 |
|
|
$ |
173,941 |
|
|
$ |
(560 |
) |
|
$ |
20,174 |
|
|
Noninterest income: |
|
|
|
|
|
|
|
|
|
|
|
|
|
|
|
|
|
|
|
|
|
Trust and securities processing |
|
|
54,834 |
|
|
|
50,773 |
|
|
|
47,000 |
|
|
|
4,061 |
|
|
|
7,834 |
|
|
Trading and investment banking |
|
|
9,356 |
|
|
|
9,693 |
|
|
|
1,723 |
|
|
|
(337 |
) |
|
|
7,633 |
|
|
Service charges on deposit accounts |
|
|
21,976 |
|
|
|
20,074 |
|
|
|
25,081 |
|
|
|
1,902 |
|
|
|
(3,105 |
) |
|
Insurance fees and commissions |
|
|
420 |
|
|
|
318 |
|
|
|
259 |
|
|
|
102 |
|
|
|
161 |
|
|
Brokerage fees |
|
|
3,334 |
|
|
|
3,918 |
|
|
|
9,860 |
|
|
|
(584 |
) |
|
|
(6,526 |
) |
|
Bankcard fees |
|
|
14,673 |
|
|
|
15,788 |
|
|
|
16,545 |
|
|
|
(1,115 |
) |
|
|
(1,872 |
) |
|
Investment securities (losses) gains, net |
|
|
(8,336 |
) |
|
|
113,010 |
|
|
|
3,520 |
|
|
|
(121,346 |
) |
|
|
(11,856 |
) |
|
Other |
|
|
12,640 |
|
|
|
14,716 |
|
|
|
(5,564 |
) |
|
|
(2,076 |
) |
|
|
18,204 |
|
|
Total noninterest income |
|
$ |
108,897 |
|
|
$ |
228,290 |
|
|
$ |
98,424 |
|
|
$ |
(119,393 |
) |
|
$ |
10,473 |
|
|
Total revenue |
|
$ |
303,012 |
|
|
$ |
422,965 |
|
|
$ |
272,365 |
|
|
$ |
(119,953 |
) |
|
$ |
30,647 |
|
|
Net interest income (FTE) |
|
$ |
200,793 |
|
|
$ |
201,514 |
|
|
$ |
180,419 |
|
|
|
|
|
|
|
|
|
|
Net interest margin (FTE) |
|
|
2.59 |
% |
|
|
2.78 |
% |
|
|
2.97 |
% |
|
|
|
|
|
|
|
|
|
Total noninterest income as a % of total revenue |
|
|
35.94 |
|
|
|
53.97 |
|
|
|
36.14 |
|
|
|
|
|
|
|
|
|
|
|
• |
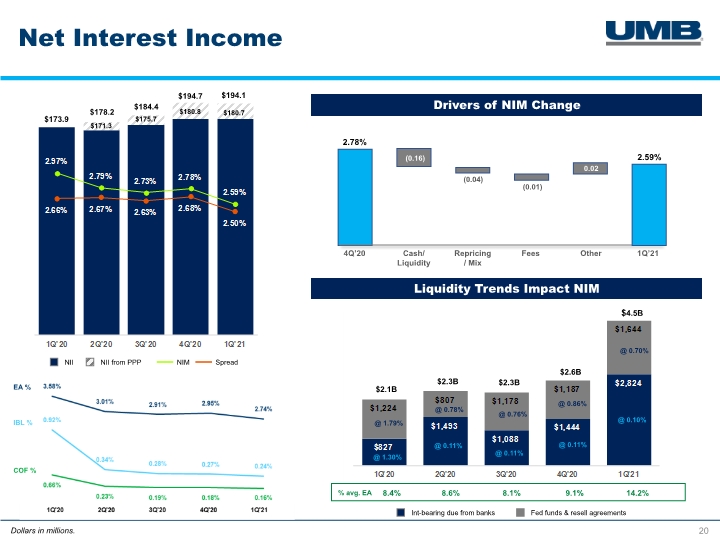
Net interest income totaled $194.1 million, which is a decrease of $0.6 million as compared to the linked quarter. The positive impact from strong balance sheet growth was reduced by the impacts of lower loan fees and PPP income in the quarter. Average earning assets increased $2.6 billion, or 8.9%, driven primarily by an increase in excess liquidity, while interest-bearing liabilities increased $1.6 billion, or 8.8%. |
|
|
• |
Net interest margin for the first quarter was 2.59%, a decrease of 19 basis points from the linked quarter, driven in part from the impacts of excess liquidity. Earning asset yields declined 21 basis points from the linked quarter, while the cost of interest-bearing liabilities decreased three basis points to 0.24%, driven by a four-basis-point decline in the cost of interest-bearing deposits. Net interest spread decreased 18 basis points to 2.50% from the linked quarter and was 16 basis points lower than the first quarter of 2020. |
|
|
• |
On a year-over-year basis, net interest income increased $20.2 million, or 11.6%, driven by a $2.6 billion, or 19.3%, increase in average loans, and a $1.9 billion, or 22.2%, increase in average securities. These increases were driven by organic loan growth, excess liquidity, and the company’s PPP participation. |
|
|
• |
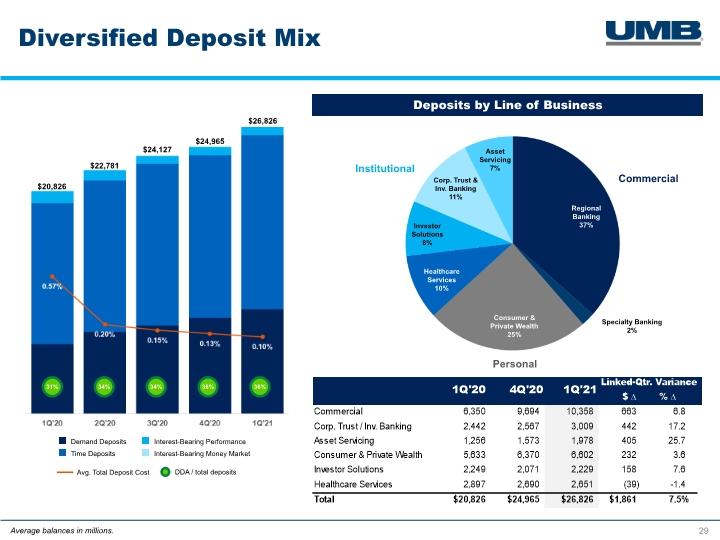
Average deposits increased 7.5% on a linked-quarter basis and 28.8% compared to the first quarter of 2020. Average noninterest-bearing demand deposit balances increased 9.0% on a linked-quarter basis and 50.2% compared to the first quarter of 2020. |
|
|
• |
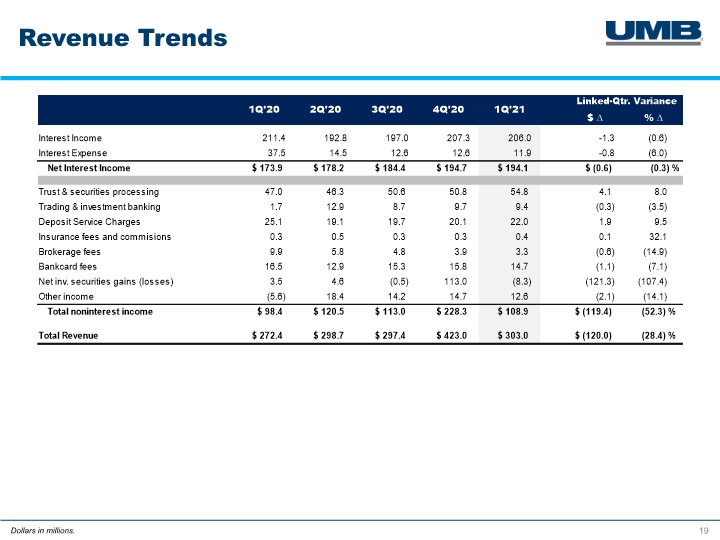
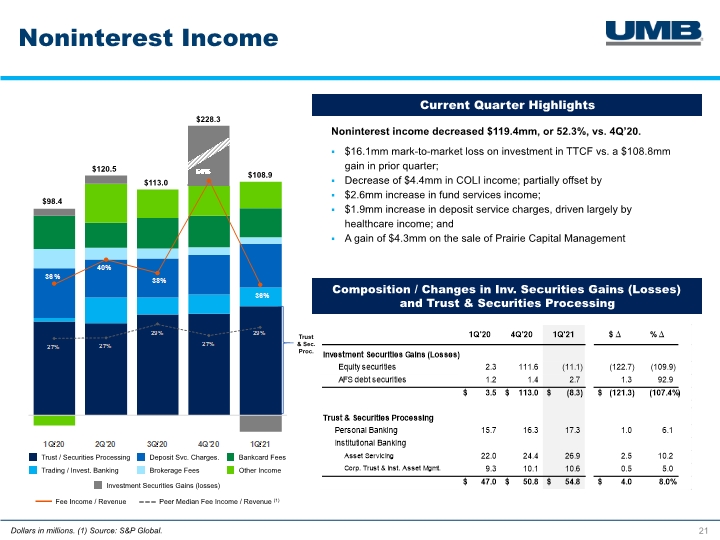
First quarter 2021 noninterest income decreased $119.4 million, or 52.3%, on a linked-quarter basis, largely due to: |
|
|
o |
A decrease of $121.3 million in investment securities gains, primarily due to a decrease of $124.9 million in gains on the company’s investment in TTCF, partially offset by increases of $1.4 million in equity earnings on alternative investments and $1.3 million in gains on sales of available for sale securities. |
|
|
o |
Decreases of $4.4 million in company-owned life insurance income and $1.1 million in derivative income, both recorded in other income. The decrease in company-owned life insurance is offset by a proportionate decrease in deferred compensation expense as noted below. |
|
|
o |
These decreases were partially offset by increases of $2.6 million and $1.0 million in fund services income and trust services income, respectively, both recorded in trust and securities processing, an increase of $1.7 million in healthcare income, recorded in service charges on deposits, and an increase in other income of $4.3 million due to the gain on sale of Prairie Capital Management, LLC (PCM). |
|
|
• |
Compared to the prior year, noninterest income in the first quarter of 2021 increased $10.5 million, or 10.6%, primarily driven by: |
|
|
o |
An increase of $18.2 million in other income, driven by an increase of $15.0 million in company-owned life insurance and a gain of $4.3 million on the sale of PCM. The increase in company-owned life insurance is offset by a proportionate increase in deferred compensation expense as noted below. |
|
|
o |
An increase of $7.8 million in trust and securities processing, driven by increases of $5.0 million in fund services income, $1.6 million in trust services income, and $1.2 million in corporate trust revenue. |
|
|
o |
An increase of $7.6 million in trading and investment banking due to increased trading volume. |
|
|
o |
These increases were partially offset by the following decreases: |
|
|
▪ |
A decrease of $11.9 million in investment securities gains due to the $16.1 million mark-to-market loss on the company’s investment in TTCF, during the first quarter of 2021, partially offset by increased gains on sales of available for sale securities and equity earnings on alternative investments. |
|
|
▪ |
A decrease of $6.5 million in brokerage fees, primarily driven by lower 12b-1 income. |
|
|
▪ |
A decrease of $3.1 million in service charges on deposits, driven by reduced healthcare income related to customer transfer and conversion fees. |
Noninterest expense
|
Summary of noninterest expense |
|
UMB Financial Corporation |
|
|||||||||||||||||
|
|
|
|
|
|
|
|
|
|
|
|
|
|
|
|
|
|
|
|
|
|
|
|
|
Q1 |
|
|
Q4 |
|
|
Q1 |
|
|
CQ vs. |
|
|
CQ vs. |
|
|||||
|
|
|
2021 |
|
|
2020 |
|
|
2020 |
|
|
LQ |
|
|
PY |
|
|||||
|
Salaries and employee benefits |
|
$ |
127,681 |
|
|
$ |
129,272 |
|
|
$ |
111,060 |
|
|
$ |
(1,591 |
) |
|
$ |
16,621 |
|
|
Occupancy, net |
|
|
11,935 |
|
|
|
11,858 |
|
|
|
12,180 |
|
|
|
77 |
|
|
|
(245 |
) |
|
Equipment |
|
|
19,615 |
|
|
|
22,008 |
|
|
|
21,241 |
|
|
|
(2,393 |
) |
|
|
(1,626 |
) |
|
Supplies and services |
|
|
3,492 |
|
|
|
4,125 |
|
|
|
4,185 |
|
|
|
(633 |
) |
|
|
(693 |
) |
|
Marketing and business development |
|
|
2,345 |
|
|
|
3,717 |
|
|
|
4,640 |
|
|
|
(1,372 |
) |
|
|
(2,295 |
) |
|
Processing fees |
|
|
15,417 |
|
|
|
14,408 |
|
|
|
13,390 |
|
|
|
1,009 |
|
|
|
2,027 |
|
|
Legal and consulting |
|
|
5,755 |
|
|
|
10,191 |
|
|
|
6,110 |
|
|
|
(4,436 |
) |
|
|
(355 |
) |
|
Bankcard |
|
|
4,956 |
|
|
|
4,711 |
|
|
|
4,860 |
|
|
|
245 |
|
|
|
96 |
|
|
Amortization of other intangible assets |
|
|
1,380 |
|
|
|
1,601 |
|
|
|
1,734 |
|
|
|
(221 |
) |
|
|
(354 |
) |
|
Regulatory fees |
|
|
2,546 |
|
|
|
2,393 |
|
|
|
2,366 |
|
|
|
153 |
|
|
|
180 |
|
|
Other |
|
|
5,824 |
|
|
|
22,574 |
|
|
|
6,853 |
|
|
|
(16,750 |
) |
|
|
(1,029 |
) |
|
Total noninterest expense |
|
$ |
200,946 |
|
|
$ |
226,858 |
|
|
$ |
188,619 |
|
|
$ |
(25,912 |
) |
|
$ |
12,327 |
|
|
|
• |
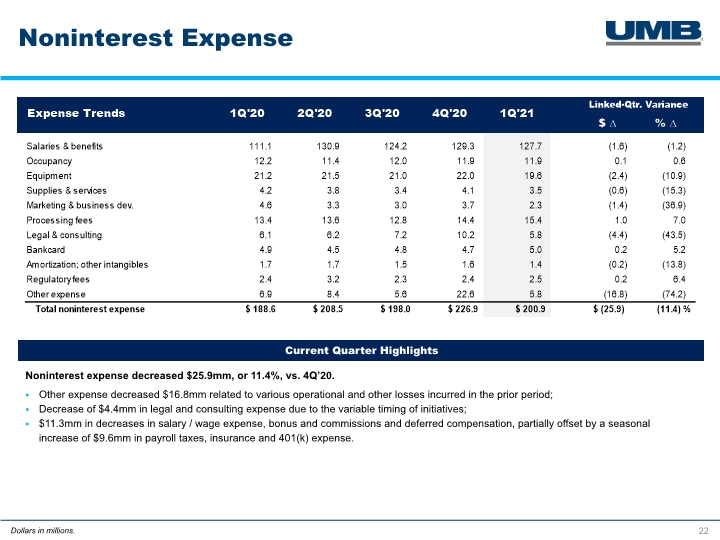
Noninterest expense for the first quarter of 2021 was $200.9 million, a decrease of $25.9 million, or 11.4%, from the linked quarter and an increase of $12.3 million, or 6.5%, from the first quarter of 2020. |
|
|
• |
The linked-quarter decrease in noninterest expense was driven by: |
|
|
|
|
o |
Decreases of $14.2 million in operational losses, $1.0 million in derivative expense, $0.9 million in charitable contributions expense, and $0.9 million in losses on other real estate owned, all recorded in other noninterest expense. |
|
|
o |
A decrease of $2.4 million in software expense, recorded in equipment expense. |
|
|
o |
Decreases of $2.3 million in consulting expense and $2.1 million in legal expense, both recorded in legal and professional expense, due to timing of multiple technology initiatives and legal work performed on various matters. |
|
|
o |
Decreases of $8.4 million in bonus and commission expense, $1.9 million in deferred compensation expense, and $1.0 million in salary and wage expense, all recorded in salaries and employee benefits. These decreases were partially offset by a seasonal increase of $9.6 million in payroll taxes, insurance, and 401(k) expense recognized in the first quarter. The decrease in deferred compensation expense was offset by the decrease in company-owned life insurance income noted above. |
|
|
• |
The year-over-year increase in noninterest expense was driven by: |
|
|
o |
An increase of $16.6 million in salaries and employee benefits, primarily due to increased deferred compensation expense. The increase in deferred compensation expense was offset by the increase in company-owned life insurance income noted above. |
|
|
o |
These increases were partially offset by a decrease of $2.3 million in marketing and development expense, primarily due to a decline in travel and entertainment expense due to the pandemic, and a decrease of $1.3 million in software expense, recorded in equipment expense. |
Balance sheet
|
|
• |
Average total assets for the first quarter of 2021 were $33.1 billion compared to $30.6 billion for the linked quarter and $26.0 billion for the same period in 2020. |
|
Summary of average loans and leases - QTD Average |
UMB Financial Corporation |
|
||||||||||||||||||
|
(unaudited, dollars in thousands) |
|
|
|
|
|
|
|
|
|
|
|
|
|
|
|
|
|
|
|
|
|
|
|
Q1 |
|
|
Q4 |
|
|
Q1 |
|
|
CQ vs. |
|
|
CQ vs. |
|
|||||
|
|
|
2021 |
|
|
2020 |
|
|
2020 |
|
|
LQ |
|
|
PY |
|
|||||
|
Commercial and industrial |
|
$ |
7,139,101 |
|
|
$ |
7,079,646 |
|
|
$ |
5,786,545 |
|
|
$ |
59,455 |
|
|
$ |
1,352,556 |
|
|
Specialty lending |
|
|
502,585 |
|
|
|
506,225 |
|
|
|
510,316 |
|
|
|
(3,640 |
) |
|
|
(7,731 |
) |
|
Commercial real estate |
|
|
5,971,047 |
|
|
|
5,847,439 |
|
|
|
5,181,036 |
|
|
|
123,608 |
|
|
|
790,011 |
|
|
Consumer real estate |
|
|
1,970,767 |
|
|
|
1,903,892 |
|
|
|
1,414,025 |
|
|
|
66,875 |
|
|
|
556,742 |
|
|
Consumer |
|
|
117,095 |
|
|
|
128,350 |
|
|
|
141,972 |
|
|
|
(11,255 |
) |
|
|
(24,877 |
) |
|
Credit cards |
|
|
362,051 |
|
|
|
382,166 |
|
|
|
418,485 |
|
|
|
(20,115 |
) |
|
|
(56,434 |
) |
|
Leases and other |
|
|
183,447 |
|
|
|
193,363 |
|
|
|
164,187 |
|
|
|
(9,916 |
) |
|
|
19,260 |
|
|
Total loans |
|
$ |
16,246,093 |
|
|
$ |
16,041,081 |
|
|
$ |
13,616,566 |
|
|
$ |
205,012 |
|
|
$ |
2,629,527 |
|
|
|
• |
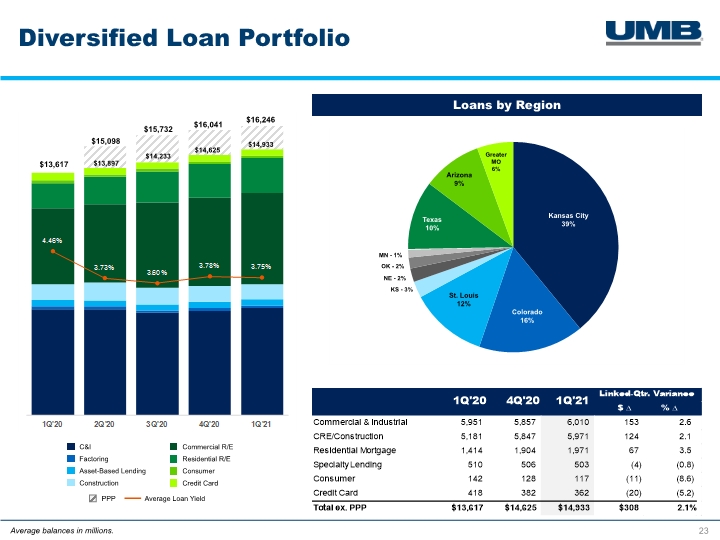
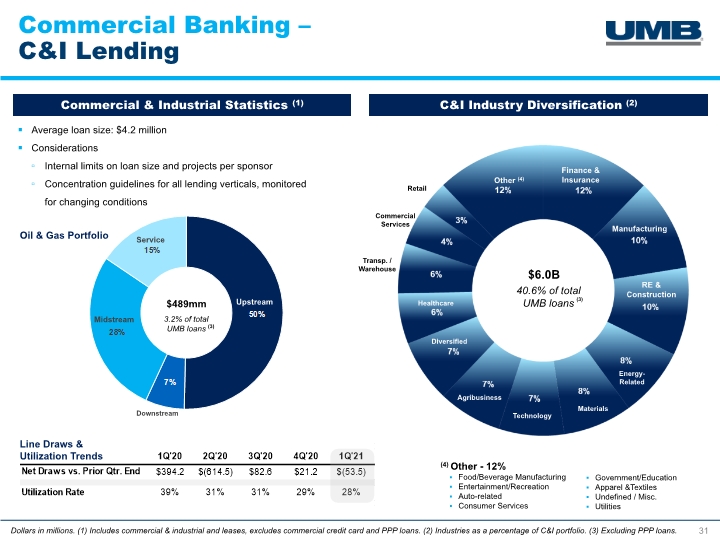
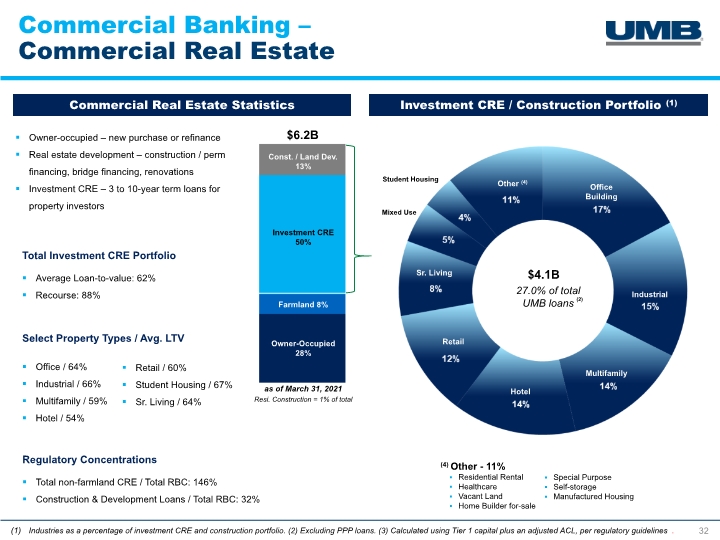
Average loans for the first quarter of 2021 increased 1.3% on a linked-quarter basis and 19.3% compared to the first quarter of 2020 due to increased commercial real estate and consumer real estate loans and the company’s PPP participation, which had an average balance of $1.3 billion in the first quarter. |
|
Summary of average securities - QTD Average |
|
UMB Financial Corporation |
|
|||||||||||||||||
|
(unaudited, dollars in thousands) |
|
|
|
|
|
|
|
|
|
|
|
|
|
|
|
|
|
|
|
|
|
|
|
Q1 |
|
|
Q4 |
|
|
Q1 |
|
|
CQ vs. |
|
|
CQ vs. |
|
|||||
|
|
|
2021 |
|
|
2020 |
|
|
2020 |
|
|
LQ |
|
|
PY |
|
|||||
|
Securities available for sale: |
|
|
|
|
|
|
|
|
|
|
|
|
|
|
|
|
|
|
|
|
|
U.S. Treasury |
|
$ |
36,032 |
|
|
$ |
30,778 |
|
|
$ |
49,638 |
|
|
$ |
5,254 |
|
|
$ |
(13,606 |
) |
|
U.S. Agencies |
|
|
95,494 |
|
|
|
96,082 |
|
|
|
94,342 |
|
|
|
(588 |
) |
|
|
1,152 |
|
|
Mortgage-backed |
|
|
5,599,987 |
|
|
|
5,053,821 |
|
|
|
4,133,118 |
|
|
|
546,166 |
|
|
|
1,466,869 |
|
|
State and political subdivisions |
|
|
3,552,945 |
|
|
|
3,600,704 |
|
|
|
3,058,594 |
|
|
|
(47,759 |
) |
|
|
494,351 |
|
|
Corporates |
|
|
83,271 |
|
|
|
76,870 |
|
|
|
188,257 |
|
|
|
6,401 |
|
|
|
(104,986 |
) |
|
Total securities available for sale |
|
$ |
9,367,729 |
|
|
$ |
8,858,255 |
|
|
$ |
7,523,949 |
|
|
$ |
509,474 |
|
|
$ |
1,843,780 |
|
|
Securities held to maturity: |
|
|
|
|
|
|
|
|
|
|
|
|
|
|
|
|
|
|
|
|
|
State and political subdivisions |
|
$ |
1,023,418 |
|
|
$ |
1,045,640 |
|
|
$ |
1,108,716 |
|
|
$ |
(22,222 |
) |
|
$ |
(85,298 |
) |
|
Trading securities |
|
|
17,540 |
|
|
|
29,659 |
|
|
|
48,102 |
|
|
|
(12,119 |
) |
|
|
(30,562 |
) |
|
Other securities |
|
|
308,297 |
|
|
|
267,445 |
|
|
|
124,795 |
|
|
|
40,852 |
|
|
|
183,502 |
|
|
Total securities |
|
$ |
10,716,984 |
|
|
$ |
10,200,999 |
|
|
$ |
8,805,562 |
|
|
$ |
515,985 |
|
|
$ |
1,911,422 |
|
|
|
• |
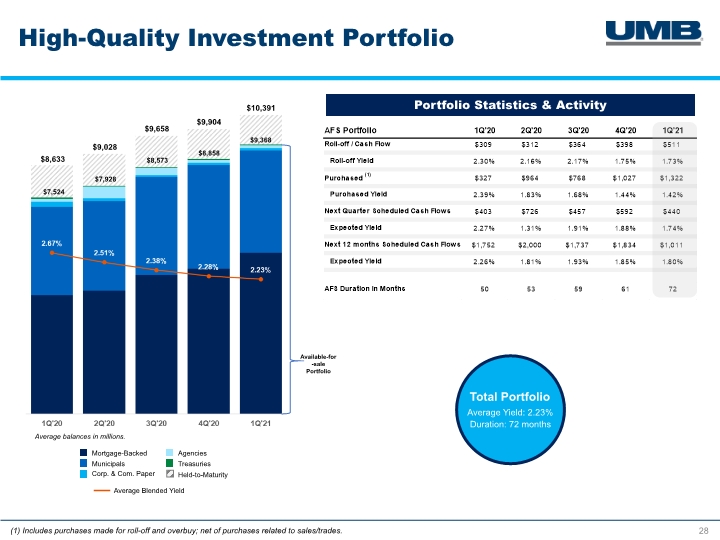
Average securities available for sale increased 5.8% on a linked-quarter basis and 24.5% compared to the first quarter of 2020. |
|
Summary of average deposits - QTD Average |
UMB Financial Corporation |
|
||||||||||||||||||
|
|
|
|
|
|
|
|
|
|
|
|
|
|
|
|
|
|
|
|
|
|
|
|
|
Q1 |
|
|
Q4 |
|
|
Q1 |
|
|
CQ vs. |
|
|
CQ vs. |
|
|||||
|
|
|
2021 |
|
|
2020 |
|
|
2020 |
|
|
LQ |
|
|
PY |
|
|||||
|
Deposits: |
|
|
|
|
|
|
|
|
|
|
|
|
|
|
|
|
|
|
|
|
|
Noninterest-bearing demand |
|
$ |
9,753,680 |
|
|
$ |
8,947,389 |
|
|
$ |
6,495,611 |
|
|
$ |
806,291 |
|
|
$ |
3,258,069 |
|
|
Interest-bearing demand and savings |
|
|
16,302,880 |
|
|
|
15,250,236 |
|
|
|
13,232,370 |
|
|
|
1,052,644 |
|
|
|
3,070,510 |
|
|
Time deposits |
|
|
769,464 |
|
|
|
767,755 |
|
|
|
1,097,780 |
|
|
|
1,709 |
|
|
|
(328,316 |
) |
|
Total deposits |
|
$ |
26,826,024 |
|
|
$ |
24,965,380 |
|
|
$ |
20,825,761 |
|
|
$ |
1,860,644 |
|
|
$ |
6,000,263 |
|
|
Noninterest bearing deposits as % of total |
|
|
36.36 |
% |
|
|
35.84 |
% |
|
|
31.19 |
% |
|
|
|
|
|
|
|
|
|
|
• |
Average deposits increased 7.5% on a linked-quarter basis and 28.8% compared to the first quarter of 2020. |
|
|
• |
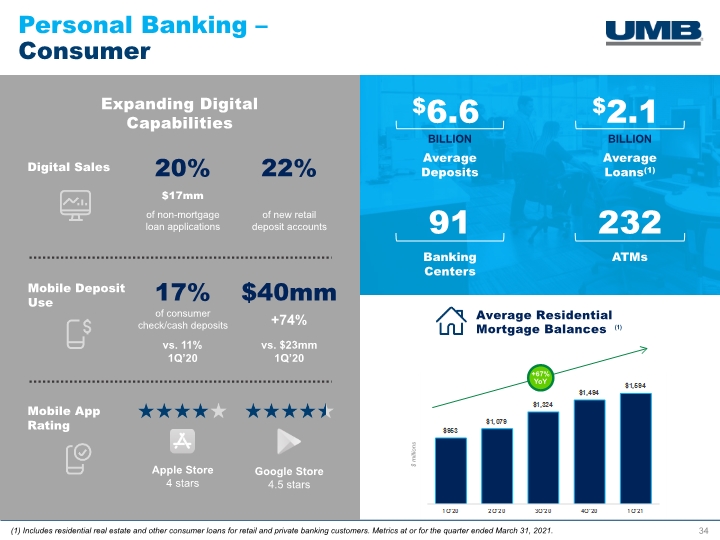
Average noninterest-bearing demand deposits increased 9.0% on a linked-quarter basis to $9.8 billion. |
Capital
|
Capital information |
|
UMB Financial Corporation |
|
|||||||||
|
(unaudited, dollars in thousands, except per share data) |
|
|
|
|
|
|
|
|
|
|
|
|
|
|
|
March 31, 2021 |
|
|
December 31, 2020 |
|
|
March 31, 2020 |
|
|||
|
Total equity |
|
$ |
2,958,239 |
|
|
$ |
3,016,948 |
|
|
$ |
2,663,441 |
|
|
Book value per common share |
|
|
61.24 |
|
|
|
62.84 |
|
|
|
55.33 |
|
|
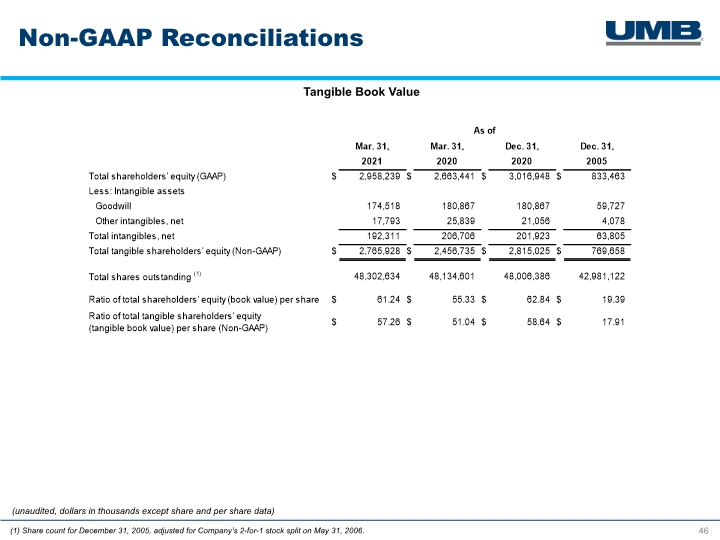
Tangible book value per common share |
|
|
57.26 |
|
|
|
58.64 |
|
|
|
51.04 |
|
|
|
|
|
|
|
|
|
|
|
|
|
|
|
|
Regulatory capital: |
|
|
|
|
|
|
|
|
|
|
|
|
|
Common equity Tier 1 capital |
|
$ |
2,660,102 |
|
|
$ |
2,547,634 |
|
|
$ |
2,279,039 |
|
|
Tier 1 capital |
|
|
2,660,102 |
|
|
|
2,547,634 |
|
|
|
2,279,039 |
|
|
Total capital |
|
|
3,102,333 |
|
|
|
3,002,545 |
|
|
|
2,514,445 |
|
|
|
|
|
|
|
|
|
|
|
|
|
|
|
|
Regulatory capital ratios: |
|
|
|
|
|
|
|
|
|
|
|
|
|
Common equity Tier 1 capital ratio |
|
|
12.25 |
% |
|
|
12.10 |
% |
|
|
11.90 |
% |
|
Tier 1 risk-based capital ratio |
|
|
12.25 |
|
|
|
12.10 |
|
|
|
11.90 |
|
|
Total risk-based capital ratio |
|
|
14.28 |
|
|
|
14.26 |
|
|
|
13.12 |
|
|
Tier 1 leverage ratio |
|
|
8.08 |
|
|
|
8.37 |
|
|
|
8.81 |
|
|
|
• |
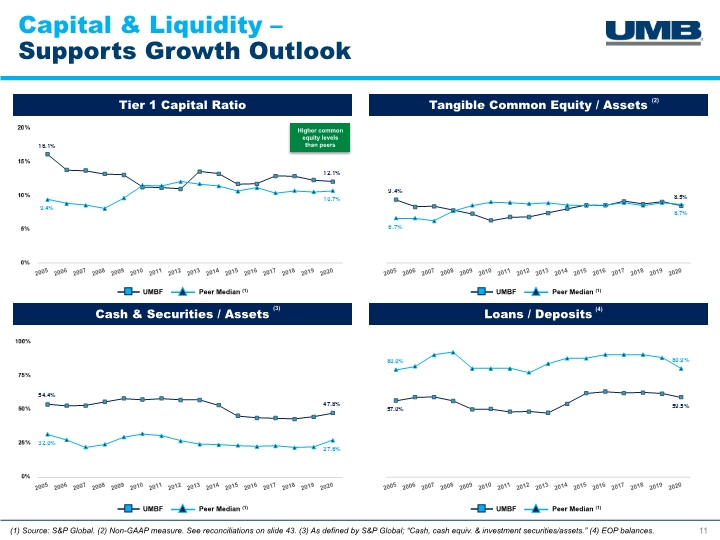
At March 31, 2021, the regulatory capital ratios presented in the foregoing table exceeded all “well-capitalized” regulatory thresholds. |
Asset Quality
|
Credit quality |
|
UMB Financial Corporation |
|
|||||||||||||||||
|
(unaudited, dollars in thousands) |
|
|
|
|
|
|
|
|
|
|
|
|
|
|
|
|
|
|
|
|
|
|
|
Q1 |
|
|
Q4 |
|
|
Q3 |
|
|
Q2 |
|
|
Q1 |
|
|||||
|
|
|
2021 |
|
|
2020 |
|
|
2020 |
|
|
2020 |
|
|
2020 |
|
|||||
|
Net charge-offs - Total loans |
|
$ |
5,310 |
|
|
$ |
1,801 |
|
|
$ |
5,111 |
|
|
$ |
5,541 |
|
|
$ |
7,672 |
|
|
Net loan charge-offs as a % of total average loans |
|
|
0.13 |
% |
|
|
0.04 |
% |
|
|
0.13 |
% |
|
|
0.15 |
% |
|
|
0.23 |
% |
|
Loans over 90 days past due |
|
$ |
1,773 |
|
|
$ |
1,952 |
|
|
$ |
1,372 |
|
|
$ |
4,588 |
|
|
$ |
2,211 |
|
|
Loans over 90 days past due as a % of total loans |
|
|
0.01 |
% |
|
|
0.01 |
% |
|
|
0.01 |
% |
|
|
0.03 |
% |
|
|
0.02 |
% |
|
Nonaccrual and restructured loans |
|
$ |
76,706 |
|
|
$ |
87,823 |
|
|
$ |
93,695 |
|
|
$ |
82,245 |
|
|
$ |
97,029 |
|
|
Nonaccrual and restructured loans as a % of total loans |
|
|
0.46 |
% |
|
|
0.55 |
% |
|
|
0.59 |
% |
|
|
0.54 |
% |
|
|
0.70 |
% |
|
Provision for credit losses |
|
$ |
(7,500 |
) |
|
$ |
5,000 |
|
|
$ |
16,000 |
|
|
$ |
21,500 |
|
|
$ |
88,000 |
|
|
|
• |
Provision for credit losses for the first quarter decreased $12.5 million from the linked quarter and $95.5 million from the first quarter of 2020. |
|
|
• |
Provision expense in 2020 included increased expense related to the impact on various economic variables due to the COVID-19 pandemic. The decline in the first quarter of 2021 represents a release of Allowance for Credit Losses based on positive macro-economic data and portfolio credit metrics. |
|
|
• |
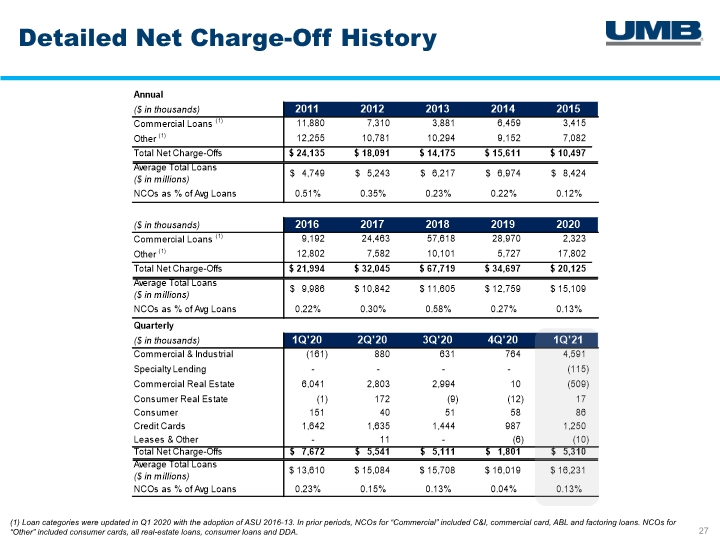
Net charge-offs for the first quarter totaled $5.3 million, or 0.13%, of average loans, compared to $1.8 million, or 0.04%, of average loans in the linked quarter, and $7.7 million, or 0.23%, of average loans for the first quarter of 2020. |
Conference Call
The company plans to host a conference call to discuss its first quarter 2021 earnings results on Wednesday, April 28, 2021, at 8:30 a.m. (CT).
Interested parties may access the call by dialing (toll-free) 877-267-8760 or (international) 412-542-4148 and requesting to join the UMB Financial call. The live call may also be accessed by visiting investorrelations.umb.com or by using the following link:
UMB Financial 1Q 2021 Conference Call
A replay of the conference call may be heard through May 12, 2021 by calling (toll-free)
877-344-7529 or (international) 412-317-0088. The replay access code required for playback is 10153930. The call replay may also be accessed at investorrelations.umb.com.
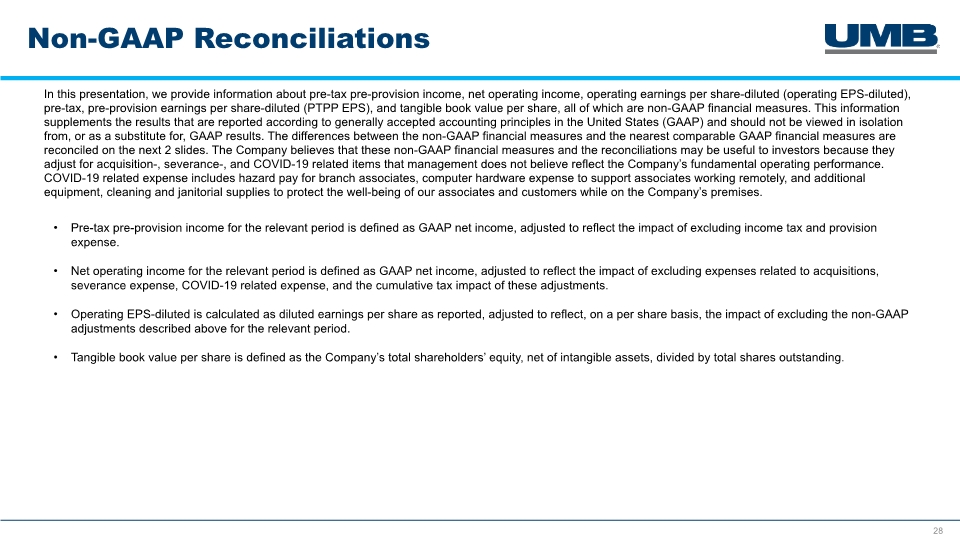
Non-GAAP Financial Information
In this release, we provide information about net operating income (loss), operating earnings (losses) per share - diluted (operating EPS), operating return on average equity (operating ROE), operating return on average assets (operating ROA), operating noninterest expense, operating efficiency ratio, pre-tax, pre-provision income, pre-tax, pre-provision earnings per share – diluted (PTPP EPS), pre-tax, pre-provision income on a fully tax equivalent basis (PTPP-FTE), pre-tax, pre-provision FTE earnings per share – diluted (PTPP-FTE EPS), tangible shareholders’ equity, and tangible book value per share, all of which are non-GAAP financial measures. This information supplements the results that are reported according to generally accepted accounting principles in the United States (GAAP) and should not be viewed in isolation from, or as a substitute for, GAAP results. The differences between the non-GAAP financial measures – net operating income (loss), operating EPS, operating ROE, operating ROA, operating noninterest expense, operating efficiency ratio, PTPP, PTPP EPS, PTPP-FTE, PTPP-FTE EPS, tangible shareholders’ equity, and tangible book value per share – and the nearest comparable GAAP financial measures are reconciled later in this release. The company believes that these non-GAAP financial
measures and the reconciliations may be useful to investors because they adjust for acquisition-, severance-, and COVID-19 related items that management does not believe reflect the company’s fundamental operating performance. COVID-19 related expense includes hazard pay for branch associates, computer hardware expense to support associates working remotely, and additional equipment, cleaning, and janitorial supplies to protect the well-being of our associates and customers while on the company’s premises.
Net operating income (loss) for the relevant period is defined as GAAP net income, adjusted to reflect the impact of excluding expenses related to acquisitions, severance expense, COVID-19 related expense, and the cumulative tax impact of these adjustments.
Operating EPS (diluted) is calculated as earnings per share as reported, adjusted to reflect, on a per share basis, the impact of excluding the non-GAAP adjustments described above for the relevant period. Operating ROE is calculated as net operating income, divided by the company’s average total shareholders’ equity for the relevant period. Operating ROA is calculated as net operating income, divided by the company’s average assets for the relevant period. Operating noninterest expense for the relevant period is defined as GAAP noninterest expense, adjusted to reflect the pre-tax impact of non-GAAP adjustments described above. Operating efficiency ratio is calculated as the company’s operating noninterest expense, net of amortization of other intangibles, divided by the company’s total non-GAAP revenue (calculated as net interest income plus noninterest income, less gains on sales of securities available for sale, net).
Pre-tax, pre-provision income for the relevant period is defined as GAAP net income, adjusted to reflect the impact of excluding income tax and provision expenses.
Pre-tax, pre-provision income on a fully tax equivalent basis for the relevant period is defined as GAAP net interest income on a fully tax equivalent basis plus noninterest income, less noninterest expense.
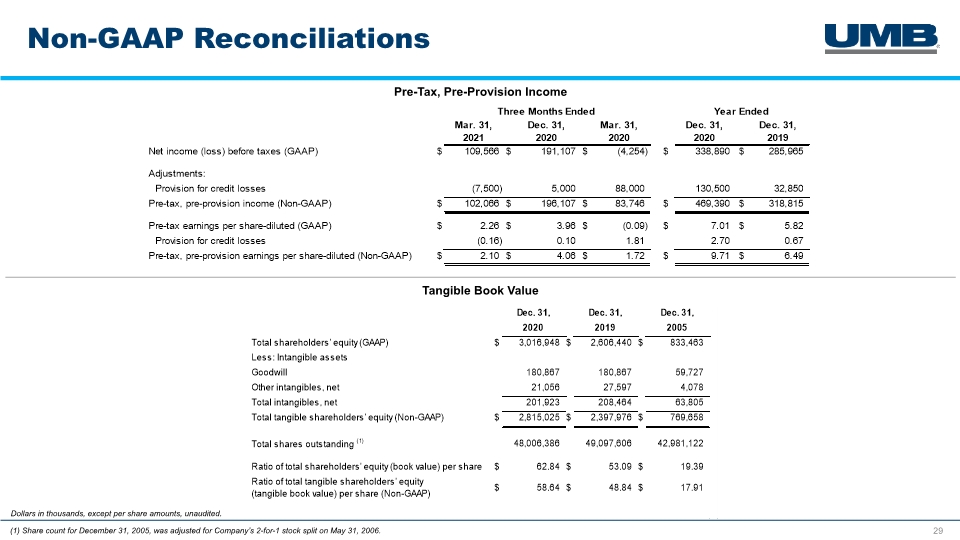
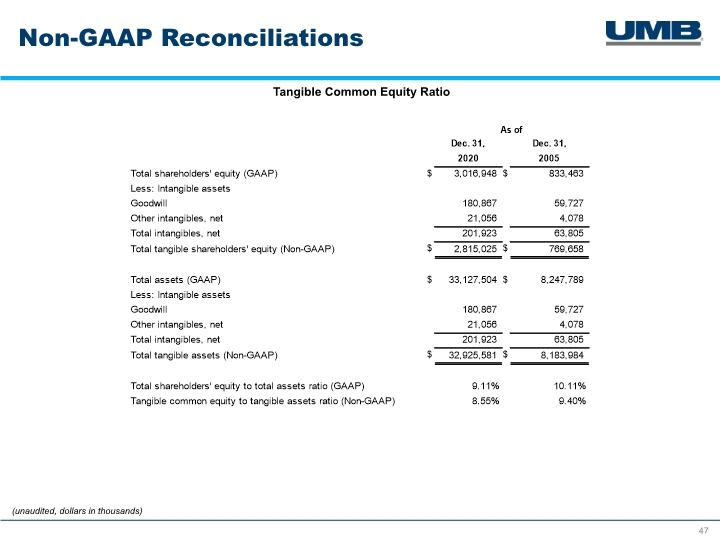
Tangible shareholders’ equity for the relevant period is defined as GAAP shareholders’ equity, net of intangible assets. Tangible book value per share is defined as tangible shareholders’ equity divided by the Company’s total shares outstanding.
Forward-Looking Statements:
This press release contains, and our other communications may contain, forward-looking statements within the meaning of the Private Securities Litigation Reform Act of 1995. These statements can be identified by the fact that they do not relate strictly to historical or current facts. Forward-looking statements often use words such as “believe,” “expect,” “anticipate,” “intend,” “estimate,” “project,” “outlook,” “forecast,” “target,” “trend,” “plan,” “goal,” or other words of comparable meaning or future-tense or conditional verbs such as “may,” “will,” “should,” “would,” or “could.” Forward-looking statements convey our expectations, intentions, or forecasts about future events, circumstances, results, or aspirations. All forward-looking statements are subject to assumptions, risks, and uncertainties, which may change over time and many of which are beyond our control. You should not rely on any forward-looking statement as a prediction or guarantee about the future. Our actual future objectives, strategies, plans, prospects, performance, condition, or results may differ materially from those set forth in any forward-looking statement. Some of the factors that may cause actual results or other future events, circumstances, or aspirations to differ from those in forward-looking statements are described in our Annual Report on Form 10-K for the year ended December 31, 2020, our subsequent Quarterly Reports on Form 10-Q or Current Reports on Form 8-K, or other applicable documents that are filed or furnished with the U.S. Securities and Exchange Commission (SEC). In addition to such factors that have been disclosed previously, the COVID-19 pandemic (the pandemic) may also cause actual results or other future events, circumstances, or aspirations to differ from our forward-looking statements. The pandemic has created a global public-health crisis that has resulted in widespread volatility and deteriorations in household, business, economic, and market conditions. It is currently adversely affecting the company and its customers, counterparties, employees, and first-party service providers, and the continued adverse impacts on our business, financial position, results of operations, and prospects could be significant. We
are not able to accurately predict the extent of the impact of the pandemic on our capital, liquidity, and other financial positions and on our business, results of operations, and prospects at this time, and we believe it will depend on a number of evolving factors, including: (i) the duration, extent and severity of the pandemic; (ii) the response of governmental and non-governmental authorities to the pandemic, which is rapidly changing and not always coordinated or consistent across jurisdictions; (iii) the effect of the pandemic on our customers, counterparties, employees and first-party service providers, which may vary widely, and which is generally expected to increase our credit, counterparty, operational, and other risks; and (iv) the effect of the pandemic on economies and markets, which in turn could adversely affect, among other things, the origination of new loans and the performance of our existing loans. Any forward-looking statement should be evaluated in light of these considerations. Any forward-looking statement made by us or on our behalf speaks only as of the date that it was made. We do not undertake to update any forward-looking statement to reflect the impact of events, circumstances, or results that arise after the date that the statement was made, except to the extent required by applicable securities laws. You, however, should consult further disclosures (including disclosures of a forward-looking nature) that we may make in any subsequent Annual Report on Form 10-K, Quarterly Report on Form 10-Q, Current Report on Form 8-K, or other applicable document that is filed or furnished with the SEC.
UMB Financial Corporation (Nasdaq: UMBF) is a financial services company headquartered in Kansas City, Missouri. UMB offers commercial banking, which includes comprehensive deposit, lending and investment services, personal banking, which includes wealth management and financial planning services, and institutional banking, which includes asset servicing, corporate trust solutions, investment banking, and healthcare services. UMB operates branches throughout Missouri, Illinois, Colorado, Kansas, Oklahoma, Nebraska, Arizona and Texas, and serves business and institutional clients nationwide. For more information, visit UMB.com, UMB Blog, UMB Facebook and UMB LinkedIn, or follow us on Twitter at @UMBBank. For information about UMB’s operations, approach and relief measures during the COVID-19 pandemic, please visit umb.com/COVID-19.
|
Consolidated Balance Sheets |
|
UMB Financial Corporation |
|
|||||
|
(unaudited, dollars in thousands) |
|
|
|
|
|
|
|
|
|
|
|
March 31, |
|
|||||
|
|
|
2021 |
|
|
2020 |
|
||
|
ASSETS |
|
|
|
|
|
|
|
|
|
Loans |
|
$ |
16,497,385 |
|
|
$ |
13,949,710 |
|
|
Allowance for credit losses on loans |
|
|
(202,814 |
) |
|
|
(187,911 |
) |
|
Net loans |
|
|
16,294,571 |
|
|
|
13,761,799 |
|
|
Loans held for sale |
|
|
10,275 |
|
|
|
9,585 |
|
|
Securities: |
|
|
|
|
|
|
|
|
|
Available for sale |
|
|
9,753,392 |
|
|
|
7,639,451 |
|
|
Held to maturity, net of allowance for credit losses |
|
|
1,039,711 |
|
|
|
1,110,925 |
|
|
Trading securities |
|
|
29,099 |
|
|
|
61,177 |
|
|
Other securities |
|
|
298,209 |
|
|
|
135,194 |
|
|
Total securities |
|
|
11,120,411 |
|
|
|
8,946,747 |
|
|
Federal funds sold and resell agreements |
|
|
1,629,813 |
|
|
|
784,750 |
|
|
Interest-bearing due from banks |
|
|
3,860,763 |
|
|
|
1,109,254 |
|
|
Cash and due from banks |
|
|
387,230 |
|
|
|
340,553 |
|
|
Premises and equipment, net |
|
|
286,068 |
|
|
|
297,668 |
|
|
Accrued income |
|
|
131,533 |
|
|
|
111,879 |
|
|
Goodwill |
|
|
174,518 |
|
|
|
180,867 |
|
|
Other intangibles, net |
|
|
17,793 |
|
|
|
25,839 |
|
|
Other assets |
|
|
756,414 |
|
|
|
675,945 |
|
|
Total assets |
|
$ |
34,669,389 |
|
|
$ |
26,244,886 |
|
|
|
|
|
|
|
|
|
|
|
|
LIABILITIES |
|
|
|
|
|
|
|
|
|
Deposits: |
|
|
|
|
|
|
|
|
|
Noninterest-bearing demand |
|
$ |
11,604,415 |
|
|
$ |
7,269,520 |
|
|
Interest-bearing demand and savings |
|
|
16,011,812 |
|
|
|
12,920,980 |
|
|
Time deposits under $250,000 |
|
|
457,290 |
|
|
|
595,128 |
|
|
Time deposits of $250,000 or more |
|
|
207,275 |
|
|
|
389,892 |
|
|
Total deposits |
|
|
28,280,792 |
|
|
|
21,175,520 |
|
|
Federal funds purchased and repurchase agreements |
|
|
2,759,818 |
|
|
|
1,890,917 |
|
|
Short-term debt |
|
|
— |
|
|
|
15,000 |
|
|
Long-term debt |
|
|
270,074 |
|
|
|
70,668 |
|
|
Accrued expenses and taxes |
|
|
239,001 |
|
|
|
216,272 |
|
|
Other liabilities |
|
|
161,465 |
|
|
|
213,068 |
|
|
Total liabilities |
|
|
31,711,150 |
|
|
|
23,581,445 |
|
|
|
|
|
|
|
|
|
|
|
|
SHAREHOLDERS' EQUITY |
|
|
|
|
|
|
|
|
|
Common stock |
|
|
55,057 |
|
|
|
55,057 |
|
|
Capital surplus |
|
|
1,093,667 |
|
|
|
1,073,089 |
|
|
Retained earnings |
|
|
1,968,318 |
|
|
|
1,646,751 |
|
|
Accumulated other comprehensive income, net |
|
|
169,197 |
|
|
|
219,390 |
|
|
Treasury stock |
|
|
(328,000 |
) |
|
|
(330,846 |
) |
|
Total shareholders' equity |
|
|
2,958,239 |
|
|
|
2,663,441 |
|
|
Total liabilities and shareholders' equity |
|
$ |
34,669,389 |
|
|
$ |
26,244,886 |
|
|
Consolidated Statements of Income |
|
UMB Financial Corporation |
|
|||||
|
(unaudited, dollars in thousands except share and per share data) |
|
|
|
|
|
|||
|
|
|
Three Months Ended |
|
|||||
|
|
|
March 31, |
|
|||||
|
|
|
2021 |
|
|
2020 |
|
||
|
INTEREST INCOME |
|
|
|
|
|
|
|
|
|
Loans |
|
$ |
150,170 |
|
|
$ |
151,026 |
|
|
Securities: |
|
|
|
|
|
|
|
|
|
Taxable interest |
|
|
27,162 |
|
|
|
27,212 |
|
|
Tax-exempt interest |
|
|
24,964 |
|
|
|
24,404 |
|
|
Total securities income |
|
|
52,126 |
|
|
|
51,616 |
|
|
Federal funds and resell agreements |
|
|
2,821 |
|
|
|
5,452 |
|
|
Interest-bearing due from banks |
|
|
703 |
|
|
|
2,663 |
|
|
Trading securities |
|
|
159 |
|
|
|
654 |
|
|
Total interest income |
|
|
205,979 |
|
|
|
211,411 |
|
|
INTEREST EXPENSE |
|
|
|
|
|
|
|
|
|
Deposits |
|
|
6,798 |
|
|
|
29,732 |
|
|
Federal funds and repurchase agreements |
|
|
1,886 |
|
|
|
6,381 |
|
|
Other |
|
|
3,180 |
|
|
|
1,357 |
|
|
Total interest expense |
|
|
11,864 |
|
|
|
37,470 |
|
|
Net interest income |
|
|
194,115 |
|
|
|
173,941 |
|
|
Provision for credit losses |
|
|
(7,500 |
) |
|
|
88,000 |
|
|
Net interest income after provision for credit losses |
|
|
201,615 |
|
|
|
85,941 |
|
|
NONINTEREST INCOME |
|
|
|
|
|
|
|
|
|
Trust and securities processing |
|
|
54,834 |
|
|
|
47,000 |
|
|
Trading and investment banking |
|
|
9,356 |
|
|
|
1,723 |
|
|
Service charges on deposit accounts |
|
|
21,976 |
|
|
|
25,081 |
|
|
Insurance fees and commissions |
|
|
420 |
|
|
|
259 |
|
|
Brokerage fees |
|
|
3,334 |
|
|
|
9,860 |
|
|
Bankcard fees |
|
|
14,673 |
|
|
|
16,545 |
|
|
Investment securities (losses) gains, net |
|
|
(8,336 |
) |
|
|
3,520 |
|
|
Other |
|
|
12,640 |
|
|
|
(5,564 |
) |
|
Total noninterest income |
|
|
108,897 |
|
|
|
98,424 |
|
|
NONINTEREST EXPENSE |
|
|
|
|
|
|
|
|
|
Salaries and employee benefits |
|
|
127,681 |
|
|
|
111,060 |
|
|
Occupancy, net |
|
|
11,935 |
|
|
|
12,180 |
|
|
Equipment |
|
|
19,615 |
|
|
|
21,241 |
|
|
Supplies and services |
|
|
3,492 |
|
|
|
4,185 |
|
|
Marketing and business development |
|
|
2,345 |
|
|
|
4,640 |
|
|
Processing fees |
|
|
15,417 |
|
|
|
13,390 |
|
|
Legal and consulting |
|
|
5,755 |
|
|
|
6,110 |
|
|
Bankcard |
|
|
4,956 |
|
|
|
4,860 |
|
|
Amortization of other intangible assets |
|
|
1,380 |
|
|
|
1,734 |
|
|
Regulatory fees |
|
|
2,546 |
|
|
|
2,366 |
|
|
Other |
|
|
5,824 |
|
|
|
6,853 |
|
|
Total noninterest expense |
|
|
200,946 |
|
|
|
188,619 |
|
|
Income (loss) before income taxes |
|
|
109,566 |
|
|
|
(4,254 |
) |
|
Income tax expense (benefit) |
|
|
16,923 |
|
|
|
(815 |
) |
|
NET INCOME (LOSS) |
|
$ |
92,643 |
|
|
$ |
(3,439 |
) |
|
|
|
|
|
|
|
|
|
|
|
PER SHARE DATA |
|
|
|
|
|
|
|
|
|
Net income (loss) – basic |
|
$ |
1.93 |
|
|
$ |
(0.07 |
) |
|
Net income (loss) – diluted |
|
|
1.91 |
|
|
|
(0.07 |
) |
|
Dividends |
|
|
0.32 |
|
|
|
0.31 |
|
|
Weighted average shares outstanding – basic |
|
|
48,096,643 |
|
|
|
48,689,876 |
|
|
Weighted average shares outstanding – diluted |
|
|
48,520,752 |
|
|
|
48,689,876 |
|
|
Consolidated Statements of Comprehensive Income |
|
UMB Financial Corporation |
|
|||||
|
(unaudited, dollars in thousands) |
|
|
|
|
|
|
|
|
|
|
|
Three Months Ended |
|
|||||
|
|
|
March 31, |
|
|||||
|
|
|
2021 |
|
|
2020 |
|
||
|
Net income (loss) |
|
$ |
92,643 |
|
|
$ |
(3,439 |
) |
|
Other comprehensive (loss) income, before tax: |
|
|
|
|
|
|
|
|
|
Unrealized gains and losses on debt securities: |
|
|
|
|
|
|
|
|
|
Change in unrealized holding gains and losses, net |
|
|
(199,038 |
) |
|
|
164,116 |
|
|
Less: Reclassification adjustment for gains included in net income |
|
|
(2,720 |
) |
|
|
(1,227 |
) |
|
Change in unrealized gains and losses on debt securities |
|
|
(201,758 |
) |
|
|
162,889 |
|
|
Unrealized gains and losses on derivative hedges: |
|
|
|
|
|
|
|
|
|
Change in unrealized gains and losses on derivative hedges, net |
|
|
6,503 |
|
|
|
14,525 |
|
|
Less: Reclassification adjustment for (gains) losses included in net income |
|
|
(842 |
) |
|
|
768 |
|
|
Change in unrealized gains and losses on derivative hedges |
|
|
5,661 |
|
|
|
15,293 |
|
|
Other comprehensive (loss) income, before tax |
|
|
(196,097 |
) |
|
|
178,182 |
|
|
Income tax benefit (expense) |
|
|
46,954 |
|
|
|
(41,972 |
) |
|
Other comprehensive (loss) income |
|
|
(149,143 |
) |
|
|
136,210 |
|
|
Comprehensive (loss) income |
|
$ |
(56,500 |
) |
|
$ |
132,771 |
|
|
Consolidated Statements of Shareholders' Equity |
UMB Financial Corporation |
|
||||||||||||||||||||||
|
(unaudited, dollars in thousands except per share data) |
|
|
|
|
|
|
|
|
|
|
|
|
|
|
|
|
|
|||||||
|
|
|
Common Stock |
|
|
Capital Surplus |
|
|
Retained Earnings |
|
|
Accumulated Other Comprehensive Income (Loss) |
|
|
Treasury Stock |
|
|
Total |
|
||||||
|
Balance - January 1, 2020 |
|
$ |
55,057 |
|
|
$ |
1,073,764 |
|
|
$ |
1,672,438 |
|
|
$ |
83,180 |
|
|
$ |
(277,999 |
) |
|
$ |
2,606,440 |
|
|
Total comprehensive (loss) income |
|
|
— |
|
|
|
— |
|
|
|
(3,439 |
) |
|
|
136,210 |
|
|
|
— |
|
|
|
132,771 |
|
|
Dividends ($0.31 per share) |
|
|
— |
|
|
|
— |
|
|
|
(15,209 |
) |
|
|
— |
|
|
|
— |
|
|
|
(15,209 |
) |
|
Purchase of treasury stock |
|
|
— |
|
|
|
(4,500 |
) |
|
|
— |
|
|
|
— |
|
|
|
(54,886 |
) |
|
|
(59,386 |
) |
|
Forfeitures of equity awards, net of issuances |
|
|
— |
|
|
|
521 |
|
|
|
— |
|
|
|
— |
|
|
|
72 |
|
|
|
593 |
|
|
Recognition of equity-based compensation |
|
|
— |
|
|
|
2,817 |
|
|
|
— |
|
|
|
— |
|
|
|
— |
|
|
|
2,817 |
|
|
Sale of treasury stock |
|
|
— |
|
|
|
95 |
|
|
|
— |
|
|
|
— |
|
|
|
89 |
|
|
|
184 |
|
|
Exercise of stock options |
|
|
— |
|
|
|
392 |
|
|
|
— |
|
|
|
— |
|
|
|
1,878 |
|
|
|
2,270 |
|
|
Cumulative effect adjustment |
|
|
— |
|
|
|
— |
|
|
|
(7,039 |
) |
|
|
— |
|
|
|
— |
|
|
|
(7,039 |
) |
|
Balance - March 31, 2020 |
|
$ |
55,057 |
|
|
$ |
1,073,089 |
|
|
$ |
1,646,751 |
|
|
$ |
219,390 |
|
|
$ |
(330,846 |
) |
|
$ |
2,663,441 |
|
|
|
|
|
|
|
|
|
|
|
|
|
|
|
|
|
|
|
|
|
|
|
|
|
|
|
|
Balance - January 1, 2021 |
|
$ |
55,057 |
|
|
$ |
1,090,450 |
|
|
$ |
1,891,246 |
|
|
$ |
318,340 |
|
|
$ |
(338,145 |
) |
|
$ |
3,016,948 |
|
|
Total comprehensive income (loss) |
|
|
— |
|
|
|
— |
|
|
|
92,643 |
|
|
|
(149,143 |
) |
|
|
— |
|
|
|
(56,500 |
) |
|
Dividends ($0.32 per share) |
|
|
— |
|
|
|
— |
|
|
|
(15,571 |
) |
|
|
— |
|
|
|
— |
|
|
|
(15,571 |
) |
|
Purchase of treasury stock |
|
|
— |
|
|
|
— |
|
|
|
— |
|
|
|
— |
|
|
|
(4,027 |
) |
|
|
(4,027 |
) |
|
Issuances of equity awards, net of forfeitures |
|
|
— |
|
|
|
(4,043 |
) |
|
|
— |
|
|
|
— |
|
|
|
4,738 |
|
|
|
695 |
|
|
Recognition of equity-based compensation |
|
|
— |
|
|
|
4,457 |
|
|
|
— |
|
|
|
— |
|
|
|
— |
|
|
|
4,457 |
|
|
Sale of treasury stock |
|
|
— |
|
|
|
65 |
|
|
|
— |
|
|
|
— |
|
|
|
86 |
|
|
|
151 |
|
|
Exercise of stock options |
|
|
— |
|
|
|
2,738 |
|
|
|
— |
|
|
|
— |
|
|
|
9,348 |
|
|
|
12,086 |
|
|
Balance - March 31, 2021 |
|
$ |
55,057 |
|
|
$ |
1,093,667 |
|
|
$ |
1,968,318 |
|
|
$ |
169,197 |
|
|
$ |
(328,000 |
) |
|
$ |
2,958,239 |
|
|
Average Balances / Yields and Rates |
|
UMB Financial Corporation |
|
|||||||||||||
|
|
|
|
|
|
|
|
|
|
|
|
|
|
|
|
|
|
|
(unaudited, dollars in thousands) |
|
|
|
|
|
|
|
|
|
|
|
|
|
|
|
|
|
|
|
Three Months Ended March 31, |
|
|||||||||||||
|
|
|
2021 |
|
|
2020 |
|
||||||||||
|
|
|
Average |
|
|
Average |
|
|
Average |
|
|
Average |
|
||||
|
|
|
Balance |
|
|
Yield/Rate |
|
|
Balance |
|
|
Yield/Rate |
|
||||
|
Assets |
|
|
|
|
|
|
|
|
|
|
|
|
|
|
|
|
|
Loans, net of unearned interest |
|
$ |
16,246,093 |
|
|
|
3.75 |
% |
|
$ |
13,616,566 |
|
|
|
4.46 |
% |
|
Securities: |
|
|
|
|
|
|
|
|
|
|
|
|
|
|
|
|
|
Taxable |
|
|
6,398,188 |
|
|
|
1.72 |
|
|
|
4,694,418 |
|
|
|
2.33 |
|
|
Tax-exempt |
|
|
4,301,256 |
|
|
|
2.98 |
|
|
|
4,063,042 |
|
|
|
3.05 |
|
|
Total securities |
|
|
10,699,444 |
|
|
|
2.23 |
|
|
|
8,757,460 |
|
|
|
2.67 |
|
|
Federal funds and resell agreements |
|
|
1,643,894 |
|
|
|
0.70 |
|
|
|
1,224,196 |
|
|
|
1.79 |
|
|
Interest bearing due from banks |
|
|
2,823,771 |
|
|
|
0.10 |
|
|
|
826,963 |
|
|
|
1.30 |
|
|
Trading securities |
|
|
17,540 |
|
|
|
4.30 |
|
|
|
48,102 |
|
|
|
5.84 |
|
|
Total earning assets |
|
|
31,430,742 |
|
|
|
2.74 |
|
|
|
24,473,287 |
|
|
|
3.58 |
|
|
Allowance for credit losses |
|
|
(219,672 |
) |
|
|
|
|
|
|
(112,751 |
) |
|
|
|
|
|
Other assets |
|
|
1,841,224 |
|
|
|
|
|
|
|
1,679,390 |
|
|
|
|
|
|
Total assets |
|
$ |
33,052,294 |
|
|
|
|
|
|
$ |
26,039,926 |
|
|
|
|
|
|
|
|
|
|
|
|
|
|
|
|
|
|
|
|
|
|
|
|
Liabilities and Shareholders' Equity |
|
|
|
|
|
|
|
|
|
|
|
|
|
|
|
|
|
Interest-bearing deposits |
|
$ |
17,072,344 |
|
|
|
0.16 |
% |
|
$ |
14,330,150 |
|
|
|
0.83 |
% |
|
Federal funds and repurchase agreements |
|
|
2,519,373 |
|
|
|
0.30 |
|
|
|
2,030,385 |
|
|
|
1.26 |
|
|
Borrowed funds |
|
|
269,576 |
|
|
|
4.78 |
|
|
|
70,647 |
|
|
|
7.73 |
|
|
Total interest-bearing liabilities |
|
|
19,861,293 |
|
|
|
0.24 |
|
|
|
16,431,182 |
|
|
|
0.92 |
|
|
Noninterest-bearing demand deposits |
|
|
9,753,680 |
|
|
|
|
|
|
|
6,495,611 |
|
|
|
|
|
|
Other liabilities |
|
|
445,777 |
|
|
|
|
|
|
|
392,181 |
|
|
|
|
|
|
Shareholders' equity |
|
|
2,991,544 |
|
|
|
|
|
|
|
2,720,952 |
|
|
|
|
|
|
Total liabilities and shareholders' equity |
|
$ |
33,052,294 |
|
|
|
|
|
|
$ |
26,039,926 |
|
|
|
|
|
|
Net interest spread |
|
|
|
|
|
|
2.50 |
% |
|
|
|
|
|
|
2.66 |
% |
|
Net interest margin |
|
|
|
|
|
|
2.59 |
|
|
|
|
|
|
|
2.97 |
|
|
Business Segment Information |
|
UMB Financial Corporation |
|
|||||||||||||
|
(unaudited, dollars in thousands) |
|
|
|
|
|
|
|
|
|
|
|
|
|
|
|
|
|
|
|
Three Months Ended March 31, 2021 |
|
|||||||||||||
|
|
|
Commercial Banking |
|
|
Institutional Banking |
|
|
Personal Banking |
|
|
Total |
|
||||
|
Net interest income |
|
$ |
133,032 |
|
|
$ |
22,138 |
|
|
$ |
38,945 |
|
|
$ |
194,115 |
|
|
Provision for credit losses |
|
|
(8,182 |
) |
|
|
220 |
|
|
|
462 |
|
|
|
(7,500 |
) |
|
Noninterest income |
|
|
7,385 |
|
|
|
68,421 |
|
|
|
33,091 |
|
|
|
108,897 |
|
|
Noninterest expense |
|
|
65,645 |
|
|
|
71,282 |
|
|
|
64,019 |
|
|
|
200,946 |
|
|
Income before taxes |
|
|
82,954 |
|
|
|
19,057 |
|
|
|
7,555 |
|
|
|
109,566 |
|
|
Income tax expense |
|
|
12,813 |
|
|
|
2,943 |
|
|
|
1,167 |
|
|
|
16,923 |
|
|
Net income |
|
$ |
70,141 |
|
|
$ |
16,114 |
|
|
$ |
6,388 |
|
|
$ |
92,643 |
|
|
|
|
|
|
|
|
|
|
|
|
|
|
|
|
|
|
|
|
|
|
Three Months Ended March 31, 2020 |
|
|||||||||||||
|
|
|
Commercial Banking |
|
|
Institutional Banking |
|
|
Personal Banking |
|
|
Total |
|
||||
|
Net interest income |
|
$ |
106,948 |
|
|
$ |
33,036 |
|
|
$ |
33,957 |
|
|
$ |
173,941 |
|
|
Provision for credit losses |
|
|
82,220 |
|
|
|
275 |
|
|
|
5,505 |
|
|
|
88,000 |
|
|
Noninterest income |
|
|
11,240 |
|
|
|
61,952 |
|
|
|
25,232 |
|
|
|
98,424 |
|
|
Noninterest expense |
|
|
59,043 |
|
|
|
68,453 |
|
|
|
61,123 |
|
|
|
188,619 |
|
|
(Loss) income before taxes |
|
|
(23,075 |
) |
|
|
26,260 |
|
|
|
(7,439 |
) |
|
|
(4,254 |
) |
|
Income tax (benefit) expense |
|
|
(4,421 |
) |
|
|
5,032 |
|
|
|
(1,426 |
) |
|
|
(815 |
) |
|
Net (loss) income |
|
$ |
(18,654 |
) |
|
$ |
21,228 |
|
|
$ |
(6,013 |
) |
|
$ |
(3,439 |
) |
|
|
|
|
|
|
|
|
|
|
|
|
|
|
|
|
|
|
The company has strategically aligned its operations into the following three reportable segments: Commercial Banking, Institutional Banking, and Personal Banking. Senior executive officers regularly evaluate business segment financial results produced by the company’s internal reporting system in deciding how to allocate resources and assess performance for individual business segments. The company’s reportable segments include certain corporate overhead, technology and service costs that are allocated based on methodologies that are applied consistently between periods. For comparability purposes, amounts in all periods are based on methodologies in effect at March 31, 2021.
Non-GAAP Financial Measures
|
Net operating income Non-GAAP reconciliations: |
|
UMB Financial Corporation |
|
|||||
|
(unaudited, dollars in thousands except per share data) |
|
|
|
|||||
|
|
|
Three Months Ended March 31, |
|
|||||
|
|
|
2021 |
|
|
2020 |
|
||
|
Net income (loss) (GAAP) |
|
$ |
92,643 |
|
|
$ |
(3,439 |
) |
|
Adjustments: |
|
|
|
|
|
|
|
|
|
Acquisition expense |
|
|
— |
|
|
|
123 |
|
|
Severance expense |
|
|
21 |
|
|
|
1,652 |
|
|
COVID-19 related expense |
|
|
155 |
|
|
|
228 |
|
|
Tax-impact of adjustments (i) |
|
|
(39 |
) |
|
|
(445 |
) |
|
Total Non-GAAP adjustments (net of tax) |
|
|
137 |
|
|
|
1,558 |
|
|
Net operating income (loss) (Non-GAAP) |
|
$ |
92,780 |
|
|
$ |
(1,881 |
) |
|
|
|
|
|
|
|
|
|
|
|
Earnings (losses) per share - diluted (GAAP) |
|
$ |
1.91 |
|
|
$ |
(0.07 |
) |
|
Acquisition expense |
|
|
— |
|
|
|
— |
|
|
Severance expense |
|
|
— |
|
|
|
0.04 |
|
|
COVID-19 related expense |
|
|
— |
|
|
|
— |
|
|
Tax-impact of adjustments (i) |
|
|
— |
|
|
|
(0.01 |
) |
|
Operating earnings (losses) per share - diluted (Non-GAAP) |
|
$ |
1.91 |
|
|
$ |
(0.04 |
) |
|
|
|
|
|
|
|
|
|
|
|
GAAP |
|
|
|
|
|
|
|
|
|
Return on average assets |
|
|
1.14 |
% |
|
|
(0.05 |
)% |
|
Return on average equity |
|
|
12.56 |
|
|
|
(0.51 |
) |
|
|
|
|
|
|
|
|
|
|
|
Non-GAAP |
|
|
|
|
|
|
|
|
|
Operating return on average assets |
|
|
1.14 |
% |
|
|
(0.03 |
)% |
|
Operating return on average equity |
|
|
12.58 |
|
|
|
(0.28 |
) |
(i) Calculated using the company’s marginal tax rate of 22.2%.
|
Operating noninterest expense and operating efficiency ratio Non-GAAP reconciliations: |
|
UMB Financial Corporation |
|
|||||
|
(unaudited, dollars in thousands) |
|
|
|
|
|
|
|
|
|
|
|
Three Months Ended March 31, |
|
|||||
|
|
|
2021 |
|
|
2020 |
|
||
|
Noninterest expense |
|
$ |
200,946 |
|
|
$ |
188,619 |
|
|
Adjustments to arrive at operating noninterest expense (pre-tax): |
|
|
|
|
|
|
|
|
|
Acquisition expense |
|
|
— |
|
|
|
123 |
|
|
Severance expense |
|
|
21 |
|
|
|
1,652 |
|
|
COVID-19 related expense |
|
|
155 |
|
|
|
228 |
|
|
Total Non-GAAP adjustments (pre-tax) |
|
|
176 |
|
|
|
2,003 |
|
|
Operating noninterest expense (Non-GAAP) |
|
$ |
200,770 |
|
|
$ |
186,616 |
|
|
|
|
|
|
|
|
|
|
|
|
Noninterest expense |
|
$ |
200,946 |
|
|
$ |
188,619 |
|
|
Less: Amortization of other intangibles |
|
|
1,380 |
|
|
|
1,734 |
|
|
Noninterest expense, net of amortization of other intangibles (Non-GAAP) (numerator A) |
|
$ |
199,566 |
|
|
$ |
186,885 |
|
|
|
|
|
|
|
|
|
|
|
|
Operating noninterest expense |
|
$ |
200,770 |
|
|
$ |
186,616 |
|
|
Less: Amortization of other intangibles |
|
|
1,380 |
|
|
|
1,734 |
|
|
Operating expense, net of amortization of other intangibles (Non-GAAP) (numerator B) |
|
$ |
199,390 |
|
|
$ |
184,882 |
|
|
|
|
|
|
|
|
|
|
|
|
Net interest income |
|
$ |
194,115 |
|
|
$ |
173,941 |
|
|
Noninterest income |
|
|
108,897 |
|
|
|
98,424 |
|
|
Less: Gains on sales of securities available for sale, net |
|
|
2,720 |
|
|
|
1,227 |
|
|
Total Non-GAAP Revenue (denominator A) |
|
$ |
300,292 |
|
|
$ |
271,138 |
|
|
|
|
|
|
|
|
|
|
|
|
Efficiency ratio (numerator A/denominator A) |
|
|
66.46 |
% |
|
|
68.93 |
% |
|
Operating efficiency ratio (Non-GAAP) (numerator B/denominator A) |
|
|
66.40 |
|
|
|
68.19 |
|
|
Pre-tax, pre-provision income non-GAAP reconciliations: |
UMB Financial Corporation |
|
||||||
|
(unaudited, dollars in thousands except per share data) |
|
|
|
|
|
|
|
|
|
|
|
Three Months Ended March 31, |
|
|||||
|
|
|
2021 |
|
|
2020 |
|
||
|
Net income (loss) before taxes (GAAP) |
|
$ |
109,566 |
|
|
$ |
(4,254 |
) |
|
Adjustments: |
|
|
|
|
|
|
|
|
|
Provision for credit losses |
|
|
(7,500 |
) |
|
|
88,000 |
|
|
Pre-tax, pre-provision income (Non-GAAP) |
|
$ |
102,066 |
|
|
$ |
83,746 |
|
|
|
|
|
|
|
|
|
|
|
|
Pre-tax earnings (losses) per share - diluted (GAAP) |
|
$ |
2.26 |
|
|
$ |
(0.09 |
) |
|
Provision for credit losses |
|
|
(0.16 |
) |
|
|
1.81 |
|
|
Pre-tax, pre-provision earnings per share - diluted (Non-GAAP) |
|
$ |
2.10 |
|
|
$ |
1.72 |
|
|
Pre-tax, pre-provision income - FTE Non-GAAP reconciliations: |
|
UMB Financial Corporation |
|
|||||
|
(unaudited, dollars in thousands except per share data) |
|
|
|
|
|
|
|
|
|
|
|
Three Months Ended March 31, |
|
|||||
|
|
|
2021 |
|
|
2020 |
|
||
|
Net interest income |
|
$ |
194,115 |
|
|
$ |
173,941 |
|
|
Adjustments to arrive at net interest income - FTE: |
|
|
|
|
|
|
|
|
|
Tax equivalent interest |
|
|
6,678 |
|
|
|
6,478 |
|
|
Net interest income - FTE |
|
$ |
200,793 |
|
|
$ |
180,419 |
|
|
Noninterest income |
|
|
108,897 |
|
|
|
98,424 |
|
|
Less: Noninterest expense |
|
|
200,946 |
|
|
|
188,619 |
|
|
Pre-tax, pre-provision income - FTE (Non-GAAP) |
|
$ |
108,744 |
|
|
$ |
90,224 |
|
|
|
|
|
|
|
|
|
|
|
|
Net interest income earnings per share - diluted |
|
$ |
4.00 |
|
|
$ |
3.57 |
|
|
Tax equivalent interest |
|
|
0.14 |
|
|
|
0.13 |
|
|
Net interest income - FTE |
|
|
4.14 |
|
|
|
3.70 |
|
|
Noninterest income |
|
|
2.24 |
|
|
|
2.02 |
|
|
Less: Noninterest expense |
|
|
4.14 |
|
|
|
3.87 |
|
|
Pre-tax, pre-provision income - FTE earnings per share - diluted (Non-GAAP) |
|
$ |
2.24 |
|
|
$ |
1.85 |
|
|
Tangible book value non-GAAP reconciliations: |
UMB Financial Corporation |
|
||||||
|
(unaudited, dollars in thousands except share and per share data) |
|
|
|
|
|
|
|
|
|
|
|
As of March 31, |
|
|||||
|
|
|
2021 |
|
|
2020 |
|
||
|
Total shareholders' equity (GAAP) |
|
$ |
2,958,239 |
|
|
$ |
2,663,441 |
|
|
Less: Intangible assets |
|
|
|
|
|
|
|
|
|
Goodwill |
|
|
174,518 |
|
|
|
180,867 |
|
|
Other intangibles, net |
|
|
17,793 |
|
|
|
25,839 |
|
|
Total intangibles, net |
|
|
192,311 |
|
|
|
206,706 |
|
|
Total tangible shareholders' equity (Non-GAAP) |
|
$ |
2,765,928 |
|
|
$ |
2,456,735 |
|
|
|
|
|
|
|
|
|
|
|
|
Total shares outstanding |
|
|
48,302,634 |
|
|
|
48,134,601 |
|
|
|
|
|
|
|
|
|
|
|
|
Ratio of total shareholders' equity (book value) per share |
|
$ |
61.24 |
|
|
$ |
55.33 |
|
|
Ratio of total tangible shareholders' equity (tangible book value) per share (Non-GAAP) |
|
|
57.26 |
|
|
|
51.04 |
|