Exhibit 99

Certain information in this Supplemental Information Package contains Non-GAAP financial measures. These Non-GAAP financial measures are REIT industry financial measures that are not calculated in accordance with accounting principles generally accepted in the United States of America. Please see page 15 for a definition of these Non-GAAP financial measures and page 7 for the reconciliation of certain captions in the Supplemental Information Package to the statement of operations as reported in the Company’s filings with the SEC on Form 10-K.
| UMH Properties, Inc. | Fourth Quarter FY 2021 Supplemental Information | 2 |
| UMH Properties, Inc. | Fourth Quarter FY 2021 Supplemental Information | 3 |
| UMH Properties, Inc. | Fourth Quarter FY 2021 Supplemental Information | 4 |
| UMH Properties, Inc. | Fourth Quarter FY 2021 Supplemental Information | 5 |
| UMH Properties, Inc. | Fourth Quarter FY 2021 Supplemental Information | 6 |
(1) Consists of special bonus and restricted stock grants for the August 2020 groundbreaking Fannie Mae financing, which are being expensed over the vesting period ($1.8 million) and non-recurring expenses for the joint venture ($171,000) in 2021.
| UMH Properties, Inc. | Fourth Quarter FY 2021 Supplemental Information | 7 |
| UMH Properties, Inc. | Fourth Quarter FY 2021 Supplemental Information | 8 |
(1) Weighted average interest rates do not include the effect of unamortized debt issuance costs.
| UMH Properties, Inc. | Fourth Quarter FY 2021 Supplemental Information | 9 |
(in thousands) (unaudited)
| As of 12/31/21: | ||||||||||||||||
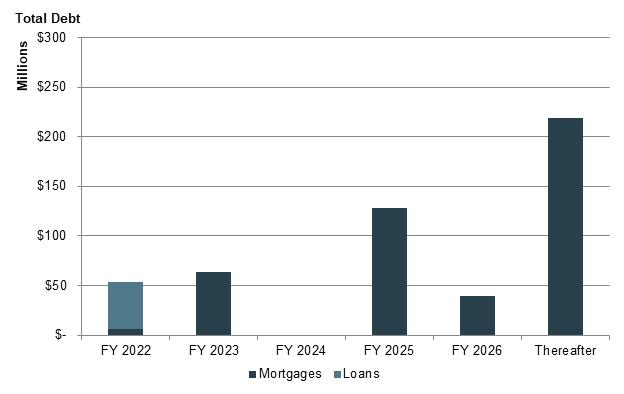
| Fiscal Year Ended | Mortgages | Loans | Total | % of Total | ||||||||||||
| 2022 | $ | 6,523 | $ | 46,945 | (1) | $ | 53,468 | 10.6 | % | |||||||
| 2023 | 63,437 | -0- | 63,437 | 12.6 | % | |||||||||||
| 2024 | -0- | -0- | -0- | 0.0 | % | |||||||||||
| 2025 | 128,501 | -0- | 128,501 | 25.5 | % | |||||||||||
| 2026 | 39,388 | -0- | 39,388 | 7.8 | % | |||||||||||
| Thereafter | 218,853 | -0- | 218,853 | 43.5 | % | |||||||||||
| Total Debt Before Unamortized Debt Issuance Cost | 456,702 | 46,945 | 503,647 | 100.0 | % | |||||||||||
| Unamortized Debt Issuance Cost | (4,135 | ) | (188 | ) | (4,323 | ) | ||||||||||
| Total Debt, Net of Unamortized Debt Issuance Costs | $ | 452,567 | $ | 46,757 | $ | 499,324 | ||||||||||
(1) Includes $25 million balance outstanding on the Company’s Line of Credit due November 2022, with an additional one-year option.
| UMH Properties, Inc. | Fourth Quarter FY 2021 Supplemental Information | 10 |
Securities Portfolio Performance
(in thousands)
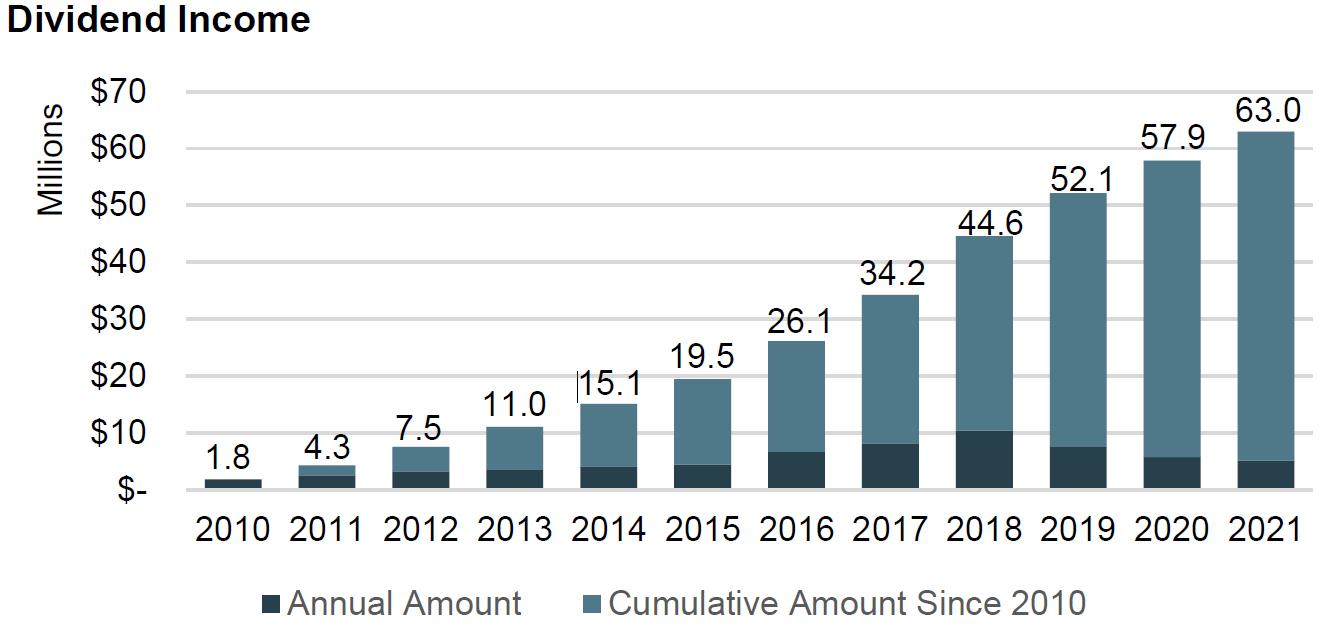
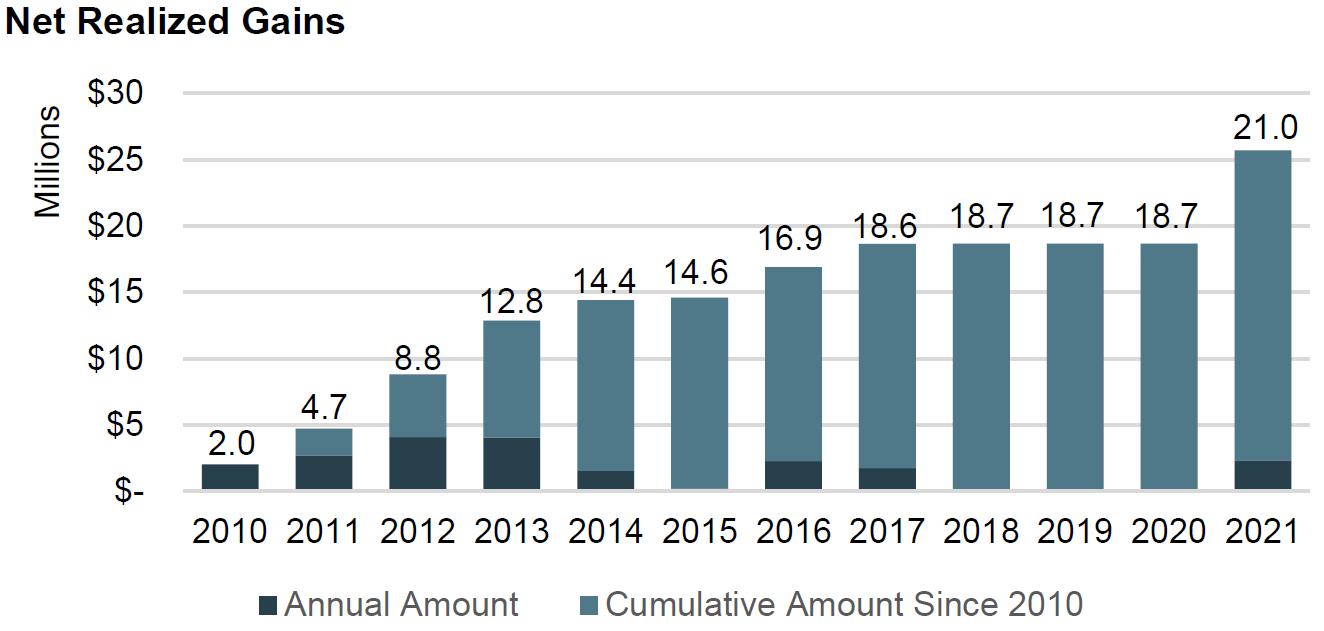
Year Ended | Securities Available for Sale | Dividend Income | Net Realized Gain on Sale of Securities | Net Realized Gain on Sale of Securities & Dividend Income | ||||||||||||
| 2010 | $ | 28,757 | $ | 1,763 | $ | 2,028 | $ | 3,791 | ||||||||
| 2011 | 43,298 | 2,512 | 2,693 | 5,205 | ||||||||||||
| 2012 | 57,325 | 3,244 | 4,093 | 7,337 | ||||||||||||
| 2013 | 59,255 | 3,481 | 4,056 | 7,537 | ||||||||||||
| 2014 | 63,556 | 4,066 | 1,543 | 5,609 | ||||||||||||
| 2015 | 75,011 | 4,399 | 204 | 4,603 | ||||||||||||
| 2016 | 108,755 | 6,636 | 2,285 | 8,921 | ||||||||||||
| 2017 | 132,964 | 8,135 | 1,747 | 9,882 | ||||||||||||
| 2018 | 99,596 | 10,367 | 20 | 10,387 | ||||||||||||
| 2019 | 116,186 | 7,535 | -0- | 7,535 | ||||||||||||
| 2020 | 103,172 | 5,729 | -0- | 5,729 | ||||||||||||
| 2021 | 113,748 | 5,098 | 2,342 | 7,440 | ||||||||||||
| $ | 62,965 | $ | 21,011 | $ | 83,976 | |||||||||||
| UMH Properties, Inc. | Fourth Quarter FY 2021 Supplemental Information | 11 |
(unaudited)
| 12/31/2021 | 12/31/2020 | % Change | ||||||||||
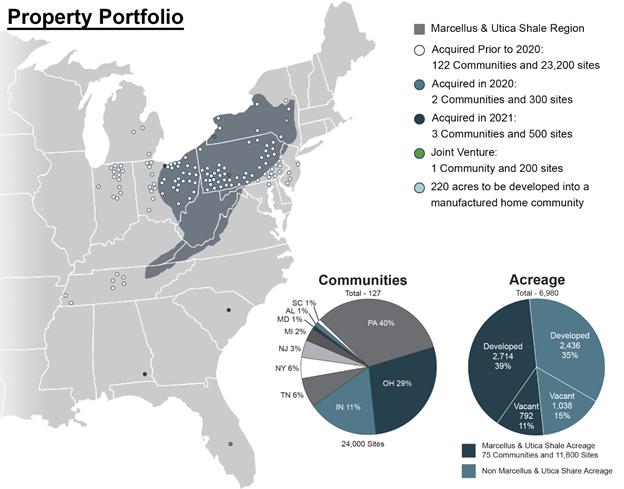
| Communities | 127 | 124 | 2.4 | % | ||||||||
| Developed Sites | 24,025 | 23,433 | 2.5 | % | ||||||||
| Occupied | 20,662 | 19,920 | 3.7 | % | ||||||||
| Occupancy % | 86.0 | % | 85.0 | % | 100 bps | |||||||
| Total Rentals | 8,706 | 8,252 | 5.5 | % | ||||||||
| Occupied Rentals | 8,312 | 7,810 | 6.4 | % | ||||||||
| Rental Occupancy % | 95.5 | % | 94.6 | % | 90 bps | |||||||
| Monthly Rent Per Site | $ | 480 | $ | 461 | 4.1 | % | ||||||
| Monthly Rent Per Home Rental Including Site | $ | 824 | $ | 790 | 4.3 | % | ||||||
| State | Number | Total Acreage | Developed Acreage | Vacant Acreage | Total Sites | Occupied Sites | Occupancy Percentage | Monthly Rent Per Site | Total Rentals | Occupied Rentals | Rental Occupancy Percentage | Monthly Rent Per Home Rental | ||||||||||||||||||||
| (1) | (1) | (2) | ||||||||||||||||||||||||||||||
| Alabama | 1 | 33 | 33 | -0- | 195 | 60 | 30.8 | % | $ | 175 | 36 | 21 | 58.3 | % | $ | 681 | ||||||||||||||||
| Indiana | 14 | 1,105 | 893 | 212 | 3,985 | 3,476 | 87.2 | % | $ | 431 | 1,715 | 1,649 | 96.2 | % | $ | 817 | ||||||||||||||||
| Maryland | 1 | 77 | 10 | 67 | 62 | 62 | 100.0 | % | $ | 569 | -0- | -0- | N/A | N/A | ||||||||||||||||||
| Michigan | 3 | 153 | 153 | -0- | 734 | 625 | 85.1 | % | $ | 470 | 264 | 246 | 93.2 | % | $ | 810 | ||||||||||||||||
| New Jersey | 4 | 349 | 187 | 162 | 1,006 | 973 | 96.7 | % | $ | 686 | 44 | 44 | 100.0 | % | $ | 1,029 | ||||||||||||||||
| New York | 8 | 674 | 323 | 351 | 1,353 | 1,154 | 85.3 | % | $ | 571 | 444 | 427 | 96.2 | % | $ | 962 | ||||||||||||||||
| Ohio | 37 | 1,837 | 1,390 | 447 | 6,937 | 5,887 | 84.9 | % | $ | 438 | 2,576 | 2,460 | 95.5 | % | $ | 788 | ||||||||||||||||
| Pennsylvania | 51 | 2,184 | 1,821 | 363 | 7,780 | 6,678 | 85.8 | % | $ | 502 | 2,756 | 2,623 | 95.2 | % | $ | 838 | ||||||||||||||||
| South Carolina | 1 | 24 | 24 | -0- | 142 | 62 | 43.7 | % | $ | 195 | 29 | 22 | 75.9 | % | $ | 565 | ||||||||||||||||
| Tennessee | 7 | 544 | 316 | 228 | 1,831 | 1,685 | 92.0 | % | $ | 486 | 842 | 820 | 97.4 | % | $ | 834 | ||||||||||||||||
| Total as of December 31, 2021 | 127 | 6,980 | 5,150 | 1,830 | 24,025 | 20,662 | 86.0 | % | $ | 480 | 8,706 | 8,312 | 95.5 | % | $ | 824 | ||||||||||||||||
(1) Total and Vacant Acreage of 220 for the Mountain View Estates property is included in the above summary.
(2) Includes home and site rent charges.
| UMH Properties, Inc. | Fourth Quarter FY 2021 Supplemental Information | 12 |
(in thousands) (unaudited)
| For Three Months Ended | For Twelve Months Ended | |||||||||||||||||||||||||||||||
| 12/31/2021 | 12/31/2020 | Change | % Change | 12/31/2021 | 12/31/2020 | Change | % Change | |||||||||||||||||||||||||
| Community Net Operating Income | ||||||||||||||||||||||||||||||||
| Rental and Related | ||||||||||||||||||||||||||||||||
| Income | $ | 39,741 | $ | 37,074 | $ | 2,667 | 7.2 | % | $ | 155,914 | $ | 142,398 | $ | 13,516 | 9.5 | % | ||||||||||||||||
| Community Operating | ||||||||||||||||||||||||||||||||
| Expenses | 15,517 | 14,878 | 639 | 4.3 | % | 62,494 | 59,856 | 2,638 | 4.4 | % | ||||||||||||||||||||||
| Community NOI | $ | 24,224 | $ | 22,196 | $ | 2,028 | 9.1 | % | $ | 93,420 | $ | 82,542 | $ | 10,878 | 13.2 | % | ||||||||||||||||
| 12/31/2021 | 12/31/2020 | Change | ||||||||||
| Total Sites | 23,054 | 23,024 | 0.1 | % | ||||||||
| Occupied Sites | 20,077 | 19,664 | 413 sites, 2.1% | |||||||||
| Occupancy % | 87.1 | % | 85.4 | % | 170 bps | |||||||
| Number of Properties | 122 | 122 | N/A | |||||||||
| Total Rentals | 8,487 | 8,131 | 4.4 | % | ||||||||
| Occupied Rentals | 8,132 | 7,700 | 5.6 | % | ||||||||
| Rental Occupancy | 95.8 | % | 94.7 | % | 110 bps | |||||||
| Monthly Rent Per Site | $ | 484 | $ | 462 | 4.8 | % | ||||||
| Monthly Rent Per Home Including Site | $ | 825 | $ | 791 | 4.3 | % | ||||||
Same Property includes all properties owned as of January 1, 2020, with the exception of Memphis Blues.
| UMH Properties, Inc. | Fourth Quarter FY 2021 Supplemental Information | 13 |
| 2021 Acquisitions | ||||||||||||||
| Community | Date of Acquisition | State | Number
of Sites | Purchase Price | Number of Acres | Occupancy | ||||||||
| Deer Run | January 8, 2021 | AL | 195 | $ | 4,555 | 33 | 37% | |||||||
| Iris Winds | January 21, 2021 | SC | 142 | 3,445 | 24 | 49% | ||||||||
| Bayshore Estates | June 1, 2021 | OH | 206 | 10,300 | 56 | 86% | ||||||||
| Total as of December 31, 2021 | 543 | $ | 18,300 | 113 | 59% | |||||||||
| UMH Properties, Inc. | Fourth Quarter FY 2021 Supplemental Information | 14 |
Investors and analysts following the real estate industry utilize funds from operations available to common shareholders (“FFO”), normalized funds from operations available to common shareholders (“Normalized FFO”), community NOI, same property NOI, and earnings before interest, taxes, depreciation, amortization and acquisition costs (“Adjusted EBITDA”), variously defined, as supplemental performance measures. While the Company believes net income (loss) available to common shareholders, as defined by accounting principles generally accepted in the United States of America (U.S. GAAP), is the most appropriate measure, it considers Community NOI, Same Property NOI, Adjusted EBITDA, FFO and Normalized FFO, given their wide use by and relevance to investors and analysts, appropriate supplemental performance measures. FFO, reflecting the assumption that real estate asset values rise or fall with market conditions, principally adjusts for the effects of U.S. GAAP depreciation and amortization of real estate assets. FFO also adjusts for the effects of the change in the fair value of marketable securities and gains and losses realized on marketable securities. Normalized FFO reflects the same assumptions as FFO except that it also adjusts for and certain one-time charges. Community NOI and Same Property NOI provides a measure of rental operations and does not factor in depreciation and amortization and non-property specific expenses such as general and administrative expenses. Adjusted EBITDA provides a tool to further evaluate the ability to incur and service debt and to fund dividends and other cash needs. In addition, Community NOI, Same Property NOI, Adjusted EBITDA, FFO and Normalized FFO are commonly used in various ratios, pricing multiples, yields and returns and valuation of calculations used to measure financial position, performance and value.
As used herein, the Company calculates FFO, as defined by The National Association of Real Estate Investment Trusts (“NAREIT”), to be equal to net income (loss) applicable to common shareholders, as defined by U.S. GAAP, excluding extraordinary items as defined by U.S. GAAP, gains or losses from sales of previously depreciated real estate assets, impairment charges related to depreciable real estate assets, the change in the fair value of marketable securities, and the gain or loss on the sale of marketable securities plus certain non-cash items such as real estate asset depreciation and amortization. Included in the NAREIT FFO White Paper - 2018 Restatement, is an option pertaining to assets incidental to our main business in the calculation of NAREIT FFO to make an election to include or exclude gains and losses on the sale of these assets, such as marketable equity securities, and include or exclude mark-to-market changes in the value recognized on these marketable equity securities. In conjunction with the adoption of the FFO White Paper - 2018 Restatement, for all periods presented, we have elected to exclude the gains and losses realized on marketable securities and change in the fair value of marketable securities from our FFO calculation. NAREIT created FFO as a non-GAAP supplemental measure of REIT operating performance.
Normalized FFO is calculated as FFO excluding certain one-time charges.
Normalized FFO per Diluted Common Share is calculated using diluted weighted shares outstanding of 51.1 million and 47.4 million shares for the three and twelve months ended December 31, 2021, respectively, and 42.4 million and 41.7 million shares for the three and twelve months ended December 31, 2020, respectively. Common stock equivalents resulting from stock options in the amount of 1.4 and 1.1 million shares for the three and twelve months ended December 31, 2021, respectively, and 636,000 and 350,000 shares for the three and twelve months ended December 31, 2020, respectively, are included in the diluted weighted shares outstanding. Common stock equivalents for the twelve months ended December 31, 2020, were excluded from the computation of the Diluted Net Income (Loss) per Share as their effect would be anti-dilutive.
Community NOI is calculated as rental and related income less community operating expenses such as real estate taxes, repairs and maintenance, community salaries, utilities, insurance and other expenses. Community NOI excludes realized gains (losses) on securities transactions.
Same Property NOI is calculated as Community NOI, using all properties owned as of January 1, 2020, with the exception of Memphis Blues.
Adjusted EBITDA is calculated as net income (loss) plus interest expense, franchise taxes, depreciation, and the change in the fair value of marketable securities.
Community NOI, Same Property NOI, Adjusted EBITDA, FFO and Normalized FFO do not represent cash generated from operating activities in accordance with U.S. GAAP and are not necessarily indicative of cash available to fund cash needs, including the repayment of principal on debt and payment of dividends and distributions. Community NOI, Same Property NOI, Adjusted EBITDA, FFO and Normalized FFO should not be considered as substitutes for net income (loss) applicable to common shareholders (calculated in accordance with U.S. GAAP) as a measure of results of operations, or cash flows (calculated in accordance with U.S. GAAP) as a measure of liquidity. Community NOI, Same Property NOI, Adjusted EBITDA, FFO and Normalized FFO as currently calculated by the Company may not be comparable to similarly titled, but variously calculated, measures of other REITs.
| UMH Properties, Inc. | Fourth Quarter FY 2021 Supplemental Information | 15 |
Press Release Dated February 24, 2022
| FOR IMMEDIATE RELEASE | February 24, 2022 |
| Contact: Nelli Madden | |
| 732-577-9997 |
UMH PROPERTIES, INC. REPORTS RESULTS FOR THE YEAR ENDED AND THE FOURTH QUARTER ENDED DECEMBER 31, 2021
FREEHOLD, NJ, February 24, 2022........ UMH Properties, Inc. (NYSE:UMH) reported Total Income of $186.1 million for the year ended December 31, 2021 as compared to $163.6 million for the year ended December 31, 2020, representing an increase of 14%. Total Income for the quarter ended December 31, 2021 was $46.0 million as compared to $42.8 million for the quarter ended December 31, 2020, representing an increase of 7%. Net Income Attributable to Common Shareholders amounted to $21.2 million or $0.45 per diluted share for the year ended December 31, 2021 as compared to a loss $29.8 million or $0.72 per diluted share for the year ended December 31, 2020. Net Income Attributable to Common Shareholders amounted to $9.4 million or $0.17 per diluted share for the quarter ended December 31, 2021 as compared to income of $15.6 million or $0.38 per diluted share for the quarter ended December 31, 2020.
Funds from Operations Attributable to Common Shareholders (“FFO”) was $39.1 million or $0.83 per diluted share for the year ended December 31, 2021 as compared to $26.3 million or $0.63 per diluted share for the year ended December 31, 2020. FFO was $10.1 million or $0.20 per diluted share for the quarter ended December 31, 2021 as compared to $8.5 million or $0.20 per diluted share for the quarter ended December 31, 2020. Normalized Funds from Operations Attributable to Common Shareholders (“Normalized FFO”), was $41.1 million or $0.87 per diluted share for the year ended December 31, 2021, as compared to $29.2 million or $0.70 per diluted share for the year ended December 31, 2020. Normalized FFO was $11.0 million or $0.22 per diluted share for the quarter ended December 31, 2021, as compared to $8.5 million or $0.20 per diluted share for the quarter ended December 31, 2020.
A summary of significant financial information for the three and twelve months ended December 31, 2021 and 2020 is as follows (in thousands except per share amounts):
| For the Three Months Ended | ||||||||
| December 31, | ||||||||
| 2021 | 2020 | |||||||
| Total Income | $ | 45,978 | $ | 42,829 | ||||
| Total Expenses | $ | 37,500 | $ | 34,382 | ||||
| Increase in Fair Value of Marketable Securities | $ | 10,932 | $ | 17,802 | ||||
| Net Income Attributable to Common Shareholders | $ | 9,410 | $ | 15,591 | ||||
Net Income Attributable to Common Shareholders per Diluted Common Share | $ | 0.17 | $ | 0.38 | ||||
| FFO (1) | $ | 10,091 | $ | 8,544 | ||||
| FFO (1) per Diluted Common Share | $ | 0.20 | $ | 0.20 | ||||
| Normalized FFO (1) | $ | 11,016 | $ | 8,544 | ||||
| Normalized FFO (1) per Diluted Common Share | $ | 0.22 | $ | 0.20 | ||||
| Weighted Average Shares Outstanding | 51,128 | 42,390 | ||||||
| UMH Properties, Inc. | Fourth Quarter FY 2021 Supplemental Information | 16 |
| For the Twelve Months Ended | ||||||||
| December 31, | ||||||||
| 2021 | 2020 | |||||||
| Total Income | $ | 186,099 | $ | 163,609 | ||||
| Total Expenses | $ | 152,163 | $ | 135,296 | ||||
| Increase (Decrease) in Fair Value of Marketable Securities | $ | 25,052 | $ | (14,119 | ) | |||
| Net Income (Loss) Attributable to Common Shareholders | $ | 21,249 | $ | (29,759 | ) | |||
| Net Income (Loss) Attributable to Common Shareholders per Diluted Common Share | $ | 0.45 | $ | (0.72 | ) | |||
| FFO (1) | $ | 39,149 | $ | 26,283 | ||||
| FFO (1) per Diluted Common Share | $ | 0.83 | $ | 0.63 | ||||
| Normalized FFO (1) | $ | 41,144 | $ | 29,154 | ||||
| Normalized FFO (1) per Diluted Common Share | $ | 0.87 | $ | 0.70 | ||||
| Weighted Average Shares Outstanding | 47,432 | 41,395 | ||||||
A summary of significant balance sheet information as of December 31, 2021 and 2020 is as follows (in thousands):
December 31, 2021 | December 31, 2020 | |||||||
| Gross Real Estate Investments | $ | 1,205,091 | $ | 1,108,483 | ||||
| Marketable Securities at Fair Value | $ | 113,748 | $ | 103,172 | ||||
| Total Assets | $ | 1,270,820 | $ | 1,089,413 | ||||
| Mortgages Payable, net | $ | 452,567 | $ | 471,477 | ||||
| Loans Payable, net | $ | 46,757 | $ | 17,296 | ||||
| Total Shareholders’ Equity | $ | 742,140 | $ | 501,808 | ||||
Samuel A. Landy, President and CEO, commented on the 2021 results.
“UMH continues to execute on our long-term business plan which has resulted in an all-time high stock price with ample growth opportunities. Our accomplishments during the year include:
| ● | Increased Rental and Related Income by 11%; | |
| ● | Increased Community Net Operating Income (“NOI”) by 13%; | |
| ● | Increased Normalized Funds from Operations (“Normalized FFO”) by 41% and Normalized FFO per share by 24%; | |
| ● | Improved our Operating Expense ratio by 130 basis points to 42.8%; | |
| ● | Increased Same Property NOI by 13%; | |
| ● | Increased Same Property Occupancy by 413 sites from 85.4% to 87.1% or 170 basis points; | |
| ● | Increased our rental home portfolio by 454 homes to approximately 8,700 total rental homes, representing an increase of 6%; | |
| ● | Increased rental home occupancy by 90 basis points from 94.6% to 95.5%; | |
| ● | Increased Sales of Manufactured Homes by 34%; | |
| ● | Acquired three communities containing approximately 543 homesites for a total cost of approximately $18.3 million (in addition to one community acquired in December 2021 by our joint venture with Nuveen Real Estate); | |
| ● | Increased our Total Market Capitalization by 50% to $2.4 billion at yearend; | |
| ● | Increased our Equity Market Capitalization by 127% to $1.4 billion at yearend; | |
| ● | Reduced our Net Debt to Total Market Capitalization from 34% at 2020 to 16% at 2021; | |
| ● | Issued and sold approximately 8.2 million shares of Common Stock through At-the-Market Sale Programs for our Common Stock at a weighted average price of $22.14 per share, generating gross proceeds of $182.0 million and net proceeds of $179.1 million, after offering expenses; |
| UMH Properties, Inc. | Fourth Quarter FY 2021 Supplemental Information | 17 |
| ● | Issued and sold, through an At-the-Market Sale Program for our Preferred Stock, 2.2 million shares of Series D Preferred Stock at a weighted average price of $24.89 per share, generating total gross proceeds of $54.1 million and total net proceeds of $53.2 million, after offering expenses; and | |
| ● | Entered into a joint venture with Nuveen Real Estate, a TIAA company, for the purpose of development or acquisition of new manufactured housing communities, with an initial capital commitment by the joint venture partners of at least $70 million and potentially up to $170 million, 60% of which would be provided by Nuveen Real Estate and 40% of which would be provided by the Company. The joint venture acquired one community, containing approximately 219 developed home sites, for a total purchase price of $22.2 million.” |
“2021 was an exceptional year for UMH. Our community level operations are stronger than ever before. Our community drone videos are available on our website. They are a great resource for shareholders that effectively exhibit the high quality portfolio that we own. They also demonstrate our residents and employees pride in their homes and their communities. It’s part of the reason we maintain 96% rental home occupancy and continue to grow our business. We have a proven business plan that continues to generate industry leading same property operating results, growing sales and robust FFO growth.”
“Demand for affordable housing at our communities remains strong as demonstrated by our strong same property and sales results. Same property income increased by 9.5% and same property NOI increased by 13.2%. This was driven by rental rate increases of 4.8% and an occupancy increase of 170 basis points or 413 sites. Home sales improved by 34% year over year and generated a sales profit of approximately $2 million as compared to $770,000 last year. We can continue to generate similar results organically by filling our 3,400 vacant sites and developing our 1,830 acres of vacant land.”
“During the year, we acquired three communities containing approximately 543 developed homesites for an aggregate cost of $18.3 million. We also entered into a joint venture with Nuveen Real Estate for the acquisition and development of new manufactured housing communities. This joint venture acquired one newly developed community in Florida containing 219 sites.”
“Subsequent to year end, we sold $102.7 million of 4.72% unsecured bonds in Israel. This capital, as well as capital raised through our ATM and other sources, will be used to redeem our $247 million 6.75% Series C preferred stock in July of 2022. In January of 2023, we can redeem our $215 million 6.375% Series D preferred stock. These transactions will drive incremental FFO growth. We are well positioned to execute on both of these redemptions.”
“Our results and future growth prospects allowed us to raise our dividend for two consecutive years. We believe we are on track for continued dividend growth in the future. We look forward to continuing to execute on our business plan and building long-term value for our dedicated shareholders.”
UMH Properties, Inc. will host its Fourth Quarter and Year Ended December 31, 2021 Financial Results Webcast and Conference Call. Senior management will discuss the results, current market conditions and future outlook on Friday, February 25, 2022 at 10:00 a.m. Eastern Time.
The Company’s fourth quarter and year ended December 31, 2021 financial results being released herein will be available on the Company’s website at www.umh.reit in the “Financials” section.
To participate in the webcast, select the microphone icon found on the homepage www.umh.reit to access the call. Interested parties can also participate via conference call by calling toll free 844-200-6205 (domestically) or 929-526-1599 (internationally).
The replay of the conference call will be available at 12:00 p.m. Eastern Time on Friday, February 25, 2022 and can be accessed by dialing toll free 866-813-9403 (domestically) and +44 204-525-0658 (internationally) and entering the passcode 412561. A transcript of the call and the webcast replay will be available at the Company’s website, www.umh.reit.
| UMH Properties, Inc. | Fourth Quarter FY 2021 Supplemental Information | 18 |
UMH Properties, Inc., which was organized in 1968, is a public equity REIT that owns and operates 127 manufactured home communities containing approximately 24,000 developed homesites. These communities are located in New Jersey, New York, Ohio, Pennsylvania, Tennessee, Indiana, Michigan, Maryland, Alabama and South Carolina. UMH also has an ownership interest in and operates one community in Florida, containing 219 sites, through its joint venture with Nuveen Real Estate.
Certain statements included in this press release which are not historical facts may be deemed forward-looking statements within the meaning of the Private Securities Litigation Reform Act of 1995. Any such forward-looking statements are based on the Company’s current expectations and involve various risks and uncertainties. Although the Company believes the expectations reflected in any forward-looking statements are based on reasonable assumptions, the Company can provide no assurance those expectations will be achieved. The risks and uncertainties that could cause actual results or events to differ materially from expectations are contained in the Company’s annual report on Form 10-K and described from time to time in the Company’s other filings with the SEC. The Company undertakes no obligation to publicly update or revise any forward-looking statements whether as a result of new information, future events, or otherwise.
Note:
| (1) | Non-GAAP Information: We assess and measure our overall operating results based upon an industry performance measure referred to as Funds from Operations Attributable to Common Shareholders (“FFO”), which management believes is a useful indicator of our operating performance. FFO is used by industry analysts and investors as a supplemental operating performance measure of a REIT. FFO, as defined by The National Association of Real Estate Investment Trusts (“NAREIT”), represents net income (loss) attributable to common shareholders, as defined by accounting principles generally accepted in the United States of America (“U.S. GAAP”), excluding extraordinary items, as defined under U.S. GAAP, gains or losses from sales of previously depreciated real estate assets, impairment charges related to depreciable real estate assets, and the change in the fair value of marketable securities plus certain non-cash items such as real estate asset depreciation and amortization. Included in the NAREIT FFO White Paper - 2018 Restatement, is an option pertaining to assets incidental to our main business in the calculation of NAREIT FFO to make an election to include or exclude gains and losses on the sale of these assets, such as marketable equity securities, and include or exclude mark-to-market changes in the value recognized on these marketable equity securities. In conjunction with the adoption of the FFO White Paper - 2018 Restatement, for all periods presented, we have elected to exclude the change in the fair value of marketable securities from our FFO calculation. Prior to the adoption of the FFO White Paper – 2018 Restatement, we utilized Core Funds from Operations (Core FFO), which we defined as FFO, excluding the change in the fair value of marketable securities. NAREIT created FFO as a non-U.S. GAAP supplemental measure of REIT operating performance. We define Normalized Funds from Operations Attributable to Common Shareholders (“Normalized FFO”), as FFO, excluding gains and losses realized on marketable securities investments and certain one-time charges. FFO and Normalized FFO should be considered as supplemental measures of operating performance used by REITs. FFO and Normalized FFO exclude historical cost depreciation as an expense and may facilitate the comparison of REITs which have a different cost basis. However, other REITs may use different methodologies to calculate FFO and Normalized FFO and, accordingly, our FFO and Normalized FFO may not be comparable to all other REITs. The items excluded from FFO and Normalized FFO are significant components in understanding the Company’s financial performance. |
FFO and Normalized FFO (i) do not represent Cash Flow from Operations as defined by U.S. GAAP; (ii) should not be considered as alternatives to net income (loss) as a measure of operating performance or to cash flows from operating, investing and financing activities; and (iii) are not alternatives to cash flow as a measure of liquidity.
The reconciliation of the Company’s U.S. GAAP net income (loss) to the Company’s FFO and Normalized FFO for the three and twelve months ended December 31, 2021 and 2020 are calculated as follows (in thousands except footnotes):
| UMH Properties, Inc. | Fourth Quarter FY 2021 Supplemental Information | 19 |
| Three Months Ended | Twelve Months Ended | |||||||||||||||
| 12/31/21 | 12/31/20 | 12/31/21 | 12/31/20 | |||||||||||||
| Net Income (Loss) Attributable to Common Shareholders | $ | 9,410 | $ | 15,591 | $ | 21,249 | $ | (29,759 | ) | |||||||
| Depreciation Expense | 11,552 | 10,716 | 45,124 | 41,707 | ||||||||||||
| Loss on Sales of Property and Equipment | 61 | 39 | 170 | 216 | ||||||||||||
| (Increase) Decrease in Fair Value of Marketable Securities | (10,932 | ) | (17,802 | ) | (25,052 | ) | 14,119 | |||||||||
| Gain on Sales of Marketable Securities, net | -0- | -0- | (2,342 | ) | ||||||||||||
| FFO Attributable to Common Shareholders | 10,091 | 8,544 | 39,149 | 26,283 | ||||||||||||
| Redemption of Preferred Stock | -0- | -0- | -0- | 2,871 | ||||||||||||
| Non-Recurring Other Expense (1) | 925 | -0- | 1,995 | -0- | ||||||||||||
| Normalized FFO Attributable to Common Shareholders | $ | 11,016 | $ | 8,544 | $ | 41,144 | $ | 29,154 | ||||||||
| (1) | Consists of special bonus and restricted stock grants for the August 2020 groundbreaking Fannie Mae financing, which is being expensed over the vesting period ($1.8 million) and non-recurring expenses for the joint venture ($171,000) in 2021. |
The diluted weighted shares outstanding used in the calculation of FFO per Diluted Common Share and Normalized FFO per Diluted Common Share were 51.1 million and 47.4 million shares for the three and twelve months ended December 31, 2021, respectively, and 42.4 million and 41.7 million shares for the three and twelve months ended December 31, 2020, respectively. Common stock equivalents resulting from stock options in the amount of 1.4 million and 1.1 million shares for the three and twelve months ended December 31, 2021, respectively, and 636,000 and 350,000 shares for the three and twelve months ended December 31, 2020, respectively, are included in the diluted weighted shares outstanding. Common stock equivalents for the twelve months ended December 31, 2020 were excluded from the computation of the Diluted Net Income (Loss) per Share as their effect would be anti-dilutive.
The following are the cash flows provided (used) by operating, investing and financing activities for the twelve months ended December 31, 2021 and 2020 (in thousands):
| 2021 | 2020 | |||||||
| Operating Activities | $ | 65,163 | $ | 66,839 | ||||
| Investing Activities | (94,364 | ) | (103,770 | ) | ||||
| Financing Activities | 125,634 | 46,528 | ||||||
# # # #

| UMH Properties, Inc. | Fourth Quarter FY 2021 Supplemental Information | 20 |