Exhibit 99

| Table of Contents |
Certain information in this Supplemental Information Package contains Non-GAAP financial measures. These Non-GAAP financial measures are REIT industry financial measures that are not calculated in accordance with accounting principles generally accepted in the United States of America. Please see page 15 for a definition of these Non-GAAP financial measures and page 7 for the reconciliation of certain captions in the Supplemental Information Package to the statement of operations as reported in the Company’s filings with the SEC on Form 10-K.
| UMH Properties, Inc. | Fourth Quarter FY 2020 Supplemental Information | 2 |
| Financial Highlights |
| (dollars in thousands except per share amounts) (unaudited) |
| Three Months Ended | Twelve Months Ended | |||||||||||||||
| 12/31/2020 | 12/31/2019 | 12/31/2020 | 12/31/2019 | |||||||||||||
| Operating Information | ||||||||||||||||
| Number of Communities | 124 | 122 | ||||||||||||||
| Number of Sites | 23,433 | 23,088 | ||||||||||||||
| Rental and Related Income | $ | 37,577 | $ | 33,631 | $ | 143,344 | $ | 128,611 | ||||||||
| Community Operating Expenses | $ | 15,984 | $ | 15,822 | $ | 63,175 | $ | 61,708 | ||||||||
| Community NOI | $ | 21,593 | $ | 17,809 | $ | 80,169 | $ | 66,903 | ||||||||
| Expense Ratio | 42.5 | % | 47.0 | % | 44.1 | % | 48.0 | % | ||||||||
| Sales of Manufactured Homes | $ | 5,252 | $ | 4,113 | $ | 20,265 | $ | 17,980 | ||||||||
| Number of Homes Sold | 71 | 69 | 323 | 299 | ||||||||||||
| Number of Rentals Added | 174 | 114 | 858 | 882 | ||||||||||||
| Net Income (1) | $ | 23,245 | $ | 3,531 | $ | 5,055 | $ | 27,750 | ||||||||
| Net Income (Loss) Attributable to Common Shareholders (1)(2) | $ | 15,591 | $ | (3,433 | ) | $ | (29,759 | ) | $ | 2,566 | ||||||
| Adjusted EBITDA | $ | 21,305 | $ | 18,460 | $ | 79,450 | $ | 67,681 | ||||||||
| FFO Attributable to Common Shareholders | $ | 8,544 | $ | 7,006 | $ | 26,283 | $ | 24,573 | ||||||||
| Normalized FFO Attributable to Common Shareholders | $ | 8,544 | $ | 7,059 | $ | 29,154 | $ | 25,207 | ||||||||
| Shares Outstanding and Per Share Data | ||||||||||||||||
| Weighted Average Shares Outstanding | ||||||||||||||||
| Basic | 41,754 | 40,929 | 41,395 | 39,909 | ||||||||||||
| Diluted | 42,390 | 40,929 | 41,395 | 40,203 | ||||||||||||
| Net Income (Loss) Attributable to Common | ||||||||||||||||
| Shareholders per Share (1)(2) | ||||||||||||||||
| Basic | $ | 0.38 | $ | (0.08 | ) | $ | (0.72 | ) | $ | 0.07 | ||||||
| Diluted | $ | 0.38 | $ | (0.08 | ) | $ | (0.72 | ) | $ | 0.06 | ||||||
| FFO per Share(2) – Basic and Diluted | $ | 0.20 | $ | 0.17 | $ | 0.63 | $ | 0.61 | ||||||||
| Normalized FFO per Share – Basic and Diluted | $ | 0.20 | $ | 0.17 | $ | 0.70 | $ | 0.63 | ||||||||
| Dividends per Common Share | $ | 0.18 | $ | 0.18 | $ | 0.72 | $ | 0.72 | ||||||||
| Balance Sheet | ||||||||||||||||
| Total Assets | $ | 1,087,214 | $ | 1,025,453 | ||||||||||||
| Total Liabilities | $ | 585,406 | $ | 479,114 | ||||||||||||
| Market Capitalization | ||||||||||||||||
| Total Debt, Net of Unamortized Debt Issuance Costs | $ | 566,288 | $ | 457,344 | ||||||||||||
| Equity Market Capitalization | $ | 620,819 | $ | 646,976 | ||||||||||||
| Series B Preferred Stock | $ | -0- | $ | 95,030 | ||||||||||||
| Series C Preferred Stock | $ | 247,100 | $ | 243,750 | ||||||||||||
| Series D Preferred Stock | $ | 160,854 | $ | 66,268 | ||||||||||||
| Total Market Capitalization | $ | 1,585,061 | $ | 1,509,368 | ||||||||||||
| (1) | Includes increase (decrease) in fair value of marketable securities. | |
| (2) | Includes charge associated with redemption of preferred stock. |
| UMH Properties, Inc. | Fourth Quarter FY 2020 Supplemental Information | 3 |
(in thousands except per share amounts)
| December 31, | December 31, | |||||||
| 2020 | 2019 | |||||||
| ASSETS | ||||||||
| Investment Property and Equipment | ||||||||
| Land | $ | 73,704 | $ | 72,459 | ||||
| Site and Land Improvements | 656,721 | 618,041 | ||||||
| Buildings and Improvements | 28,153 | 27,380 | ||||||
| Rental Homes and Accessories | 349,905 | 297,401 | ||||||
| Total Investment Property | 1,108,483 | 1,015,281 | ||||||
| Equipment and Vehicles | 22,572 | 21,145 | ||||||
| Total Investment Property and Equipment | 1,131,055 | 1,036,426 | ||||||
| Accumulated Depreciation | (272,823 | ) | (232,783 | ) | ||||
| Net Investment Property and Equipment | 858,232 | 803,643 | ||||||
| Other Assets | ||||||||
| Cash and Cash Equivalents | 15,336 | 12,902 | ||||||
| Marketable Securities at Fair Value | 103,172 | 116,186 | ||||||
| Inventory of Manufactured Homes | 25,450 | 31,967 | ||||||
| Notes and Other Receivables, net | 46,414 | 37,995 | ||||||
| Prepaid Expenses and Other Assets | 17,785 | 10,762 | ||||||
| Land Development Costs | 20,825 | 11,998 | ||||||
| Total Other Assets | 228,982 | 221,810 | ||||||
| TOTAL ASSETS | $ | 1,087,214 | $ | 1,025,453 | ||||
| LIABILITIES AND SHAREHOLDERS’ EQUITY | ||||||||
| Liabilities | ||||||||
| Mortgages Payable, net of Unamortized Debt Issuance Costs | $ | 469,279 | $ | 373,658 | ||||
| Other Liabilities | ||||||||
| Accounts Payable | 4,390 | 4,572 | ||||||
| Loans Payable, net of Unamortized Debt Issuance Costs | 87,009 | 83,686 | ||||||
| Accrued Liabilities and Deposits | 17,295 | 10,575 | ||||||
| Tenant Security Deposits | 7,433 | 6,623 | ||||||
| Total Other Liabilities | 116,127 | 105,456 | ||||||
| Total Liabilities | 585,406 | 479,114 | ||||||
| COMMITMENTS AND CONTINGENCIES | ||||||||
| Shareholders’ Equity: | ||||||||
| Series B - 8.0% Cumulative Redeemable Preferred Stock, par value $0.10 per share; 4,000 shares authorized; 3,801 shares issued and outstanding as of December 31, 2019 | -0- | 95,030 | ||||||
| Series C - 6.75% Cumulative Redeemable Preferred Stock, par value $0.10 per share; 13,750 shares authorized; 9,884 and 9,750 issued and outstanding as of December 31, 2020 and 2019, respectively | 247,100 | 243,750 | ||||||
| Series D - 6.375% Cumulative Redeemable Preferred Stock, par value $0.10 per share; 9,300 and 6,000 shares authorized; 6,434 and 2,651 shares issued and outstanding as of December 31, 2020 and 2019, respectively | 160,854 | 66,268 | ||||||
| Common Stock – $0.10 par value per share: 140,364 and 123,664 shares authorized; 41,919 and 41,130 shares issued and outstanding as of December 31, 2020 and 2019, respectively | 4,192 | 4,113 | ||||||
Excess Stock – $0.10 par value per share: 3,000 shares authorized; no shares issued or outstanding as of December 31, 2020 and 2019 | -0- | -0- | ||||||
| Additional Paid-In Capital | 115,026 | 162,542 | ||||||
| Undistributed Income (Accumulated Deficit) | (25,364 | ) | (25,364 | ) | ||||
| Total Shareholders’ Equity | 501,808 | 546,339 | ||||||
| TOTAL LIABILITIES AND SHAREHOLDERS’ EQUITY | $ | 1,087,214 | $ | 1,025,453 | ||||
| UMH Properties, Inc. | Fourth Quarter FY 2020 Supplemental Information | 4 |
| Consolidated Statements of Income (Loss) |
| (in thousands) |
(unaudited) Three Months Ended | Twelve Months Ended | |||||||||||||||
| 12/31/2020 | 12/31/2019 | 12/31/2020 | 12/31/2019 | |||||||||||||
| INCOME: | ||||||||||||||||
| Rental and Related Income | $ | 37,577 | $ | 33,631 | $ | 143,344 | $ | 128,611 | ||||||||
| Sales of Manufactured Homes | 5,252 | 4,113 | 20,265 | 17,980 | ||||||||||||
| TOTAL INCOME | 42,829 | 37,744 | 163,609 | 146,591 | ||||||||||||
| EXPENSES: | ||||||||||||||||
| Community Operating Expenses | 15,984 | 15,822 | 63,175 | 61,708 | ||||||||||||
| Cost of Sales of Manufactured Homes | 3,704 | 2,821 | 14,417 | 12,938 | ||||||||||||
| Selling Expenses | 1,184 | 1,276 | 4,941 | 5,079 | ||||||||||||
| General and Administrative Expenses | 2,794 | 2,136 | 11,056 | 10,046 | ||||||||||||
| Depreciation Expense | 10,716 | 9,801 | 41,707 | 36,811 | ||||||||||||
| TOTAL EXPENSES | 34,382 | 31,856 | 135,296 | 126,582 | ||||||||||||
| OTHER INCOME (EXPENSE): | ||||||||||||||||
| Interest Income | 773 | 832 | 2,917 | 2,619 | ||||||||||||
| Dividend Income | 1,248 | 1,801 | 5,729 | 7,535 | ||||||||||||
| Increase (Decrease) in Fair Value of Marketable Securities | 17,802 | (563 | ) | (14,119 | ) | 14,915 | ||||||||||
| Other Income | 157 | 164 | 718 | 588 | ||||||||||||
| Interest Expense | (5,143 | ) | (4,516 | ) | (18,287 | ) | (17,805 | ) | ||||||||
| TOTAL OTHER INCOME (EXPENSE) | 14,837 | (2,282 | ) | (23,042 | ) | 7,852 | ||||||||||
| Income before Loss on Sales of Investment Property and Equipment | 23,284 | 3,606 | 5,271 | 27,861 | ||||||||||||
| Loss on Sales of Investment Property and Equipment | (39 | ) | (75 | ) | (216 | ) | (111 | ) | ||||||||
| NET INCOME | 23,245 | 3,531 | 5,055 | 27,750 | ||||||||||||
| Less: Preferred Dividends | (7,654 | ) | (6,964 | ) | (31,943 | ) | (25,184 | ) | ||||||||
| Less: Redemption of Preferred Stock | -0- | -0- | (2,871 | ) | -0- | |||||||||||
| NET INCOME (LOSS) ATTRIBUTABLE TO COMMON SHAREHOLDERS | $ | 15,591 | $ | (3,433 | ) | $ | (29,759 | ) | $ | 2,566 | ||||||
| UMH Properties, Inc. | Fourth Quarter FY 2020 Supplemental Information | 5 |
Consolidated Statements of Cash Flows
(in thousands)
| Twelve Months Ended | ||||||||
| 12/31/2020 | 12/31/2019 | |||||||
| CASH FLOWS FROM OPERATING ACTIVITIES: | ||||||||
| Net Income | $ | 5,055 | $ | 27,750 | ||||
| Non-Cash Items Included in Net Income: | ||||||||
| Depreciation | 41,707 | 36,811 | ||||||
| Amortization of Financing Costs | 1,027 | 758 | ||||||
| Stock Compensation Expense | 1,327 | 1,939 | ||||||
| Provision for Uncollectible Notes and Other Receivables | 1,546 | 1,408 | ||||||
| (Increase) Decrease in Fair Value of Marketable Securities | 14,119 | (14,915 | ) | |||||
| Loss on Sales of Investment Property and Equipment | 216 | 111 | ||||||
| Changes in Operating Assets and Liabilities: | ||||||||
| Inventory of Manufactured Homes | 6,517 | (8,264 | ) | |||||
| Notes and Other Receivables, net of Notes Acquired with Acquisitions | (9,965 | ) | (7,909 | ) | ||||
| Prepaid Expenses and Other Assets | 140 | (3,817 | ) | |||||
| Accounts Payable | (182 | ) | 699 | |||||
| Accrued Liabilities and Deposits | 6,720 | 3,164 | ||||||
| Tenant Security Deposits | 810 | 781 | ||||||
| Net Cash Provided by Operating Activities | 69,037 | 38,516 | ||||||
| CASH FLOWS FROM INVESTING ACTIVITIES: | ||||||||
| Purchase of Manufactured Home Communities, net of Mortgages Assumed | (7,790 | ) | (38,799 | ) | ||||
| Purchase of Investment Property and Equipment | (76,761 | ) | (64,535 | ) | ||||
| Proceeds from Sales of Investment Property and Equipment | 2,657 | 2,745 | ||||||
| Additions to Land Development Costs | (20,771 | ) | (20,086 | ) | ||||
| Purchase of Marketable Securities | (1,105 | ) | (1,800 | ) | ||||
| Proceeds from Sales/Redemption of Marketable Securities | -0- | 125 | ||||||
| Net Cash Used in Investing Activities | (103,770 | ) | (122,350 | ) | ||||
| CASH FLOWS FROM FINANCING ACTIVITIES: | ||||||||
| Proceeds from Mortgages, net of Mortgages Assumed | 105,984 | 44,850 | ||||||
| Net Proceeds (Payments) from Short Term Borrowings | 3,309 | (24,373 | ) | |||||
| Principal Payments of Mortgages and Loans | (9,313 | ) | (21,624 | ) | ||||
| Financing Costs on Debt | (4,737 | ) | (752 | ) | ||||
| Proceeds from Issuance of Preferred Stock, net of Offering Costs | -0- | 96,688 | ||||||
| Proceeds from At-The-Market Preferred Equity Program, net of Offering Costs | 96,141 | 15,931 | ||||||
| Redemption of 8.0% Series B Preferred Stock | (95,017 | ) | -0- | |||||
| Proceeds from At-The-Market Common Equity Program, net of Offering Costs | 1,743 | -0- | ||||||
| Proceeds from Issuance of Common Stock in the DRIP, net of Dividend Reinvestments | 6,003 | 23,796 | ||||||
| Repurchase of Preferred Stock | (12 | ) | -0- | |||||
| Repurchase of Common Stock | (1,830 | ) | (237 | ) | ||||
| Proceeds from Exercise of Stock Options | 659 | 2,603 | ||||||
| Preferred Dividends Paid | (31,943 | ) | (25,709 | ) | ||||
| Common Dividends Paid, net of Dividend Reinvestments | (26,657 | ) | (21,120 | ) | ||||
| Net Cash Provided by Financing Activities | 44,330 | 90,053 | ||||||
| NET INCREASE IN CASH, CASH EQUIVALENTS AND RESTRICTED CASH | 9,597 | 6,219 | ||||||
| CASH, CASH EQUIVALENTS AND RESTRICTED CASH AT BEGINNING OF PERIOD | 18,996 | 12,777 | ||||||
| CASH, CASH EQUIVALENTS AND RESTRICTED CASH AT END OF PERIOD | $ | 28,593 | 18,996 | |||||
| UMH Properties, Inc. | Fourth Quarter FY 2020 Supplemental Information | 6 |
| Reconciliation of Net Income to Adjusted EBITDA and Net Income (Loss) Attributable |
| to Common Shareholders to FFO and Normalized FFO |
| (in thousands except footnotes) (unaudited) |
| Three Months Ended | Twelve Months Ended | |||||||||||||||
| 12/31/2020 | 12/31/2019 | 12/31/2020 | 12/31/2019 | |||||||||||||
| Reconciliation of Net Income to Adjusted EBITDA | ||||||||||||||||
| Net Income | $ | 23,245 | $ | 3,531 | $ | 5,055 | $ | 27,750 | ||||||||
| Interest Expense | 5,143 | 4,516 | 18,287 | 17,805 | ||||||||||||
| Franchise Taxes | 3 | 49 | 282 | 230 | ||||||||||||
| Depreciation Expense | 10,716 | 9,801 | 41,707 | 36,811 | ||||||||||||
| (Increase) Decrease in Fair Value of Marketable Securities | (17,802 | ) | 563 | 14,119 | (14,915 | ) | ||||||||||
| Adjusted EBITDA | $ | 21,305 | $ | 18,460 | $ | 79,450 | $ | 67,681 | ||||||||
| Reconciliation of Net Income (Loss) Attributable to Common Shareholders to Funds from Operations | ||||||||||||||||
| Net Income (Loss) Attributable to Common Shareholders | $ | 15,591 | $ | (3,433 | ) | $ | (29,759 | ) | $ | 2,566 | ||||||
| Depreciation Expense | 10,716 | 9,801 | 41,707 | 36,811 | ||||||||||||
| Loss on Sales of Property and Equipment | 39 | 75 | 216 | 111 | ||||||||||||
| (Increase) Decrease in Fair Value of Marketable Securities | (17,802 | ) | 563 | 14,119 | (14,915 | ) | ||||||||||
| Funds from Operations (“FFO”) | 8,544 | 7,006 | 26,283 | 24,573 | ||||||||||||
| Adjustments: | ||||||||||||||||
| Redemption of Preferred Stock | -0- | -0- | 2,871 | -0- | ||||||||||||
| Non-Recurring Expenses (1) | -0- | 53 | -0- | 634 | ||||||||||||
| Normalized Funds from Operations (“Normalized FFO”) | $ | 8,544 | $ | 7,059 | $ | 29,154 | $ | 25,207 | ||||||||
(1) Consists of utility billing dispute over a prior 10-year period ($0 and $375,000), emergency windstorm tree removal expenses ($53,000 and $179,000) and costs associated with acquisitions not completed ($0 and $80,000) for the three and twelve months ended December 31, 2019, respectively.
| UMH Properties, Inc. | Fourth Quarter FY 2020 Supplemental Information | 7 |
| Market Capitalization, Debt and Coverage Ratios |
| (in thousands except per share amounts) (unaudited) |
| Twelve Months Ended | ||||||||
| 12/31/2020 | 12/31/2019 | |||||||
| Shares Outstanding | 41,919 | 41,130 | ||||||
| Market Price Per Share | $ | 14.81 | $ | 15.73 | ||||
| Equity Market Capitalization | $ | 620,819 | $ | 646,976 | ||||
| Total Debt | 556,288 | 457,344 | ||||||
| Preferred | 407,954 | 405,048 | ||||||
| Total Market Capitalization | $ | 1,585,061 | $ | 1,509,368 | ||||
| Total Debt | $ | 556,288 | $ | 457,344 | ||||
| Less: Cash and Cash Equivalents | (15,336 | ) | (12,902 | ) | ||||
| Net Debt | 540,952 | 444,442 | ||||||
| Less: Marketable Securities at Fair Value (“Securities”) | (103,172 | ) | (116,186 | ) | ||||
| Net Debt Less Securities | $ | 437,780 | $ | 328,256 | ||||
| Interest Expense | $ | 18,287 | $ | 17,805 | ||||
| Capitalized Interest | 1,253 | 1,498 | ||||||
| Preferred Dividends | 31,943 | 25,184 | ||||||
| Total Fixed Charges | $ | 51,483 | $ | 44,487 | ||||
| Adjusted EBITDA | $ | 79,450 | $ | 67,681 | ||||
| Debt and Coverage Ratios | ||||||||
| Net Debt / Total Market Capitalization | 34.1 | % | 29.4 | % | ||||
| Net Debt Plus Preferred / Total Market Capitalization | 59.9 | % | 56.3 | % | ||||
| Net Debt Less Securities / Total Market Capitalization | 27.6 | % | 21.7 | % | ||||
| Net Debt Less Securities Plus Preferred / Total Market Capitalization | 53.4 | % | 48.6 | % | ||||
| Interest Coverage | 4.1 | x | 3.5 | x | ||||
| Fixed Charge Coverage | 1.5 | x | 1.5 | x | ||||
| Net Debt / Adjusted EBITDA | 6.8 | x | 6.6 | x | ||||
| Net Debt Less Securities / Adjusted EBITDA | 5.5 | x | 4.9 | x | ||||
| Net Debt Plus Preferred / Adjusted EBITDA | 11.9 | x | 12.6 | x | ||||
| Net Debt Less Securities Plus Preferred / Adjusted EBITDA | 10.6 | x | 10.8 | x | ||||
| UMH Properties, Inc. | Fourth Quarter FY 2020 Supplemental Information | 8 |
(in thousands) (unaudited)
| Twelve Months Ended | ||||||||
| 12/31/2020 | 12/31/2019 | |||||||
| Debt Outstanding | ||||||||
| Mortgages Payable: | ||||||||
| Fixed Rate Mortgages | $ | 476,390 | $ | 377,045 | ||||
| Unamortized Debt Issuance Costs | (7,111 | ) | (3,387 | ) | ||||
| Mortgages, Net of Unamortized Debt Issuance Costs | $ | 469,279 | $ | 373,658 | ||||
| Loans Payable: | ||||||||
| Unsecured Line of Credit | $ | 45,000 | $ | 15,000 | ||||
| Other Loans Payable | 42,353 | 69,044 | ||||||
| Total Loans Before Unamortized Debt Issuance Costs | 87,353 | 84,044 | ||||||
| Unamortized Debt Issuance Costs | (344 | ) | (358 | ) | ||||
| Loans, Net of Unamortized Debt Issuance Costs | $ | 87,009 | $ | 83,686 | ||||
| Total Debt, Net of Unamortized Debt Issuance Costs | $ | 556,288 | $ | 457,344 | ||||
| % Fixed/Floating | ||||||||
| Fixed | 84.6 | % | 82.2 | % | ||||
| Floating | 15.4 | % | 17.8 | % | ||||
| Total | 100.0 | % | 100.0 | % | ||||
| Weighted Average Interest Rates (1) | ||||||||
| Mortgages Payable | 3.81 | % | 4.14 | % | ||||
| Loans Payable | 2.12 | % | 3.69 | % | ||||
| Total Average | 3.55 | % | 4.06 | % | ||||
| Weighted Average Maturity (Years) | ||||||||
| Mortgages Payable | 6.0 | 6.0 | ||||||
| (1) | Weighted average interest rates do not include the effect of unamortized debt issuance costs. |
| UMH Properties, Inc. | Fourth Quarter FY 2020 Supplemental Information | 9 |
(in thousands) (unaudited)
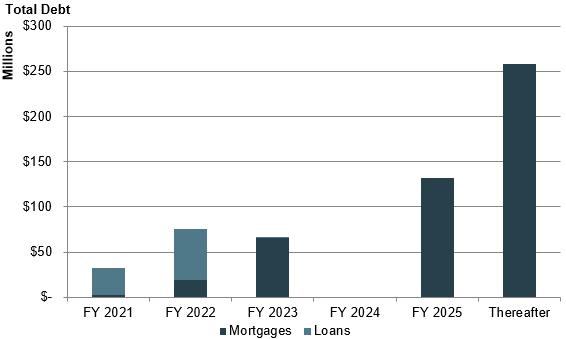
| As of 12/31/20: | ||||||||||||||||
| Fiscal Year Ended | Mortgages | Loans | Total | % of Total | ||||||||||||
| 2021 | $ | 2,077 | $ | 30,782 | $ | 32,859 | 5.8 | % | ||||||||
| 2022 | 19,386 | 56,491 | (1) | 75,877 | 13.5 | % | ||||||||||
| 2023 | 65,240 | 80 | 65,320 | 11.6 | % | |||||||||||
| 2024 | -0- | -0- | -0- | 0.0 | % | |||||||||||
| 2025 | 131,760 | -0- | 131,760 | 23.4 | % | |||||||||||
| Thereafter | 257,927 | -0- | 257,927 | 45.8 | % | |||||||||||
| Total Debt Before Unamortized | ||||||||||||||||
| Debt Issuance Cost | 476,390 | 87,353 | 563,743 | 100.0 | % | |||||||||||
| Unamortized Debt Issuance Cost | (7,111 | ) | (344 | ) | (7,455 | ) | ||||||||||
| Total Debt, Net of Unamortized | ||||||||||||||||
| Debt Issuance Costs | $ | 469,279 | $ | 87,009 | $ | 556,288 | ||||||||||
(1) Includes $45 million balance outstanding on the Company’s Line of Credit due November 2022, with an additional one-year option.
| UMH Properties, Inc. | Fourth Quarter FY 2020 Supplemental Information | 10 |
Securities Portfolio Performance
(in thousands)
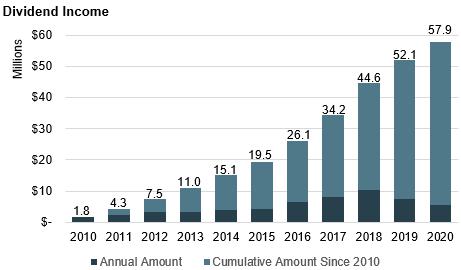
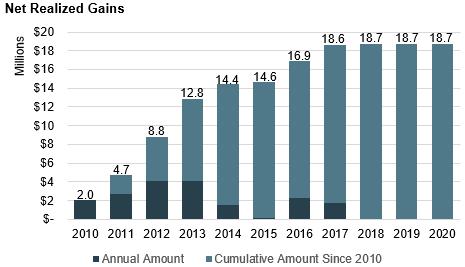
Year Ended | Securities Available for Sale | Dividend Income | Net Realized Gain on Sale of Securities | Net Realized Gain on Sale of Securities & Dividend Income | ||||||||||||
| 2010 | $ | 28,757 | $ | 1,763 | $ | 2,028 | $ | 3,791 | ||||||||
| 2011 | 43,298 | 2,512 | 2,693 | 5,205 | ||||||||||||
| 2012 | 57,325 | 3,244 | 4,093 | 7,337 | ||||||||||||
| 2013 | 59,255 | 3,481 | 4,056 | 7,537 | ||||||||||||
| 2014 | 63,556 | 4,066 | 1,543 | 5,609 | ||||||||||||
| 2015 | 75,011 | 4,399 | 204 | 4,603 | ||||||||||||
| 2016 | 108,755 | 6,636 | 2,285 | 8,921 | ||||||||||||
| 2017 | 132,964 | 8,135 | 1,747 | 9,882 | ||||||||||||
| 2018 | 99,596 | 10,367 | 20 | 10,387 | ||||||||||||
| 2019 | 116,186 | 7,535 | -0- | 7,535 | ||||||||||||
| 2020 | 103,172 | 5,729 | -0- | 5,729 | ||||||||||||
| $ | 57,867 | $ | 18,669 | $ | 76,536 | |||||||||||
| UMH Properties, Inc. | Fourth Quarter FY 2020 Supplemental Information | 11 |
(unaudited)
| 12/31/2020 | 12/31/2019 | % Change | ||||||||||
| Communities | 124 | 122 | 1.6 | % | ||||||||
| Developed Sites | 23,433 | 23,088 | 1.5 | % | ||||||||
| Occupied | 19,920 | 18,936 | 5.2 | % | ||||||||
| Occupancy % | 85.0 | % | 82.0 | % | 300 bps | |||||||
| Total Rentals | 8,252 | 7,394 | 11.6 | % | ||||||||
| Occupied Rentals | 7,810 | 6,821 | 14.5 | % | ||||||||
| Rental Occupancy % | 94.6 | % | 92.3 | % | 230 bps | |||||||
| Monthly Rent Per Site | $ | 461 | $ | 447 | 3.1 | % | ||||||
| Monthly Rent Per Home Rental Including Site | $ | 790 | $ | 765 | 3.3 | % | ||||||
| State | Number | Total Acreage | Developed Acreage | Vacant Acreage | Total Sites | Occupied Sites | Occupancy Percentage | Monthly
Rent Per Site | Total Rentals | Occupied Rentals | Rental
Occupancy Percentage | Monthly Rent Per Home Rental | ||||||||||||||||||||||||||||||||||||
| (1) | (1) | (2) | ||||||||||||||||||||||||||||||||||||||||||||||
| Indiana | 14 | 1,105 | 880 | 225 | 3,998 | 3,393 | 84.9 | % | $ | 415 | 1,666 | 1,543 | 92.6 | % | $ | 787 | ||||||||||||||||||||||||||||||||
| Maryland | 1 | 77 | 10 | 67 | 62 | 61 | 98.4 | % | $ | 531 | -0- | -0- | N/A | N/A | ||||||||||||||||||||||||||||||||||
| Michigan | 3 | 153 | 153 | -0- | 740 | 623 | 84.2 | % | $ | 450 | 262 | 243 | 92.7 | % | $ | 782 | ||||||||||||||||||||||||||||||||
| New Jersey | 4 | 349 | 187 | 162 | 1,006 | 961 | 95.5 | % | $ | 652 | 46 | 43 | 93.5 | % | $ | 966 | ||||||||||||||||||||||||||||||||
| New York | 8 | 674 | 348 | 326 | 1,339 | 1,143 | 85.4 | % | $ | 551 | 433 | 418 | 96.5 | % | $ | 915 | ||||||||||||||||||||||||||||||||
| Ohio | 36 | 1,781 | 1,328 | 453 | 6,727 | 5,559 | 82.6 | % | $ | 417 | 2,420 | 2,304 | 95.2 | % | $ | 742 | ||||||||||||||||||||||||||||||||
| Pennsylvania | 51 | 2,180 | 1,822 | 358 | 7,785 | 6,551 | 84.1 | % | $ | 478 | 2,584 | 2,468 | 95.5 | % | $ | 808 | ||||||||||||||||||||||||||||||||
| Tennessee | 7 | 539 | 293 | 246 | 1,776 | 1,629 | 91.7 | % | $ | 464 | 841 | 791 | 94.1 | % | $ | 813 | ||||||||||||||||||||||||||||||||
| Total as of December 31, 2020 | 124 | 6,858 | 5,021 | 1,837 | 23,433 | 19,920 | 85.0 | % | $ | 461 | 8,252 | 7,810 | 94.6 | % | $ | 790 | ||||||||||||||||||||||||||||||||
| Acquisitions (3) | 2 | 57 | 57 | -0- | 337 | 142 | 42.1 | % | $ | 185 | 68 | 49 | 72.1 | % | $ | 532 | ||||||||||||||||||||||||||||||||
| Grand Total | 126 | 6,915 | 5,078 | 1,837 | 23,770 | 20,062 | 84.4 | % | $ | 459 | 8,320 | 7,859 | 94.5 | % | $ | 789 | ||||||||||||||||||||||||||||||||
| (1) | Total and Vacant Acreage of 220 for the Mountain View Estates property is included in the above summary. | |
| (2) | Includes home and site rent charges. | |
| (3) | Acquisition of two communities completed January 2021. |
| UMH Properties, Inc. | Fourth Quarter FY 2020 Supplemental Information | 12 |
(dollars in thousands except footnotes) (unaudited)
| For Three Months Ended | For Twelve Months Ended | |||||||||||||||||||||||||||||||
| 12/31/2020 | 12/31/2019 | Change | %
Change | 12/31/2020 | 12/31/2019 | Change | %
Change | |||||||||||||||||||||||||
| Community Net Operating Income | ||||||||||||||||||||||||||||||||
| Rental and Related | ||||||||||||||||||||||||||||||||
| Income | $ | 35,512 | $ | 32,187 | $ | 3,325 | 10.3 | % | $ | 136,552 | $ | 125,935 | $ | 10,617 | 8.4 | % | ||||||||||||||||
| Community Operating | ||||||||||||||||||||||||||||||||
| Expenses (1) | 14,111 | 14,380 | (269 | ) | (1.9 | %) | 57,137 | 57,114 | 23 | 0.0 | % | |||||||||||||||||||||
| Community NOI | $ | 21,401 | $ | 17,807 | $ | 3,594 | 20.2 | % | $ | 79,415 | $ | 68,821 | $ | 10,594 | 15.4 | % | ||||||||||||||||
| As of | ||||||||||||
| 12/31/2020 | 12/31/2019 | Change | ||||||||||
| Total Sites | 21,530 | 21,503 | 0.1 | % | ||||||||
| Occupied Sites | 18,698 | 17,980 | 718 sites, 4.0 | % | ||||||||
| Occupancy % | 86.8 | % | 83.6 | % | 320 bps | |||||||
| Number of Properties | 118 | 118 | N/A | |||||||||
| Total Rentals | 7,927 | 7,189 | 10.3 | % | ||||||||
| Occupied Rentals | 7,511 | 6,671 | 12.6 | % | ||||||||
| Rental Occupancy | 94.8 | % | 92.8 | % | 200 bps | |||||||
| Monthly Rent Per Site | $ | 464 | $ | 449 | 3.3 | % | ||||||
| Monthly Rent Per Home Including Site | $ | 790 | $ | 765 | 3.3 | % | ||||||
Same Property includes all properties owned as of January 1, 2019, with the exception of Memphis Blues.
(1) Excludes a one-time settlement of a utility billing dispute of $0 and $375,000 over a prior ten-year period and emergency windstorm tree removal costs of $53,000 and $179,000 for the three and twelve months ended December 31, 2019, respectively.
| UMH Properties, Inc. | Fourth Quarter FY 2020 Supplemental Information | 13 |
(dollars in thousands)
| At Acquisition: | ||||||||||||||||||||||||||||
Year of Acquisition | Number of Communities | Sites | Occupied Sites | Occupancy % | Purchase Price | Price Per Site | Total Acres | |||||||||||||||||||||
| 2018 | 6 | 1,615 | 1,271 | 79 | % | $ | 59,093 | $ | 37 | 494 | ||||||||||||||||||
| 2019 | 4 | 1,495 | 935 | 62 | % | $ | 56,237 | $ | 38 | 247 | ||||||||||||||||||
| 2020 | 2 | 310 | 197 | 64 | % | $ | 7,840 | $ | 25 | 48 | ||||||||||||||||||
| 2021 | 2 | 337 | 142 | 42 | % | $ | 8,000 | $ | 24 | 57 | ||||||||||||||||||
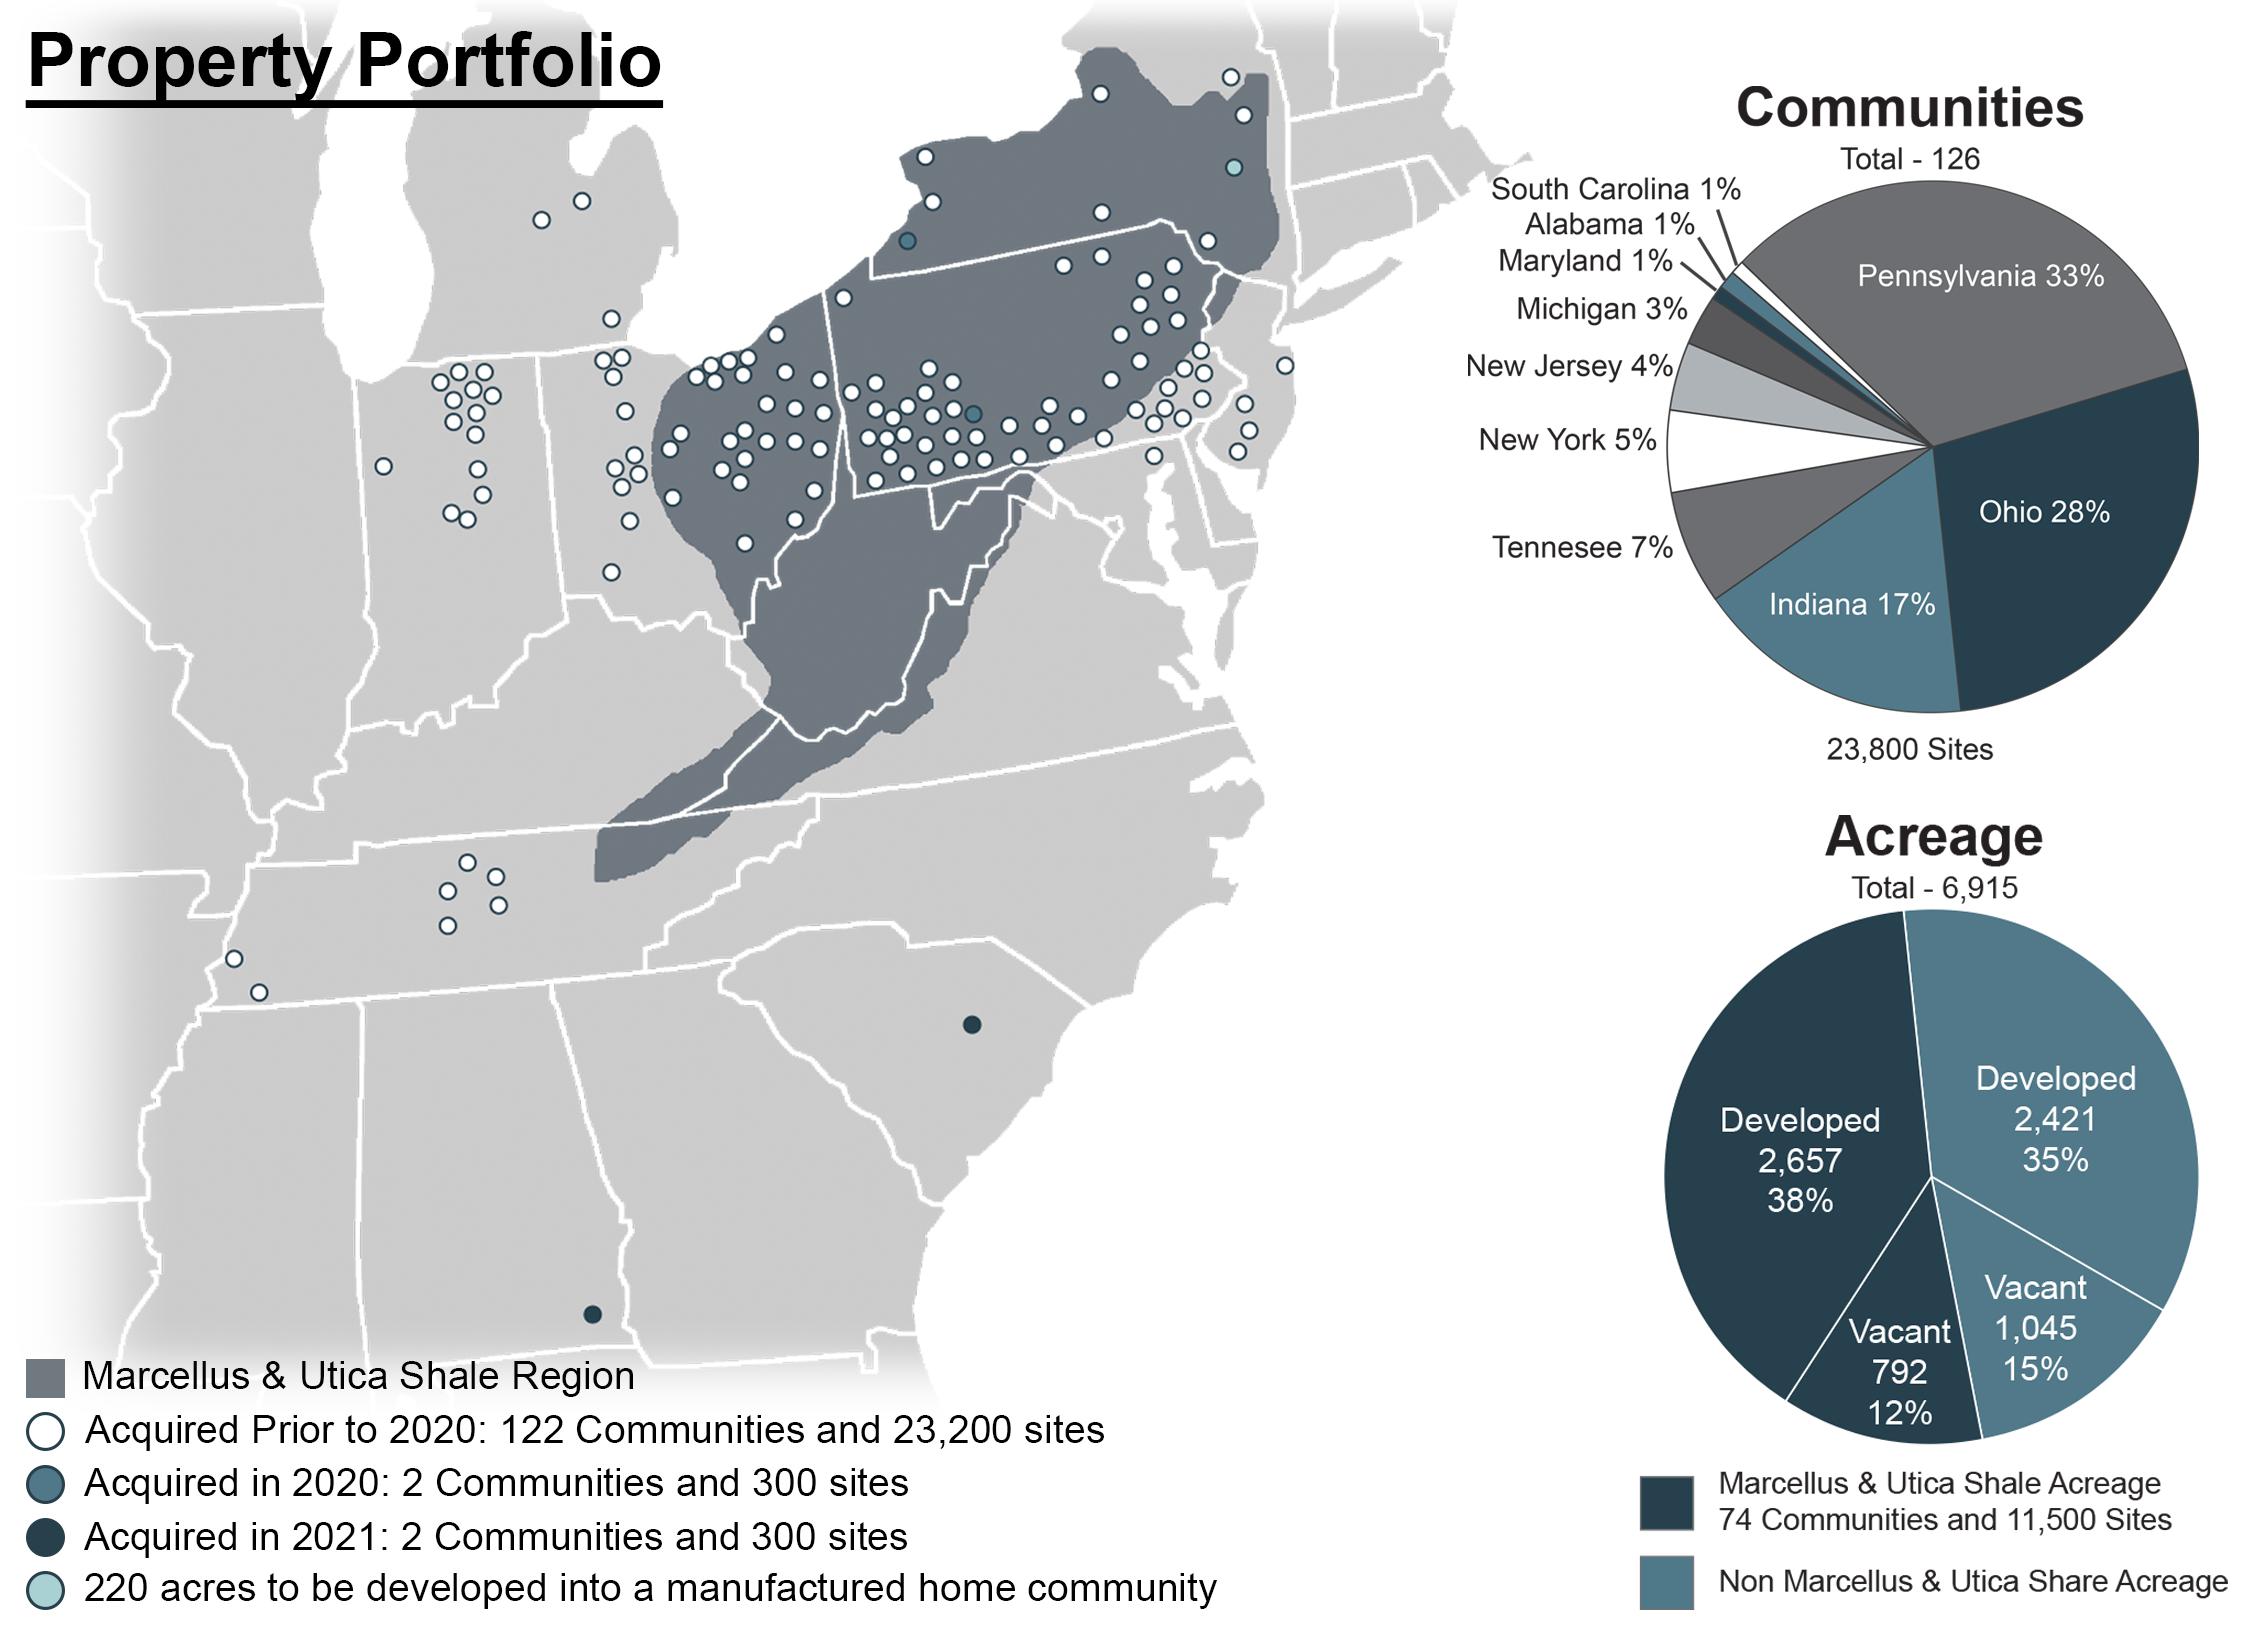
| 2020 Acquisitions | ||||||||||||||||||||||||
| Community | Date of Acquisition | State | Number
of Sites | Purchase Price | Number of Acres | Occupancy | ||||||||||||||||||
| Camelot Woods | July 24, 2020 | PA | 147 | $ | 3,340 | 27 | 56 | % | ||||||||||||||||
| Lake Erie Estates | September 21, 2020 | NY | 163 | 4,500 | 21 | 71 | % | |||||||||||||||||
| Total 2020 | 310 | $ | 7,840 | 48 | 64 | % | ||||||||||||||||||
| 2021 Acquisitions | ||||||||||||||||||||||||
| Community | Date of Acquisition | State | Number
of Sites | Purchase Price | Number of Acres | Occupancy | ||||||||||||||||||
| Deer Run | January 8, 2021 | AL | 195 | $ | 4,600 | 33 | 37 | % | ||||||||||||||||
| Iris Winds | January 21, 2021 | SC | 142 | 3,400 | 24 | 49 | % | |||||||||||||||||
| Total 2021 to Date | 337 | $ | 8,000 | 57 | 42 | % | ||||||||||||||||||
| UMH Properties, Inc. | Fourth Quarter FY 2020 Supplemental Information | 14 |
Investors and analysts following the real estate industry utilize funds from operations available to common shareholders (“FFO”), normalized funds from operations available to common shareholders (“Normalized FFO”), community NOI, same property NOI, and earnings before interest, taxes, depreciation, amortization and acquisition costs (“Adjusted EBITDA”), variously defined, as supplemental performance measures. While the Company believes net income (loss) available to common shareholders, as defined by accounting principles generally accepted in the United States of America (U.S. GAAP), is the most appropriate measure, it considers Community NOI, Same Property NOI, Adjusted EBITDA, FFO and Normalized FFO, given their wide use by and relevance to investors and analysts, appropriate supplemental performance measures. FFO, reflecting the assumption that real estate asset values rise or fall with market conditions, principally adjusts for the effects of U.S. GAAP depreciation and amortization of real estate assets. FFO also adjusts for the effects of the change in the fair value of marketable securities and costs associated with the redemption of preferred stock. Normalized FFO reflects the same assumptions as FFO except that it also adjusts for gains and losses realized on marketable securities investments and certain one-time charges. Community NOI and Same Property NOI provide a measure of rental operations and do not factor in depreciation and amortization and non-property specific expenses such as general and administrative expenses. Adjusted EBITDA provides a tool to further evaluate the ability to incur and service debt and to fund dividends and other cash needs. In addition, Community NOI, Same Property NOI, Adjusted EBITDA, FFO and Normalized FFO are commonly used in various ratios, pricing multiples, yields and returns and valuation of calculations used to measure financial position, performance and value.
As used herein, the Company calculates FFO, as defined by The National Association of Real Estate Investment Trusts (“NAREIT”), to be equal to net income (loss) applicable to common shareholders, as defined by U.S. GAAP, excluding extraordinary items as defined by U.S. GAAP, gains or losses from sales of previously depreciated real estate assets, impairment charges related to depreciable real estate assets, and the change in the fair value of marketable securities plus certain non-cash items such as real estate asset depreciation and amortization. Included in the NAREIT FFO White Paper - 2018 Restatement, is an option pertaining to assets incidental to our main business in the calculation of NAREIT FFO to make an election to include or exclude gains and losses on the sale of these assets, such as marketable equity securities, and include or exclude mark-to-market changes in the value recognized on these marketable equity securities. In conjunction with the adoption of the FFO White Paper - 2018 Restatement, for all periods presented, we have elected to exclude the change in the fair value of marketable securities from our FFO calculation. Prior to the adoption of the FFO White Paper – 2018 Restatement, we utilized Core Funds from Operations (Core FFO), which we defined as FFO, excluding the change in the fair value of marketable securities. NAREIT created FFO as a non-GAAP supplemental measure of REIT operating performance.
Normalized FFO is calculated as FFO excluding gains and losses realized on marketable securities investments and certain one-time charges.
Normalized FFO per Diluted Common Share is calculated using diluted weighted shares outstanding of 42.4 million and 41.7 million shares for the three and twelve months ended December 31, 2020, respectively, and 41.4 million and 40.2 million for the three and twelve months ended December 31, 2019, respectively. Common stock equivalents resulting from stock options in the amount of 636,000 and 350,000 shares for the three and twelve months ended December 31, 2020, respectively, and 456,000 and 294,000 shares for the three and twelve months ended December 31, 2019, respectively, are included in the diluted weighted shares outstanding. Common stock equivalents for the twelve months ended December 31, 2020, and for the three months ended December 31,2019 were excluded from the computation of the Diluted Net Income (Loss) per Share as their effect would be anti-dilutive.
Community NOI is calculated as rental and related income less community operating expenses such as real estate taxes, repairs and maintenance, community salaries, utilities, insurance and other expenses. Community NOI excludes realized gains (losses) on securities transactions.
Same Property NOI is calculated as Community NOI, using all properties owned as of January 1, 2019, with the exception of Memphis Blues.
Adjusted EBITDA is calculated as net income (loss) plus interest expense, franchise taxes, depreciation, and the change in the fair value of marketable securities.
Community NOI, Same Property NOI, Adjusted EBITDA, FFO and Normalized FFO do not represent cash generated from operating activities in accordance with U.S. GAAP and are not necessarily indicative of cash available to fund cash needs, including the repayment of principal on debt and payment of dividends and distributions. Community NOI, Same Property NOI, Adjusted EBITDA, FFO and Normalized FFO should not be considered as substitutes for net loss applicable to common shareholders (calculated in accordance with U.S. GAAP) as a measure of results of operations, or cash flows (calculated in accordance with U.S. GAAP) as a measure of liquidity. Community NOI, Same Property NOI, Adjusted EBITDA, FFO and Normalized FFO as currently calculated by the Company may not be comparable to similarly titled, but variously calculated, measures of other REITs.
| UMH Properties, Inc. | Fourth Quarter FY 2020 Supplemental Information | 15 |
Press Release Dated March 10, 2021
| FOR IMMEDIATE RELEASE | March 10, 2021 |
| Contact: Nelli Madden | |
| 732-577-9997 |
UMH PROPERTIES, INC. REPORTS RESULTS FOR THE YEAR ENDED AND THE FOURTH
QUARTER ENDED DECEMBER 31, 2020
FREEHOLD, NJ, March 10, 2021........ UMH Properties, Inc. (NYSE:UMH) reported Total Income of $163.6 million for the year ended December 31, 2020 as compared to $146.6 million for the year ended December 31, 2019, representing an increase of 12%. Total Income for the quarter ended December 31, 2020 was $42.8 million as compared to $37.7 million for the quarter ended December 31, 2019, representing an increase of 13%. Net Income (Loss) Attributable to Common Shareholders amounted to a loss $29.8 million or $0.72 per diluted share for the year ended December 31, 2020 as compared to income of $2.6 million or $0.06 per diluted share for the year ended December 31, 2019. Net Income (Loss) Attributable to Common Shareholders amounted to income of $15.6 million or $0.38 per diluted share for the quarter ended December 31, 2020 as compared to a loss of $3.4 million or $0.08 per diluted share for the quarter ended December 31, 2019.
Funds from Operations Attributable to Common Shareholders (“FFO”) was $26.3 million or $0.63 per diluted share for the year ended December 31, 2020 as compared to $24.6 million or $0.61 per diluted share for the year ended December 31, 2019. FFO was $8.5 million or $0.20 per diluted share for the quarter ended December 31, 2020 as compared to $7.0 million or $0.17 per diluted share for the quarter ended December 31, 2019. Normalized Funds from Operations Attributable to Common Shareholders (“Normalized FFO”), was $29.2 million or $0.70 per diluted share for the year ended December 31, 2020, as compared to $25.2 million or $0.63 per diluted share for the year ended December 31, 2019. Normalized FFO was $8.5 million or $0.20 per diluted share for the quarter ended December 31, 2020, as compared to $7.1 million or $0.17 per diluted share for the quarter ended December 31, 2019.
A summary of significant financial information for the three and twelve months ended December 31, 2020 and 2019 is as follows (in thousands except per share amounts):
| For the Three Months Ended | ||||||||
| December 31, | ||||||||
| 2020 | 2019 | |||||||
| Total Income | $ | 42,829 | $ | 37,744 | ||||
| Total Expenses | $ | 34,382 | $ | 31,856 | ||||
| Increase (Decrease) in Fair Value of Marketable Securities | $ | 17,802 | $ | (563 | ) | |||
| Net Income (Loss) Attributable to Common Shareholders | $ | 15,591 | $ | (3,433 | ) | |||
| Net Income (Loss) Attributable to Common Shareholders per Diluted Common Share | $ | 0.38 | $ | (0.08 | ) | |||
| FFO (1) | $ | 8,544 | $ | 7,006 | ||||
| FFO (1) per Diluted Common Share | $ | 0.20 | $ | 0.17 | ||||
| Normalized FFO (1) | $ | 8,544 | $ | 7,059 | ||||
| Normalized FFO (1) per Diluted Common Share | $ | 0.20 | $ | 0.17 | ||||
| Weighted Average Shares Outstanding | 42,390 | 40,929 | ||||||
| UMH Properties, Inc. | Fourth Quarter FY 2020 Supplemental Information | 16 |
| For the Twelve Months Ended | ||||||||
| December 31, | ||||||||
| 2020 | 2019 | |||||||
| Total Income | $ | 163,609 | $ | 146,591 | ||||
| Total Expenses | $ | 135,296 | $ | 126,582 | ||||
| Increase (Decrease) in Fair Value of Marketable Securities | $ | (14,119 | ) | $ | 14,915 | |||
| Net Income (Loss) Attributable to Common Shareholders | $ | (29,759 | ) | $ | 2,566 | |||
| Net Income (Loss) Attributable to Common Shareholders per Diluted Common Share | $ | (0.72 | ) | $ | 0.06 | |||
| FFO (1) | $ | 26,283 | $ | 24,573 | ||||
| FFO (1) per Diluted Common Share | $ | 0.63 | $ | 0.61 | ||||
| Normalized FFO (1) | $ | 29,154 | $ | 25,207 | ||||
| Normalized FFO (1) per Diluted Common Share | $ | 0.70 | $ | 0.63 | ||||
| Weighted Average Shares Outstanding | 41,395 | 40,203 | ||||||
A summary of significant balance sheet information as of December 31, 2020 and 2019 is as follows (in thousands):
December 31, 2020 | December 31, 2019 | |||||||
| Gross Real Estate Investments | $ | 1,108,483 | $ | 1,015,281 | ||||
| Marketable Securities at Fair Value | $ | 103,172 | $ | 116,186 | ||||
| Total Assets | $ | 1,087,214 | $ | 1,025,453 | ||||
| Mortgages Payable, net | $ | 469,279 | $ | 373,658 | ||||
| Loans Payable, net | $ | 87,009 | $ | 83,686 | ||||
| Total Shareholders’ Equity | $ | 501,808 | $ | 546,339 | ||||
Samuel A. Landy, President and CEO, commented on the 2020 results.
“2020 will be viewed as a transformational year for UMH Properties. Despite the uncertainties caused by COVID-19, we were able to generate exceptional results on all fronts. Our accomplishments during the year include:
| ● | Increased Rental and Related Income by 11%; | |
| ● | Increased Community Net Operating Income (“NOI”) by 20%; | |
| ● | Increased Normalized Funds from Operations (“Normalized FFO”) by 16% and Normalized FFO per share by 11%; | |
| ● | Improved our Operating Expense ratio by 390 basis points to 44.1%; | |
| ● | Increased Same Property NOI by 15%; | |
| ● | Increased Same Property Occupancy by 718 sites from 83.6% to 86.8% or 320 basis points; | |
| ● | Increased our rental home portfolio by 858 homes to approximately 8,300 total rental homes, representing an increase of 12%; | |
| ● | Increased rental home occupancy by 230 basis points from 92.3% to 94.6%; | |
| ● | Increased Sales of Manufactured Homes by 13%; | |
| ● | Acquired two communities containing approximately 310 homesites for a total cost of approximately $7.8 million; | |
| ● | Completed the financing of 28 unencumbered communities with Fannie Mae for proceeds of approximately $106 million, with a maturity of 10 years and a 30-year amortization at a fixed rate of 2.62%; |
| UMH Properties, Inc. | Fourth Quarter FY 2020 Supplemental Information | 17 |
| ● | Issued and sold approximately 135,000 shares of Common Stock through an At-the-Market Sale Program for our Common Stock at a weighted average price of $14.60 per share, generating gross proceeds of $2.0 million and net proceeds of $1.7 million, after offering expenses; | |
| ● | Issued and sold, through At-the-Market Sale Programs for our Preferred Stock, 134,000 shares of Series C Preferred Stock at a weighted average price of $24.96 per share and 3.8 million shares of Series D Preferred Stock at a weighted average price of $24.98 per share, generating total gross proceeds of $97.8 million and total net proceeds of $96.1 million, after offering expenses; | |
| ● | Redeemed all 3.8 million issued and outstanding shares of our 8.0% Series B Cumulative Redeemable Preferred Stock for $96.1 million with proceeds from our 2.62% Fannie Mae financing, resulting in a savings of over $5 million annually; | |
| ● | Reduced the weighted average interest rate on our mortgages payable from 4.1% to 3.8% year over year; | |
| ● | Subsequent to year end, issued and sold 768,000 additional shares of Series D Preferred Stock at a weighted average price of $24.80 per share through our At-the-Market Sale Program for our Preferred Stock, generating gross proceeds of $19.1 million and net proceeds of $18.8 million, after offering expenses; | |
| ● | Subsequent to year end, acquired two communities containing approximately 340 homesites for a total cost of approximately $8.0 million; and | |
| ● | Subsequent to year end, raised our dividend by 5.5% to an annualized rate of $0.76 per share.” |
“2020 was a challenging year in all respects, but our team produced results that we are very proud of. Most importantly, our rent collections remained stable and at pre-pandemic levels and we were able to maintain rental home occupancy rates of 94.5% or greater. We increased rental and related income by 11% and community NOI by 20%.”
“The pandemic increased demand for housing in our communities. We increased our rental home portfolio by 858 homes. Home sales also improved by 13% year over year and generated a sales profit of approximately $770,000. These results were achieved while reducing our operating expense ratio from 48.0% to 44.1%. All of these operating metrics drove a same-property occupancy increase of 320 basis points to 86.8% and same property NOI growth of 15%.”
“We also made progress on the financing front. We completed the financing of 28 unencumbered communities generating proceeds of $106 million at an interest rate of 2.62%. This capital was used to redeem $96 million of 8% Series B Preferred Stock. This recapitalization resulted in savings of $5 million or $0.11 per share annually. We anticipate being able to accomplish similar feats in 2022 and 2023 when over $400 million of preferred stock is callable. Our ability to recapitalize the company with low cost debt, equity or preferred will be a significant catalyst for the company moving forward.”
“During the year, we acquired two communities containing approximately 310 developed homesites for an aggregate cost of $7.8 million. These communities are located in our existing markets which exhibit favorable demographics. Subsequent to year end, we acquired one community in Alabama and one community in South Carolina for a purchase price of approximately $8 million. They contain 337 developed homesites.”
“UMH continues to build upon the foundation that we have laid over the past few years. These results allowed us to confidently raise our dividend by 5.5%. to $0.76 per share. We look forward to continuing to execute on our business plan and building long-term value for our dedicated shareholders.”
UMH Properties, Inc. will host its Fourth Quarter and Year Ended December 31, 2020 Financial Results Webcast and Conference Call. Senior management will discuss the results, current market conditions and future outlook on Thursday, March 11, 2021 at 10:00 a.m. Eastern Time.
The Company’s fourth quarter and year ended December 31, 2020 financial results being released herein will be available on the Company’s website at www.umh.reit in the “Financials” section.
| UMH Properties, Inc. | Fourth Quarter FY 2020 Supplemental Information | 18 |
To participate in the webcast, select the microphone icon found on the homepage www.umh.reit to access the call. Interested parties can also participate via conference call by calling toll free 877-513-1898 (domestically) or 412-902-4147 (internationally).
The replay of the conference call will be available at 12:00 p.m. Eastern Time on Thursday, March 11, 2021. It will be available until May 1, 2021, and can be accessed by dialing toll free 877-344-7529 (domestically) and 412-317-0088 (internationally) and entering the passcode 10151272. A transcript of the call and the webcast replay will be available at the Company’s website, www.umh.reit.
UMH Properties, Inc., which was organized in 1968, is a public equity REIT that owns and operates 126 manufactured home communities containing approximately 23,800 developed homesites. These communities are located in New Jersey, New York, Ohio, Pennsylvania, Tennessee, Indiana, Michigan, Maryland, Alabama and South Carolina. In addition, the Company owns a portfolio of REIT securities.
Certain statements included in this press release which are not historical facts may be deemed forward-looking statements within the meaning of the Private Securities Litigation Reform Act of 1995. Any such forward-looking statements are based on the Company’s current expectations and involve various risks and uncertainties. Although the Company believes the expectations reflected in any forward-looking statements are based on reasonable assumptions, the Company can provide no assurance those expectations will be achieved. The risks and uncertainties that could cause actual results or events to differ materially from expectations are contained in the Company’s annual report on Form 10-K and described from time to time in the Company’s other filings with the SEC. The Company undertakes no obligation to publicly update or revise any forward-looking statements whether as a result of new information, future events, or otherwise.
Note:
| (1) | Non-GAAP Information: We assess and measure our overall operating results based upon an industry performance measure referred to as Funds from Operations Attributable to Common Shareholders (“FFO”), which management believes is a useful indicator of our operating performance. FFO is used by industry analysts and investors as a supplemental operating performance measure of a REIT. FFO, as defined by The National Association of Real Estate Investment Trusts (“NAREIT”), represents net income (loss) attributable to common shareholders, as defined by accounting principles generally accepted in the United States of America (“U.S. GAAP”), excluding extraordinary items, as defined under U.S. GAAP, gains or losses from sales of previously depreciated real estate assets, impairment charges related to depreciable real estate assets, and the change in the fair value of marketable securities plus certain non-cash items such as real estate asset depreciation and amortization. Included in the NAREIT FFO White Paper - 2018 Restatement, is an option pertaining to assets incidental to our main business in the calculation of NAREIT FFO to make an election to include or exclude gains and losses on the sale of these assets, such as marketable equity securities, and include or exclude mark-to-market changes in the value recognized on these marketable equity securities. In conjunction with the adoption of the FFO White Paper - 2018 Restatement, for all periods presented, we have elected to exclude the change in the fair value of marketable securities from our FFO calculation. Prior to the adoption of the FFO White Paper – 2018 Restatement, we utilized Core Funds from Operations (Core FFO), which we defined as FFO, excluding the change in the fair value of marketable securities. NAREIT created FFO as a non-U.S. GAAP supplemental measure of REIT operating performance. We define Normalized Funds from Operations Attributable to Common Shareholders (“Normalized FFO”), as FFO, excluding gains and losses realized on marketable securities investments and certain one-time charges. FFO and Normalized FFO should be considered as supplemental measures of operating performance used by REITs. FFO and Normalized FFO exclude historical cost depreciation as an expense and may facilitate the comparison of REITs which have a different cost basis. However, other REITs may use different methodologies to calculate FFO and Normalized FFO and, accordingly, our FFO and Normalized FFO may not be comparable to all other REITs. The items excluded from FFO and Normalized FFO are significant components in understanding the Company’s financial performance. |
FFO and Normalized FFO (i) do not represent Cash Flow from Operations as defined by U.S. GAAP; (ii) should not be considered as alternatives to net income (loss) as a measure of operating performance or to cash flows from operating, investing and financing activities; and (iii) are not alternatives to cash flow as a measure of liquidity.
| UMH Properties, Inc. | Fourth Quarter FY 2020 Supplemental Information | 19 |
The reconciliation of the Company’s U.S. GAAP net income (loss) to the Company’s FFO and Normalized FFO for the three and twelve months ended December 31, 2020 and 2019 are calculated as follows (in thousands except footnotes):
| Three Months Ended | Twelve Months Ended | |||||||||||||||
| 12/31/20 | 12/31/19 | 12/31/20 | 12/31/19 | |||||||||||||
| Net Income (Loss) Attributable to Common Shareholders | $ | 15,591 | $ | (3,433 | ) | $ | (29,759 | ) | $ | 2,566 | ||||||
| Depreciation Expense | 10,716 | 9,801 | 41,707 | 36,811 | ||||||||||||
| Loss on Sales of Property and Equipment | 39 | 75 | 216 | 111 | ||||||||||||
| (Increase) Decrease in Fair Value of Marketable Securities | (17,802 | ) | 563 | 14,119 | (14,915 | ) | ||||||||||
| FFO Attributable to Common Shareholders | 8,544 | 7,006 | 26,283 | 24,573 | ||||||||||||
| Redemption of Preferred Stock | -0- | -0- | 2,871 | -0- | ||||||||||||
| Non-Recurring Other Expense (2) | -0- | 53 | -0- | 634 | ||||||||||||
| Normalized FFO Attributable to Common Shareholders | $ | 8,544 | $ | 7,059 | $ | 29,154 | $ | 25,207 | ||||||||
The diluted weighted shares outstanding used in the calculation of FFO per Diluted Common Share and Normalized FFO per Diluted Common Share were 42.4 million and 41.7 million shares for the three and twelve months ended December 31, 2020, respectively, and 41.4 million and 40.2 million shares for the three and twelve months ended December 31, 2019, respectively. Common stock equivalents resulting from stock options in the amount of 636,000 and 350,000 shares for the three and twelve months ended December 31, 2020, respectively, and 456,000 and 294,000 shares for the three and twelve months ended December 31, 2019, respectively, are included in the diluted weighted shares outstanding. Common stock equivalents for the twelve months ended December 31, 2020 and three months ended December 31, 2019 were excluded from the computation of the Diluted Net Income (Loss) per Share as their effect would be anti-dilutive.
The following are the cash flows provided (used) by operating, investing and financing activities for the twelve months ended December 31, 2020 and 2019 (in thousands):
| 2020 | 2019 | |||||||
| Operating Activities | $ | 69,037 | $ | 38,516 | ||||
| Investing Activities | (103,770 | ) | (122,350 | ) | ||||
| Financing Activities | 44,330 | 90,053 | ||||||
| (2) | Consists of utility billing dispute over a prior 10-year period ($0 and $375,000), emergency windstorm tree removal expenses in three communities ($53,000 and $179,000) and costs associated with acquisitions not completed ($0 and $80,000) for the three and twelve months ended December 31, 2019, respectively. |
# # # #

| UMH Properties, Inc. | Fourth Quarter FY 2020 Supplemental Information | 20 |