SECURITIES AND EXCHANGE COMMISSION
WASHINGTON, D.C. 20549
FORM
CURRENT REPORT PURSUANT
TO SECTION 13 OR 15(d) OF THE
SECURITIES EXCHANGE ACT OF 1934
Date of Report (Date of earliest event reported)

(Exact Name of Registrant as Specified in its Charter)
(State or Other Jurisdiction of Incorporation)
(Commission File Number) | (IRS Employer Identification No.) |
(Address of Principal Executive Office)
(
(Registrant’s Telephone Number, Including Area Code)
Check the appropriate box below if the Form 8-K filing is intended to simultaneously satisfy the filing obligation of the registrant under any of the following provisions:
Written communications pursuant to Rule 425 under the Securities Act (17 CFR 230.425) | |
Soliciting material pursuant to Rule 14a12 under the Exchange Act (17 CFR 240.14a-12) | |
Pre-commencement communications pursuant to Rule 14d-2(b) under the Exchange Act (17 CFR 240.14d-2(b)) | |
Pre-commencement communications pursuant to Rule 13e-4(c) under the Exchange Act (17 CFR 240.13e-4(c)) |
Securities registered pursuant to Section 12(b) of the Act:
Title of each class | Trading Symbol(s) | Name of each exchange on which registered |
Indicate by check mark whether the registrant is an emerging growth company as defined in Rule 405 of the Securities Act of 1933 (§230.405 of this chapter) or Rule 12b-2 of the Securities Exchange Act of 1934 (§240.12b-2 of this chapter).
Emerging growth company
If an emerging growth company, indicate by check mark if the registrant has elected not to use the extended transition period for complying with any new or revised financial accounting standards provided pursuant to Section 13(a) of the Exchange Act. ☐
Item 2.02 Results of Operation and Financial Condition
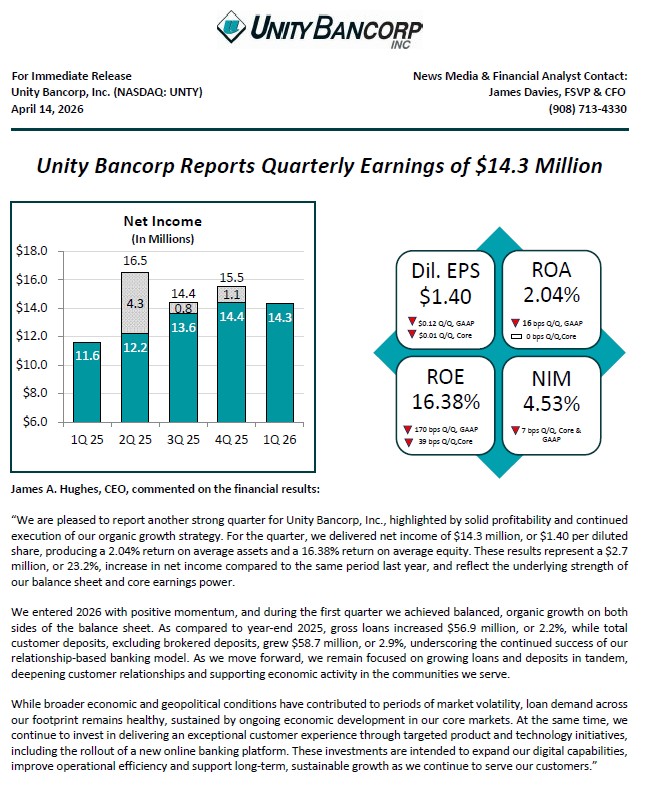
The Registrant issued a press release on April 14, 2026 announcing results for the three months ended March 31, 2026, the full text of which is incorporated by reference to this Item.
Item 9.01 Financial Statements and Exhibits
(d) Exhibits
Exhibit 99.1 |
SIGNATURES
Pursuant to the requirements of the Securities Exchange Act of 1934, the Registrant has duly caused this Report to be signed on its behalf by the undersigned hereunto duly authorized.
UNITY BANCORP, INC. | ||
(Registrant) | ||
Date: April 14, 2026 | ||
By: | /s/ James Davies | |
James Davies | ||
First Senior Vice President & Chief Financial Officer | ||
Exhibit 99.1

Clinton, NJ -- Unity Bancorp, Inc. (NASDAQ: UNTY), parent company of Unity Bank, reported net income of $14.3 million, or $1.40 per diluted share, for the quarter ended March 31, 2026, compared to net income of $15.5 million, or $1.52 per diluted share for the quarter ended December 31, 2025.
Quarterly Earnings Highlights
| ● | Noninterest income was $2.9 million for the quarter ended March 31, 2026, compared to $3.9 million for the quarter ended December 31, 2025. The $1.0 million decrease was primarily due to the $1.5 million unrealized gain associated with Patriot recognized in the prior quarter, partially offset by increased service and loan fee income and gain on sale of SBA and mortgage loans. |
Balance Sheet Highlights
| ● | Total gross loans increased $56.9 million, or 2.2%, from December 31, 2025, primarily due to increases in the commercial and residential and commercial construction loan categories. Furthermore, gross loans increased $256.5 million, or 10.9% from March 31, 2025. |
| ● | As of March 31, 2026, the allowance for credit losses as a percentage of gross loans was 1.28%. |
| ● | Total deposits increased $55.1 million, or 2.4%, from December 31, 2025. As of March 31, 2026, uninsured or uncollateralized deposits represented 21.6% of total deposits. The Company’s deposit composition as of March 31, 2026, consisted of 19.0% in noninterest bearing demand deposits, 17.2% in interest-bearing demand deposits, 24.9% in savings deposits and 38.9% in time deposits. |
| ● | Borrowed funds decreased $7.5 million from December 31, 2025. Borrowed funds were entirely comprised of borrowings from the FHLB. |
| ● | Shareholders’ equity was $358.1 million as of March 31, 2026, compared to $345.6 million as of December 31, 2025. The $12.5 million increase was primarily driven by 2026 earnings, partially offset by dividend payments and share repurchase activity. During the quarter ended March 31, 2026, Unity Bancorp, Inc. repurchased 6,616 shares at a weighted average price of $49.01 per share. |
| ● | Book value per common share was $35.66 as of March 31, 2026, compared to $34.63 as of December 31, 2025. This increase is primarily due to net income partially offset by dividends and share repurchases. |
| ● | Below is a summary of Unity Bancorp’s regulatory capital ratios: |
| o | The Leverage Ratio increased 21 basis points to 12.93% at March 31, 2026, compared to 12.72% at December 31, 2025. |
| o | The Common Equity Tier 1 Capital Ratio increased 5 basis points to 14.50% at March 31, 2026, compared to 14.45% at December 31, 2025. |
| o | The Tier 1 Capital Ratio increased 4 basis points to 14.91% at March 31, 2026, compared to 14.87% at December 31, 2025. |
| o | The Total Capital Ratio increased 4 basis points, to 16.16% at March 31, 2026, compared to 16.12% at December 31, 2025. |
| ● | At March 31, 2026, the Company held $229.2 million of cash and cash equivalents. The Company also maintained approximately $410.7 million of funding available from various sources, including the FHLB, FRB Discount Window and other lines of credit. Total available funding plus cash on hand represented 124.4% of uninsured or uncollateralized deposits. |
| ❖ | In February 2026, Unity Bancorp, Inc. announced a 7% increase for its first quarter dividend from $0.15 per common share to $0.16 per common share. |
| ❖ | Unity Bancorp, Inc. will hold its virtual annual shareholder meeting on Thursday, April 23rd at 8:00 AM EDT. Refer to our 2026 Proxy for further details. |
Unity Bancorp, Inc. is a financial services organization headquartered in Clinton, New Jersey, with approximately $3.0 billion in assets and $2.4 billion in deposits. Unity Bank, the Company’s wholly owned subsidiary, provides financial services to retail, corporate and small business customers through its robust branch network located in Bergen, Hunterdon, Middlesex, Morris, Ocean, Somerset, Union and Warren Counties in New Jersey and Northampton County in Pennsylvania. For additional information about Unity, visit our website at www.unitybank.com , or call 800-618-BANK.
This news release contains certain forward-looking statements, either expressed or implied, which are provided to assist the reader in understanding anticipated future financial performance. These statements may be identified by use of the words “believe”, “expect”, “intend”, “anticipate”, “estimate”, “project” or similar expressions. These statements involve certain risks, uncertainties, estimates and assumptions made by management, which are subject to factors beyond the Company’s control that could impede its ability to achieve these goals. These factors include those items included in our Annual Report on Form 10-K under the heading “Item IA-Risk Factors” as amended or supplemented by our subsequent filings with the SEC, as well as general economic conditions, trends in interest rates, the ability of our borrowers to repay their loans, our ability to manage and reduce the level of our nonperforming assets, results of regulatory exams, the impact of any health crisis or national disasters on the Bank, its employees and customers, and the impact of uncertain or changing political conditions or any current or future federal government shutdown and uncertainty regarding the federal government’s debt limit or changes in fiscal, monetary, trade or regulatory policy, among other factors.
UNITY BANCORP, INC.
SUMMARY FINANCIAL HIGHLIGHTS
March 31, 2026
| | | | | | | | | | | | March 31, 2026 vs. | | ||
| | | | | | | | | | | | December 31, 2025 | | March 31, 2025 | |
(In thousands, except percentages and per share amounts) | | March 31, 2026 | | December 31, 2025 | | March 31, 2025 | | | % | | % | | |||
BALANCE SHEET DATA | | | | | | | | | | | | | | | |
Total assets | | $ | 3,027,327 | | $ | 2,966,652 | | $ | 2,767,943 | | | 2.0 | % | 9.4 | % |
Total deposits | | | 2,379,140 | | | 2,324,061 | | | 2,175,398 | | | 2.4 | | 9.4 | |
Total gross loans | | | 2,601,656 | | | 2,544,713 | | | 2,345,130 | | | 2.2 | | 10.9 | |
Total securities | | | 115,268 | | | 124,015 | | | 142,092 | | | (7.1) | | (18.9) | |
Total shareholders' equity | | | 358,095 | | | 345,631 | | | 306,142 | | | 3.6 | | 17.0 | |
Allowance for credit losses | | | 33,354 | | | 32,342 | | | 27,651 | | | 3.1 | | 20.6 | |
| | | | | | | | | | | | | | | |
FINANCIAL DATA - QUARTER TO DATE | | | | | | | | | | | | | | | |
Income before provision for income taxes | | $ | 18,487 | | $ | 19,694 | | $ | 15,424 | | | (6.1) | | 19.9 | |
Provision for income taxes | | | 4,199 | | | 4,222 | | | 3,826 | | | (0.5) | | 9.7 | |
Net income | | $ | 14,288 | | $ | 15,472 | | $ | 11,598 | | | (7.7) | | 23.2 | |
| | | | | | | | | | | | | | | |
Net income per common share - Basic | | $ | 1.43 | | $ | 1.55 | | $ | 1.15 | | | (7.7) | | 24.3 | |
Net income per common share - Diluted | | | 1.40 | | | 1.52 | | | 1.13 | | | (7.9) | | 23.9 | |
| | | | | | | | | | | | | | | |
PERFORMANCE RATIOS - QUARTER TO DATE (ANNUALIZED) | | | | | | | | | | | | | | | |
Return on average assets | | | 2.04 | % | | 2.20 | % | | 1.83 | % | | | | | |
Return on average equity | | | 16.38 | | | 18.08 | | | 15.56 | | | | | | |
Efficiency ratio** | | | 41.77 | | | 39.52 | | | 42.89 | | | | | | |
Cost of funds | | | 2.38 | | | 2.38 | | | 2.46 | | | | | | |
Net interest margin | | | 4.53 | | | 4.60 | | | 4.46 | | | | | | |
Noninterest expense to average assets | | | 2.01 | | | 1.89 | | | 1.99 | | | | | | |
| | | | | | | | | | | | | | | |
SHARE INFORMATION | | | | | | | | | | | | | | | |
Market price per share | | $ | 51.83 | | $ | 51.72 | | $ | 40.70 | | | 0.2 | | 27.3 | |
Dividends paid (QTD) | | | 0.16 | | | 0.15 | | | 0.14 | | | 6.7 | | 14.3 | |
Book value per common share | | | 35.66 | | | 34.63 | | | 30.38 | | | 3.0 | | 17.4 | |
Average diluted shares outstanding (QTD) | | | 10,199 | | | 10,195 | | | 10,247 | | | - | | (0.5) | |
| | | | | | | | | | | | | | | |
UNITY BANCORP CAPITAL RATIOS | | | | | | | | | | | | | | | |
Total equity to total assets | | | 11.83 | % | | 11.65 | % | | 11.06 | % | | 1.5 | | 7.0 | |
Leverage ratio | | | 12.93 | | | 12.72 | | | 12.32 | | | 1.7 | | 5.0 | |
Common Equity Tier 1 Capital Ratio | | | 14.50 | | | 14.45 | | | 13.87 | | | 0.3 | | 4.5 | |
Risk-based Tier 1 Capital Ratio | | | 14.91 | | | 14.87 | | | 14.33 | | | 0.3 | | 4.0 | |
Risk-based Total Capital Ratio | | | 16.16 | | | 16.12 | | | 15.58 | | | 0.2 | | 3.7 | |
| | | | | | | | | | | | | | | |
CREDIT QUALITY AND RATIOS | | | | | | | | | | | | | | | |
Nonaccrual assets | | $ | 32,092 | | $ | 31,308 | | $ | 17,990 | | | 2.5 | | 78.4 | |
QTD annualized net chargeoffs to QTD average loans | | | (0.01) | % | | (0.02) | % | | (0.09) | % | | | | | |
Allowance for credit losses to total loans | | | 1.28 | | | 1.27 | | | 1.18 | | | | | | |
Nonaccrual loans to total loans | | | 1.18 | | | 1.17 | | | 0.72 | | | | | | |
Nonaccrual assets to total assets | | | 1.06 | | | 1.06 | | | 0.65 | | | | | | |
** The efficiency ratio is a non-GAAP measure, calculated based on the noninterest expense divided by the sum of net interest income plus non interest income, excluding net gains and losses on securities. | |||||||||||||||
| | | | | | | | | | | | | | | |
UNITY BANCORP, INC.
CONSOLIDATED BALANCE SHEETS
March 31, 2026
| | | | | | | | | | | | March 31, 2026 vs. | | ||
| | | | | | | | | | | | December 31, 2025 | | March 31, 2025 | |
(In thousands, except percentages) | | March 31, 2026 | | December 31, 2025 | | March 31, 2025 | | | % | | % | | |||
| | | | | | | | | | | | | | | |
ASSETS | | | | | | | | | | | | | | | |
Cash and due from banks | | $ | 24,591 | | $ | 19,841 | | $ | 26,378 | | | 23.9 | % | (6.8) | % |
Interest-bearing deposits | | | 204,569 | | | 196,678 | | | 185,215 | | | 4.0 | | 10.4 | |
Cash and cash equivalents | | | 229,160 | | | 216,519 | | | 211,593 | | | 5.8 | | 8.3 | |
Securities: | | | | | | | | | | | | | | | |
Debt securities available for sale, at market value, net of valuation allowance | | | 63,301 | | | 70,870 | | | 90,438 | | | (10.7) | | (30.0) | |
Debt securities held to maturity, at book value | | | 36,648 | | | 36,576 | | | 40,947 | | | 0.2 | | (10.5) | |
Equity securities, at market value | | | 15,319 | | | 16,569 | | | 10,707 | | | (7.5) | | 43.1 | |
Total securities | | | 115,268 | | | 124,015 | | | 142,092 | | | (7.1) | | (18.9) | |
Loans: | | | | | | | | | | | | | | | |
Loans held for sale | | | 12,557 | | | 9,490 | | | 14,000 | | | 32.3 | | (10.3) | |
SBA loans held for investment | | | 32,499 | | | 34,259 | | | 37,993 | | | (5.1) | | (14.5) | |
Commercial loans | | | 1,559,166 | | | 1,518,032 | | | 1,357,023 | | | 2.7 | | 14.9 | |
Commercial construction loans | | | 159,200 | | | 147,215 | | | 129,831 | | | 8.1 | | 22.6 | |
Residential mortgage loans | | | 668,739 | | | 677,221 | | | 654,250 | | | (1.3) | | 2.2 | |
Consumer loans | | | 85,614 | | | 85,219 | | | 78,620 | | | 0.5 | | 8.9 | |
Residential construction loans | | | 83,881 | | | 73,277 | | | 73,413 | | | 14.5 | | 14.3 | |
Total loans | | | 2,601,656 | | | 2,544,713 | | | 2,345,130 | | | 2.2 | | 10.9 | |
Allowance for credit losses | | | (33,354) | | | (32,342) | | | (27,651) | | | 3.1 | | 20.6 | |
Net loans | | | 2,568,302 | | | 2,512,371 | | | 2,317,479 | | | 2.2 | | 10.8 | |
Premises and equipment, net | | | 18,118 | | | 18,022 | | | 18,715 | | | 0.5 | | (3.2) | |
Bank owned life insurance ("BOLI") | | | 26,764 | | | 26,547 | | | 25,925 | | | 0.8 | | 3.2 | |
Deferred tax assets | | | 14,888 | | | 14,640 | | | 14,627 | | | 1.7 | | 1.8 | |
Federal Home Loan Bank ("FHLB") stock | | | 13,989 | | | 14,314 | | | 13,583 | | | (2.3) | | 3.0 | |
Accrued interest receivable | | | 13,255 | | | 12,896 | | | 12,998 | | | 2.8 | | 2.0 | |
Goodwill | | | 1,516 | | | 1,516 | | | 1,516 | | | - | | - | |
Other real estate owned ("OREO") | | | 1,472 | | | 1,472 | | | - | | | - | | *NM | |
Prepaid expenses and other assets | | | 24,595 | | | 24,340 | | | 9,415 | | | 1.0 | | 161.2 | |
Total assets | | $ | 3,027,327 | | $ | 2,966,652 | | $ | 2,767,943 | | | 2.0 | % | 9.4 | % |
| | | | | | | | | | | | | | | |
LIABILITIES AND SHAREHOLDERS' EQUITY | | | | | | | | | | | | | |||
Liabilities: | | | | | | | | | | | | | | | |
Deposits: | | | | | | | | | | | | | | | |
Noninterest-bearing demand | | $ | 451,138 | | $ | 465,596 | | $ | 454,425 | | | (3.1) | % | (0.7) | % |
Interest-bearing demand | | | 378,162 | | | 369,131 | | | 351,485 | | | 2.4 | | 7.6 | |
Savings | | | 582,730 | | | 535,044 | | | 491,449 | | | 8.9 | | 18.6 | |
Brokered deposits | | | 270,603 | | | 274,203 | | | 202,323 | | | (1.3) | | 33.7 | |
Time deposits | | | 696,507 | | | 680,087 | | | 675,716 | | | 2.4 | | 3.1 | |
Total deposits | | | 2,379,140 | | | 2,324,061 | | | 2,175,398 | | | 2.4 | | 9.4 | |
Borrowed funds | | | 248,274 | | | 255,774 | | | 243,292 | | | (2.9) | | 2.0 | |
Subordinated debentures | | | 10,310 | | | 10,310 | | | 10,310 | | | - | | - | |
Accrued interest payable | | | 2,302 | | | 2,138 | | | 2,147 | | | 7.7 | | 7.2 | |
Accrued expenses and other liabilities | | | 29,206 | | | 28,738 | | | 30,654 | | | 1.6 | | (4.7) | |
Total liabilities | | | 2,669,232 | | | 2,621,021 | | | 2,461,801 | | | 1.8 | | 8.4 | |
Shareholders' equity: | | | | | | | | | | | | | | | |
Common stock | | | 106,034 | | | 105,892 | | | 104,033 | | | 0.1 | | 1.9 | |
Retained earnings | | | 256,620 | | | 243,935 | | | 237,518 | | | 5.2 | | 8.0 | |
Treasury stock, at cost | | | (3,425) | | | (3,101) | | | (33,577) | | | (10.4) | | (89.8) | |
Accumulated other comprehensive loss | | | (1,134) | | | (1,095) | | | (1,832) | | | 3.6 | | (38.1) | |
Total shareholders' equity | | | 358,095 | | | 345,631 | | | 306,142 | | | 3.6 | | 17.0 | |
Total liabilities and shareholders' equity | | $ | 3,027,327 | | $ | 2,966,652 | | $ | 2,767,943 | | | 2.0 | % | 9.4 | % |
| | | | | | | | | | | | | | | |
Shares issued | | | 10,114 | | | 10,048 | | | 11,666 | | | | | | |
Shares outstanding | | | 10,041 | | | 9,982 | | | 10,076 | | | | | | |
Treasury shares | | | 73 | | | 66 | | | 1,590 | | | | | | |
| | | | | | | | | | | | | | | |
*NM=Not meaningful | | | | | | | | | | | | | | | |
UNITY BANCORP, INC.
QTD CONSOLIDATED STATEMENTS OF INCOME
March 31, 2026
| | | | | | | | | | | | March 31, 2026 vs. | | ||||||||||
| | For the three months ended | | | December 31, 2025 | | March 31, 2025 | | |||||||||||||||
(In thousands, except percentages and per share amounts) | | March 31, 2026 | | December 31, 2025 | | March 31, 2025 | | | $ | | % | | $ | | % | | |||||||
INTEREST INCOME | | | | | | | | | | | | | | | | | | | | | | | |
Interest-bearing deposits | | $ | 558 | | $ | 674 | | $ | 332 | | | $ | (116) | | | (17.2) | % | $ | 226 | | | 68.1 | % |
FHLB stock | | | 134 | | | 133 | | | 182 | | | | 1 | | | 0.8 | | | (48) | | | (26.4) | |
Securities: | | | | | | | | | | | | | | | | | | | | | | | |
Taxable | | | 1,409 | | | 1,561 | | | 1,786 | | | | (152) | | | (9.7) | | | (377) | | | (21.1) | |
Tax-exempt | | | 18 | | | 18 | | | 18 | | | | - | | | - | | | - | | | - | |
Total securities | | | 1,427 | | | 1,579 | | | 1,804 | | | | (152) | | | (9.6) | | | (377) | | | (20.9) | |
Loans: | | | | | | | | | | | | | | | | | | | | | | | |
SBA loans | | | 844 | | | 1,037 | | | 934 | | | | (193) | | | (18.6) | | | (90) | | | (9.6) | |
Commercial loans | | | 25,016 | | | 25,626 | | | 21,314 | | | | (610) | | | (2.4) | | | 3,702 | | | 17.4 | |
Commercial construction loans | | | 3,038 | | | 2,666 | | | 2,946 | | | | 372 | | | 14.0 | | | 92 | | | 3.1 | |
Residential mortgage loans | | | 10,913 | | | 10,838 | | | 9,947 | | | | 75 | | | 0.7 | | | 966 | | | 9.7 | |
Consumer loans | | | 1,424 | | | 1,524 | | | 1,346 | | | | (100) | | | (6.6) | | | 78 | | | 5.8 | |
Residential construction loans | | | 1,825 | | | 1,791 | | | 1,996 | | | | 34 | | | 1.9 | | | (171) | | | (8.6) | |
Total loans | | | 43,060 | | | 43,482 | | | 38,483 | | | | (422) | | | (1.0) | | | 4,577 | | | 11.9 | |
Total interest income | | | 45,179 | | | 45,868 | | | 40,801 | | | | (689) | | | (1.5) | | | 4,378 | | | 10.7 | |
INTEREST EXPENSE | | | | | | | | | | | | | | | | | | | | | | | |
Interest-bearing demand deposits | | | 1,910 | | | 2,009 | | | 1,622 | | | | (99) | | | (4.9) | | | 288 | | | 17.8 | |
Savings deposits | | | 3,160 | | | 3,165 | | | 2,593 | | | | (5) | | | (0.2) | | | 567 | | | 21.9 | |
Brokered deposits | | | 2,267 | | | 2,033 | | | 1,787 | | | | 234 | | | 11.5 | | | 480 | | | 26.9 | |
Time deposits | | | 6,128 | | | 6,350 | | | 6,415 | | | | (222) | | | (3.5) | | | (287) | | | (4.5) | |
Borrowed funds and subordinated debentures | | | 984 | | | 942 | | | 1,133 | | | | 42 | | | 4.5 | | | (149) | | | (13.2) | |
Total interest expense | | | 14,449 | | | 14,499 | | | 13,550 | | | | (50) | | | (0.3) | | | 899 | | | 6.6 | |
Net interest income | | | 30,730 | | | 31,369 | | | 27,251 | | | | (639) | | | (2.0) | | | 3,479 | | | 12.8 | |
Provision for credit losses, loans | | | 1,043 | | | 2,208 | | | 1,358 | | | | (1,165) | | | (52.8) | | | (315) | | | (23.2) | |
Provision (Release) for credit losses, off-balance sheet | | | 5 | | | 50 | | | (41) | | | | (45) | | | (90.0) | | | 46 | | | 112.2 | |
(Release) provision of credit losses, securities | | | - | | | - | | | - | | | | - | | | - | | | - | | | - | |
Net interest income after provision for credit losses | | | 29,682 | | | 29,111 | | | 25,934 | | | | 571 | | | 2.0 | | | 3,748 | | | 14.5 | |
NONINTEREST INCOME | | | | | | | | | | | | | | | | | | | | | | | |
Branch fee income | | | 489 | | | 475 | | | 447 | | | | 14 | | | 2.9 | | | 42 | | | 9.4 | |
Service and loan fee income | | | 912 | | | 705 | | | 864 | | | | 207 | | | 29.4 | | | 48 | | | 5.6 | |
Gain on sale of SBA loans held for sale, net | | | 427 | | | 165 | | | 139 | | | | 262 | | | 158.8 | | | 288 | | | 207.2 | |
Gain on sale of mortgage loans, net | | | 500 | | | 343 | | | 168 | | | | 157 | | | 45.8 | | | 332 | | | 197.6 | |
BOLI income | | | 217 | | | 228 | | | 151 | | | | (11) | | | (4.8) | | | 66 | | | 43.7 | |
Net securities (losses) gains | | | (82) | | | 1,570 | | | (49) | | | | (1,652) | | | *NM | | | (33) | | | (67.3) | |
Other income | | | 413 | | | 412 | | | 381 | | | | 1 | | | 0.2 | | | 32 | | | 8.4 | |
Total noninterest income | | | 2,876 | | | 3,898 | | | 2,101 | | | | (1,022) | | | (26.2) | | | 775 | | | 36.9 | |
NONINTEREST EXPENSE | | | | | | | | | | | | | | | | | | | | | | | |
Compensation and benefits | | | 8,673 | | | 7,693 | | | 7,902 | | | | 980 | | | 12.7 | | | 771 | | | 9.8 | |
Processing and communications | | | 1,146 | | | 1,077 | | | 986 | | | | 69 | | | 6.4 | | | 160 | | | 16.2 | |
Occupancy | | | 987 | | | 880 | | | 880 | | | | 107 | | | 12.2 | | | 107 | | | 12.2 | |
Furniture and equipment | | | 715 | | | 854 | | | 746 | | | | (139) | | | (16.3) | | | (31) | | | (4.2) | |
Professional services | | | 488 | | | 640 | | | 364 | | | | (152) | | | (23.8) | | | 124 | | | 34.1 | |
Advertising | | | 393 | | | 379 | | | 391 | | | | 14 | | | 3.7 | | | 2 | | | 0.5 | |
Loan related expenses | | | 473 | | | 426 | | | 46 | | | | 47 | | | 11.0 | | | 427 | | | 928.3 | |
Deposit insurance | | | 300 | | | 300 | | | 241 | | | | - | | | - | | | 59 | | | 24.5 | |
Director fees | | | 260 | | | 271 | | | 495 | | | | (11) | | | (4.1) | | | (235) | | | (47.5) | |
Other expenses | | | 636 | | | 795 | | | 560 | | | | (159) | | | (20.0) | | | 76 | | | 13.6 | |
Total noninterest expense | | | 14,071 | | | 13,315 | | | 12,611 | | | | 756 | | | 5.7 | | | 1,460 | | | 11.6 | |
Income before provision for income taxes | | | 18,487 | | | 19,694 | | | 15,424 | | | | (1,207) | | | (6.1) | | | 3,063 | | | 19.9 | |
Provision for income taxes | | | 4,199 | | | 4,222 | | | 3,826 | | | | (23) | | | (0.5) | | | 373 | | | 9.7 | |
Net income | | $ | 14,288 | | $ | 15,472 | | $ | 11,598 | | | $ | (1,184) | | | (7.7) | % | $ | 2,690 | | | 23.2 | % |
| | | | | | | | | | | | | | | | | | | | | | | |
Effective tax rate | | | 22.7 | % | | 21.4 | % | | 24.8 | % | | | | | | | | | | | | | |
| | | | | | | | | | | | | | | | | | | | | | | |
Net income per common share - Basic | | $ | 1.43 | | $ | 1.55 | | $ | 1.15 | | | | | | | | | | | | | | |
Net income per common share - Diluted | | | 1.40 | | | 1.52 | | | 1.13 | | | | | | | | | | | | | | |
| | | | | | | | | | | | | | | | | | | | | | | |
Weighted average common shares outstanding - Basic | | | 10,012 | | | 10,008 | | | 10,054 | | | | | | | | | | | | | | |
Weighted average common shares outstanding - Diluted | | | 10,199 | | | 10,195 | | | 10,247 | | | | | | | | | | | | | | |
*NM=Not meaningful | | | | | | | | | | | | | | | | | | | | | | | |
UNITY BANCORP, INC.
QUARTER TO DATE NET INTEREST MARGIN
March 31, 2026
| | For the three months ended | | ||||||||||||||||
(Dollar amounts in thousands, interest amounts and | | March 31, 2026 | | March 31, 2025 | | ||||||||||||||
interest rates/yields on a fully tax-equivalent basis) | | Average Balance | | Interest | | Rate/Yield | | Average Balance | | Interest | | Rate/Yield | | ||||||
ASSETS | | | | | | | | | | | | | | | | | | | |
Interest-earning assets: | | | | | | | | | | | | | | | | | | | |
Interest-bearing deposits | | $ | 61,424 | | $ | 558 | | | 3.69 | % | $ | 30,259 | | $ | 332 | | | 4.45 | % |
FHLB stock | | | 7,214 | | | 134 | | | 7.53 | | | 7,459 | | | 182 | | | 9.90 | |
Securities: | | | | | | | | | | | | | | | | | | | |
Taxable | | | 118,488 | | | 1,409 | | | 4.76 | | | 142,847 | | | 1,786 | | | 5.00 | |
Tax-exempt | | | 1,486 | | | 21 | | | 5.60 | | | 1,596 | | | 18 | | | 4.59 | |
Total securities (A) | | | 119,974 | | | 1,430 | | | 4.77 | | | 144,443 | | | 1,804 | | | 5.00 | |
Loans: | | | | | | | | | | | | | | | | | | | |
SBA loans | | | 41,576 | | | 844 | | | 8.12 | | | 49,638 | | | 934 | | | 7.53 | |
Commercial loans | | | 1,528,022 | | | 25,016 | | | 6.55 | | | 1,306,052 | | | 21,314 | | | 6.53 | |
Commercial construction loans | | | 152,561 | | | 3,038 | | | 7.96 | | | 140,946 | | | 2,946 | | | 8.36 | |
Residential mortgage loans | | | 678,359 | | | 10,913 | | | 6.44 | | | 639,742 | | | 9,947 | | | 6.22 | |
Consumer loans | | | 84,037 | | | 1,424 | | | 6.78 | | | 75,156 | | | 1,346 | | | 7.16 | |
Residential construction loans | | | 80,226 | | | 1,825 | | | 9.10 | | | 84,414 | | | 1,996 | | | 9.46 | |
Total loans (B) | | | 2,564,781 | | | 43,060 | | | 6.72 | | | 2,295,948 | | | 38,483 | | | 6.70 | |
Total interest-earning assets | | $ | 2,753,393 | | $ | 45,182 | | | 6.66 | % | $ | 2,478,109 | | $ | 40,801 | | | 6.68 | % |
| | | | | | | | | | | | | | | | | | | |
Noninterest-earning assets: | | | | | | | | | | | | | | | | | | | |
Cash and due from banks | | | 24,735 | | | | | | | | | 23,117 | | | | | | | |
Allowance for credit losses | | | (33,007) | | | | | | | | | (27,455) | | | | | | | |
Other assets | | | 98,891 | | | | | | | | | 91,553 | | | | | | | |
Total noninterest-earning assets | | | 90,619 | | | | | | | | | 87,215 | | | | | | | |
Total assets | | $ | 2,844,012 | | | | | | | | $ | 2,565,324 | | | | | | | |
| | | | | | | | | | | | | | | | | | | |
LIABILITIES AND SHAREHOLDERS' EQUITY | | | | | | | | | | | | | | | | | | | |
Interest-bearing liabilities: | | | | | | | | | | | | | | | | | | | |
Interest-bearing demand deposits | | $ | 385,444 | | $ | 1,910 | | | 2.01 | % | $ | 341,991 | | $ | 1,622 | | | 1.92 | % |
Savings deposits | | | 563,220 | | | 3,160 | | | 2.28 | | | 495,051 | | | 2,593 | | | 2.12 | |
Brokered deposits | | | 265,877 | | | 2,267 | | | 3.46 | | | 213,517 | | | 1,787 | | | 3.39 | |
Time deposits | | | 685,355 | | | 6,128 | | | 3.63 | | | 637,936 | | | 6,415 | | | 4.08 | |
Total interest-bearing deposits | | | 1,899,896 | | | 13,465 | | | 2.87 | | | 1,688,495 | | | 12,417 | | | 2.98 | |
Borrowed funds and subordinated debentures | | | 108,231 | | | 984 | | | 3.64 | | | 119,135 | | | 1,133 | | | 3.80 | |
Total interest-bearing liabilities | | $ | 2,008,127 | | $ | 14,449 | | | 2.92 | % | $ | 1,807,630 | | $ | 13,550 | | | 3.04 | % |
| | | | | | | | | | | | | | | | | | | |
Noninterest-bearing liabilities: | | | | | | | | | | | | | | | | | | | |
Noninterest-bearing demand deposits | | | 457,603 | | | | | | | | | 425,569 | | | | | | | |
Other liabilities | | | 24,594 | | | | | | | | | 29,833 | | | | | | | |
Total noninterest-bearing liabilities | | | 482,197 | | | | | | | | | 455,402 | | | | | | | |
Total shareholders' equity | | | 353,688 | | | | | | | | | 302,292 | | | | | | | |
Total liabilities and shareholders' equity | | $ | 2,844,012 | | | | | | | | $ | 2,565,324 | | | | | | | |
| | | | | | | | | | | | | | | | | | | |
Net interest spread | | | | | $ | 30,733 | | | 3.74 | % | | | | $ | 27,251 | | | 3.64 | % |
Tax-equivalent basis adjustment | | | | | | (3) | | | | | | | | | - | | | | |
Net interest income | | | | | $ | 30,730 | | | | | | | | $ | 27,251 | | | | |
Net interest margin | | | | | | | | | 4.53 | % | | | | | | | | 4.46 | % |
| | | | | | | | | | | | | | | | | | | |
| (A) | Yields related to securities exempt from federal and state income taxes are stated on a fully tax-equivalent basis, assuming a federal tax rate of 21 percent. |
| (B) | The loan averages are stated net of unearned income, and the averages include loans on which the accrual of interest has been discontinued. |
UNITY BANCORP, INC.
QUARTER TO DATE NET INTEREST MARGIN
March 31, 2026
| | For the three months ended | | ||||||||||||||||
(Dollar amounts in thousands, interest amounts and | | March 31, 2026 | | December 31, 2025 | | ||||||||||||||
interest rates/yields on a fully tax-equivalent basis) | | Average Balance | | Interest | | Rate/Yield | | Average Balance | | Interest | | Rate/Yield | | ||||||
ASSETS | | | | | | | | | | | | | | | | | | | |
Interest-earning assets: | | | | | | | | | | | | | | | | | | | |
Interest-bearing deposits | | $ | 61,424 | | $ | 558 | | | 3.69 | % | $ | 66,840 | | $ | 674 | | | 4.00 | % |
FHLB stock | | | 7,214 | | | 134 | | | 7.53 | | | 6,859 | | | 133 | | | 7.67 | |
Securities: | | | | | | | | | | | | | | | | | | | |
Taxable | | | 118,488 | | | 1,409 | | | 4.76 | | | 128,384 | | | 1,561 | | | 4.86 | |
Tax-exempt | | | 1,486 | | | 21 | | | 5.60 | | | 1,474 | | | 21 | | | 5.67 | |
Total securities (A) | | | 119,974 | | | 1,430 | | | 4.77 | | | 129,858 | | | 1,582 | | | 4.87 | |
Loans: | | | | | | | | | | | | | | | | | | | |
SBA Loans | | | 41,576 | | | 844 | | | 8.12 | | | 45,686 | | | 1,037 | | | 9.08 | |
Commercial loans | | | 1,528,022 | | | 25,016 | | | 6.55 | | | 1,487,472 | | | 25,626 | | | 6.74 | |
Commercial construction loans | | | 152,561 | | | 3,038 | | | 7.96 | | | 131,268 | | | 2,666 | | | 7.95 | |
Residential mortgage loans | | | 678,359 | | | 10,913 | | | 6.44 | | | 680,679 | | | 10,838 | | | 6.37 | |
Consumer loans | | | 84,037 | | | 1,424 | | | 6.78 | | | 84,318 | | | 1,524 | | | 7.07 | |
Residential construction loans | | | 80,226 | | | 1,825 | | | 9.10 | | | 74,915 | | | 1,791 | | | 9.35 | |
Total loans (B) | | | 2,564,781 | | | 43,060 | | | 6.72 | | | 2,504,338 | | | 43,482 | | | 6.79 | |
Total interest-earning assets | | $ | 2,753,393 | | $ | 45,182 | | | 6.66 | % | $ | 2,707,895 | | $ | 45,871 | | | 6.72 | % |
| | | | | | | | | | | | | | | | | | | |
Noninterest-earning assets: | | | | | | | | | | | | | | | | | | | |
Cash and due from banks | | | 24,735 | | | | | | | | | 23,135 | | | | | | | |
Allowance for credit losses | | | (33,007) | | | | | | | | | (30,791) | | | | | | | |
Other assets | | | 98,891 | | | | | | | | | 91,977 | | | | | | | |
Total noninterest-earning assets | | | 90,619 | | | | | | | | | 84,321 | | | | | | | |
Total assets | | $ | 2,844,012 | | | | | | | | $ | 2,792,216 | | | | | | | |
| | | | | | | | | | | | | | | | | | | |
LIABILITIES AND SHAREHOLDERS' EQUITY | | | | | | | | | | | | | | | | | | | |
Interest-bearing liabilities: | | | | | | | | | | | | | | | | | | | |
Interest-bearing demand deposits | | $ | 385,444 | | $ | 1,910 | | | 2.01 | % | $ | 391,005 | | $ | 2,009 | | | 2.04 | % |
Savings deposits | | | 563,220 | | | 3,160 | | | 2.28 | | | 546,025 | | | 3,165 | | | 2.30 | |
Brokered deposits | | | 265,877 | | | 2,267 | | | 3.46 | | | 231,956 | | | 2,033 | | | 3.48 | |
Time deposits | | | 685,355 | | | 6,128 | | | 3.63 | | | 687,058 | | | 6,350 | | | 3.67 | |
Total interest-bearing deposits | | | 1,899,896 | | | 13,465 | | | 2.87 | | | 1,856,044 | | | 13,557 | | | 2.90 | |
Borrowed funds and subordinated debentures | | | 108,231 | | | 984 | | | 3.64 | | | 100,689 | | | 942 | | | 3.66 | |
Total interest-bearing liabilities | | $ | 2,008,127 | | $ | 14,449 | | | 2.92 | % | $ | 1,956,733 | | $ | 14,499 | | | 2.94 | % |
| | | | | | | | | | | | | | | | | | | |
Noninterest-bearing liabilities: | | | | | | | | | | | | | | | | | | | |
Noninterest-bearing demand deposits | | | 457,603 | | | | | | | | | 462,977 | | | | | | | |
Other liabilities | | | 24,594 | | | | | | | | | 33,026 | | | | | | | |
Total noninterest-bearing liabilities | | | 482,197 | | | | | | | | | 496,003 | | | | | | | |
Total shareholders' equity | | | 353,688 | | | | | | | | | 339,480 | | | | | | | |
Total liabilities and shareholders' equity | | $ | 2,844,012 | | | | | | | | $ | 2,792,216 | | | | | | | |
| | | | | | | | | | | | | | | | | | | |
Net interest spread | | | | | $ | 30,733 | | | 3.74 | % | | | | $ | 31,372 | | | 3.78 | % |
Tax-equivalent basis adjustment | | | | | | (3) | | | | | | | | | (3) | | | | |
Net interest income | | | | | $ | 30,730 | | | | | | | | $ | 31,369 | | | | |
Net interest margin | | | | | | | | | 4.53 | % | | | | | | | | 4.60 | % |
| | | | | | | | | | | | | | | | | | | |
| (A) | Yields related to securities exempt from federal and state income taxes are stated on a fully tax-equivalent basis, assuming a federal tax rate of 21 percent. |
| (B) | The loan averages are stated net of unearned income, and the averages include loans on which the accrual of interest has been discontinued. |
UNITY BANCORP, INC.
QUARTERLY ALLOWANCE FOR CREDIT LOSSES AND LOAN QUALITY SCHEDULES
March 31, 2026
Amounts in thousands, except percentages | | March 31, 2026 | | December 31, 2025 | | September 30, 2025 | | June 30, 2025 | | March 31, 2025 | | |||||
ALLOWANCE FOR CREDIT LOSSES: | | | | | | | | | | | | | | | | |
Balance, beginning of period | | $ | 32,342 | | $ | 30,245 | | $ | 29,012 | | $ | 27,651 | | $ | 26,788 | |
Provision for credit losses for loans | | | 1,043 | | | 2,208 | | | 1,409 | | | 1,725 | | | 1,358 | |
| | | 33,385 | | | 32,453 | | | 30,421 | | | 29,376 | | | 28,146 | |
Less: Chargeoffs | | | | | | | | | | | | | | | | |
SBA loans | | | 50 | | | 265 | | | 211 | | | 105 | | | 350 | |
Commercial loans | | | 140 | | | - | | | - | | | 100 | | | 2 | |
Residential mortgage loans | | | - | | | 46 | | | 85 | | | 282 | | | 130 | |
Consumer loans | | | 10 | | | 11 | | | 30 | | | 21 | | | 50 | |
Residential construction loans | | | 40 | | | - | | | - | | | - | | | - | |
Total chargeoffs | | | 240 | | | 322 | | | 326 | | | 508 | | | 532 | |
Add: Recoveries | | | | | | | | | | | | | | | | |
SBA loans | | | 5 | | | 4 | | | 50 | | | 2 | | | 5 | |
Commercial loans | | | 93 | | | 196 | | | 92 | | | 102 | | | 5 | |
Residential mortgage loans | | | 100 | | | - | | | - | | | - | | | - | |
Consumer loans | | | 11 | | | 11 | | | 8 | | | 40 | | | 27 | |
Residential construction loans | | | - | | | - | | | - | | | - | | | - | |
Total recoveries | | | 209 | | | 211 | | | 150 | | | 144 | | | 37 | |
Net chargeoffs | | | (31) | | | (111) | | | (176) | | | (364) | | | (495) | |
Balance, end of period | | $ | 33,354 | | $ | 32,342 | | $ | 30,245 | | $ | 29,012 | | $ | 27,651 | |
| | | | | | | | | | | | | | | | |
ASSET QUALITY INFORMATION: | | | | | | | | | | | | | | | | |
| | | | | | | | | | | | | | | | |
Nonaccrual loans: | | | | | | | | | | | | | | | | |
SBA loans | | $ | 1,645 | | $ | 1,751 | | $ | 4,225 | | $ | 4,177 | | $ | 3,231 | |
Commercial loans | | | 18,375 | | | 18,473 | | | 4,006 | | | 3,512 | | | 4,821 | |
Residential mortgage loans | | | 8,915 | | | 8,173 | | | 11,174 | | | 7,980 | | | 8,622 | |
Consumer loans | | | 1,557 | | | 1,268 | | | 938 | | | - | | | - | |
Residential construction loans | | | 128 | | | 171 | | | 171 | | | 171 | | | 171 | |
Total nonaccrual loans | | | 30,620 | | | 29,836 | | | 20,514 | | | 15,840 | | | 16,845 | |
Debt securities available for sale, net of valuation allowance | | | - | | | - | | | - | | | - | | | 1,145 | |
OREO | | | 1,472 | | | 1,472 | | | - | | | - | | | - | |
Nonaccrual assets | | | 32,092 | | | 31,308 | | | 20,514 | | | 15,840 | | | 17,990 | |
| | | | | | | | | | | | | | | | |
Loans 90 days past due & still accruing | | $ | 90 | | $ | - | | $ | 356 | | $ | 2,876 | | $ | 1,123 | |
| | | | | | | | | | | | | | | | |
Nonaccrual loans to total loans | | | 1.18 | % | | 1.17 | % | | 0.83 | % | | 0.66 | % | | 0.72 | % |
Nonaccrual assets to total assets | | | 1.06 | | | 1.06 | | | 0.71 | | | 0.54 | | | 0.65 | |
| | | | | | | | | | | | | | | | |
Allowance for credit losses to: | | | | | | | | | | | | | | | | |
Total loans | | | 1.28 | % | | 1.27 | % | | 1.23 | % | | 1.22 | % | | 1.18 | % |
Total nonaccrual loans | | | 108.93 | | | 108.40 | | | 147.44 | | | 183.16 | | | 164.15 | |
UNITY BANCORP, INC.
QUARTERLY FINANCIAL DATA
March 31, 2026
(In thousands, except %'s, employee, office and per share amounts) | | March 31, 2026 | | December 31, 2025 | | September 30, 2025 | | June 30, 2025 | | March 31, 2025 | | |||||
SUMMARY OF INCOME: | | | | | | | | | | | | | | | | |
Total interest income | | $ | 45,179 | | $ | 45,868 | | $ | 44,361 | | $ | 42,600 | | $ | 40,799 | |
Total interest expense | | | 14,449 | | | 14,499 | | | 14,505 | | | 14,043 | | | 13,548 | |
Net interest income | | | 30,730 | | | 31,369 | | | 29,856 | | | 28,557 | | | 27,251 | |
Provision (Release) for credit losses | | | 1,048 | | | 2,258 | | | 542 | | | (175) | | | 1,316 | |
Net interest income after provision for credit losses | | | 29,682 | | | 29,111 | | | 29,314 | | | 28,732 | | | 25,935 | |
Total noninterest income | | | 2,876 | | | 3,898 | | | 2,967 | | | 5,815 | | | 2,099 | |
Total noninterest expense | | | 14,071 | | | 13,315 | | | 13,415 | | | 13,019 | | | 12,610 | |
Income before provision for income taxes | | | 18,487 | | | 19,694 | | | 18,866 | | | 21,528 | | | 15,424 | |
Provision for income taxes | | | 4,199 | | | 4,222 | | | 4,476 | | | 5,037 | | | 3,826 | |
Net income | | $ | 14,288 | | $ | 15,472 | | $ | 14,390 | | $ | 16,491 | | $ | 11,598 | |
| | | | | | | | | | | | | | | | |
Net income per common share - Basic | | $ | 1.43 | | $ | 1.55 | | $ | 1.43 | | $ | 1.64 | | $ | 1.16 | |
Net income per common share - Diluted | | | 1.40 | | | 1.52 | | | 1.41 | | | 1.61 | | | 1.13 | |
| | | | | | | | | | | | | | | | |
COMMON SHARE DATA: | | | | | | | | | | | | | | | | |
Market price per share | | $ | 51.83 | | $ | 51.72 | | $ | 48.87 | | $ | 47.08 | | $ | 40.70 | |
Dividends paid | | | 0.16 | | | 0.15 | | | 0.15 | | | 0.14 | | | 0.14 | |
Book value per common share | | | 35.66 | | | 34.63 | | | 33.26 | | | 31.88 | | | 30.38 | |
| | | | | | | | | | | | | | | | |
Weighted average common shares outstanding - Basic | | | 10,012 | | | 10,008 | | | 10,036 | | | 10,033 | | | 10,054 | |
Weighted average common shares outstanding - Diluted | | | 10,199 | | | 10,195 | | | 10,233 | | | 10,212 | | | 10,247 | |
Issued common shares | | | 10,114 | | | 10,048 | | | 11,681 | | | 11,672 | | | 11,666 | |
Outstanding common shares | | | 10,041 | | | 9,982 | | | 10,041 | | | 10,032 | | | 10,076 | |
Treasury shares | | | 73 | | | 66 | | | 1,640 | | | 1,640 | | | 1,590 | |
| | | | | | | | | | | | | | | | |
QUARTERLY PERFORMANCE RATIOS (ANNUALIZED): | | | | | | | | | | | | | | | | |
Return on average assets | | | 2.04 | % | | 2.20 | % | | 2.11 | % | | 2.51 | % | | 1.83 | % |
Return on average equity | | | 16.38 | | | 18.08 | | | 17.41 | | | 21.15 | | | 15.56 | |
Efficiency ratio ** | | | 41.77 | | | 39.52 | | | 41.47 | | | 42.31 | | | 42.89 | |
Noninterest expense to average assets | | | 2.01 | | | 1.89 | | | 1.97 | | | 1.98 | | | 1.99 | |
| | | | | | | | | | | | | | | | |
BALANCE SHEET DATA: | | | | | | | | | | | | | | | | |
Total assets | | $ | 3,027,327 | | $ | 2,966,652 | | $ | 2,876,365 | | $ | 2,928,523 | | $ | 2,767,943 | |
Total securities | | | 115,268 | | | 124,015 | | | 131,252 | | | 139,348 | | | 142,092 | |
Total loans | | | 2,601,656 | | | 2,544,713 | | | 2,468,527 | | | 2,382,594 | | | 2,345,130 | |
Allowance for credit losses | | | 33,354 | | | 32,342 | | | 30,245 | | | 29,012 | | | 27,651 | |
Total deposits | | | 2,379,140 | | | 2,324,061 | | | 2,267,484 | | | 2,187,366 | | | 2,175,398 | |
Total shareholders' equity | | | 358,095 | | | 345,631 | | | 334,023 | | | 319,840 | | | 306,142 | |
| | | | | | | | | | | | | | | | |
TAX EQUIVALENT YIELDS AND RATES: | | | | | | | | | | | | | | | | |
Interest-earning assets | | | 6.66 | % | | 6.72 | % | | 6.74 | % | | 6.70 | % | | 6.68 | % |
Interest-bearing liabilities | | | 2.92 | | | 2.94 | | | 3.05 | | | 3.05 | | | 3.04 | |
Net interest spread | | | 3.74 | | | 3.78 | | | 3.69 | | | 3.66 | | | 3.64 | |
Net interest margin | | | 4.53 | | | 4.60 | | | 4.54 | | | 4.49 | | | 4.46 | |
| | | | | | | | | | | | | | | | |
CREDIT QUALITY: | | | | | | | | | | | | | | | | |
Nonaccrual assets | | $ | 32,092 | | $ | 31,308 | | $ | 20,514 | | $ | 15,840 | | $ | 17,990 | |
QTD annualized net chargeoffs to QTD average loans | | | (0.01) | % | | (0.02) | % | | (0.03) | % | | (0.06) | % | | (0.09) | % |
Allowance for credit losses to total loans | | | 1.28 | | | 1.27 | | | 1.23 | | | 1.22 | | | 1.18 | |
Nonaccrual loans to total loans | | | 1.18 | | | 1.17 | | | 0.83 | | | 0.66 | | | 0.72 | |
Nonaccrual assets to total assets | | | 1.06 | | | 1.06 | | | 0.71 | | | 0.54 | | | 0.65 | |
| | | | | | | | | | | | | | | | |
UNITY BANCORP CAPITAL RATIOS | | | | | | | | | | | | | | | | |
Total equity to total assets | | | 11.83 | % | | 11.65 | % | | 11.61 | % | | 10.92 | % | | 11.06 | % |
Leverage ratio | | | 12.93 | | | 12.72 | | | 12.71 | | | 12.50 | | | 12.32 | |
Common Equity Tier 1 Capital Ratio | | | 14.50 | | | 14.45 | | | 14.45 | | | 13.96 | | | 13.87 | |
Risk-based Tier 1 Capital Ratio | | | 14.91 | | | 14.87 | | | 14.88 | | | 14.39 | | | 14.33 | |
Risk-based Total Capital Ratio | | | 16.16 | | | 16.12 | | | 16.13 | | | 15.65 | | | 15.58 | |
| | | | | | | | | | | | | | | | |
Number of banking offices | | | 22 | | | 22 | | | 22 | | | 21 | | | 21 | |
Employee Full-Time Equivalent | | | 244 | | | 242 | | | 238 | | | 237 | | | 227 | |
** The efficiency ratio is a non-GAAP measure, calculated based on the noninterest expense divided by the sum of net interest income plus non interest income, excluding net gains and losses on securities. | | |||||||||||||||
UNITY BANCORP, INC.
LOAN PORTFOLIO COMPOSITION
March 31, 2026
In thousands, except percentages | | March 31, 2026 | | % | | December 31, 2025 | | % | ||
Loans Held for Sale | | $ | 12,557 | | 0.5% | | $ | 9,490 | | 0.4% |
| | | | | | | | | | |
SBA Loans | | | 32,499 | | 1.2% | | | 34,259 | | 1.3% |
| | | | | | | | | | |
Commercial Loans | | | | | | | | | | |
SBA 504 | | | 43,254 | | 1.7% | | | 43,802 | | 1.7% |
Commercial & industrial | | | 185,207 | | 7.1% | | | 183,163 | | 7.2% |
Commercial mortgage - owner occupied | | | 681,803 | | 26.2% | | | 660,427 | | 26.0% |
Commercial mortgage - nonowner occupied | | | 561,057 | | 21.6% | | | 531,954 | | 20.9% |
Other | | | 87,845 | | 3.4% | | | 98,686 | | 3.9% |
Total Commercial Loans | | | 1,559,166 | | 60.0% | | | 1,518,032 | | 59.7% |
| | | | | | | | | | |
Commercial Construction Loans | | | 159,200 | | 6.1% | | | 147,215 | | 5.8% |
| | | | | | | | | | |
Residential Mortgage Loans | | | | | | | | | | |
Primary residence | | | 467,329 | | 18.0% | | | 472,482 | | 18.6% |
Secondary residence | | | 67,835 | | 2.6% | | | 71,656 | | 2.8% |
Investor property | | | 133,575 | | 5.1% | | | 133,083 | | 5.2% |
Total Residential Mortgage Loans | | | 668,739 | | 25.7% | | | 677,221 | | 26.6% |
| | | | | | | | | | |
Consumer Loans | | | | | | | | | | |
Home equity | | | 82,980 | | 3.2% | | | 82,488 | | 3.2% |
Consumer other | | | 2,634 | | 0.1% | | | 2,731 | | 0.1% |
Total Consumer Loans | | | 85,614 | | 3.3% | | | 85,219 | | 3.3% |
| | | | | | | | | | |
Residential Construction Loans | | | 83,881 | | 3.2% | | | 73,277 | | 2.9% |
| | | | | | | | | | |
Total Gross Loans | | $ | 2,601,656 | | 100.0% | | $ | 2,544,713 | | 100.0% |
UNITY BANCORP, INC.
QUARTERLY NON-GAAP / CORE RECONCILIATION
March 31, 2026
| | For the three months ended | | |||||||
(In thousands, except percentages and per share amounts) | | March 31, 2026 | | December 31, 2025 | | March 31, 2025 | | |||
Adjusted net income: | | | | | | | | | | |
Net income (GAAP) | | $ | 14,288 | | $ | 15,472 | | $ | 11,598 | |
Non-recurring transactions: | | | | | | | | | | |
Less: Net securities gains, unrealized | | | - | | | (1,475) | | | - | |
Add: Adjusted release of income taxes | | | - | | | 354 | | | - | |
Adjusted net income (non-GAAP) | | $ | 14,288 | | $ | 14,351 | | $ | 11,598 | |
| | | | | | | | | | |
Adjusted net income per common share: | | | | | | | | | | |
Weighted average common shares outstanding - Basic | | | 10,012 | | | 10,008 | | | 10,054 | |
Weighted average common shares outstanding - Diluted | | | 10,199 | | | 10,195 | | | 10,247 | |
| | | | | | | | | | |
Net income per common share - Basic (GAAP) | | $ | 1.43 | | $ | 1.55 | | $ | 1.15 | |
Net income per common share - Diluted (GAAP) | | | 1.40 | | | 1.52 | | | 1.13 | |
| | | | | | | | | | |
Adjusted net income per common share - Basic (non-GAAP) | | $ | N/A | | $ | 1.43 | | $ | N/A | |
Adjusted net income per common share - Diluted (non-GAAP) | | | N/A | | | 1.41 | | | N/A | |
| | | | | | | | | | |
Adjusted return on average assets: | | | | | | | | | | |
Total QTD average assets | | | 2,844,012 | | | 2,792,216 | | | 2,565,324 | |
| | | | | | | | | | |
Return on average assets (GAAP) | | | 2.04 | % | | 2.20 | % | | 1.83 | % |
Adjusted return on average assets (non-GAAP) | | | N/A | | | 2.04 | | | N/A | |
| | | | | | | | | | |
Adjusted return on average equity: | | | | | | | | | | |
Total QTD average equity | | | 353,688 | | | 339,480 | | | 302,292 | |
| | | | | | | | | | |
Return on average equity (GAAP) | | | 16.38 | % | | 18.08 | % | | 15.56 | % |
Adjusted return on average equity (non-GAAP) | | | N/A | | | 16.77 | | | N/A | |
Management uses these non-GAAP measures as internal benchmarks in evaluating operating performance and in planning and forecasting future periods.