2Q25 Key Financial Data | 2Q25 Financial Highlights | |||||||||||||||||||
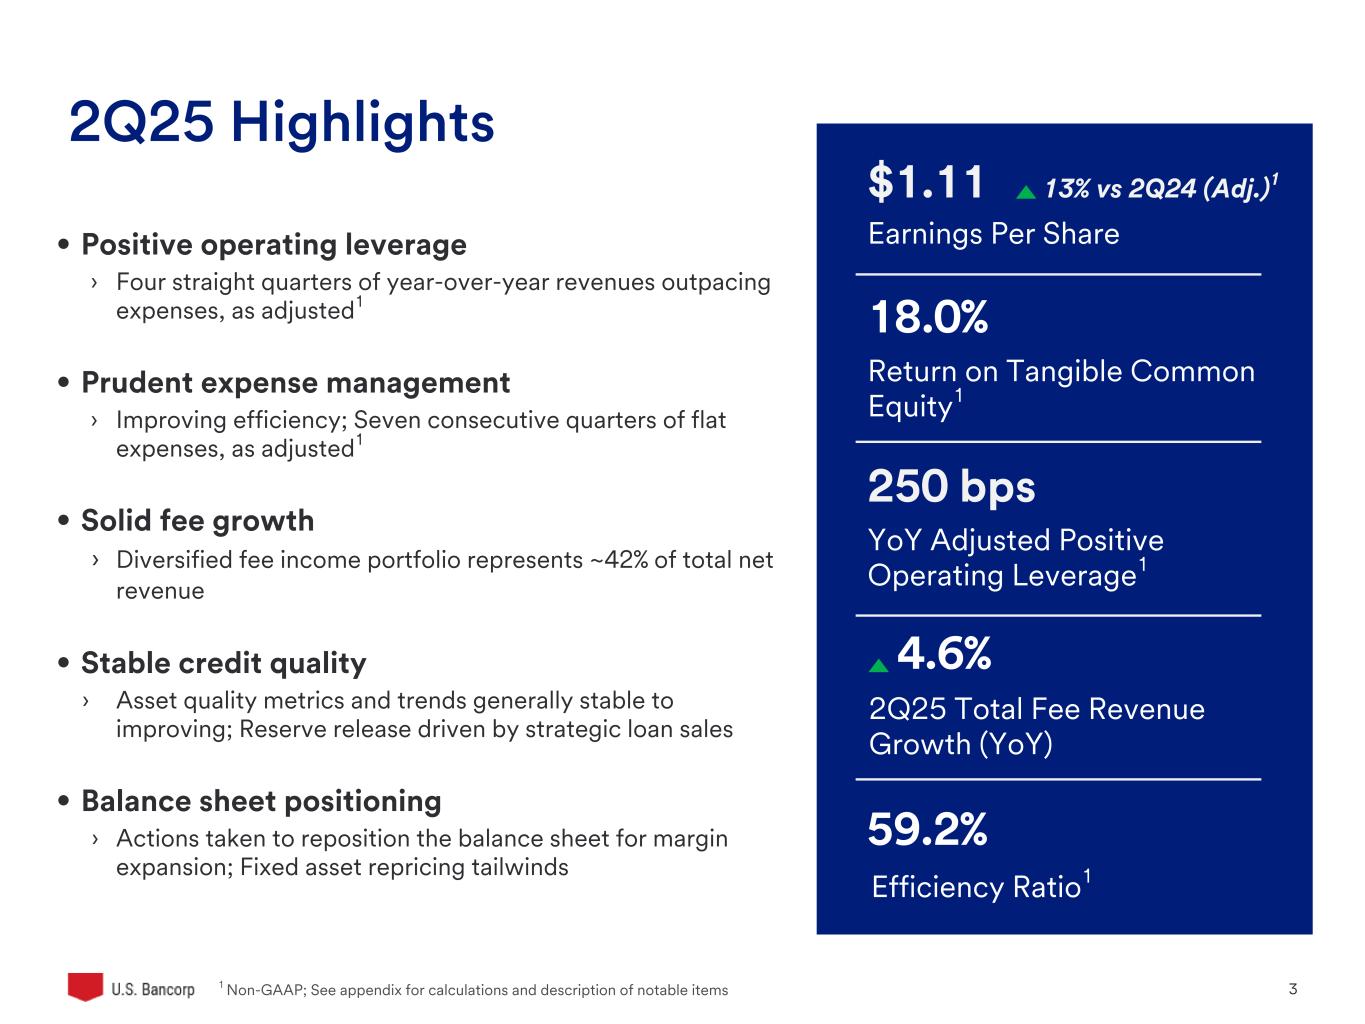
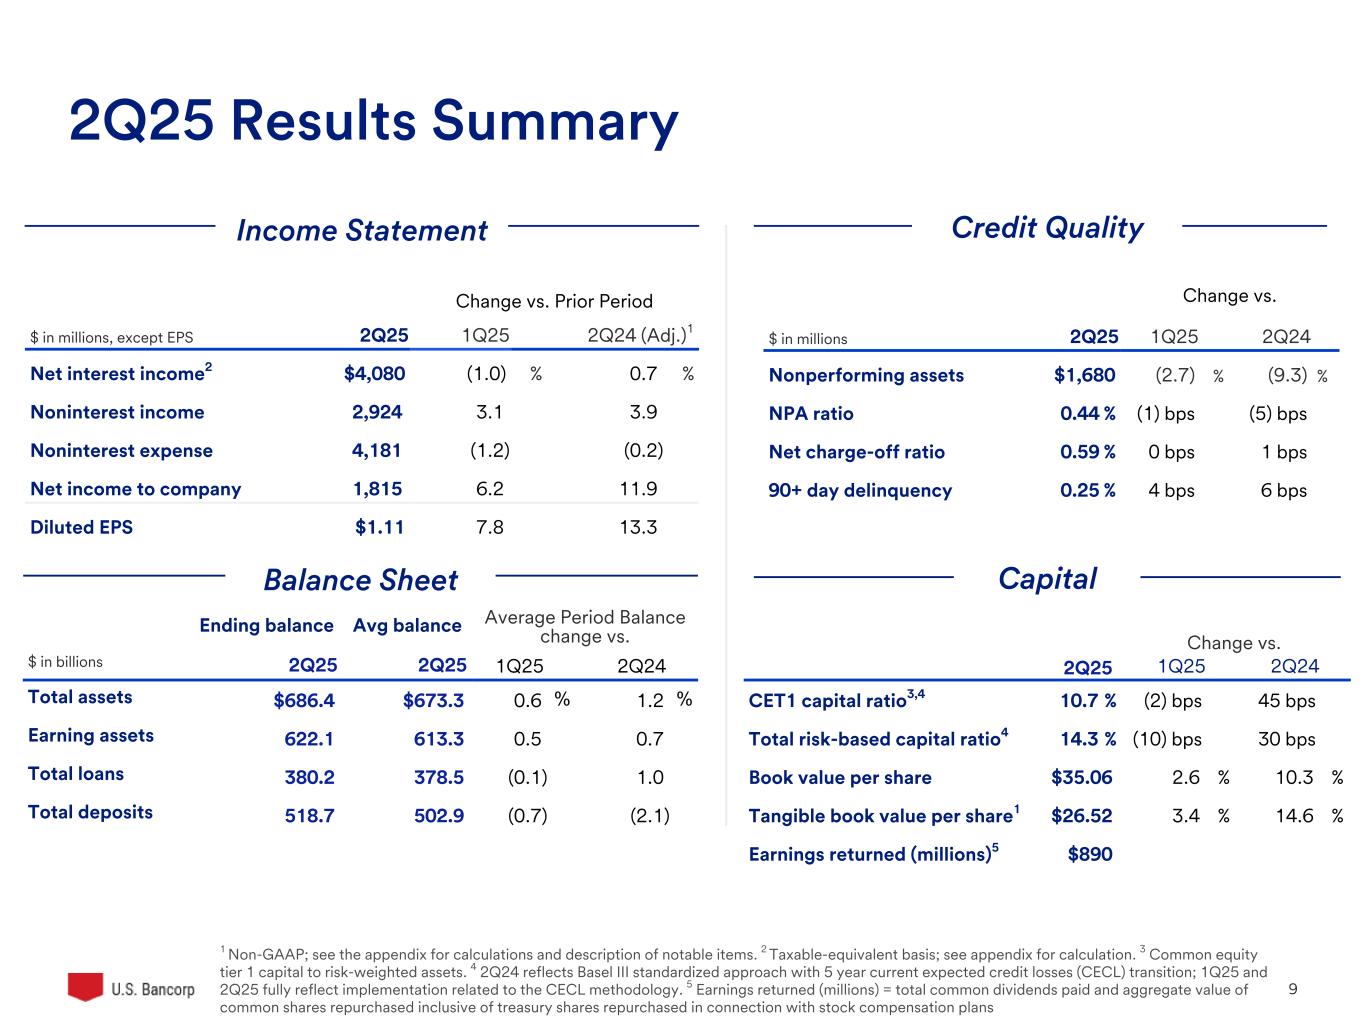
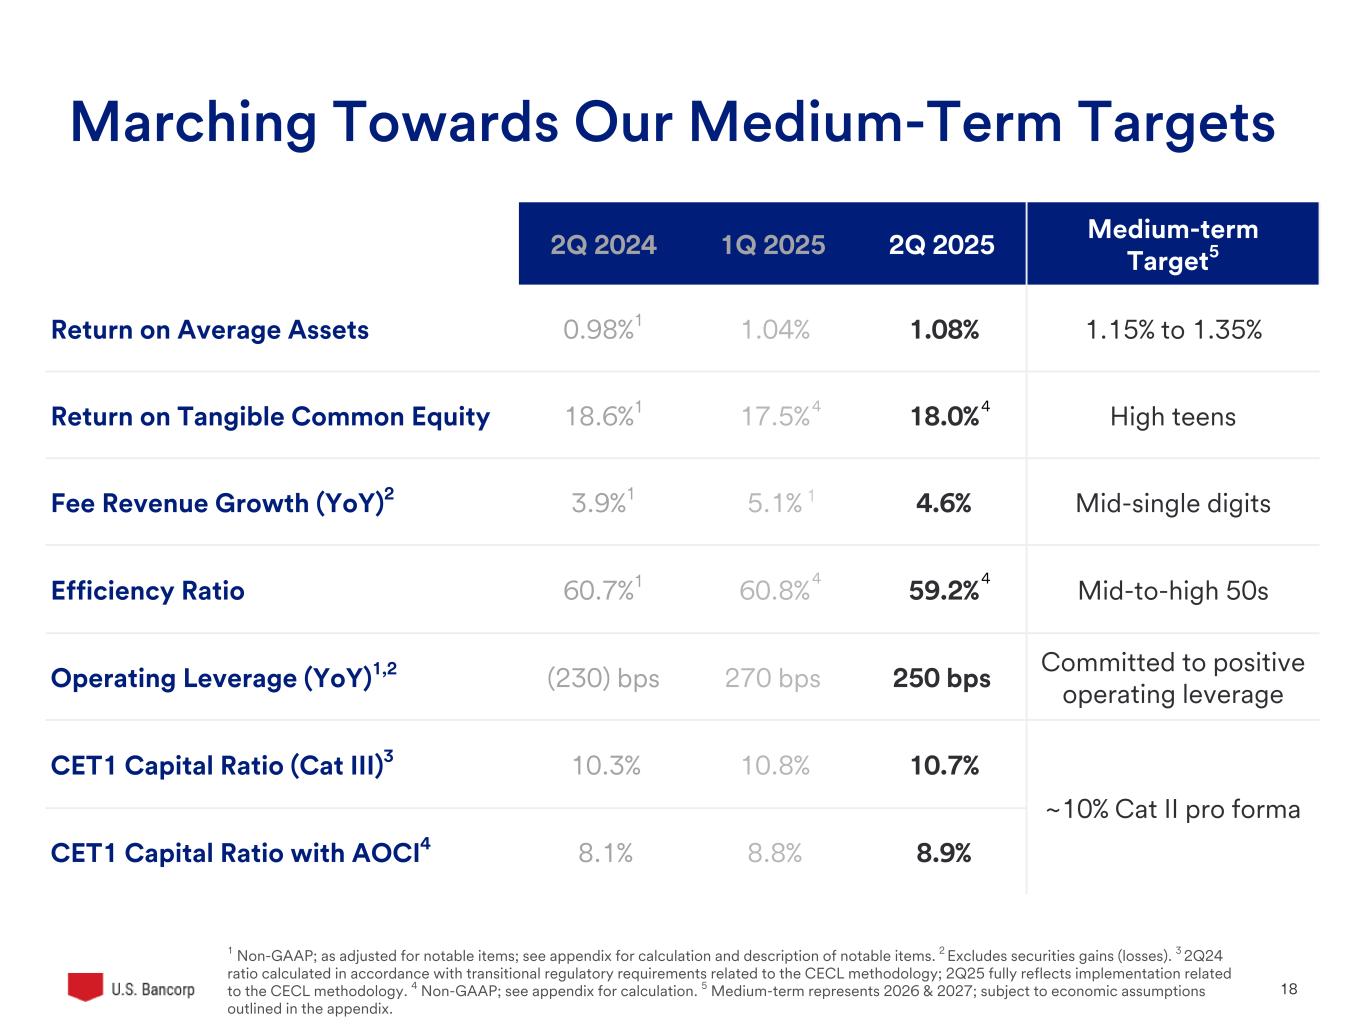
| PROFITABILITY METRICS | 2Q25 | 1Q25 | 2Q24 | •Net income of $1,815 million, an increase of 13.2% year-over-year •Diluted earnings per common share of $1.11, compared with $0.97 diluted earnings per common share in the second quarter of 2024 •Return on tangible common equity of 18.0%, return on average assets of 1.08%, and efficiency ratio of 59.2% •Positive operating leverage of 250 basis points on a year-over-year basis, excluding securities gains (losses), and as adjusted for the notable item in the second quarter of 2024 •Net revenue of $7,004 million, an increase of 2.0% year-over-year, including an increase of 4.6% in fee revenue •Noninterest expense decrease of 0.2% on a year-over-year basis, as adjusted for the notable item in the second quarter of 2024, and 1.2% on a linked quarter basis •Average total loans increased 1.0% on a year-over-year basis and decreased 0.1% on a linked quarter basis, reflecting the impact of loan portfolio sales during the second quarter of 2025. Total average loans and loans held for sale increased 1.7% on a year-over-year basis and 0.7% on a linked quarter basis. •CET1 capital ratio of 10.7% at June 30, 2025 | ||||||||||||||||
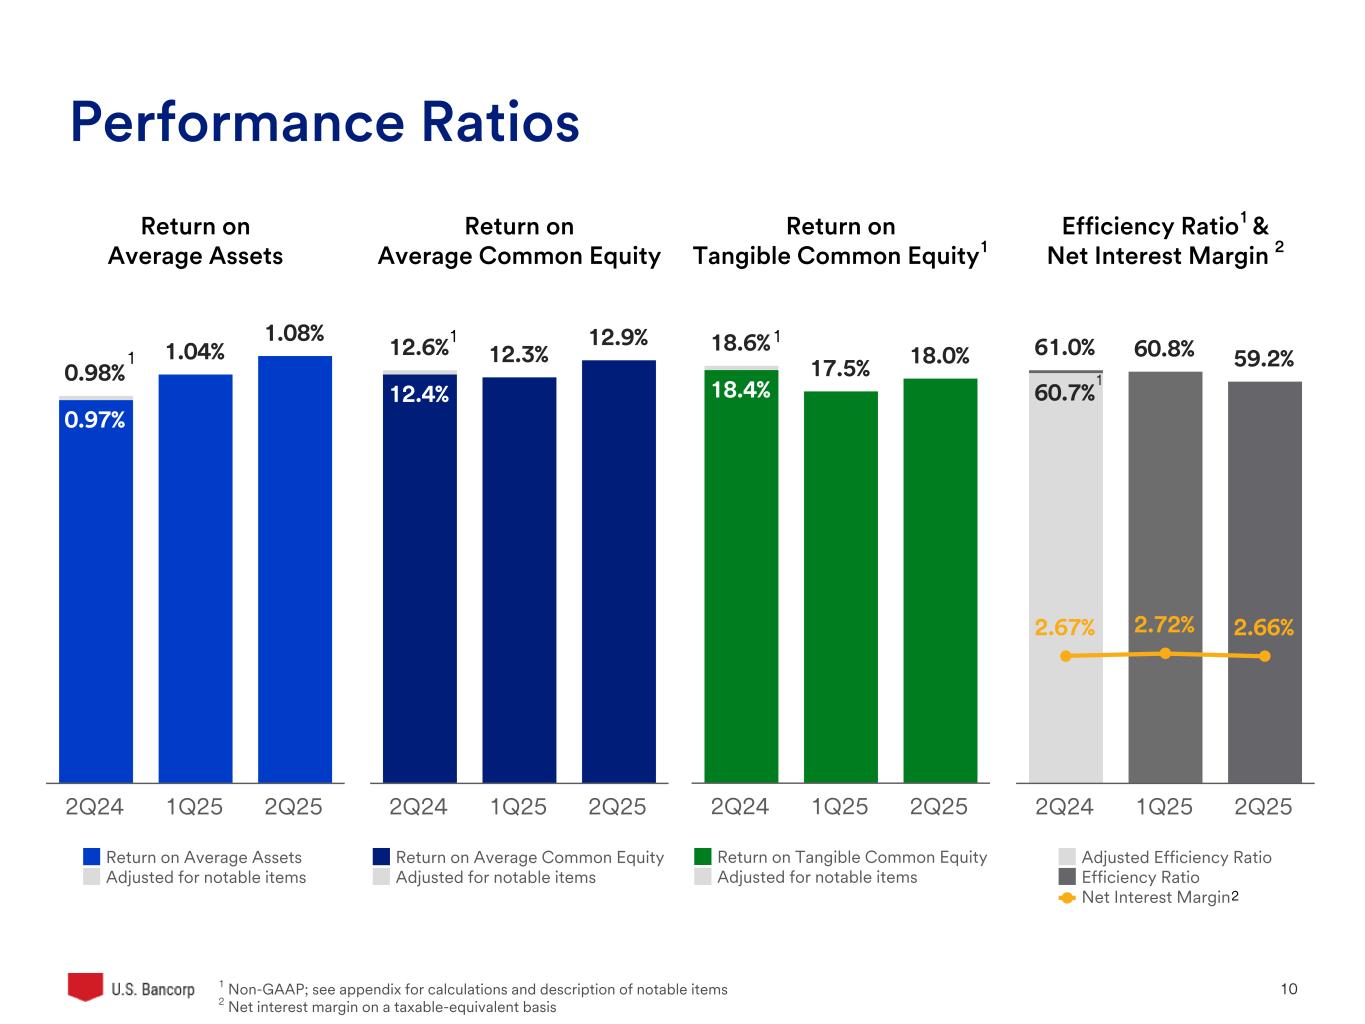
| Return on average assets (%) | 1.08 | 1.04 | .97 | |||||||||||||||||
| Return on average common equity (%) | 12.9 | 12.3 | 12.4 | |||||||||||||||||
| Return on tangible common equity (%) (a) | 18.0 | 17.5 | 18.4 | |||||||||||||||||
| Net interest margin (%) | 2.66 | 2.72 | 2.67 | |||||||||||||||||
| Efficiency ratio (%) (a) | 59.2 | 60.8 | 61.0 | |||||||||||||||||
| Tangible efficiency ratio (%) (a) | 57.5 | 59.1 | 59.0 | |||||||||||||||||
| INCOME STATEMENT (b) | 2Q25 | 1Q25 | 2Q24 | |||||||||||||||||
| Net interest income (taxable-equivalent basis) | $4,080 | $4,122 | $4,052 | |||||||||||||||||
| Noninterest income | $2,924 | $2,836 | $2,815 | |||||||||||||||||
| Noninterest expense | $4,181 | $4,232 | $4,214 | |||||||||||||||||
| Net income attributable to U.S. Bancorp | $1,815 | $1,709 | $1,603 | |||||||||||||||||
| Diluted earnings per common share | $1.11 | $1.03 | $.97 | |||||||||||||||||
| Dividends declared per common share | $.50 | $.50 | $.49 | |||||||||||||||||
| BALANCE SHEET (b) | 2Q25 | 1Q25 | 2Q24 | |||||||||||||||||
| Average total loans | $378,529 | $379,028 | $374,685 | |||||||||||||||||
| Average total deposits | $502,890 | $506,534 | $513,909 | |||||||||||||||||
| Net charge-off ratio (%) | .59 | .59 | .58 | |||||||||||||||||
| Book value per common share (period end) | $35.06 | $34.16 | $31.80 | |||||||||||||||||
| Basel III standardized CET1 (%) (c) | 10.7 | 10.8 | 10.3 | |||||||||||||||||
(a) See Non-GAAP Financial Measures reconciliation on page 18 (b) Dollars in millions, except per share data (c) CET1 = Common equity tier 1 capital ratio | ||||||||||||||||||||
| CEO Commentary | ||
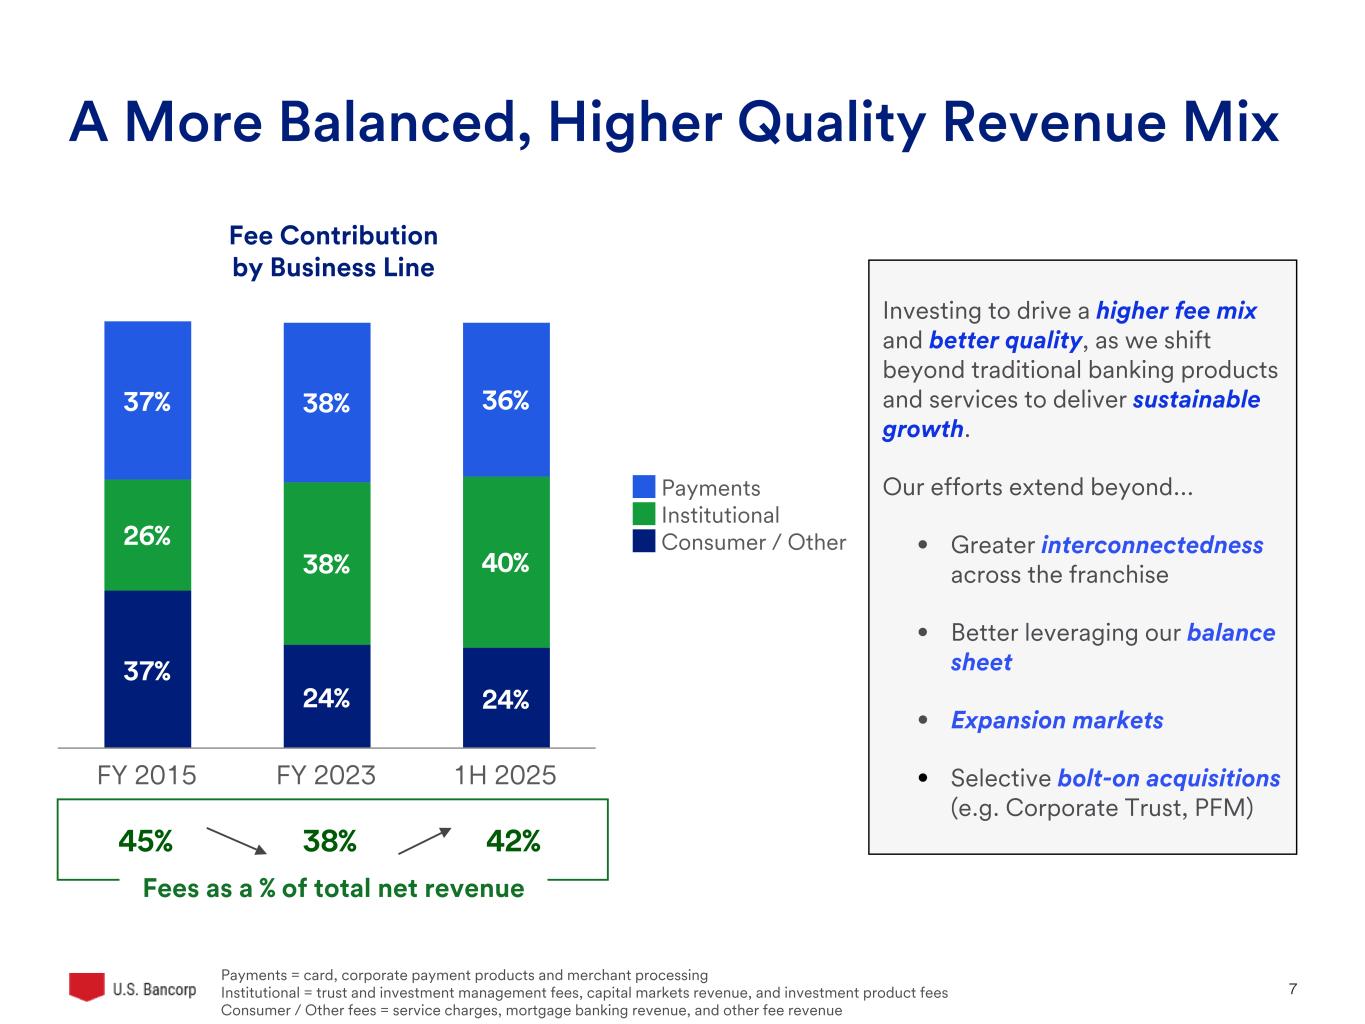
"In the second quarter we posted diluted earnings per share of $1.11, delivered a return on tangible common equity of 18% and posted a return on average assets of 1.08%. Importantly, year-over-year top-line revenue growth, coupled with our continued expense discipline, resulted in 250 basis points of positive operating leverage, as adjusted, and an efficiency ratio of 59.2% for the quarter. Our results showcased continued momentum across several of our diversified fee income businesses, which now represent approximately 42% of company-wide revenue. Our fee growth was led by payment services revenue, trust and investment management fees, and treasury management fees, which benefited from greater interconnectedness across the franchise and self-funded investments in our organic growth. Our asset quality metrics held steady this quarter with a net charge-off ratio of 59 basis points, and our continued capital levels remain strong.
As we look ahead, we remain committed to executing on our strategic priorities and making disciplined progress towards achieving our medium-term financial targets. Our diversified business mix and sound risk management culture remain strengths, especially at a time of economic volatility. On behalf of all my U.S. Bank colleagues, I would like to thank our clients and shareholders, for their loyalty and support of our exceptional company."
— Gunjan Kedia, President and CEO, U.S. Bancorp
| Business and Other Highlights | ||
Elavon Jumps Two Spots in 2025 Nilson Report Ratings
Elavon, the merchant services payment provider of U.S. Bank, has moved up two spots in the 2025 Nilson Report to become the fifth-largest U.S. merchant acquirer and the second-largest bank-owned merchant acquirer as ranked by Mastercard and Visa purchase volume. Elavon processes more than $576 billion in transactions worldwide annually and provides payment processing to eight of the top 10 airlines globally and seven of the top 10 largest U.S. hotel brands.
U.S. Bank Completes First Fully Digital Trade Finance Transaction
U.S. Bank has completed its first trade finance collection transaction using a fully digital process, marking a step forward in the bank’s efforts to modernize trade and working capital for clients. U.S. Bank is the first U.S. bank to utilize the blockchain-based WaveBL platform, which supports encrypted document transfers between trading partners and their banks. Previously, a transaction like this would have required a courier to physically transport documents across continents, often taking several days. By contrast, the digital process reduced that timeline to minutes – eliminating delays, enhancing security and compliance, and avoiding disruptions from external events.
U.S. Bank and Fiserv to Create Integrated Agent Card Issuance
U.S. Bank and Fiserv are working together to integrate U.S. Bank’s Elan Financial Services credit card program into Fiserv’s Credit Choice solution. This will allow financial institutions to deliver a digital-first, branded agent-bank credit card program for consumer and small business cardholders. The enhanced platform will allow users to manage both debit and credit card accounts within a single digital interface, improving user experience and operational efficiency. Financial institutions will benefit from streamlined onboarding and servicing tools, while the rollout of new capabilities is expected to continue through 2025 and into early 2026.
U.S. Bank Expands Embedded Payments Suite to Power Efficient, Secure Transactions
U.S. Bank recently unveiled an expanded suite of embedded payment solutions. U.S. Bank Embedded Payment Solutions offer businesses across industries a powerful way to integrate efficient, secure payment capabilities directly into websites, apps, enterprise systems and fintech integrations. Building on Elavon’s success with tech-led embedded merchant acquiring solutions, this expansion is another step in U.S. Bank’s ongoing work to integrate payment capabilities into the software and platforms businesses rely on daily while enabling faster, easier and secure financial transactions.
Investor contact: George Andersen, [email protected] | Media contact: Jeff Shelman, [email protected] | ||
 | U.S. Bancorp Second Quarter 2025 Results | ||||
| INCOME STATEMENT HIGHLIGHTS | ||||||||||||||||||||||||||||||||||||||
| ($ in millions, except per share data) | ADJUSTED (a) (b) | |||||||||||||||||||||||||||||||||||||
| Percent Change | Percent Change | |||||||||||||||||||||||||||||||||||||
| 2Q 2025 | 1Q 2025 | 2Q 2024 | 2Q25 vs 1Q25 | 2Q25 vs 2Q24 | 2Q 2025 | 1Q 2025 | 2Q 2024 | 2Q25 vs 1Q25 | 2Q25 vs 2Q24 | |||||||||||||||||||||||||||||
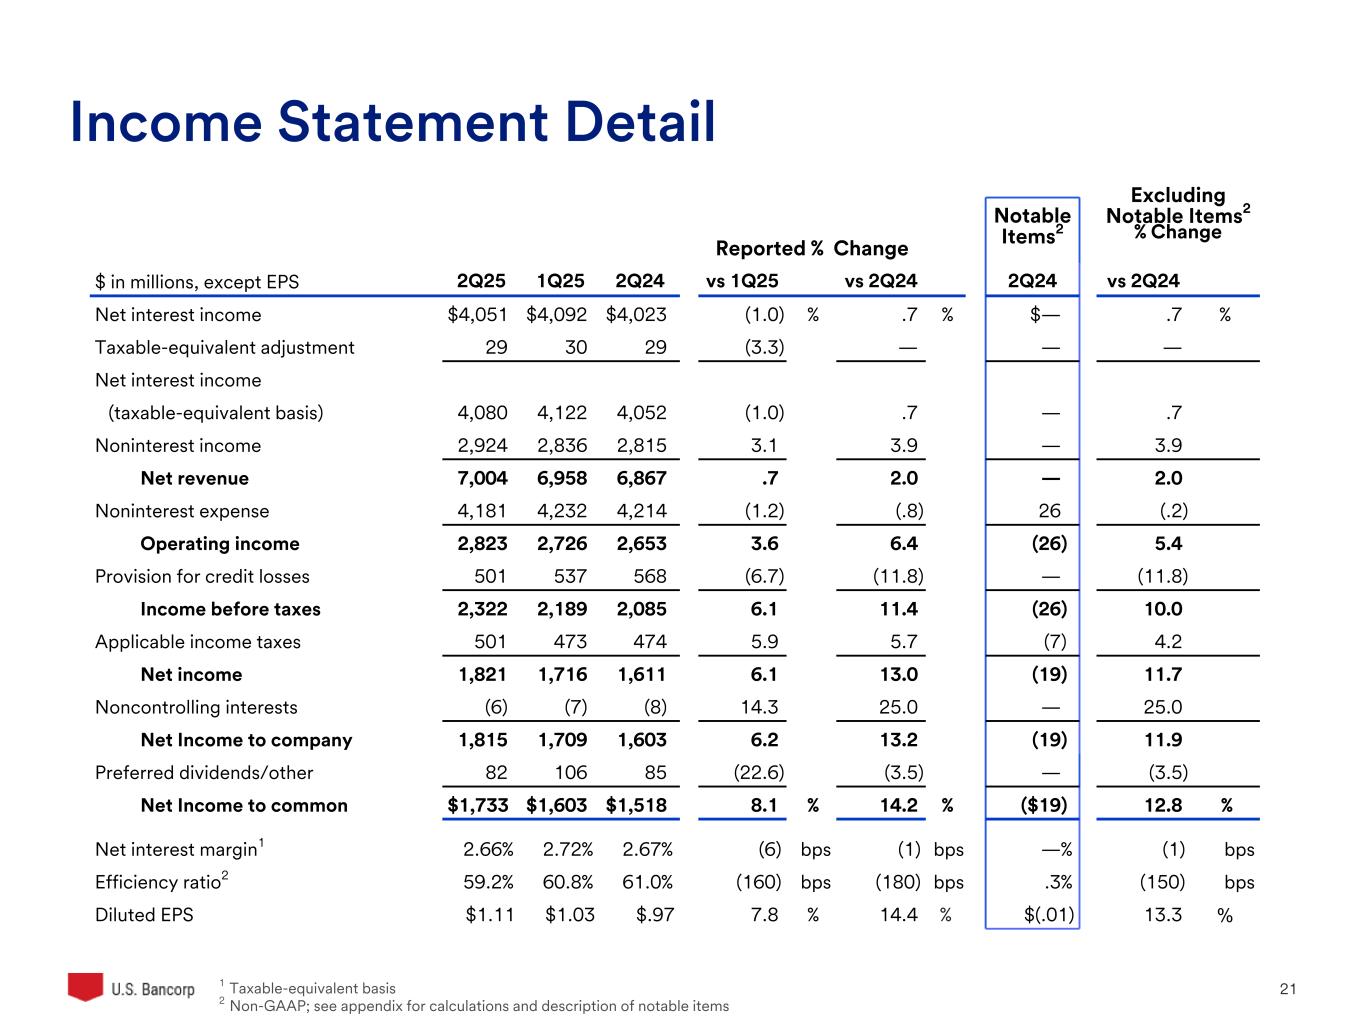
| Net interest income | $4,051 | $4,092 | $4,023 | (1.0) | .7 | $4,051 | $4,092 | $4,023 | (1.0) | .7 | ||||||||||||||||||||||||||||
| Taxable-equivalent adjustment | 29 | 30 | 29 | (3.3) | — | 29 | 30 | 29 | (3.3) | — | ||||||||||||||||||||||||||||
| Net interest income (taxable-equivalent basis) | 4,080 | 4,122 | 4,052 | (1.0) | .7 | 4,080 | 4,122 | 4,052 | (1.0) | .7 | ||||||||||||||||||||||||||||
| Noninterest income | 2,924 | 2,836 | 2,815 | 3.1 | 3.9 | 2,924 | 2,836 | 2,815 | 3.1 | 3.9 | ||||||||||||||||||||||||||||
| Total net revenue | 7,004 | 6,958 | 6,867 | .7 | 2.0 | 7,004 | 6,958 | 6,867 | .7 | 2.0 | ||||||||||||||||||||||||||||
| Noninterest expense | 4,181 | 4,232 | 4,214 | (1.2) | (.8) | 4,181 | 4,232 | 4,188 | (1.2) | (.2) | ||||||||||||||||||||||||||||
| Income before provision and income taxes | 2,823 | 2,726 | 2,653 | 3.6 | 6.4 | 2,823 | 2,726 | 2,679 | 3.6 | 5.4 | ||||||||||||||||||||||||||||
| Provision for credit losses | 501 | 537 | 568 | (6.7) | (11.8) | 501 | 537 | 568 | (6.7) | (11.8) | ||||||||||||||||||||||||||||
| Income before taxes | 2,322 | 2,189 | 2,085 | 6.1 | 11.4 | 2,322 | 2,189 | 2,111 | 6.1 | 10.0 | ||||||||||||||||||||||||||||
| Income taxes and taxable-equivalent adjustment | 501 | 473 | 474 | 5.9 | 5.7 | 501 | 473 | 481 | 5.9 | 4.2 | ||||||||||||||||||||||||||||
| Net income | 1,821 | 1,716 | 1,611 | 6.1 | 13.0 | 1,821 | 1,716 | 1,630 | 6.1 | 11.7 | ||||||||||||||||||||||||||||
| Net (income) loss attributable to noncontrolling interests | (6) | (7) | (8) | 14.3 | 25.0 | (6) | (7) | (8) | 14.3 | 25.0 | ||||||||||||||||||||||||||||
| Net income attributable to U.S. Bancorp | $1,815 | $1,709 | $1,603 | 6.2 | 13.2 | $1,815 | $1,709 | $1,622 | 6.2 | 11.9 | ||||||||||||||||||||||||||||
| Net income applicable to U.S. Bancorp common shareholders | $1,733 | $1,603 | $1,518 | 8.1 | 14.2 | $1,733 | $1,603 | $1,537 | 8.1 | 12.8 | ||||||||||||||||||||||||||||
| Diluted earnings per common share | $1.11 | $1.03 | $.97 | 7.8 | 14.4 | $1.11 | $1.03 | $.98 | 7.8 | 13.3 | ||||||||||||||||||||||||||||
(a)2Q24 excludes a $26 million ($19 million net-of-tax) notable item for an increase in the FDIC special assessment.
(b)See Non-GAAP Financial Measures reconciliation beginning on page 18.
| INCOME STATEMENT HIGHLIGHTS | ||||||||||||||||||||||||||
| ($ in millions, except per share data) | ADJUSTED (c) (d) | |||||||||||||||||||||||||
| YTD 2025 | YTD 2024 | Percent Change | YTD 2025 | YTD 2024 | Percent Change | |||||||||||||||||||||
| Net interest income | $8,143 | $8,008 | 1.7 | $8,143 | $8,008 | 1.7 | ||||||||||||||||||||
| Taxable-equivalent adjustment | 59 | 59 | — | 59 | 59 | — | ||||||||||||||||||||
| Net interest income (taxable-equivalent basis) | 8,202 | 8,067 | 1.7 | 8,202 | 8,067 | 1.7 | ||||||||||||||||||||
| Noninterest income | 5,760 | 5,515 | 4.4 | 5,760 | 5,515 | 4.4 | ||||||||||||||||||||
| Total net revenue | 13,962 | 13,582 | 2.8 | 13,962 | 13,582 | 2.8 | ||||||||||||||||||||
| Noninterest expense | 8,413 | 8,673 | (3.0) | 8,413 | 8,382 | .4 | ||||||||||||||||||||
| Income before provision and income taxes | 5,549 | 4,909 | 13.0 | 5,549 | 5,200 | 6.7 | ||||||||||||||||||||
| Provision for credit losses | 1,038 | 1,121 | (7.4) | 1,038 | 1,121 | (7.4) | ||||||||||||||||||||
| Income before taxes | 4,511 | 3,788 | 19.1 | 4,511 | 4,079 | 10.6 | ||||||||||||||||||||
| Income taxes and taxable-equivalent adjustment | 974 | 851 | 14.5 | 974 | 924 | 5.4 | ||||||||||||||||||||
| Net income | 3,537 | 2,937 | 20.4 | 3,537 | 3,155 | 12.1 | ||||||||||||||||||||
| Net (income) loss attributable to noncontrolling interests | (13) | (15) | 13.3 | (13) | (15) | 13.3 | ||||||||||||||||||||
| Net income attributable to U.S. Bancorp | $3,524 | $2,922 | 20.6 | $3,524 | $3,140 | 12.2 | ||||||||||||||||||||
| Net income applicable to U.S. Bancorp common shareholders | $3,336 | $2,727 | 22.3 | $3,336 | $2,944 | 13.3 | ||||||||||||||||||||
| Diluted earnings per common share | $2.14 | $1.75 | 22.3 | $2.14 | $1.89 | 13.2 | ||||||||||||||||||||
(c)2024 excludes $291 million ($218 million net-of-tax) of notable items including: $155 million of merger and integration-related charges and $136 million for the increase in the FDIC special assessment.
(d)See Non-GAAP Financial Measures reconciliation beginning on page 18.
2
| U.S. Bancorp Second Quarter 2025 Results | ||||
Net income attributable to U.S. Bancorp was $1,815 million for the second quarter of 2025, $212 million higher than the $1,603 million for the second quarter of 2024 and $106 million higher than the $1,709 million for the first quarter of 2025. Diluted earnings per common share was $1.11 in the second quarter of 2025, compared with $0.97 in the second quarter of 2024 and $1.03 in the first quarter of 2025. The second quarter of 2024 included a notable item of $19 million or ($0.01) per diluted common share, net-of-tax. Excluding the impact of the prior year quarter notable item, net income attributable to U.S. Bancorp for the second quarter of 2025 was $193 million higher than the second quarter of 2024.
The increase in net income attributable to U.S. Bancorp year-over-year was primarily due to higher total net revenue, lower noninterest expense and lower provision for credit losses. Excluding the notable item in the prior year quarter, net income attributable to U.S. Bancorp in the second quarter of 2025 increased 11.9 percent compared with the second quarter of 2024. Net interest income increased 0.7 percent on a year-over-year taxable-equivalent basis, primarily due to the impact of fixed asset repricing, loan mix, and lower rates paid on interest-bearing deposits, partially offset by lower noninterest-bearing deposit balances. The net interest margin decreased to 2.66 percent in the second quarter of 2025 from 2.67 percent in the second quarter of 2024, driven by the factors described above. Noninterest income increased 3.9 percent compared with a year ago driven by higher payment services revenue, trust and investment management fees, and other revenue, partially offset by lower mortgage banking revenue. Noninterest expense decreased 0.8 percent primarily due to lower compensation and employee benefits and other intangible expense, partially offset by higher technology and communications expense. Excluding the notable item in the prior year quarter, noninterest expense in the second quarter of 2025 decreased 0.2 percent compared with the second quarter of 2024. The provision for credit losses decreased $67 million (11.8 percent) compared with the second quarter of 2024, reflecting the impact of loan portfolio sales during the second quarter of 2025 and improved credit quality.
Net income attributable to U.S. Bancorp increased on a linked quarter basis primarily due to an increase in total net revenue, lower noninterest expense and lower provision for credit losses. Net interest income decreased 1.0 percent on a linked quarter taxable-equivalent basis primarily driven by competitive deposit pricing pressure and rotation into higher rate products. The net interest margin decreased to 2.66 percent in the second quarter of 2025 from 2.72 percent in the first quarter of 2025, driven by larger average assets due to the timing of loan sales in the quarter in addition to the factors mentioned above. Noninterest income in the second quarter of 2025 increased 3.1 percent from the first quarter of 2025 primarily due to higher payment services revenue, trust and investment management fees, and service charges, partially offset by net securities losses in the second quarter of 2025. Noninterest expense in the second quarter of 2025 decreased by 1.2 percent from the first quarter of 2025 primarily due to lower compensation and employee benefits expense, and marketing and business development expense. The provision for credit losses decreased $36 million (6.7 percent) compared with the first quarter of 2025, reflecting the impact of loan portfolio sales during the second quarter of 2025 and improved credit quality, partially offset by higher commercial real estate net charge-offs.
3
| U.S. Bancorp Second Quarter 2025 Results | ||||
| NET INTEREST INCOME | ||||||||||||||||||||||||||||||||||||||||||||||||||
| (Taxable-equivalent basis; $ in millions) | Change | |||||||||||||||||||||||||||||||||||||||||||||||||
| 2Q 2025 | 1Q 2025 | 2Q 2024 | 2Q25 vs 1Q25 | 2Q25 vs 2Q24 | YTD 2025 | YTD 2024 | Change | |||||||||||||||||||||||||||||||||||||||||||
| Components of net interest income | ||||||||||||||||||||||||||||||||||||||||||||||||||
| Income on earning assets | $ | 7,633 | $ | 7,546 | $ | 8,015 | $ | 87 | $ | (382) | $ | 15,179 | $ | 15,810 | $ | (631) | ||||||||||||||||||||||||||||||||||
| Expense on interest-bearing liabilities | 3,553 | 3,424 | 3,963 | 129 | (410) | 6,977 | 7,743 | (766) | ||||||||||||||||||||||||||||||||||||||||||
| Net interest income | $ | 4,080 | $ | 4,122 | $ | 4,052 | $ | (42) | $ | 28 | $ | 8,202 | $ | 8,067 | $ | 135 | ||||||||||||||||||||||||||||||||||
| Average yields and rates paid | ||||||||||||||||||||||||||||||||||||||||||||||||||
| Earning assets yield | 4.99 | % | 4.99 | % | 5.29 | % | — | % | (.30) | % | 4.99 | % | 5.27 | % | (.28) | % | ||||||||||||||||||||||||||||||||||
| Rate paid on interest-bearing liabilities | 2.80 | 2.75 | 3.18 | .05 | (.38) | 2.78 | 3.15 | (.37) | ||||||||||||||||||||||||||||||||||||||||||
| Gross interest margin | 2.19 | % | 2.24 | % | 2.11 | % | (.05) | % | .08 | % | 2.21 | % | 2.12 | % | .09 | % | ||||||||||||||||||||||||||||||||||
| Net interest margin | 2.66 | % | 2.72 | % | 2.67 | % | (.06) | % | (.01) | % | 2.69 | % | 2.68 | % | .01 | % | ||||||||||||||||||||||||||||||||||
| Average balances | ||||||||||||||||||||||||||||||||||||||||||||||||||
| Investment securities (a) | $ | 172,841 | $ | 171,178 | $ | 167,020 | $ | 1,663 | $ | 5,821 | $ | 172,014 | $ | 164,128 | $ | 7,886 | ||||||||||||||||||||||||||||||||||
| Loans held for sale | 4,843 | 1,823 | 2,382 | 3,020 | 2,461 | 3,341 | 2,192 | 1,149 | ||||||||||||||||||||||||||||||||||||||||||
| Loans | 378,529 | 379,028 | 374,685 | (499) | 3,844 | 378,777 | 372,878 | 5,899 | ||||||||||||||||||||||||||||||||||||||||||
| Interest-bearing deposits with banks | 41,550 | 43,735 | 53,056 | (2,185) | (11,506) | 42,637 | 51,979 | (9,342) | ||||||||||||||||||||||||||||||||||||||||||
| Other earning assets | 15,579 | 14,466 | 11,749 | 1,113 | 3,830 | 15,025 | 11,336 | 3,689 | ||||||||||||||||||||||||||||||||||||||||||
| Earning assets | 613,342 | 610,230 | 608,892 | 3,112 | 4,450 | 611,794 | 602,513 | 9,281 | ||||||||||||||||||||||||||||||||||||||||||
| Interest-bearing liabilities | 508,918 | 504,023 | 500,464 | 4,895 | 8,454 | 506,484 | 493,908 | 12,576 | ||||||||||||||||||||||||||||||||||||||||||
| (a) Excludes unrealized gain (loss) | ||||||||||||||||||||||||||||||||||||||||||||||||||
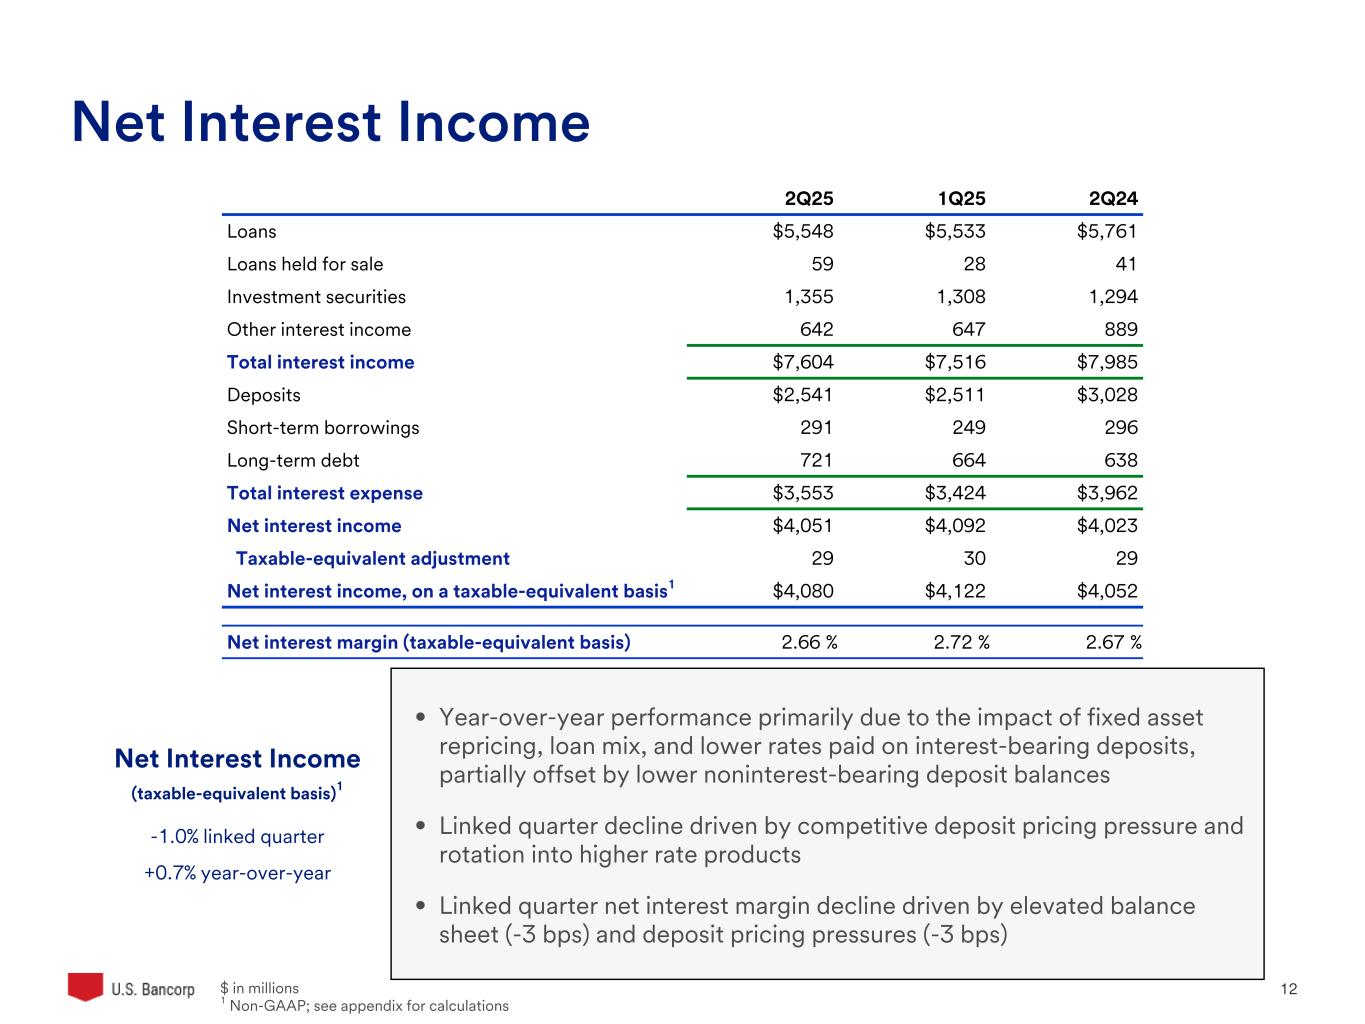
Net interest income on a taxable-equivalent basis in the second quarter of 2025 was $4,080 million, an increase of $28 million (0.7 percent) from the second quarter of 2024. The increase was primarily due to the impact of fixed asset repricing, loan mix, and lower rates paid on interest-bearing deposits, partially offset by lower noninterest-bearing deposit balances. Average earning assets were $4.5 billion (0.7 percent) higher than the second quarter of 2024, reflecting increases of $5.8 billion (3.5 percent) in average investment securities due to balance sheet repositioning, $6.3 billion (1.7 percent) in total average loans and loans held for sale, and $3.8 billion (32.6 percent) in average other earning assets, partially offset by a decrease of $11.5 billion (21.7 percent) in average interest-bearing deposits with banks. Second quarter of 2025 average loans held for sale reflected the impact of a portfolio of residential mortgages transferred to held for sale and subsequently sold during the period.
Net interest income on a taxable-equivalent basis decreased $42 million (1.0 percent) on a linked quarter basis primarily driven by competitive deposit pricing pressure and rotation into higher rate products. Average earning assets were $3.1 billion (0.5 percent) higher on a linked quarter basis, reflecting increases of $1.7 billion (1.0 percent) in average investment securities due to balance sheet repositioning, $2.5 billion (0.7 percent) in total average loans and loans held for sale, and $1.1 billion (7.7 percent) in other earning assets, partially offset by a decrease of $2.2 billion (5.0 percent) in average interest-bearing deposits with banks. Second quarter of 2025 average loans held for sale reflected the impact of a portfolio of residential mortgages transferred to held for sale and subsequently sold during the period.
The net interest margin in the second quarter of 2025 was 2.66 percent, compared with 2.67 percent in the second quarter of 2024 and 2.72 percent in the first quarter of 2025. The decrease in the net interest margin from the prior year and prior quarter was driven by the factors mentioned above.
4
| U.S. Bancorp Second Quarter 2025 Results | ||||
| AVERAGE LOANS | |||||||||||||||||||||||||||||
| ($ in millions) | Percent Change | ||||||||||||||||||||||||||||
| 2Q 2025 | 1Q 2025 | 2Q 2024 | 2Q25 vs 1Q25 | 2Q25 vs 2Q24 | YTD 2025 | YTD 2024 | Percent Change | ||||||||||||||||||||||
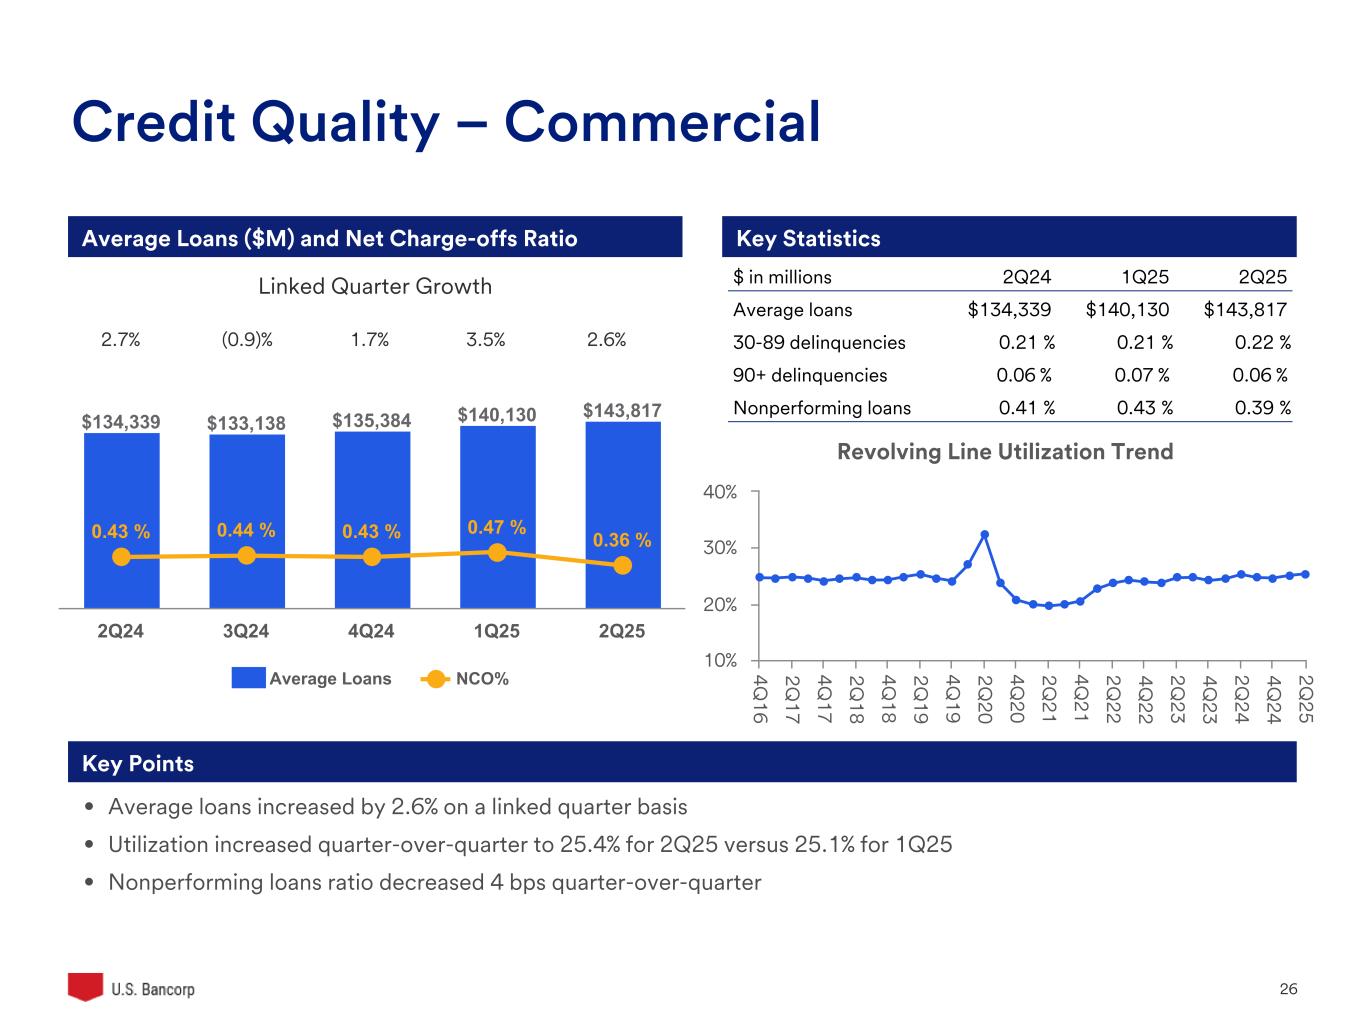
| Commercial | $139,606 | $135,931 | $130,162 | 2.7 | 7.3 | $137,778 | $128,382 | 7.3 | |||||||||||||||||||||
| Lease financing | 4,211 | 4,199 | 4,177 | .3 | .8 | 4,206 | 4,171 | .8 | |||||||||||||||||||||
| Total commercial | 143,817 | 140,130 | 134,339 | 2.6 | 7.1 | 141,984 | 132,553 | 7.1 | |||||||||||||||||||||
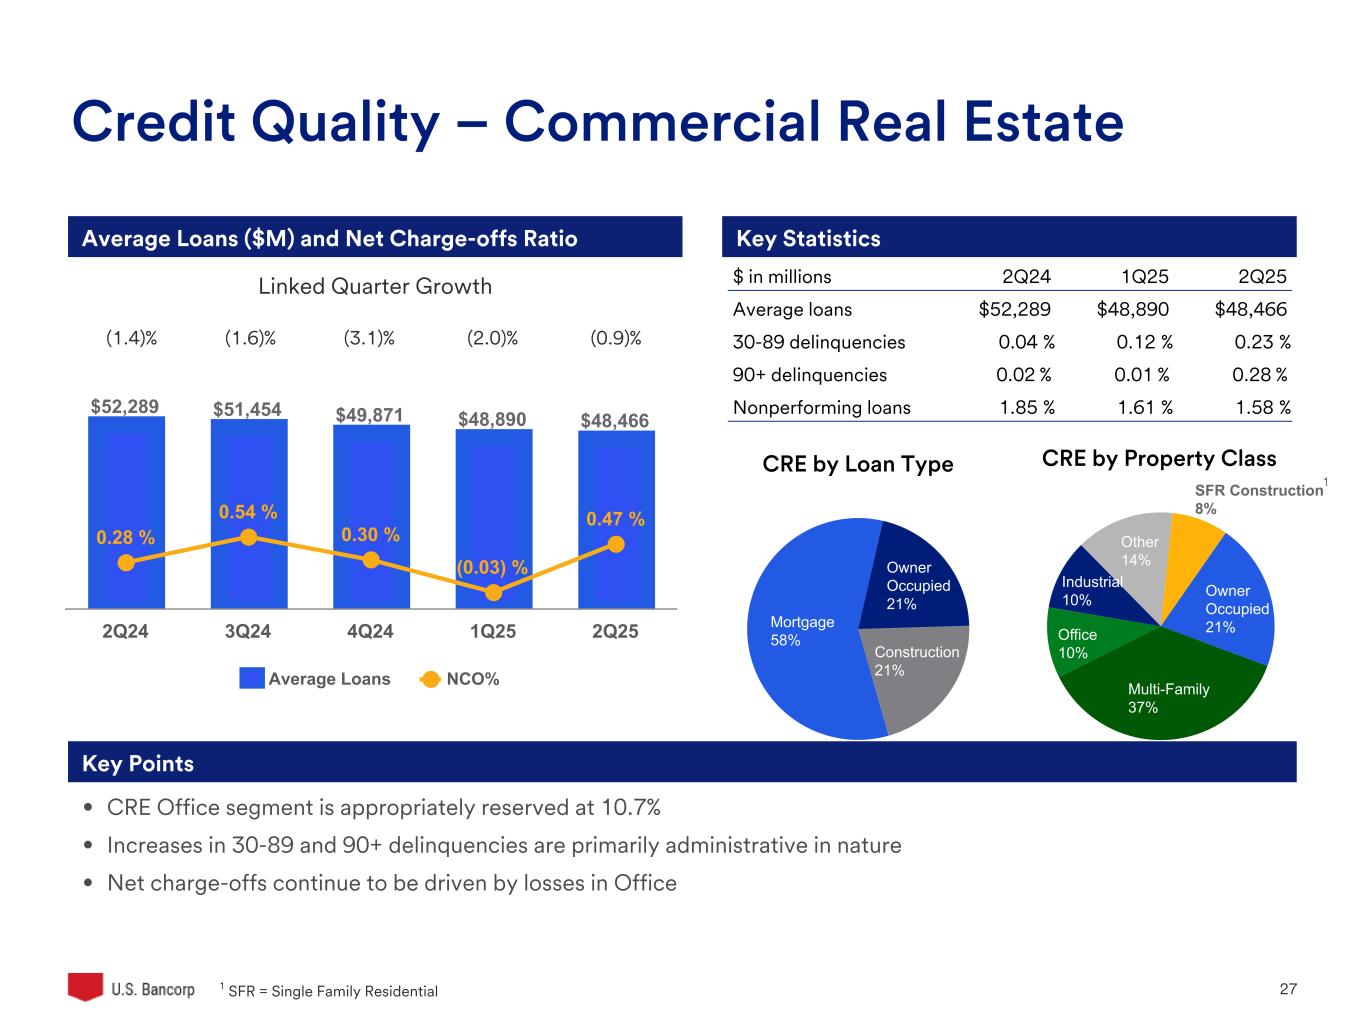
| Commercial mortgages | 38,194 | 38,624 | 40,871 | (1.1) | (6.5) | 38,408 | 41,208 | (6.8) | |||||||||||||||||||||
| Construction and development | 10,272 | 10,266 | 11,418 | .1 | (10.0) | 10,269 | 11,455 | (10.4) | |||||||||||||||||||||
| Total commercial real estate | 48,466 | 48,890 | 52,289 | (.9) | (7.3) | 48,677 | 52,663 | (7.6) | |||||||||||||||||||||
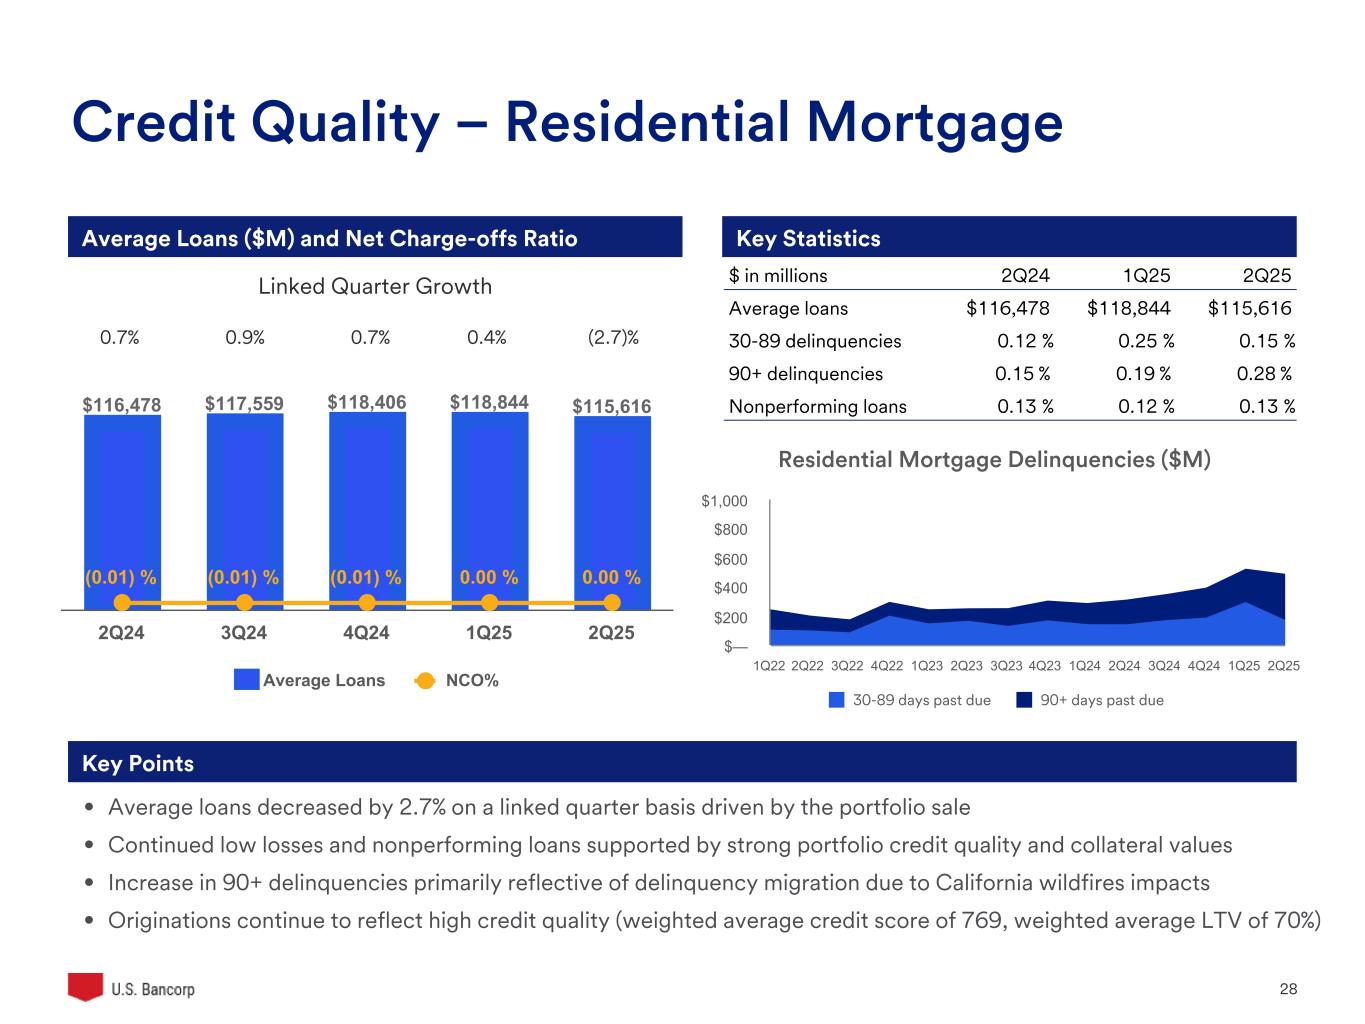
| Residential mortgages | 115,616 | 118,844 | 116,478 | (2.7) | (.7) | 117,221 | 116,059 | 1.0 | |||||||||||||||||||||
| Credit card | 29,588 | 29,404 | 28,349 | .6 | 4.4 | 29,497 | 28,145 | 4.8 | |||||||||||||||||||||
| Retail leasing | 3,869 | 3,990 | 4,185 | (3.0) | (7.6) | 3,929 | 4,134 | (5.0) | |||||||||||||||||||||
| Home equity and second mortgages | 13,678 | 13,542 | 13,053 | 1.0 | 4.8 | 13,610 | 13,018 | 4.5 | |||||||||||||||||||||
| Other | 23,495 | 24,228 | 25,992 | (3.0) | (9.6) | 23,859 | 26,306 | (9.3) | |||||||||||||||||||||
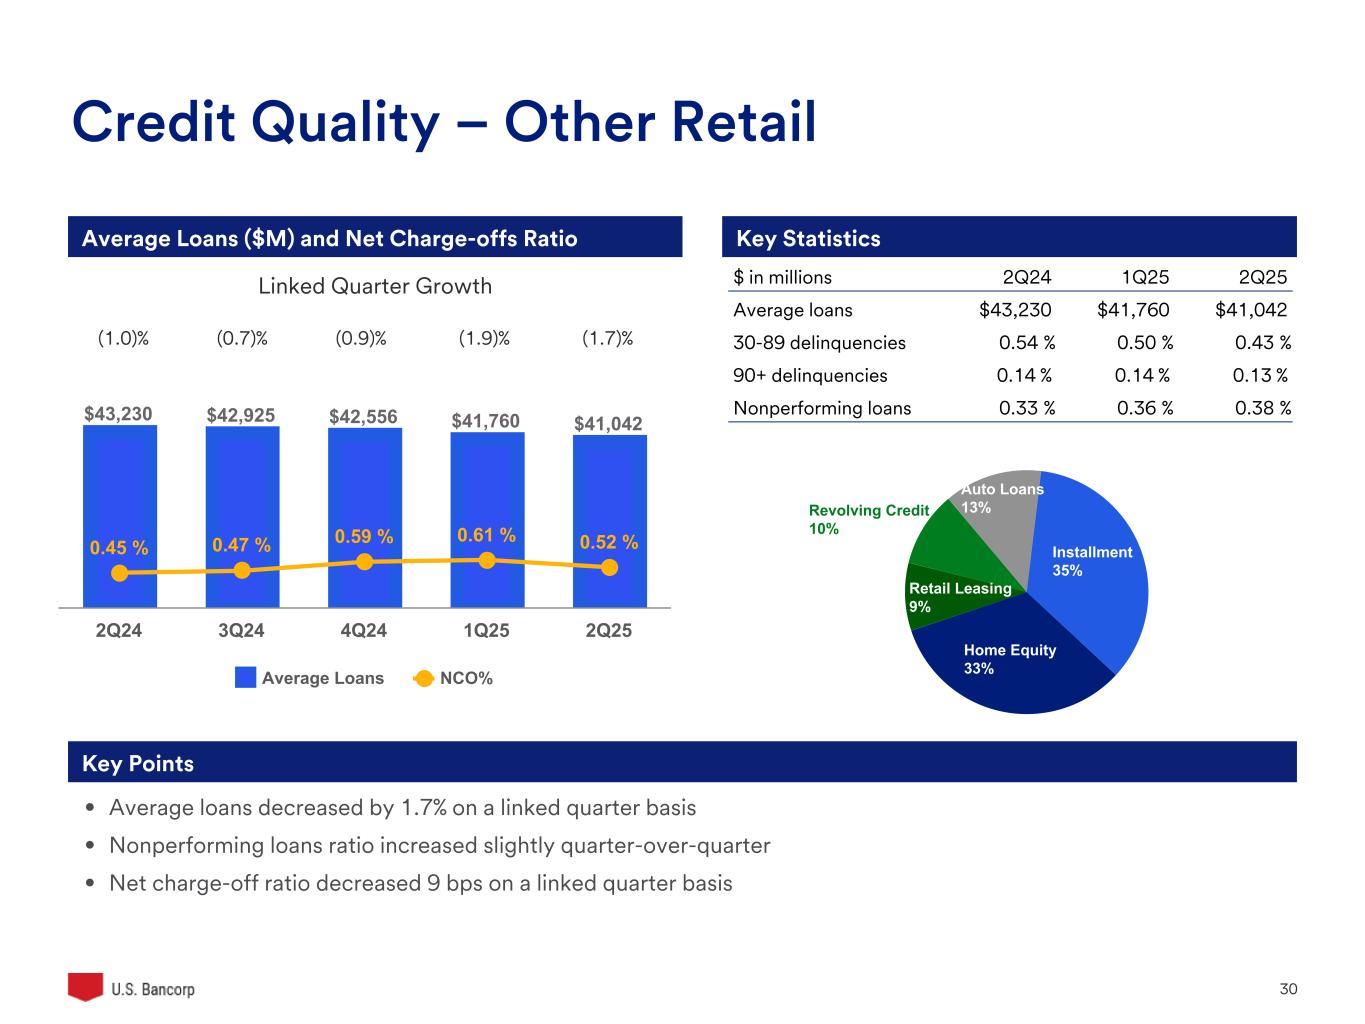
| Total other retail | 41,042 | 41,760 | 43,230 | (1.7) | (5.1) | 41,398 | 43,458 | (4.7) | |||||||||||||||||||||
| Total loans | $378,529 | $379,028 | $374,685 | (.1) | 1.0 | $378,777 | $372,878 | 1.6 | |||||||||||||||||||||
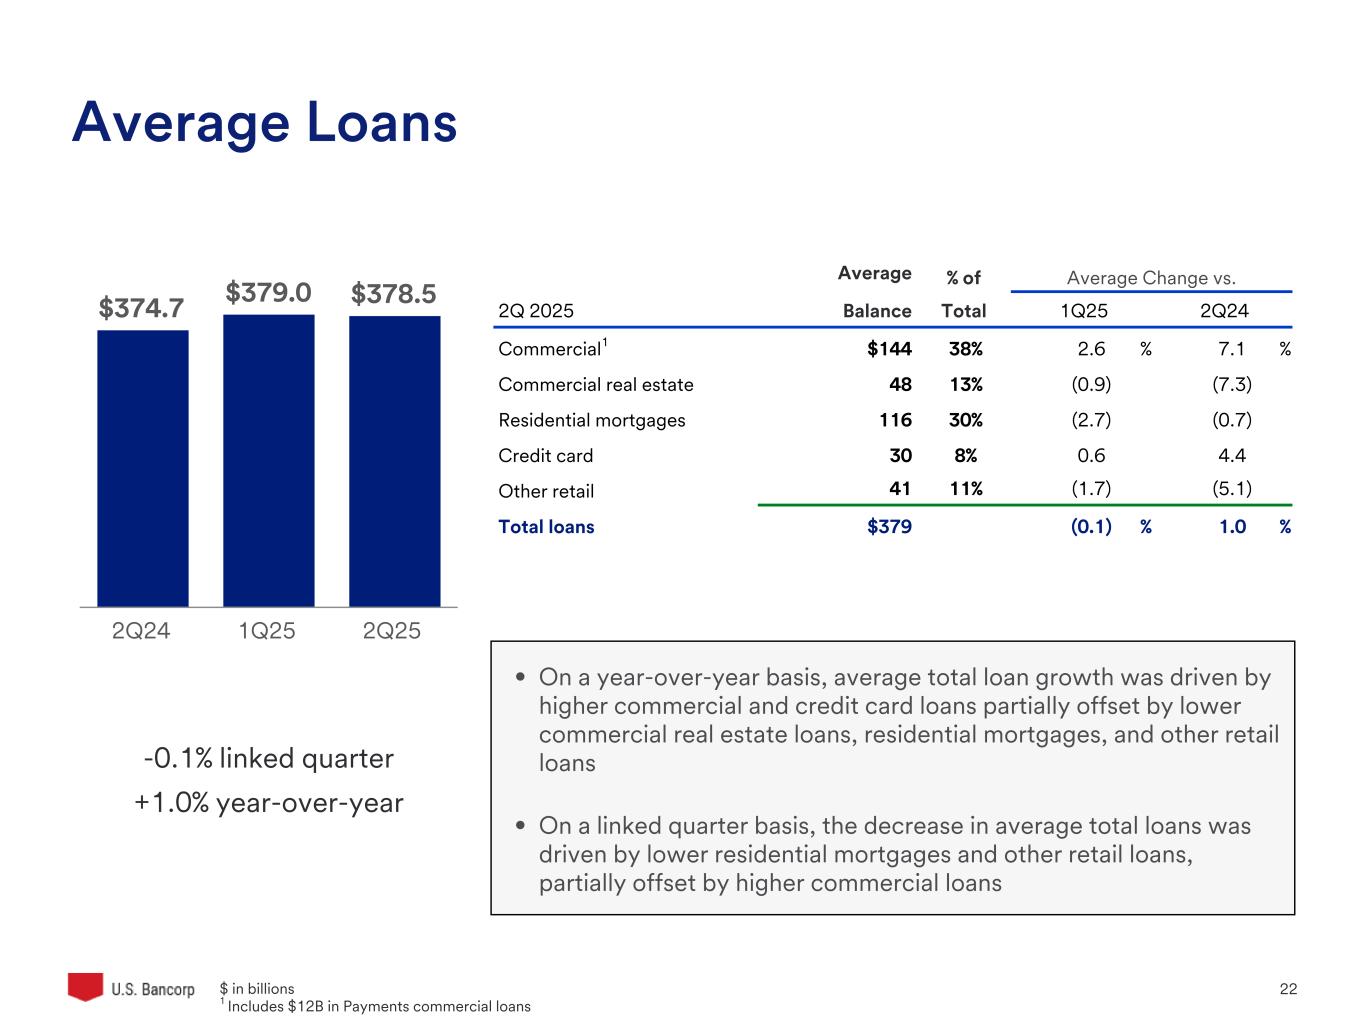
Average total loans for the second quarter of 2025 were $3.8 billion (1.0 percent) higher than the second quarter of 2024. The increase was primarily due to higher total commercial loans (7.1 percent) and credit card loans (4.4 percent), partially offset by lower total commercial real estate loans (7.3 percent), residential mortgages (0.7 percent), and total other retail loans (5.1 percent). The increase in commercial loans was primarily due to growth in loans to financial institutions. The increase in credit card loans was primarily driven by customer account growth and higher spend volume. The decrease in commercial real estate loans was primarily due to loan workout activities and payoffs. The decrease in residential mortgages and other retail loans was primarily due to portfolio sales in the second quarter of 2025.
Average total loans were $499 million (0.1 percent) lower than the first quarter of 2025. The decrease was primarily due to lower residential mortgages (2.7 percent) and total other retail loans (1.7 percent), partially offset by higher total commercial loans (2.6 percent). Linked quarter changes were primarily driven by similar factors as the year-over-year changes.
5
| U.S. Bancorp Second Quarter 2025 Results | ||||
| AVERAGE DEPOSITS | |||||||||||||||||||||||||||||
| ($ in millions) | Percent Change | ||||||||||||||||||||||||||||
| 2Q 2025 | 1Q 2025 | 2Q 2024 | 2Q25 vs 1Q25 | 2Q25 vs 2Q24 | YTD 2025 | YTD 2024 | Percent Change | ||||||||||||||||||||||
| Noninterest-bearing deposits | $79,117 | $79,696 | $83,418 | (.7) | (5.2) | $79,405 | $84,102 | (5.6) | |||||||||||||||||||||
| Interest-bearing savings deposits | |||||||||||||||||||||||||||||
| Interest checking | 131,599 | 125,651 | 125,709 | 4.7 | 4.7 | 128,642 | 125,360 | 2.6 | |||||||||||||||||||||
| Money market savings | 177,087 | 195,442 | 208,386 | (9.4) | (15.0) | 186,213 | 202,444 | (8.0) | |||||||||||||||||||||
| Savings accounts | 58,171 | 50,271 | 38,855 | 15.7 | 49.7 | 54,243 | 40,250 | 34.8 | |||||||||||||||||||||
| Total savings deposits | 366,857 | 371,364 | 372,950 | (1.2) | (1.6) | 369,098 | 368,054 | .3 | |||||||||||||||||||||
| Time deposits | 56,916 | 55,474 | 57,541 | 2.6 | (1.1) | 56,199 | 56,329 | (.2) | |||||||||||||||||||||
| Total interest-bearing deposits | 423,773 | 426,838 | 430,491 | (.7) | (1.6) | 425,297 | 424,383 | .2 | |||||||||||||||||||||
| Total deposits | $502,890 | $506,534 | $513,909 | (.7) | (2.1) | $504,702 | $508,485 | (.7) | |||||||||||||||||||||
Average total deposits for the second quarter of 2025 were $11.0 billion (2.1 percent) lower than the second quarter of 2024. Average noninterest-bearing deposits decreased $4.3 billion (5.2 percent) reflecting balance decreases within Wealth, Corporate, Commercial and Institutional Banking and Consumer and Business Banking. Average total savings deposits decreased $6.1 billion (1.6 percent) driven by decreases within Wealth, Corporate, Commercial and Institutional Banking, partially offset by increases in Consumer and Business Banking. Average time deposits were $625 million (1.1 percent) lower than the second quarter of 2024 mainly within Wealth, Corporate, Commercial and Institutional Banking. Changes in time deposits are primarily related to those deposits managed as an alternative to other funding sources, based largely on relative pricing and liquidity characteristics.
Average total deposits decreased $3.6 billion (0.7 percent) from the first quarter of 2025. Average noninterest-bearing deposits decreased $579 million (0.7 percent) reflecting balance decreases within Wealth, Corporate, Commercial and Institutional Banking. Average total savings deposits decreased $4.5 billion (1.2 percent) driven by decreases within Wealth, Corporate, Commercial and Institutional Banking, partially offset by increases in Consumer and Business Banking. Average time deposits were $1.4 billion (2.6 percent) higher on a linked quarter basis due to increases within Consumer and Business Banking, partially offset by decreases within Wealth, Corporate, Commercial and Institutional Banking.
6
| U.S. Bancorp Second Quarter 2025 Results | ||||
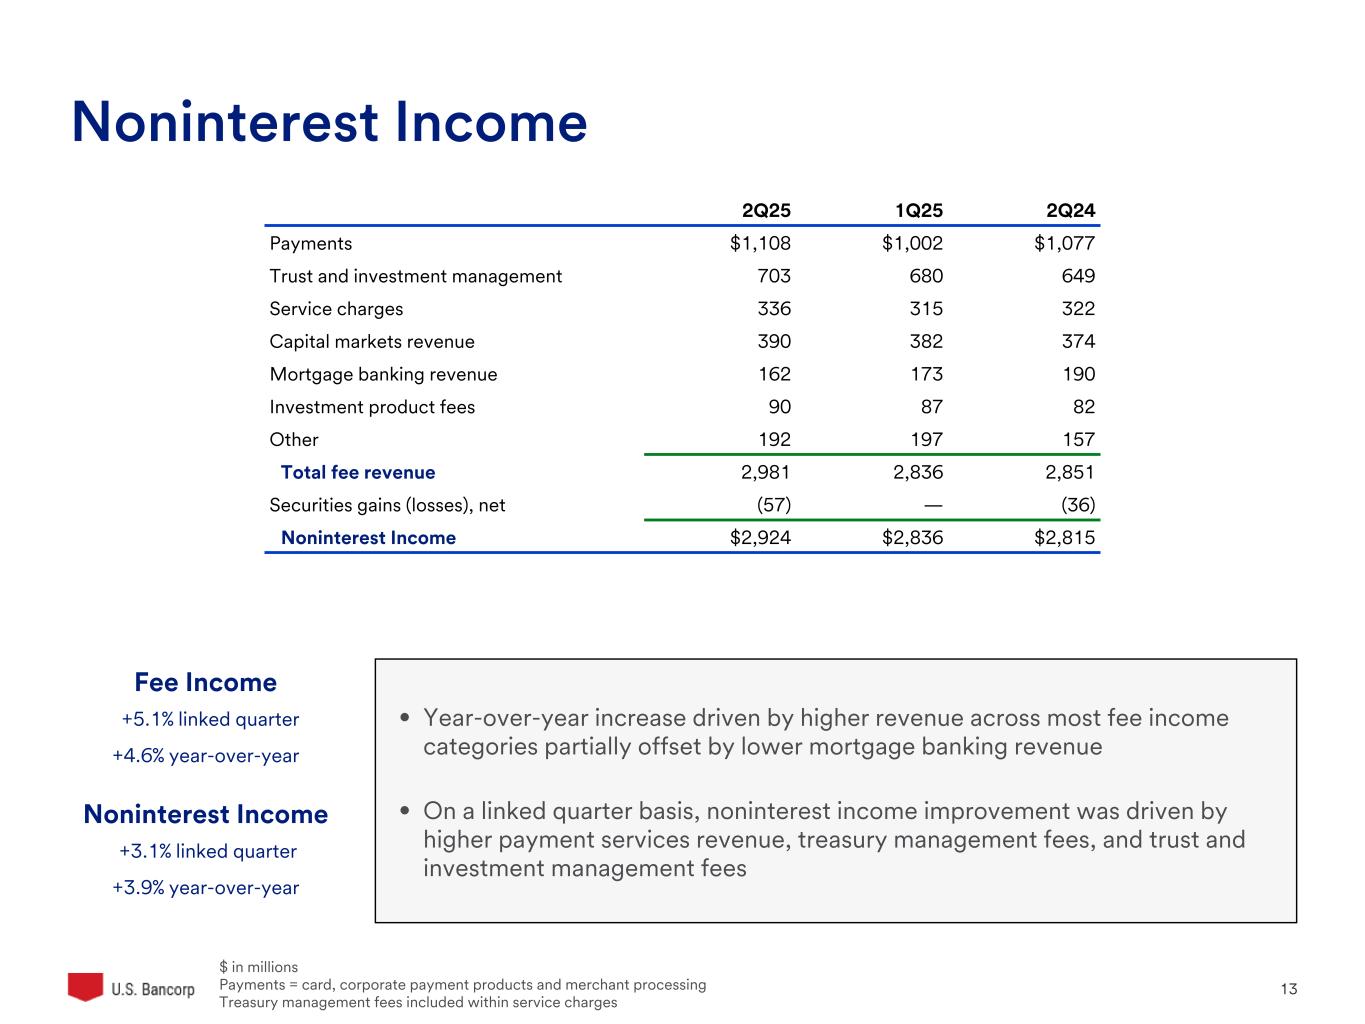
| NONINTEREST INCOME | |||||||||||||||||||||||||||||
| ($ in millions) | Percent Change | ||||||||||||||||||||||||||||
| 2Q 2025 | 1Q 2025 | 2Q 2024 | 2Q25 vs 1Q25 | 2Q25 vs 2Q24 | YTD 2025 | YTD 2024 | Percent Change | ||||||||||||||||||||||
| Card revenue | $442 | $398 | $428 | 11.1 | 3.3 | $840 | $820 | 2.4 | |||||||||||||||||||||
| Corporate payment products revenue | 192 | 189 | 195 | 1.6 | (1.5) | 381 | 379 | .5 | |||||||||||||||||||||
| Merchant processing services | 474 | 415 | 454 | 14.2 | 4.4 | 889 | 855 | 4.0 | |||||||||||||||||||||
| Trust and investment management fees | 703 | 680 | 649 | 3.4 | 8.3 | 1,383 | 1,290 | 7.2 | |||||||||||||||||||||
| Service charges | 336 | 315 | 322 | 6.7 | 4.3 | 651 | 637 | 2.2 | |||||||||||||||||||||
| Capital markets revenue | 390 | 382 | 374 | 2.1 | 4.3 | 772 | 762 | 1.3 | |||||||||||||||||||||
| Mortgage banking revenue | 162 | 173 | 190 | (6.4) | (14.7) | 335 | 356 | (5.9) | |||||||||||||||||||||
| Investment products fees | 90 | 87 | 82 | 3.4 | 9.8 | 177 | 159 | 11.3 | |||||||||||||||||||||
| Other | 192 | 197 | 157 | (2.5) | 22.3 | 389 | 291 | 33.7 | |||||||||||||||||||||
| Total fee revenue | 2,981 | 2,836 | 2,851 | 5.1 | 4.6 | 5,817 | 5,549 | 4.8 | |||||||||||||||||||||
| Securities gains (losses), net | (57) | — | (36) | nm | (58.3) | (57) | (34) | (67.6) | |||||||||||||||||||||
| Total noninterest income | $2,924 | $2,836 | $2,815 | 3.1 | 3.9 | $5,760 | $5,515 | 4.4 | |||||||||||||||||||||
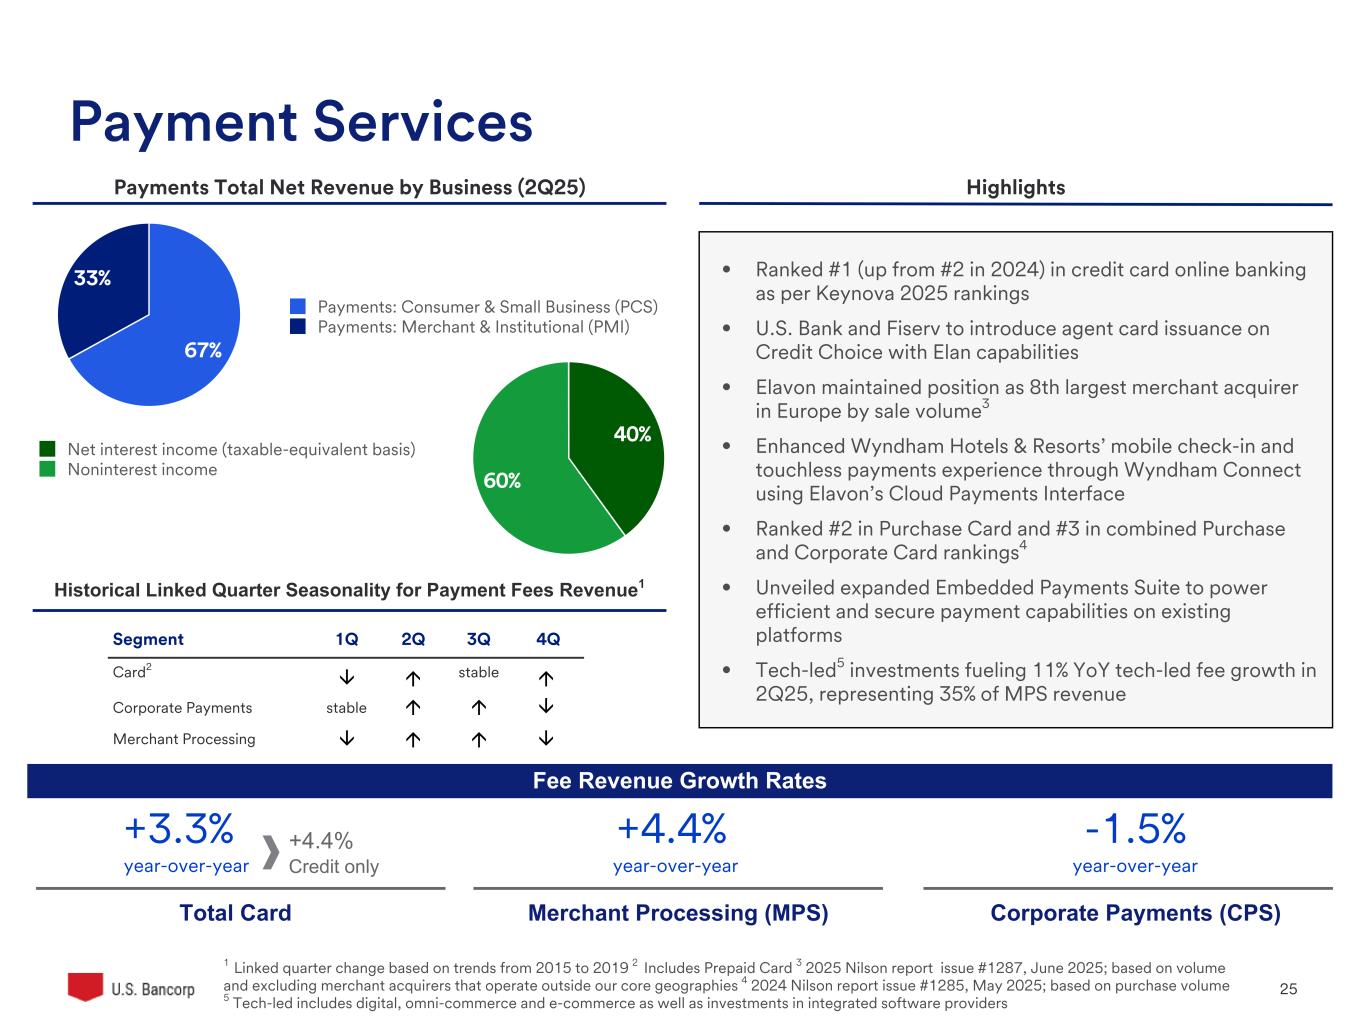
Second quarter noninterest income of $2,924 million was $109 million (3.9 percent) higher than the second quarter of 2024. The second quarter total fee revenue was $130 million (4.6 percent) higher than the prior year quarter. The increase was driven by higher payment services revenue, trust and investment management fees, service charges and other revenue, partially offset by lower mortgage banking revenue. Payment services revenue increased $31 million (2.9 percent) compared with the second quarter of 2024, due to increases in card revenue of $14 million (3.3 percent) mainly due to higher sales volume, and merchant processing services of $20 million (4.4 percent) due to favorable rates. Trust and investment management fees increased $54 million (8.3 percent) driven by favorable market conditions and business growth. Service charges increased $14 million (4.3 percent) primarily due to higher treasury management fees. Other revenue increased $35 million (22.3 percent) due to higher tax credit investment activity. Mortgage banking revenue decreased $28 million (14.7 percent) primarily due to a gain on the sale of mortgage servicing rights in the prior year quarter.
Noninterest income was $88 million (3.1 percent) higher in the second quarter of 2025 compared with the first quarter of 2025. The second quarter total fee revenue was $145 million (5.1 percent) higher than linked quarter. The increase was driven by higher payment services revenue, trust and investment management fees, and service charges. Payment services revenue increased $106 million (10.6 percent) compared with the first quarter of 2025, due to increases in card revenue of $44 million (11.1 percent) due to higher sales volume and seasonality, and merchant processing services of $59 million (14.2 percent) due to seasonality and favorable rates. Trust and investment management fees increased $23 million (3.4 percent) due to favorable market conditions and business growth. Service charges increased $21 million (6.7 percent) primarily due to higher treasury management fees.
7
| U.S. Bancorp Second Quarter 2025 Results | ||||
| NONINTEREST EXPENSE | |||||||||||||||||||||||||||||
| ($ in millions) | Percent Change | ||||||||||||||||||||||||||||
| 2Q 2025 | 1Q 2025 | 2Q 2024 | 2Q25 vs 1Q25 | 2Q25 vs 2Q24 | YTD 2025 | YTD 2024 | Percent Change | ||||||||||||||||||||||
| Compensation and employee benefits | $2,600 | $2,637 | $2,619 | (1.4) | (.7) | $5,237 | $5,310 | (1.4) | |||||||||||||||||||||
| Net occupancy and equipment | 301 | 306 | 316 | (1.6) | (4.7) | 607 | 612 | (.8) | |||||||||||||||||||||
| Professional services | 109 | 98 | 116 | 11.2 | (6.0) | 207 | 226 | (8.4) | |||||||||||||||||||||
| Marketing and business development | 161 | 182 | 158 | (11.5) | 1.9 | 343 | 294 | 16.7 | |||||||||||||||||||||
| Technology and communications | 534 | 533 | 509 | .2 | 4.9 | 1,067 | 1,016 | 5.0 | |||||||||||||||||||||
| Other intangibles | 124 | 123 | 142 | .8 | (12.7) | 247 | 288 | (14.2) | |||||||||||||||||||||
| Other | 352 | 353 | 328 | (.3) | 7.3 | 705 | 636 | 10.8 | |||||||||||||||||||||
| Total before notable items | 4,181 | 4,232 | 4,188 | (1.2) | (.2) | 8,413 | 8,382 | .4 | |||||||||||||||||||||
| Notable items | — | — | 26 | — | nm | — | 291 | nm | |||||||||||||||||||||
| Total noninterest expense | $4,181 | $4,232 | $4,214 | (1.2) | (.8) | $8,413 | $8,673 | (3.0) | |||||||||||||||||||||
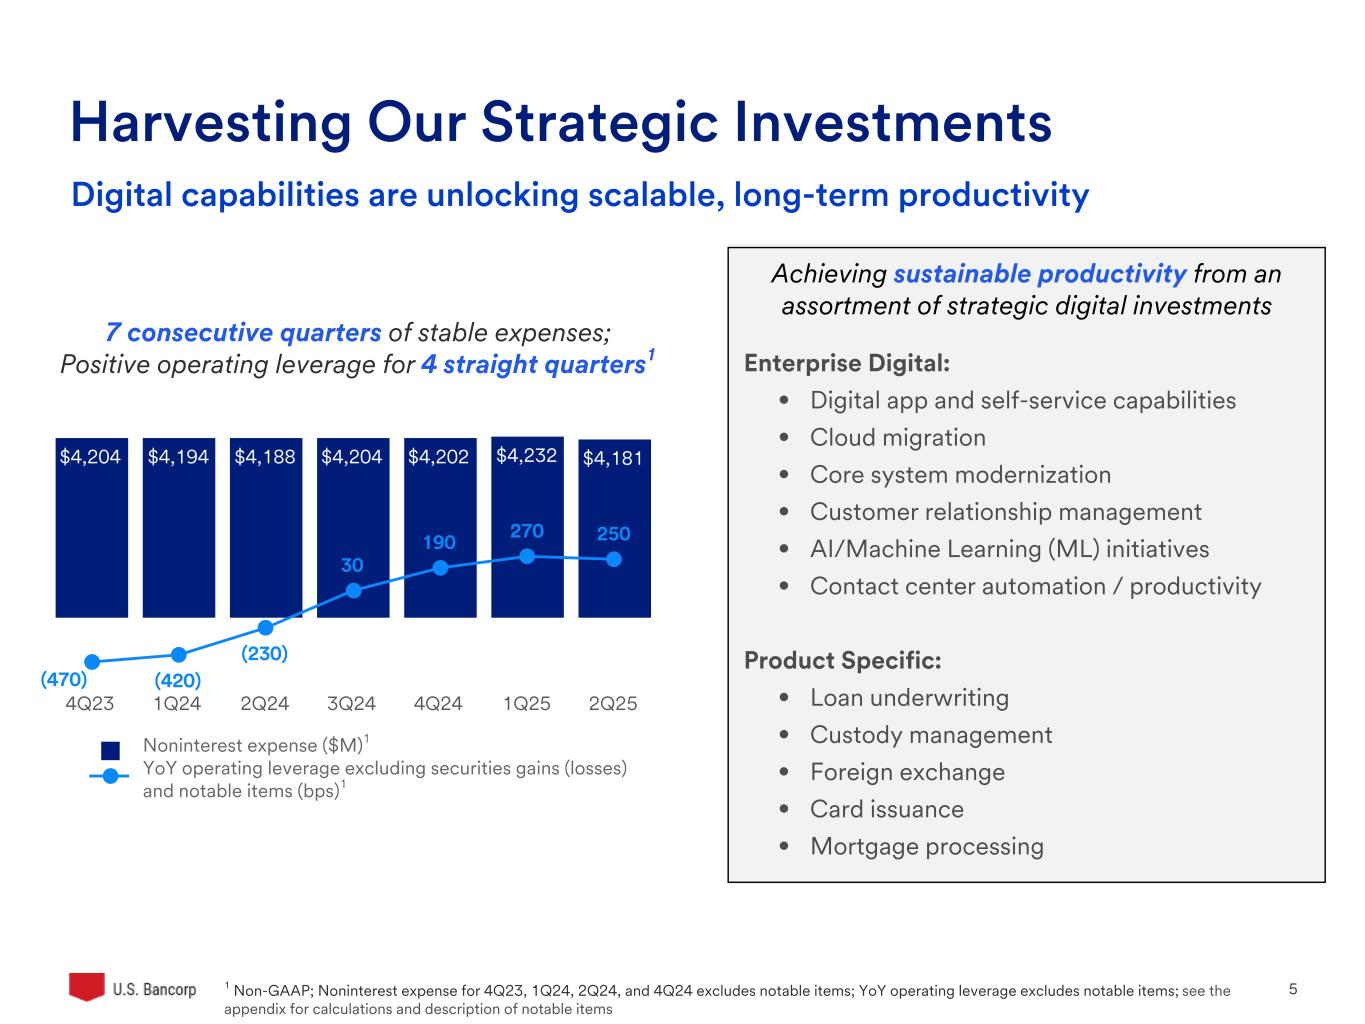
Second quarter noninterest expense of $4,181 million was $33 million (0.8 percent) lower than the second quarter of 2024. Excluding the notable item of $26 million in the second quarter of 2024, second quarter of 2025 noninterest expense decreased $7 million (0.2 percent) compared with the second quarter of 2024. The decrease was driven by lower compensation and employee benefits expense, net occupancy and equipment expense and other intangibles expense, partially offset by higher technology and communications expense, and other noninterest expense. Compensation and employee benefits expense decreased $19 million (0.7 percent) primarily due to cost savings from operational efficiencies, partially offset by merit increases. Net occupancy and equipment expense decreased $15 million (4.7 percent) due to cost savings from operational efficiencies. The increase in technology and communications expense of $25 million (4.9 percent) was due to investments in infrastructure and technology development.
Noninterest expense decreased $51 million (1.2 percent) from the first quarter of 2025. The decrease was primarily driven by lower compensation and employee benefits expense and marketing and business development expense. Compensation and employee benefits expense decreased $37 million (1.4 percent) primarily due to seasonally lower stock-based compensation and cost savings from operational efficiencies, partially offset by merit increases. Marketing and business development expense decreased $21 million (11.5 percent) primarily due to the charitable foundation contribution in the first quarter of 2025.
Provision for Income Taxes
The provision for income taxes for the second quarter of 2025 resulted in a tax rate of 21.6 percent on a taxable-equivalent basis (effective tax rate of 20.6 percent), compared with 22.7 percent on a taxable-equivalent basis (effective tax rate of 21.6 percent) in the second quarter of 2024, and 21.6 percent on a taxable-equivalent basis (effective tax rate of 20.5 percent) in the first quarter of 2025.
8
| U.S. Bancorp Second Quarter 2025 Results | ||||
| ALLOWANCE FOR CREDIT LOSSES | ||||||||||||||||||||||||||||||||
| ($ in millions) | 2Q 2025 | % (a) | 1Q 2025 | % (a) | 4Q 2024 | % (a) | 3Q 2024 | % (a) | 2Q 2024 | % (a) | ||||||||||||||||||||||
| Balance, beginning of period | $7,915 | $7,925 | $7,927 | $7,934 | $7,904 | |||||||||||||||||||||||||||
| Net charge-offs | ||||||||||||||||||||||||||||||||
| Commercial | 122 | .35 | 159 | .47 | 140 | .42 | 139 | .43 | 135 | .42 | ||||||||||||||||||||||
| Lease financing | 6 | .57 | 4 | .39 | 6 | .57 | 8 | .77 | 8 | .77 | ||||||||||||||||||||||
| Total commercial | 128 | .36 | 163 | .47 | 146 | .43 | 147 | .44 | 143 | .43 | ||||||||||||||||||||||
| Commercial mortgages | 57 | .60 | (5) | (.05) | 44 | .45 | 69 | .68 | 35 | .34 | ||||||||||||||||||||||
| Construction and development | — | — | 1 | .04 | (6) | (.23) | 1 | .04 | 1 | .04 | ||||||||||||||||||||||
| Total commercial real estate | 57 | .47 | (4) | (.03) | 38 | .30 | 70 | .54 | 36 | .28 | ||||||||||||||||||||||
| Residential mortgages | (1) | — | — | — | (2) | (.01) | (3) | (.01) | (4) | (.01) | ||||||||||||||||||||||
| Credit card | 317 | 4.30 | 325 | 4.48 | 317 | 4.28 | 299 | 4.10 | 315 | 4.47 | ||||||||||||||||||||||
| Retail leasing | 10 | 1.04 | 13 | 1.32 | 8 | .79 | 5 | .49 | 3 | .29 | ||||||||||||||||||||||
| Home equity and second mortgages | — | — | (1) | (.03) | 1 | .03 | (1) | (.03) | (1) | (.03) | ||||||||||||||||||||||
| Other | 43 | .73 | 51 | .85 | 54 | .86 | 47 | .73 | 46 | .71 | ||||||||||||||||||||||
| Total other retail | 53 | .52 | 63 | .61 | 63 | .59 | 51 | .47 | 48 | .45 | ||||||||||||||||||||||
| Total net charge-offs | 554 | .59 | 547 | .59 | 562 | .60 | 564 | .60 | 538 | .58 | ||||||||||||||||||||||
| Provision for credit losses | 501 | 537 | 560 | 557 | 568 | |||||||||||||||||||||||||||
| Balance, end of period | $7,862 | $7,915 | $7,925 | $7,927 | $7,934 | |||||||||||||||||||||||||||
| Components | ||||||||||||||||||||||||||||||||
| Allowance for loan losses | $7,537 | $7,584 | $7,583 | $7,560 | $7,549 | |||||||||||||||||||||||||||
| Liability for unfunded credit commitments | 325 | 331 | 342 | 367 | 385 | |||||||||||||||||||||||||||
| Total allowance for credit losses | $7,862 | $7,915 | $7,925 | $7,927 | $7,934 | |||||||||||||||||||||||||||
| Gross charge-offs | $683 | $690 | $697 | $669 | $652 | |||||||||||||||||||||||||||
| Gross recoveries | $129 | $143 | $135 | $105 | $114 | |||||||||||||||||||||||||||
| Allowance for credit losses as a percentage of | ||||||||||||||||||||||||||||||||
| Period-end loans (%) | 2.07 | 2.07 | 2.09 | 2.12 | 2.11 | |||||||||||||||||||||||||||
| Nonperforming loans (%) | 480 | 470 | 442 | 438 | 438 | |||||||||||||||||||||||||||
| Nonperforming assets (%) | 468 | 458 | 433 | 429 | 428 | |||||||||||||||||||||||||||
(a) Annualized and calculated on average loan balances | ||||||||||||||||||||||||||||||||
9
| U.S. Bancorp Second Quarter 2025 Results | ||||
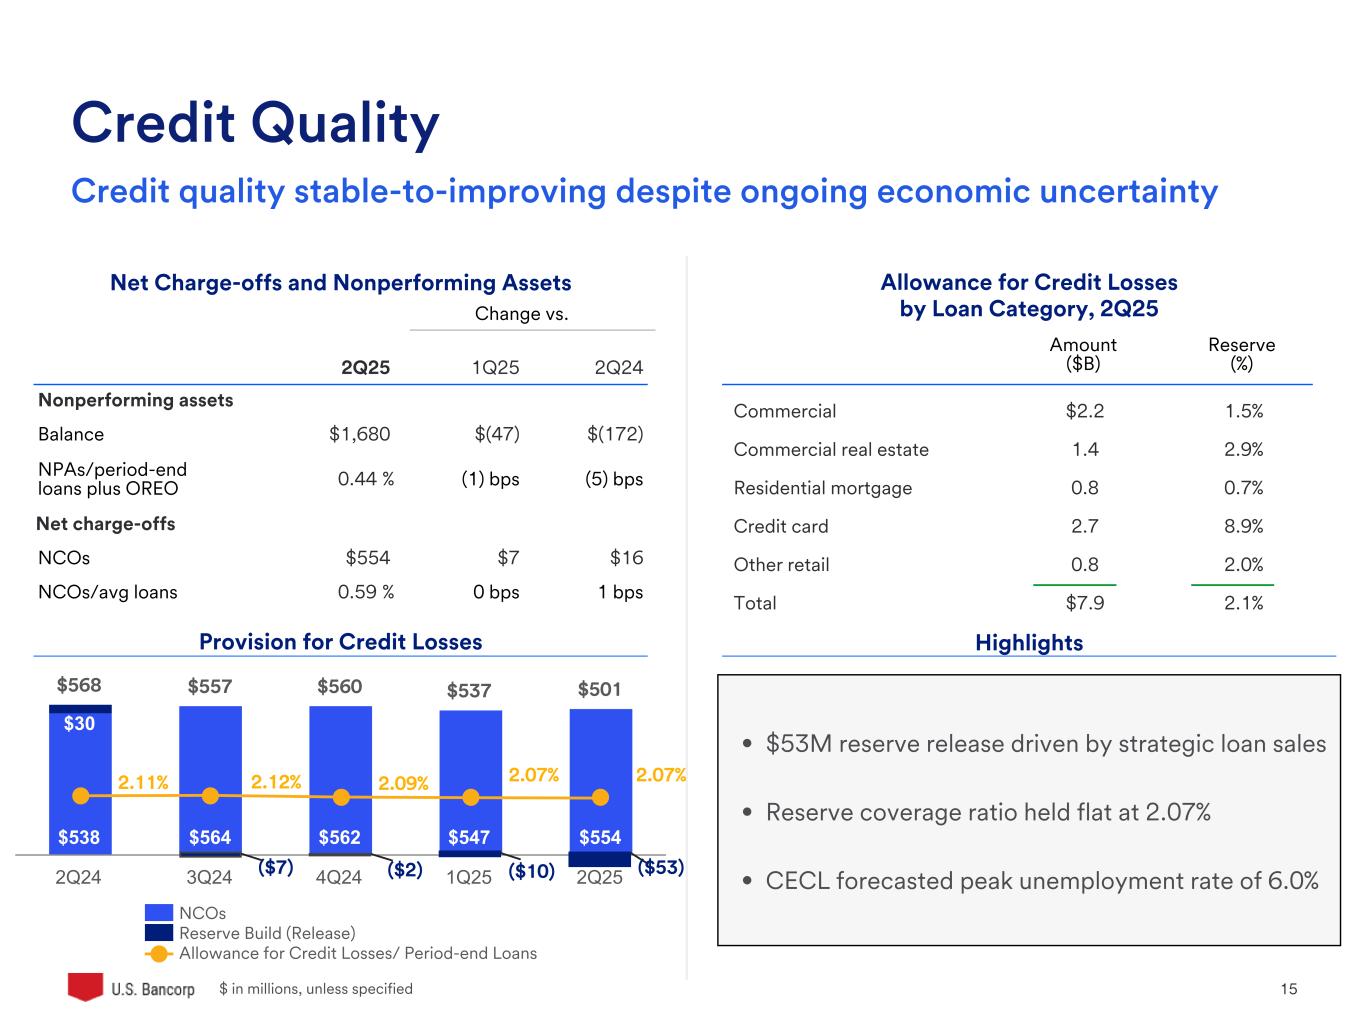
The Company’s provision for credit losses for the second quarter of 2025 was $501 million, compared with $537 million in the first quarter of 2025 and $568 million in the second quarter of 2024. The second quarter of 2025 provision was $36 million (6.7 percent) lower than the first quarter of 2025 and $67 million (11.8 percent) lower than the second quarter of 2024. The decrease in provision expense on a year-over-year basis was primarily driven by the impact of loan portfolio sales during the second quarter of 2025 and improved credit quality. The decrease in provision expense on a linked quarter basis was primarily driven by the impact of loan portfolio sales during the second quarter of 2025 and improved credit quality, partially offset by higher commercial real estate net charge-offs. The Company continues to monitor economic uncertainty related to interest rates, inflationary pressures, including those related to changing tariff policies, and other economic factors that may affect the financial strength of corporate and consumer borrowers.
Total net charge-offs in the second quarter of 2025 were $554 million, compared with $547 million in the first quarter of 2025 and $538 million in the second quarter of 2024. The net charge-off ratio was 0.59 percent in the second quarter of 2025 and in the first quarter of 2025, compared with 0.58 percent in the second quarter of 2024. The increase in net charge-offs on a year-over-year basis primarily reflected higher net charge-offs on commercial real estate loans, partially offset by lower net charge-offs on commercial loans.
The allowance for credit losses was $7,862 million at June 30, 2025, compared with $7,915 million at March 31, 2025, and $7,934 million at June 30, 2024. The decrease in the allowance for credit losses on a year-over-year basis was primarily driven by improved credit quality and portfolio mix. The decrease in the allowance for credit losses on a linked quarter basis was primarily driven by the impact of loan portfolio sales during the second quarter of 2025 and improved credit quality. The ratio of the allowance for credit losses to period-end loans was 2.07 percent at June 30, 2025, compared with 2.07 percent at March 31, 2025, and 2.11 percent at June 30, 2024. The ratio of the allowance for credit losses to nonperforming loans was 480 percent at June 30, 2025, compared with 470 percent at March 31, 2025, and 438 percent at June 30, 2024.
Nonperforming assets were $1,680 million at June 30, 2025, compared with $1,727 million at March 31, 2025, and $1,852 million at June 30, 2024. The ratio of nonperforming assets to loans and other real estate was 0.44 percent at June 30, 2025, compared with 0.45 percent at March 31, 2025, and 0.49 percent at June 30, 2024. The decrease in nonperforming assets on a linked quarter basis was primarily due to lower commercial and commercial real estate nonperforming loans. The decrease in nonperforming assets on a year-over year basis was primarily due to lower commercial real estate nonperforming loans, partially offset by higher commercial nonperforming loans. Accruing loans 90 days or more past due were $966 million at June 30, 2025, compared with $796 million at March 31, 2025, and $701 million at June 30, 2024. The increase in accruing loans 90 days or more past due on a quarter-over-quarter and year-over-year basis was primarily due to higher commercial real estate delinquencies that are primarily administrative in nature and higher residential mortgage delinquencies primarily related to forbearance extended to borrowers affected by California wildfires.
10
| U.S. Bancorp Second Quarter 2025 Results | ||||
| DELINQUENT LOAN RATIOS AS A PERCENT OF ENDING LOAN BALANCES | |||||||||||||||||
| (Percent) | Jun 30 2025 | Mar 31 2025 | Dec 31 2024 | Sep 30 2024 | Jun 30 2024 | ||||||||||||
| Delinquent loan ratios - 90 days or more past due | |||||||||||||||||
| Commercial | .06 | .07 | .07 | .07 | .06 | ||||||||||||
| Commercial real estate | .28 | .01 | .02 | .02 | .02 | ||||||||||||
| Residential mortgages | .28 | .19 | .17 | .15 | .15 | ||||||||||||
| Credit card | 1.24 | 1.40 | 1.43 | 1.36 | 1.30 | ||||||||||||
| Other retail | .13 | .14 | .15 | .14 | .14 | ||||||||||||
| Total loans | .25 | .21 | .21 | .20 | .19 | ||||||||||||
| Delinquent loan ratios - 90 days or more past due and nonperforming loans | |||||||||||||||||
| Commercial | .45 | .49 | .55 | .51 | .48 | ||||||||||||
| Commercial real estate | 1.86 | 1.62 | 1.70 | 1.85 | 1.87 | ||||||||||||
| Residential mortgages | .40 | .31 | .30 | .28 | .28 | ||||||||||||
| Credit card | 1.24 | 1.40 | 1.43 | 1.36 | 1.30 | ||||||||||||
| Other retail | .51 | .50 | .50 | .48 | .47 | ||||||||||||
| Total loans | .68 | .65 | .69 | .68 | .67 | ||||||||||||
| ASSET QUALITY (a) | |||||||||||||||||
| ($ in millions) | |||||||||||||||||
| Jun 30 2025 | Mar 31 2025 | Dec 31 2024 | Sep 30 2024 | Jun 30 2024 | |||||||||||||
| Nonperforming loans | |||||||||||||||||
| Commercial | $548 | $589 | $644 | $560 | $531 | ||||||||||||
| Lease financing | 27 | 27 | 26 | 25 | 25 | ||||||||||||
| Total commercial | 575 | 616 | 670 | 585 | 556 | ||||||||||||
| Commercial mortgages | 732 | 745 | 789 | 853 | 888 | ||||||||||||
| Construction and development | 31 | 35 | 35 | 72 | 71 | ||||||||||||
| Total commercial real estate | 763 | 780 | 824 | 925 | 959 | ||||||||||||
| Residential mortgages | 145 | 141 | 152 | 154 | 154 | ||||||||||||
| Credit card | — | — | — | — | — | ||||||||||||
| Other retail | 154 | 148 | 147 | 145 | 141 | ||||||||||||
| Total nonperforming loans | 1,637 | 1,685 | 1,793 | 1,809 | 1,810 | ||||||||||||
| Other real estate | 21 | 23 | 21 | 21 | 23 | ||||||||||||
| Other nonperforming assets | 22 | 19 | 18 | 18 | 19 | ||||||||||||
| Total nonperforming assets | $1,680 | $1,727 | $1,832 | $1,848 | $1,852 | ||||||||||||
| Accruing loans 90 days or more past due | $966 | $796 | $810 | $738 | $701 | ||||||||||||
| Nonperforming assets to loans plus ORE (%) | .44 | .45 | .48 | .49 | .49 | ||||||||||||
| (a) Throughout this document, nonperforming assets and related ratios do not include accruing loans 90 days or more past due | |||||||||||||||||
11
| U.S. Bancorp Second Quarter 2025 Results | ||||
| COMMON SHARES | |||||||||||||||||
| (Millions) | 2Q 2025 | 1Q 2025 | 4Q 2024 | 3Q 2024 | 2Q 2024 | ||||||||||||
| Beginning shares outstanding | 1,560 | 1,560 | 1,561 | 1,560 | 1,560 | ||||||||||||
| Shares issued for stock incentive plans, | |||||||||||||||||
| acquisitions and other corporate purposes | — | 4 | 2 | 1 | — | ||||||||||||
| Shares repurchased | (2) | (4) | (3) | — | — | ||||||||||||
| Ending shares outstanding | 1,558 | 1,560 | 1,560 | 1,561 | 1,560 | ||||||||||||
| CAPITAL POSITION | Preliminary Data | |||||||||||||||||||||||||||||||
| ($ in millions) | Jun 30 2025 | Mar 31 2025 | Dec 31 2024 | Sep 30 2024 | Jun 30 2024 | |||||||||||||||||||||||||||
| Total U.S. Bancorp shareholders' equity | $61,438 | $60,096 | $58,578 | $58,859 | $56,420 | |||||||||||||||||||||||||||
| Basel III Standardized Approach (a) | ||||||||||||||||||||||||||||||||
| Common equity tier 1 capital | $49,382 | $48,482 | $47,877 | $47,164 | $46,239 | |||||||||||||||||||||||||||
| Tier 1 capital | 56,630 | 55,736 | 55,129 | 54,416 | 53,491 | |||||||||||||||||||||||||||
| Total risk-based capital | 65,752 | 64,989 | 64,375 | 63,625 | 62,926 | |||||||||||||||||||||||||||
| Fully implemented common equity tier 1 capital ratio (a) | 10.7 | % | 10.8 | % | 10.5 | % (b) | 10.5 | % (b) | 10.2 | % (b) | ||||||||||||||||||||||
| Tier 1 capital ratio | 12.3 | 12.4 | 12.2 | 12.2 | 11.9 | |||||||||||||||||||||||||||
| Total risk-based capital ratio | 14.3 | 14.4 | 14.3 | 14.2 | 14.0 | |||||||||||||||||||||||||||
| Leverage ratio | 8.5 | 8.4 | 8.3 | 8.3 | 8.1 | |||||||||||||||||||||||||||
| Common equity to assets | 8.0 | 7.9 | 7.6 | 7.6 | 7.3 | |||||||||||||||||||||||||||
| Tangible common equity to tangible assets (b) | 6.1 | 6.0 | 5.8 | 5.7 | 5.4 | |||||||||||||||||||||||||||
| Tangible common equity to risk-weighted assets (b) | 9.0 | 8.9 | 8.5 | 8.6 | 8.0 | |||||||||||||||||||||||||||
| Common equity tier 1 capital to risk-weighted assets, reflecting transitional regulatory capital requirements related to the current expected credit losses methodology (a) | — | — | 10.6 | 10.5 | 10.3 | |||||||||||||||||||||||||||
(a) Beginning January 1, 2025, the regulatory capital requirements fully reflect implementation related to the current expected credit losses methodology. Prior to 2025, the Company's capital ratios reflected certain transitional adjustments. (b) See Non-GAAP Financial Measures reconciliation on page 18 | ||||||||||||||||||||||||||||||||
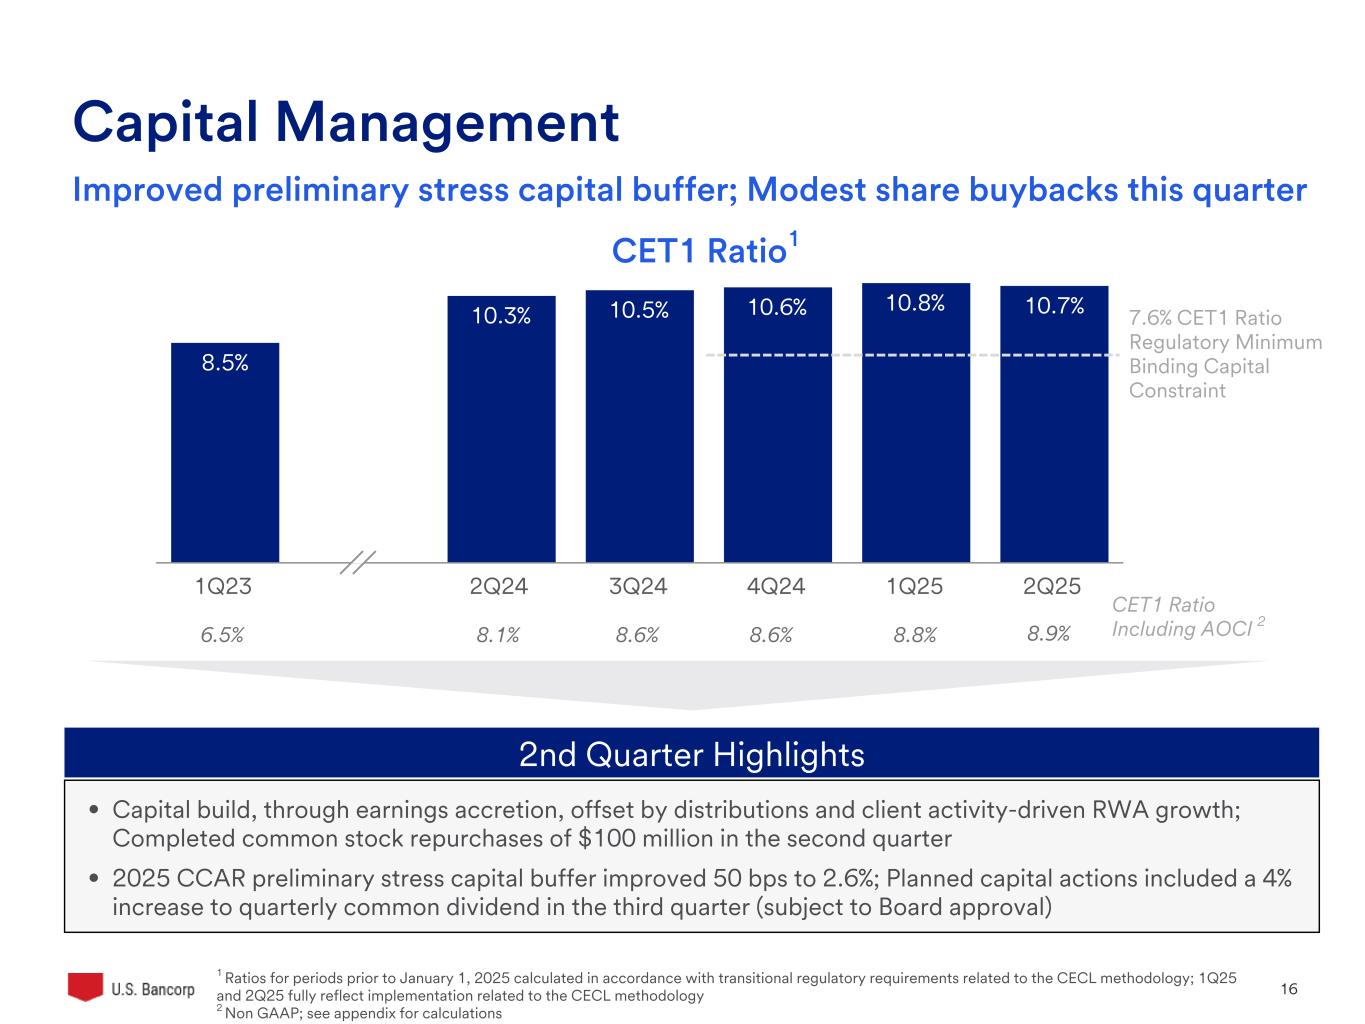
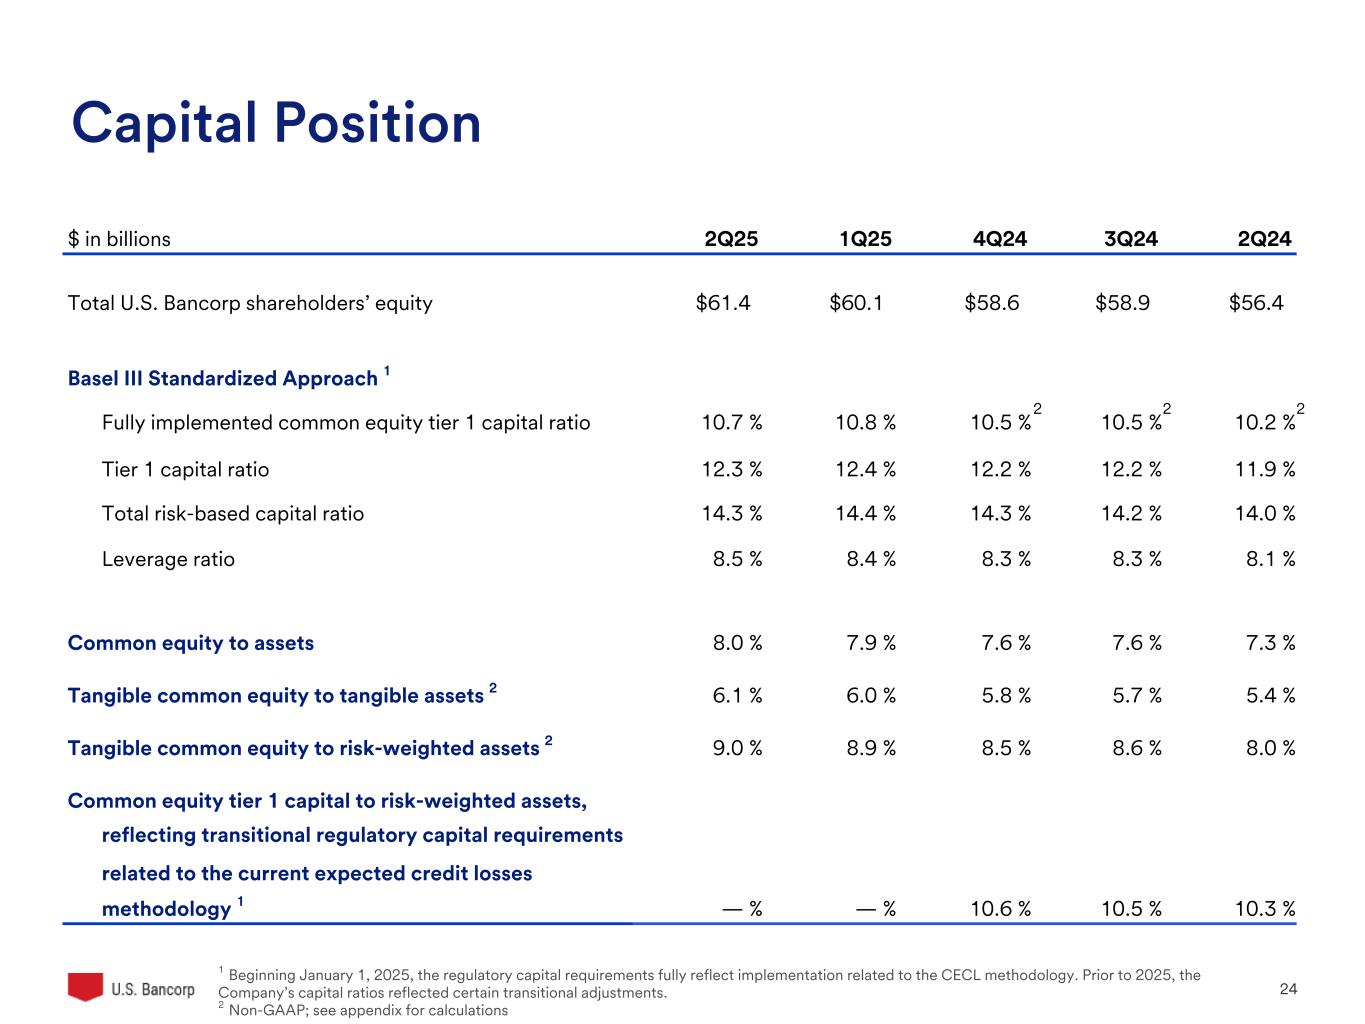
Total U.S. Bancorp shareholders’ equity was $61.4 billion at June 30, 2025, compared with $60.1 billion at March 31, 2025, and $56.4 billion at June 30, 2024. During 2024, the Company's Board of Directors authorized a share repurchase program for up to $5.0 billion of the Company's outstanding common stock effective September 13, 2024. The Company began repurchasing shares under this program, in addition to repurchases done in connection with its stock-based compensation plans, in the fourth quarter of 2024.
All regulatory ratios continue to be in excess of “well-capitalized” requirements. The common equity tier 1 capital to risk-weighted assets ratio using the Basel III standardized approach was 10.7 percent at June 30, 2025, compared with 10.8 percent at March 31, 2025, and 10.3 percent at June 30, 2024.
12
| U.S. Bancorp Second Quarter 2025 Results | ||||
| Investor Conference Call | ||
On Thursday, July 17, 2025 at 7 a.m. CT, President and Chief Executive Officer Gunjan Kedia and Vice Chair and Chief Financial Officer John Stern will host a conference call to review the financial results. The live conference call will be available online or by telephone. To access the webcast and presentation, visit the U.S. Bancorp website at usbank.com and click on “About us”, “Investor relations”, "News & events" and “Webcasts & presentations.” To access the conference call from locations within the United States and Canada, please dial 888-210-4659. Participants calling from outside the United States and Canada, please dial 646-960-0383. The access code for all participants is 7269933. For those unable to participate during the live call, a replay will be available at approximately 10 a.m. CT on Thursday, July 17, 2025. To access the replay, please visit the U.S. Bancorp website at usbank.com and click on “About us”, “Investor relations”, "News & events" and “Webcasts & presentations.”
| About U.S. Bancorp | ||
U.S. Bancorp, with approximately 70,000 employees and $686 billion in assets as of June 30, 2025, is the parent company of U.S. Bank National Association. Headquartered in Minneapolis, the company serves millions of customers locally, nationally and globally through a diversified mix of businesses including consumer banking, business banking, commercial banking, institutional banking, payments and wealth management. U.S. Bancorp has been recognized for its approach to digital innovation, community partnerships and customer service, including being named one of the 2025 World’s Most Ethical Companies and one of Fortune’s most admired superregional banks. Learn more at usbank.com/about.
| Forward-looking Statements | ||
“Safe Harbor” Statement under the Private Securities Litigation Reform Act of 1995.
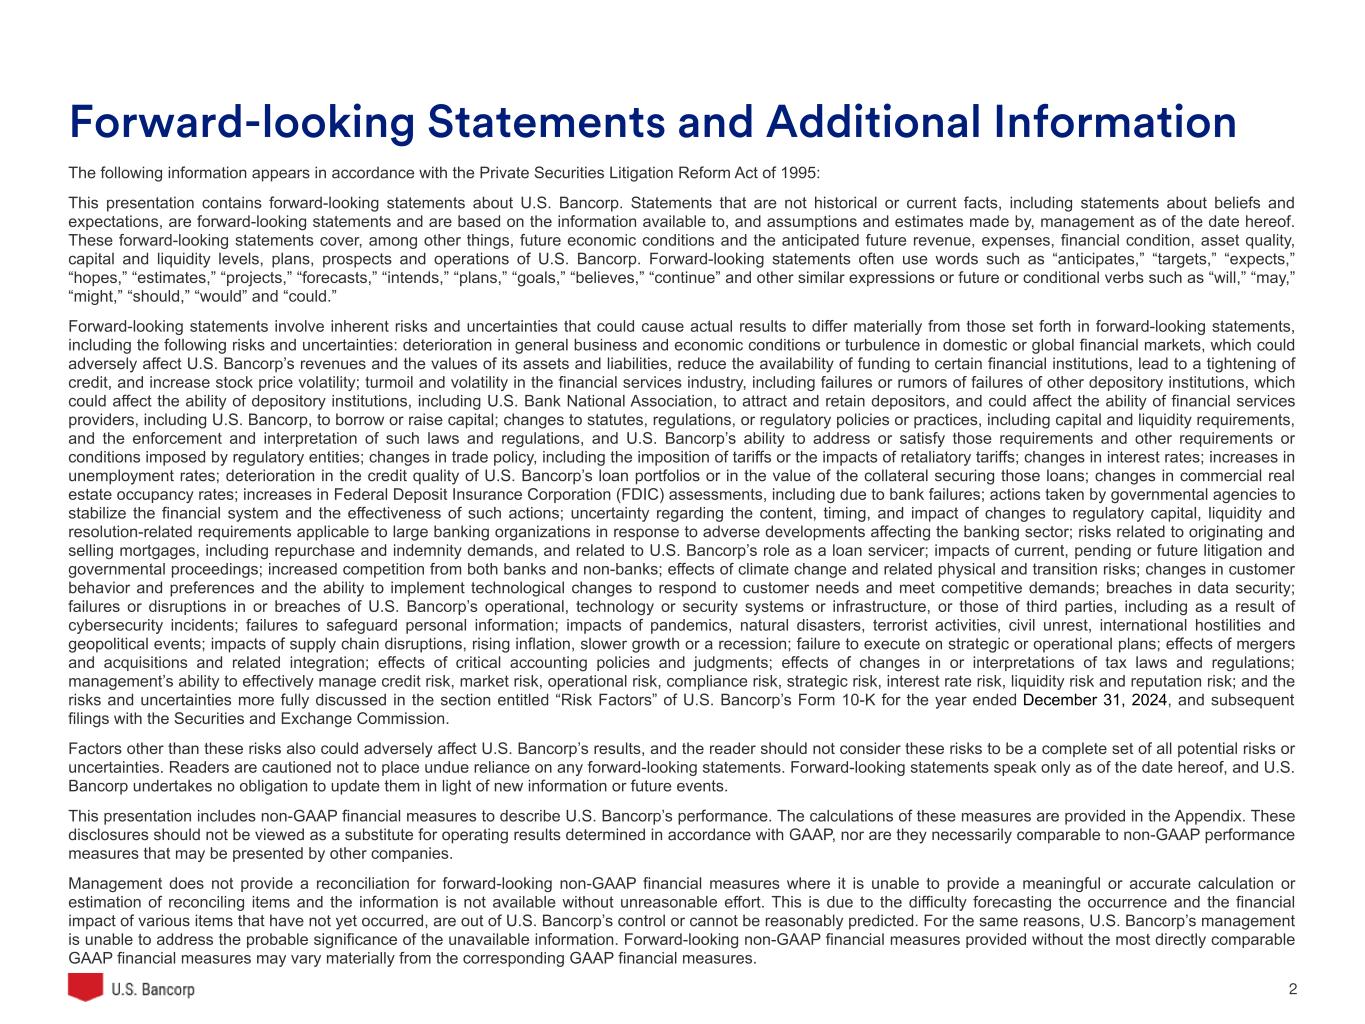
This press release contains forward-looking statements about U.S. Bancorp. Statements that are not historical or current facts, including statements about beliefs and expectations, are forward-looking statements and are based on the information available to, and assumptions and estimates made by, management as of the date hereof. These forward-looking statements cover, among other things, future economic conditions and the anticipated future revenue, expenses, financial condition, asset quality, capital and liquidity levels, plans, prospects and operations of U.S. Bancorp. Forward-looking statements often use words such as “anticipates,” “targets,” “expects,” “hopes,” “estimates,” “projects,” “forecasts,” “intends,” “plans,” “goals,” “believes,” “continue” and other similar expressions or future or conditional verbs such as “will,” “may,” “might,” “should,” “would” and “could.”
Forward-looking statements involve inherent risks and uncertainties that could cause actual results to differ materially from those set forth in forward-looking statements, including the following risks and uncertainties:
•Deterioration in general business and economic conditions or turbulence in domestic or global financial markets, which could adversely affect U.S. Bancorp’s revenues and the values of its assets and liabilities, reduce the availability of funding to certain financial institutions, lead to a tightening of credit, and increase stock price volatility;
•Turmoil and volatility in the financial services industry, including failures or rumors of failures of other depository institutions, which could affect the ability of depository institutions, including U.S. Bank National Association, to attract and retain depositors, and could affect the ability of financial services providers, including U.S. Bancorp, to borrow or raise capital;
•Changes to statutes, regulations, or regulatory policies or practices, including capital and liquidity requirements, and the enforcement and interpretation of such laws and regulations, and U.S. Bancorp’s ability to address or satisfy those requirements and other requirements or conditions imposed by regulatory entities;
•Changes in trade policy, including the imposition of tariffs or the impacts of retaliatory tariffs;
•Changes in interest rates;
•Increases in unemployment rates;
•Deterioration in the credit quality of U.S. Bancorp's loan portfolios or in the value of the collateral securing those loans;
•Changes in commercial real estate occupancy rates;
•Increases in FDIC assessments, including due to bank failures;
•Actions taken by governmental agencies to stabilize the financial system and the effectiveness of such actions;
•Uncertainty regarding the content, timing and impact of changes to regulatory capital, liquidity and resolution-related requirements applicable to large banking organizations in response to adverse developments affecting the banking sector;
13
| U.S. Bancorp Second Quarter 2025 Results | ||||
•Risks related to originating and selling mortgages, including repurchase and indemnity demands, and related to U.S. Bancorp’s role as a loan servicer;
•Impacts of current, pending or future litigation and governmental proceedings;
•Increased competition from both banks and non-banks;
•Effects of climate change and related physical and transition risks;
•Changes in customer behavior and preferences and the ability to implement technological changes to respond to customer needs and meet competitive demands;
•Breaches in data security;
•Failures or disruptions in or breaches of U.S. Bancorp’s operational, technology or security systems or infrastructure, or those of third parties, including as a result of cybersecurity incidents;
•Failures to safeguard personal information;
•Impacts of pandemics, natural disasters, terrorist activities, civil unrest, international hostilities and geopolitical events;
•Impacts of supply chain disruptions, rising inflation, slower growth or a recession;
•Failure to execute on strategic or operational plans;
•Effects of mergers and acquisitions and related integration;
•Effects of critical accounting policies and judgments;
•Effects of changes in or interpretations of tax laws and regulations;
•Management’s ability to effectively manage credit risk, market risk, operational risk, compliance risk, strategic risk, interest rate risk, liquidity risk and reputation risk; and
•The risks and uncertainties more fully discussed in the section entitled “Risk Factors” of U.S. Bancorp’s Form 10-K for the year ended December 31, 2024, and subsequent filings with the Securities and Exchange Commission.
Factors other than these risks also could adversely affect U.S. Bancorp’s results, and the reader should not consider these risks to be a complete set of all potential risks or uncertainties. Readers are cautioned not to place undue reliance on any forward-looking statements. Forward-looking statements speak only as of the date hereof, and U.S. Bancorp undertakes no obligation to update them in light of new information or future events.
14
| U.S. Bancorp Second Quarter 2025 Results | ||||
| Non-GAAP Financial Measures | ||
In addition to capital ratios defined by banking regulators, the Company considers various other measures when evaluating capital utilization and adequacy, including:
•Tangible common equity to tangible assets,
•Tangible common equity to risk-weighted assets,
•Common equity tier 1 capital to risk-weighted assets, reflecting the full implementation of the current expected credit losses methodology, and
•Return on tangible common equity.
These capital measures are viewed by management as useful additional methods of evaluating the Company’s utilization of its capital held and the level of capital available to withstand unexpected negative market or economic conditions. Additionally, presentation of these measures allows investors, analysts and banking regulators to assess the Company’s capital position and use of capital relative to other financial services companies. These capital measures are not defined in generally accepted accounting principles (“GAAP”), or in banking regulations or were not effective for certain periods. In addition, certain capital measures related to prior periods are presented on the same basis as those in the current period. The effective capital ratios defined by banking regulations for these periods were subject to certain transitional provisions for the implementation of accounting guidance related to impairment of financial instruments based on the current expected credit losses methodology. As a result, these capital measures disclosed by the Company may be considered non-GAAP financial measures. Management believes this information helps investors assess trends in the Company’s capital utilization and adequacy.
The Company also discloses net interest income and related ratios and analysis on a taxable-equivalent basis, which may also be considered non-GAAP financial measures. The Company believes this presentation to be the preferred industry measurement of net interest income as it provides a relevant comparison of net interest income arising from taxable and tax-exempt sources. In addition, certain performance measures utilize net interest income on a taxable-equivalent basis, including the efficiency ratio, tangible efficiency ratio, net interest margin, and tax rate.
The adjusted noninterest expense, adjusted net income, adjusted diluted earnings per common share, and adjusted operating leverage exclude notable items. Management uses these measures in their analysis of the Company’s performance and believes these measures provide a greater understanding of ongoing operations and enhance comparability of results with prior periods.
There may be limits in the usefulness of these measures to investors. As a result, the Company encourages readers to consider the consolidated financial statements and other financial information contained in this press release in their entirety, and not to rely on any single financial measure. A table follows that shows the Company’s calculation of these non-GAAP financial measures.
15
| CONSOLIDATED STATEMENT OF INCOME | ||||||||||||||
| (Dollars and Shares in Millions, Except Per Share Data) | Three Months Ended June 30, | Six Months Ended June 30, | ||||||||||||
| (Unaudited) | 2025 | 2024 | 2025 | 2024 | ||||||||||
| Interest Income | ||||||||||||||
| Loans | $5,548 | $5,761 | $11,081 | $11,473 | ||||||||||
| Loans held for sale | 59 | 41 | 87 | 78 | ||||||||||
| Investment securities | 1,355 | 1,294 | 2,663 | 2,469 | ||||||||||
| Other interest income | 642 | 889 | 1,289 | 1,729 | ||||||||||
| Total interest income | 7,604 | 7,985 | 15,120 | 15,749 | ||||||||||
| Interest Expense | ||||||||||||||
| Deposits | 2,541 | 3,028 | 5,052 | 5,912 | ||||||||||
| Short-term borrowings | 291 | 296 | 540 | 566 | ||||||||||
| Long-term debt | 721 | 638 | 1,385 | 1,263 | ||||||||||
| Total interest expense | 3,553 | 3,962 | 6,977 | 7,741 | ||||||||||
| Net interest income | 4,051 | 4,023 | 8,143 | 8,008 | ||||||||||
| Provision for credit losses | 501 | 568 | 1,038 | 1,121 | ||||||||||
| Net interest income after provision for credit losses | 3,550 | 3,455 | 7,105 | 6,887 | ||||||||||
| Noninterest Income | ||||||||||||||
| Card revenue | 442 | 428 | 840 | 820 | ||||||||||
| Corporate payment products revenue | 192 | 195 | 381 | 379 | ||||||||||
| Merchant processing services | 474 | 454 | 889 | 855 | ||||||||||
| Trust and investment management fees | 703 | 649 | 1,383 | 1,290 | ||||||||||
| Service charges | 336 | 322 | 651 | 637 | ||||||||||
| Capital markets revenue | 390 | 374 | 772 | 762 | ||||||||||
| Mortgage banking revenue | 162 | 190 | 335 | 356 | ||||||||||
| Investment products fees | 90 | 82 | 177 | 159 | ||||||||||
| Securities gains (losses), net | (57) | (36) | (57) | (34) | ||||||||||
| Other | 192 | 157 | 389 | 291 | ||||||||||
| Total noninterest income | 2,924 | 2,815 | 5,760 | 5,515 | ||||||||||
| Noninterest Expense | ||||||||||||||
| Compensation and employee benefits | 2,600 | 2,619 | 5,237 | 5,310 | ||||||||||
| Net occupancy and equipment | 301 | 316 | 607 | 612 | ||||||||||
| Professional services | 109 | 116 | 207 | 226 | ||||||||||
| Marketing and business development | 161 | 158 | 343 | 294 | ||||||||||
| Technology and communications | 534 | 509 | 1,067 | 1,016 | ||||||||||
| Other intangibles | 124 | 142 | 247 | 288 | ||||||||||
| Merger and integration charges | — | — | — | 155 | ||||||||||
| Other | 352 | 354 | 705 | 772 | ||||||||||
| Total noninterest expense | 4,181 | 4,214 | 8,413 | 8,673 | ||||||||||
| Income before income taxes | 2,293 | 2,056 | 4,452 | 3,729 | ||||||||||
| Applicable income taxes | 472 | 445 | 915 | 792 | ||||||||||
| Net income | 1,821 | 1,611 | 3,537 | 2,937 | ||||||||||
| Net (income) loss attributable to noncontrolling interests | (6) | (8) | (13) | (15) | ||||||||||
| Net income attributable to U.S. Bancorp | $1,815 | $1,603 | $3,524 | $2,922 | ||||||||||
| Net income applicable to U.S. Bancorp common shareholders | $1,733 | $1,518 | $3,336 | $2,727 | ||||||||||
| Earnings per common share | $1.11 | $.97 | $2.14 | $1.75 | ||||||||||
| Diluted earnings per common share | $1.11 | $.97 | $2.14 | $1.75 | ||||||||||
| Dividends declared per common share | $.50 | $.49 | $1.00 | $.98 | ||||||||||
| Average common shares outstanding | 1,559 | 1,560 | 1,559 | 1,560 | ||||||||||
| Average diluted common shares outstanding | 1,559 | 1,561 | 1,560 | 1,560 | ||||||||||
16
| CONSOLIDATED ENDING BALANCE SHEET | |||||||||||
| (Dollars in Millions) | June 30, 2025 | December 31, 2024 | June 30, 2024 | ||||||||
| Assets | (Unaudited) | (Unaudited) | |||||||||
| Cash and due from banks | $57,807 | $56,502 | $65,832 | ||||||||
| Investment securities | |||||||||||
| Held-to-maturity | 77,879 | 78,634 | 81,486 | ||||||||
| Available-for-sale | 90,577 | 85,992 | 79,799 | ||||||||
| Loans held for sale | 2,288 | 2,573 | 2,582 | ||||||||
| Loans | |||||||||||
| Commercial | 147,416 | 139,484 | 135,248 | ||||||||
| Commercial real estate | 48,181 | 48,859 | 51,887 | ||||||||
| Residential mortgages | 114,475 | 118,813 | 117,147 | ||||||||
| Credit card | 30,023 | 30,350 | 28,715 | ||||||||
| Other retail | 40,148 | 42,326 | 43,136 | ||||||||
| Total loans | 380,243 | 379,832 | 376,133 | ||||||||
| Less allowance for loan losses | (7,537) | (7,583) | (7,549) | ||||||||
| Net loans | 372,706 | 372,249 | 368,584 | ||||||||
| Premises and equipment | 3,625 | 3,565 | 3,570 | ||||||||
| Goodwill | 12,637 | 12,536 | 12,476 | ||||||||
| Other intangible assets | 5,285 | 5,547 | 5,757 | ||||||||
| Other assets | 63,566 | 60,720 | 59,972 | ||||||||
| Total assets | $686,370 | $678,318 | $680,058 | ||||||||
| Liabilities and Shareholders' Equity | |||||||||||
| Deposits | |||||||||||
| Noninterest-bearing | $86,972 | $84,158 | $86,756 | ||||||||
| Interest-bearing | 431,745 | 434,151 | 437,029 | ||||||||
| Total deposits | 518,717 | 518,309 | 523,785 | ||||||||
| Short-term borrowings | 15,039 | 15,518 | 16,557 | ||||||||
| Long-term debt | 64,013 | 58,002 | 52,720 | ||||||||
| Other liabilities | 26,705 | 27,449 | 30,111 | ||||||||
| Total liabilities | 624,474 | 619,278 | 623,173 | ||||||||
| Shareholders' equity | |||||||||||
| Preferred stock | 6,808 | 6,808 | 6,808 | ||||||||
| Common stock | 21 | 21 | 21 | ||||||||
| Capital surplus | 8,706 | 8,715 | 8,688 | ||||||||
| Retained earnings | 78,652 | 76,863 | 75,231 | ||||||||
| Less treasury stock | (24,140) | (24,065) | (24,020) | ||||||||
| Accumulated other comprehensive income (loss) | (8,609) | (9,764) | (10,308) | ||||||||
| Total U.S. Bancorp shareholders' equity | 61,438 | 58,578 | 56,420 | ||||||||
| Noncontrolling interests | 458 | 462 | 465 | ||||||||
| Total equity | 61,896 | 59,040 | 56,885 | ||||||||
| Total liabilities and equity | $686,370 | $678,318 | $680,058 | ||||||||
17
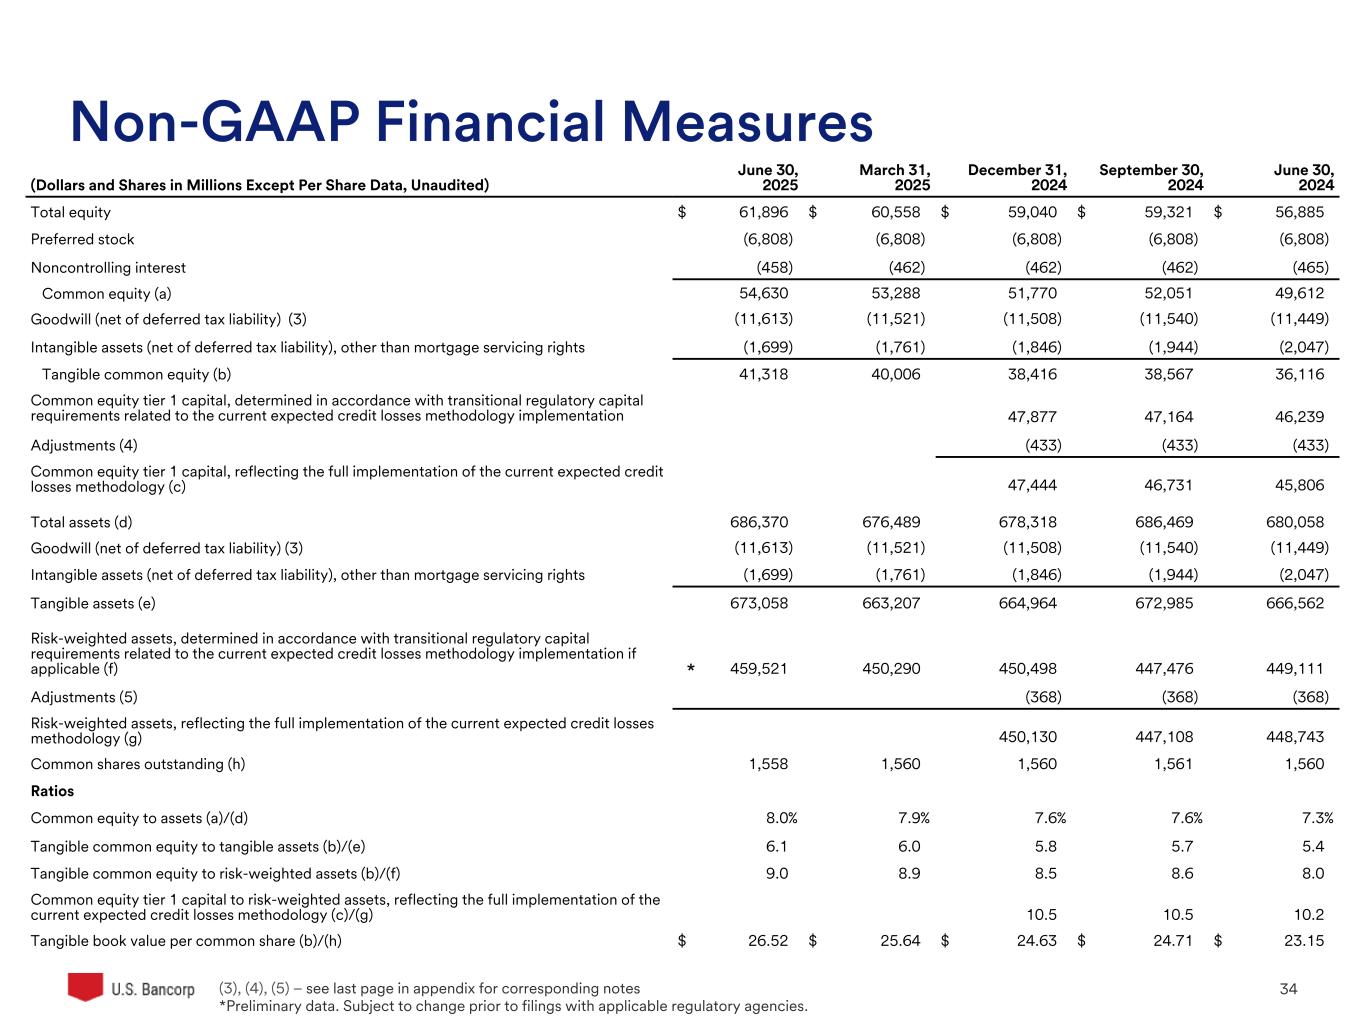
| NON-GAAP FINANCIAL MEASURES | ||||||||||||||||||||
| (Dollars in Millions, Unaudited) | June 30, 2025 | March 31, 2025 | December 31, 2024 | September 30, 2024 | June 30, 2024 | |||||||||||||||
| Total equity | $61,896 | $60,558 | $59,040 | $59,321 | $56,885 | |||||||||||||||
| Preferred stock | (6,808) | (6,808) | (6,808) | (6,808) | (6,808) | |||||||||||||||
| Noncontrolling interests | (458) | (462) | (462) | (462) | (465) | |||||||||||||||
| Common equity (a) | 54,630 | 53,288 | 51,770 | 52,051 | 49,612 | |||||||||||||||
Goodwill (net of deferred tax liability) (1) | (11,613) | (11,521) | (11,508) | (11,540) | (11,449) | |||||||||||||||
| Intangible assets (net of deferred tax liability), other than mortgage servicing rights | (1,699) | (1,761) | (1,846) | (1,944) | (2,047) | |||||||||||||||
Tangible common equity (b) | 41,318 | 40,006 | 38,416 | 38,567 | 36,116 | |||||||||||||||
| Common equity tier 1 capital, determined in accordance with transitional regulatory capital requirements related to the current expected credit losses methodology implementation | 47,877 | 47,164 | 46,239 | |||||||||||||||||
| Adjustments (2) | (433) | (433) | (433) | |||||||||||||||||
| Common equity tier 1 capital, reflecting the full implementation of the current expected credit losses methodology (c) | 47,444 | 46,731 | 45,806 | |||||||||||||||||
| Total assets (d) | 686,370 | 676,489 | 678,318 | 686,469 | 680,058 | |||||||||||||||
Goodwill (net of deferred tax liability) (1) | (11,613) | (11,521) | (11,508) | (11,540) | (11,449) | |||||||||||||||
| Intangible assets (net of deferred tax liability), other than mortgage servicing rights | (1,699) | (1,761) | (1,846) | (1,944) | (2,047) | |||||||||||||||
Tangible assets (e) | 673,058 | 663,207 | 664,964 | 672,985 | 666,562 | |||||||||||||||
Risk-weighted assets, determined in accordance with prescribed regulatory capital requirements effective for the Company (f) | 459,521 | * | 450,290 | 450,498 | 447,476 | 449,111 | ||||||||||||||
| Adjustments (3) | (368) | (368) | (368) | |||||||||||||||||
Risk-weighted assets, reflecting the full implementation of the current expected credit losses methodology (g) | 450,130 | 447,108 | 448,743 | |||||||||||||||||
| Ratios * | ||||||||||||||||||||
| Common equity to assets (a)/(d) | 8.0 | % | 7.9 | % | 7.6 | % | 7.6 | % | 7.3 | % | ||||||||||
| Tangible common equity to tangible assets (b)/(e) | 6.1 | 6.0 | 5.8 | 5.7 | 5.4 | |||||||||||||||
| Tangible common equity to risk-weighted assets (b)/(f) | 9.0 | 8.9 | 8.5 | 8.6 | 8.0 | |||||||||||||||
Common equity tier 1 capital to risk-weighted assets, reflecting the full implementation of the current expected credit losses methodology (c)/(g) | 10.5 | 10.5 | 10.2 | |||||||||||||||||
| Three Months Ended | ||||||||||||||||||||
| June 30, 2025 | March 31, 2025 | December 31, 2024 | September 30, 2024 | June 30, 2024 | ||||||||||||||||
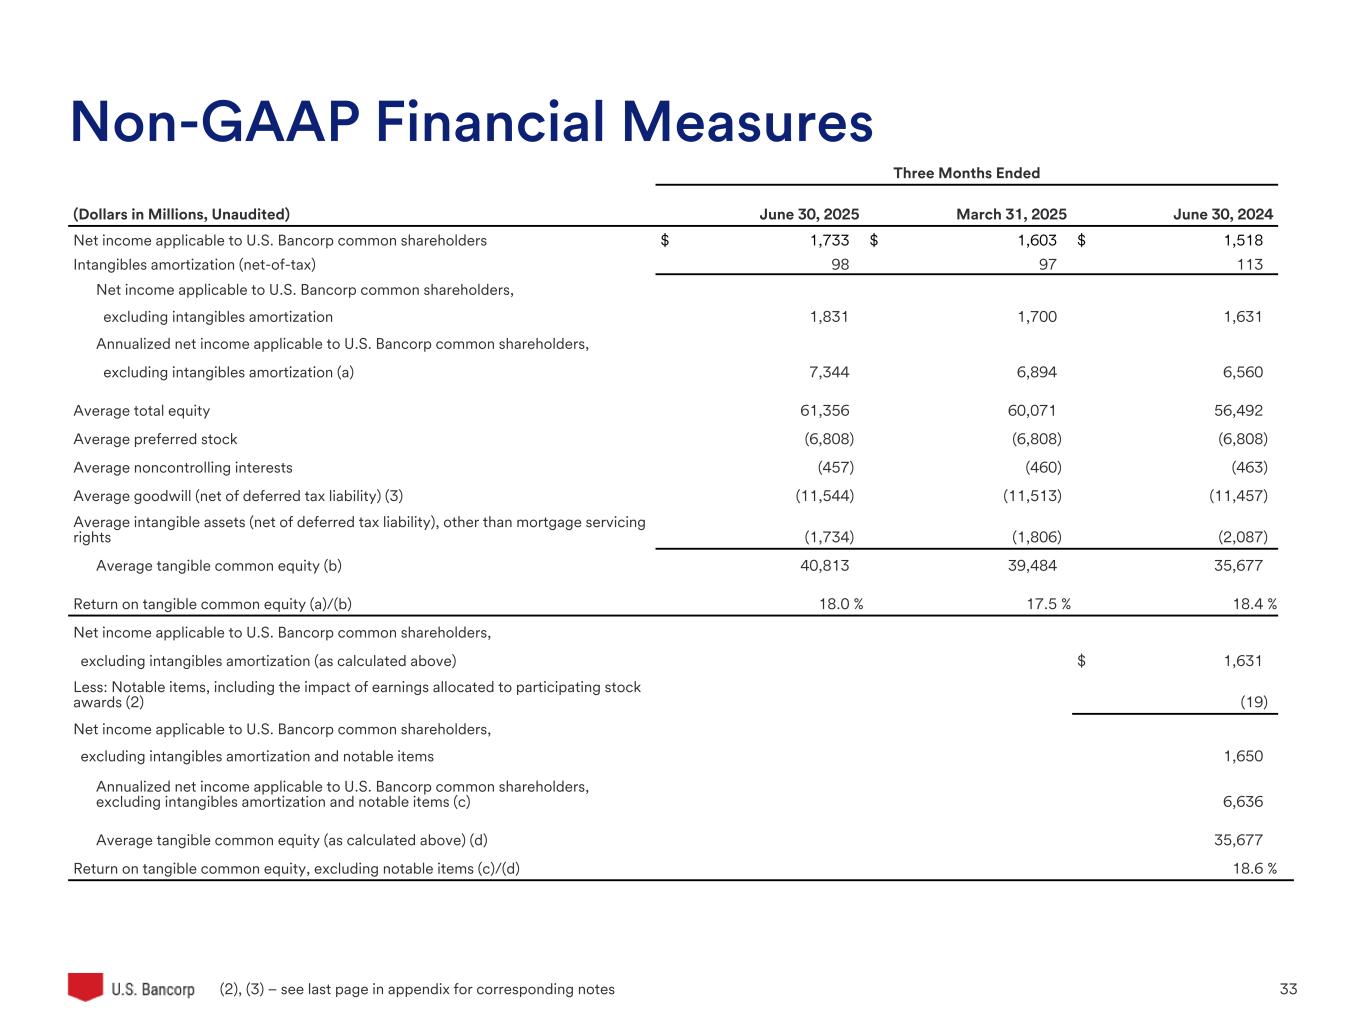
| Net income applicable to U.S. Bancorp common shareholders | $1,733 | $1,603 | $1,581 | $1,601 | $1,518 | |||||||||||||||
| Intangibles amortization (net-of-tax) | 98 | 97 | 110 | 112 | 113 | |||||||||||||||
| Net income applicable to U.S. Bancorp common shareholders, excluding intangibles amortization | 1,831 | 1,700 | 1,691 | 1,713 | 1,631 | |||||||||||||||
Annualized net income applicable to U.S. Bancorp common shareholders, excluding intangible amortization (h) | 7,344 | 6,894 | 6,727 | 6,815 | 6,560 | |||||||||||||||
| Average total equity | 61,356 | 60,071 | 59,272 | 58,744 | 56,492 | |||||||||||||||
| Average preferred stock | (6,808) | (6,808) | (6,808) | (6,808) | (6,808) | |||||||||||||||
| Average noncontrolling interests | (457) | (460) | (460) | (461) | (463) | |||||||||||||||
| Average goodwill (net of deferred tax liability) (1) | (11,544) | (11,513) | (11,515) | (11,494) | (11,457) | |||||||||||||||
| Average intangible assets (net of deferred tax liability), other than mortgage servicing rights | (1,734) | (1,806) | (1,885) | (1,981) | (2,087) | |||||||||||||||
| Average tangible common equity (i) | 40,813 | 39,484 | 38,604 | 38,000 | 35,677 | |||||||||||||||
| Return on tangible common equity (h)/(i) | 18.0 | % | 17.5 | % | 17.4 | % | 17.9 | % | 18.4 | % | ||||||||||
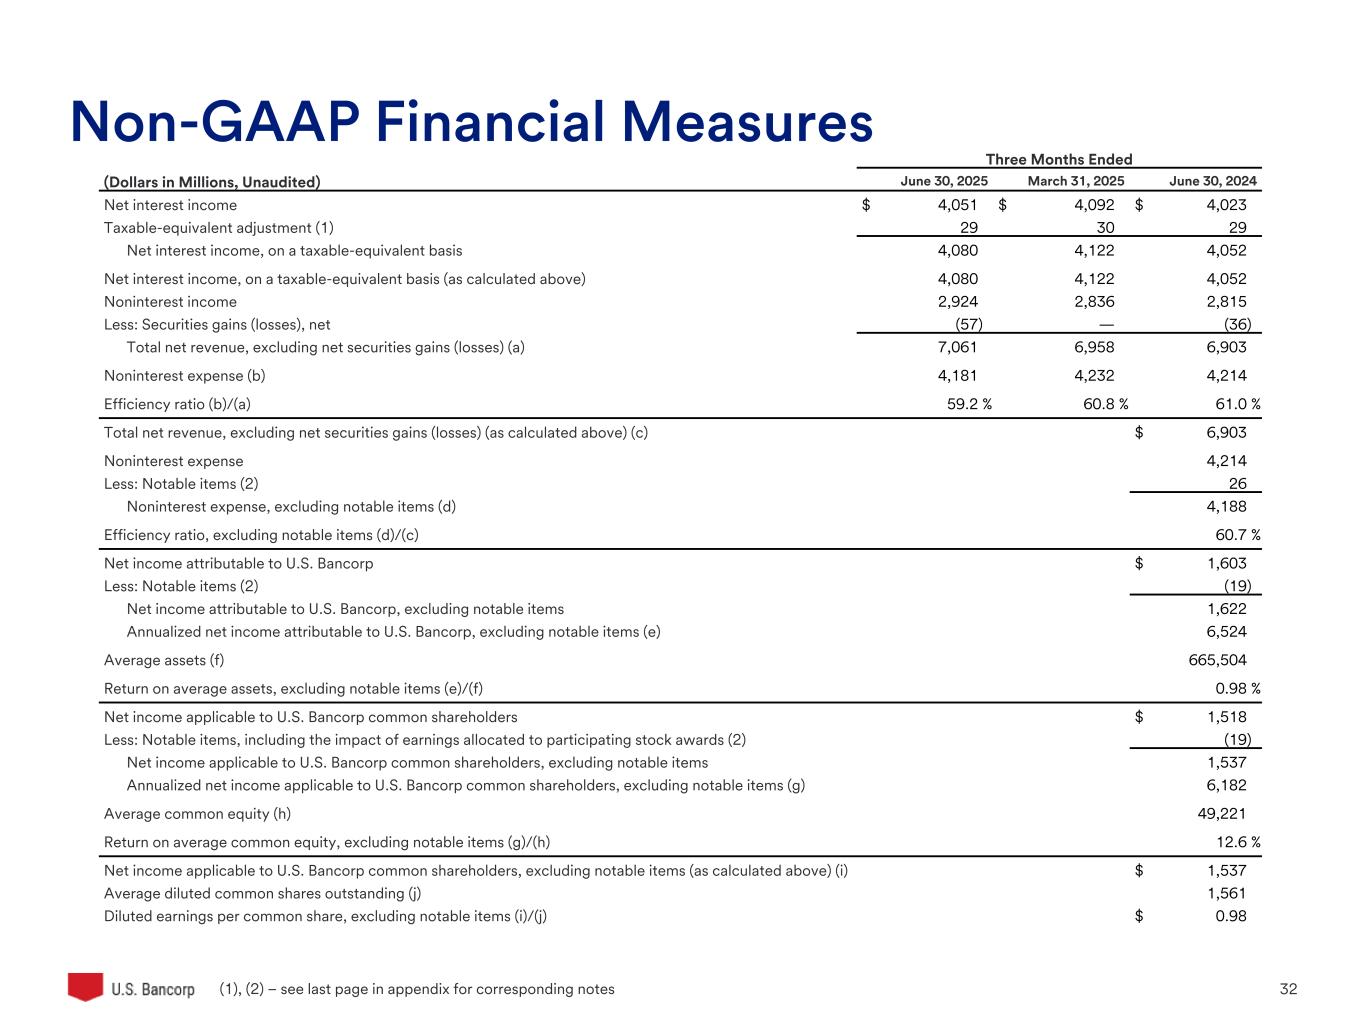
| Net interest income | $4,051 | $4,092 | $4,146 | $4,135 | $4,023 | |||||||||||||||
| Taxable-equivalent adjustment (4) | 29 | 30 | 30 | 31 | 29 | |||||||||||||||
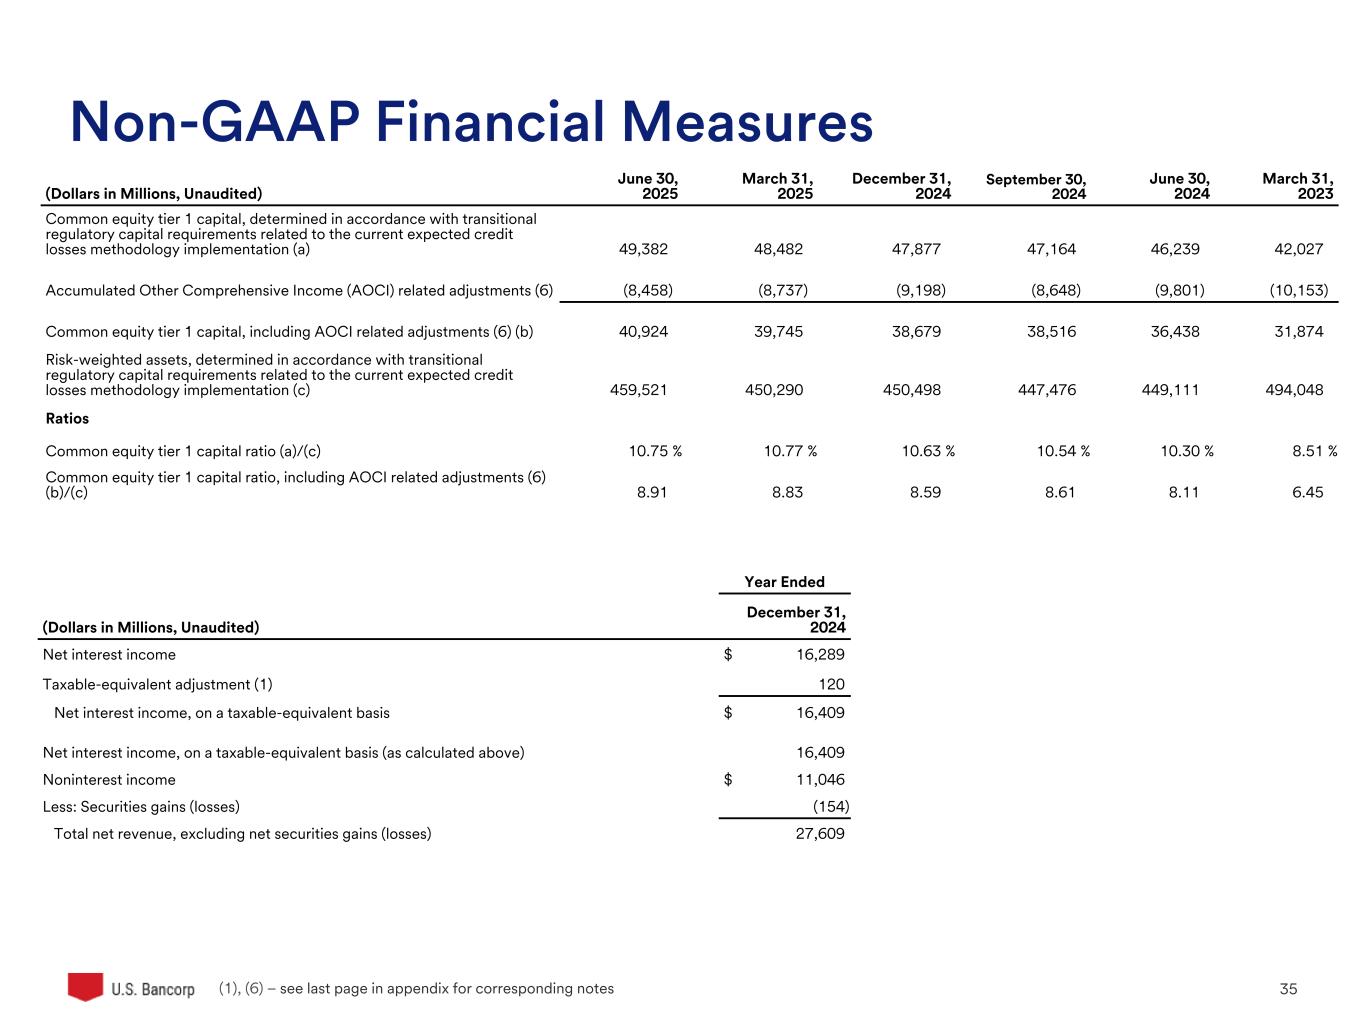
| Net interest income, on a taxable-equivalent basis | 4,080 | 4,122 | 4,176 | 4,166 | 4,052 | |||||||||||||||
| Net interest income, on a taxable-equivalent basis (as calculated above) | 4,080 | 4,122 | 4,176 | 4,166 | 4,052 | |||||||||||||||
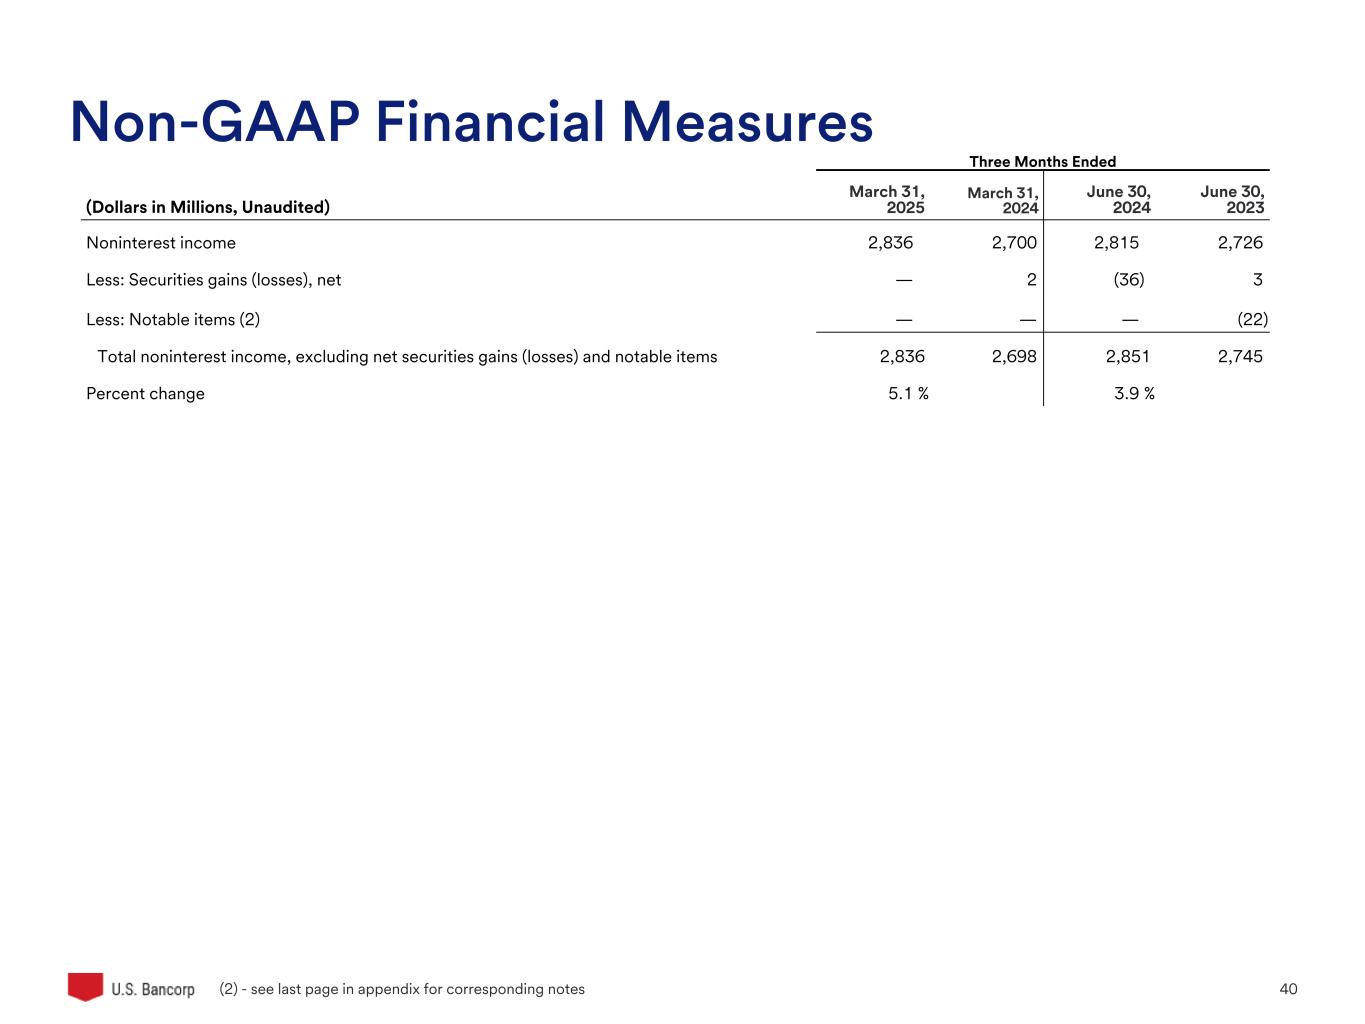
| Noninterest income | 2,924 | 2,836 | 2,833 | 2,698 | 2,815 | |||||||||||||||
| Less: Securities gains (losses), net | (57) | — | (1) | (119) | (36) | |||||||||||||||
| Total net revenue, excluding net securities gains (losses) (j) | 7,061 | 6,958 | 7,010 | 6,983 | 6,903 | |||||||||||||||
| Noninterest expense (k) | 4,181 | 4,232 | 4,311 | 4,204 | 4,214 | |||||||||||||||
| Less: Intangible amortization | 124 | 123 | 139 | 142 | 142 | |||||||||||||||
| Noninterest expense, excluding intangible amortization (l) | 4,057 | 4,109 | 4,172 | 4,062 | 4,072 | |||||||||||||||
| Efficiency ratio (k)/(j) | 59.2 | % | 60.8 | % | 61.5 | % | 60.2 | % | 61.0 | % | ||||||||||
| Tangible efficiency ratio (l)/(j) | 57.5 | 59.1 | 59.5 | 58.2 | 59.0 | |||||||||||||||
* Preliminary data. Subject to change prior to filings with applicable regulatory agencies.
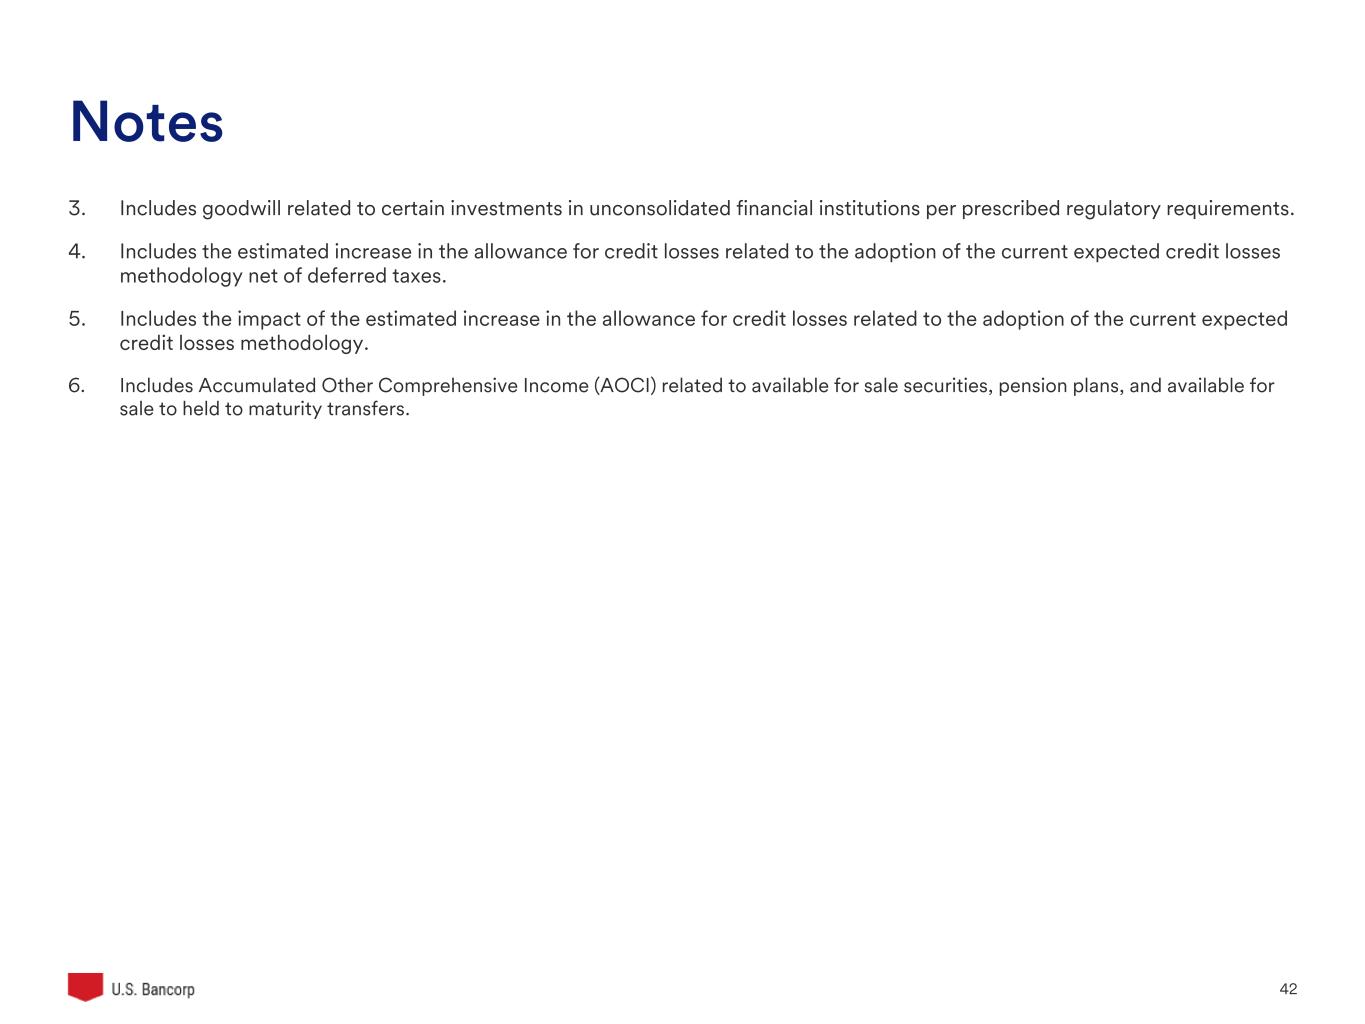
(1)Includes goodwill related to certain investments in unconsolidated financial institutions per prescribed regulatory requirements.
(2)Includes the estimated increase in the allowance for credit losses related to the adoption of the current expected credit losses methodology net of deferred taxes.
(3)Includes the impact of the estimated increase in the allowance for credit losses related to the adoption of the current expected credit losses methodology.
(4)Based on a federal income tax rate of 21 percent for those assets and liabilities whose income or expense is not included for federal income tax purposes.
18
| NON-GAAP FINANCIAL MEASURES | ||||||||||||||
| Three Months Ended | Six Months Ended | |||||||||||||
| (Dollars and Shares in Millions, Except Per Share Data, Unaudited) | June 30, 2024 | June 30, 2024 | ||||||||||||
| Net income applicable to U.S. Bancorp common shareholders | $1,518 | $2,727 | ||||||||||||
| Less: Notable items, including the impact of earnings allocated to participating stock awards (1), (2) | (19) | (217) | ||||||||||||
| Net income applicable to U.S. Bancorp common shareholders, excluding notable items (a) | 1,537 | 2,944 | ||||||||||||
| Average diluted common shares outstanding (b) | 1,561 | 1,560 | ||||||||||||
| Diluted earnings per common share, excluding notable items (a)/(b) | $.98 | $1.89 | ||||||||||||
| Three Months Ended | ||||||||||||||
| June 30, 2025 | June 30, 2024 | Percent Change | ||||||||||||
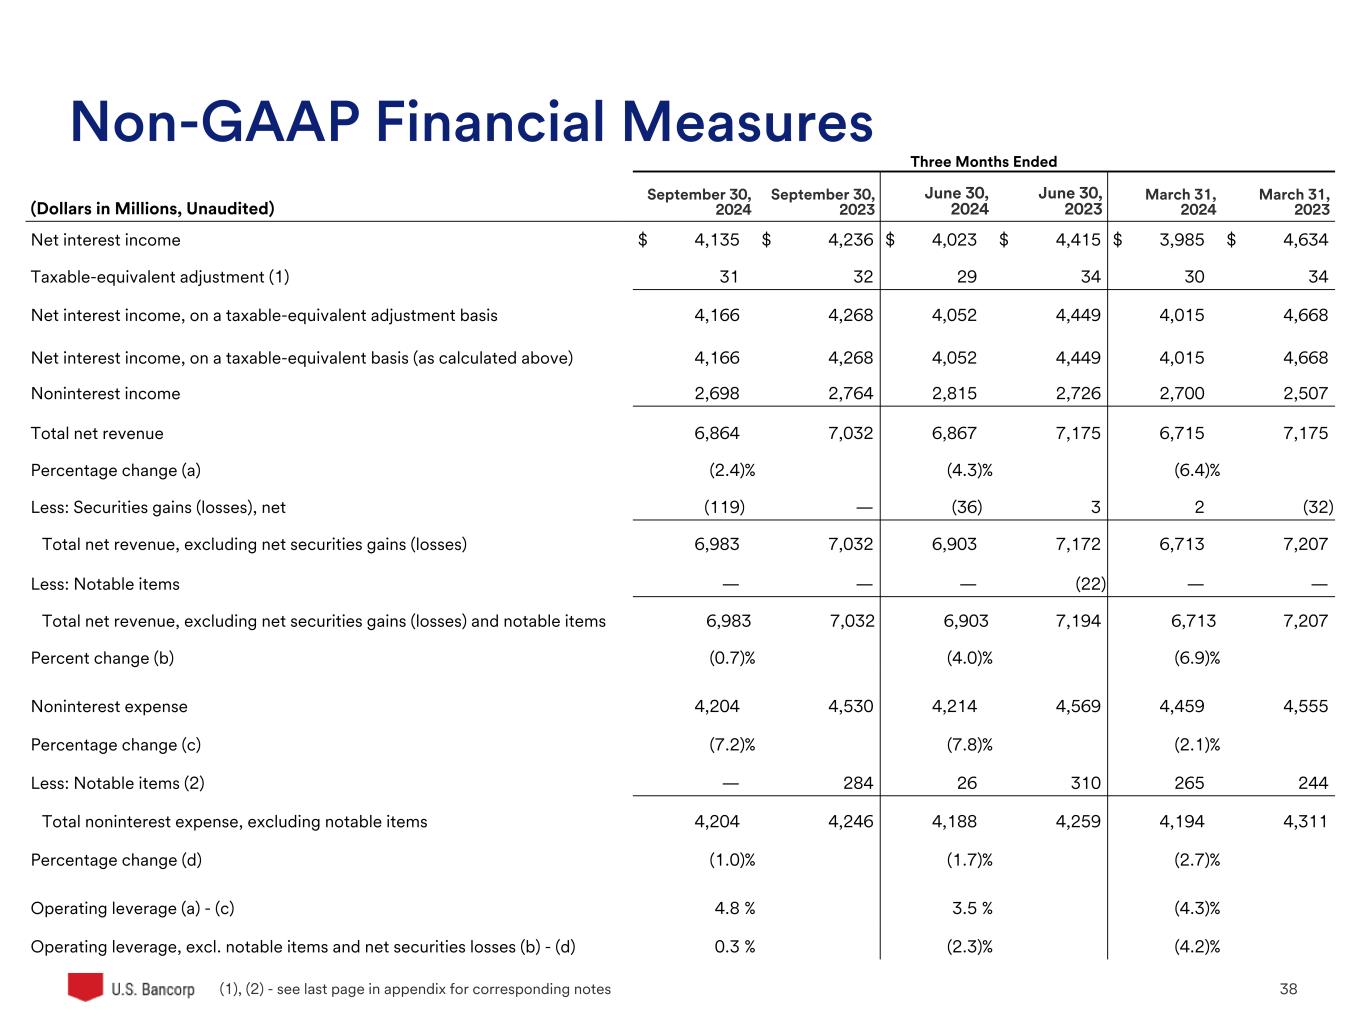
| Net interest income | $4,051 | $4,023 | ||||||||||||
| Taxable-equivalent adjustment (3) | 29 | 29 | ||||||||||||
| Net interest income, on a taxable-equivalent basis | 4,080 | 4,052 | ||||||||||||
| Net interest income, on a taxable-equivalent basis (as calculated above) | 4,080 | 4,052 | ||||||||||||
| Noninterest income | 2,924 | 2,815 | ||||||||||||
| Total net revenue | 7,004 | 6,867 | 2.0 | % | (c) | |||||||||
| Less: Securities gains (losses), net | (57) | (36) | ||||||||||||
| Total net revenue, excluding securities gains (losses), net | 7,061 | 6,903 | 2.3 | % | (d) | |||||||||
| Noninterest expense | 4,181 | 4,214 | (0.8) | % | (e) | |||||||||
| Less: Notable items (1) | — | 26 | ||||||||||||
| Total noninterest expense, excluding notable items | 4,181 | 4,188 | (0.2) | % | (f) | |||||||||
| Operating leverage (c) - (e) | 2.8 | % | ||||||||||||
| Operating leverage, excluding securities gains (losses) and notable items (d) - (f) | 2.5 | % | ||||||||||||
(1)Notable items for the three months ended June 30, 2024 included a $26 million ($19 million net-of-tax) charge for the increase in FDIC special assessment.
(2)Notable items of $291 million ($218 million net-of-tax) for the six months ended June 30, 2024 included $155 million of merger and integration-related charges and a $136 million charge for the increase in FDIC special assessment.
(3)Based on a federal income tax rate of 21 percent for those assets and liabilities whose income or expense is not included for federal income tax purposes.
19
Business Segment Schedules Second Quarter 2025 | ||
WEALTH, CORPORATE, COMMERCIAL AND INSTITUTIONAL BANKING CONSUMER AND BUSINESS BANKING PAYMENT SERVICES TREASURY AND CORPORATE SUPPORT | ||
| BUSINESS SEGMENT FINANCIAL PERFORMANCE | Preliminary data | |||||||||||||||||||||||||||||||
| ($ in millions) | Net Income Attributable to U.S. Bancorp | Percent Change | Net Income Attributable to U.S. Bancorp | |||||||||||||||||||||||||||||
| Business Segment | 2Q 2025 | 1Q 2025 | 2Q 2024 | 2Q25 vs 1Q25 | 2Q25 vs 2Q24 | YTD 2025 | YTD 2024 | Percent Change | ||||||||||||||||||||||||
| Wealth, Corporate, Commercial and Institutional Banking | $1,098 | $1,200 | $1,183 | (8.5) | (7.2) | $2,298 | $2,321 | (1.0) | ||||||||||||||||||||||||
| Consumer and Business Banking | 459 | 408 | 493 | 12.5 | (6.9) | 867 | 958 | (9.5) | ||||||||||||||||||||||||
| Payment Services | 325 | 337 | 289 | (3.6) | 12.5 | 662 | 523 | 26.6 | ||||||||||||||||||||||||
| Treasury and Corporate Support | (67) | (236) | (362) | 71.6 | 81.5 | (303) | (880) | 65.6 | ||||||||||||||||||||||||
| Consolidated Company | $1,815 | $1,709 | $1,603 | 6.2 | 13.2 | $3,524 | $2,922 | 20.6 | ||||||||||||||||||||||||
| Income Before Provision and Taxes | Percent Change | Income Before Provision and Taxes | ||||||||||||||||||||||||||||||
| 2Q 2025 | 1Q 2025 | 2Q 2024 | 2Q25 vs 1Q25 | 2Q25 vs 2Q24 | YTD 2025 | YTD 2024 | Percent Change | |||||||||||||||||||||||||
| Wealth, Corporate, Commercial and Institutional Banking | $1,647 | $1,610 | $1,677 | 2.3 | (1.8) | $3,257 | $3,335 | (2.3) | ||||||||||||||||||||||||
| Consumer and Business Banking | 651 | 606 | 688 | 7.4 | (5.4) | 1,257 | 1,362 | (7.7) | ||||||||||||||||||||||||
| Payment Services | 818 | 766 | 774 | 6.8 | 5.7 | 1,584 | 1,445 | 9.6 | ||||||||||||||||||||||||
| Treasury and Corporate Support | (293) | (256) | (486) | (14.5) | 39.7 | (549) | (1,233) | 55.5 | ||||||||||||||||||||||||
| Consolidated Company | $2,823 | $2,726 | $2,653 | 3.6 | 6.4 | $5,549 | $4,909 | 13.0 | ||||||||||||||||||||||||
Business Segments
The Company’s major business segments are Wealth, Corporate, Commercial and Institutional Banking, Consumer and Business Banking, Payment Services, and Treasury and Corporate Support. Business segment results are derived from the Company’s business unit profitability reporting systems by specifically attributing managed balance sheet assets, deposits and other liabilities and their related income or expense. Designations, assignments and allocations change from time to time as management systems are enhanced, methods of evaluating performance or product lines change or business segments are realigned to better respond to the Company’s diverse customer base. During 2025 and 2024, certain organization and methodology changes were made, including revising the Company's business segment funds transfer-pricing methodology related to deposits and loans during the second quarter of 2024. Prior period results were recast and presented on a comparable basis.
21
| |||||
| WEALTH, CORPORATE, COMMERCIAL AND INSTITUTIONAL BANKING | Preliminary data | ||||||||||||||||||||||||||||
| ($ in millions) | Percent Change | ||||||||||||||||||||||||||||
| 2Q 2025 | 1Q 2025 | 2Q 2024 | 2Q25 vs 1Q25 | 2Q25 vs 2Q24 | YTD 2025 | YTD 2024 | Percent Change | ||||||||||||||||||||||
| Condensed Income Statement | |||||||||||||||||||||||||||||
| Net interest income (taxable-equivalent basis) | $1,801 | $1,780 | $1,928 | 1.2 | (6.6) | $3,581 | $3,851 | (7.0) | |||||||||||||||||||||
| Noninterest income | 1,199 | 1,167 | 1,130 | 2.7 | 6.1 | 2,366 | 2,242 | 5.5 | |||||||||||||||||||||
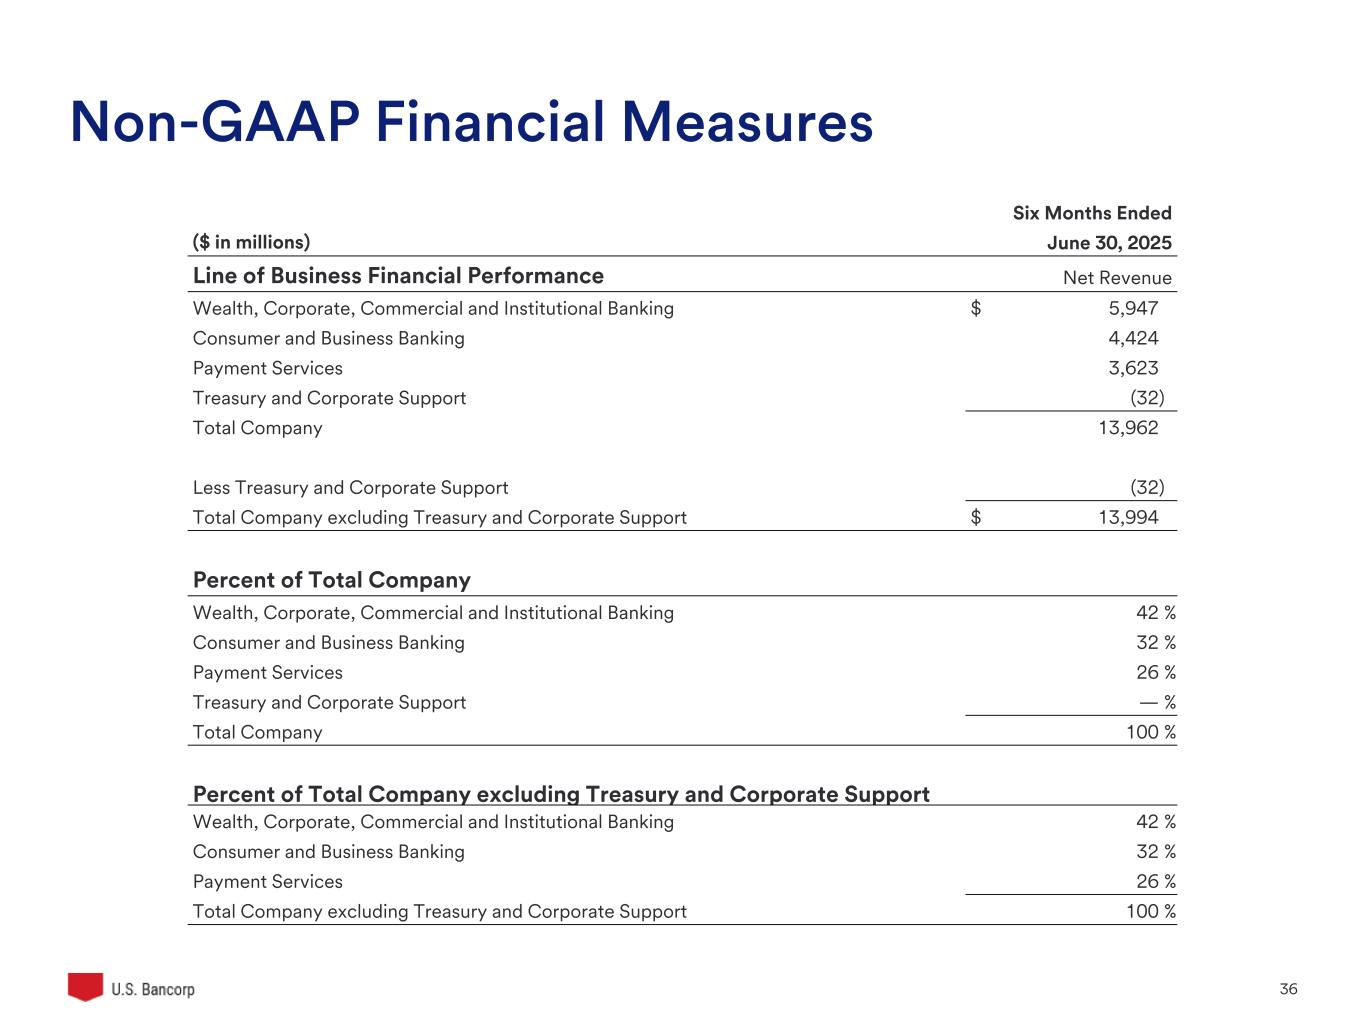
| Total net revenue | 3,000 | 2,947 | 3,058 | 1.8 | (1.9) | 5,947 | 6,093 | (2.4) | |||||||||||||||||||||
| Noninterest expense | 1,353 | 1,337 | 1,381 | 1.2 | (2.0) | 2,690 | 2,758 | (2.5) | |||||||||||||||||||||
| Income before provision and taxes | 1,647 | 1,610 | 1,677 | 2.3 | (1.8) | 3,257 | 3,335 | (2.3) | |||||||||||||||||||||
| Provision for credit losses | 183 | 10 | 100 | nm | 83.0 | 193 | 241 | (19.9) | |||||||||||||||||||||
| Income before income taxes | 1,464 | 1,600 | 1,577 | (8.5) | (7.2) | 3,064 | 3,094 | (1.0) | |||||||||||||||||||||
| Income taxes and taxable-equivalent adjustment | 366 | 400 | 394 | (8.5) | (7.1) | 766 | 773 | (.9) | |||||||||||||||||||||
| Net income | 1,098 | 1,200 | 1,183 | (8.5) | (7.2) | 2,298 | 2,321 | (1.0) | |||||||||||||||||||||
| Net (income) loss attributable to noncontrolling interests | — | — | — | — | — | — | — | — | |||||||||||||||||||||
| Net income attributable to U.S. Bancorp | $1,098 | $1,200 | $1,183 | (8.5) | (7.2) | $2,298 | $2,321 | (1.0) | |||||||||||||||||||||
| Average Balance Sheet Data | |||||||||||||||||||||||||||||
| Loans | $181,077 | $178,004 | $173,807 | 1.7 | 4.2 | $179,549 | $172,475 | 4.1 | |||||||||||||||||||||
| Other earning assets | 12,778 | 11,957 | 9,590 | 6.9 | 33.2 | 12,370 | 9,164 | 35.0 | |||||||||||||||||||||
| Goodwill | 4,826 | 4,824 | 4,824 | — | — | 4,825 | 4,824 | — | |||||||||||||||||||||
| Other intangible assets | 817 | 863 | 1,007 | (5.3) | (18.9) | 840 | 1,032 | (18.6) | |||||||||||||||||||||
| Assets | 211,954 | 208,656 | 203,313 | 1.6 | 4.3 | 210,314 | 201,291 | 4.5 | |||||||||||||||||||||
| Noninterest-bearing deposits | 54,422 | 55,171 | 57,362 | (1.4) | (5.1) | 54,794 | 58,001 | (5.5) | |||||||||||||||||||||
| Interest-bearing deposits | 210,094 | 216,214 | 218,233 | (2.8) | (3.7) | 213,136 | 213,933 | (.4) | |||||||||||||||||||||
| Total deposits | 264,516 | 271,385 | 275,595 | (2.5) | (4.0) | 267,930 | 271,934 | (1.5) | |||||||||||||||||||||
| Total U.S. Bancorp shareholders' equity | 21,817 | 21,550 | 21,487 | 1.2 | 1.5 | 21,684 | 21,624 | .3 | |||||||||||||||||||||
Wealth, Corporate, Commercial and Institutional Banking provides core banking, specialized lending, transaction and payment processing, capital markets, asset management, and brokerage and investment related services to wealth, middle market, large corporate, commercial real estate, government and institutional clients.
Wealth, Corporate, Commercial and Institutional Banking generated $1,647 million of income before provision and taxes in the second quarter of 2025, compared with $1,677 million in the second quarter of 2024, and contributed $1,098 million of the Company’s net income in the second quarter of 2025. The provision for credit losses increased $83 million (83.0 percent) compared with the second quarter of 2024 primarily due to increased reserves and charge-offs on select problem assets. Total net revenue was $58 million (1.9 percent) lower in the second quarter of 2025 due to a decrease of $127 million (6.6 percent) in net interest income, partially offset by an increase of $69 million (6.1 percent) in noninterest income. Net interest income decreased primarily due to lower noninterest-bearing deposit balances and continued rotation within the deposit portfolio. Noninterest income increased primarily due to business growth and favorable market conditions in trust and investment management fees and higher treasury management fees in service charges. Noninterest expense decreased $28 million (2.0 percent) compared with the second quarter of 2024 primarily due to lower compensation and employee benefits expense and technology and communications expense.
22
| |||||
| CONSUMER AND BUSINESS BANKING | Preliminary data | ||||||||||||||||||||||||||||
| ($ in millions) | Percent Change | ||||||||||||||||||||||||||||
| 2Q 2025 | 1Q 2025 | 2Q 2024 | 2Q25 vs 1Q25 | 2Q25 vs 2Q24 | YTD 2025 | YTD 2024 | Percent Change | ||||||||||||||||||||||
| Condensed Income Statement | |||||||||||||||||||||||||||||
| Net interest income (taxable-equivalent basis) | $1,843 | $1,768 | $1,912 | 4.2 | (3.6) | $3,611 | $3,783 | (4.5) | |||||||||||||||||||||
| Noninterest income | 406 | 407 | 414 | (.2) | (1.9) | 813 | 838 | (3.0) | |||||||||||||||||||||
| Total net revenue | 2,249 | 2,175 | 2,326 | 3.4 | (3.3) | 4,424 | 4,621 | (4.3) | |||||||||||||||||||||
| Noninterest expense | 1,598 | 1,569 | 1,638 | 1.8 | (2.4) | 3,167 | 3,259 | (2.8) | |||||||||||||||||||||
| Income before provision and taxes | 651 | 606 | 688 | 7.4 | (5.4) | 1,257 | 1,362 | (7.7) | |||||||||||||||||||||
| Provision for credit losses | 39 | 62 | 30 | (37.1) | 30.0 | 101 | 84 | 20.2 | |||||||||||||||||||||
| Income before income taxes | 612 | 544 | 658 | 12.5 | (7.0) | 1,156 | 1,278 | (9.5) | |||||||||||||||||||||
| Income taxes and taxable-equivalent adjustment | 153 | 136 | 165 | 12.5 | (7.3) | 289 | 320 | (9.7) | |||||||||||||||||||||
| Net income | 459 | 408 | 493 | 12.5 | (6.9) | 867 | 958 | (9.5) | |||||||||||||||||||||
| Net (income) loss attributable to noncontrolling interests | — | — | — | — | — | — | — | — | |||||||||||||||||||||
| Net income attributable to U.S. Bancorp | $459 | $408 | $493 | 12.5 | (6.9) | $867 | $958 | (9.5) | |||||||||||||||||||||
| Average Balance Sheet Data | |||||||||||||||||||||||||||||
| Loans | $149,661 | $153,914 | $154,931 | (2.8) | (3.4) | $151,776 | $154,940 | (2.0) | |||||||||||||||||||||
| Other earning assets | 4,875 | 1,778 | 2,278 | nm | nm | 3,335 | 2,079 | 60.4 | |||||||||||||||||||||
| Goodwill | 4,326 | 4,325 | 4,326 | — | — | 4,326 | 4,326 | — | |||||||||||||||||||||
| Other intangible assets | 4,277 | 4,368 | 4,734 | (2.1) | (9.7) | 4,322 | 4,715 | (8.3) | |||||||||||||||||||||
| Assets | 165,175 | 166,499 | 168,705 | (.8) | (2.1) | 165,834 | 168,946 | (1.8) | |||||||||||||||||||||
| Noninterest-bearing deposits | 19,610 | 19,117 | 20,845 | 2.6 | (5.9) | 19,365 | 21,081 | (8.1) | |||||||||||||||||||||
| Interest-bearing deposits | 200,903 | 198,949 | 201,012 | 1.0 | (.1) | 199,932 | 199,247 | .3 | |||||||||||||||||||||
| Total deposits | 220,513 | 218,066 | 221,857 | 1.1 | (.6) | 219,297 | 220,328 | (.5) | |||||||||||||||||||||
| Total U.S. Bancorp shareholders' equity | 13,562 | 13,705 | 14,558 | (1.0) | (6.8) | 13,633 | 14,705 | (7.3) | |||||||||||||||||||||
Consumer and Business Banking comprises consumer banking, small business banking and consumer lending. Products and services are delivered through banking offices, telephone servicing and sales, online services, direct mail, ATMs, mobile devices, distributed mortgage loan officers, and intermediary relationships including auto dealerships, mortgage banks, and strategic business partners.
Consumer and Business Banking generated $651 million of income before provision and taxes in the second quarter of 2025, compared with $688 million in the second quarter of 2024, and contributed $459 million of the Company’s net income in the second quarter of 2025. The provision for credit losses increased $9 million (30.0 percent) compared with the second quarter of 2024 primarily due to higher net charge-offs. Total net revenue was lower by $77 million (3.3 percent) in the second quarter of 2025 due to a decrease of $69 million (3.6 percent) in net interest income and a decrease of $8 million (1.9 percent) in noninterest income. Net interest income decreased primarily due to continued rotation within the deposit portfolio. Noninterest income decreased primarily due to lower other revenue. Noninterest expense decreased $40 million (2.4 percent) primarily due to lower compensation and employee benefits expense and professional services expense.
23
| |||||
| PAYMENT SERVICES | Preliminary data | ||||||||||||||||||||||||||||
| ($ in millions) | Percent Change | ||||||||||||||||||||||||||||
| 2Q 2025 | 1Q 2025 | 2Q 2024 | 2Q25 vs 1Q25 | 2Q25 vs 2Q24 | YTD 2025 | YTD 2024 | Percent Change | ||||||||||||||||||||||
| Condensed Income Statement | |||||||||||||||||||||||||||||
| Net interest income (taxable-equivalent basis) | $730 | $742 | $673 | (1.6) | 8.5 | $1,472 | $1,375 | 7.1 | |||||||||||||||||||||
| Noninterest income | 1,116 | 1,035 | 1,093 | 7.8 | 2.1 | 2,151 | 2,071 | 3.9 | |||||||||||||||||||||
| Total net revenue | 1,846 | 1,777 | 1,766 | 3.9 | 4.5 | 3,623 | 3,446 | 5.1 | |||||||||||||||||||||
| Noninterest expense | 1,028 | 1,011 | 992 | 1.7 | 3.6 | 2,039 | 2,001 | 1.9 | |||||||||||||||||||||
| Income before provision and taxes | 818 | 766 | 774 | 6.8 | 5.7 | 1,584 | 1,445 | 9.6 | |||||||||||||||||||||
| Provision for credit losses | 384 | 317 | 388 | 21.1 | (1.0) | 701 | 747 | (6.2) | |||||||||||||||||||||
| Income before income taxes | 434 | 449 | 386 | (3.3) | 12.4 | 883 | 698 | 26.5 | |||||||||||||||||||||
| Income taxes and taxable-equivalent adjustment | 109 | 112 | 97 | (2.7) | 12.4 | 221 | 175 | 26.3 | |||||||||||||||||||||
| Net income | 325 | 337 | 289 | (3.6) | 12.5 | 662 | 523 | 26.6 | |||||||||||||||||||||
| Net (income) loss attributable to noncontrolling interests | — | — | — | — | — | — | — | — | |||||||||||||||||||||
| Net income attributable to U.S. Bancorp | $325 | $337 | $289 | (3.6) | 12.5 | $662 | $523 | 26.6 | |||||||||||||||||||||
| Average Balance Sheet Data | |||||||||||||||||||||||||||||
| Loans | $42,229 | $41,611 | $40,832 | 1.5 | 3.4 | $41,922 | $40,318 | 4.0 | |||||||||||||||||||||
| Other earning assets | 5 | 57 | 115 | (91.2) | (95.7) | 31 | 134 | (76.9) | |||||||||||||||||||||
| Goodwill | 3,425 | 3,392 | 3,327 | 1.0 | 2.9 | 3,409 | 3,330 | 2.4 | |||||||||||||||||||||
| Other intangible assets | 258 | 249 | 281 | 3.6 | (8.2) | 254 | 291 | (12.7) | |||||||||||||||||||||
| Assets | 47,840 | 46,829 | 46,096 | 2.2 | 3.8 | 47,338 | 46,456 | 1.9 | |||||||||||||||||||||
| Noninterest-bearing deposits | 2,512 | 2,682 | 2,706 | (6.3) | (7.2) | 2,597 | 2,749 | (5.5) | |||||||||||||||||||||
| Interest-bearing deposits | 95 | 94 | 96 | 1.1 | (1.0) | 95 | 96 | (1.0) | |||||||||||||||||||||
| Total deposits | 2,607 | 2,776 | 2,802 | (6.1) | (7.0) | 2,692 | 2,845 | (5.4) | |||||||||||||||||||||
| Total U.S. Bancorp shareholders' equity | 10,235 | 10,229 | 9,941 | .1 | 3.0 | 10,232 | 9,953 | 2.8 | |||||||||||||||||||||
Payment Services includes consumer and business credit cards, stored-value cards, debit cards, corporate, government and purchasing card services and merchant processing.
Payment Services generated $818 million of income before provision and taxes in the second quarter of 2025, compared with $774 million in the second quarter of 2024, and contributed $325 million of the Company’s net income in the second quarter of 2025. The provision for credit losses was relatively stable, decreasing $4 million (1.0 percent) compared with the second quarter of 2024. Total net revenue increased $80 million (4.5 percent) in the second quarter of 2025 due to higher net interest income of $57 million (8.5 percent) and higher noninterest income of $23 million (2.1 percent). Net interest income increased primarily due to higher average loan balances and lower funding costs, partially offset by lower loan spreads. Noninterest income increased primarily due to increases in card revenue mainly due to higher sales volume and merchant processing services due to favorable rates. Noninterest expense increased $36 million (3.6 percent) due to higher marketing and business development expense and other expense.
24
| |||||
| TREASURY AND CORPORATE SUPPORT | Preliminary data | ||||||||||||||||||||||||||||
| ($ in millions) | Percent Change | ||||||||||||||||||||||||||||
| 2Q 2025 | 1Q 2025 | 2Q 2024 | 2Q25 vs 1Q25 | 2Q25 vs 2Q24 | YTD 2025 | YTD 2024 | Percent Change | ||||||||||||||||||||||
| Condensed Income Statement | |||||||||||||||||||||||||||||
| Net interest income (taxable-equivalent basis) | ($294) | ($168) | ($461) | (75.0) | 36.2 | ($462) | ($942) | 51.0 | |||||||||||||||||||||
| Noninterest income | 203 | 227 | 178 | (10.6) | 14.0 | 430 | 364 | 18.1 | |||||||||||||||||||||
| Total net revenue | (91) | 59 | (283) | nm | 67.8 | (32) | (578) | 94.5 | |||||||||||||||||||||
| Noninterest expense | 202 | 315 | 203 | (35.9) | (.5) | 517 | 655 | (21.1) | |||||||||||||||||||||
| Income (loss) before provision and taxes | (293) | (256) | (486) | (14.5) | 39.7 | (549) | (1,233) | 55.5 | |||||||||||||||||||||
| Provision for credit losses | (105) | 148 | 50 | nm | nm | 43 | 49 | (12.2) | |||||||||||||||||||||
| Income (loss) before income taxes | (188) | (404) | (536) | 53.5 | 64.9 | (592) | (1,282) | 53.8 | |||||||||||||||||||||
| Income taxes and taxable-equivalent adjustment | (127) | (175) | (182) | 27.4 | 30.2 | (302) | (417) | 27.6 | |||||||||||||||||||||
| Net income | (61) | (229) | (354) | 73.4 | 82.8 | (290) | (865) | 66.5 | |||||||||||||||||||||
| Net (income) loss attributable to noncontrolling interests | (6) | (7) | (8) | 14.3 | 25.0 | (13) | (15) | 13.3 | |||||||||||||||||||||
| Net income (loss) attributable to U.S. Bancorp | ($67) | ($236) | ($362) | 71.6 | 81.5 | ($303) | ($880) | 65.6 | |||||||||||||||||||||
| Average Balance Sheet Data | |||||||||||||||||||||||||||||
| Loans | $5,562 | $5,499 | $5,115 | 1.1 | 8.7 | $5,530 | $5,145 | 7.5 | |||||||||||||||||||||
| Other earning assets | 217,155 | 217,410 | 222,224 | (.1) | (2.3) | 217,281 | 218,258 | (.4) | |||||||||||||||||||||
| Goodwill | — | — | — | — | — | — | — | — | |||||||||||||||||||||
| Other intangible assets | 8 | 8 | 9 | — | (11.1) | 8 | 10 | (20.0) | |||||||||||||||||||||
| Assets | 248,372 | 247,409 | 247,390 | .4 | .4 | 247,892 | 243,014 | 2.0 | |||||||||||||||||||||
| Noninterest-bearing deposits | 2,573 | 2,726 | 2,505 | (5.6) | 2.7 | 2,649 | 2,271 | 16.6 | |||||||||||||||||||||
| Interest-bearing deposits | 12,681 | 11,581 | 11,150 | 9.5 | 13.7 | 12,134 | 11,107 | 9.2 | |||||||||||||||||||||
| Total deposits | 15,254 | 14,307 | 13,655 | 6.6 | 11.7 | 14,783 | 13,378 | 10.5 | |||||||||||||||||||||
| Total U.S. Bancorp shareholders' equity | 15,285 | 14,127 | 10,043 | 8.2 | 52.2 | 14,709 | 9,567 | 53.7 | |||||||||||||||||||||
Treasury and Corporate Support includes the Company’s investment portfolios, funding, capital management, interest rate risk management, income taxes not allocated to the business segments, including most investments in tax-advantaged projects, and the residual aggregate of those expenses associated with corporate activities that are managed on a consolidated basis.
Treasury and Corporate Support generated a $293 million loss before provision and taxes in the second quarter of 2025, compared with a $486 million loss before provision and taxes in the second quarter of 2024, and recorded a net loss of $67 million in the second quarter of 2025. The provision for credit losses decreased $155 million compared with the second quarter of 2024 primarily due to a stable economic outlook in the second quarter of 2025 and improved credit quality. Total net revenue was higher by $192 million (67.8 percent) in the second quarter of 2025 due to an increase of $167 million (36.2 percent) in net interest income and an increase of $25 million (14.0 percent) in noninterest income. Net interest income increased primarily due to lower funding costs as well as the impact of fixed asset repricing. The increase in noninterest income was primarily due to higher tax credit investment activity, higher capital markets revenue, and the impact of other favorable items in other revenue, partially offset by lower mortgage banking revenue due to the gain on the sale of mortgage servicing rights in the prior year quarter. Noninterest expense decreased $1 million (0.5 percent) compared with the second quarter of 2024 primarily due to lower marketing and business development expense and the notable item in the prior year quarter, partially offset by higher compensation and employee benefits expense and technology and communications expense.
Income taxes are assessed to each business segment at a managerial tax rate of 25.0 percent with the residual tax expense or benefit to arrive at the consolidated effective tax rate included in Treasury and Corporate Support.
25