Exhibit 99.1
|
|
U.S. Bancorp Reports First Quarter 2021 Results
• Net revenue of $5.5 billion and net income of $2.3 billion • Return on average assets of 1.69% and return on average common equity of 19.0% • Common Equity Tier 1 capital ratio of 9.9% and strong levels of liquidity
| |
|
1Q21 Key Financial Data |
1Q21 Highlights |

|
PROFITABILITY METRICS |
1Q21 | 4Q20 | 1Q20 |
|
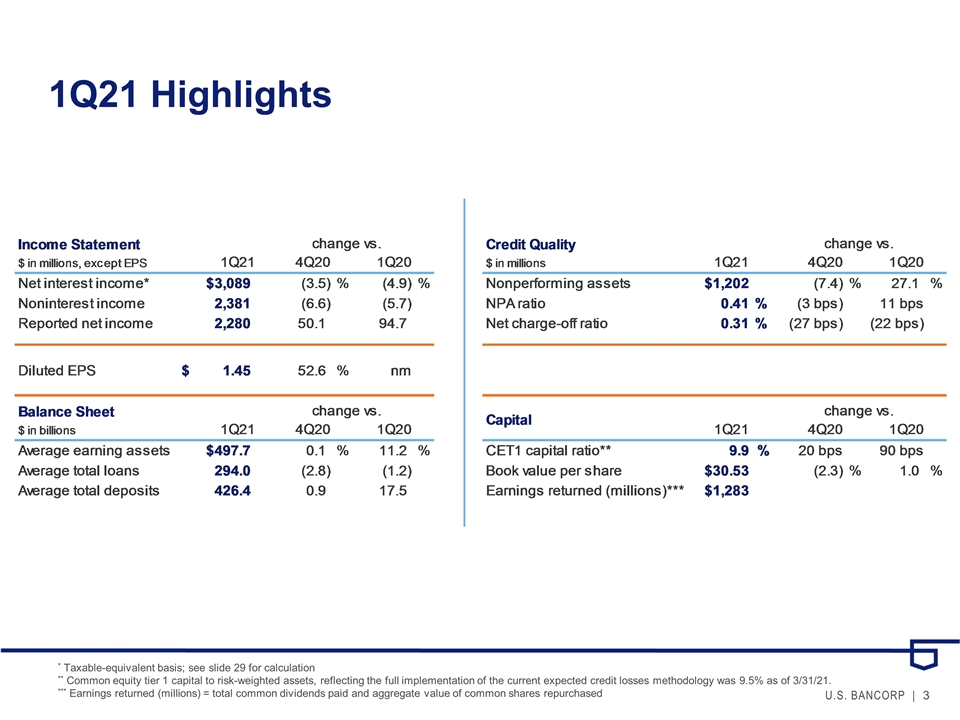
• Net income of $2,280 million and diluted earnings per common share of $1.45
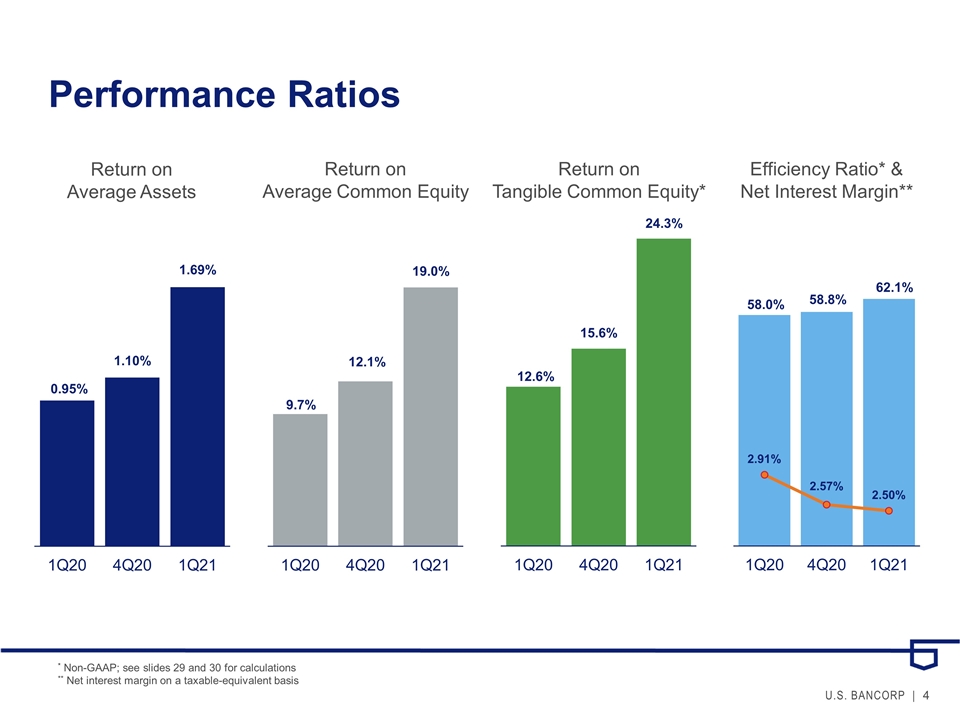
• Return on average assets of 1.69% and return on average common equity of 19.0%
• Net revenue of $5,470 million, including $3,089 million of net interest income and $2,381 million of noninterest income
• Average total earning assets growth of 11.2% year-over-year
• Average total deposits growth of 17.5% year-over-year
• Net charge-off ratio of 0.31% in 1Q21 compared with 0.58% in 4Q20 and 0.53% in the 1Q20
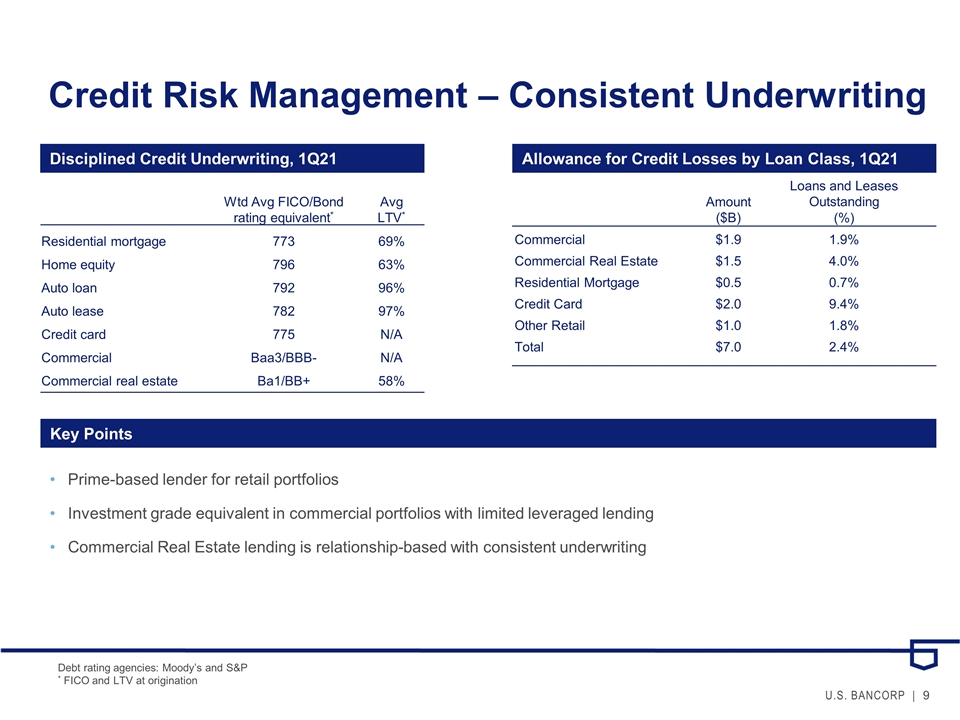
• Allowance for credit losses declined $1,050 million during the quarter given improving economic outlook and credit trends
• Nonperforming assets decreased 7.4% on a linked quarter basis and increased 27.1% year-over year
• CET1 capital ratio increased to 9.9% at March 31, 2021, compared with 9.7% at December 31, 2020
| |||||||||||
| Return on average assets (%) |
1.69 | 1.10 | .95 | |||||||||||||
| Return on average common equity (%) |
19.0 | 12.1 | 9.7 | |||||||||||||
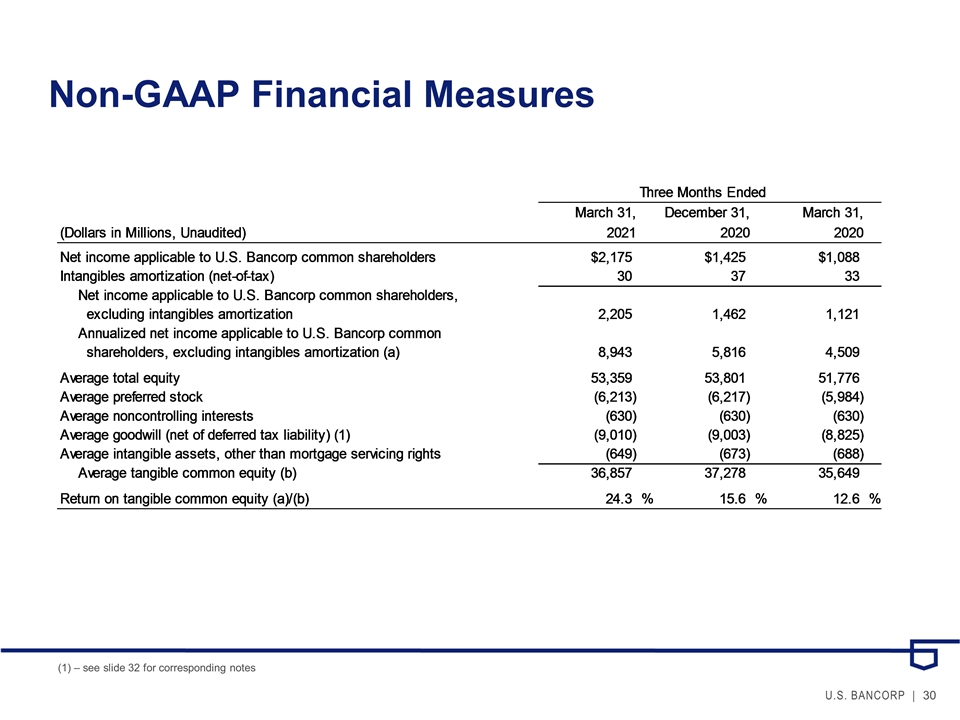
| Return on tangible common equity (%) (a) |
24.3 | 15.6 | 12.6 | |||||||||||||
| Net interest margin (%) |
2.50 | 2.57 | 2.91 | |||||||||||||
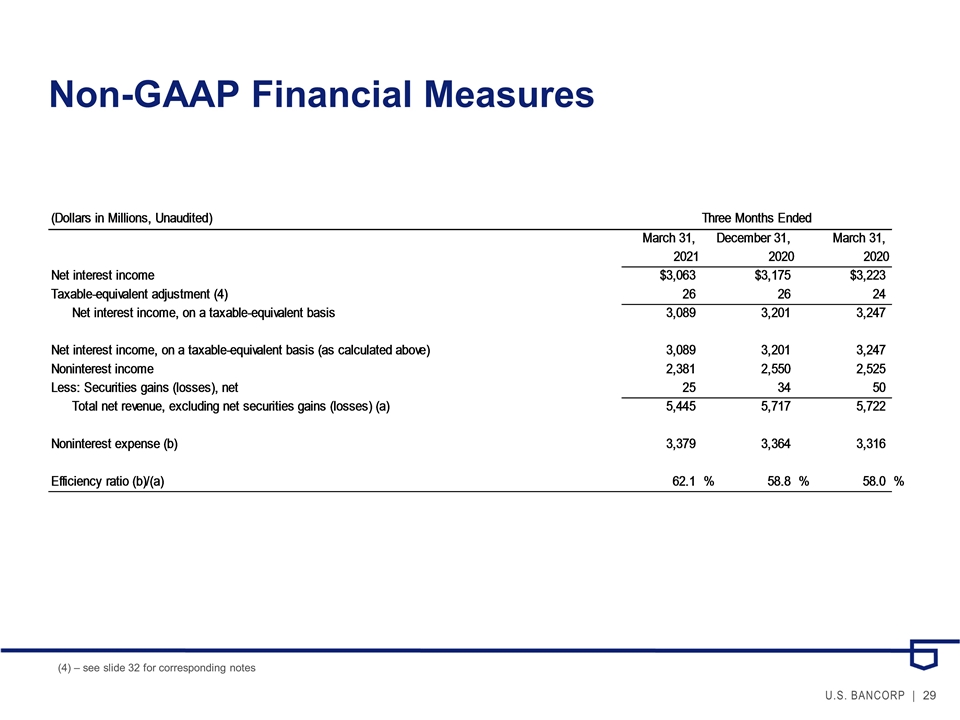
| Efficiency ratio (%) (a) |
62.1 | 58.8 | 58.0 | |||||||||||||
| INCOME STATEMENT (b) |
1Q21 | 4Q20 | 1Q20 | |||||||||||||
| Net interest income (taxable-equivalent basis) |
$3,089 | $3,201 | $3,247 | |||||||||||||
| Noninterest income |
$2,381 | $2,550 | $2,525 | |||||||||||||
| Net income attributable to U.S. Bancorp |
$2,280 | $1,519 | $1,171 | |||||||||||||
| Diluted earnings per common share |
$1.45 | $.95 | $.72 | |||||||||||||
| Dividends declared per common share |
$.42 | $.42 | $.42 | |||||||||||||
| BALANCE SHEET (b) |
1Q21 | 4Q20 | 1Q20 | |||||||||||||
| Average total loans |
$293,989 | $302,308 | $297,657 | |||||||||||||
| Average total deposits |
$426,364 | $422,413 | $362,804 | |||||||||||||
| Net charge-off ratio |
.31% | .58% | .53% | |||||||||||||
| Book value per common share (period end) |
$30.53 | $31.26 | $30.24 | |||||||||||||
| Basel III standardized CET1 (c) |
9.9% | 9.7% | 9.0% | |||||||||||||
|
|
||||||||||||||||
|
(a) See Non-GAAP Financial Measures reconciliation on page 16 |
|
|||||||||||||||
|
(b) Dollars in millions, except per share data |
|
|||||||||||||||
|
(c) CET1 = Common equity tier 1 capital ratio |
|
|||||||||||||||
|
CEO Commentary
| ||||||||||
“A lot has changed in the last year, and our first quarter results were reflective of improving economic conditions and increasing consumer confidence and spending activity. Credit quality continues to perform better than we had expected – in fact, we incurred the bank’s lowest net charge-off ratio in recent decades – and an improved outlook for future performance allowed us to release over a billion dollars in reserves for credit losses. Our payments businesses are well-positioned to take advantage of the cyclical recovery and renewed business and consumer activity. In a similar fashion, we will continue to invest in capabilities to create growth, as evidenced by our advances in digital, our alliance with State Farm and our acquisition of talech, an important small business payments capability. These investments will drive revenue growth and further efficiencies that will create value for our business, customers and shareholders. Although the pandemic has disrupted most aspects of personal and professional life for more than a year, our employees have dedicated themselves to service and our company’s success. I appreciate their hard work and everything they continue to do to position us for better days ahead.”
— Andy Cecere, Chairman, President and CEO, U.S. Bancorp
In the Spotlight

Investor contact: Jennifer Thompson, 612.303.0778 | Media contact: Jeff Shelman, 612.422.1423
|
|
U.S. Bancorp First Quarter 2021 Results | |
| INCOME STATEMENT HIGHLIGHTS | ||||||||||||||||||||
| ($ in millions, except per-share data) | Percent Change | |||||||||||||||||||
| 1Q 2021 |
4Q 2020 |
1Q 2020 |
1Q21 vs 4Q20 |
1Q21 vs 1Q20 |
||||||||||||||||
| Net interest income |
$3,063 | $3,175 | $3,223 | (3.5) | (5.0) | |||||||||||||||
| Taxable-equivalent adjustment |
26 | 26 | 24 | -- | 8.3 | |||||||||||||||
| Net interest income (taxable-equivalent basis) |
3,089 | 3,201 | 3,247 | (3.5) | (4.9) | |||||||||||||||
| Noninterest income |
2,381 | 2,550 | 2,525 | (6.6) | (5.7) | |||||||||||||||
| Total net revenue |
5,470 | 5,751 | 5,772 | (4.9) | (5.2) | |||||||||||||||
| Noninterest expense |
3,379 | 3,364 | 3,316 | .4 | 1.9 | |||||||||||||||
| Income before provision and income taxes |
2,091 | 2,387 | 2,456 | (12.4) | (14.9) | |||||||||||||||
| Provision for credit losses |
(827) | 441 | 993 | nm | nm | |||||||||||||||
| Income before taxes |
2,918 | 1,946 | 1,463 | 49.9 | 99.5 | |||||||||||||||
| Income taxes and taxable-equivalent adjustment |
633 | 421 | 284 | 50.4 | nm | |||||||||||||||
| Net income |
2,285 | 1,525 | 1,179 | 49.8 | 93.8 | |||||||||||||||
| Net (income) loss attributable to noncontrolling interests |
(5) | (6) | (8) | 16.7 | 37.5 | |||||||||||||||
| Net income attributable to U.S. Bancorp |
$2,280 | $1,519 | $1,171 | 50.1 | 94.7 | |||||||||||||||
| Net income applicable to U.S. Bancorp common shareholders |
$2,175 | $1,425 | $1,088 | 52.6 | 99.9 | |||||||||||||||
| Diluted earnings per common share |
$1.45 | $.95 | $.72 | 52.6 | nm | |||||||||||||||
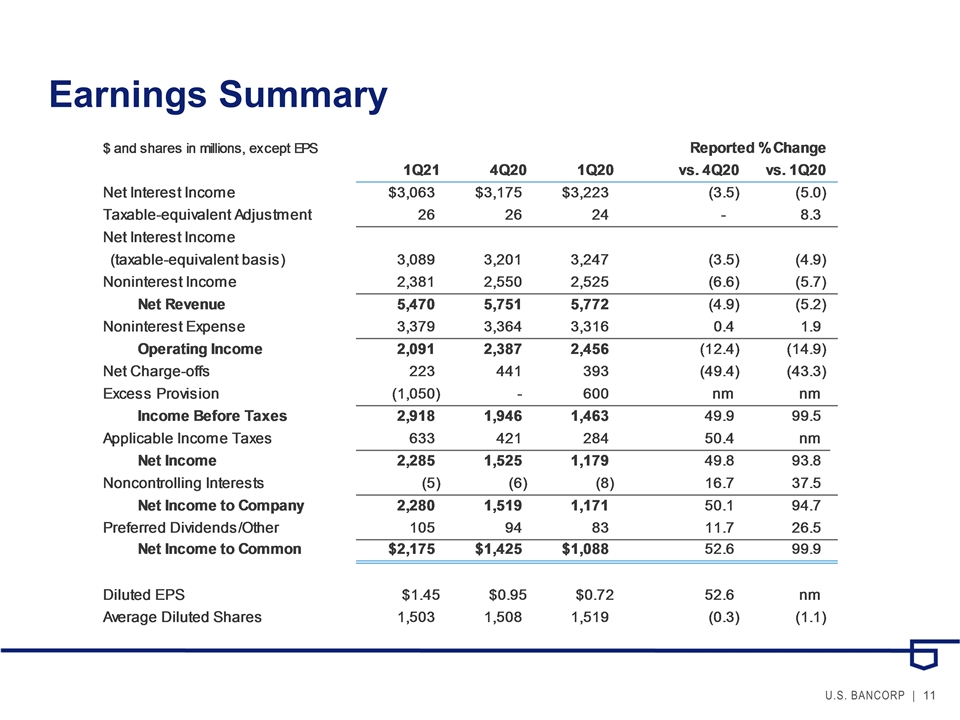
Net income attributable to U.S. Bancorp was $2,280 million for the first quarter of 2021, which was 94.7 percent higher than the $1,171 million for the first quarter of 2020, and 50.1 percent higher than the $1,519 million for the fourth quarter of 2020. Diluted earnings per common share were $1.45 in the first quarter of 2021, compared with $0.72 in the first quarter of 2020 and $0.95 in the fourth quarter of 2020.
The increase in net income year-over-year was primarily due to lower provision for credit losses, partially offset by lower net interest income and noninterest income in addition to higher noninterest expense. Net interest income decreased 4.9 percent on a year-over-year tax-equivalent basis, primarily due to the impact of lower rates compared with a year ago and higher premium amortization in the investment portfolio related to mortgage refinancing activities, partially offset by the benefit of deposit and funding mix as well as higher loan fees related to the Small Business Administration (“SBA”) Paycheck Protection Program. Net interest margin declined from a year ago to 2.50 percent in the first quarter of 2021 primarily due to the impact of a lower yield curve on earning assets, higher levels of liquidity and higher premium amortization within the investment portfolio, partially offset by the net benefit of deposit repricing and funding composition and higher loan fees. Noninterest income decreased 5.7 percent compared with a year ago, driven by lower mortgage banking revenue, deposit service charges, securities gains and other noninterest income, partially offset by improvement in trust and investment management fees and commercial products revenue. Noninterest expense increased 1.9 percent reflecting increases in personnel expense, primarily related to performance-based incentive compensation, as well as technology and communications expense, partially offset by lower net occupancy and equipment expense, marketing and business development expense, and other noninterest expense.
Net income increased on a linked quarter basis primarily due to lower provision for credit losses, partially offset by lower net interest income and noninterest income. Net interest income decreased 3.5 percent primarily due to lower average loan balances, the yield impact of prepayments, and two less days in the quarter, partially offset by the benefit of deposit and funding mix as well as higher loan fees. The net interest margin decreased on a linked quarter basis primarily reflecting the dilutive impact of investment portfolio reinvestment rates, premium amortization and mortgage prepayments, partially offset by lower cash balances. Noninterest income decreased 6.6 percent compared with the fourth quarter of 2020 driven by a decline in mortgage banking revenue, credit and debit card revenue, and other noninterest income, partially offset by higher commercial product revenue. Noninterest expense was relatively flat, reflecting higher personnel expense related to incentive compensation and the seasonal impact of payroll taxes, partially offset by lower professional services expense, marketing and business development expense and other noninterest expense.
2
|
|
U.S. Bancorp First Quarter 2021 Results | |
| NET INTEREST INCOME | ||||||||||||||||||||
| (Taxable-equivalent basis; $ in millions) | Change | |||||||||||||||||||
| 1Q 2021 |
4Q 2020 |
1Q 2020 |
1Q21 vs 4Q20 |
1Q21 vs 1Q20 |
||||||||||||||||
| Components of net interest income |
||||||||||||||||||||
| Income on earning assets |
$3,367 | $3,505 | $4,142 | $(138) | $(775) | |||||||||||||||
| Expense on interest-bearing liabilities |
278 | 304 | 895 | (26) | (617) | |||||||||||||||
| Net interest income |
$3,089 | $3,201 | $3,247 | $(112) | $(158) | |||||||||||||||
| Average yields and rates paid |
||||||||||||||||||||
| Earning assets yield |
2.73% | 2.81% | 3.71% | (.08)% | (.98)% | |||||||||||||||
| Rate paid on interest-bearing liabilities |
.31 | .33 | 1.02 | (.02) | (.71) | |||||||||||||||
| Gross interest margin |
2.42% | 2.48% | 2.69% | (.06)% | (.27)% | |||||||||||||||
| Net interest margin |
2.50% | 2.57% | 2.91% | (.07)% | (.41)% | |||||||||||||||
| Average balances |
||||||||||||||||||||
| Investment securities (a) |
$145,520 | $133,430 | $120,843 | $12,090 | $24,677 | |||||||||||||||
| Loans |
293,989 | 302,308 | 297,657 | (8,319) | (3,668) | |||||||||||||||
| Earning assets |
497,711 | 497,437 | 447,722 | 274 | 49,989 | |||||||||||||||
| Interest-bearing liabilities |
360,582 | 362,445 | 352,761 | (1,863) | 7,821 | |||||||||||||||
(a) Excludes unrealized gain (loss)
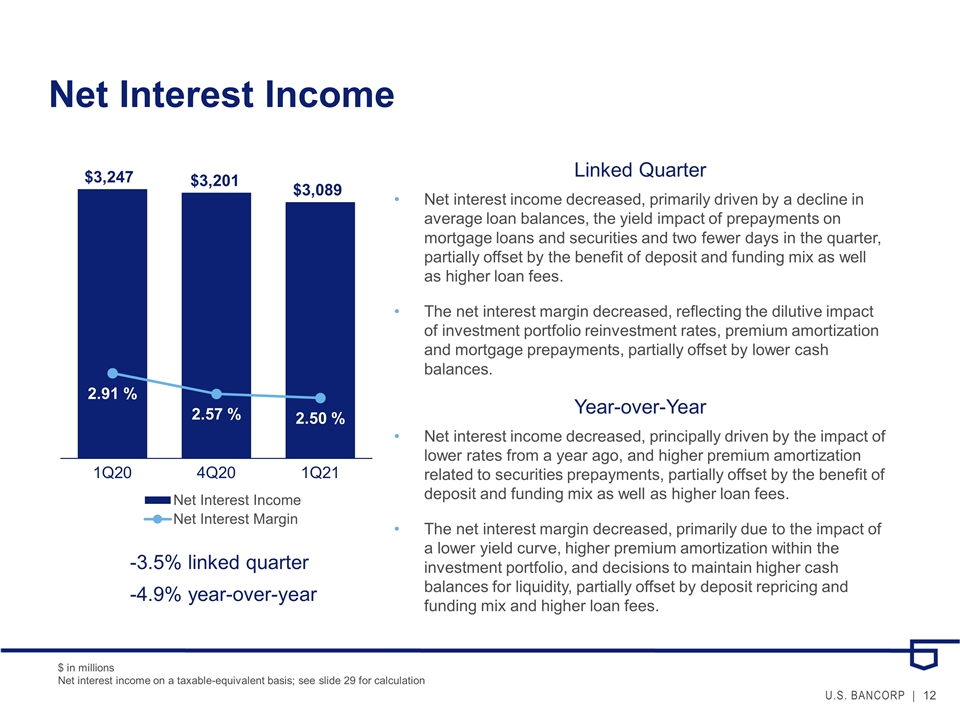
Net interest income on a taxable-equivalent basis in the first quarter of 2021 was $3,089 million, a decrease of $158 million (4.9 percent) compared with the first quarter of 2020. The decrease was primarily due to the impact of lower rates compared with a year ago and higher premium amortization related to securities prepayments, partially offset by the benefit of deposit and funding mix as well as higher loan fees. Average earning assets were $50.0 billion (11.2 percent) higher than the first quarter of 2020, reflecting increases of $24.7 billion (20.4 percent) in average investment securities and $23.7 billion (96.8 percent) in average other earning assets, including cash balances being maintained for liquidity given the current economic environment, while average total loans decreased $3.7 billion (1.2 percent) due to continued paydowns by corporate customers that accessed the capital markets last year.
Net interest income on a taxable-equivalent basis decreased $112 million (3.5 percent) on a linked quarter basis primarily due to a decline in average loan balances, the yield impact of prepayments on mortgage loans and securities and two less days in the quarter, partially offset by the benefit of deposit and funding mix as well as higher loan fees. Average earning assets were flat on a linked quarter basis, reflecting increases of $12.1 billion (9.1 percent) in average investment securities, partially offset by a decrease of $8.3 billion (2.8 percent) in average total loans, primarily due to continued paydowns by corporate customers, as well as a decrease of $4.7 billion (8.8 percent) in average other earning assets driven by lower cash balances on a linked quarter basis.
Net interest margin in the first quarter of 2021 was 2.50 percent, compared with 2.91 percent in the first quarter of 2020 and 2.57 percent in the fourth quarter of 2020. The decrease in the net interest margin from the prior year was primarily due to the impact of a lower yield curve on earning assets, higher premium amortization within the investment portfolio and decisions to maintain higher levels of liquidity, partially offset by the net benefit of deposit repricing and funding composition and higher loan fees. The decrease in net interest margin on a linked quarter basis reflects the dilutive impact of investment portfolio reinvestment rates, premium amortization and mortgage prepayments, partially offset by lower cash balances.
Given the current interest rates, we believe the first quarter will be the low point for net interest income with opportunity for growth in future quarters.
The increase in average investment securities on a linked quarter and year-over-year basis was due to purchases of mortgage-backed, U.S. Treasury and state and political securities net of prepayments and maturities.
3
|
|
U.S. Bancorp First Quarter 2021 Results | |
| AVERAGE LOANS | ||||||||||||||||||||
| ($ in millions) | Percent Change | |||||||||||||||||||
| 1Q 2021 |
4Q 2020 |
1Q 2020 |
1Q21 vs 4Q20 |
1Q21 vs 1Q20 |
||||||||||||||||
| Commercial |
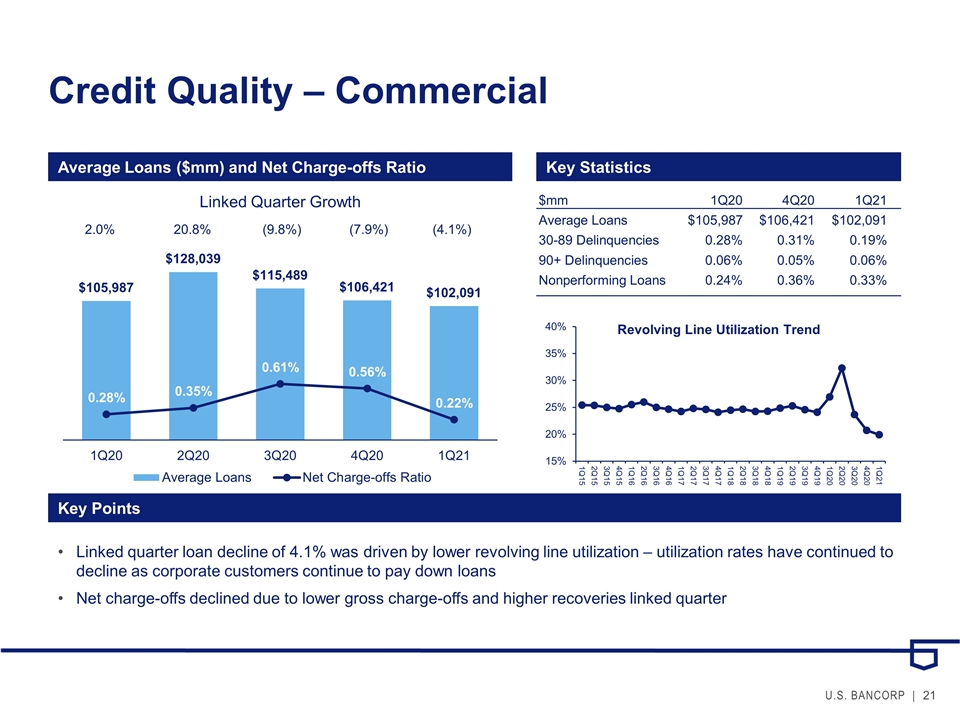
$96,757 | $100,863 | $100,329 | (4.1 | ) | (3.6 | ) | |||||||||||||
| Lease financing |
5,334 | 5,558 | 5,658 | (4.0 | ) | (5.7 | ) | |||||||||||||
| Total commercial |
102,091 | 106,421 | 105,987 | (4.1 | ) | (3.7 | ) | |||||||||||||
| Commercial mortgages |
27,968 | 29,004 | 29,523 | (3.6 | ) | (5.3 | ) | |||||||||||||
| Construction and development |
10,818 | 11,094 | 10,555 | (2.5 | ) | 2.5 | ||||||||||||||
| Total commercial real estate |
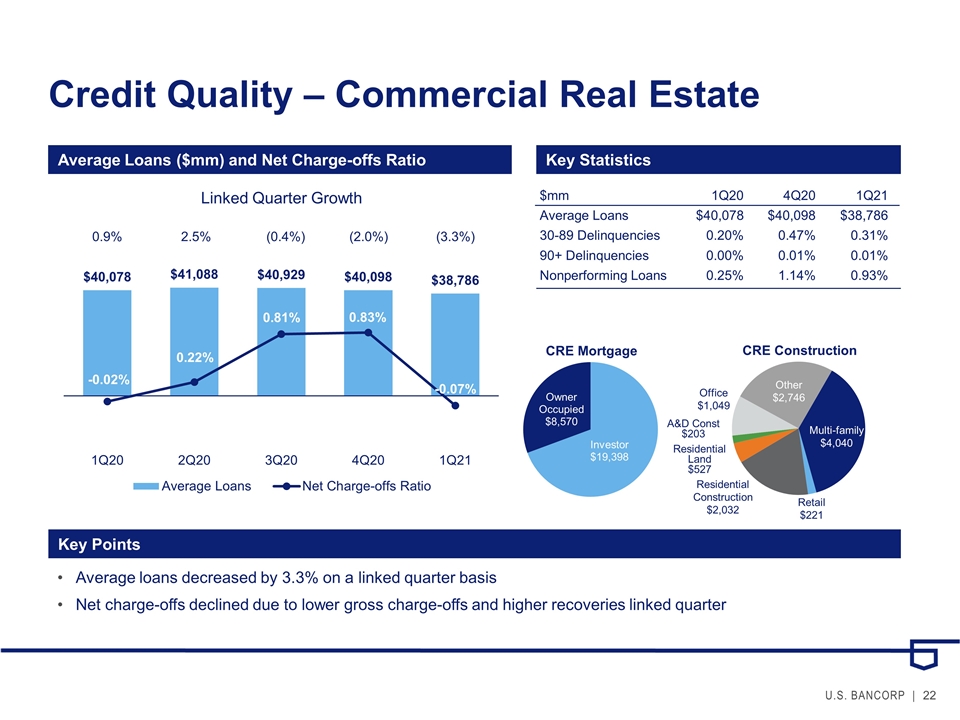
38,786 | 40,098 | 40,078 | (3.3 | ) | (3.2 | ) | |||||||||||||
| Residential mortgages |
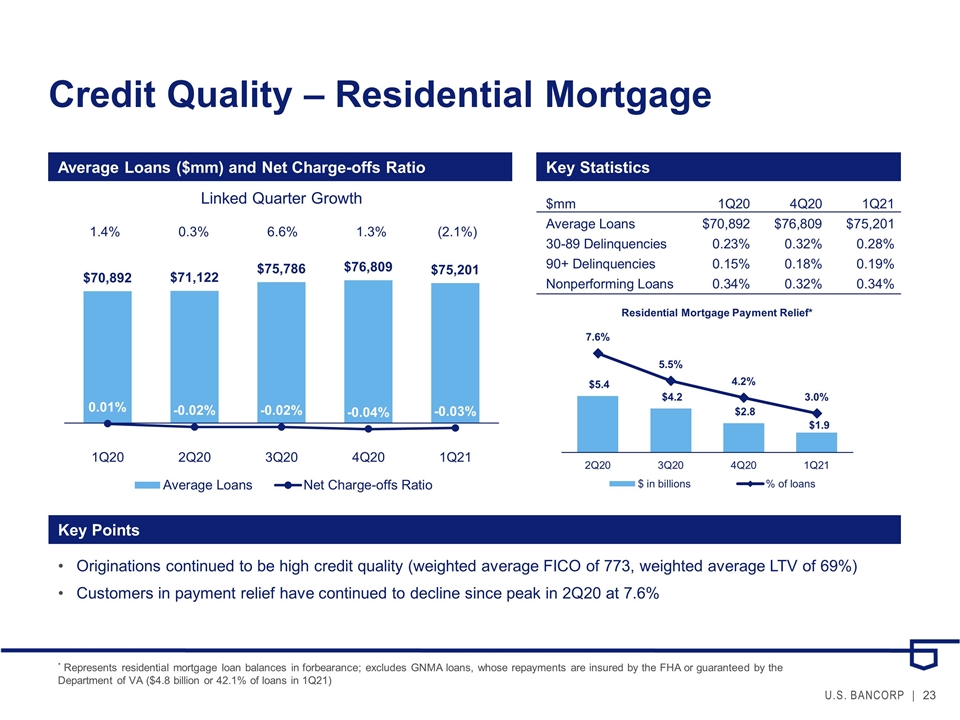
75,201 | 76,809 | 70,892 | (2.1 | ) | 6.1 | ||||||||||||||
| Credit card |
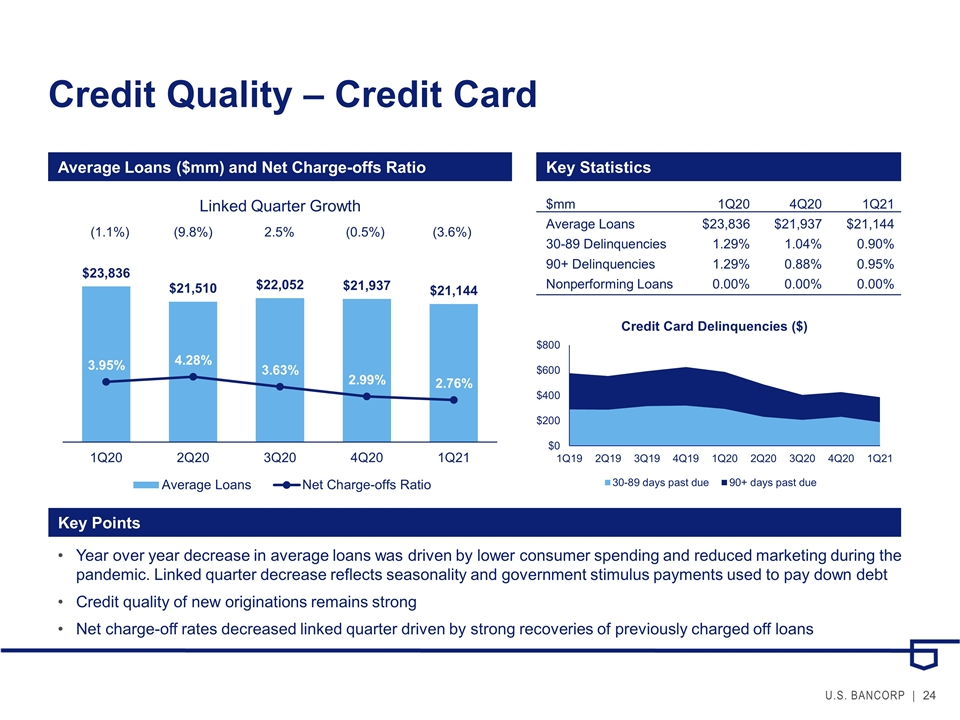
21,144 | 21,937 | 23,836 | (3.6 | ) | (11.3 | ) | |||||||||||||
| Retail leasing |
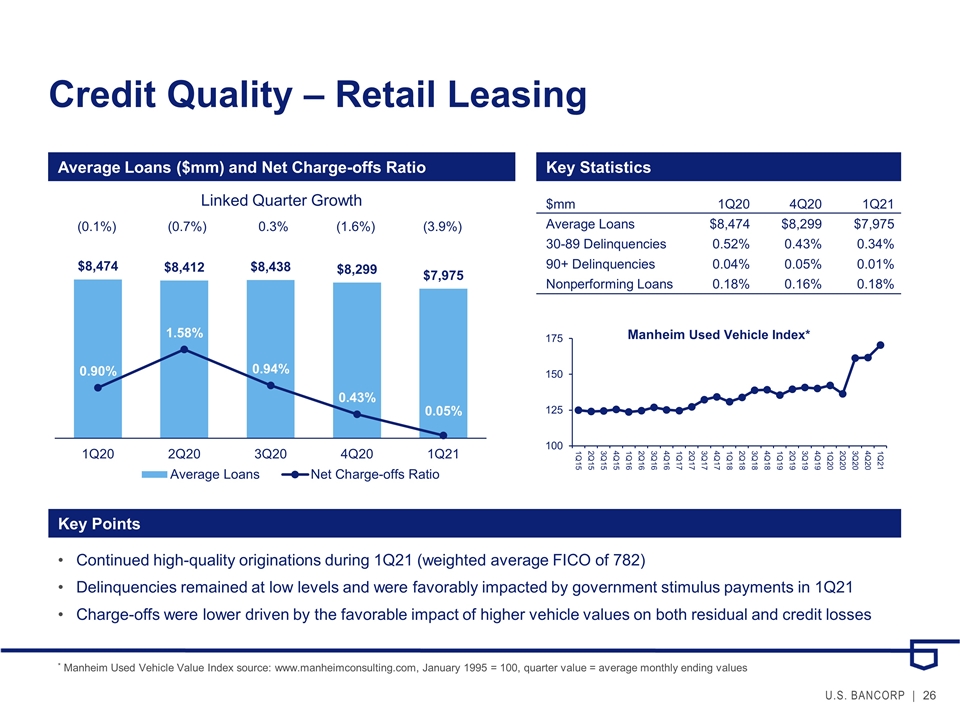
7,975 | 8,299 | 8,474 | (3.9 | ) | (5.9 | ) | |||||||||||||
| Home equity and second mortgages |
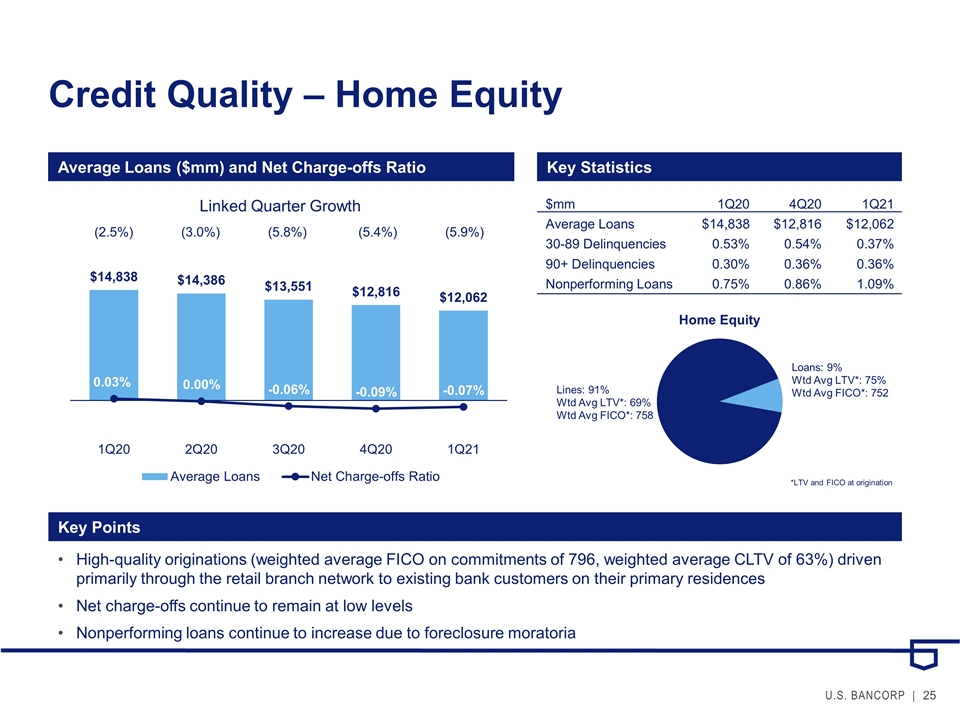
12,062 | 12,816 | 14,838 | (5.9 | ) | (18.7 | ) | |||||||||||||
| Other |
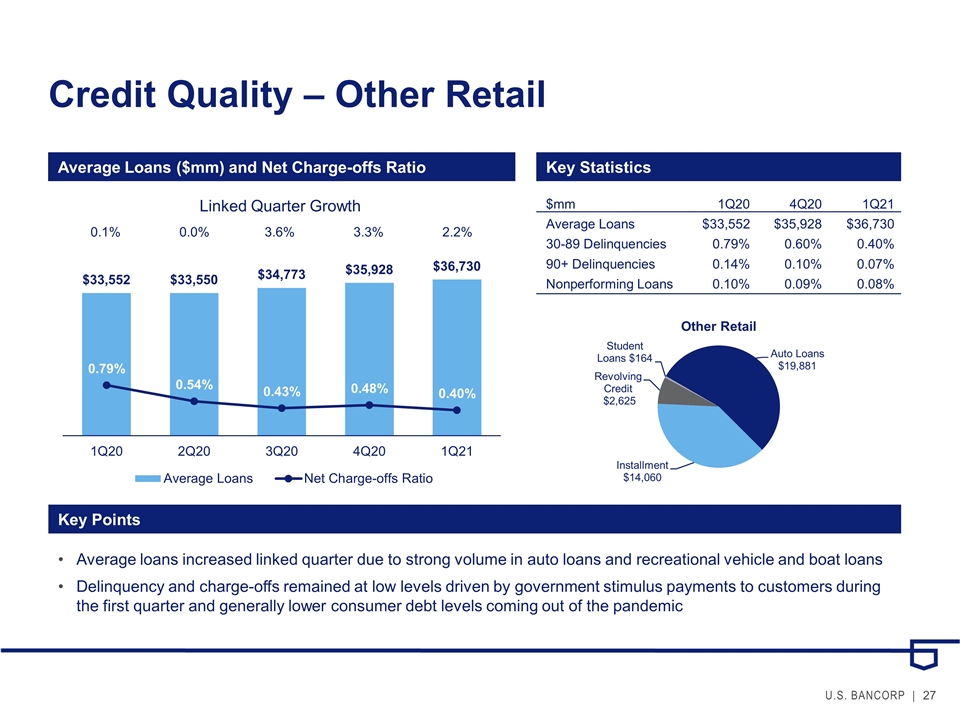
36,730 | 35,928 | 33,552 | 2.2 | 9.5 | |||||||||||||||
| Total other retail |
56,767 | 57,043 | 56,864 | (.5 | ) | (.2 | ) | |||||||||||||
| Total loans |
$293,989 | $302,308 | $297,657 | (2.8 | ) | (1.2 | ) | |||||||||||||
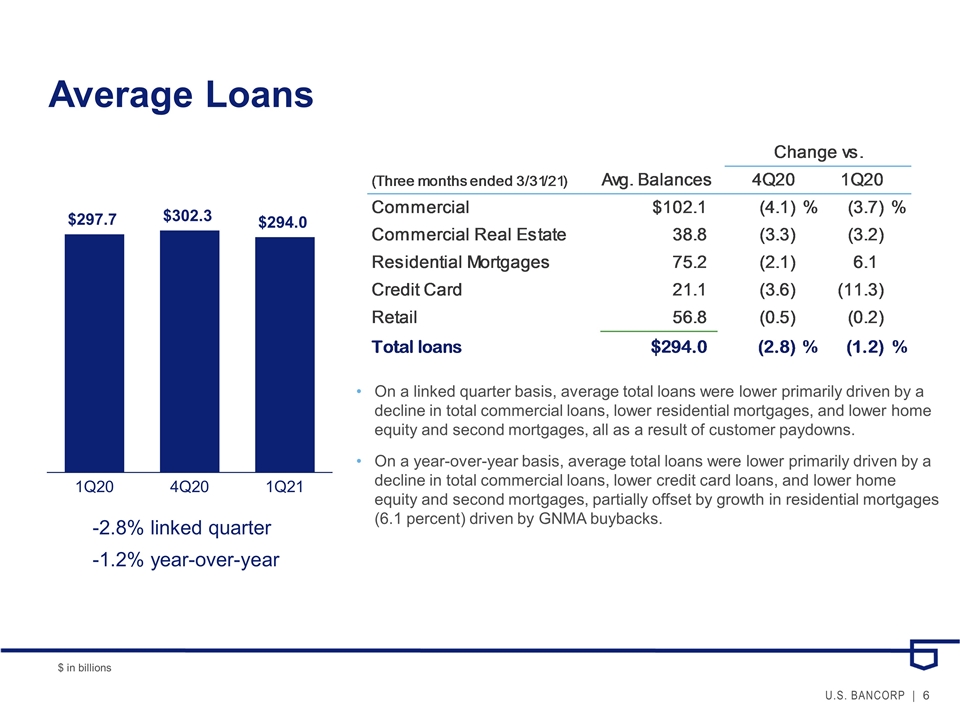
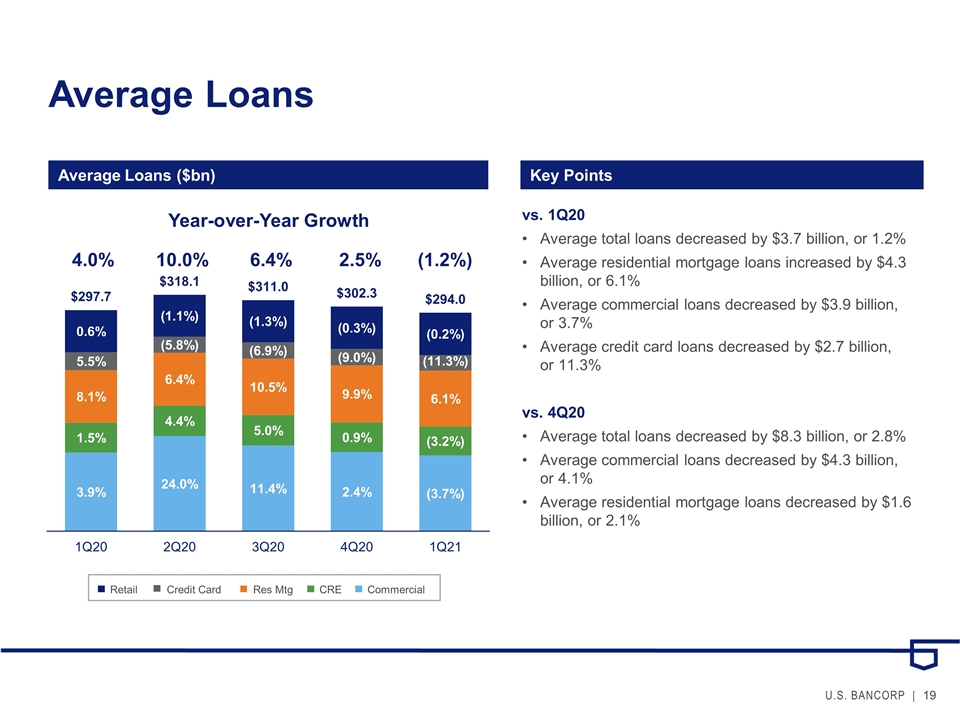
Average total loans for the first quarter of 2021 were $3.7 billion (1.2 percent) lower than the first quarter of 2020. The decrease was primarily due to lower total commercial loans (3.7 percent) driven by continued paydowns by corporate customers that accessed the capital markets last year, lower credit card loans (11.3 percent) driven by higher customer payment rates given their excess liquidity from the government stimulus, and lower home equity and second mortgages (18.7 percent) as more customers chose to refinance their existing first lien residential mortgage balances during the prior year due to the low interest rate environment. These decreases were partially offset by growth in residential mortgages (6.1 percent) driven by loan repurchases from the Government National Mortgage Association (“GNMA”), as well as growth in other retail loans (9.5 percent) driven by growth in installment loans due to the impact of COVID-19 on recreational vehicle sales.
Average total loans were $8.3 billion (2.8 percent) lower than the fourth quarter of 2020 primarily driven by lower total commercial loans (4.1 percent), lower residential mortgages (2.1 percent), and lower home equity and second mortgages (5.9 percent), all as a result of customer paydowns.
4
|
|
U.S. Bancorp First Quarter 2021 Results | |
| AVERAGE DEPOSITS |
| |||||||||||||||||||
| ($ in millions) | Percent Change | |||||||||||||||||||
| 1Q 2021 |
4Q 2020 |
1Q 2020 |
1Q21 vs 4Q20 |
1Q21 vs 1Q20 |
||||||||||||||||
| Noninterest-bearing deposits |
$ | 118,352 | $ | 115,148 | $ | 74,142 | 2.8 | 59.6 | ||||||||||||
| Interest-bearing savings deposits |
||||||||||||||||||||
| Interest checking |
97,385 | 91,384 | 77,359 | 6.6 | 25.9 | |||||||||||||||
| Money market savings |
124,825 | 127,390 | 121,946 | (2.0 | ) | 2.4 | ||||||||||||||
| Savings accounts |
58,848 | 55,730 | 48,048 | 5.6 | 22.5 | |||||||||||||||
| Total savings deposits |
281,058 | 274,504 | 247,353 | 2.4 | 13.6 | |||||||||||||||
| Time deposits |
26,954 | 32,761 | 41,309 | (17.7 | ) | (34.8) | ||||||||||||||
| Total interest-bearing deposits |
308,012 | 307,265 | 288,662 | .2 | 6.7 | |||||||||||||||
| Total deposits |
$ | 426,364 | $ | 422,413 | $ | 362,804 | .9 | 17.5 | ||||||||||||
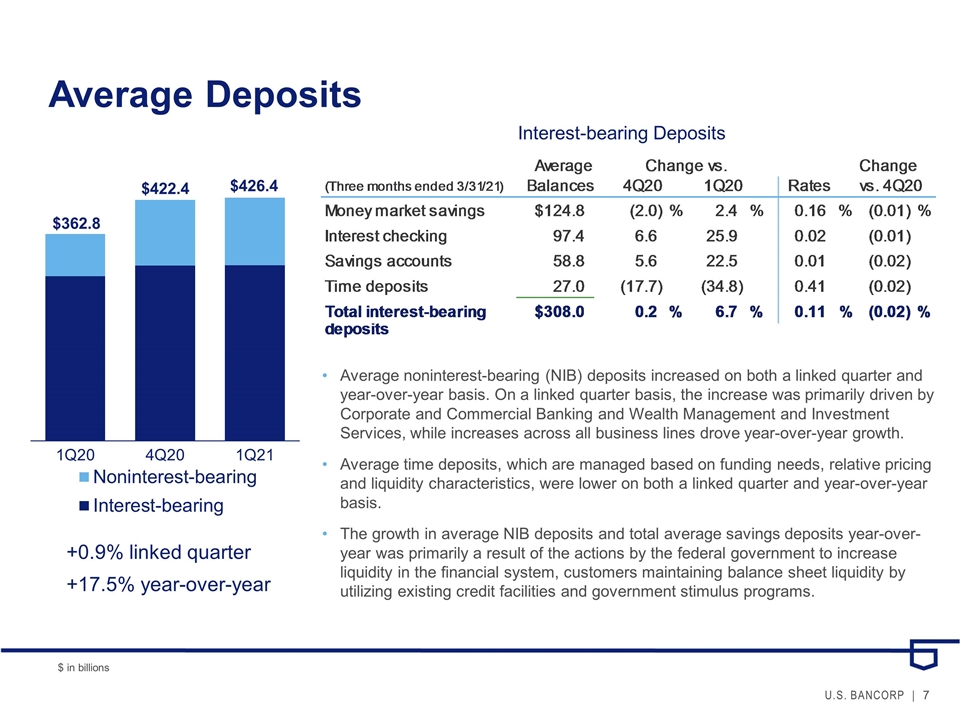
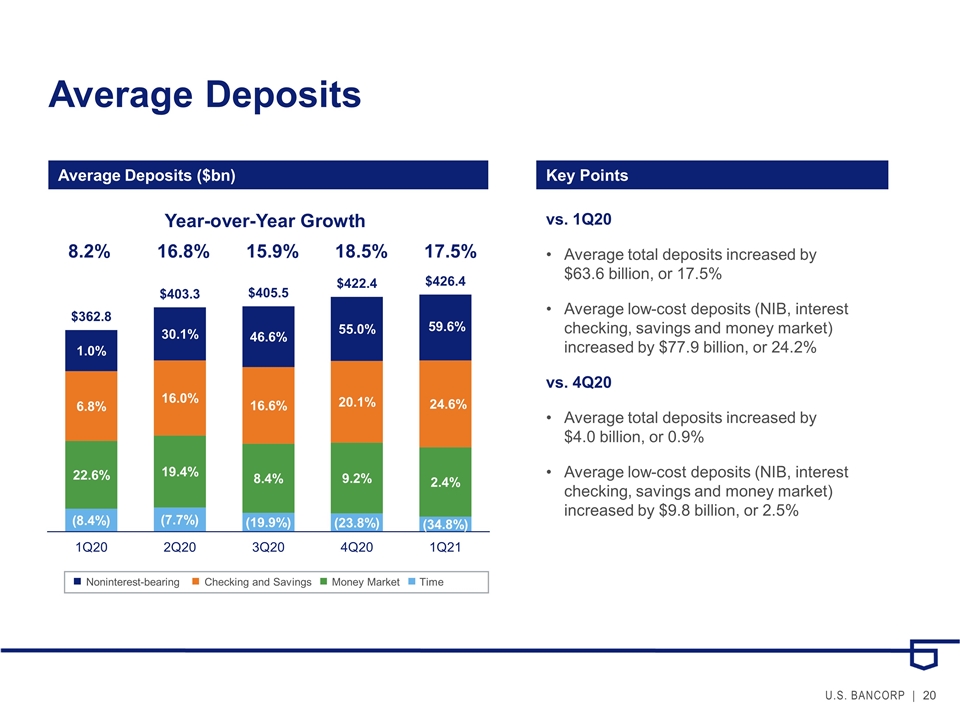
Average total deposits for the first quarter of 2021 were $63.6 billion (17.5 percent) higher than the first quarter of 2020, including approximately $10 billion related to the acquisition of deposit balances from State Farm Bank in the fourth quarter of 2020. Average noninterest-bearing deposits increased $44.2 billion (59.6 percent) across all business lines. Average total savings deposits were $33.7 billion (13.6 percent) higher year-over-year driven by Consumer and Business Banking and Wealth Management and Investment Services. Average time deposits were $14.4 billion (34.8 percent) lower than the prior year quarter primarily within Corporate and Commercial Banking. Changes in time deposits are largely related to those deposits managed as an alternative to other funding sources, based largely on relative pricing and liquidity characteristics.
Average total deposits increased $4.0 billion (0.9 percent) from the fourth quarter of 2020. On a linked quarter basis, average noninterest-bearing deposits increased $3.2 billion (2.8 percent) driven by Corporate and Commercial Banking and Wealth Management and Investment Services. Average total savings deposits increased $6.6 billion (2.4 percent) compared with the fourth quarter of 2020 primarily due to increases in Consumer and Business Banking and Wealth Management and Investment Services. Average time deposits, which are managed based on funding needs, relative pricing and liquidity characteristics, decreased $5.8 billion (17.7 percent) on a linked quarter basis across all business lines.
The growth in average noninterest-bearing deposits and total average savings deposits year-over-year was primarily a result of the actions by the federal government to increase liquidity in the financial system, customers maintaining balance sheet liquidity by utilizing existing credit facilities and government stimulus programs.
5
|
|
U.S. Bancorp First Quarter 2021 Results | |
| NONINTEREST INCOME | ||||||||||||||||||||
| ($ in millions) | Percent Change | |||||||||||||||||||
| 1Q 2021 |
4Q 2020 |
1Q 2020 |
1Q21 vs 4Q20 |
1Q21 vs 1Q20 |
||||||||||||||||
| Credit and debit card revenue |
$336 | $362 | $304 | (7.2 | ) | 10.5 | ||||||||||||||
| Corporate payment products revenue |
126 | 126 | 145 | -- | (13.1 | ) | ||||||||||||||
| Merchant processing services |
318 | 311 | 337 | 2.3 | (5.6 | ) | ||||||||||||||
| Trust and investment management fees |
444 | 441 | 427 | .7 | 4.0 | |||||||||||||||
| Deposit service charges |
161 | 165 | 209 | (2.4 | ) | (23.0 | ) | |||||||||||||
| Treasury management fees |
147 | 143 | 143 | 2.8 | 2.8 | |||||||||||||||
| Commercial products revenue |
280 | 239 | 246 | 17.2 | 13.8 | |||||||||||||||
| Mortgage banking revenue |
299 | 468 | 395 | (36.1 | ) | (24.3 | ) | |||||||||||||
| Investment products fees |
55 | 50 | 49 | 10.0 | 12.2 | |||||||||||||||
| Securities gains (losses), net |
25 | 34 | 50 | (26.5 | ) | (50.0 | ) | |||||||||||||
| Other |
190 | 211 | 220 | (10.0 | ) | (13.6 | ) | |||||||||||||
| Total noninterest income |
$2,381 | $2,550 | $2,525 | (6.6 | ) | (5.7 | ) | |||||||||||||
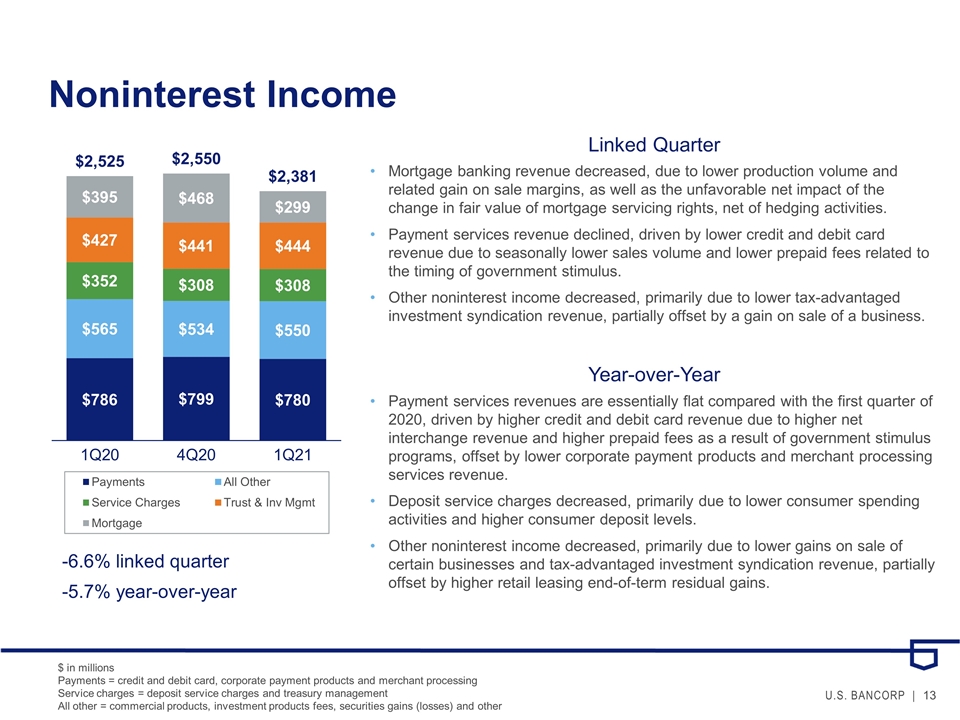
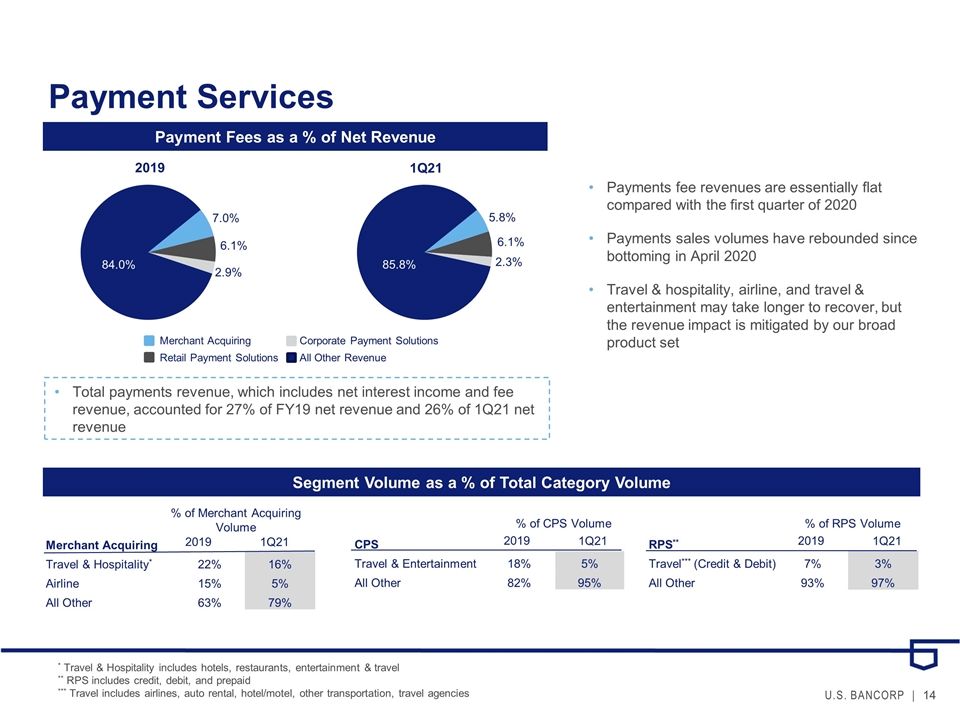
First quarter noninterest income of $2,381 million was $144 million (5.7 percent) lower than the first quarter of 2020 primarily reflecting lower mortgage banking revenue, including a $145 million reduction in the fair value of mortgage servicing rights, net of hedging activities driven by the impact of prepayments on the servicing portfolio partially offset by higher production volume and related gain on sale margins compared with a year ago. During the past year, payment services revenue has been adversely affected by the impact of the pandemic on consumer spending, particularly related to travel and entertainment activities. However, consumer spending continues to strengthen across most sectors driven by government stimulus, local jurisdictions reducing restrictions and consumer behaviors normalizing. As a result, payments revenues are essentially flat compared with the first quarter of 2020. The components of payments revenue included higher credit and debit card revenue of $32 million (10.5 percent) driven by higher net interchange revenue related to sales volumes and higher prepaid fees as a result of government stimulus programs, more than offset by lower corporate payment products revenue of $19 million (13.1 percent) primarily due to lower business spending related to travel and entertainment and lower merchant processing services revenue of $19 million (5.6 percent) driven by lower sales volume and merchant fees. Deposit service charges decreased $48 million (23.0 percent) primarily due to lower consumer spending activities and higher consumer deposit levels related to government stimulus. Other noninterest income decreased $30 million (13.6 percent) primarily due to lower gains on sale of certain businesses and tax-advantaged investment syndication revenue in the first quarter of 2021, partially offset by higher retail leasing end of term residual gains. Partially offsetting the unfavorable impact of these fee categories, trust and investment management fees increased $17 million (4.0 percent) driven by business growth and favorable market conditions, while commercial products revenue increased $34 million (13.8 percent) primarily due to better market conditions and higher non-yield loan fees on unused commitments.
Noninterest income was $169 million (6.6 percent) lower in the first quarter of 2021 compared with the fourth quarter of 2020, reflecting lower mortgage banking revenue, payment services revenue and other noninterest income, partially offset by higher commercial product revenue. Mortgage banking revenue decreased $169 million (36.1 percent) due to the unfavorable net impact of the change in fair value of mortgage servicing rights, net of hedging activities, and lower production volume and related gain on sale margins. Payment services revenue decreased $19 million (2.4 percent) compared with the fourth quarter of 2020 primarily driven by lower credit and debit card revenue of $26 million (7.2 percent) due to seasonally lower sales volume and lower prepaid fees related to the timing of government stimulus. Other noninterest income decreased $21 million (10.0 percent) primarily due to lower tax-advantaged investment syndication revenue, partially offset by a gain on sale of a business. These decreases were partially offset by higher commercial products revenue of $41 million (17.2 percent) primarily due to higher corporate bond fees and trading revenue.
6
|
|
U.S. Bancorp First Quarter 2021 Results | |
| NONINTEREST EXPENSE | ||||||||||||||||||||
| ($ in millions) | Percent Change | |||||||||||||||||||
| 1Q 2021 |
4Q 2020 |
1Q 2020 |
1Q21 vs 4Q20 |
1Q21 vs 1Q20 |
||||||||||||||||
| Compensation |
$ | 1,803 | $ | 1,643 | $ | 1,620 | 9.7 | 11.3 | ||||||||||||
| Employee benefits |
384 | 302 | 352 | 27.2 | 9.1 | |||||||||||||||
| Net occupancy and equipment |
263 | 269 | 276 | (2.2 | ) | (4.7 | ) | |||||||||||||
| Professional services |
98 | 123 | 99 | (20.3 | ) | (1.0 | ) | |||||||||||||
| Marketing and business development |
48 | 105 | 74 | (54.3 | ) | (35.1 | ) | |||||||||||||
| Technology and communications |
359 | 362 | 289 | (.8 | ) | 24.2 | ||||||||||||||
| Postage, printing and supplies |
69 | 74 | 72 | (6.8 | ) | (4.2 | ) | |||||||||||||
| Other intangibles |
38 | 47 | 42 | (19.1 | ) | (9.5 | ) | |||||||||||||
| Other |
317 | 439 | 492 | (27.8 | ) | (35.6 | ) | |||||||||||||
| Total noninterest expense |
$ | 3,379 | $ | 3,364 | $ | 3,316 | .4 | 1.9 | ||||||||||||
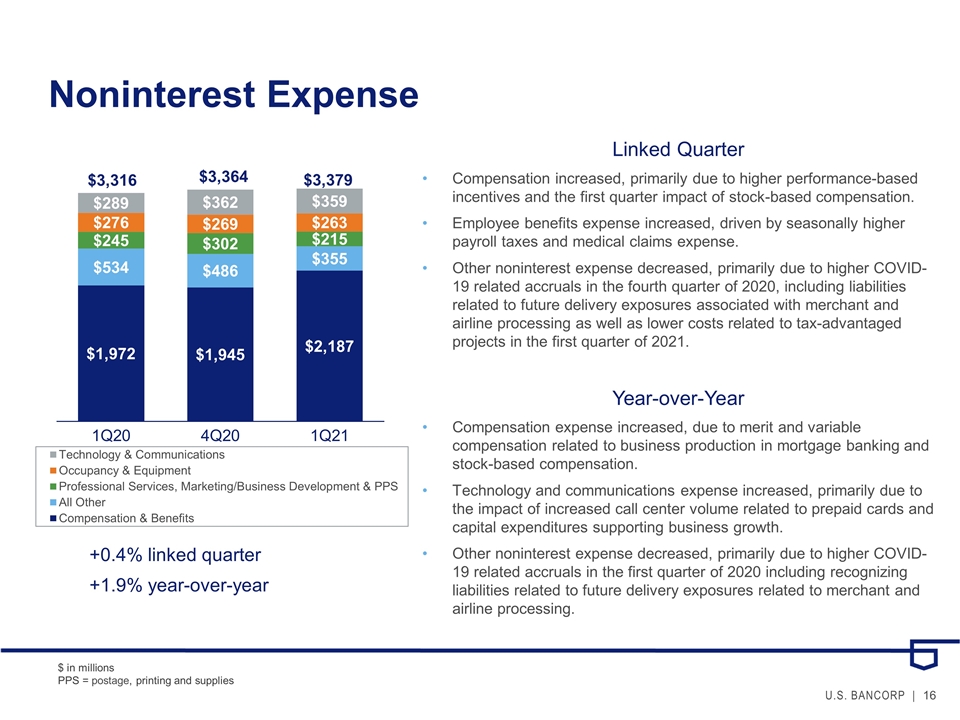
First quarter noninterest expense of $3,379 million was $63 million (1.9 percent) higher than the first quarter of 2020 reflecting increases in compensation expense, employee benefits expense, and technology and communications expense, partially offset by lower net occupancy and equipment expense, marketing and business development expense, and other noninterest expense. Compensation expense increased $183 million (11.3 percent) compared with the first quarter of 2020 due to merit, revenue-related compensation driven by business production in mortgage banking, performance-based incentives, and stock-based compensation. Employee benefits expense increased $32 million (9.1 percent) primarily due to payroll taxes and related benefits, as well as higher medical claims expense compared with the first quarter of 2020. Technology and communications expense increased $70 million (24.2 percent) primarily due to higher call center volume related to prepaid cards and capital expenditures supporting business technology investments. These increases were partially offset by lower net occupancy and equipment expense of $13 million (4.7 percent) primarily due to branch optimization initiatives and lower marketing and business development expense of $26 million (35.1 percent) due to a reduction in travel as a result of COVID-19. In addition, other noninterest expense decreased $175 million (35.6 percent) primarily due to higher COVID-19 related accruals in the first quarter of 2020 including recognizing liabilities related to future delivery exposures related to merchant and airline processing.
Noninterest expense increased $15 million (0.4 percent) on a linked quarter basis reflecting higher compensation and employee benefits expense, mostly offset by lower professional services expense, marketing and business development expense and other noninterest expense. Compensation expense increased $160 million (9.7 percent) primarily due to higher performance-based incentives and seasonally higher stock-based compensation as well as seasonally higher employee benefits of $82 million (27.2 percent) related to payroll taxes and medical claims expense. Partially offsetting these increases, professional services expense decreased $25 million (20.3 percent) and marketing and business development expense decreased $57 million (54.3 percent) primarily due to a seasonal reduction in spending. Other noninterest expense decreased $122 million (27.8 percent) due to higher COVID-19 related accruals in the fourth quarter of 2020, including liabilities related to future delivery exposures associated with merchant and airline processing as well as lower costs related to tax-advantaged projects in the first quarter of 2021.
Provision for Income Taxes
The provision for income taxes for the first quarter of 2021 resulted in a tax rate of 21.7 percent on a taxable-equivalent basis (effective tax rate of 21.0 percent), compared with 19.4 percent on a taxable-equivalent basis (effective tax rate of 18.1 percent) in the first quarter of 2020, and a tax rate of 21.6 percent on a taxable-equivalent basis (effective tax rate of 20.6 percent) in the fourth quarter of 2020. The increase in the tax rate, on a taxable-equivalent basis, is due to the marginal impact of providing taxes on higher pretax earnings in the first quarter of 2021.
7
|
|
U.S. Bancorp First Quarter 2021 Results | |
| ALLOWANCE FOR CREDIT LOSSES | ||||||||||||||||||||||||||||||||||||||||
| ($ in millions) | 1Q 2021 |
% (a) | 4Q 2020 |
% (a) | 3Q 2020 |
% (a) | 2Q 2020 |
% (a) | 1Q 2020 |
% (a) | ||||||||||||||||||||||||||||||
|
Balance, beginning of period |
$ | 8,010 | $ | 8,010 | $ | 7,890 | $ | 6,590 | $ | 4,491 | ||||||||||||||||||||||||||||||
| Change in accounting principle (b) |
-- | -- | -- | -- | 1,499 | |||||||||||||||||||||||||||||||||||
| Net charge-offs |
||||||||||||||||||||||||||||||||||||||||
| Commercial |
52 | .22 | 142 | .56 | 167 | .60 | 105 | .34 | 69 | .28 | ||||||||||||||||||||||||||||||
| Lease financing |
4 | .30 | 8 | .57 | 11 | .78 | 6 | .43 | 5 | .36 | ||||||||||||||||||||||||||||||
|
|
|
|
|
|
|
|
|
|
|
|||||||||||||||||||||||||||||||
| Total commercial |
56 | .22 | 150 | .56 | 178 | .61 | 111 | .35 | 74 | .28 | ||||||||||||||||||||||||||||||
| Commercial mortgages |
(12 | ) | (.17 | ) | 82 | 1.12 | 85 | 1.13 | 19 | .25 | (1 | ) | (.01 | ) | ||||||||||||||||||||||||||
| Construction and development |
5 | .19 | 2 | .07 | (2 | ) | (.07 | ) | 3 | .11 | (1 | ) | (.04 | ) | ||||||||||||||||||||||||||
|
|
|
|
|
|
|
|
|
|
|
|||||||||||||||||||||||||||||||
| Total commercial real estate |
(7 | ) | (.07 | ) | 84 | .83 | 83 | .81 | 22 | .22 | (2 | ) | (.02 | ) | ||||||||||||||||||||||||||
| Residential mortgages |
(5 | ) | (.03 | ) | (7 | ) | (.04 | ) | (3 | ) | (.02 | ) | (3 | ) | (.02 | ) | 1 | .01 | ||||||||||||||||||||||
| Credit card |
144 | 2.76 | 165 | 2.99 | 201 | 3.63 | 229 | 4.28 | 234 | 3.95 | ||||||||||||||||||||||||||||||
| Retail leasing |
1 | .05 | 9 | .43 | 20 | .94 | 33 | 1.58 | 19 | .90 | ||||||||||||||||||||||||||||||
| Home equity and second mortgages |
(2 | ) | (.07 | ) | (3 | ) | (.09 | ) | (2 | ) | (.06 | ) | -- | -- | 1 | .03 | ||||||||||||||||||||||||
| Other |
36 | .40 | 43 | .48 | 38 | .43 | 45 | .54 | 66 | .79 | ||||||||||||||||||||||||||||||
|
|
|
|
|
|
|
|
|
|
|
|||||||||||||||||||||||||||||||
| Total other retail |
35 | .25 | 49 | .34 | 56 | .39 | 78 | .56 | 86 | .61 | ||||||||||||||||||||||||||||||
|
|
|
|
|
|
|
|
|
|
|
|||||||||||||||||||||||||||||||
| Total net charge-offs |
223 | .31 | 441 | .58 | 515 | .66 | 437 | .55 | 393 | .53 | ||||||||||||||||||||||||||||||
| Provision for credit losses |
(827 | ) | 441 | 635 | 1,737 | 993 | ||||||||||||||||||||||||||||||||||
|
|
|
|
|
|
|
|
|
|
|
|||||||||||||||||||||||||||||||
| Balance, end of period |
$ | 6,960 | $ | 8,010 | $ | 8,010 | $ | 7,890 | $ | 6,590 | ||||||||||||||||||||||||||||||
|
|
|
|
|
|
|
|
|
|
|
|||||||||||||||||||||||||||||||
| Components |
||||||||||||||||||||||||||||||||||||||||
| Allowance for loan losses |
$ | 6,343 | $ | 7,314 | $ | 7,407 | $ | 7,383 | $ | 6,216 | ||||||||||||||||||||||||||||||
| Liability for unfunded credit commitments |
617 | 696 | 603 | 507 | 374 | |||||||||||||||||||||||||||||||||||
|
|
|
|
|
|
|
|
|
|
|
|||||||||||||||||||||||||||||||
| Total allowance for credit losses |
$ | 6,960 | $ | 8,010 | $ | 8,010 | $ | 7,890 | $ | 6,590 | ||||||||||||||||||||||||||||||
|
|
|
|
|
|
|
|
|
|
|
|||||||||||||||||||||||||||||||
| Gross charge-offs |
$ | 374 | $ | 556 | $ | 611 | $ | 522 | $ | 491 | ||||||||||||||||||||||||||||||
| Gross recoveries |
$ | 151 | $ | 115 | $ | 96 | $ | 85 | $ | 98 | ||||||||||||||||||||||||||||||
| Allowance for credit losses as a percentage of Period-end loans |
2.36 | 2.69 | 2.61 | 2.54 | 2.07 | |||||||||||||||||||||||||||||||||||
| Nonperforming loans |
617 | 654 | 678 | 737 | 809 | |||||||||||||||||||||||||||||||||||
| Nonperforming assets |
579 | 617 | 631 | 673 | 697 | |||||||||||||||||||||||||||||||||||
| (a) Annualized and calculated on average loan balances
|
| |||||||||||||||||||||||||||||||||||||||
| (b) Effective January 1, 2020, the Company adopted accounting guidance which changed impairment recognition of financial instruments to a model that is based on expected losses rather than incurred losses
|
| |||||||||||||||||||||||||||||||||||||||
8
|
|
U.S. Bancorp First Quarter 2021 Results | |
The Company’s provision for credit losses for the first quarter of 2021 was a benefit of $827 million, which was $1,268 million lower than the prior quarter and $1,820 million lower than the first quarter of 2020. During the first quarter of 2021, factors affecting economic conditions, including passing of additional government stimulus, widespread vaccine availability in the U.S. and reduced levels of new virus cases, have shifted to a clear improving trend not present in the fourth quarter of 2020 or a year ago. In addition to these factors, expected loss estimates considered various factors including customer specific information impacting changes in risk ratings, projected delinquencies and the impact of industry-wide loan modification efforts designed to limit long term effects of the pandemic. Currently, consumer credit trends continue to perform better than expected, although select commercial portfolios continue to be monitored for structural shifts associated with the pandemic.
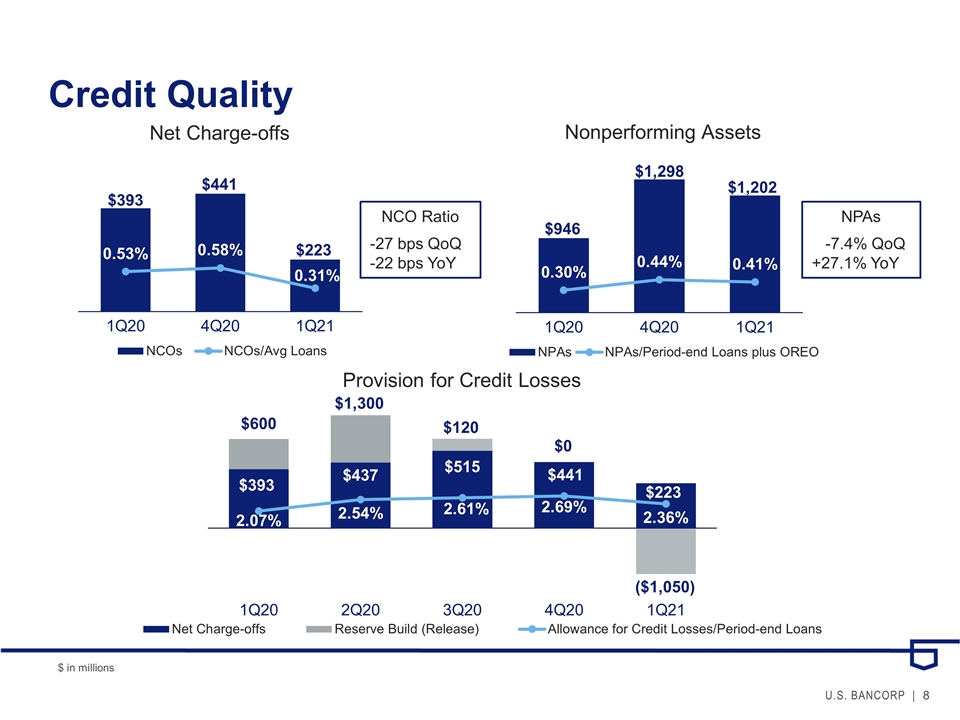
Total net charge-offs in the first quarter of 2021 were $223 million, compared with $441 million in the fourth quarter of 2020, and $393 million in the first quarter of 2020. The net charge-off ratio was 0.31 percent in the first quarter of 2021, compared with 0.58 percent in the fourth quarter of 2020 and 0.53 percent in the first quarter of 2020. Net charge-offs decreased $218 million (49.4 percent) compared with the fourth quarter of 2020 mainly due to lower total commercial and total commercial real estate net charge-offs. Net charge-offs decreased $170 million (43.3 percent) compared with the first quarter of 2020 primarily due to lower total commercial, credit card and total other retail net charge-offs.
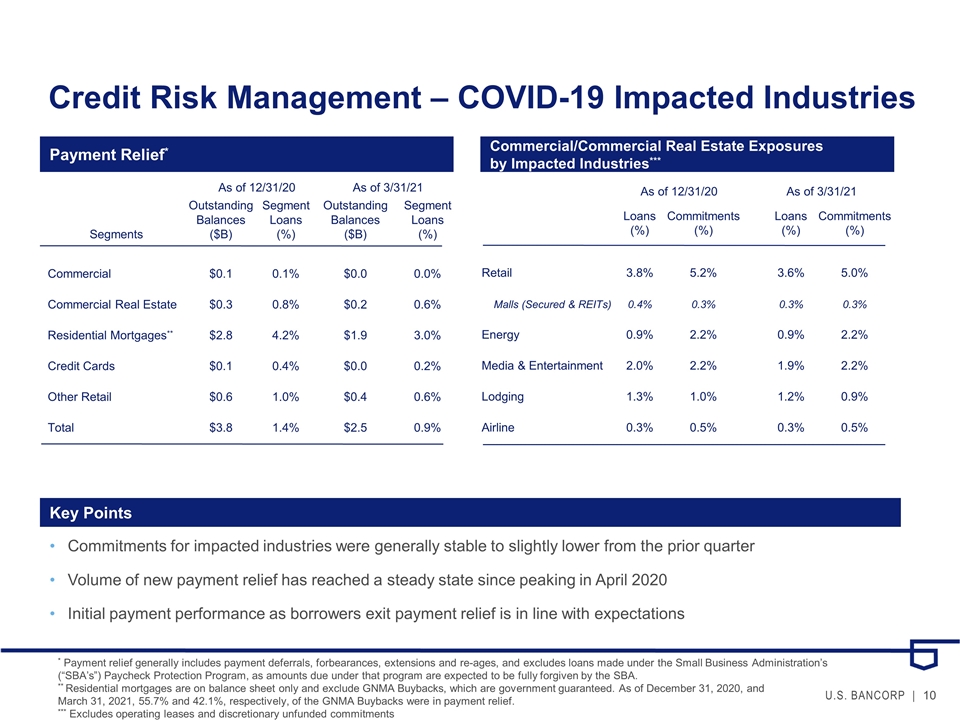
Nonperforming assets were $1,202 million at March 31, 2021, compared with $1,298 million at December 31, 2020, and $946 million at March 31, 2020. The ratio of nonperforming assets to loans and other real estate was 0.41 percent at March 31, 2021, compared with 0.44 percent at December 31, 2020, and 0.30 percent at March 31, 2020. The year-over-year increase in nonperforming assets was primarily due to increases in total commercial and total commercial real estate nonperforming loans. Accruing loans 90 days or more past due were $476 million at March 31, 2021, compared with $477 million at December 31, 2020, and $579 million at March 31, 2020. The Company expects credit quality to return to more normalized levels throughout the remainder of the year as the economy rebounds and consumer spending resumes. However, some manageable levels of elevated nonperforming assets in certain industries and loan categories yet to recover from pandemic related impacts are expected.
The allowance for credit losses was $6,960 million at March 31, 2021, compared with $8,010 million at December 31, 2020, and $6,590 million at March 31, 2020. The decrease on a linked quarter basis was driven by improvement in the global economy combined with government stimulus programs and vaccine availability compared with the reserve build during 2020 driven by the concerns associated with the economic impact of COVID-19. The ratio of the allowance for credit losses to period-end loans was 2.36 percent at March 31, 2021, compared with 2.69 percent at December 31, 2020, and 2.07 percent at March 31, 2020. The ratio of the allowance for credit losses to nonperforming loans was 617 percent at March 31, 2021, compared with 654 percent at December 31, 2020, and 809 percent at March 31, 2020.
9
|
|
U.S. Bancorp First Quarter 2021 Results | |
| DELINQUENT LOAN RATIOS AS A PERCENT OF ENDING LOAN BALANCES | ||||||||||||||||||||
| (Percent) | Mar 31 2021 |
Dec 31 2020 |
Sep 30 2020 |
Jun 30 2020 |
Mar 31 2020 |
|||||||||||||||
| Delinquent loan ratios - 90 days or more past due excluding nonperforming loans |
|
|||||||||||||||||||
| Commercial |
.06 | .05 | .06 | .07 | .06 | |||||||||||||||
| Commercial real estate |
.01 | .01 | -- | -- | -- | |||||||||||||||
| Residential mortgages |
.19 | .18 | .15 | .16 | .15 | |||||||||||||||
| Credit card |
.95 | .88 | .91 | 1.22 | 1.29 | |||||||||||||||
| Other retail |
.12 | .15 | .14 | .16 | .17 | |||||||||||||||
| Total loans |
.16 | .16 | .15 | .18 | .18 | |||||||||||||||
| Delinquent loan ratios - 90 days or more past due including nonperforming loans |
|
|||||||||||||||||||
| Commercial |
.39 | .42 | .48 | .45 | .31 | |||||||||||||||
| Commercial real estate |
.94 | 1.15 | .82 | .48 | .25 | |||||||||||||||
| Residential mortgages |
.54 | .50 | .46 | .50 | .49 | |||||||||||||||
| Credit card |
.95 | .88 | .91 | 1.22 | 1.29 | |||||||||||||||
| Other retail |
.42 | .42 | .40 | .48 | .45 | |||||||||||||||
| Total loans |
.54 | .57 | .53 | .52 | .44 | |||||||||||||||
| ASSET QUALITY (a) | ||||||||||||||||||||
| ($ in millions) | ||||||||||||||||||||
| Mar 31 2021 |
Dec 31 2020 |
Sep 30 2020 |
Jun 30 2020 |
Mar 31 2020 |
||||||||||||||||
| Nonperforming loans |
||||||||||||||||||||
| Commercial |
$298 | $321 | $403 | $403 | $276 | |||||||||||||||
| Lease financing |
49 | 54 | 56 | 53 | 33 | |||||||||||||||
| Total commercial |
347 | 375 | 459 | 456 | 309 | |||||||||||||||
| Commercial mortgages |
266 | 411 | 323 | 188 | 89 | |||||||||||||||
| Construction and development |
90 | 39 | 7 | 7 | 12 | |||||||||||||||
| Total commercial real estate |
356 | 450 | 330 | 195 | 101 | |||||||||||||||
| Residential mortgages |
253 | 245 | 240 | 242 | 243 | |||||||||||||||
| Credit card |
-- | -- | -- | -- | -- | |||||||||||||||
| Other retail |
172 | 154 | 152 | 178 | 162 | |||||||||||||||
| Total nonperforming loans |
1,128 | 1,224 | 1,181 | 1,071 | 815 | |||||||||||||||
| Other real estate |
19 | 24 | 35 | 52 | 70 | |||||||||||||||
| Other nonperforming assets |
55 | 50 | 54 | 50 | 61 | |||||||||||||||
| Total nonperforming assets |
$1,202 | $1,298 | $1,270 | $1,173 | $946 | |||||||||||||||
| Accruing loans 90 days or more past due |
$476 | $477 | $461 | $556 | $579 | |||||||||||||||
| Nonperforming assets to loans plus ORE (%) |
.41 | .44 | .41 | .38 | .30 | |||||||||||||||
| (a) Throughout this document, nonperforming assets and related ratios do not include accruing loans 90 days or more past due
|
| |||||||||||||||||||
10
|
|
U.S. Bancorp First Quarter 2021 Results | |
| COMMON SHARES | ||||||||||||||||||||
| (Millions) | 1Q | 4Q | 3Q | 2Q | 1Q | |||||||||||||||
| 2021 | 2020 | 2020 | 2020 | 2020 | ||||||||||||||||
| Beginning shares outstanding |
1,507 | 1,506 | 1,506 | 1,506 | 1,534 | |||||||||||||||
| Shares issued for stock incentive plans, acquisitions and other corporate purposes |
3 | 1 | -- | -- | 3 | |||||||||||||||
| Shares repurchased |
(13 | ) | -- | -- | -- | (31 | ) | |||||||||||||
|
|
|
|
|
|
|
|
|
|
|
|||||||||||
| Ending shares outstanding |
1,497 | 1,507 | 1,506 | 1,506 | 1,506 | |||||||||||||||
|
|
|
|
|
|
|
|
|
|
|
|||||||||||
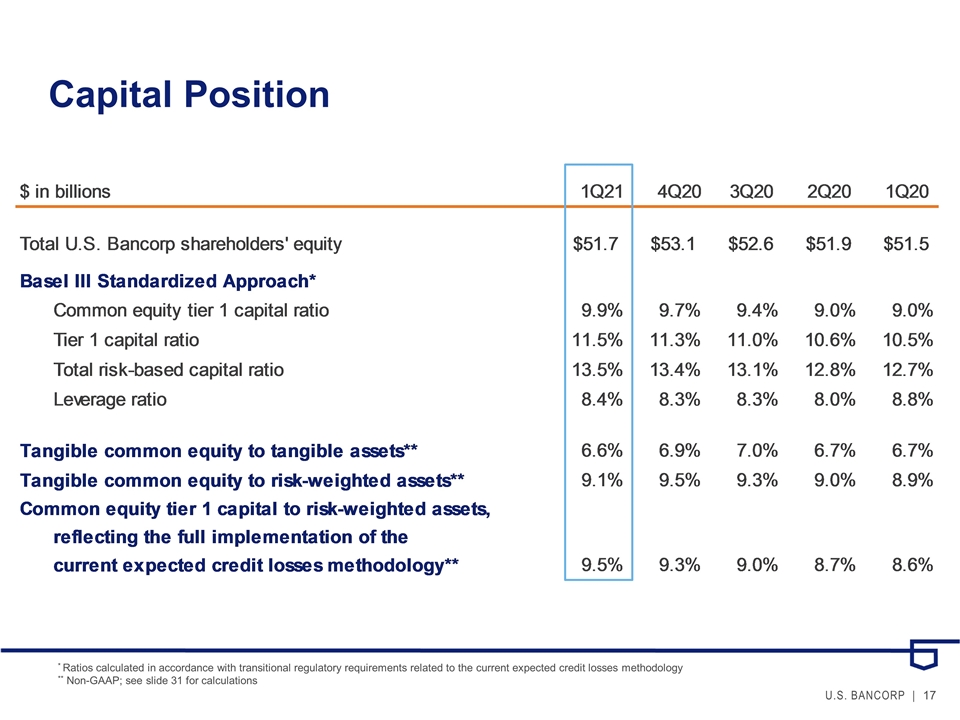
| CAPITAL POSITION | ||||||||||||||||||||
| ($ in millions) | Mar 31 | Dec 31 | Sep 30 | Jun 30 | Mar 31 | |||||||||||||||
| 2021 | 2020 | 2020 | 2020 | 2020 | ||||||||||||||||
| Total U.S. Bancorp shareholders’ equity |
$ | 51,678 | $ | 53,095 | $ | 52,565 | $ | 51,850 | $ | 51,532 | ||||||||||
| Basel III Standardized Approach (a) |
||||||||||||||||||||
| Common equity tier 1 capital |
$ | 39,103 | $ | 38,045 | $ | 37,485 | $ | 36,351 | $ | 36,224 | ||||||||||
| Tier 1 capital |
45,517 | 44,474 | 43,916 | 42,781 | 42,651 | |||||||||||||||
| Total risk-based capital |
53,625 | 52,602 | 52,086 | 51,457 | 51,277 | |||||||||||||||
| Common equity tier 1 capital ratio |
9.9 | % | 9.7 | % | 9.4 | % | 9.0 | % | 9.0 | % | ||||||||||
| Tier 1 capital ratio |
11.5 | 11.3 | 11.0 | 10.6 | 10.5 | |||||||||||||||
| Total risk-based capital ratio |
13.5 | 13.4 | 13.1 | 12.8 | 12.7 | |||||||||||||||
| Leverage ratio |
8.4 | 8.3 | 8.3 | 8.0 | 8.8 | |||||||||||||||
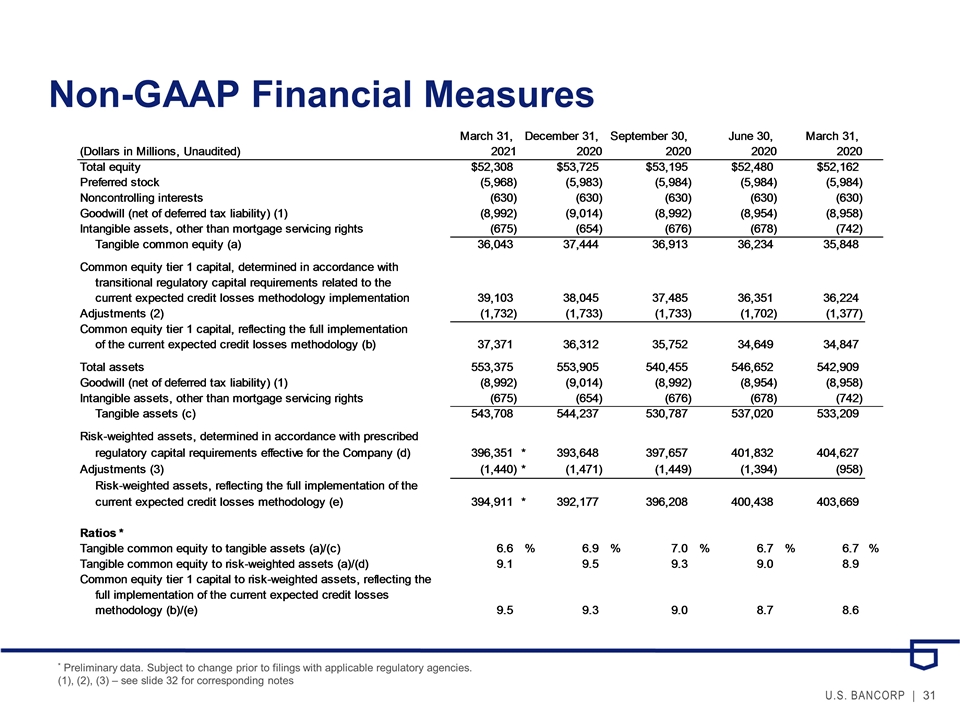
| Tangible common equity to tangible assets (b) |
6.6 | 6.9 | 7.0 | 6.7 | 6.7 | |||||||||||||||
| Tangible common equity to risk-weighted assets (b) |
9.1 | 9.5 | 9.3 | 9.0 | 8.9 | |||||||||||||||
| Common equity tier 1 capital to risk-weighted assets, reflecting the full implementation of the current expected credit losses methodology (b) |
9.5 | 9.3 | 9.0 | 8.7 | 8.6 | |||||||||||||||
| (a) Amounts and ratios calculated in accordance with transitional regulatory requirements related to the current expected credit losses methodology |
| |||||||||||||||||||
| (b) See Non-GAAP Financial Measures reconciliation on page 16 |
|
|||||||||||||||||||
Total U.S. Bancorp shareholders’ equity was $51.7 billion at March 31, 2021, compared with $53.1 billion at December 31, 2020, and $51.5 billion at March 31, 2020. Beginning in March of 2020 and continuing through the remainder of 2020, the Company suspended all common stock repurchases except for those done exclusively in connection with its stock-based compensation programs. This action was initially taken to maintain strong capital levels given the impact and uncertainties of COVID-19 on the economy and global markets. Due to continued economic uncertainty, the Federal Reserve Board implemented measures beginning in the fourth quarter of 2020 and extending through the first quarter of 2021, restricting capital distributions of all large bank holding companies, including U.S. Bancorp. These restrictions include capping common stock dividends at existing rates and limiting the aggregate amount of common stock dividends and share repurchases to an amount not exceeding the average net income of the four preceding calendar quarters. Based on the results of the December 2020 Federal Reserve Stress Test, the Company announced its Board of Directors had approved an authorization to repurchase up to $3.0 billion of its common stock beginning January 1, 2021.
All regulatory ratios continue to be in excess of “well-capitalized” requirements. The common equity tier 1 capital to risk-weighted assets ratio using the Basel III standardized approach was 9.9 percent at March 31, 2021, compared with 9.7 percent at December 31, 2020, and 9.0 percent at March 31, 2020. The Company’s common equity tier 1 capital to risk-weighted assets ratio, reflecting the full implementation of the current expected credit losses methodology was 9.5 percent at March 31, 2021, compared with 9.3 percent at December 31, 2020, and 8.6 percent at March 31, 2020.
11
|
|
U.S. Bancorp First Quarter 2021 Results | |
|
Investor Conference Call |
On Thursday, April 15, 2021, at 10 a.m. CT, Chairman, President and Chief Executive Officer Andy Cecere and Vice Chair and Chief Financial Officer Terry Dolan will host a conference call to review the financial results. The conference call will be available online or by telephone. To access the webcast and presentation, visit U.S. Bancorp’s website at usbank.com and click on “About Us,” “Investor Relations” and “Webcasts & Presentations.” To access the conference call from locations within the United States and Canada, please dial 866.316.1409. Participants calling from outside the United States and Canada, please dial 706.634.9086. The conference ID number for all participants is 2351343. For those unable to participate during the live call, a recording will be available at approximately 1 p.m. CT on Thursday, April 15 and will be accessible until Thursday, April 22 at 10:59 p.m. CT. To access the recorded message within the United States and Canada, please dial 855.859.2056. If calling from outside the United States and Canada, please dial 404.537.3406 to access the recording. The conference ID is 2351343.
| About U.S. Bancorp |
U.S. Bancorp, with nearly 70,000 employees and $553 billion in assets as of March 31, 2021, is the parent company of U.S. Bank National Association, the fifth-largest commercial bank in the United States. The Minneapolis-based bank blends its relationship teams, branches and ATM network with digital tools that allow customers to bank when, where and how they prefer. U.S. Bank is committed to serving its millions of retail, business, wealth management, payment, commercial, corporate, and investment customers across the country and around the world as a trusted and responsible financial partner. This commitment continues to earn a spot on the Ethisphere Institute’s World’s Most Ethical Companies list and puts U.S. Bank in the top 5% of global companies assessed on the CDP A List for climate change action. Visit usbank.com for more.
|
Forward-looking Statements |
“Safe Harbor” Statement under the Private Securities Litigation Reform Act of 1995:
This press release contains forward-looking statements about U.S. Bancorp. Statements that are not historical or current facts, including statements about beliefs and expectations, are forward-looking statements and are based on the information available to, and assumptions and estimates made by, management as of the date hereof. These forward-looking statements cover, among other things, anticipated future revenue and expenses and the future plans and prospects of U.S. Bancorp. Forward-looking statements involve inherent risks and uncertainties, and important factors could cause actual results to differ materially from those anticipated. The COVID-19 pandemic is adversely affecting U.S. Bancorp, its customers, counterparties, employees, and third-party service providers, and the ultimate extent of the impacts on its business, financial position, results of operations, liquidity, and prospects is uncertain. Continued deterioration in general business and economic conditions or turbulence in domestic or global financial markets could adversely affect U.S. Bancorp’s revenues and the values of its assets and liabilities, reduce the availability of funding to certain financial institutions, lead to a tightening of credit, and increase stock price volatility. In addition, changes to statutes, regulations, or regulatory policies or practices could affect U.S. Bancorp in substantial and unpredictable ways. U.S. Bancorp’s results could also be adversely affected by changes in interest rates; further increases in unemployment rates; deterioration in the credit quality of its loan portfolios or in the value of the collateral securing those loans; deterioration in the value of its investment securities; legal and regulatory developments; litigation; increased competition from both banks and non-banks; civil unrest; changes in customer behavior and preferences; breaches in data security; failures to safeguard personal information; effects of mergers and acquisitions and related integration; effects of critical accounting policies and judgments; and management’s ability to effectively manage credit risk, market risk, operational risk, compliance risk, strategic risk, interest rate risk, liquidity risk and reputation risk.
For discussion of these and other risks that may cause actual results to differ from expectations, refer to U.S. Bancorp’s Annual Report on Form 10-K for the year ended December 31, 2020, on file with the Securities and Exchange Commission, including the sections entitled “Corporate Risk Profile” and “Risk Factors” contained in Exhibit 13, and all subsequent filings with the Securities and Exchange Commission under Sections 13(a), 13(c), 14 or 15(d) of the Securities Exchange Act of 1934. In addition, factors other than these risks also could adversely affect U.S. Bancorp’s results, and the reader should not consider these risks to be a complete set of all potential risks or uncertainties. Forward-looking statements speak only as of the date hereof, and U.S. Bancorp undertakes no obligation to update them in light of new information or future events.
12
|
|
U.S. Bancorp First Quarter 2021 Results | |
|
Non-GAAP Financial Measures |
In addition to capital ratios defined by banking regulators, the Company considers various other measures when evaluating capital utilization and adequacy, including:
| • | Tangible common equity to tangible assets |
| • | Tangible common equity to risk-weighted assets |
| • | Common equity tier 1 capital to risk-weighted assets, reflecting the full implementation of the current expected credit losses methodology, and |
| • | Return on tangible common equity. |
These capital measures are viewed by management as useful additional methods of evaluating the Company’s utilization of its capital held and the level of capital available to withstand unexpected negative market or economic conditions. Additionally, presentation of these measures allows investors, analysts and banking regulators to assess the Company’s capital position relative to other financial services companies. These capital measures are not defined in generally accepted accounting principles (“GAAP”), or are not currently effective or defined in banking regulations. In addition, certain of these measures differ from currently effective capital ratios defined by banking regulations principally in that the currently effective ratios, which are subject to certain transitional provisions, temporarily exclude the impact of the 2020 adoption of accounting guidance related to impairment of financial instruments based on the current expected credit losses methodology. As a result, these capital measures disclosed by the Company may be considered non-GAAP financial measures. Management believes this information helps investors assess trends in the Company’s capital adequacy.
The Company also discloses net interest income and related ratios and analysis on a taxable-equivalent basis, which may also be considered non-GAAP financial measures. The Company believes this presentation to be the preferred industry measurement of net interest income as it provides a relevant comparison of net interest income arising from taxable and tax-exempt sources. In addition, certain performance measures, including the efficiency ratio and net interest margin utilize net interest income on a taxable-equivalent basis.
There may be limits in the usefulness of these measures to investors. As a result, the Company encourages readers to consider the consolidated financial statements and other financial information contained in this press release in their entirety, and not to rely on any single financial measure. A table follows that shows the Company’s calculation of these non-GAAP financial measures.
13
|
|
U.S. Bancorp First Quarter 2021 Results | |
| CONSOLIDATED STATEMENT OF INCOME | ||||||||
| Three Months Ended | ||||||||
| (Dollars and Shares in Millions, Except Per Share Data) | March 31, | |||||||
| (Unaudited) | 2021 | 2020 | ||||||
| Interest Income |
||||||||
| Loans |
$2,724 | $3,311 | ||||||
| Loans held for sale |
67 | 44 | ||||||
| Investment securities |
517 | 692 | ||||||
| Other interest income |
33 | 69 | ||||||
| Total interest income |
3,341 | 4,116 | ||||||
| Interest Expense |
||||||||
| Deposits |
85 | 525 | ||||||
| Short-term borrowings |
16 | 71 | ||||||
| Long-term debt |
177 | 297 | ||||||
| Total interest expense |
278 | 893 | ||||||
| Net interest income |
3,063 | 3,223 | ||||||
| Provision for credit losses |
(827 | ) | 993 | |||||
| Net interest income after provision for credit losses |
3,890 | 2,230 | ||||||
| Noninterest Income |
||||||||
| Credit and debit card revenue |
336 | 304 | ||||||
| Corporate payment products revenue |
126 | 145 | ||||||
| Merchant processing services |
318 | 337 | ||||||
| Trust and investment management fees |
444 | 427 | ||||||
| Deposit service charges |
161 | 209 | ||||||
| Treasury management fees |
147 | 143 | ||||||
| Commercial products revenue |
280 | 246 | ||||||
| Mortgage banking revenue |
299 | 395 | ||||||
| Investment products fees |
55 | 49 | ||||||
| Securities gains (losses), net |
25 | 50 | ||||||
| Other |
190 | 220 | ||||||
| Total noninterest income |
2,381 | 2,525 | ||||||
| Noninterest Expense |
||||||||
| Compensation |
1,803 | 1,620 | ||||||
| Employee benefits |
384 | 352 | ||||||
| Net occupancy and equipment |
263 | 276 | ||||||
| Professional services |
98 | 99 | ||||||
| Marketing and business development |
48 | 74 | ||||||
| Technology and communications |
359 | 289 | ||||||
| Postage, printing and supplies |
69 | 72 | ||||||
| Other intangibles |
38 | 42 | ||||||
| Other |
317 | 492 | ||||||
| Total noninterest expense |
3,379 | 3,316 | ||||||
| Income before income taxes |
2,892 | 1,439 | ||||||
| Applicable income taxes |
607 | 260 | ||||||
| Net income |
2,285 | 1,179 | ||||||
| Net (income) loss attributable to noncontrolling interests |
(5 | ) | (8 | ) | ||||
| Net income attributable to U.S. Bancorp |
$2,280 | $1,171 | ||||||
| Net income applicable to U.S. Bancorp common shareholders |
$2,175 | $1,088 | ||||||
| Earnings per common share |
$1.45 | $.72 | ||||||
| Diluted earnings per common share |
$1.45 | $.72 | ||||||
| Dividends declared per common share |
$.42 | $.42 | ||||||
| Average common shares outstanding |
1,502 | 1,518 | ||||||
| Average diluted common shares outstanding |
1,503 | 1,519 | ||||||
14

| CONSOLIDATED ENDING BALANCE SHEET |
|
|||||||||||
| (Dollars in Millions) | March 31, 2021 |
December 31, 2020 |
March 31, 2020 |
|||||||||
| Assets |
(Unaudited) | (Unaudited) | ||||||||||
| Cash and due from banks |
$43,501 | $62,580 | $46,805 | |||||||||
| Available-for-sale investment securities |
156,003 | 136,840 | 123,681 | |||||||||
| Loans held for sale |
8,991 | 8,761 | 4,623 | |||||||||
| Loans |
||||||||||||
| Commercial |
104,158 | 102,871 | 126,317 | |||||||||
| Commercial real estate |
38,432 | 39,311 | 40,980 | |||||||||
| Residential mortgages |
73,624 | 76,155 | 71,175 | |||||||||
| Credit card |
20,872 | 22,346 | 22,781 | |||||||||
| Other retail |
57,341 | 57,024 | 57,052 | |||||||||
| Total loans |
294,427 | 297,707 | 318,305 | |||||||||
| Less allowance for loan losses |
(6,343 | ) | (7,314 | ) | (6,216 | ) | ||||||
| Net loans |
288,084 | 290,393 | 312,089 | |||||||||
| Premises and equipment |
3,388 | 3,468 | 3,660 | |||||||||
| Goodwill |
9,905 | 9,918 | 9,836 | |||||||||
| Other intangible assets |
3,462 | 2,864 | 2,629 | |||||||||
| Other assets |
40,041 | 39,081 | 39,586 | |||||||||
| Total assets |
$553,375 | $553,905 | $542,909 | |||||||||
| Liabilities and Shareholders’ Equity |
||||||||||||
| Deposits |
||||||||||||
| Noninterest-bearing |
126,754 | $118,089 | $91,432 | |||||||||
| Interest-bearing |
307,007 | 311,681 | 303,422 | |||||||||
| Total deposits |
433,761 | 429,770 | 394,854 | |||||||||
| Short-term borrowings |
12,098 | 11,766 | 26,344 | |||||||||
| Long-term debt |
37,419 | 41,297 | 52,298 | |||||||||
| Other liabilities |
17,789 | 17,347 | 17,251 | |||||||||
| Total liabilities |
501,067 | 500,180 | 490,747 | |||||||||
| Shareholders’ equity |
||||||||||||
| Preferred stock |
5,968 | 5,983 | 5,984 | |||||||||
| Common stock |
21 | 21 | 21 | |||||||||
| Capital surplus |
8,487 | 8,511 | 8,452 | |||||||||
| Retained earnings |
65,740 | 64,188 | 62,544 | |||||||||
| Less treasury stock |
(26,443 | ) | (25,930 | ) | (25,972 | ) | ||||||
| Accumulated other comprehensive income (loss) |
(2,095 | ) | 322 | 503 | ||||||||
| Total U.S. Bancorp shareholders’ equity |
51,678 | 53,095 | 51,532 | |||||||||
| Noncontrolling interests |
630 | 630 | 630 | |||||||||
| Total equity |
52,308 | 53,725 | 52,162 | |||||||||
| Total liabilities and equity |
$553,375 | $553,905 | $542,909 | |||||||||
15
|
|
| NON-GAAP FINANCIAL MEASURES |
| |||||||||||||||||||
| March 31, | December 31, | September 30, | June 30, | March 31, | ||||||||||||||||
| (Dollars in Millions, Unaudited) | 2021 | 2020 | 2020 | 2020 | 2020 | |||||||||||||||
| Total equity |
$52,308 | $53,725 | $53,195 | $52,480 | $52,162 | |||||||||||||||
| Preferred stock |
(5,968 | ) | (5,983 | ) | (5,984 | ) | (5,984 | ) | (5,984 | ) | ||||||||||
| Noncontrolling interests |
(630 | ) | (630 | ) | (630 | ) | (630 | ) | (630 | ) | ||||||||||
| Goodwill (net of deferred tax liability) (1) |
(8,992 | ) | (9,014 | ) | (8,992 | ) | (8,954 | ) | (8,958 | ) | ||||||||||
| Intangible assets, other than mortgage servicing rights |
(675 | ) | (654 | ) | (676 | ) | (678 | ) | (742 | ) | ||||||||||
| Tangible common equity (a) |
36,043 | 37,444 | 36,913 | 36,234 | 35,848 | |||||||||||||||
| Common equity tier 1 capital, determined in accordance with transitional regulatory capital requirements related to the current expected credit losses methodology implementation |
39,103 | 38,045 | 37,485 | 36,351 | 36,224 | |||||||||||||||
| Adjustments (2) |
(1,732 | ) | (1,733 | ) | (1,733 | ) | (1,702 | ) | (1,377 | ) | ||||||||||
| Common equity tier 1 capital, reflecting the full implementation of the current expected credit losses methodology (b) |
37,371 | 36,312 | 35,752 | 34,649 | 34,847 | |||||||||||||||
| Total assets |
553,375 | 553,905 | 540,455 | 546,652 | 542,909 | |||||||||||||||
| Goodwill (net of deferred tax liability) (1) |
(8,992 | ) | (9,014 | ) | (8,992 | ) | (8,954 | ) | (8,958 | ) | ||||||||||
| Intangible assets, other than mortgage servicing rights |
(675 | ) | (654 | ) | (676 | ) | (678 | ) | (742 | ) | ||||||||||
| Tangible assets (c) |
543,708 | 544,237 | 530,787 | 537,020 | 533,209 | |||||||||||||||
| Risk-weighted assets, determined in accordance with prescribed regulatory capital requirements effective for the Company (d) |
396,351 | * | 393,648 | 397,657 | 401,832 | 404,627 | ||||||||||||||
| Adjustments (3) |
(1,440) | * | (1,471 | ) | (1,449 | ) | (1,394 | ) | (958 | ) | ||||||||||
| Risk-weighted assets, reflecting the full implementation of the current expected credit losses methodology (e) |
394,911 | * | 392,177 | 396,208 | 400,438 | 403,669 | ||||||||||||||
| Ratios * |
||||||||||||||||||||
| Tangible common equity to tangible assets (a)/(c) |
6.6 | % | 6.9 | % | 7.0 | % | 6.7 | % | 6.7 | % | ||||||||||
| Tangible common equity to risk-weighted assets (a)/(d) |
9.1 | 9.5 | 9.3 | 9.0 | 8.9 | |||||||||||||||
| Common equity tier 1 capital to risk-weighted assets, reflecting the full implementation of the current expected credit losses methodology (b)/(e) |
9.5 | 9.3 | 9.0 | 8.7 | 8.6 | |||||||||||||||
| Three Months Ended | ||||||||||||||||||||
| March 31, | December 31, | September 30, | June 30, | March 31, | ||||||||||||||||
| 2021 | 2020 | 2020 | 2020 | 2020 | ||||||||||||||||
| Net income applicable to U.S. Bancorp common shareholders |
$2,175 | $1,425 | $1,494 | $614 | $1,088 | |||||||||||||||
| Intangibles amortization (net-of-tax) |
30 | 37 | 35 | 34 | 33 | |||||||||||||||
| Net income applicable to U.S. Bancorp common shareholders, excluding intangibles amortization |
2,205 | 1,462 | 1,529 | 648 | 1,121 | |||||||||||||||
| Annualized net income applicable to U.S. Bancorp common shareholders, excluding intangible amortization (f) |
8,943 | 5,816 | 6,083 | 2,606 | 4,509 | |||||||||||||||
| Average total equity |
53,359 | 53,801 | 53,046 | 52,871 | 51,776 | |||||||||||||||
| Average preferred stock |
(6,213) | (6,217) | (5,984) | (5,984) | (5,984) | |||||||||||||||
| Average noncontrolling interests |
(630) | (630) | (630) | (630) | (630) | |||||||||||||||
| Average goodwill (net of deferred tax liability) (1) |
(9,010) | (9,003) | (8,975) | (8,960) | (8,825) | |||||||||||||||
| Average intangible assets, other than mortgage servicing rights |
(649) | (673) | (711) | (706) | (688) | |||||||||||||||
| Average tangible common equity (g) |
36,857 | 37,278 | 36,746 | 36,591 | 35,649 | |||||||||||||||
| Return on tangible common equity (f)/(g) |
24.3 | % | 15.6 | % | 16.6 | % | 7.1 | % | 12.6 | % | ||||||||||
| Net interest income |
$3,063 | $3,175 | $3,227 | $3,200 | $3,223 | |||||||||||||||
| Taxable-equivalent adjustment (4) |
26 | 26 | 25 | 24 | 24 | |||||||||||||||
| Net interest income, on a taxable-equivalent basis |
3,089 | 3,201 | 3,252 | 3,224 | 3,247 | |||||||||||||||
| Net interest income, on a taxable-equivalent basis (as calculated above) |
3,089 | 3,201 | 3,252 | 3,224 | 3,247 | |||||||||||||||
| Noninterest income |
2,381 | 2,550 | 2,712 | 2,614 | 2,525 | |||||||||||||||
| Less: Securities gains (losses), net |
25 | 34 | 12 | 81 | 50 | |||||||||||||||
| Total net revenue, excluding net securities gains (losses) (h) |
5,445 | 5,717 | 5,952 | 5,757 | 5,722 | |||||||||||||||
| Noninterest expense (i) |
3,379 | 3,364 | 3,371 | 3,318 | 3,316 | |||||||||||||||
| Efficiency ratio (i)/(h) |
62.1% | 58.8% | 56.6% | 57.6% | 58.0% | |||||||||||||||
| * | Preliminary data. Subject to change prior to filings with applicable regulatory agencies. |
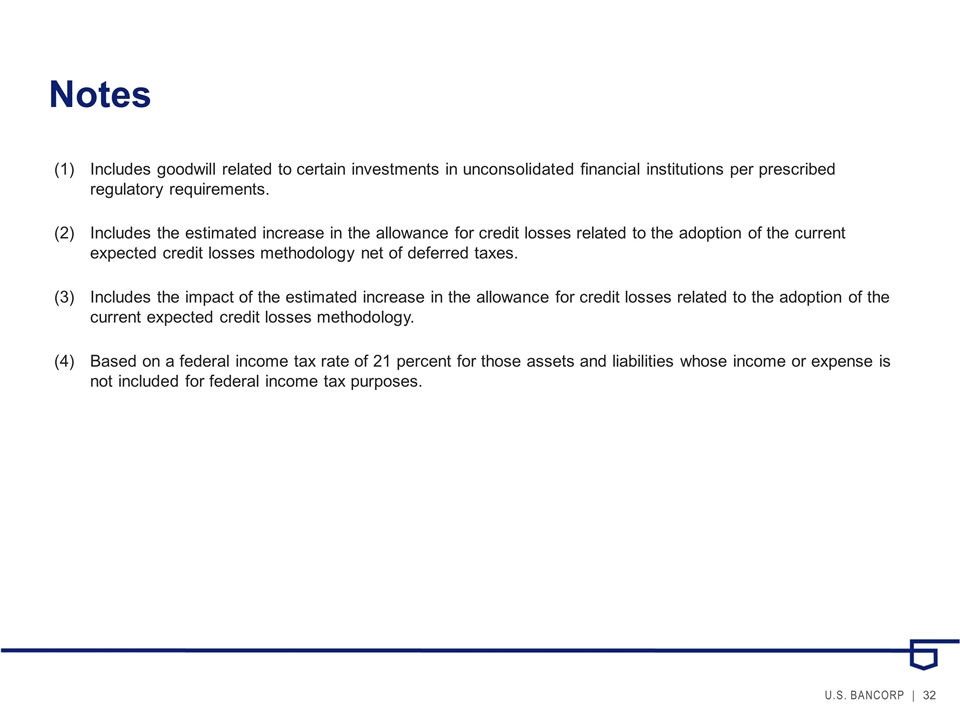
| (1) | Includes goodwill related to certain investments in unconsolidated financial institutions per prescribed regulatory requirements. |
| (2) | Includes the estimated increase in the allowance for credit losses related to the adoption of the current expected credit losses methodology net of deferred taxes. |
| (3) | Includes the impact of the estimated increase in the allowance for credit losses related to the adoption of the current expected credit losses methodology. |
| (4) | Based on a federal income tax rate of 21 percent for those assets and liabilities whose income or expense is not included for federal income tax purposes. |
16

|
|
||
| LINE OF BUSINESS FINANCIAL PERFORMANCE (a) | ||||||||||||||||||||
| ($ in millions) | Net Income Attributable | |||||||||||||||||||
| to U.S. Bancorp | Percent Change | |||||||||||||||||||
| Business Line | 1Q 2021 |
4Q 2020 |
1Q 2020 |
1Q21 vs 4Q20 |
1Q21 vs 1Q20 |
|||||||||||||||
| Corporate and Commercial Banking |
$419 | $381 | $141 | 10.0 | nm | |||||||||||||||
| Consumer and Business Banking |
671 | 730 | 619 | (8.1 | ) | 8.4 | ||||||||||||||
| Wealth Management and Investment Services |
171 | 151 | 206 | 13.2 | (17.0 | ) | ||||||||||||||
| Payment Services |
479 | 282 | 303 | 69.9 | 58.1 | |||||||||||||||
| Treasury and Corporate Support |
540 | (25 | ) | (98) | nm | nm | ||||||||||||||
| Consolidated Company |
$ | 2,280 | $ | 1,519 | $ | 1,171 | 50.1 | 94.7 | ||||||||||||
| (a) preliminary data
|
||||||||||||||||||||
Lines of Business
The Company’s major lines of business are Corporate and Commercial Banking, Consumer and Business Banking, Wealth Management and Investment Services, Payment Services, and Treasury and Corporate Support. These operating segments are components of the Company about which financial information is prepared and is evaluated regularly by management in deciding how to allocate resources and assess performance. Business line results are derived from the Company’s business unit profitability reporting systems by specifically attributing managed balance sheet assets, deposits and other liabilities and their related income or expense. Designations, assignments and allocations change from time to time as management systems are enhanced, methods of evaluating performance or product lines change or business segments are realigned to better respond to the Company’s diverse customer base. During 2021, certain organization and methodology changes were made and, accordingly, prior period results were restated and presented on a comparable basis.
2
|
|
||
| CORPORATE AND COMMERCIAL BANKING (a) | ||||||||||||||||||||
| ($ in millions) | Percent Change | |||||||||||||||||||
| 1Q 2021 |
4Q 2020 |
1Q 2020 |
1Q21 vs 4Q20 |
1Q21 vs 1Q20 |
||||||||||||||||
| Condensed Income Statement |
||||||||||||||||||||
| Net interest income (taxable-equivalent basis) |
$666 | $731 | $784 | (8.9 | ) | (15.1 | ) | |||||||||||||
| Noninterest income |
259 | 208 | 271 | 24.5 | (4.4 | ) | ||||||||||||||
| Securities gains (losses), net |
-- | -- | -- | -- | -- | |||||||||||||||
| Total net revenue |
925 | 939 | 1,055 | (1.5 | ) | (12.3 | ) | |||||||||||||
| Noninterest expense |
406 | 392 | 443 | 3.6 | (8.4 | ) | ||||||||||||||
| Other intangibles |
-- | -- | -- | -- | -- | |||||||||||||||
| Total noninterest expense |
406 | 392 | 443 | 3.6 | (8.4 | ) | ||||||||||||||
| Income before provision and taxes |
519 | 547 | 612 | (5.1 | ) | (15.2 | ) | |||||||||||||
| Provision for credit losses |
(40 | ) | 39 | 424 | nm | nm | ||||||||||||||
| Income before income taxes |
559 | 508 | 188 | 10.0 | nm | |||||||||||||||
| Income taxes and taxable-equivalent adjustment |
140 | 127 | 47 | 10.2 | nm | |||||||||||||||
| Net income |
419 | 381 | 141 | 10.0 | nm | |||||||||||||||
| Net (income) loss attributable to noncontrolling interests |
-- | -- | -- | -- | -- | |||||||||||||||
| Net income attributable to U.S. Bancorp |
$419 | $381 | $141 | 10.0 | nm | |||||||||||||||
| Average Balance Sheet Data |
||||||||||||||||||||
| Loans |
$94,872 | $98,919 | $103,368 | (4.1 | ) | (8.2 | ) | |||||||||||||
| Other earning assets |
4,308 | 4,141 | 4,555 | 4.0 | (5.4 | ) | ||||||||||||||
| Goodwill |
1,647 | 1,647 | 1,647 | -- | -- | |||||||||||||||
| Other intangible assets |
5 | 6 | 7 | (16.7 | ) | (28.6 | ) | |||||||||||||
| Assets |
107,022 | 111,599 | 115,308 | (4.1 | ) | (7.2 | ) | |||||||||||||
| Noninterest-bearing deposits |
51,020 | 48,889 | 29,370 | 4.4 | 73.7 | |||||||||||||||
| Interest-bearing deposits |
67,750 | 76,357 | 80,657 | (11.3 | ) | (16.0 | ) | |||||||||||||
| Total deposits |
118,770 | 125,246 | 110,027 | (5.2 | ) | 7.9 | ||||||||||||||
| Total U.S. Bancorp shareholders’ equity |
13,074 | 14,146 | 14,182 | (7.6 | ) | (7.8 | ) | |||||||||||||
| (a) preliminary data
|
||||||||||||||||||||
Corporate and Commercial Banking offers lending, equipment finance and small-ticket leasing, depository services, treasury management, capital markets services, international trade services and other financial services to middle market, large corporate, commercial real estate, financial institution, non-profit and public sector clients.
Corporate and Commercial Banking contributed $419 million of the Company’s net income in the first quarter of 2021, compared with $141 million in the first quarter of 2020. Total net revenue decreased $130 million (12.3 percent) due to a decrease of $118 million (15.1 percent) in net interest income and a decrease of $12 million (4.4 percent) in total noninterest income. Net interest income decreased primarily due to the impact of declining interest rates on the margin benefit from deposits and lower loan balances, partially offset by favorable deposit mix with higher noninterest-bearing balances and higher loan fees. Total noninterest income decreased year-over-year primarily driven by lower capital markets activities, including trading revenue, and commercial leasing fees, partially offset by higher non-yield loan fees on unused commitments. Total noninterest expense declined $37 million (8.4 percent) compared with a year ago primarily due to lower net shared services expense and production incentives as well as lower marketing and business development expense driven by a reduction in travel as a result of COVID-19. The provision for credit losses decreased $464 million primarily due to a favorable change in the reserve allocation driven by improving credit risk ratings.
3
|
|
||
| CONSUMER AND BUSINESS BANKING (a) | ||||||||||||||||||||
| ($ in millions) | Percent Change | |||||||||||||||||||
| 1Q 2021 |
4Q 2020 |
1Q 2020 |
1Q21 vs 4Q20 |
1Q21 vs 1Q20 |
||||||||||||||||
| Condensed Income Statement |
||||||||||||||||||||
| Net interest income (taxable-equivalent basis) |
$1,625 | $1,634 | $1,531 | (.6 | ) | 6.1 | ||||||||||||||
| Noninterest income |
617 | 791 | 757 | (22.0 | ) | (18.5 | ) | |||||||||||||
| Securities gains (losses), net |
-- | -- | -- | -- | -- | |||||||||||||||
| Total net revenue |
2,242 | 2,425 | 2,288 | (7.5 | ) | (2.0 | ) | |||||||||||||
| Noninterest expense |
1,388 | 1,431 | 1,336 | (3.0 | ) | 3.9 | ||||||||||||||
| Other intangibles |
3 | 4 | 4 | (25.0 | ) | (25.0 | ) | |||||||||||||
| Total noninterest expense |
1,391 | 1,435 | 1,340 | (3.1 | ) | 3.8 | ||||||||||||||
| Income before provision and taxes |
851 | 990 | 948 | (14.0 | ) | (10.2 | ) | |||||||||||||
| Provision for credit losses |
(44 | ) | 16 | 123 | nm | nm | ||||||||||||||
| Income before income taxes |
895 | 974 | 825 | (8.1 | ) | 8.5 | ||||||||||||||
| Income taxes and taxable-equivalent adjustment |
224 | 244 | 206 | (8.2 | ) | 8.7 | ||||||||||||||
| Net income |
671 | 730 | 619 | (8.1 | ) | 8.4 | ||||||||||||||
| Net (income) loss attributable to noncontrolling interests |
-- | -- | -- | -- | -- | |||||||||||||||
| Net income attributable to U.S. Bancorp |
$671 | $730 | $619 | (8.1 | ) | 8.4 | ||||||||||||||
| Average Balance Sheet Data |
||||||||||||||||||||
| Loans |
$153,177 | $156,729 | $146,718 | (2.3 | ) | 4.4 | ||||||||||||||
| Other earning assets |
10,203 | 8,966 | 4,967 | 13.8 | nm | |||||||||||||||
| Goodwill |
3,475 | 3,475 | 3,574 | -- | (2.8 | ) | ||||||||||||||
| Other intangible assets |
2,491 | 2,137 | 2,411 | 16.6 | 3.3 | |||||||||||||||
| Assets |
175,541 | 176,811 | 161,886 | (.7 | ) | 8.4 | ||||||||||||||
| Noninterest-bearing deposits |
39,186 | 39,623 | 27,866 | (1.1 | ) | 40.6 | ||||||||||||||
| Interest-bearing deposits |
166,876 | 161,298 | 133,718 | 3.5 | 24.8 | |||||||||||||||
| Total deposits |
206,062 | 200,921 | 161,584 | 2.6 | 27.5 | |||||||||||||||
| Total U.S. Bancorp shareholders’ equity |
13,453 | 13,462 | 13,422 | (.1 | ) | .2 | ||||||||||||||
| (a) preliminary data
|
||||||||||||||||||||
Consumer and Business Banking delivers products and services through banking offices, telephone servicing and sales, on-line services, direct mail, ATM processing and mobile devices. It encompasses community banking, metropolitan banking and indirect lending, as well as mortgage banking.
Consumer and Business Banking contributed $671 million of the Company’s net income in the first quarter of 2021, compared with $619 million in the first quarter of 2020. Total net revenue decreased $46 million (2.0 percent) due to a decrease of $140 million (18.5 percent) in total noninterest income, partially offset by an increase in net interest income of $94 million (6.1 percent). Net interest income reflected continued strong growth in deposit balances and loan growth, driven by mortgage and indirect lending as well as by loans made under the SBA’s Paycheck Protection Program and GNMA buybacks. The increase in net interest income also reflected higher loan fees and favorable loan spreads, partially offset by the impact of declining interest rates on deposit spreads. Total noninterest income decreased primarily due to lower mortgage banking revenue reflecting a reduction in the fair value of mortgage servicing rights, net of hedging activities, partially offset by higher production volume and related gain of sale margins compared with a year ago as well as lower deposit service charges. Total noninterest expense increased $51 million (3.8 percent) primarily due to an increase in net shared services expense due to investments in digital capabilities and higher variable compensation related to mortgage banking origination activities. The provision for credit losses decreased $167 million due to a favorable change in the reserve allocation primarily reflecting lower delinquency rates in consumer portfolios and a reduction in end of period outstanding balances in the first quarter of 2021 compared with growth in the first quarter of 2020.
4
|
|
||
| WEALTH MANAGEMENT AND INVESTMENT SERVICES (a) | ||||||||||||||||||||
| ($ in millions) | Percent Change | |||||||||||||||||||
| 1Q 2021 |
4Q 2020 |
1Q 2020 |
1Q21 vs 4Q20 |
1Q21 vs 1Q20 |
||||||||||||||||
| Condensed Income Statement |
||||||||||||||||||||
| Net interest income (taxable-equivalent basis) |
$204 | $222 | $284 | (8.1 | ) | (28.2 | ) | |||||||||||||
| Noninterest income |
492 | 478 | 466 | 2.9 | 5.6 | |||||||||||||||
| Securities gains (losses), net |
-- | -- | -- | -- | -- | |||||||||||||||
| Total net revenue |
696 | 700 | 750 | (.6 | ) | (7.2 | ) | |||||||||||||
| Noninterest expense |
459 | 490 | 449 | (6.3 | ) | 2.2 | ||||||||||||||
| Other intangibles |
2 | 3 | 3 | (33.3 | ) | (33.3 | ) | |||||||||||||
| Total noninterest expense |
461 | 493 | 452 | (6.5 | ) | 2.0 | ||||||||||||||
| Income before provision and taxes |
235 | 207 | 298 | 13.5 | (21.1 | ) | ||||||||||||||
| Provision for credit losses |
7 | 5 | 23 | 40.0 | (69.6 | ) | ||||||||||||||
| Income before income taxes |
228 | 202 | 275 | 12.9 | (17.1 | ) | ||||||||||||||
| Income taxes and taxable-equivalent adjustment |
57 | 51 | 69 | 11.8 | (17.4 | ) | ||||||||||||||
| Net income |
171 | 151 | 206 | 13.2 | (17.0 | ) | ||||||||||||||
| Net (income) loss attributable to noncontrolling interests |
-- | -- | -- | -- | -- | |||||||||||||||
| Net income attributable to U.S. Bancorp |
$171 | $151 | $206 | 13.2 | (17.0 | ) | ||||||||||||||
| Average Balance Sheet Data |
||||||||||||||||||||
| Loans |
$12,443 | $12,043 | $10,608 | 3.3 | 17.3 | |||||||||||||||
| Other earning assets |
279 | 292 | 281 | (4.5 | ) | (.7 | ) | |||||||||||||
| Goodwill |
1,619 | 1,618 | 1,617 | .1 | .1 | |||||||||||||||
| Other intangible assets |
42 | 34 | 44 | 23.5 | (4.5 | ) | ||||||||||||||
| Assets |
15,662 | 14,968 | 13,950 | 4.6 | 12.3 | |||||||||||||||
| Noninterest-bearing deposits |
20,277 | 18,699 | 13,232 | 8.4 | 53.2 | |||||||||||||||
| Interest-bearing deposits |
71,629 | 68,328 | 68,842 | 4.8 | 4.0 | |||||||||||||||
| Total deposits |
91,906 | 87,027 | 82,074 | 5.6 | 12.0 | |||||||||||||||
| Total U.S. Bancorp shareholders’ equity |
2,634 | 2,597 | 2,571 | 1.4 | 2.5 | |||||||||||||||
| (a) preliminary data
|
||||||||||||||||||||
Wealth Management and Investment Services provides private banking, financial advisory services, investment management, retail brokerage services, insurance, trust, custody and fund servicing through four businesses: Wealth Management, Global Corporate Trust & Custody, U.S. Bancorp Asset Management and Fund Services.
Wealth Management and Investment Services contributed $171 million of the Company’s net income in the first quarter of 2021, compared with $206 million in the first quarter of 2020. Total net revenue decreased $54 million (7.2 percent) year-over-year reflecting a decrease in net interest income of $80 million (28.2 percent), partially offset by an increase of $26 million (5.6 percent) in noninterest income. Net interest income decreased year-over-year primarily due to the declining margin benefit of deposits given lower interest rates, partially offset by higher noninterest-bearing deposits and favorable deposit mix. Total noninterest income increased primarily due to the impact of core business growth on trust and investment management fees and favorable market conditions, partially offset by higher fee waivers related to money market funds. Total noninterest expense increased $9 million (2.0 percent) compared with the first quarter of 2020 reflecting increased other noninterest expense and higher salary expense due to merit in the current year quarter. The provision for credit losses decreased $16 million (69.6 percent) reflecting a favorable change in the reserve allocation primarily driven by stable credit quality relative to credit quality deterioration in the first quarter of 2020.
5
|
|
||
| PAYMENT SERVICES (a) | ||||||||||||||||||||
| ($ in millions) | Percent Change | |||||||||||||||||||
| 1Q 2021 |
4Q 2020 |
1Q 2020 |
1Q21 vs 4Q20 |
1Q21 vs 1Q20 |
||||||||||||||||
| Condensed Income Statement |
||||||||||||||||||||
| Net interest income (taxable-equivalent basis) |
$628 | $651 | $661 | (3.5 | ) | (5.0 | ) | |||||||||||||
| Noninterest income |
785 | 805 | 794 | (2.5 | ) | (1.1 | ) | |||||||||||||
| Securities gains (losses), net |
-- | -- | -- | -- | -- | |||||||||||||||
| Total net revenue |
1,413 | 1,456 | 1,455 | (3.0 | ) | (2.9 | ) | |||||||||||||
| Noninterest expense |
782 | 836 | 754 | (6.5 | ) | 3.7 | ||||||||||||||
| Other intangibles |
33 | 40 | 35 | (17.5 | ) | (5.7 | ) | |||||||||||||
| Total noninterest expense |
815 | 876 | 789 | (7.0 | ) | 3.3 | ||||||||||||||
| Income before provision and taxes |
598 | 580 | 666 | 3.1 | (10.2 | ) | ||||||||||||||
| Provision for credit losses |
(41 | ) | 204 | 262 | nm | nm | ||||||||||||||
| Income before income taxes |
639 | 376 | 404 | 69.9 | 58.2 | |||||||||||||||
| Income taxes and taxable-equivalent adjustment |
160 | 94 | 101 | 70.2 | 58.4 | |||||||||||||||
| Net income |
479 | 282 | 303 | 69.9 | 58.1 | |||||||||||||||
| Net (income) loss attributable to noncontrolling interests |
-- | -- | -- | -- | -- | |||||||||||||||
| Net income attributable to U.S. Bancorp |
$479 | $282 | $303 | 69.9 | 58.1 | |||||||||||||||
| Average Balance Sheet Data |
||||||||||||||||||||
| Loans |
$29,630 | $30,992 | $33,688 | (4.4 | ) | (12.0 | ) | |||||||||||||
| Other earning assets |
5 | 5 | 6 | -- | (16.7 | ) | ||||||||||||||
| Goodwill |
3,173 | 3,160 | 2,856 | .4 | 11.1 | |||||||||||||||
| Other intangible assets |
544 | 572 | 557 | (4.9 | ) | (2.3 | ) | |||||||||||||
| Assets |
35,095 | 36,508 | 38,285 | (3.9 | ) | (8.3 | ) | |||||||||||||
| Noninterest-bearing deposits |
5,264 | 5,836 | 1,471 | (9.8 | ) | nm | ||||||||||||||
| Interest-bearing deposits |
132 | 130 | 114 | 1.5 | 15.8 | |||||||||||||||
| Total deposits |
5,396 | 5,966 | 1,585 | (9.6 | ) | nm | ||||||||||||||
| Total U.S. Bancorp shareholders’ equity |
7,480 | 7,700 | 7,619 | (2.9 | ) | (1.8 | ) | |||||||||||||
| (a) preliminary data
|
||||||||||||||||||||
Payment Services includes consumer and business credit cards, stored-value cards, debit cards, corporate, government and purchasing card services, consumer lines of credit and merchant processing.
Payment Services contributed $479 million of the Company’s net income in the first quarter of 2021, compared with $303 million in the first quarter of 2020. Total net revenue decreased $42 million (2.9 percent) primarily due to lower net interest income of $33 million (5.0 percent) and slightly lower noninterest income of $9 million (1.1 percent). Net interest income decreased primarily due to lower loan balances, related to higher credit card payment rates, and loan fees, mostly offset by higher deposit balances as a result of state unemployment programs utilizing prepaid debit cards. Total noninterest income decreased year-over-year mainly due to the impact of COVID-19 on consumer spending, particularly related to travel and entertainment activities. However, consumer spending continues to strengthen across most sectors driven by government stimulus, local jurisdictions reducing restrictions and consumer behaviors normalizing resulting in payments revenues being essentially flat. Payments revenue included higher credit and debit card revenue driven by higher net interchange revenue related to sales volumes and higher prepaid fees as a result of government stimulus programs, offset by lower corporate payment products revenue primarily due to lower business spending related to travel and entertainment and lower merchant processing services revenue driven by lower sales volume and merchant fees. Total noninterest expense increased $26 million (3.3 percent) reflecting incremental costs related to the prepaid card business. The provision for credit losses decreased $303 million primarily due to lower delinquency rates in the first quarter of 2021.
6
|
|
||
| TREASURY AND CORPORATE SUPPORT (a) | ||||||||||||||||||||
| ($ in millions) | Percent Change | |||||||||||||||||||
| 1Q 2021 |
4Q 2020 |
1Q 2020 |
1Q21 vs 4Q20 |
1Q21 vs 1Q20 |
||||||||||||||||
| Condensed Income Statement |
||||||||||||||||||||
| Net interest income (taxable-equivalent basis) |
$(34) | $(37) | $(13) | 8.1 | nm | |||||||||||||||
| Noninterest income |
203 | 234 | 187 | (13.2 | ) | 8.6 | ||||||||||||||
| Securities gains (losses), net |
25 | 34 | 50 | (26.5 | ) | (50.0 | ) | |||||||||||||
| Total net revenue |
194 | 231 | 224 | (16.0 | ) | (13.4 | ) | |||||||||||||
| Noninterest expense |
306 | 168 | 292 | 82.1 | 4.8 | |||||||||||||||
| Other intangibles |
-- | -- | -- | -- | -- | |||||||||||||||
| Total noninterest expense |
306 | 168 | 292 | 82.1 | 4.8 | |||||||||||||||
| Income (loss) before provision and taxes |
(112 | ) | 63 | (68) | nm | (64.7 | ) | |||||||||||||
| Provision for credit losses |
(709 | ) | 177 | 161 | nm | nm | ||||||||||||||
| Income (loss) before income taxes |
597 | (114 | ) | (229) | nm | nm | ||||||||||||||
| Income taxes and taxable-equivalent adjustment |
52 | (95 | ) | (139) | nm | nm | ||||||||||||||
| Net income (loss) |
545 | (19 | ) | (90) | nm | nm | ||||||||||||||
| Net (income) loss attributable to noncontrolling interests |
(5 | ) | (6 | ) | (8) | 16.7 | 37.5 | |||||||||||||
| Net income (loss) attributable to U.S. Bancorp |
$540 | $(25 | ) | $(98) | nm | nm | ||||||||||||||
| Average Balance Sheet Data |
||||||||||||||||||||
| Loans |
$3,867 | $3,625 | $3,275 | 6.7 | 18.1 | |||||||||||||||
| Other earning assets |
188,927 | 181,725 | 140,256 | 4.0 | 34.7 | |||||||||||||||
| Goodwill |
-- | -- | -- | -- | -- | |||||||||||||||
| Other intangible assets |
-- | -- | -- | -- | -- | |||||||||||||||
| Assets |
215,414 | 208,675 | 165,378 | 3.2 | 30.3 | |||||||||||||||
| Noninterest-bearing deposits |
2,605 | 2,101 | 2,203 | 24.0 | 18.2 | |||||||||||||||
| Interest-bearing deposits |
1,625 | 1,152 | 5,331 | 41.1 | (69.5 | ) | ||||||||||||||
| Total deposits |
4,230 | 3,253 | 7,534 | 30.0 | (43.9 | ) | ||||||||||||||
| Total U.S. Bancorp shareholders’ equity |
16,088 | 15,266 | 13,352 | 5.4 | 20.5 | |||||||||||||||
| (a) preliminary data
|
||||||||||||||||||||
Treasury and Corporate Support includes the Company’s investment portfolios, funding, capital management, interest rate risk management, income taxes not allocated to the business lines, including most investments in tax-advantaged projects, and the residual aggregate of those expenses associated with corporate activities that are managed on a consolidated basis.
Treasury and Corporate Support contributed $540 million of the Company’s net income in the first quarter of 2021, compared with a net loss of $98 million in the first quarter of 2020. Total net revenue decreased $30 million (13.4 percent) year-over-year due to decrease of $21 million in net interest income and a decrease in noninterest income of $9 million (3.8 percent). Net interest income decreased primarily due to higher premium amortization and lower reinvestment yields within the investment portfolio compared with a year ago. Total noninterest income decreased primarily due to lower other noninterest income driven by lower gains on sales of businesses and tax-advantaged investment syndication revenue, mostly offset by the impact of favorable market conditions. Total noninterest expense increased $14 million (4.8 percent) primarily due to higher compensation expense as a result of merit, performance-based incentives and stock-based compensation as well as related payroll taxes and benefits, mostly offset by lower COVID-19 related accruals compared with the first quarter of 2020 including recognizing liabilities related to future delivery exposures for merchant and airline processing and lower net shared services expense. The provision for credit losses decreased $870 million reflecting the residual impact of changes in the allowance for credit losses being impacted by improving economic conditions. Income taxes are assessed to each line of business at a managerial tax rate of 25.0 percent with the residual tax expense or benefit to arrive at the consolidated effective tax rate included in Treasury and Corporate Support.
7