Exhibit
96.1
S-K
1300 Technical Report Summary
iNITIAL
aSSESSMENT
for
THE
Whistler Project
South
Central Alaska
Centred
at 6,872,000 N and 520,000 E (NAD 83)
| |
|
Submitted
to: |
| |
|
U.S.
GoldMining Inc. |
| |
|
1830-1030
West Georgia St. |
| |
|
Vancouver,
B.C. V6E 2Y3, Canada |
| |
|
Tel:
604.630.1000 |
| |
|
|
| |
|
|
| |
|
Effective
Date: 12 September 2024 |
| |
|
Date
of Issue: 7 October 2024 |
| |
|
|
| |
|
|
| |
|
|
| |
|
Submitted
by: |
| |
|
Moose
Mountain Technical Services |
| |
|
#210
1510-2nd St. North |
| |
|
Cranbrook,
B.C. V1C 3L2, Canada |
| |
|
Tel:
250.489.1212 |
| |
|
|
| |
|
Author: |
| |
|
Sue
Bird, P. Eng. |
| |
|
Email:
[email protected] |
| Effective Date: September 12, 2024 | Page 1 of 181 |
| | S-K 1300 Technical Summary Report – Whistler Project, Alaska |
TABLE
OF CONTENTS
| 1 |
EXECUTIVE
SUMMARY |
11 |
| |
1.1 |
Introduction |
11 |
| |
1.2 |
Mineral
Resource Estimate |
11 |
| |
1.3 |
Terms
of Reference |
13 |
| |
1.4 |
Property
Description |
13 |
| |
1.5 |
Mineral
Tenure |
13 |
| |
|
1.5.1 |
Royalties
and Encumbrances |
13 |
| |
1.6 |
Surface
Rights |
14 |
| |
1.7 |
Accessibility,
Climate, Local Resources, Infrastructure and Physiography |
14 |
| |
|
1.7.1 |
Accessibility
and Climate |
14 |
| |
|
1.7.2 |
Local
Resources and Infrastructure |
14 |
| |
|
1.7.3 |
Physiography |
14 |
| |
1.8 |
Geologic
Setting and Mineralization |
14 |
| |
1.9 |
Exploration |
15 |
| |
1.10 |
Drilling |
16 |
| |
1.11 |
Conclusions
and Recommendations |
16 |
| |
|
1.11.1 |
Sampling,
Preparation, Analysis Conclusions |
16 |
| |
|
1.11.2 |
Metallurgical
Testwork Conclusions |
16 |
| |
|
1.11.3 |
Resource
Estimate Conclusions |
16 |
| |
|
1.11.4 |
Sampling,
Preparation, Analysis Recommendations |
16 |
| |
|
1.11.5 |
Metallurgical
Recommendations |
16 |
| |
|
1.11.6 |
Resource
and Exploration Recommendations |
16 |
| 2 |
INTRODUCTION |
17 |
| |
2.1 |
Terms
of Reference |
17 |
| |
2.2 |
Qualified
Persons |
17 |
| |
2.3 |
Site
visits and Scope of Personal Inspection |
17 |
| |
2.4 |
Effective
Date |
17 |
| |
2.5 |
Sources
of Information |
17 |
| 3 |
PROPERTY
DESCRIPTION |
18 |
| |
3.1 |
Royalties
and Encumbrances |
19 |
| 4 |
ACCESSIBILITY,
CLIMATE, LOCAL RESOURCES, INFRASTRUCTURE AND PHYSIOGRAPHY |
21 |
| |
4.1 |
Accessibility |
21 |
| |
4.2 |
Climate |
22 |
| |
4.3 |
Local
Resources |
22 |
| |
4.4 |
Infrastructure |
22 |
| |
4.5 |
Physiography |
25 |
| 5 |
HISTORY |
27 |
| 6 |
GEOLOGICAL
SETTING, MINERALIZATION and DEPOSIT |
29 |
| |
6.1 |
Geological
Setting |
29 |
| |
|
6.1.1 |
Whistler
Corridor |
35 |
| |
|
6.1.2 |
Island
Mountain |
37 |
| |
|
6.1.3 |
Muddy
Creek |
39 |
| Effective Date: September 12, 2024 | Page 2 of 181 |
| | S-K 1300 Technical Summary Report – Whistler Project, Alaska |
| |
6.2 |
Mineralization |
41 |
| |
|
6.2.1 |
Whistler
Area and Whistler Deposit Mineralization Overview |
42 |
| |
|
6.2.2 |
Mineralization:
Whistler Deposit |
48 |
| |
|
6.2.3 |
Mineralization:
Raintree West |
51 |
| |
|
6.2.4 |
Mineralization:
Island Mountain |
53 |
| |
|
6.2.5 |
Mineralization:
Muddy Creek |
56 |
| |
6.3 |
Deposit
Types |
57 |
| 7 |
EXPLORATION |
58 |
| |
7.1 |
Geological
Mapping |
58 |
| |
7.2 |
Airborne
Geophysics |
58 |
| |
7.3 |
Ground
Geophysics |
59 |
| |
7.4 |
Soil
and Rock Sampling |
62 |
| |
7.5 |
Drilling |
64 |
| |
7.6 |
Drilling
by Cominco Alaska Inc. |
67 |
| |
7.7 |
Drilling
by Kennecott |
68 |
| |
7.8 |
Drilling
by Geoinformatics |
68 |
| |
7.9 |
Drilling
by Kiska |
68 |
| |
|
7.9.1 |
Whistler
Deposit |
69 |
| |
|
7.9.2 |
Raintree
Deposit |
69 |
| |
|
7.9.3 |
Whistler
Area Exploration Drilling |
69 |
| |
|
7.9.4 |
Island
Mountain Drilling |
71 |
| |
7.10 |
Drilling
by U.S. GoldMining Inc. |
71 |
| |
|
7.10.1 |
Whistler
Area Exploration Drilling |
71 |
| 8 |
SAMPLE
PREPARATION, ANALYSES, AND SECURITY |
74 |
| |
8.1 |
Sample
Preparation and Analyses |
74 |
| |
|
8.1.1 |
Sample
Preparation and Analysis -Cominco |
74 |
| |
|
8.1.2 |
Sample
Preparation and Analysis – Kennecott and Geoinformatics |
74 |
| |
|
8.1.3 |
Sample
Preparation and Analysis – Kiska |
75 |
| |
|
8.1.4 |
Sample
Preparation and Analysis – US GoldMining |
76 |
| |
8.2 |
Security
and Chain of Custody |
76 |
| |
8.3 |
QAQC
Summary |
78 |
| |
|
8.3.1 |
QAQC
Whistler Deposit |
81 |
| |
|
8.3.2 |
QAQC
Raintree Deposit |
93 |
| |
|
8.3.3 |
QAQC
Island Mountain Deposit |
101 |
| |
8.4 |
Sample
Preparation, Analyses and Security Conclusions and Recommendations |
108 |
| 9 |
DATA
VERIFICATION |
109 |
| |
9.1 |
Site
Visit |
109 |
| |
9.2 |
Re-Assay
Results |
111 |
| |
9.3 |
Data
Audit |
113 |
| |
|
9.3.1 |
Certificate
Checks and Database Corrections |
113 |
| |
|
9.3.2 |
Check
assays |
114 |
| |
9.4 |
Collar
Survey |
114 |
| |
9.5 |
Data
Verification Conclusions and Recommendations |
114 |
| |
9.6 |
Statement
on Adequacy of Data |
114 |
| Effective Date: September 12, 2024 | Page 3 of 181 |
| | S-K 1300 Technical Summary Report – Whistler Project, Alaska |
| 10 |
MINERAL
PROCESSING AND METALLURGICAL TESTING |
115 |
| |
10.1 |
Summary
of Preliminary Metallurgical Testing, Whistler Deposit (Phase One) |
115 |
| |
|
10.1.1 |
Sample
Preparation |
115 |
| |
10.2 |
Testing |
116 |
| |
|
10.2.1 |
Results
from Preliminary Testing |
116 |
| |
|
10.2.2 |
Preliminary
Conclusions |
117 |
| |
10.3 |
Summary
of Preliminary Metallurgical Testing, Island Mountain Deposit (August 21, 2010) (Phase 2) |
118 |
| |
|
10.3.1 |
Introduction |
118 |
| |
|
10.3.2 |
Sample
Selection |
118 |
| |
|
10.3.3 |
Feed
Grade |
119 |
| |
|
10.3.4 |
Test
Program |
119 |
| |
|
10.3.5 |
Metallurgical
Results |
120 |
| |
|
10.3.6 |
Whole
Ore Leach |
120 |
| |
|
10.3.7 |
Leaching
of Selective Flotation Tails |
121 |
| |
|
10.3.8 |
Overall
Recoveries |
121 |
| |
|
10.3.9 |
Conclusions |
121 |
| |
10.4 |
Summary
of Whistler Deposit Testwork (2012) (Phase 3) |
122 |
| |
|
10.4.1 |
Metallurgical
Samples |
122 |
| |
|
10.4.2 |
Results |
123 |
| |
10.5 |
Cyanidation |
128 |
| |
10.6 |
Concentrate
Specifications |
128 |
| |
10.7 |
Conclusions |
129 |
| |
10.8 |
Overall
Metallurgical Observations and Comments for 2024 Resource Estimate |
129 |
| 11 |
MINERAL
RESOURCE ESTIMATES |
131 |
| |
11.1 |
Mineral
Resource Estimate |
131 |
| |
11.2 |
Key
Assumptions and Data used in the Estimate |
135 |
| |
11.3 |
Geologic
Modelling |
136 |
| |
11.4 |
Compositing |
144 |
| |
11.5 |
Variography |
144 |
| |
11.6 |
Block
Model Interpolations |
150 |
| |
11.7 |
Classification |
152 |
| |
11.8 |
Block
Model Validation |
152 |
| |
|
11.8.1 |
Comparison
of Tonnage and Grades |
152 |
| |
11.9 |
Visual
Validation |
155 |
| |
11.10 |
Reasonable
Prospects of Eventual Economic Extraction |
161 |
| |
11.11 |
Statement
on Prospect of Economic Extraction |
162 |
| |
11.12 |
Factors
That May Affect the Mineral Resource Estimate |
163 |
| |
11.13 |
Risk
Assessment |
163 |
| 12 |
MINERAL
RESERVE ESTIMATES |
164 |
| 13 |
MINING
METHODS |
164 |
| 14 |
PROCESS
AND RECOVERY METHODS |
164 |
| 15 |
INFRASTRUCTURE |
164 |
| 16 |
MARKET
STUDIES |
164 |
| 17 |
ENVIRONMENTAL
STUDIES, PERMITTING AND PLANS, NEGOTIATIONS, OR AREEMENTS WITH LOCAL INDIVIDUALS OR GROUPS |
165 |
| 18 |
CAPITAL
AND OPERATING COSTS |
166 |
| 19 |
ECONOMIC
ANALYSIS |
166 |
| 20 |
ADJACENT
PROPERTIES |
166 |
| 21 |
OTHER
RELEVANT DATA AND INFORMATION |
166 |
| Effective Date: September 12, 2024 | Page 4 of 181 |
| | S-K 1300 Technical Summary Report – Whistler Project, Alaska |
| 22 |
INTERPRETATION
AND CONCLUSIONS |
167 |
| |
22.1 |
Sampling,
Preparation, Analysis |
167 |
| |
22.2 |
Data
Verification |
167 |
| |
22.3 |
Metallurgical
Testwork |
167 |
| |
22.4 |
Resource
Estimate |
167 |
| |
22.5 |
Risks
and Opportunities |
167 |
| |
|
22.5.1 |
Sampling,
Preparation, Analysis and Data Risks and Opportunities |
167 |
| |
|
22.5.2 |
Metallurgical
Testwork Risks and Opportunities |
167 |
| |
|
22.5.3 |
Resource
Estimate Risks and Opportunities |
167 |
| 23 |
RECOMMENDATIONS |
168 |
| |
23.1 |
Sample
Preparation, Analyses and Security |
168 |
| |
23.2 |
Data
Verification |
168 |
| |
23.3 |
Metallurgy |
168 |
| |
23.4 |
Exploration
and Resource |
168 |
| |
|
23.4.1 |
Whistler |
168 |
| |
|
23.4.2 |
Raintree |
168 |
| |
|
23.4.3 |
Island
Mountain |
168 |
| |
|
23.4.4 |
Exploration
Program and Budget |
168 |
| |
|
23.4.5 |
Initial
Mining Assessment / Preliminary Economic Assessment (PEA) |
168 |
| 24 |
REFERENCES |
170 |
| 25 |
RELIANCE
ON INFORMATION PROVIDED BY THE REGISTRANT |
172 |
| |
25.1 |
Mineral
Tenure and Surface Rights |
172 |
| |
25.2 |
Royalties
and Incumbrances |
172 |
| 26 |
DATE
AND SIGNATURE PAGE |
173 |
| APPENDIX
A: CLAIMS LIST |
175 |
| Effective Date: September 12, 2024 | Page 5 of 181 |
| | S-K 1300 Technical Summary Report – Whistler Project, Alaska |
LIST
OF TABLES
| Table
1-1 |
Mineral
Resource Estimate for the Total Whistler Project (Effective date: September 12, 2024) |
12 |
| Table
7-1 |
Summary
of Exploration on the Whistler Project |
58 |
| Table
7-2 |
Summary
of Diamond Drilling on the Whistler Project |
64 |
| Table
7-3 |
Examples
of Significant Drill Results North of the Island Mountain Deposit |
73 |
| Table
8-1 |
QAQC
Sample Summary (All Areas and Years) |
79 |
| Table
8-2 |
2004-2023
Assay Laboratories and assay methods for Au and Cu |
80 |
| Table
8-3 |
Blank
Material Details 2004-2023 |
80 |
| Table
8-4 |
CRM
Detail 2004-2023 |
81 |
| Table
8-5 |
Summary
of Gold Assays of Blanks, Whistler Deposit |
82 |
| Table
8-6 |
Whistler
Deposit CRM Summary, Gold |
84 |
| Table
8-7 |
Whistler
Deposit CRM Summary, Copper |
85 |
| Table
8-8 |
Whistler
Field Duplicates Simple Statistics |
87 |
| Table
8-9 |
Summary
of Gold Assays of Blanks, Raintree Deposit |
93 |
| Table
8-10 |
Raintree
Deposit CRM Summary, Gold |
96 |
| Table
8-11 |
Raintree
Deposit CRM Summary, Copper |
97 |
| Table
8-12 |
Raintree
Field Duplicates - Simple Statistics |
99 |
| Table
8-13 |
Summary
of Gold Assays of Blanks, Island Mountain Deposit |
101 |
| Table
8-14 |
Island
Mountain Deposit CRM Summary, Gold |
103 |
| Table
8-15 |
Island
Mountain Deposit CRM Summary, Copper |
104 |
| Table
8-16 |
Island
Mountain Field Duplicate Simple Statistics |
106 |
| Table
9-1 |
Certificate
Check Results |
113 |
| Table
9-2 |
Summary
of Data Supported by Certificate and QAQC |
114 |
| Table
10-1 |
Three
Stage Cleaning Tests |
117 |
| Table
10-2 |
Summary
of Analysis of Composites from IM09-001 and IM09-002 |
119 |
| Table
10-3 |
Bulk
Flotation Results |
120 |
| Table
10-4 |
Selective
Cleaner Flotation |
120 |
| Table
10-5 |
Whole
Ore Cyanidation |
121 |
| Table
10-6 |
Cyanidation
of Selective Flotation Tailings |
121 |
| Table
10-7 |
Sample
Head Grades |
122 |
| Table
10-8 |
Minor
Element Data |
129 |
| Effective Date: September 12, 2024 | Page 6 of 181 |
| | S-K 1300 Technical Summary Report – Whistler Project, Alaska |
| Table
11-1 |
Mineral
Resource Estimate for the Total Whistler Project (Effective date: September 12, 2024) |
132 |
| Table
11-2 |
Mineral
Resource Estimate and Sensitivity – Whistler Deposit |
133 |
| Table
11-3 |
Mineral
Resource Estimate and Sensitivity – Raintree Deposit |
133 |
| Table
11-4 |
Mineral
Resource Estimate and Sensitivity – Island Mountain Deposit |
134 |
| Table
11-5 |
Whistler
Deposit MRE Conceptual Phased Pit Shells at a US$10/tonne NSR Cutoff |
134 |
| Table
11-6 |
Summary
of Whistler Project Drillhole Data within Block Models |
136 |
| Table
11-7 |
Summary
of Capping and Outlier Restriction Values |
142 |
| Table
11-8 |
Capped
Assay and Composite Statistics by Domain - Au |
142 |
| Table
11-9 |
Capped
Assay and Composite Statistics by Domain - Cu |
143 |
| Table
11-10 |
Capped
Assay and Composite Statistics by Domain – Ag |
143 |
| Table
11-11 |
Variogram
Parameters - Whistler |
144 |
| Table
11-12 |
Variogram
Parameters - Raintree |
145 |
| Table
11-13 |
Variogram
Parameters – Island Mountain |
145 |
| Table
11-14 |
Block
Model Limits |
150 |
| Table
11-15 |
Search
Rotation and Distances – Whistler |
150 |
| Table
11-16 |
Search
Rotation and Distances – Raintree |
151 |
| Table
11-17 |
Search
Rotation and Distances – Island Mountain |
151 |
| Table
11-18 |
Additional
Search Criteria |
152 |
| Table
11-19 |
Classification
Criteria |
152 |
| Table
11-20 |
Comparison
of De-clustered Composite and OK Modelled Grades for Cu |
153 |
| Table
11-21 |
Comparison
of De-clustered Composite and OK Modelled Grades for Au |
153 |
| Table
11-22 |
Economic
Inputs and Metallurgical Recoveries |
162 |
| Table
11-23 |
List
of Risks and Mitigations/Justifications |
163 |
| Table
23-1 |
Proposed
Exploration Budget |
169 |
| Effective Date: September 12, 2024 | Page 7 of 181 |
| | S-K 1300 Technical Summary Report – Whistler Project, Alaska |
LIST
OF Figure S
| Figure
3-1 |
Location
of the Whistler Project |
18 |
| Figure
3-2 |
Tenement
Map |
20 |
| Figure
4-1 |
Layout
of Built and Proposed (and permitted) infrastructure in the Whistler Area |
21 |
| Figure
4-2 |
Layout
of the U.S. GoldMining Camp and Facilities located adjacent to Whisky Bravo Airstrip |
23 |
| Figure
4-3 |
Drone
aerial image looking northeast overlooking Whistler Camp adjacent the Skwentna River |
24 |
| Figure
4-4 |
Layout
of the Whiskey-Bravo Airstrip relative to Whistler Camp |
25 |
| Figure
4-5 |
Drone
aerial photo looking southwest over the Whistler deposit with the Skwentna River valley on the left side of the photo |
26 |
| Figure
6-1 |
Regional
Geological Map of South-central Alaska |
30 |
| Figure
6-2 |
Regional
Geology of the Whistler Project |
32 |
| Figure
6-3 |
Stratigraphic
column of the Whistler District and Property Geology |
33 |
| Figure
6-4 |
Geological
Map of the Whistler Corridor, Island Mountain, and Muddy Creek |
34 |
| Figure
6-5 |
Whistler
Project Geology |
35 |
| Figure
6-6 |
Property
Geology of the Island Mountain Area |
38 |
| Figure
6-7 |
Geological
Map of Muddy Creek |
40 |
| Figure
6-8 |
Prospect
Areas |
41 |
| Figure
6-9 |
Photo
of irregular M-veins in dark magnetite alteration of mafics (upper) and pervasive pink-black blotchy k-feldspar and magnetite alteration
(lower) with wormy quartz + magnetite + chalcopyrite A-veins (Whistler Deposit) |
43 |
| Figure
6-10 |
Photo
of a classic B-style quartz vein with a chalcopyrite-filled centreline cutting an irregular,
wormy A-style quartz vein (Whistler Deposit, WH 08-08, ~123.0
m) |
44 |
| Figure
6-11 |
Photo
or chlorite-sericite (+calcite) alteration overprinting potassic – magnetite alteration in a zone of quartz vein stockwork,
subsequently cut by later Dpy veinlets with sericitic and iron-carbonate halos (Whistler Deposit) |
45 |
| Figure
6-12 |
D-style
pyrite veins with well-developed phyllic halos (Whistler Deposit), that cut and off-set B-style quartz veins (lower sample). Also
note the local occurrence of hematite at the intersection of both vein types (magnetite>hematite?) |
46 |
| Figure
6-13 |
Photo
of quartz-carbonate vein from Raintree West (WH11-030) showing well-developed colliform banding and coarse-grained sphalerite and
galena (Source: MMTS, 2015) |
47 |
| Figure
6-14 |
Common
vein paragenesis in all porphyry occurrences in Whistler Area: dark grey quartz vein stockwork with chalcopyrite (A- and B-style),
cut by quartz-calcite-carbonate-sphalerite-galena veinlet (Dbm veins, top left down to bottom right), cut by narrow Fe-carbonate
veinlets with Fe-carbonate alteration halos (Raintree West example) |
47 |
| Figure
6-15 |
Geological
Map of the Whistler Deposit |
48 |
| Figure
6-16 |
Geological
Cross-section – looking WNW of the Whistler Deposit |
49 |
| Figure
6-17 |
Plan
Map of the Raintree West on a Background of greyscale airborne magnetic data, (magnetic high anomalies shown as lighter shades of
grey) |
52 |
| Figure
6-18 |
Photo
of monzonite-matrix intrusive breccia with patchy albite alteration, silicification and disseminated chalcopyrite |
53 |
| Figure
6-19 |
Photos
of various textures of actinolite-magnetite hydrothermal breccia (BXMA), showing strong albitization in monomict breccia (upper),
pyrrhotite matrix in polymict breccia (lower) |
54 |
| Effective Date: September 12, 2024 | Page 8 of 181 |
| | S-K 1300 Technical Summary Report – Whistler Project, Alaska |
| Figure
6-20 |
Schematic
Model of Breccia Zone Alteration and Mineralization |
55 |
| Figure
6-21 |
Detail
view of Biotite Monzonite Northwest of Muddy Creek, cut by sub-vertical limonite-stained
fracture fillings of chalcopyrite-arsenopyrite (~1-3
per metre) |
56 |
| Figure
7-1 |
Depth
slices (100m) of the chargeability (top) and resistivity (bottom) inversion model of the 3D IP data in the Whistler Area (with contours
of the 400m line spacing AMAG RTP). WD, Whistler Deposit; RTW, Raintree West; RTN, Raintree North; RTS, Raintree South, DGW, Dagwood;
RMK, Rainmaker |
61 |
| Figure
7-2 |
From
the Whistler Area looking North to the Snow Ridge Area |
63 |
| Figure
7-3 |
From
the Whistler Area looking South to the Rainmaker Area |
63 |
| Figure
7-4 |
Plan
View of Drillholes by Year/Owner – Whistler |
65 |
| Figure
7-5 |
Plan
View of Drillholes by Year/Owner – Raintree |
66 |
| Figure
7-6 |
Plan
View of Drillholes by Year/Owner – Island Mountain |
67 |
| Figure
7-7 |
Whistler
Area Drilling |
70 |
| Figure
7-8 |
Plan
Map of Drillholes and Mineralization Style at the Breccia Zone |
72 |
| Figure
8-1 |
Sample
Bags with Security Tags |
77 |
| Figure
8-2 |
Sample
Dispatch Form |
77 |
| Figure
8-3 |
U.S.
GoldMining Inc. Sample Dispatch Form |
78 |
| Figure
8-4 |
Sequential
Plot of Gold Assays of Blanks, Whistler Deposit |
82 |
| Figure
8-5 |
Sequential
Plot of Copper Assays of Blanks, Whistler Deposit |
83 |
| Figure
8-6 |
Whistler
Deposit Normalized Process Control Chart, Gold |
85 |
| Figure
8-7 |
Whistler
Deposit Normalized Process Control Chart, Copper |
86 |
| Figure
8-8 |
Whistler
Deposit Field Duplicate Scatter Plot, Gold |
87 |
| Figure
8-9 |
Whistler
Deposit Field Duplicate Scatter Plot, Copper |
88 |
| Figure
8-10 |
Whistler
Deposit Umpire Scatter Plot, Gold |
89 |
| Figure
8-11 |
Whistler
Deposit Umpire Scatter Plot, Copper |
90 |
| Figure
8-12 |
Whistler
Deposit ALS Re-Assay Scatter Plot, Copper |
91 |
| Figure
8-13 |
Whistler
Deposit Umpire Scatter Plot, Gold |
92 |
| Figure
8-14 |
Whistler
Deposit Umpire Scatter Plot, Copper |
93 |
| Figure
8-15 |
Sequential
Plot of Gold Assays of Blanks, Raintree Deposit |
94 |
| Figure
8-16 |
Sequential
Plot of Copper Assays of Blanks, Raintree Deposit |
95 |
| Figure
8-17 |
Raintree
Deposit Normalized Process Control Chart, Gold |
96 |
| Figure
8-18 |
Raintree
Deposit Normalized Process Control Chart, Copper |
97 |
| Figure
8-19 |
Process
Control Chart Raintree OREAS-50c, Copper |
98 |
| Figure
8-20 |
Process
Control Chart Raintree OREAS-54Pa, Copper |
99 |
| Figure
8-21 |
Raintree
Deposit Field Duplicate Scatter Plot, Gold |
100 |
| Figure
8-22 |
Raintree
Deposit Field Duplicate Scatter Plot, Copper |
101 |
| Figure
8-23 |
Sequential
Plot of Gold Assays of Blanks, Island Mountain Deposit |
102 |
| Figure
8-24 |
Sequential
Plot of Copper Assays of Blanks, Island Mountain Deposit |
102 |
| Figure
8-25 |
Island
Mountain Deposit Normalized Process Control Chart, Gold |
103 |
| Figure
8-26 |
Island
Mountain Deposit Normalized Process Control Chart |
105 |
| Figure
8-27 |
Process
Control Chart Island Mountain CRM OREAS-50c, Copper |
106 |
| Figure
8-28 |
Island
Mountain Deposit Field Duplicate Scatter Plot, Gold |
107 |
| Figure
8-29 |
Island
Mountain Deposit Field Duplicate Scatter Plot, Copper |
108 |
| Figure
9-1 |
Aerial
view of Whistler Camp |
109 |
| Figure
9-2 |
Drillcore
Boxes in Storage Area |
110 |
| Figure
9-3 |
Core
Logging Shed |
111 |
| Figure
9-4 |
Check
Assay Results from 2022 and 2024 Site Visits – Au |
112 |
| Effective Date: September 12, 2024 | Page 9 of 181 |
| | S-K 1300 Technical Summary Report – Whistler Project, Alaska |
| Figure
9-5 |
Check
Assay Results from 2022 and 2024 Site Visits – Cu |
112 |
| Figure
10-1 |
Flotation
and Cyanidation Flowsheet and Test Conditions Flotation |
124 |
| Figure
10-2 |
Flotation
Test Results |
126 |
| Figure
10-3 |
Copper
Grade Recovery |
127 |
| Figure
10-4 |
Gold
Grade Recovery |
127 |
| Figure
11-1 |
Whistler
Deposit Resource Pit and Conceptual Phases |
135 |
| Figure
11-2 |
Whistler
Deposit – Au-Ag high grade domain (red), Cu high grade domain (yellow) lower grade halo (blue) |
137 |
| Figure
11-3 |
Domains
Modeled for Raintree Deposit |
138 |
| Figure
11-4 |
Domains
Modelled for Island Mountain Capping |
138 |
| Figure
11-5 |
CPP
of Au Assay Data by Domain - Whistler |
139 |
| Figure
11-6 |
CPP
of Cu Assay Data by Domain – Whistler |
139 |
| Figure
11-7 |
CPP
of Au Assay Data by Domain – Raintree |
140 |
| Figure
11-8 |
CPP
of Cu Assay Data by Domain – Raintree |
140 |
| Figure
11-9 |
CPP
of Au Assay Data by Domain – Island Mountain |
141 |
| Figure
11-10 |
CPP
of Cu Assay Data by Domain – Island Mountain |
141 |
| Figure
11-11 |
Histogram
of Assay Lengths |
144 |
| Figure
11-12 |
Variogram
Model for Cu Lower Grade “Halo” – Major and Minor Axes – Whistler Deposit |
146 |
| Figure
11-13 |
Variogram
Model for Au in Domain 1 – Major and Minor Axes – Whistler Deposit |
147 |
| Figure
11-14 |
Variogram
Model for Cu in Domain 5 – Major and Minor Axes – Raintree Deposit |
148 |
| Figure
11-15 |
Variogram
Model for Au in Domains 1-6 – Major and Minor Axes – Island Mountain Deposit |
149 |
| Figure
11-16 |
Tonnage-Grade
Curves for Au – Comparison of Interpolation Methods – Whistler |
153 |
| Figure
11-17 |
Tonnage-Grade
Curves for Cu – Comparison of Interpolation Methods - Whistler |
154 |
| Figure
11-18 |
Tonnage-Grade
Curves for Au – Comparison of Interpolation Methods – Raintree |
154 |
| Figure
11-19 |
Tonnage-Grade
Curves for Cu – Comparison of Interpolation Methods - Raintree |
155 |
| Figure
11-20 |
Tonnage-Grade
Curves for Au – Comparison of Interpolation Methods – Island Mountain |
155 |
| Figure
11-21 |
Tonnage-Grade
Curves for Cu – Comparison of Interpolation Methods - Island Mountain |
155 |
| Figure
11-22 |
E-W
Section Comparing Au Grades for Block Model and Assay Data - Whistler |
156 |
| Figure
11-23 |
E-W
Section Comparing Cu Grades for Block Model and Assay Data - Whistler |
157 |
| Figure
11-24 |
Section
Looking SW - Comparing Au Grades for Block Model and Assay Data – Raintree |
158 |
| Figure
11-25 |
Section
Looking SW - Comparing Cu Grades for Block Model and Assay Data – Raintree |
159 |
| Figure
11-26 |
E-W
Section Comparing Cu Grades for Block Model and Assay Data – Island Mountain |
160 |
| Figure
11-27 |
E-W
Section Comparing Cu Grades for Block Model and Assay Data – Island Mountain |
161 |
| Effective Date: September 12, 2024 | Page 10 of 181 |
| | S-K 1300 Technical Summary Report – Whistler Project, Alaska |
Moose
Mountain Technical Services (MMTS) has prepared an updated Technical Report Summary (TRS, or Report) on the Mineral Resource Estimate
(MRE), for U.S. GoldMining Inc. (‘U.S. GoldMining’ or ‘USGO’), of the Whistler Project located in Alaska, U.S.A.
U.S. GoldMining is an indirect subsidiary of GoldMining Inc. and holds the rights to the Whistler gold-copper property located 150 km
northwest of Anchorage, Alaska. U.S. GoldMining is expected to be focused on the development and advancement of the Whistler Project.
U.S. GoldMining does not have any operating revenues and does not expect to have any operating revenues in the near future.
The
Whistler Project resource estimate is an update of the 2022 resource estimate which includes the Whistler, Raintree, and Island Mountain
deposits. The estimate contained herein is in support of the News Release issued by U.S. GoldMining Inc. (USGM), on October 7, 2024.
This
TRS provides an overview of the Whistler Project and includes recommendations for future work required to reach a decision point. It
discloses a Mineral Resource Estimate (MRE) including information about the geology, mineralization, metallurgy, exploration potential,
Mineral Resources, and recommendations for the Whistler Project.
| 1.2 |
Mineral
Resource Estimate |
The
Whistler Project total MRE includes the Whistler, Raintree and Island Mountain deposits and is summarized in Table 1-1 for the base case
cut-off grade. The resource is prepared under direction of Independent Qualified Persons (QPs) and in accordance with the United States
Securities and Exchange Commission (SEC) regulation S-K subpart 1300 (S-K 1300) for reporting mineral properties (CFR Title 17 §
229.1300-1305).
The
resource utilizes pit shells to constrain resources at the Whistler, Island Mountain, and Raintree West gold-copper deposits, as well
as an underground potentially mineable shape to constrain the mineral resource estimate for the deeper portion of the Raintree West deposit.
The current estimate uses metal prices of US$1,850/oz gold price, US$4.00/lb copper and US$23/oz silver, updated
recoveries, smelter terms and costs, as summarized in the notes to Table 1-1. Metal prices have been chosen based partially on market
consensus research by CIBC Capital Markets (CIBC, 2024) based on mean prices from 2024 and forecast up to 2027 for long term prices.
The metal prices chosen also considered the spot prices and the three-year trailing average prices. For all three metals, the final prices
used for this resource estimate are below both the spot metal price and the three-year trailing average, which is considered an industry
standard in choosing prices.
The
base case cut-off grade for open pit mining is $10.00/tonne for all three deposits, which more than covers the Processing + G&A costs
of US$7.90/tonne processed; this is the marginal cut-off for which mining costs are not included. Cut-off grades for underground mining
are based on Processing costs plus an additional US$17.10/tonne for underground bulk mining, to define the marginal cut-off NSR grade.
There has been drilling in 2023 and 2024 which resulted in updated geologic modelling, resource estimation parameters and an updated
resource estimate (using only 2023 drilling).
| Effective Date: September 12, 2024 | Page 11 of 181 |
| | S-K 1300 Technical Summary Report – Whistler Project, Alaska |
For
the mineral resource cut-off grade determination, a
3.0% NSR was assumed. This is derived from the sum of a 2.75% royalty to MF2 plus a 1% royalty to Gold Royalty Corp., with an assumption
that U.S. GoldMining can negotiate a buy back of a 0.75% NSR, for a net 3.0% NSR, as is customary to occur for similar project developments.
In preparing the resource estimate herein, a sensitivity analysis has also been conducted by the author. Based on such analysis, utilizing
a higher 3.75% NSR royalty rate in determining a cut-off grade would not materially impact the estimates contained herein and would be
de minimis (approx. 0.7% differential of total metal in the Whistler pit on a gold equivalent basis).
These
mineral resource estimates include inferred mineral resources that are considered too speculative geologically to have economic considerations
applied to them that would enable them to be categorized as mineral reserves. Mineral Resources that are not Mineral Reserves do not
have demonstrated economic viability.
The
QP is of the opinion that issues relating to all relevant technical and economic factors likely to influence the prospect of economic
extraction can be resolved with further work. These factors may include environmental permitting, infrastructure, sociopolitical, marketing,
or other relevant factors.
As
a point of reference, the in-situ gold, copper and silver mineralization are inventoried and reported by intended processing method.
| Table
1-1 |
Mineral
Resource Estimate for the Total Whistler Project (Effective date: September 12, 2024) |
| Class |
Deposit |
Cut-off
Value |
ROM
tonnage |
In
situ Grades |
In
situ Metal |
| (US$/t) |
(ktonnes) |
NSR
(US$/t) |
AuEqv
(gpt) |
Au
(gpt) |
Cu
(%) |
Ag
(gpt) |
AuEqv
(koz) |
Au
(koz) |
Cu
(mlbs) |
Ag
(koz) |
| Indicated |
Whistler |
10 |
282,205 |
22.84 |
0.68 |
0.41 |
0.16 |
1.89 |
6,201 |
3,724 |
999 |
17,166 |
| Raintree-Pit |
10 |
8,905 |
21.08 |
0.63 |
0.46 |
0.08 |
4.81 |
180 |
131 |
16 |
1,378 |
| Indicated
Open Pit |
varies |
291,410 |
22.79 |
0.68 |
0.41 |
0.16 |
1.98 |
6,381 |
3,855 |
1,015 |
18,544 |
| Raintree-UG |
25 |
3,064 |
34.41 |
1.03 |
0.79 |
0.13 |
4.49 |
101 |
78 |
9 |
443 |
| Total
Indicated |
varies |
294,474 |
22.91 |
0.68 |
0.42 |
0.16 |
2.01 |
6,482 |
3,933 |
1,024 |
18,987 |
| Inferred |
Whistler |
10 |
18,224 |
21.01 |
0.63 |
0.40 |
0.13 |
1.75 |
368 |
233 |
54 |
1,025 |
| Island
Mountain |
10 |
124,529 |
18.21 |
0.54 |
0.45 |
0.05 |
1.02 |
2,180 |
1,817 |
139 |
4,084 |
| Raintree-Pit |
10 |
15,056 |
23.12 |
0.69 |
0.55 |
0.06 |
4.36 |
335 |
267 |
21 |
2,112 |
| Inferred
Open Pit |
varies |
157,809 |
19.00 |
0.57 |
0.45 |
0.06 |
1.42 |
2,883 |
2,317 |
214 |
7,221 |
| Raintree-UG |
25 |
40,432 |
32.81 |
0.98 |
0.76 |
0.12 |
3.31 |
1,275 |
994 |
103 |
4,300 |
| Total
Inferred |
varies |
198,241 |
21.82 |
0.65 |
0.52 |
0.07 |
1.81 |
4,158 |
3,311 |
317 |
11,521 |
Notes
to Table 1:
| |
1.
|
Mineral
resources are not mineral reserves and do not have demonstrated economic viability. There is no certainty that all or any part of
the mineral resources will be converted into mineral reserves. |
| |
2.
|
The
Mineral Resource for the Whistler, Island Mountain, and the upper portions of the Raintree West deposits have been confined by an
open pit with “reasonable prospects of economic extraction” using the following assumptions: |
| |
|
|
| |
|
● |
Metal
prices of US$1,850/oz Au, US$4.00/lb Cu and US$23/oz Ag; |
| |
|
● |
Payable
metal of 95% payable for Au and Ag, and 96.5% payable for Cu |
| |
|
● |
Refining
costs for Au of US$8.00/oz, for Ag of US$0.60/oz and for Cu of US$0.05/lb; |
| |
|
● |
Offsite
costs for Au of US$77.50/wmt, for Ag of US$3.50/wmt and for Cu of US$55.00/wmt; |
| |
|
● |
Royalty
of 3% NSR; |
| |
|
● |
Pit
slopes are 50 degrees; |
| |
|
● |
Mining
cost of US$2.25/t for waste and mineralized material; and |
| |
|
● |
Processing,
general and administrative costs of US$7.90/t. |
| Effective Date: September 12, 2024 | Page 12 of 181 |
| | S-K 1300 Technical Summary Report – Whistler Project, Alaska |
| |
3.
|
The
lower portion of the Raintree West deposit has been constrained by a mineable shape with “reasonable prospects of eventual
economic extraction” using a US$25.00/t cut-off. |
| |
4.
|
Metallurgical
recoveries are: 70% for Au, 83% for Cu, and 65% Ag for Ag grades below 10g/t. The Ag recovery is 0% for values above 10g/t for all
deposits. |
| |
5.
|
The
NSR equations are: below 10g/t Ag: NSR (US$/t)=(100%-3%)*((Au*70%*US$54.646/t) + (Cu*83%*US$3.702*2204.62 + Ag*65%*US$0.664)), and
above 10g/t Ag: NSR (US$/t)=(100%-3%)*((Au*70%*US$56.646g/t) + (Cu*83%*US$3.702*2204.62)) ; |
| |
6.
|
The
Au Equivalent equations are: below 10g/t Ag: AuEq=Au + Cu*1.771 +0.0113Ag, and above 10g/t Ag: AuEq=Au + Cu*1.771 |
| |
7. |
The
specific gravity for each deposit and domain ranges from 2.76 to 2.91 for Island Mountain, 2.60 to 2.72 for Whistler with an average
value of 2.80 for Raintree West. |
| |
8.
|
Numbers
may not add due to rounding. |
The
TRS is being completed in connection with a News Release issued on October 7, 2024.
The
Whistler Project is a gold-copper exploration project located in the Yentna Mining District of Alaska, approximately 105 miles (170 km?
northwest of Anchorage.
The
Whistler Project comprises 377 State of Alaska mining claims covering an aggregate area of approximately 53,700 acres (217 km2).
The center of the property is located at 152.566° longitude west and 61.983° latitude north. The project is located in the drainage
of the Skwentna River. Elevation varies from about 400m above sea level in the valley floors to over 5,000 m in the highest peaks resulting
in quite a spectacular landscape. The Whiskey Bravo gravel airstrip established adjacent to the Skwentna River is compliant for wheel-based
aircraft up to DC-3s. A fifty-person camp is equipped with diesel generators, a satellite communication link, tent structures on wooden
floors and several wood-frame buildings. Although chiefly used for summer field programs, the camp is winterized.
Rights
to the Whistler Project were acquired by GoldMining, through its subsidiary U.S. GoldMining, formerly named BRI Alaska Corp., in August
2015 pursuant to an Asset Purchase Agreement (the “Asset Purchase”) with Kiska Metals Corporation (“Kiska”) in
exchange for the issuance of 3,500,000 common shares in the capital of GoldMining as disclosed by news releases of GoldMining on July
21 and August 6, 2015. The project is subject to three underlying agreements, which were assigned to U.S. GoldMining under the transaction.
| 1.5.1 |
Royalties
and Encumbrances |
The
first underlying agreement is a Royalty Purchase Agreement between Kiska Metals Corporation, Geoinformatics Alaska Exploration Inc. and
MF2 LLC. (“MF2”), dated December 16, 2014. This agreement grants MF2 a 2.75 percent NSR royalty over all 377 claims and extending
outside the current claims over an Area of Interest defined by the maximum historical extent of claims held on the project as indicated
on Figure 32. The MF2 royalty was subsequently assigned to Osisko Mining (USA) Inc. (“OM”). U.S. GoldMining can buy back
0.75 percent of the 2.75 percent NSR royalty for a payment of US$5,000,000 to OM. Pursuant to a subsequent assignment agreement dated
January 11, 2021, the buy-back right was conveyed to Gold Royalty U.S. Corp.
| Effective Date: September 12, 2024 | Page 13 of 181 |
| | S-K 1300 Technical Summary Report – Whistler Project, Alaska |
The
second underlying agreement is an earlier agreement between Cominco American Incorporated and Mr. Kent Turner (whose rights and obligations
thereunder were assumed by U.S. GoldMining) dated October 1, 1999. This agreement concerns a 2.0 percent net profit interest to Teck
Resources, recently purchased by Sandstorm Gold, in connection with an Area of Interest specified by standard township sub-division.
The
third underlying agreement is a royalty agreement dated January 11, 2021, between U.S. GoldMining and Gold Royalty U.S. Corp, pursuant
to which Gold Royalty U.S. Corp holds a 1% NSR royalty covering the Whistler Project.
Under
AS 38.05.255, the surface uses of land or water included within a state mining location that the owners, lessees, or operators of the
location may undertake by virtue of such location are (a) are limited to those necessary for the prospecting for, extraction of, or basic
processing of minerals and (b) shall be subject to reasonable concurrent uses (Stoel Rives, 2023).
| 1.7 |
Accessibility,
Climate, Local Resources, Infrastructure and Physiography |
| |
|
| 1.7.1 |
Accessibility
and Climate |
The
Whistler Project is in the Alaska Range approximately 105 miles (170 km) northwest of Anchorage and 47 miles (76km) west of the township
of Skwentna as illustrated in Figure 3-1. Access to the project area is by fixed wing aircraft to a gravel airstrip located adjacent
to the Whistler exploration camp. The project area is between regions of maritime and continental climate and is characterized by severe
winters and hot, dry summers. Annual precipitation ranges from 500 to 900 mm. Winter snow accumulation usually begins in October and
by mid to late May the snow has melted sufficiently to allow for fieldwork.
| 1.7.2 |
Local
Resources and Infrastructure |
The
nearest public infrastructure for the Whistler Project is the town of Petersville, located approximately 66 miles (106 km) east of Whistler;
Petersville is connected to Anchorage by an all-weather road and highway. The Whistler Project is supported by a 24 person, all season
camp located on the banks of the Skwentna River approximately 1.7 miles (2.7 km) from the Whistler Deposit and 14 miles (22km) from the
Island Mountain prospect. The camp is connected to the Whistler Deposit by a 4-mile (6km) access trail.
The
project is in the drainage of the Skwentna River that forms a large network of interconnected low-elevation U-shaped valleys cutting
through the rugged terrain of the southern Alaska Range. Elevation varies from about 400 m above sea level in the valley floors to over
5,000 m in the highest peaks resulting in a quite spectacular landscape.
| 1.8 |
Geologic
Setting and Mineralization |
Alaskan
geology consists of a collage of various terrains that were accreted to the western margin of North America because of complex plate
interactions through most of the Phanerozoic. The southernmost Pacific margin is underlain by the Chugach–Prince William composite
terrain, a Mesozoic-Cenozoic accretionary prism developed seaward from the Wrangellia composite terrain. It comprises arc batholiths
and associated volcanic rocks of Jurassic, Cretaceous, and early Tertiary age.
| Effective Date: September 12, 2024 | Page 14 of 181 |
| | S-K 1300 Technical Summary Report – Whistler Project, Alaska |
The
Alaska Range represents a long-lived continental arc characterized by multiple magmatic events ranging in age from about 70 million years
(“Ma”) to 30 Ma and associated with a wide range of base and precious metals hydrothermal sulphide bearing mineralization.
The geology of Whistler Project is characterized by a thick succession of Cretaceous to early Tertiary (ca. 97 to 65 Ma) volcano-sedimentary
rocks intruded by a diverse suite of plutonic rocks of Jurassic to mid-Tertiary age.
Two
main intrusive suites are important in the Whistler Project area:
| |
1) |
The
Whistler Igneous Suite comprises alkali-calcic basalt-andesite, diorite, and monzonite intrusive rocks approximately 76 Ma with restricted
extrusive equivalent. These intrusions are commonly associated with gold-copper porphyry-style mineralization (Whistler Deposit). |
| |
2) |
The
Composite Suite intrusions vary in composition from peridotite to granite and their ages span from 67 to about 64 Ma. Gold-copper
veinlets and pegmatitic occurrences are characteristics of the Composite plutons (e.g., the Mt. Estelle prospect, the Muddy Creek
prospect). |
The
Whistler Project was acquired for its potential to host magmatic hydrothermal gold and copper mineralization. Magmatic hydrothermal deposits
represent a wide clan of mineral deposits formed by the circulation of hydrothermal fluids into fractured rocks and associated with the
intrusion of magma into the crust. Exploration work completed by Kennecott, Geoinformatics, and Kiska has discovered several gold-copper
sulphide occurrences exhibiting characteristics indicative of magmatic hydrothermal processes and suggesting that the project area is
generally highly prospective for porphyry gold-copper deposits.
Kennecott
completed airborne helicopter geophysical surveys during 2003 and 2004. Results from these airborne surveys were used to interpret geological
contacts, fault structures and potential mineralization in the Whistler, Island Mountain, and Muddy Creek areas. In particular, the airborne
magnetic data showed that the Whistler Deposit displays a strong 900 m by 700 m positive magnetic anomaly attributed to the magnetic
Whistler Diorite intrusive complex (host to the Whistler Deposit) in addition to a contribution from secondary magnetite alteration and
veining associated with Au-Cu mineralization.
Cominco
acquired 8.4 line-km of 2D Induced Polarization geophysics with results used to target the deposit area with subsequent drilling. From
2004 to 2006, Kennecott completed 39.4 line-km of 2D IP geophysics in the Whistler area. Subsequent lines targeted magnetic anomalies
at the Round Mountain, Canyon Creek, Canyon Ridge, Canyon Mouth, Long Lake Hills, Raintree, and Rainmaker prospects. In 2007-2008, Geoinformatics
completed 8.8 line-km of 2D IP from six separate reconnaissance lines in the Whistler area targeting airborne magnetic highs. Anomalous
results from this survey in the Raintree area led to the Raintree West discovery. In 2009, Kiska completed 224 line-km of a 3D Induced
Polarization geophysical survey. This was executed on two grids (Round Mountain; Whistler Area). This survey reaffirmed that the Whistler
Deposit is coincident with a discrete 3D chargeability anomaly.
| Effective Date: September 12, 2024 | Page 15 of 181 |
| | S-K 1300 Technical Summary Report – Whistler Project, Alaska |
A
total of 72,755 m of diamond drilling in 261 holes are documented in the Whistler database for drilling on the Whistler Project by Cominco,
Kennecott, Geoinformatics, Kiska and U.S. GoldMining from 1986 to the end of 2023. Of these drillholes 22,608 m in 53 holes have been
drilled in the Whistler Deposit area, 5,190 m in 58 holes have been drilled in the Raintree area, and 15,572 m in 40 holes comprise the
Island Mountain resource area. There are 29,385 m in 110 holes in areas outside the three resource areas.
| 1.11 |
Conclusions
and Recommendations |
The
QPs make the following conclusions regarding sampling, analysis, metallurgical testwork and the resource estimate.
| 1.11.1 |
Sampling,
Preparation, Analysis Conclusions |
In
the opinion of the QP, sampling preparation, analysis, and security by previous operators are consistent with industry standard practices.
Review and analysis of the assay database and QAQC data shows the assay database is of sufficient quality for resource estimation.
| 1.11.2 |
Metallurgical
Testwork Conclusions |
The
recoveries used for Resource estimate are reasonable for this level of study based on the metallurgical testing to date.
| 1.11.3 |
Resource
Estimate Conclusions |
In
the opinion of the QP the block model resource estimate and resource classification reported herein are a reasonable representation of
the global gold, copper, and silver mineral resources found in the Whistler, Raintree West, and Island Mountain deposits. Mineral resources
are not mineral reserves and do not have demonstrated economic viability. There is no certainty that all or any part of the mineral resource
will be converted into mineral reserve.
The
QPs make the following recommendations regarding sampling, analysis, metallurgical testwork and the resource estimate.
| 1.11.4 |
Sampling,
Preparation, Analysis Recommendations |
| |
● |
QAQC
for silver was not available, data for blanks and duplicates should be collected from the database. Future drilling should include
CRMs for silver. |
| |
● |
Future
programs should ensure that QAQC sample failures are identified and affected samples are re-assayed. |
| |
● |
Survey
of 10% of collar locations be accomplished and all resurveyed as necessary. |
| |
● |
U.S.
GoldMining continues to amend the assay database with certificate numbers and locate missing certificates as necessary. |
| 1.11.5 |
Metallurgical
Recommendations |
| |
● |
Mineralogical
studies to better understand the gold associations |
| |
● |
Comminution
testing specifically to address SAG mill power requirements and design |
| |
● |
Variability
testing |
| |
● |
Confirmatory
locked cycle flotation testing at the coarser primary grind size |
| |
● |
Testwork
to include feed material containing Pb, Zn sulphide, and higher Ag grade material |
| 1.11.6 |
Resource
and Exploration Recommendations |
| |
● |
Further
step-out and infill drilling at Whistler, Raintree West and Island Mountain to upgrade the resource classification and to potentially
add new resources. |
| |
● |
Construction
of a geological model and mineral domains at Raintree West. |
| |
● |
Preliminary
metallurgical testwork for Raintree West. |
| |
● |
Additional
geological modelling and mineral domain definition at the Whistler Deposit to further determine potential lithological and structural
controls on mineralization, with potential updates to the resource estimate utilizing 2024 drilling data. |
| |
● |
The
collection of additional specific gravity measurements from existing drillholes at all deposits to augment the database. |
| |
● |
Top-of-bedrock
grid drilling in the Whistler area to define new targets. |
| |
● |
A
new and full review of all exploration data, with an outlook to review, and rank all targets for further exploration drilling. |
| |
● |
Additional
deep drilling to investigate the potential for the High-Grade Core, or other potential zones of high-grade mineralization, to extend
to depth. |
| Effective Date: September 12, 2024 | Page 16 of 181 |
| | S-K 1300 Technical Summary Report – Whistler Project, Alaska |
U.S.
GoldMining is an indirect subsidiary of GoldMining Inc. and holds the rights to the Whistler gold-copper property located 150 km northwest
of Anchorage, Alaska. U.S. GoldMining will be focused on the development and advancement of the Whistler Project.
Moose
Mountain Technical Services (MMTS) was retained by U.S. GoldMining to produce an updated resource estimate on the Whistler Project for
the Whistler, Raintree West, and Island Mountain deposits. MMTS was initially retained by GoldMining to conduct NI 43-101 technical reports
on the project in 2016 and 2021. The effective date for this TRS resource estimate is September 22, 2022. This report is an update to
the previously filed NI 43-101 report completed in 2016 for GoldMining (Giroux, 2016). This update was previously reported by GoldMining
in a NI 43-101 technical report issued by MMTS in 2021.
This
Report is the inaugural TRS developed for the Whistler Project in accordance with United States SEC S-K 1300 regulations. The TRS summarizes
a 2021 Mineral Resource Estimate (MRE) Technical Report that was completed under NI 43-101 guidelines for GoldMining. All technical analyses,
design information, capital, and operating cost information, permitting and legal assumptions, conclusions and recommendations are consistent
between this S-K 1300 TRS and the GoldMining 2021 NI 43-101 report.
The
purpose of this report is to support a proposed initial public offering of U.S. GoldMining Inc. and related disclosures on the Whistler
Project.
All
measurement units used in this Report are metric, and currency is expressed in US dollars unless stated otherwise.
The
following serve as the qualified person (QP) for this Technical Summary Report:
| |
● |
Sue
Bird, P.Eng., Moose Mountain Technical Services is responsible for all Sections of the report. |
| 2.3 |
Site
visits and Scope of Personal Inspection |
Sue
Bird, P.Eng., of MMTS, visited the Whistler Project site on September 14, 2022, and again on August 6, 2024. During the site visit collar
locations at Whistler and Raintree were validated. The core storage at both Whiskey Bravo camp and Rainy Pass core storage site visited.
The core from each deposit was examined for mineralization with 4 samples for re-assay obtained in 2022 with another 5-sample collected
in 2024. The buildings at the previous camp at Rainy Pass were also investigated with most of the buildings found to be in good shape
to be re-vamped for future drill programs.
The
overall Report effective date is September 12, 2024.
| 2.5 |
Sources
of Information |
Sources
of information are listed in the references, Section 24 of this report, with the sources provided by U.S. GoldMining and its parent,
GoldMining, regarding property ownership and environmental permitting listed in Section 25.
| Effective Date: September 12, 2024 | Page 17 of 181 |
| | S-K 1300 Technical Summary Report – Whistler Project, Alaska |
The
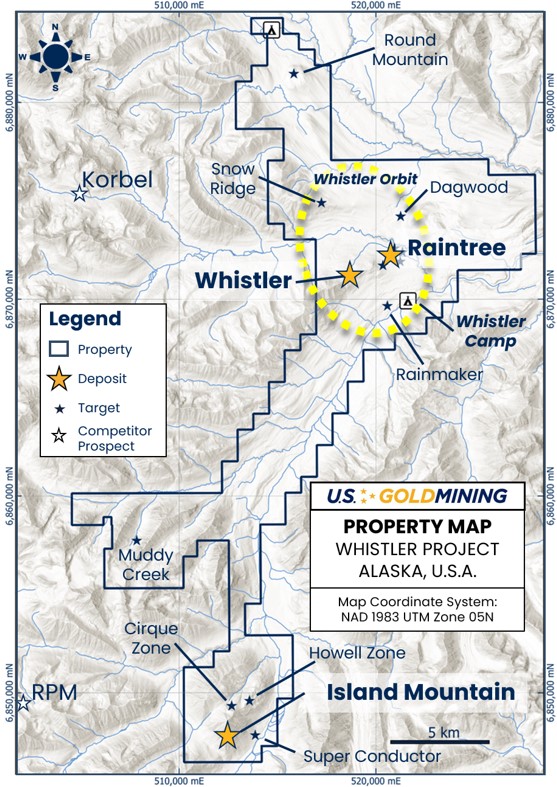
Whistler Project is in the Alaska Range approximately 105 miles (170 km) northwest of Anchorage as illustrated in Figure 3-1 below. The
centre of the property is located at 152.57 degrees longitude west and 61.98 degrees latitude north.
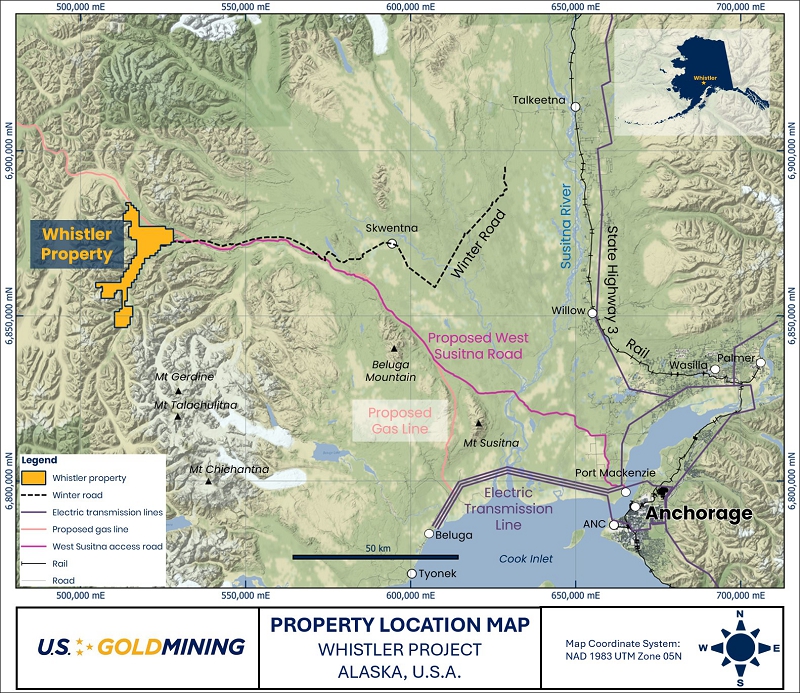
| Figure
3-1 |
Location
of the Whistler Project |
The
Whistler Project comprises 377 State of Alaska mining claims covering an aggregate area of approximately 53,700 acres (217 km2)
in the Yentna Mining District of Alaska. All the claims are owned 100% by U.S. GoldMining. The property boundaries have not been legally
surveyed.
An
all-season camp facility exists near the confluence of Portage Creek and the Skwentna River, approximately 15 km southeast of the Rainy
Pass Hunting Lodge. The camp is serviced with a 1,000 m gravel airstrip for wheel-based aircraft. The camp is equipped with diesel generators,
a satellite communication link, tent structures on wooden floors, and several wood-framed buildings.
| Effective Date: September 12, 2024 | Page 18 of 181 |
| | S-K 1300 Technical Summary Report – Whistler Project, Alaska |
GoldMining
Inc., through its subsidiary U.S. GoldMining (then known as BRI Alaska Corp.), acquired the rights to the project on August 5, 2015,
pursuant to an asset purchase agreement date August 5, 2015, between GoldMining, U.S. GoldMining, Kiska Metals Corporation and Geoinformatics
Alaska Exploration, Inc. in exchange for the issuance of 3,500,000 GoldMining shares as set out in Gold Mining’s news release of
August 6, 2015.
A
full Claims List can be found in Appendix A at the end of this report. Annual Labor requirements:
| |
● |
$400
for each quarter section MTRS claim |
| |
● |
$100
each for any other type of claim |
Labor
must be performed by September 1 of each year and the statement of annual labor must be recorded by November 30. Excess labor from previous
years may be carried forward.
| 3.1 |
Royalties
and Encumbrances |
The
first underlying agreement is a Royalty Purchase Agreement between Kiska Metals Corporation, Geoinformatics Alaska Exploration Inc. and
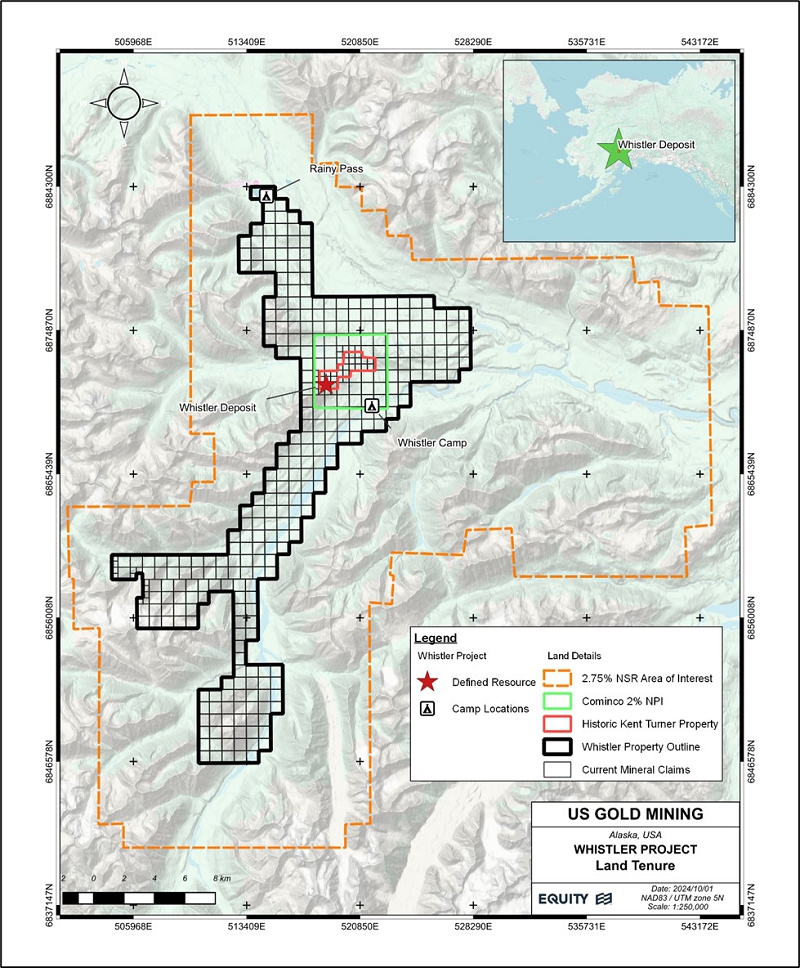
MF2 LLC. (“MF2”), dated December 16, 2014. This agreement grants MF2 a 2.75 percent NSR royalty over all 377 claims and extending
outside the current claims over an Area of Interest defined by the maximum historical extent of claims held on the project as indicated
on Figure 3-2. The MF2 royalty was subsequently assigned to Osisko Mining (USA) Inc. (“OM”). U.S. GoldMining can buy back
0.75 percent of the 2.75 percent NSR royalty for a payment of US$5,000,000 to OM. Pursuant to a subsequent assignment agreement dated
January 11, 2021, the buy-back right was conveyed to Gold Royalty U.S. Corp.
The
second underlying agreement is an earlier agreement between Cominco American Incorporated and Mr. Kent Turner (whose rights and obligations
thereunder were assumed by U.S. GoldMining) dated October 1, 1999. This agreement concerns a 2.0 percent net profit interest to Teck
Resources, recently purchased by Sandstorm Gold, in connection with an Area of Interest specified by standard township sub-division as
indicated in Figure 3-2.
The
third underlying agreement is a royalty agreement dated January 11, 2021, between U.S. GoldMining and Gold Royalty U.S. Corp, pursuant
to which Gold Royalty U.S. Corp holds a 1% NSR royalty covering the Whistler Project.
| Effective Date: September 12, 2024 | Page 19 of 181 |
| | S-K 1300 Technical Summary Report – Whistler Project, Alaska |
| Effective Date: September 12, 2024 | Page 20 of 181 |
| | S-K 1300 Technical Summary Report – Whistler Project, Alaska |
| 4 |
ACCESSIBILITY,
CLIMATE, LOCAL RESOURCES, INFRASTRUCTURE AND PHYSIOGRAPHY |
The
Whistler Project is located within the Alaska Range approximately 105 miles (170 km) northwest of Anchorage and 47 miles (76 km) west
of the township of Skwentna as illustrated in Figure 31. Access to the project area is by fixed wing aircraft to the Whiskey Bravo gravel
airstrip located adjacent to the Whistler exploration camp. In the winter of 2011, Kiska constructed a temporary winter trail to the
Whistler Project that was then used for the inbound transportation of fuel, earth moving equipment, and bulk items for the camp and exploration
programs. A 3,280 ft (1,000 m) compacted gravel runway, the Whisky Bravo Airstrip (Figure 4-1), provides a year-round accessibility to
the site. The airstrip is capable of landing up to DC-3 class aircraft and is currently shared with the Estelle Gold Project owned by
Nova Minerals Ltd.
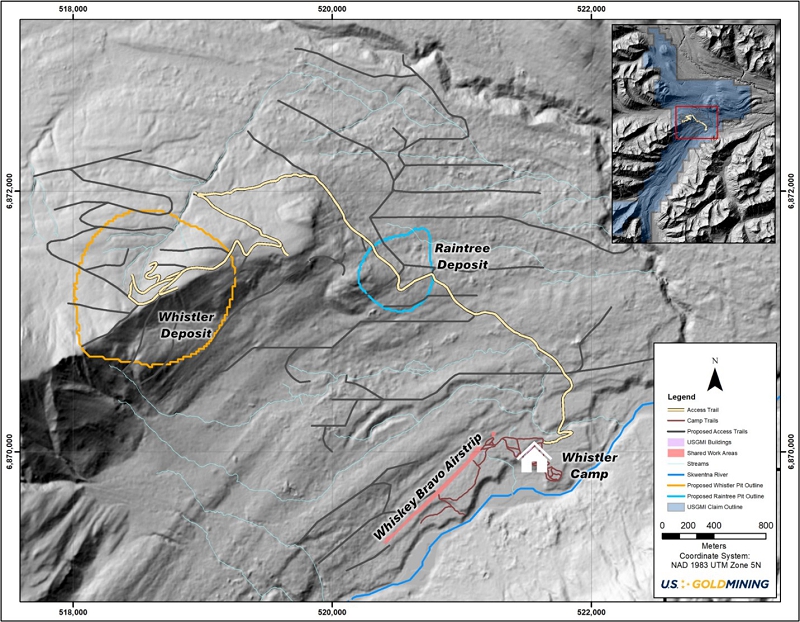
(Source:
U.S. GoldMining, 2024)
| Figure
4-1 |
Layout
of Built and Proposed (and permitted) infrastructure in the Whistler Area |
| Effective Date: September 12, 2024 | Page 21 of 181 |
| | S-K 1300 Technical Summary Report – Whistler Project, Alaska |
The
project area is between regions of maritime and continental climate and is characterized by relatively mild winters and warm summers.
The maritime climatic influence provides for dry, mild, and temperate summers. Fog and low clouds are common in mid-summer and fall especially
around higher elevation areas. Average summer temperatures range between 41° to 68° F (5° to 20° C), whereas winter temperatures
range from 5° to 23° F (-15° to -5° C). Occasionally, arctic cold fronts will propagate across the Alaska Range from
the interior, causing cold dry air to seep into the watershed. These infrequent stationary high-pressure systems can lead to clear days
with temperatures dropping to a low of -35° C during the winter. Moderate winds (>35 kts) persist during the winter months. Annual
precipitation ranges from 19.6 to 35.4 in (500 to 900 mm). Winter snow accumulation usually begins in October and by late May the snow
has melted sufficiently to allow for fieldwork.
The
nearest public infrastructure for the Whistler Project is the Petersville Bridge, located approximately 66 miles (106 km) east of Whistler.
Petersville is connected to Anchorage by an all-weather road and highway. The Whistler Project is also located approximately 75 miles
(120 km) north of the Beluga gas-powered electricity generation plant and 80 miles (128 km) north of the village of Tyonek on the Cook
Inlet coast.
The
Whistler Project is supported by a 24 person, all season camp located on the banks of the Skwentna River approximately 1.7 miles (2.7
km) in a straight line from the Whistler Deposit and connected to it via a 4 mile (6.4 km) long access trail, as illustrated in Figure
4-1. The camp is 13.6 miles (22 km) in a straight line from the Island Mountain prospect. The camp is located 0.25 miles (400 m) from
the northeast end of the Whisky Bravo Airstrip, connected via a gravel access trail.
The
Whistler Camp was originally built by Kiska Corp. in 2011, and in 2023 the camp was renovated by U.S. GoldMining to satisfy building
codes and all State safety, health and hygiene regulations. The camp is served by a 45-kW single phase generator with a 37-kW single
phase backup generator, water well, septic system, showers and flush toilets, and a modern kitchen and dining facility. The camp has
8 wood frame accommodations cabins, kitchen / dining hall, First Aid Tent, a wood frame water well/generator house and a wood frame men’s
and women’s shower/restroom building. The camp is currently permitted for 24 personnel, but with addition of extra accommodations
it could be expanded and permitted for up to 50 personnel.
Core
processing facilities consist of a well-insulated, well illuminated 22.9 ft by 45.9 ft (7 by 14 m) wood-frame building, and a core cutting
tent that houses a core saw. The core logging facility has a deck that is designed for ease of handling large volumes of core with skid
steer forklifts.
A
wood-frame workshop building serves mobile equipment and general camp equipment maintenance. The core cutting facilities and shop are
supplied electricity by a separate 20 kW and 2 kW kilowatt generators respectively.
Heavy
equipment and ground transport machines at the Whistler Project include one Cat D6N bulldozer; one Cat 226B track skid-steer; one Bobcat
S175 wheeled skid-steer; one Volvo A-30C haul truck; two Mahindra Roxor 4WD vehicles, and a fleet of smaller ground transportation vehicles
including snowmobiles; and side-by-side ATVs.
| Effective Date: September 12, 2024 | Page 22 of 181 |
| | S-K 1300 Technical Summary Report – Whistler Project, Alaska |
A
core storage area approximately 75 by 328 ft (23 by 10 m) has been cleared near the core shack. Additional clearings can be made for
more storage as the project grows. There are also two wooden-deck helicopter pads with a small building for helicopter support (Figure
4-2).
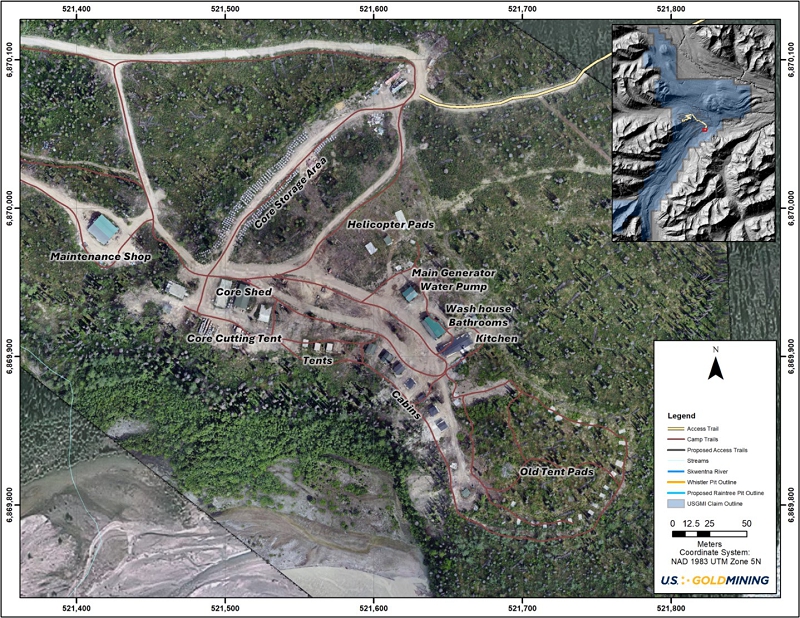
(Source:
U.S. goldmining Inc., 2024)
| Figure
4-2 |
Layout
of the U.S. GoldMining Camp and Facilities located adjacent to Whisky Bravo Airstrip |
The
Whisky Bravo Airstrip for the camp is illustrated in Figure 4-3. A 5,000-gallon (18, 927 litre) fuel storage facility, comprising ten
x 500-gallon tanks (1,892.7 litre), is located at the northeast end of the runway. All tanks are stored in lined containments. All pumping
is done through aircraft approved filter systems. A drillers lay-down areas is located adjacent the fuel storage facility for drilling
contractor equipment, parts and materials storage (Figure 4-3).
| Effective Date: September 12, 2024 | Page 23 of 181 |
| | S-K 1300 Technical Summary Report – Whistler Project, Alaska |
(Source:
U.S. GoldMining Inc, 2024)
| Figure
4-3 |
Drone
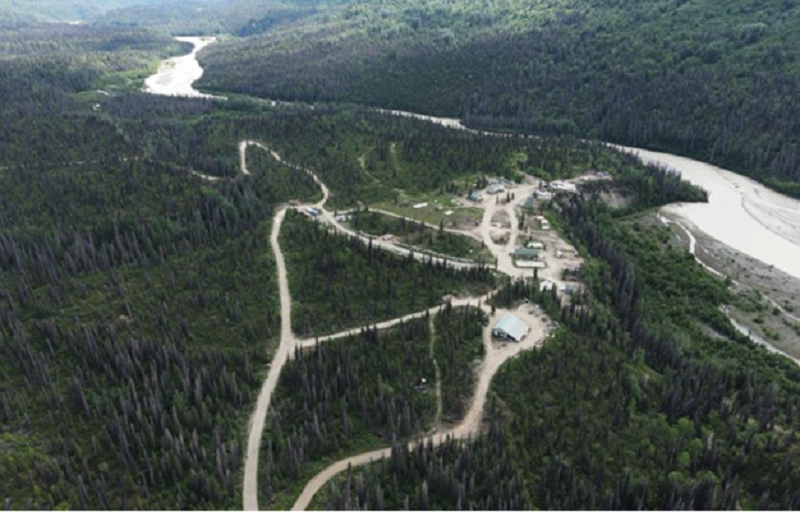
aerial image looking northeast overlooking Whistler Camp adjacent the Skwentna River |
Communications
is provided by Starlink TM satellite system, with routers providing wireless internet communications throughout camp. Cell
phone reception is weak at the top of the Whistler Ridge, and there is no cell coverage in camp. Operations communications is executed
via two-way handheld radios, with a repeater located at the top of Whistler Ridge to ensure adequate radio communications between camp
and the northern side of the ridge.
A
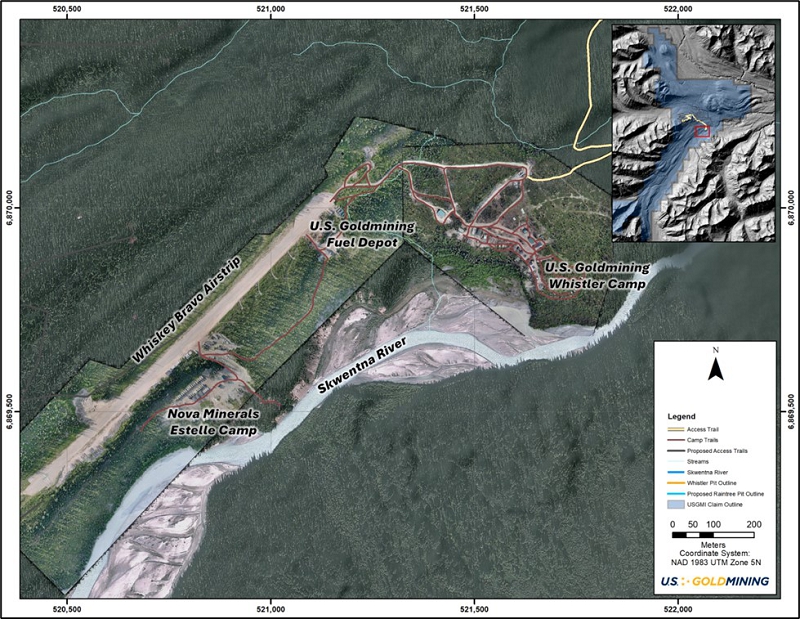
winter trail was blazed by previous operators Kiska Corp. and has been used in recent years by Nova Minerals Ltd. which owns the Estelle
Project west of U.S. GoldMining’s claims, and which also operates from a camp on the southern side of the Whisky Bravo Airstrip
(Figure 4-4). The winter road requires annual trail re-establishment, including building of ice bridges over creek and river crossings.
The cost of establishing the trail is such that it is only utilized for bulky and heavy equipment which cannot be flown, however for
general freight purposes the cost and reliability of air transportation which has year-round availability, is competitive.
| Effective Date: September 12, 2024 | Page 24 of 181 |
| | S-K 1300 Technical Summary Report – Whistler Project, Alaska |
| Figure
4-4 |
Layout
of the Whiskey-Bravo Airstrip relative to Whistler Camp |
Future
potential mining operations would require a year-round access road. On October 27, 2021, the Alaska
Industrial Development and Export Authority (“AIDEA”) announced the receipt of $8.5 million in funds for the advancement
of predevelopment work for the West Susitna Access Road (“WSAR”) project, which would extend into areas west of Cook Inlet
in Southcentral Alaska in the vicinity of the Whistler Project. During 2022 – 2024 AIDEA undertook road engineering investigations
to support road design and test alternatives, environmental baseline surveys and archaeological surveys, and stakeholder consultation.
The Alaska Department of Transportation and Public Facilities (“DOT-PF”) has also announced that it has included the first
25 miles of the WSAR in its State Transportation Infrastructure Plan (“STIP”) and has commenced permitting.
The
project is in the drainage of the Skwentna River that forms a large network of interconnected low-elevation U-shaped valleys cutting
through the rugged terrain of the southern Alaska Range. Elevation within the property footprint varies from approximately 1,033 ft (315
m) above sea level in the valley floors to over 5,708 ft (1,740 m) in the head waters of Muddy Creek. The Alaska Range is a continuation
of the Pacific Coast Mountains extending in an arc across the northern Pacific.
| Effective Date: September 12, 2024 | Page 25 of 181 |
| | S-K 1300 Technical Summary Report – Whistler Project, Alaska |
The
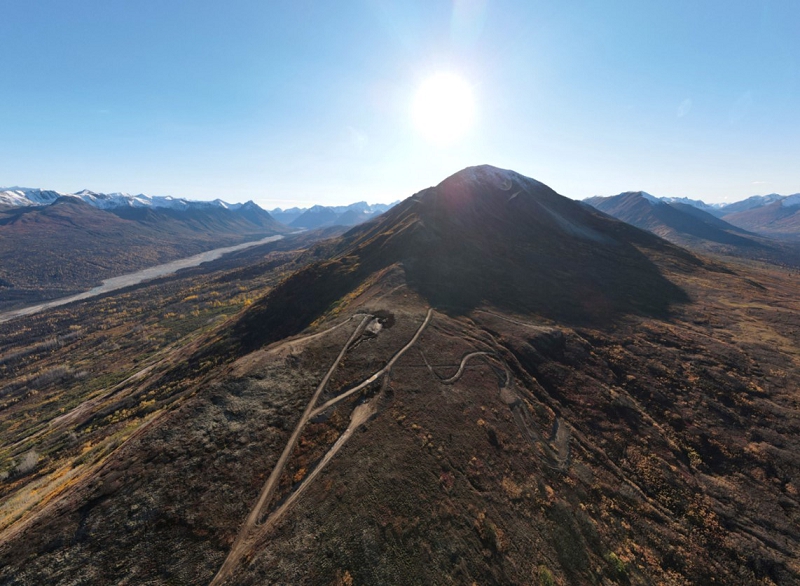
vegetation in the Whistler region is quite variable. The valley floors and lower slopes are usually characterized by dense vegetation
giving way above about 2,406 ft (750 m) elevation to dense tundra shrubs above the timber line (Figure 4-5). At higher elevations, vegetation
is absent and on the peaks surrounding the Whistler Property, active glaciers with terminal and lateral moraines are present. The timber
line is located at elevations varying between 2,624 to 3,608 ft (800 to 1,100 m). Bedrock exposures within the project area are scarce
except at elevations above 3,280 ft (1,000 m) and along incised drainage.
The
Whistler Project mineral claims provide the area that is sufficient for the development of a potential open pit project, including tailings
storage, waste disposal, potential processing plant sites and water sources. A source of power has yet to be determined, and mining personnel
would likely have to be housed in a camp.
(Source:
U.S. GoldMining Inc., 2024)
| Figure
4-5 |
Drone
aerial photo looking southwest over the Whistler deposit with the Skwentna River valley on the left side of the photo |
| Effective Date: September 12, 2024 | Page 26 of 181 |
| | S-K 1300 Technical Summary Report – Whistler Project, Alaska |
During
the late 1960s, regional mapping and geochemical sampling by the United States Geological Survey (“USGS”) identified several
base and precious metal occurrences over a very large area in the southern Alaska Range including southern portions of the Whistler project
area.
Following
the results of that work, limited exploration was conducted in the area during the 1960s and 1980s. Falconbridge (or their operator St.
Eugene) was involved in exploring the nearby Stoney Vein in the late 1960s. A local prospector, Arne Murto (deceased), was active in
the Long Lake Hills area from at least 1964 and AMAX staked at least four claims over the Lower Discovery showing at Mount Estelle (circa
1982).
Mineral
exploration in the Whistler area was initiated by Cominco Alaska in 1986 and continued through 1989. During this period, the Whistler
and the Island Mountain gold-copper porphyry occurrences were discovered and partially tested by drilling. In 1990, Cominco’s interest
waned and all core from the Whistler region were donated to the State of Alaska. The property was allowed to lapse.
In
1999, Kent Turner staked twenty-five State of Alaska mining claims at Whistler, the “Turner Property”, and leased the property
to Kennecott. From 2004 through 2006 Kennecott conducted extensive exploration of the Whistler region, including geological mapping,
soil, rock, and stream sediments sampling, ground induced polarization and they conducted an evaluation of the Whistler gold-copper occurrence
with fifteen core boreholes (7,948 m) and reconnaissance core drilling at other targets in the Whistler region (4,184 m). Over that period,
Kennecott invested over USD$6.3 million in exploration.
In
June 2007, Geoinformatics Exploration Inc. (“Geoinformatics”) announced the conditional acquisition of the Whistler Project
as part of a strategic alliance with Kennecott Exploration Company (“Kennecott”). Between July and October 2007, Geoinformatics
drilled seven core boreholes (3,321 m) to infill the deposit to sections spaced at seventy-five metres and to test for the north and
south extensions of the deposit.
In
August 2009, Geoinformatics acquired Rimfire Minerals Corporation and changed its name to Kiska Metals Corporation (“Kiska”).
In 2009 and 2010, Kiska completed three phases of exploration on the property to fulfill the terms of the Standardization of Back-In
Rights (“SOBIR”) Agreement between Kennecott Exploration Company and Kiska Metals Corporation.
In
total, Kiska completed 224 line-km of 3D induced polarization (“IP”) geophysics, 40 line-km of 2D IP geophysics, 327 line-km
of cut-line, geological mapping on the 3D IP grid, detailed mapping of significant Au-Cu prospects, collection of 109 rock samples and
61 soil samples, 8,660 m of diamond drilling from 23 drillholes (all greater than 200 m in total length), petrographic analysis of mineralization
at Island Mountain, a preliminary review of metallurgy at the Whistler Resource, and metallurgical testing of mineralization from the
Discovery Breccia at Island Mountain. This program was executed by Kiska geologists, independent geologists, and multiple contractors,
under the supervision of Kiska personnel. All aspects of the exploration program were designed and monitored by a Technical Committee
comprised of two Kennecott employees and two Kiska employees. In August of 2010, Kiska delivered a Technical Report (Roberts, 2010) to
Kennecott summarizing the results of the completed Trigger Program. In September of 2010, Kennecott informed Kiska that it would not
exercise its back-in right on the project and hence retained a 2% Net Smelter Royalty on the property.
| Effective Date: September 12, 2024 | Page 27 of 181 |
| | S-K 1300 Technical Summary Report – Whistler Project, Alaska |
From
this point forward, Kiska continued to drill and explore the Whistler Project for the duration of the 2010 and 2011 field seasons. The
majority of this work included shallow grid drilling (25 m to 50 m top of bedrock drilling) in the Whistler Area (also referred to as
the Whistler Corridor), conventional step-out drilling from prospects in the Whistler Area, step-out drilling at the Island Mountain
Breccia Zone, an airborne EM survey of the Island Mountain area, reconnaissance drilling at Muddy Creek, and minor infill drilling at
the Whistler Deposit, followed by the publication of an updated NI 43-101 resource estimate (MMTS, 2011).
A
Purchase and Sale agreement between Kent Turner, Kiska Metals Corporation and Geoinformatics Alaska Exploration Inc. dated December 16,
2014, terminated the “Turner Agreement” (an agreement that granted Kennecott and its successors a 30-year lease on twenty-five
unpatented State of Alaska Claims; see Figure 3-2) and transferred to Kiska and Geoinformatics, and their successors, an undivided 100
percent of the legal and beneficial interest in, under, to, and respecting the Turner Property free and clear of all Encumbrances arising
by, through or under Turner other than the Cominco American net profit interest.
GoldMining
Inc., through its subsidiary U.S. GoldMining (then known as BRI Alaska Corp.), acquired the rights to the Whistler Project pursuant to
an asset purchase agreement dated August 5, 2015, between GoldMining, U.S. GoldMining, Kiska Metals Corporation and Geoinformatics Alaska
Exploration, Inc. in exchange for the issuance of 3,500,000 GoldMining shares, as set out in Gold Mining’s news release of August
6, 2015. In April 2023 U.S. GoldMining listed on the NASDAQ and raised US$20M to fund the recommencement of exploration activities at
the Whistler Project, including drilling which commence in August 2023.
| Effective Date: September 12, 2024 | Page 28 of 181 |
| | S-K 1300 Technical Summary Report – Whistler Project, Alaska |
| 6 |
GEOLOGICAL
SETTING, MINERALIZATION and DEPOSIT |
The
Whistler Project is situated within the Wrangellia Composite Terrane (“WCT”), one of three composite terranes accreted to
the Alaskan portion of the North America Cordilleran margin in the Mesozoic and Cenozoic. This margin records a complex history of terrane
accretion, basin formation, basin exhumation, subduction, and multiple pulses of magmatism.
In
south-central Alaska, the WCT is comprised of three significant tectono-magmatic assemblages (Figure 6-1): 1) the Paleozoic-Triassic
basement rocks upon which the Early to Late Jurassic Talkeetna island arc was built, including volumetrically significant plutonic rocks;
2) the Kahiltna assemblage, consisting of Jura-Cretaceous flysch sediments that formed in basins initiated by the convergence of Wrangellia
with the former continental craton; and 3) voluminous Upper Cretaceous and Paleocene-Oligocene igneous rocks, dominantly plutons, that
stitch the Wrangellia composite terrane with the inboard autochthonous terranes. The latter two assemblages dominate the regional geology
of the Whistler area.
The
Kahiltna assemblage occurs as a broad 100 km by >300 km belt extending across the Alaska Range. This assemblage is comprised of mostly
marine sediments with fossils indicating deposition from the Late Jurassic to Early Cretaceous.
| Effective Date: September 12, 2024 | Page 29 of 181 |
| | S-K 1300 Technical Summary Report – Whistler Project, Alaska |
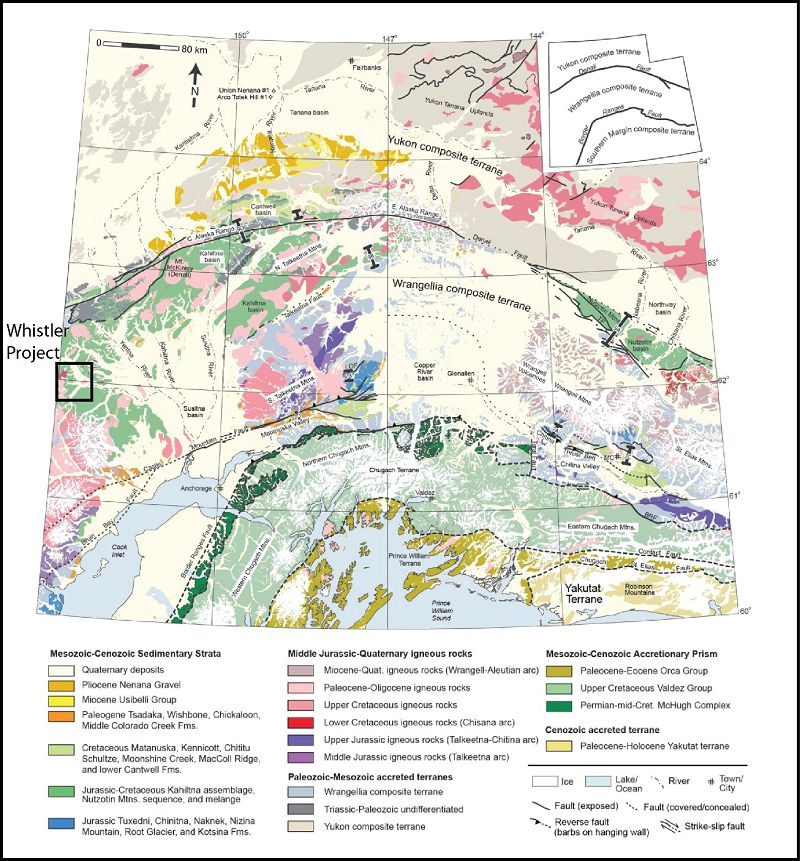
(Source:
Trop and Ridgeway, 2007)
| Figure
6-1 |
Regional
Geological Map of South-central Alaska |
The
black inset box shows the location of Whistler area and map extent in Figure 6-1 above.
| Effective Date: September 12, 2024 | Page 30 of 181 |
| | S-K 1300 Technical Summary Report – Whistler Project, Alaska |
Uplift
and shortening of the Kahiltna basin was followed by the construction of a continental-margin arc as defined by an extensive belt of
80 - 60 Ma plutons extending from the Alaska Range south-eastwards into the Coast Range of Canada. In the Alaska Range, these arc rocks
are dominated by plutons interpreted to be the deeper roots of subvolcanic and volcanic centres; however extrusive sections are locally
preserved.
There
are four intrusive suites associated with this epoch of magmatism that are recognized in the Whistler region, including (from oldest
to youngest): 1) the Whistler Intrusive Suite or “WIS” (host to the Whistler Deposit); 2) the Summit Lake Suite; 3) the Composite
Suite; and 4) the Crystal Creek Suite, as illustrated in Figure 6-2. A stratigraphic column in Figure 6-3 illustrates the timing relationship
of intrusive suites in the district, and their relationship to host country rocks.
The
Whistler Intrusive Suite consists of intermediate to mafic extrusive and intrusive rocks, including diorite porphyries. These diorite
porphyries are host to, and genetically associated with, gold-copper porphyry mineralization in the Whistler Project area. This is the
only suite where comagmatic extrusive rocks and shallow subvolcanic intrusive rocks are recognized in the region. On a district scale
the intrusions generally occur as sills and less commonly as dikes and small stocks. Hornblende Ar-Ar dating of Whistler diorite porphyry
gives an age of 75.5 +/- 0.3 Ma (Layer and Drake, 2005) and mapping shows Whistler diorite intruding extrusive andesite. Subsequent U-Pb
age dating of zircons from the mineralized diorite porphyry in the Whistler Deposit, and other mineralized porphyries on the Whistler
Project, indicate igneous ages of 76.36 Ma ±0.3 Ma (Hames, 2014). One of the least-altered diorite porphyry intrusions located
on the Whistler Ridge has a hornblende Ar-Ar age date of 75.5 ± 0.3 Ma (Young, 2005).
The
Summit Lake intrusions are regionally represented by 74 to 61 Ma calc-alkaline granodiorite to diorite, becoming more monzonitic and
of alkali-calcic affinity in the Whistler area. East and northeast from Whistler, these intrusions are associated with local gold prospects
and have been called the Kichatna plutons and more locally, the “Old Man Diorite”.
The
Composite Plutons include the Emerald, Mount Estelle, Stoney, and Kohlsaat plutons, and are locally associated with gold mineralization.
The Composite Plutons are seen to be somewhat concentrically zoned magmatic series, with an early border phase of alkaline mafic to ultramafic
rock, inwards towards less alkaline monzonites to granites. The common age range is 67 to 64 Ma.
The
regional geology of the Whistler deposit area is shown in Figure 6-2. The Crystal Creek sequence, located south of Whistler, is mainly
calc-alkaline granite or rhyolite and ranges in age from 61 to 56 Ma. More mafic rocks, including the 61Ma Porcupine Butte andesite and
Bear Cub (diorite) pluton, may represent higher level/border phases to the Crystal Creek sequence.
Continental
arc magmatism in the Latest Cretaceous is responsible for some of the most significant gold and copper-gold deposits in Alaska. These
include the Pebble gold-copper porphyry deposit (89 Ma; Schrader et al, 2001), the Donlin Creek gold deposit (70 Ma, Szumigala et al,
2000), the Fort Knox gold deposit (95 – 89 Ma, Mortenson et al, 1995), and the Livengood gold deposit (Late Cretaceous).
| Effective Date: September 12, 2024 | Page 31 of 181 |
| | S-K 1300 Technical Summary Report – Whistler Project, Alaska |
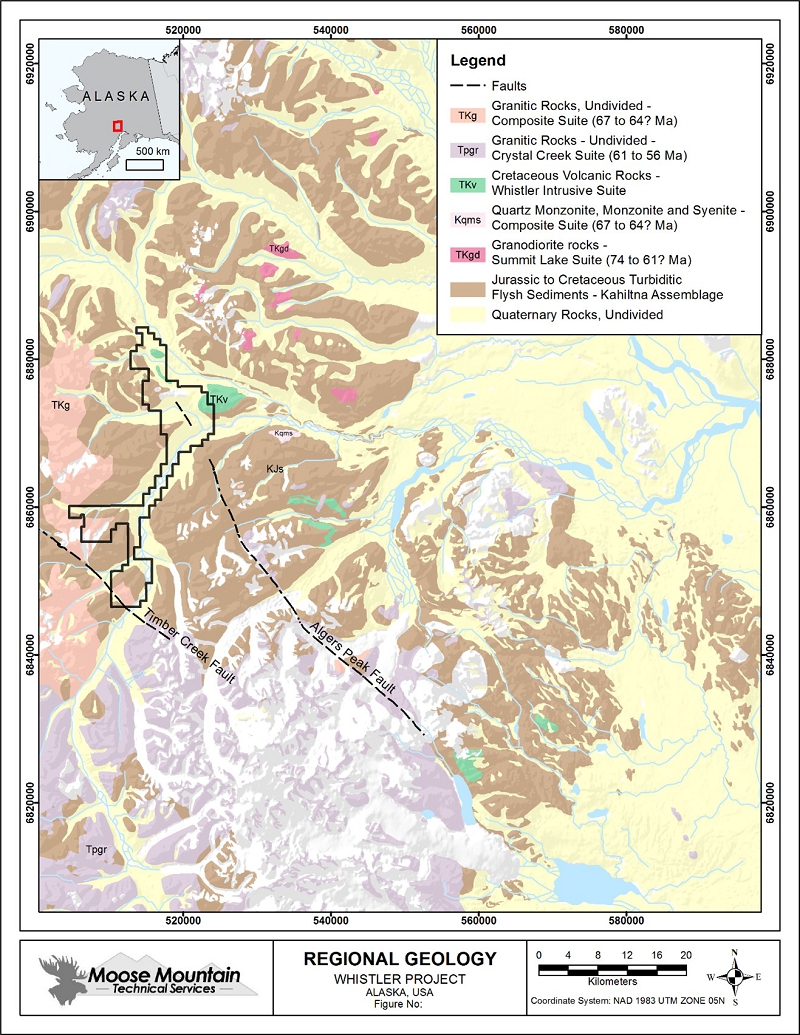
(Source:
Wilson et al., 2009)
| Figure
6-2 |
Regional
Geology of the Whistler Project |
| Effective Date: September 12, 2024 | Page 32 of 181 |
| | S-K 1300 Technical Summary Report – Whistler Project, Alaska |
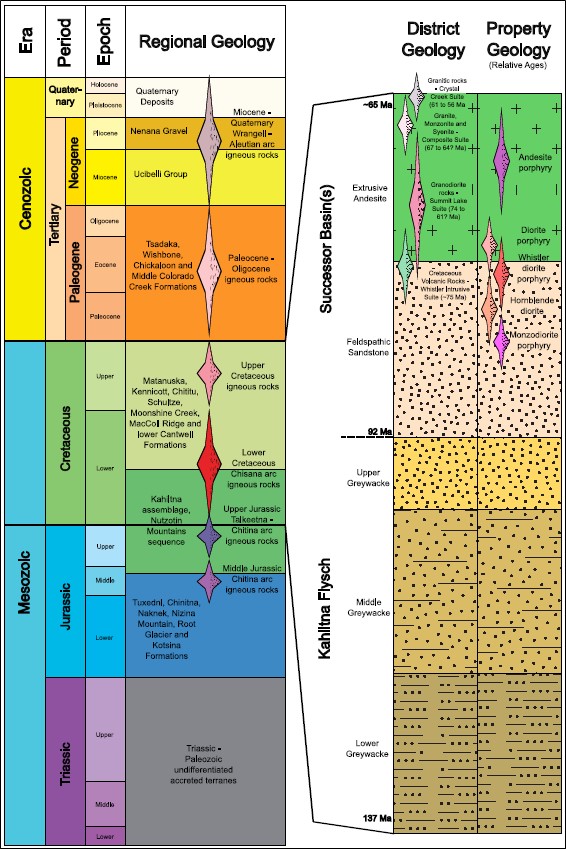
(Source:
Young, 2005 and Hames, 2014)
| Figure
6-3 |
Stratigraphic
column of the Whistler District and Property Geology |
| Effective Date: September 12, 2024 | Page 33 of 181 |
| | S-K 1300 Technical Summary Report – Whistler Project, Alaska |
The
property geology of the Whistler area is well documented and described in detail by Young (2005) and Franklin (2007). A stratigraphic
column in Figure 6-3 illustrates the timing relationship of intrusive suites and their relationship to host country rocks at the property
scale. The property can be subdivided into three main areas based on distinctive intrusive rocks and their association with gold-copper
and gold-only mineralization: 1) The Whistler Corridor; 2) Island Mountain; and 3) Muddy Creek as illustrated in Figure 6-4.
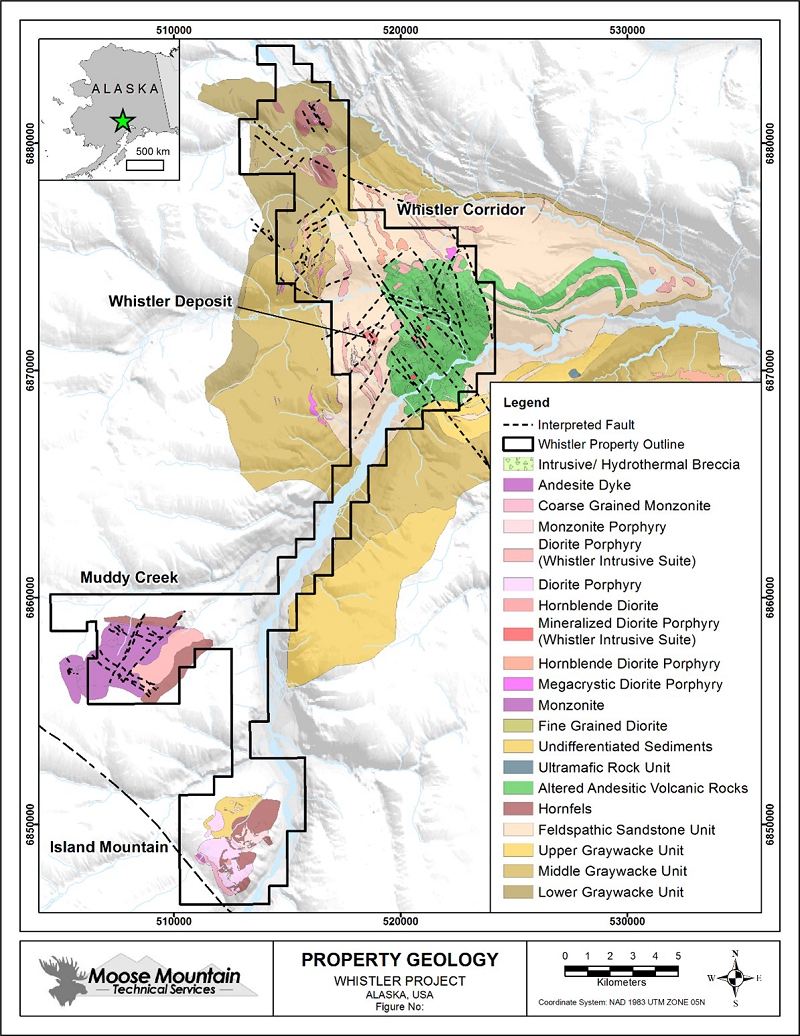
(Source:
MMTS, 2015, modified from Roberts, 2011a)
| Figure
6-4 |
Geological
Map of the Whistler Corridor, Island Mountain, and Muddy Creek |
| Effective Date: September 12, 2024 | Page 34 of 181 |
| | S-K 1300 Technical Summary Report – Whistler Project, Alaska |
The
bulk of the Whistler property is underlain by flysch sediments of the Kahiltna assemblage, while the Whistler Corridor is dominated by
a largely fault bounded block of andesitic volcanic rocks, interpreted to represent a local volcanic-dominated basin as illustrated in
Figure 6-5. The sedimentary and volcanic rocks are host to a variety of dioritic to monzonitic dykes, sills, and stocks of the WIS. Much
of the low-lying areas in this region are covered by 5 to 15 m of glacial till, and hence much of the geological map is based on drilling
and interpretation of geophysical data.
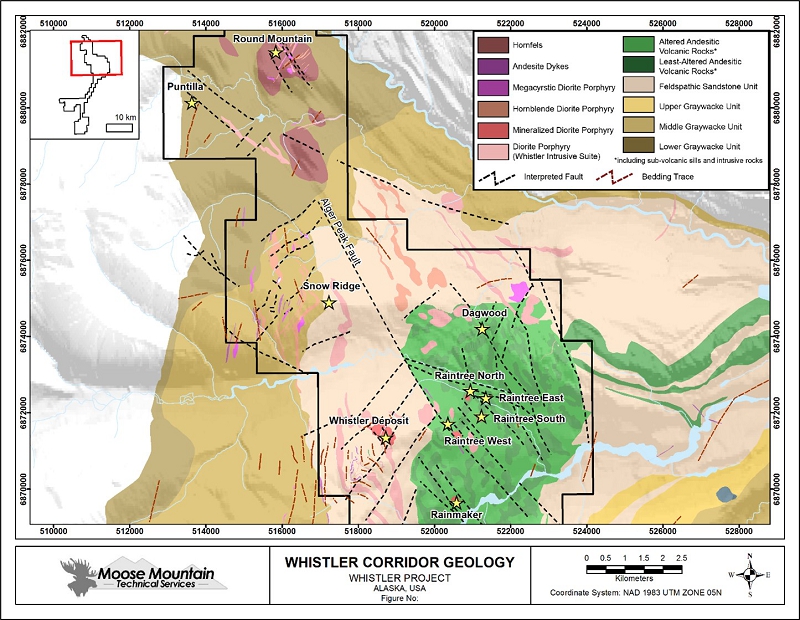
(Source:
MMTS, 2015, modified from Roberts, 2011a)
| Figure
6-5 |
Whistler
Project Geology |
The
Whistler Deposit is hosted by a multi-phase diorite porphyry intrusive complex of the WIS nested within sediments of the flysch package,
whereas prospects in the Whistler Area (Raintree, Rainmaker) are hosted by similar diorite porphyry intrusive centres within the volcanic
basin. Age dating of mineralized and barren diorite porphyry units on the Whistler ridge indicates that magmatism occurred at approximately
75 to 76 Ma (Layer & Drake, 2005; Young, 2005; Hames, 2011). The mineralogy and composition of the intrusive rocks and the andesitic
volcanic rocks are quite similar, suggesting that they are broadly comagmatic (Young, 2005). Mapping implies monzodiorite porphyry and
hornblende diorite suites intruded prior to eruption of extrusive andesites and therefore is older than the Whistler diorite porphyry.
Hornblende Ar-Ar dating indicates unmineralized diorite porphyry is likely a later phase of Whistler diorite porphyry (Hames, 2014).
Andesitic porphyry is observed to cut all phases of diorite porphyry (Young, 2005) and can be assumed to be the youngest intrusive rock
at the Whistler property.
| Effective Date: September 12, 2024 | Page 35 of 181 |
| | S-K 1300 Technical Summary Report – Whistler Project, Alaska |
Inversion
modeling of the airborne geophysical data suggests that there is a large 5 km diameter batholith possibly situated 2-3 km below the surface
and that some of the diorite porphyry intrusive centres represent hypabyssal apophyses (stocks and dykes) emanating from the deep causative
batholith.
The
detailed geology of the volcanic stratigraphy remains uncertain, largely due to glacial cover and the extensive amount of texturally
destructive, hydrothermal alteration. Volcanic rocks are comprised of coherent andesites and volcanic breccias that define a variety
of depositional facies. Based on the occurrence of common argillaceous interflow sediments Young (2005) inferred a sub-aqueous marine
setting for the bulk of the volcanic rocks. In the eastern Long Lake Hills area, volcanic flows are interbedded with Feldspathic Sandstones,
and Young (2005) interpreted this to represent the onset of volcanism in a shallower marine setting. In addition to these extrusive rocks,
a large volume of the volcanic rocks is interpreted to be comprised of porphyritic, subvolcanic units, as either large stocks, sills
or dykes. These subvolcanic units can be difficult to differentiate from coherent volcanic rocks, particularly porphyritic flows, and
in areas of intense texturally destructive phyllic alteration. The stratigraphy of the volcanic rocks is currently unresolved. The current
geological map only differentiates “least-altered” from “altered” volcanic rocks based on the extrapolation of
airborne magnetic data from the grid and scout drilling. All the volcanic and subvolcanic rocks encountered in drilling are magnetic
when they are least altered, and magnetism is generally destroyed by sulphidation during phyllic alteration.
In
addition to least-altered volcanic rocks, magnetic high anomalies also occur in association with northwest-elongated linear to oval-shaped
diorite dykes and stocks hosted by flysch sediments and in association with zones of near-surface secondary magnetite alteration and
veining, such as the Whistler Deposit, and the Rainmaker and Raintree North deposits.
The
bulk of the flysch sediments on the Whistler Project area have north to northeast striking and steeply dipping bedding orientations due
to compressional deformation that resulted in chevron-style folding. These folds are north-east striking, and fold limbs are typically
moderate to steep or overturned (Young, 2005). A dioritic sill exposed on the Whistler Ridge is likewise folded, suggesting that a component
of dioritic magmatism pre-dated regional deformation.
Several
northeast-trending faults have been interpreted based on topographic linear features and the truncation and offset of magnetic features.
These are the earliest structure features on the property since they are truncated by north-northwest-oriented faults with left-lateral
offset, such as the Alger Peak Fault.
| Effective Date: September 12, 2024 | Page 36 of 181 |
| | S-K 1300 Technical Summary Report – Whistler Project, Alaska |
The
Island Mountain area is comprised of a suite of nested intrusions, ranging compositionally from hornblende diorite to hornblende-biotite
monzonite, emplaced within flysch sediments of the Kahiltna assemblage as illustrated in Figure 6-6. Texturally, these intrusions range
from equigranular to strongly porphyritic, suggesting a relatively high level of emplacement typical of the porphyry environment. Unlike
the Whistler area, no coeval volcanic rocks are recognized. Based on limited whole-rock geochemistry (Young, 2005) the Monzonite at Island
Mountain plots within the silica-saturated alkalic field of Lang et al. (1995) and is the intrusive equivalent of trachyandesite on a
total alkali versus silica diagram. This suite of intrusions is mapped as part of the circa 67 to 64 Ma Composite Suite of intrusions,
like the Muddy Creek area, however recent age dating suggests some complexity with dates ranging from 77 Ma down to 64 Ma (Gross, 2014).
Compared to Muddy Creek, the intrusive rocks at Island Mountain are generally more mafic (diorite and monzonites as opposed to quartz
monzonite and granites at Muddy Creek), are magnetite-bearing rather than ilmenite-bearing, are commonly more porphyritic rather than
coarse equigranular, lack the strong, pervasive gold-arsenic association, and lack the evenly distributed northwest-oriented sheeted
fracture set that typifies mineralized structures at Muddy Creek. For these reasons, it is likely that igneous rocks at Island Mountain
represent a unique intrusive suite separate from the Composite Suite.
This
unique intrusive centre is broadly situated at the intersection between the regionally significant northwest-striking Timber Creek Fault,
which can be traced for 10’s of kilometres, and the Skwentna River valley, postulated as a possible fault zone (Young, 2005). The
bulk of the nested intrusions occur on the southeast side of Island Mountain, and this is where sediments in the contact metamorphic
aureole of these intrusions are hornfelsed. The hornfels, especially on the southwest corner of Island Mountain, occur as irregular rafts
and possibly roof pendants that appear to form a slope-parallel skin of country rock that demarks the roof zone of this intrusive complex.
Sediments consist of dark mudstone, shale, thin-to-medium-bedded siltstone and dark grey sandstone and minor dirty calcareous sedimentary
beds and a few local thin pebble conglomerate units. These units predominate on the northwest portion of Island Mountain.
| Effective Date: September 12, 2024 | Page 37 of 181 |
| | S-K 1300 Technical Summary Report – Whistler Project, Alaska |
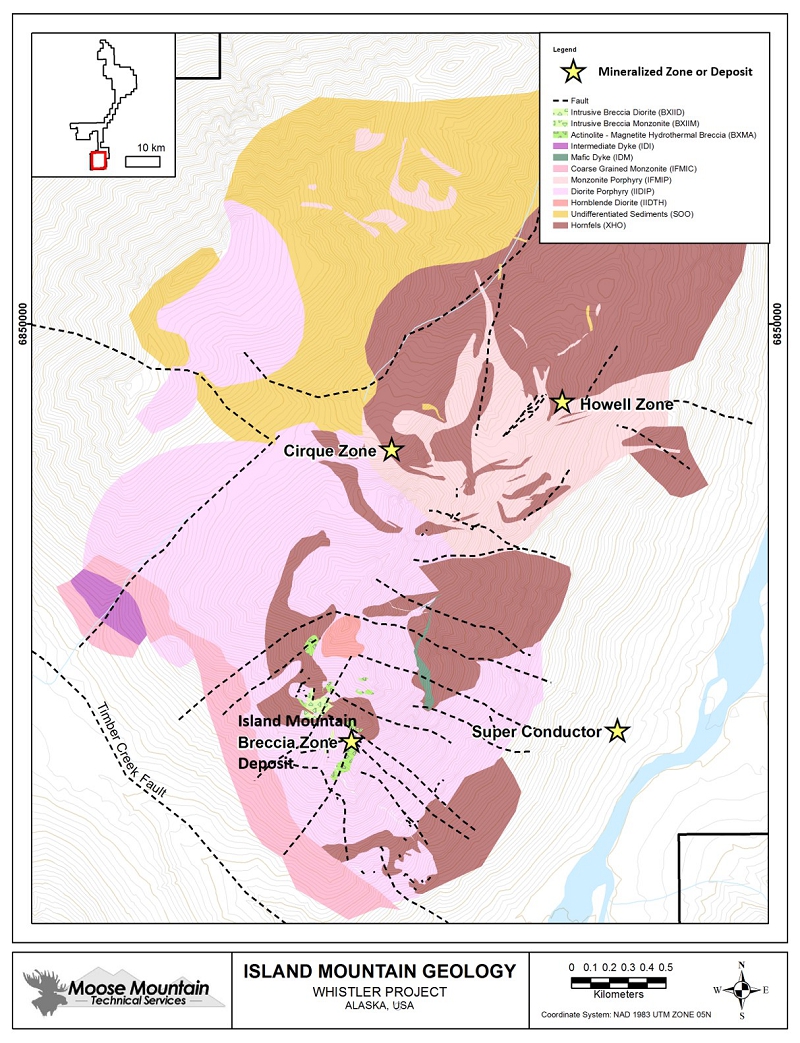
(Source:
MMTS, 2015, modified from Roberts, 2011a)
| Figure
6-6 |
Property
Geology of the Island Mountain Area |
| Effective Date: September 12, 2024 | Page 38 of 181 |
| | S-K 1300 Technical Summary Report – Whistler Project, Alaska |
The
earliest recognized intrusive phase is the Island Mountain Diorite Porphyry. This unit has been observed to be cut by all other igneous
units and is the host to gold-copper porphyry mineralization associated with intrusive and hydrothermal breccias at the Island Mountain
Deposit (previously referred to as the “Breccia Zone”).
The
next most volumetrically significant intrusive phase is a Monzonite Porphyry (IFMIP) that occurs in the northeast corner of Island Mountain,
and which is generally the host of gold-copper porphyry-style mineralization at the Cirque and the Howell zones. Unlike the Diorite Porphyry,
this unit contains magnetite phenocrysts and is thus well delineated by airborne magnetic survey data.
In
the Breccia Zone, Diorite- and Monzonite-cemented intrusive breccias occur as sub-vertical, 100-150 metre diameter, sub-circular to irregularly
shaped pipes that grade into actinolite-magnetite-cemented hydrothermal breccias with pyrrhotite-pyrite-chalcopyrite mineralization,
which together define magmatic-hydrothermal conduits that host the bulk of gold-copper porphyry mineralization in this area. Not all
the Intrusive Breccia bodies are altered or mineralized, suggesting that either some of these breccias post-date the main phase of mineralization,
or that some pre-mineral intrusive breccias were not affected by hydrothermal fluid. Together, these intrusive and hydrothermal breccias
have been the focus of the majority of the exploration drilling at Island Mountain since 2009. A series of these breccias extend discontinuously
for 700m from the “Breccia Zone” on a north-northwest trend along the south-western slope of Island Mountain. The Breccia
Zone also contains narrow, pencil-like bodies of Coarse Porphyritic Hornblende Diorite that are syn to post gold-copper mineralization.
This
corridor of breccias is flanked by strong pervasive albite alteration with local zones of vein and disseminated pyrrhotite that constitutes
significant Au-only mineralization within and flanking the Breccia Zone. Similar intrusive and hydrothermal breccias with peripheral
sodic alteration and pyrrhotite mineralization occur in areas of gold and copper soil anomalies at the Howell Zone, suggesting the occurrence
of multiple magmatic-hydrothermal centres. The Howell Zone remains untested by drilling.
The
last volumetrically significant phase of magmatism is represented by a coarse grained equigranular monzonite that occurs as a northwest-striking
dyke or sill exposed near the base of slope on the south-western side of Island Mountain. This unit lies adjacent and strikes parallel
to the regional Timber Creek Fault, suggesting a possible regional control on the emplacement of this unit. Likewise, all the above-mentioned
units are cut by narrow, post-mineral, fine-grained mafic to intermediate dykes that generally strike to the northwest and dip steeply.
Muddy
Creek is in rugged terrain along the western edge of the Whistler Project and is comprised of several steep, north-east facing U-shaped
glacial valleys separated by razor-back ridges with small remnant glaciers at the heads of each valley. This prospect is largely underlain
by a monzonitic intrusive complex, part of the Composite Suite (or Estelle Suite) of intrusions that were emplaced within sediments of
the Kahiltna Assemblage in the late Cretaceous (Figure 6-7). An argon-argon analysis of igneous biotite from a granodiorite on the western
margin of the intrusive complex returned an age date of 67.4Ma ± 0.4Ma (Solie et al., 1991a). A steep, east-west trending contact
between the intrusive complex and hornfels sediments is well-exposed in the ridgelines in the northern portion of the prospect and is
comprised of a conspicuous and extensive red-brown colour anomaly. Hornfels also comprises the eastern contact of the intrusive complex.
| Effective Date: September 12, 2024 | Page 39 of 181 |
| | S-K 1300 Technical Summary Report – Whistler Project, Alaska |
The
bulk of the geological mapping at Island Mountain was completed by Kennecott and the following descriptions are from Young (2005). The
core of the intrusive complex is monzonitic, grading outwards to progressively more mafic and older intrusive phases (Crowe et al, 1991),
with pendants of ultramafic rocks at the margins (Millholland, 1998). The pluton intrudes very steeply north-dipping sedimentary rocks
of the middle Graywacke Sandstone subunit and Tabular Sandstone unit. Local matrix-supported pebble conglomerate and spherical concretions
along Muddy Creek support a correlation with the Tabular Sandstone unit.
The
majority of the Mount Estelle pluton consists of biotite-monzonite, with an increasing proportion of augite phenocrysts towards the margins.
Monzonite is medium- to coarse-grained and idiomorphic granular and occurs at the central and southern portions of the mapped area at
Muddy Creek. Mafics, principally biotite books (to 5 mm) and subordinate to absent stubby dark augite generally constitute 15 to 35%
of the monzonite. Twinned 3mm to 1cm orthoclase phenocrysts are a fundamental component. Groundmass consists of a medium-grained equigranular
mixture of feldspar and quartz. Rounded xenoliths are rare, but widespread, and consist of biotitized sediments and more strongly mafic
(biotite and augite)-rich intrusive rock of earlier intrusive phases. Intrusion breccia’s with rounded clasts are a very local
feature as are sinuous to linear aplitic dikes.
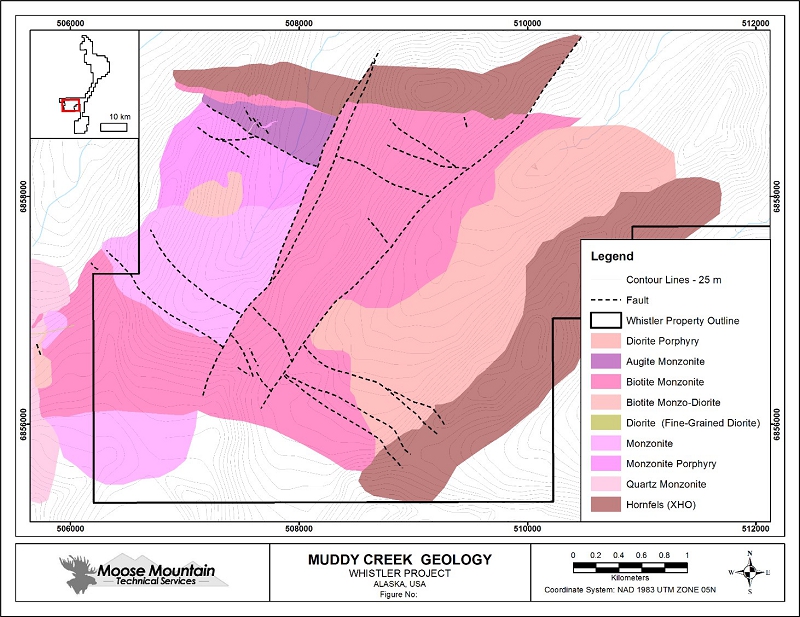
(Source:
MMTS, 2015, modified from Roberts, 2011c)
| Figure
6-7 |
Geological
Map of Muddy Creek |
| Effective Date: September 12, 2024 | Page 40 of 181 |
| | S-K 1300 Technical Summary Report – Whistler Project, Alaska |
Exploration
on the Whistler Project by Kennecott, Geoinformatics, Kiska and U.S. GoldMining has identified three primary exploration targets for
porphyry-style gold-copper mineralization. These include the Whistler Deposit, Raintree West, and the Island Mountain deposits as shown
in Figure 6-8. The Whistler-Raintree and Island Mountain areas also host multiple additional porphyry-like prospects defined by drilling,
anomalous soil samples, alteration, veining, surface rock samples, induced polarization chargeability/resistivity anomalies, airborne
magnetic anomalies, and airborne electromagnetic anomalies. These include the Raintree North, Rainmaker, Round Mountain, Puntilla, Snow
Ridge, Dagwood, Super Conductor, Howell Zone, and Cirque Zones. The Muddy Creek area represents an additional exploration target with
the potential to host a low-grade, bulk tonnage, Intrusion-Related Gold mineralization.
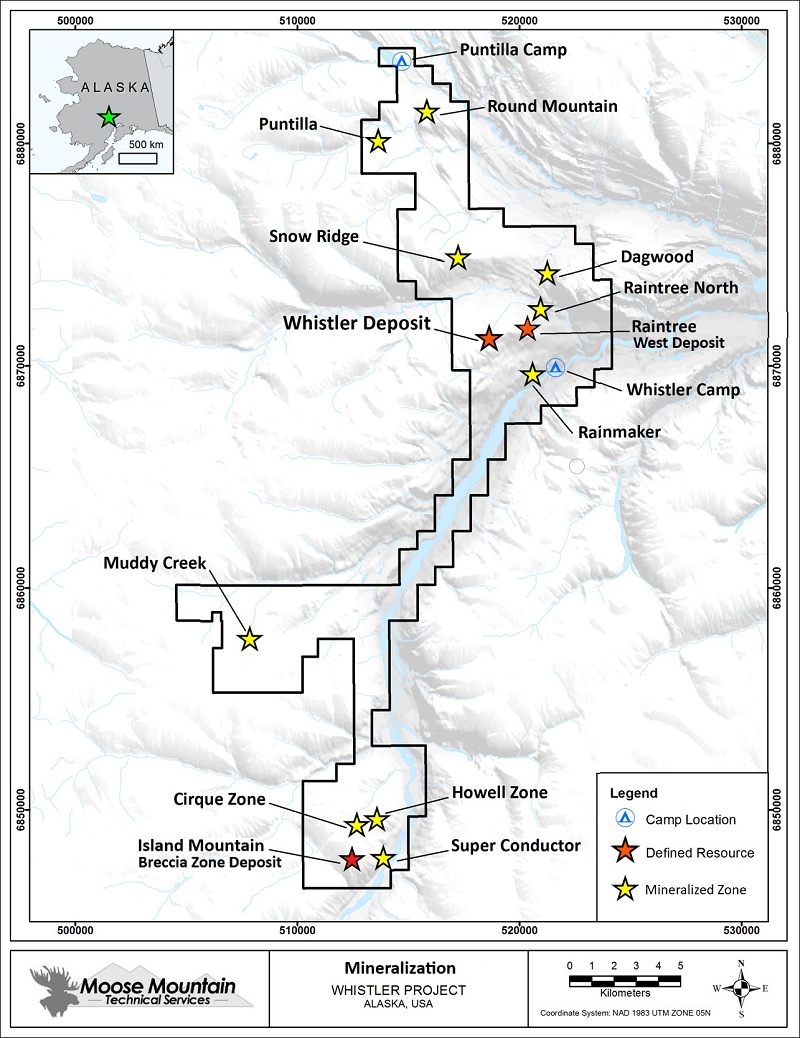
| Figure
6-8 |
Prospect
Areas |
| Effective Date: September 12, 2024 | Page 41 of 181 |
| | S-K 1300 Technical Summary Report – Whistler Project, Alaska |
| 6.2.1 |
Whistler
Area and Whistler Deposit Mineralization Overview |
The
Whistler Deposit and prospects in the Whistler Area (Raintree West, Raintree North and Rainmaker) display a common pattern of alteration,
vein paragenesis, and mineralization styles that suggest these spatially separate porphyry centres share a common genetic association.
These features are hosted by, and genetically linked to, pulses of diorite porphyry intrusive bodies that are nested in pipe-like centres.
Geophysical inversion models of the airborne magnetic data suggest that these pipes represent hypabyssal apophyses (stocks and dykes)
emanating from the deep causative batholith. That these porphyry centres are genetically associated is corroborated by common alteration
assemblages, vein types, mineralization styles and paragenetic relationships. At the Whistler Deposit, the earliest Diorite Porphyry
phase (Main Stage Whistler Diorite Porphyry) is associated with the main stage of gold-copper mineralization, whereas subsequent phases
are less mineralized, and thus are either weak metal contributors or diluting bodies.
The
Whistler Deposit is hosted within the Whistler Intrusive Suite, a composite of diorite stocks and dykes that divide the suite broadly
into an early Main Stage Porphyry (“MSP”), a later Intermineral Porphyry Suite (“IMP”) and a late
intrusive phase referred to as the Late-Stage Porphyry (“LSP”). Gold and copper mineralization is characterized by
abundant disseminated sulphide and quartz + sulphide vein stockworks (including classic porphyry diagnostic ‘A’, ‘B’,
‘D’, and ‘M’ type veins), and potassic alteration which is variably overprinted by later phyllic alteration.
The early-stage MSP suite is most strongly altered, veined and mineralized, with the IMP being less intensely altered and veined but
remaining consistently mineralized, and the late or post-mineralization LSP generally containing below cut-off grade or being unmineralized.
In addition, a robust core of higher-grade mineralization is recognized within the deposit that correlates with intense alteration and
B-veining within MSP and IMP in the eastern part of the intrusive suite.
The
earliest recognized alteration event recognized at the Whistler Deposit and the porphyry prospects in the Whistler Area, referred to
as “Magnetite” alteration, occurs as patchy magnetite alteration of mafic minerals (dominantly hornblende and possibly pyroxenes)
and narrow, irregular magnetite veinlets (“M-veins”). Magnetite in this event is occasionally intergrown with trace chalcopyrite.
This stage may include the partial replacement of feldspars by secondary K-feldspar, particularly in the selvages to M-veins, and hence
may be part of the earliest, weakest stage of Potassic alteration (see Figure 6-9 below). This stage is recognized in both the Main Stage
and Intermineral Stage Diorite Porphyry generally in the core zone of mineralization at the Whistler Deposit. In addition, it has been
observed to occur within andesitic volcanic and volcaniclastic rocks within 50 m of similarly altered diorite intrusions in the Whistler
Area, however not within the Feldspathic Sandstones that host the Whistler Deposit.
| Effective Date: September 12, 2024 | Page 42 of 181 |
| | S-K 1300 Technical Summary Report – Whistler Project, Alaska |
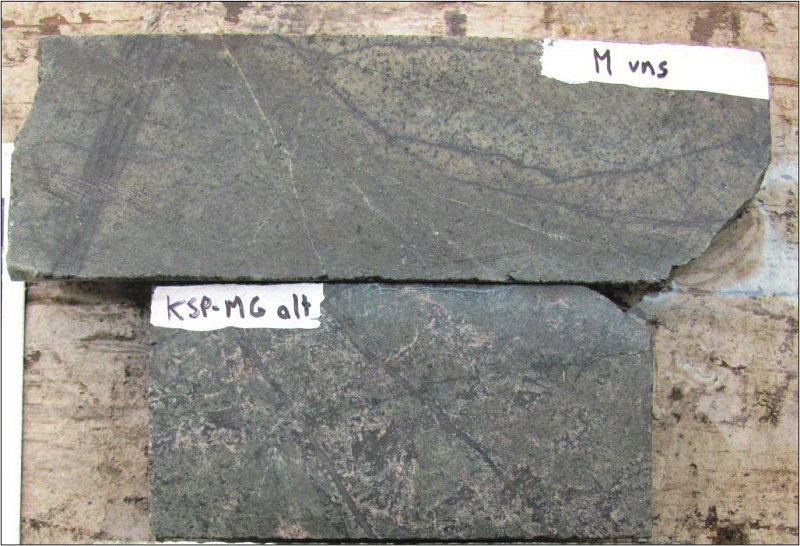
(Source:
MMTS, 2015)
| Figure
6-9 |
Photo
of irregular M-veins in dark magnetite alteration of mafics (upper) and pervasive pink-black blotchy k-feldspar and magnetite alteration
(lower) with wormy quartz + magnetite + chalcopyrite A-veins (Whistler Deposit) |
The
subsequent stage of alteration is “Potassic” alteration, defined by the occurrence of pinkish K-feldspar replacing plagioclase
and matrix, which generally occurs as halos to, or pervasively in zones of, A-style and B-style quartz veins. Potassic alteration also
includes the replacement of mafic phases by fine-grained secondary “shreddy” biotite, however this is generally difficult
to observe due to overprinting Chlorite-Sericite alteration (see Figure 6-10, below). Strong Potassic alteration (pink rock) is generally
accompanied by strong patchy magnetite alteration, and overall this leads to strong textural destruction such that the rock is mottled
pink-black without an obvious porphyritic texture. Potassic alteration is associated with the bulk of gold-copper mineralization, which
occurs as chalcopyrite and rare bornite in A- and B-style quartz veins and as fine-grained disseminations in adjacent wall rock. At the
Whistler Deposit, gold occurs predominantly as electrum associated with chalcopyrite. There exists a spectrum of A- and B-style quartz
veins. A-veins are millimetre wide, sugary quartz ± magnetite with wormy margins. These are generally observed to cut M-veins,
however occasional M-veins have been seen to transition into A-like quartz veins. B-veins are generally comprised of slightly coarser,
equigranular quartz with centre-line septa of chalcopyrite, and have straight sides. Intense zones of B-style veining form strong stockwork
zones are associated with high-grade zones (>1 gpt Au, >0.5% Cu). Potassic alteration and quartz veining may include minor pyrite,
yet these zones have relatively low total sulphide content (<1-2%).
| Effective Date: September 12, 2024 | Page 43 of 181 |
| | S-K 1300 Technical Summary Report – Whistler Project, Alaska |
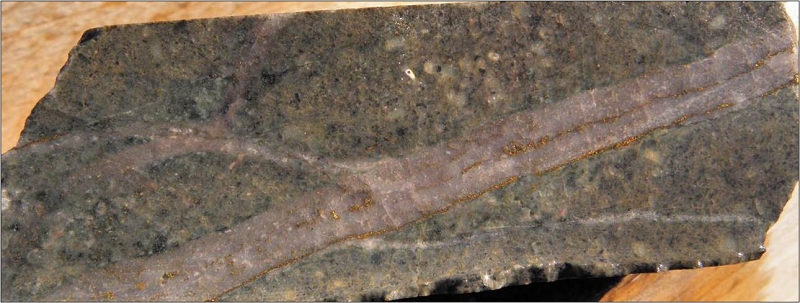
(Source:
MMTS, 2015)
| Figure
6-10 |
Photo
of a classic B-style quartz vein with a chalcopyrite-filled centreline cutting an irregular,
wormy A-style quartz vein (Whistler Deposit, WH 08-08, ~123.0
m) |
In
general, core zones of Potassic alteration and Au-Cu mineralization are partially to completely overprinted by “Chlorite-Sericite”
alteration. This “green rock” alteration is ubiquitous and the most macroscopically obvious alteration in zones of Au-Cu
mineralization, even though it is a later event. As shown in Figure 6-11, bright green chlorite replaces secondary biotite and any primary
mafic phases remaining, and waxy green sericite replaces feldspars. Pyrite is part of this assemblage, partly replacing mafics and magnetite.
Calcite or carbonate may be part of this assemblage, as well as trace epidote. Kennecott referred to this alteration assemblage as “Intermediate
Argillic”, which is equivalent to SCC alteration in the porphyry literature (Sillitoe, 2010). Kiska interpreted the Chlorite-Sericite
alteration to be transitional to “Phyllic” alteration, overprinting (telescoping) and immediately peripheral to core zones
of mineralization. This pervasive style of alteration is not obviously associated with any veining event, however there is a continuum
of glassy quartz veins with pyrite>>chalcopyrite + molybdenite that appears to only occur in zones of Chlorite-Sericite and Phyllic
alteration.
| Effective Date: September 12, 2024 | Page 44 of 181 |
| | S-K 1300 Technical Summary Report – Whistler Project, Alaska |
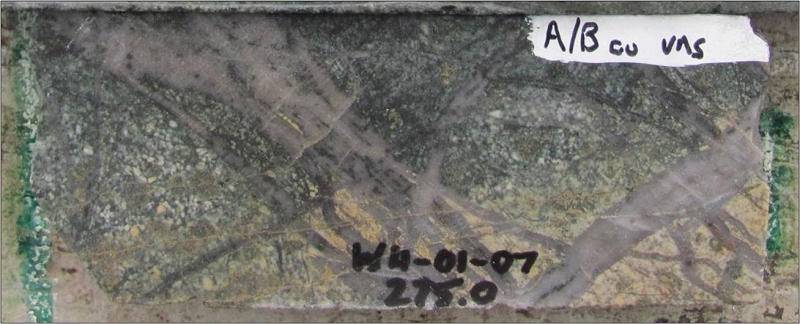
(Source:
MMTS, 2015)
| Figure
6-11 |
Photo
or chlorite-sericite (+calcite) alteration overprinting potassic – magnetite alteration in a zone of quartz vein stockwork,
subsequently cut by later Dpy veinlets with sericitic and iron-carbonate halos (Whistler Deposit) |
Potassic
and Chlorite-Sericite alteration is variably overprinted by “Phyllic” alteration. The Phyllic assemblage consists of sericite
+ pyrite + quartz. Moderate to strong Phyllic alteration is typically bleached grey-tan, where mafic minerals are completely to strongly
replaced by sericite and pyrite, magnetite is replaced by pyrite, and feldspars are replaced by sericite (and clays). Phyllic alteration
commonly occurs in halos to pyritic stringers (“Dpy”) and quartz + pyrite veins (“D-veins”). In areas with intense
D-style veining, phyllic halos coalesce to give pervasive Phyllic alteration, as illustrated in Figure 6-12. Strong to intense Phyllic
alteration is texturally destructive, which often leads to difficulty in distinguishing intrusive from volcanic rocks. It is also suspected
that intense Phyllic alteration is grade destructive. At the Whistler Deposit and other prospects Phyllic alteration forms an outer and
upper, commonly gradational halo to Chlorite-Sericite alteration, and is also preferentially developed in structural zones, including
faults and hydrothermal breccias. Hydrothermal breccias commonly occur along the boundaries of different units (sediment/diorite; volcanic/diorite;
diorite/diorite) and are comprised of variably milled wall rock fragments cemented by quartz-sericite-pyrite (“pyritic rock flour
breccias”). These breccias occasionally contain tourmaline.
In
the Whistler Area, strong Phyllic alteration and high pyrite content (10 - 15%) is common peripheral to individual porphyry centres extending
for hundreds of metres into surrounding volcanic rocks. This has led to significant demagnetization of the volcanic stratigraphy such
that the magnetic signature in the area is a function of alteration (dominantly Phyllic) rather than primary rock types. In contrast,
the Phyllic halo at the Whistler Deposit only extends 50m into the surrounding Feldspathic Sandstone. In addition to pyrite, porphyry
centres in the area are also large sulphur anomalies, in the form of sulphates. Anhydrite appears to span several alteration and vein
types: anhydrite occurs within B-type quartz-chalcopyrite veins and within cross-cutting D-veins and Dbm veins (see below). Fine-grained
anhydrite, of an uncertain alteration affiliation, also replaces feldspars at the microscopic scale. Gypsum locally replaces vein anhydrite
and occurs as very narrow and abundant hairline veinlets in zones of strong to intense and pyritic phyllic alteration.
| Effective Date: September 12, 2024 | Page 45 of 181 |
| | S-K 1300 Technical Summary Report – Whistler Project, Alaska |
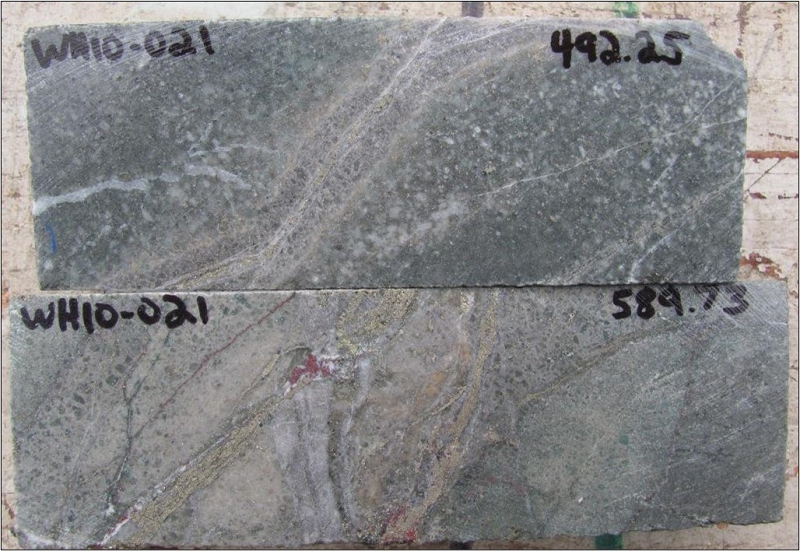
(Source:
MMTS, 2015)
| Figure
6-12 |
D-style
pyrite veins with well-developed phyllic halos (Whistler Deposit), that cut and off-set B-style quartz veins (lower sample). Also
note the local occurrence of hematite at the intersection of both vein types (magnetite>hematite?) |
At
the Whistler Deposit and other prospects in the Whistler Area, the latest stage of precious and base metal mineralization is associated
with quartz-carbonate (dolomite and calcite)-sphalerite-galena ± chalcopyrite veins (“Dbm” or “D-base metal
veins”). These veins have been observed to cut Potassic and Chlorite Sericite alteration (including Au-Cu mineralization and A-
and B-vein stockwork), Dpy and D veins, and sericite-quartz-pyrite cemented hydrothermal breccias as illustrated in Figure 6-14. In the
Whistler Area, these veins are commonly most abundant in the outer, intense phyllic halo within volcanic rocks within 100 – 200
m of the diorite intrusive centres. The veins can range from narrow veins (0.5 - 1.0 cm wide) up to 2 – 5 m wide (generally as
vein breccias). Veins minerals, including sulphides, are medium to very coarse-grained (Figure 6-13), have local colliform banding, and
vein quartz is occasionally chalcedonic. Based on their cross-cutting relationships, textures, mineralogy and spatial relationship to
porphyry centres, these veins are interpreted to have formed syn- to post-Phyllic stage alteration. That these veins typically cut phyllic-stage
hydrothermal breccias and have open-space fill colliform banding, suggests that these veins formed in a much different hydrologic/structural
regime (hydrostatic, possible incursion of meteoric waters) relative to Magnetite through to Phyllic events. Relative to the Whistler
Deposit, these veins are much more abundant in the host rocks to porphyry centres in the volcanic-hosted prospects in the Whistler Area,
particularly Raintree West. This observation, in addition to the epithermal-like textures of these veins, supports the notion that other
porphyry centres in the Whistler Area may have formed at shallower stratigraphic levels compared to that of the Whistler Deposit.
| Effective Date: September 12, 2024 | Page 46 of 181 |
| | S-K 1300 Technical Summary Report – Whistler Project, Alaska |
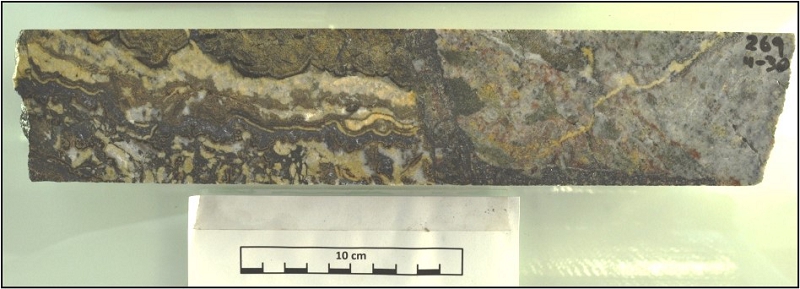
| Figure
6-13 |
Photo
of quartz-carbonate vein from Raintree West (WH11-030) showing well-developed colliform banding and coarse-grained sphalerite and
galena (Source: MMTS, 2015) |
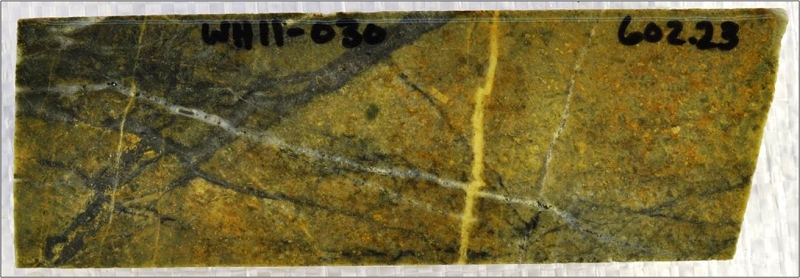
(Source:
MMTS, 2015)
| Figure
6-14 |
Common
vein paragenesis in all porphyry occurrences in Whistler Area: dark grey quartz vein stockwork with chalcopyrite (A- and B-style),
cut by quartz-calcite-carbonate-sphalerite-galena veinlet (Dbm veins, top left down to bottom right), cut by narrow Fe-carbonate
veinlets with Fe-carbonate alteration halos (Raintree West example) |
The
most significant style of post-mineral alteration is Fe-carbonate alteration as illustrated in Figure 6-14 above. This occurs as pervasive
alteration of feldspars in structural zones and as selvages to ankerite veins. Primary igneous magnetite and secondary magnetite is commonly
altered to hematite in these zones. Ankerite veins, typically as brittle tension gashes, cross-cut all vein styles, including the Dbm
veins. The degree and extent of this style of alteration is typically not obvious until the core has weathered for a year or more and
is therefore not well-documented in the core logs.
| Effective Date: September 12, 2024 | Page 47 of 181 |
| | S-K 1300 Technical Summary Report – Whistler Project, Alaska |
| 6.2.2 |
Mineralization:
Whistler Deposit |
Gold
and copper mineralization at the Whistler Deposit is hosted by a Late Cretaceous, multi-phase diorite porphyry intrusive complex that
intrudes the Feldspathic Sandstone unit of the Kahiltna assemblage (Figure 6-3 and Figure 6-15). The Feldspathic Sandstone is comprised
of sandstone with minor interbeds of mudstone, siltstone, and conglomerate. Sedimentary bedding in the vicinity of the deposit primarily
strikes to the northeast and dips steeply to the northwest.
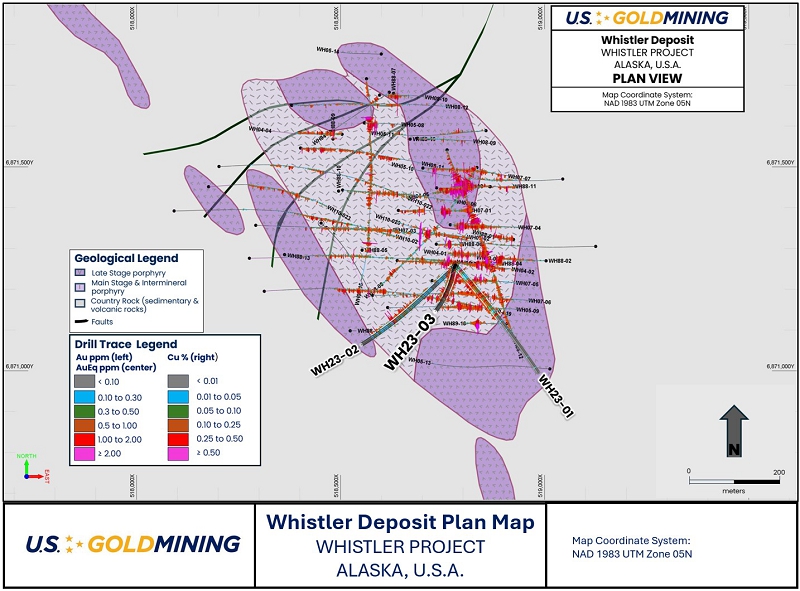
| Figure
6-15 |
Geological
Map of the Whistler Deposit |
The
diorite porphyry intrusive complex is ovoid-shaped and vertically plunging (Figure 6-16). The long axis of the ovoid is 700 m long and
oriented in a northwest-southeast direction. The short axis of the ovoid is 500 m wide and oriented in a northeast-southwest direction.
Deep drilling indicates that the intrusive complex is open below a depth of 800 m from surface.
The
intrusive complex is composed of at least three diorite porphyry phases that are compositionally and texturally similar: they are comprised
of 60% - 80%, euhedral to subhedral blocks of plagioclase feldspar phenocrysts (0.2 - 3.0 mm diameter), 5%-20% hornblende laths (0.2
- 3.0 mm) that are usually altered to sericite, chlorite, pyrite, or a combination of these, and a fine grained, granular groundmass
of feldspar and minor quartz, that is usually altered to silica, chlorite, sericite, clay or potassium feldspar. In places within the
deposit, three intrusive phases are recognized based on cross-cutting relationships with mineralization and alteration. The oldest intrusive
phase, the “main stage diorite porphyry” (MSP), carries the earliest recognized veining and alteration associated with gold-copper
mineralization (see below); the second phase, the “inter-mineral diorite porphyry” (IMP) is recognized where it clearly cuts
main stage diorite porphyry mineralization (i.e., intrusive contact cutting mineralized veins), and is itself veined and mineralized.
The third and youngest phase, the “late-stage diorite porphyry” (LSP) is barren except for local mineralized xenoliths of
main or inter-mineral porphyry.
| Effective Date: September 12, 2024 | Page 48 of 181 |
| | S-K 1300 Technical Summary Report – Whistler Project, Alaska |
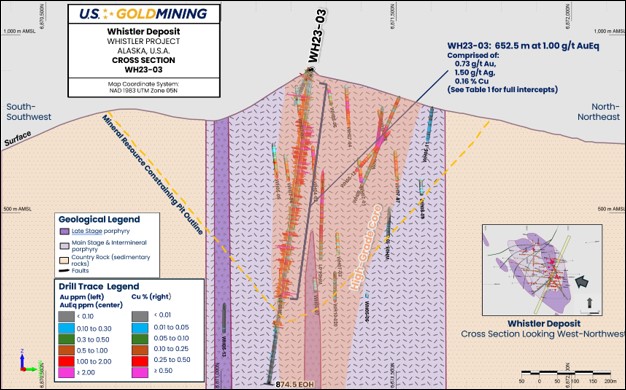
| Figure
6-16 |
Geological
Cross-section – looking WNW of the Whistler Deposit |
Due
to the compositional and textural similarity of the main stage and inter-mineral stage porphyries and hence the difficulty in consistently
identifying these stages in areas that lack clear cross-cutting relationships with mineralization or alteration, the MSP and IMP are
currently modeled as a single mineralized porphyry unit. For consistency these phases are therefore referred to as ‘productive
porphyry, or collectively the “Main Stage Porphyry”. Further re-logging of drill core and future in-fill drilling may be
able to differentiate these phases clearly and consistently.
The
Main Stage Porphyry (“MSP”) comprises the bulk of the volume of the intrusive complex and is cut by the Late-Stage Porphyry.
This latter phase clearly post-dates mineralization and truncates grade. It occurs as narrow, sub-vertical dykes and pencil-like bodies,
generally 2 to 10 m wide but up to 150 m wide on the south, north and western edges of the MSP. This phase generally has strong pervasive
phyllic alteration, and occasionally xenoliths or rafts of the MSP, which locally contribute grade.
Gold
and copper mineralization in the Main Stage Porphyry is comprised of 1 - 3% chalcopyrite and trace bornite as grains within magnetite
and quartz veins (see below) and as disseminations in the host porphyry generally within the halos to these veins. Petrography indicates
that gold occurs predominantly as electrum associated with chalcopyrite (Petersen, 2004). This mineralogy and style of mineralization
is typical of diorite-hosted gold-copper porphyry deposits (Sillitoe, 2010).
| Effective Date: September 12, 2024 | Page 49 of 181 |
| | S-K 1300 Technical Summary Report – Whistler Project, Alaska |
Recent,
preliminary modeling has identified a ‘High-Grade Core’ (Figure 6-16), interpreted as a semi-discrete, near-vertical, ovoid-shaped
fluid flow conduit (interconnected vein networks) that delivered and trapped the bulk of the metals in the MSP. The High-Grade Core is
defined by coincident approximately ≥0.40 gpt gold and ≥0.20% Cu grade contours and extends approximately 500 m in the north-south
dimension, 250 m in the east-west dimension and is 600 m deep (from surface). The High-Grade Core has the highest gold-copper grades
relative to the remainder of the MSP domain, yet the boundaries are geologically gradational.
The
High-Grade Core contains inner zones of strong potassic and magnetite alteration (see below), which is dominantly overprinted by pervasive
chlorite-sericite alteration and local phyllic alteration. This domain is also defined by the consistent occurrence and highest concentration
of M-veins and mineralized quartz veins (A- and B-veins), which generally range in volume from 1 to 5%. Local higher-grade mineralization
occurs in zones of high-density quartz vein stockwork (locally >20% quartz vein volume) and quartz + magnetite + chalcopyrite cemented
hydrothermal breccias. Minor 1cm to 10cm wide quartz-carbonate (ankerite and calcite)-barite-sphalerite-galena ± chalcopyrite
veins (Dbm veins) cross-cut mineralized and unmineralized portions of the Main Stage Porphyry and are interpreted as intermediate sulphidation
epithermal veins that have telescoped on the porphyry system. These sparse veins contain minor Au, Ag, Pb, Zn, and Cu, yet do not contribute
significantly to the economic resource.
The
structure of the intrusive complex is becoming better constrained with the most recent rounds of drilling (2023 and 2024 totalling 6240
meters core), combined with relogging of historic core, to fill gaps in understanding within the previously widely spaced drilling.
The
‘Divide Fault’, previously modelled based on drill core intercepts and breaks in the downhole magnetic susceptibility readings,
and which formed a hard-boundary between eastern and western domains (Domain 1 & 2 respectively in Bird, 2022), has been removed
from the current structural model of the Whistler Deposit, as relogging campaigns and recent drilling has failed to find convincing evidence
of the existence of this fault. While a diffuse / gradational ‘break’ in geology can be discerned parallel to the plane of
the previously interpreted Divide Fault, this ‘transition zone’ is likely to represent an interfingering complex intrusive
contact between MSP and IMP, subsequently intruded locally by LSP dykes. Thus, the transition zone is also no longer considered a hard
boundary suitable for constraining resource interpolation. Several other previously modelled faults as described in earlier geological
interpretations of the Whistler Deposit, have also been removed from the current geological model for the Whistler deposit, as their
existence is tenuous and their impact on either controlling or offsetting / juxtaposing mineralization was minor.
A
newly interpreted fault system crosscuts the northern part of the deposit (Figure 6-15): the ‘Rover Fault’ and associated
splays. Fault structures in the deposit are commonly associated with narrow zones of strong to intense sericite, clay, pyrite, and carbonate
alteration. The Rover Faults are interpreted as post-mineral, with vertical displacement.
| Effective Date: September 12, 2024 | Page 50 of 181 |
| | S-K 1300 Technical Summary Report – Whistler Project, Alaska |
| 6.2.3 |
Mineralization:
Raintree West |
The
Raintree West deposit occurs 1,500 m to the east of the Whistler Deposit, just off the nose of Whistler Ridge. It occurs below a thin
veneer of glacial till (5 to 15 m) and hence is not exposed at surface. Outside of the Whistler Deposit, Raintree West is currently the
most advanced deposit in the Whistler Area based on drill metres, with a total of 8,538 m since the original discovery hole drilled by
Geoinformatics in 2008. The discovery drillhole, RN-08-06, targeted an airborne magnetic high anomaly that is coincident with an IP chargeability
high detected on a 2D IP reconnaissance line that crossed the Whistler Area. This hole discovered a significant zone of near surface
(below 5m of till cover) gold-copper porphyry mineralization (160 m grading 0.59 gpt gold, 6.02 gpt silver, 0.10% copper).
Mineralization
at Raintree West occurs as two main types: 1) early, porphyry-style gold-copper mineralization hosted by diorite porphyry stocks and
consisting of quartz and magnetite stockwork veining, with vein and disseminated chalcopyrite associated with potassic alteration, and
2) later cross-cutting silver-gold-lead-zinc mineralization in quartz-carbonate veins (Dbm) that contain pyrite, sphalerite, galena,
and chalcopyrite, with occasional banded epithermal-like textures. The early gold-copper mineralization is best developed within, and
controlled by, early diorite porphyry intrusions (akin to Main Stage Porphyry at the Whistler Deposit), whereas the later silver-gold-lead-zinc
veins surround and locally overprint the porphyry mineralization and are most abundant in the host volcanic rocks in zones of strong
to intense phyllic alteration vertically above and adjacent to the diorite porphyries. In places, 25m to 50m wide diorite porphyry dykes
cut both types of mineralization and are barren (akin to Late-Stage Porphyry at the Whistler Deposit).
Current
drilling at Raintree West has defined two significant zones of gold-copper porphyry mineralization: 1) a near surface zone on the east
side of the Alger Peak fault; and 2) a deep zone on the west side of the fault (Figure 6-17).
The
near surface porphyry gold-copper mineralization is coincident with a northwest-elongate airborne magnetic high anomaly that measures
250 m long and 150 m wide, which pinches to the northwest and southeast. Drilling has only intersected this mineralization on two 100
metre-spaced east-west sections (6,871,350mN and 6,871,450mN). Gold-copper mineralization occurs from the top of bedrock to a maximum
depth of approximately 170 m, where it is either truncated by post-mineral diorite porphyry intrusions or faulting, and has a true width
of approximately 150 m. Gold-copper mineralization is closed to the north, and potentially open to the south, however grade diminishes,
and the airborne magnetic high anomaly pinches out just south of the most southerly hole (WH10-025).
The
deep zone of porphyry gold-copper mineralization on the west side of the fault has a maximum apparent width and vertical extent of 300
by 300 m at its widest (6,871,650N), is open to depth, and occurs at its shallowest at 470 m below surface. This deep zone of mineralization
can be traced along a northwest-trending strike extent for at least 325 m where it appears fault bound to the northwest and is open to
depth to the southeast. The mineralization is essentially blind to the airborne magnetic data and the 3D IP due to the limited depth
penetration of these techniques.
Porphyry
mineralization at Raintree West is essentially like that at the Whistler Deposit with respect to veining and alteration, although Raintree
West is mantled by intensely altered volcanic rocks with epithermal-texture quartz-carbonate veins. These veins (Dbm), interpreted to
have formed in a shallow environment post-dating the main phase of porphyry gold-copper mineralization, may have developed through hydrothermal/thermal
downward collapse onto to earlier formed high temperature porphyry system, contributing base and precious metals to the mantle of volcanic
rocks and porphyry mineralization.
| Effective Date: September 12, 2024 | Page 51 of 181 |
| | S-K 1300 Technical Summary Report – Whistler Project, Alaska |
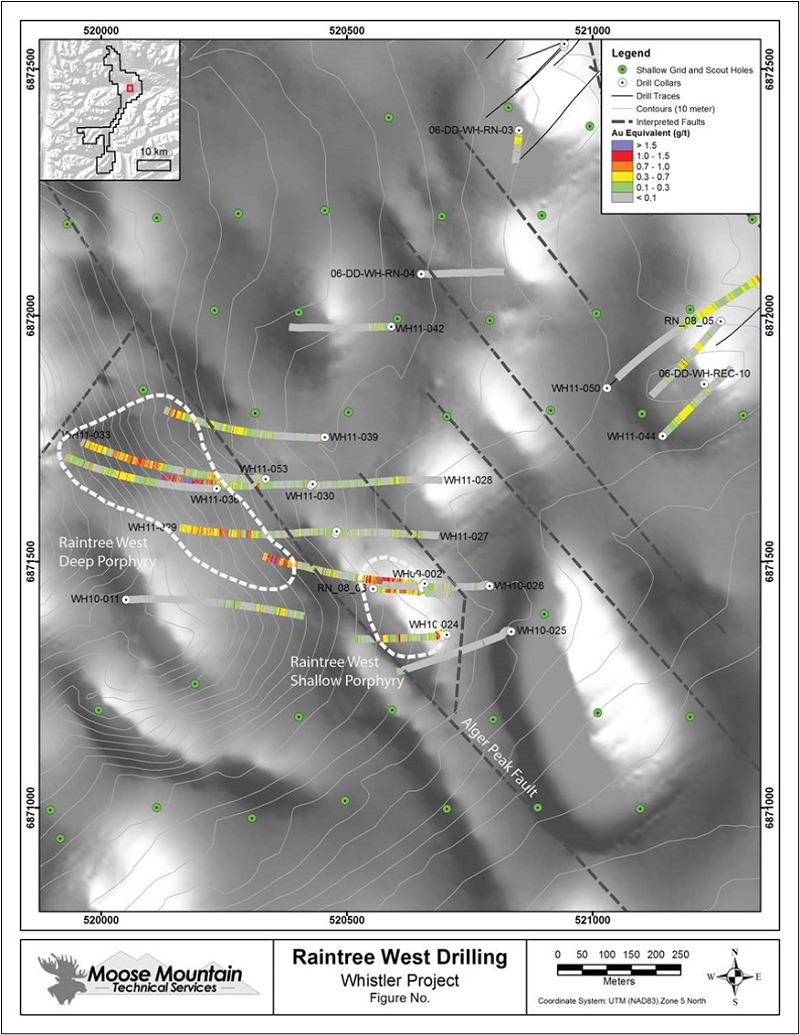
| Figure
6-17 |
Plan
Map of the Raintree West on a Background of greyscale airborne magnetic data, (magnetic high anomalies shown as lighter shades of
grey) |
| Effective Date: September 12, 2024 | Page 52 of 181 |
| | S-K 1300 Technical Summary Report – Whistler Project, Alaska |
| 6.2.4 |
Mineralization:
Island Mountain |
The
Island Mountain deposit area is host to several mineralized zones interpreted to represent a cluster of individual porphyry centres within
this large intrusive complex. These include the Breccia (the “Island Mountain Deposit”), Cirque and Howell Zones, and other
prospects defined by surface geochemistry and geophysical anomalies that require further field assessment. Exploration activity and the
majority of diamond drilling by Kiska have concentrated on mineralization associated within the Breccia Zone on the southwest slope of
Island Mountain. Here, at least three styles of significant gold and copper mineralization are currently recognized: 1) gold-copper mineralization
hosted by k-feldspar altered monzonitic intrusive breccia, 2) gold-copper mineralization hosted by intrusive and hydrothermal breccias
associated with strong sodic-calcic alteration, and 3) gold-only mineralization associated with vein and disseminated pyrrhotite (“pyrrhotite-gold”).
At
the Breccia Zone, the first two styles of mineralization occur within a 300 m diameter, sub-circular, sub-vertical breccia pipe, which
appears to have been a conduit for inter-mingled intrusive and hydrothermal breccias hosted by the Diorite Porphyry. Gold-copper mineralization
hosted by the k-feldspar altered monzonitic intrusive breccia is volumetrically smaller than the subjacent hydrothermal breccias and
is interpreted as being the earliest stage of mineralization, since this breccia body is cut by actinolite veinlets. Mineralization is
associated with trace to 2% disseminated chalcopyrite in the k-feldspar altered intrusive cement of the breccia, as illustrated in Figure
6-18 below.
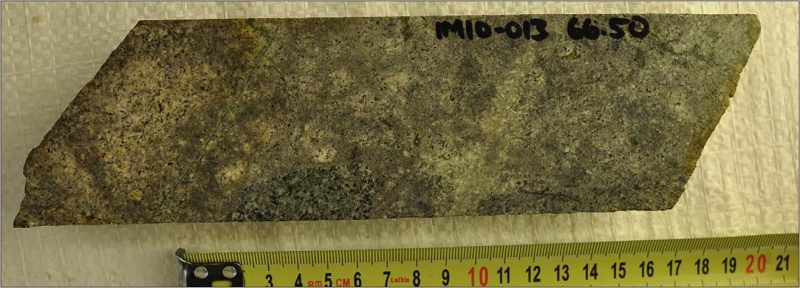
(Source:
MMTS, 2015)
| Figure
6-18 |
Photo
of monzonite-matrix intrusive breccia with patchy albite alteration, silicification and disseminated chalcopyrite |
The
bulk of gold-copper mineralization at the Breccia Zone is hosted by intrusive and hydrothermal breccias with strong sodic-calcic alteration
with pyrrhotite as the predominate sulphide and trace to 1% chalcopyrite. Chalcopyrite is most abundant in the matrix of the hydrothermal
breccias and is commonly intergrown with pyrrhotite and actinolite ± magnetite. Pyrrhotite, ranging from 1 to 5%, occurs as disseminations
within the breccia matrix and as large blebs cementing the matrix as illustrated in Figure 6-19. The deportment of gold in the breccia
zone is not known. Weaker gold-copper mineralization extends 50 - 75 m beyond the breccia zone and is associated with actinolite stockwork
veining.
| Effective Date: September 12, 2024 | Page 53 of 181 |
| | S-K 1300 Technical Summary Report – Whistler Project, Alaska |
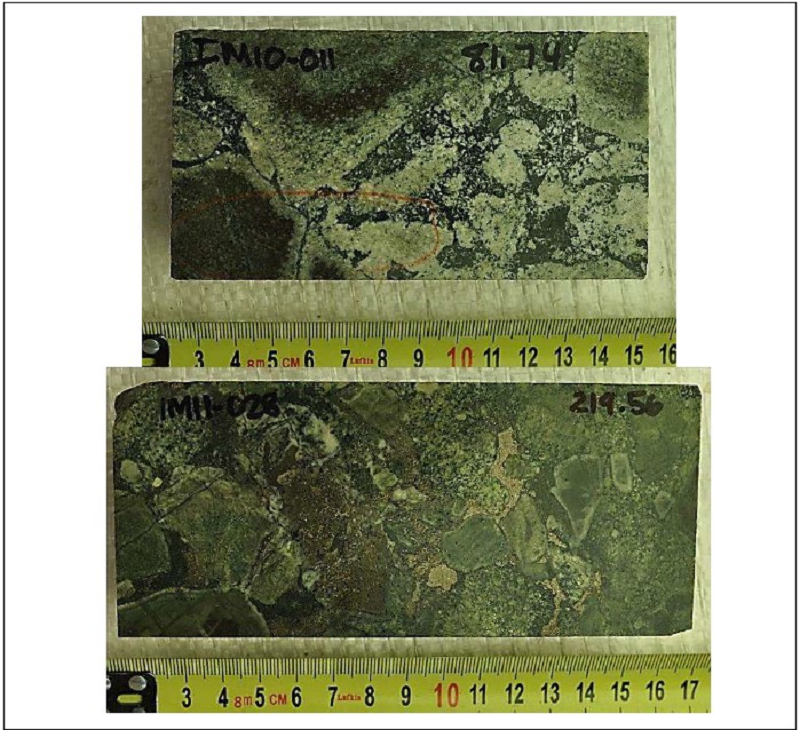
(Source:
MMTS, 2015)
| Figure
6-19 |
Photos
of various textures of actinolite-magnetite hydrothermal breccia (BXMA), showing strong albitization in monomict breccia (upper),
pyrrhotite matrix in polymict breccia (lower) |
Gold-only
mineralization in the Breccia Zone (referred to as “Pyrrhotite-Gold” mineralization) occurs 100 – 200 m peripherally
to the intrusive-hydrothermal breccia body and occurs in association with vein and disseminated pyrrhotite within the Diorite Porphyry.
Pyrrhotite veins occur in irregular, possibly sheeted sets, and are typically 1 - 10 millimetres wide and have pyrrhotite-rich (up to
15 - 20%) net-textured vein selvages (i.e., replacing the igneous matrix of the Diorite Porphyry). Petrography and SEM studies indicate
that gold occurs as electrum intergrown within and marginal to pyrrhotite grains. The orientation and continuity of these veins is currently
undefined.
The
relationship between the breccia-hosted gold-copper mineralization and the pyrrhotite-associated gold-only mineralization is not fully
understood. The current working hypothesis is that the gold-copper and gold-only mineralization are associated with the same hydrothermal
fluid, such that copper was precipitated in the hotter parts of the system within the hydrothermal breccia, and copper-depleted, gold-bearing
fluids persisted into cooler, structural zones beyond the breccia and were subsequently precipitated as illustrated schematically in
Figure 6-20 below (Rowins, 2011).
| Effective Date: September 12, 2024 | Page 54 of 181 |
| | S-K 1300 Technical Summary Report – Whistler Project, Alaska |
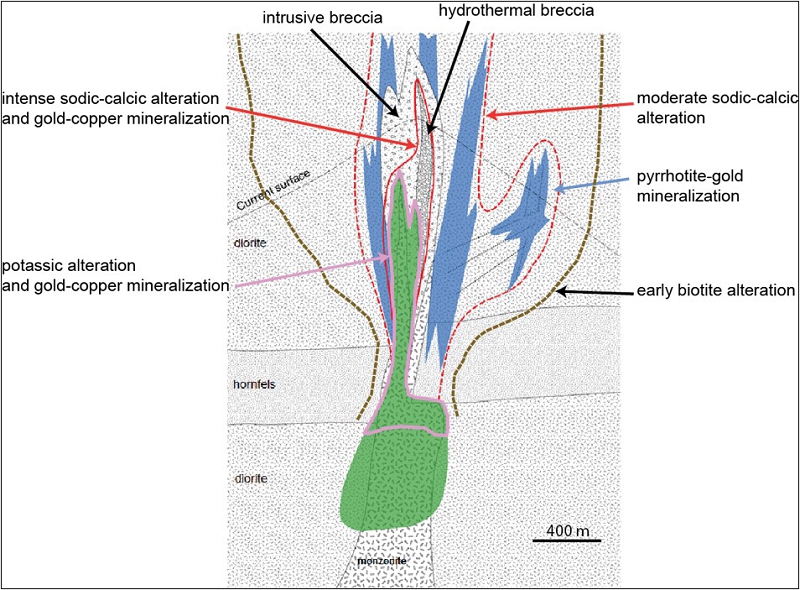
(Source:
Roberts, 2011b)
| Figure
6-20 |
Schematic
Model of Breccia Zone Alteration and Mineralization |
| Effective Date: September 12, 2024 | Page 55 of 181 |
| | S-K 1300 Technical Summary Report – Whistler Project, Alaska |
| 6.2.5 |
Mineralization:
Muddy Creek |
Gold
mineralization at Muddy Creek is hosted throughout the core of the plutonic complex and is controlled by northwest-striking and steeply
southwest-dipping, mm- to locally cm-wide veinlets of sulphides and quartz, manifest as rusty-weathering sub-parallel fracture sets,
commonly spaced a metre or more apart (Figure 6-21). These veinlets may contain any combination of chalcopyrite, arsenopyrite, pyrite,
stibnite, pyrrhotite and native gold, with minor amounts of galena, sphalerite and molybdenite. Moderate sericitic alteration is typically
restricted to cm-wide selvages to these veins, whereas the bulk of the interleaving rock is relatively unaltered and unmineralized. Cone
sheets and circular onion skin-type joints that resemble bubbles or miarolites also carry gold mineralization, and elevated gold and
copper values are also found in cm-scale pegmatites. Coarse- to very coarse-grained feldspar-quartz pegmatite with chalcopyrite and subordinate
molybdenite occur along joint planes and intersections, centered in aplitic dikes and at the cores of circular joint sets or cone sheets.
Lastly, massive sulfide veins occur locally along Muddy Creek in hornfelsed sedimentary wall rock. Previous workers report gold in all
mineralization types to range from ppm to more than 1 oz/t in select samples (Millholland, 1998).
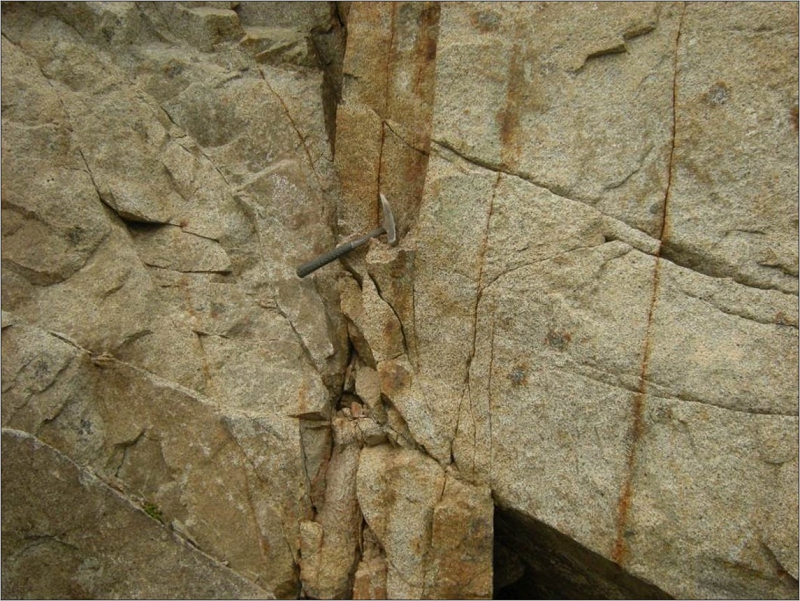
(Source:
MMTS, 2015)
| Figure
6-21 |
Detail
view of Biotite Monzonite Northwest of Muddy Creek, cut by sub-vertical limonite-stained
fracture fillings of chalcopyrite-arsenopyrite ( ~1-3
per metre) |
Accessory
minerals associated with mineralization in veins include vuggy quartz and K-spar, with greatly subordinate ilmenite, tourmaline, apatite,
beryl, and possibly corundum. Unlike most other mineral types of the Whistler region, magnetite is completely absent and the only measurable
magnetism in hand samples is imparted by ilmenite and pyrrhotite.
| Effective Date: September 12, 2024 | Page 56 of 181 |
| | S-K 1300 Technical Summary Report – Whistler Project, Alaska |
Previous
exploration has largely been focused on areas where the vein/fracture density is highest. This includes structural zones near the top
of Discovery Creek, Phoenix Creek, Prospect Creek, and Muddy Creek that occur along the strike extent of a significant northwest-striking
fault zone. Two diamond drillholes drilled by Kiska in 2011 focused on a high-density vein/fracture zone at the top of Prospect Creek.
Here drilling returned a highlight result of 0.44 gpt gold over 44.2 m from 297.0 downhole (MC11-002). True widths on mineralization
in this area may be approximately 80% of drilled widths, yet the full extent of mineralization down-dip or along strike is unknown due
to a lack of drilling.
Exploration
on the Whistler Project by Kennecott, Geoinformatics, Kiska and U.S. GoldMining Inc., has identified three primary exploration targets
for porphyry-style gold-copper deposits. These include the Whistler, Raintree and Island Mountain Deposits. These deposits and their
exploration criteria, conform to the porphyry deposit model as described in Sillitoe (2010). All the porphyry deposits in the Whistler
Area share similar styles of alteration, mineralization, veining and cross-cutting relationships that are generally typical of porphyry
systems associated with relatively oxidized magma series (A- and B-type quartz vein stockwork, chalcopyrite-pyrite ore assemblage, presence
of sulphates, core of potassic alteration with well-developed peripheral phyllic alteration zones). The Whistler area also hosts multiple
additional porphyry-like prospects defined by drilling, anomalous soil samples, alteration, veining, surface rock samples, Induced Polarization
chargeability/resistivity anomalies and airborne magnetic anomalies. These include the Raintree North, Rainmaker, Dagwood, Round Mountain,
Puntilla, Canyon Creek, and Snow Ridge prospects. Thus the Whistler-Raintree area, also known as the ‘Whistler Orbit’, is
considered to be a classic porphyry cluster comprising multiple high-level magmatic apophyses emanating from a common deep causative
batholith.
In
contrast, Island Mountain has significantly different alteration, veining and sulphide assemblages associated with mineralization, principally
the occurrence of pyrrhotite and to a lesser extent arsenopyrite associated with Au-Cu mineralization, Au-Cu association with strong
sodic-calcic alteration, lack of significant sulphates, very minor hydrothermal quartz and weak to insignificant phyllic alteration.
For these reasons, the porphyry system at Island Mountain may belong to the “reduced” subclass of porphyry copper-gold deposits
(see Rowins, 2000).
The
Muddy Creek area represents an additional exploration target with the potential to host a bulk tonnage, Intrusion Related Gold (IRG)
deposit. Previous exploration by Millrock Resources Inc., and more recently by Nova Minerals Ltd., on claims directly adjacent to the
Muddy Creek area, which are geologically analogous, have returned encouraging preliminary results. Like Island Mountain, the Muddy Creek
mineralization is distinct from the Whistler Porphyry systems and shares more similarity with IRG systems characteristic of the Tintina
Gold Belt. The intrusive complex at Muddy Creek is predominantly monzonitic grading to more mafic marginal phases yet is generally more
felsic in composition relative to the diorites of the Whistler Area. Mineralization is restricted to sheeted vein zones with narrow millimetre
scale veinlets and pegmatitic veinlets of quartz, feldspar, tourmaline, and sulphides that include arsenopyrite, minor chalcopyrite and
pyrite-pyrrhotite. Gold mineralization is largely confined to the minute veinlets whereas the intervening intrusive rocks are largely
unaltered and unmineralized.
| Effective Date: September 12, 2024 | Page 57 of 181 |
| | S-K 1300 Technical Summary Report – Whistler Project, Alaska |
A
summary of all exploration work conducted by various operators from 1986 to present is summarized in Table 7-1. Cominco Alaska Inc. is
attributed with the discovery of the Whistler Deposit in 1986. The only exploration activity documented by Cominco for which Kiska has
records are 8.4 line-kilometres of 2D Induced Polarization geophysics over the Whistler Deposit and sixteen diamond drillholes (1,677
m) in the Whistler Deposit.
| Table
7-1 |
Summary
of Exploration on the Whistler Project |
| Operator |
Field
Seasons |
Mapping |
Geophysics |
Rocks |
Soils |
Silts |
| Cominco |
1986-1989 |
n/a |
●
8.4 line-km of 2D IP over the Whistler deposit |
n/a |
n/a |
n/a |
| Kennecott |
2003-2006 |
Property-wide
mapping |
●
39.4 line-km of 2D IP |
1312 |
2446 |
103 |
| |
|
|
●
Property-wide AM (400m line spacing) |
|
|
|
| |
|
|
●
Snow Ridge AM (79 line-km at 200m line spacing) |
|
|
|
| |
|
|
●
Whistler Area AM (1,365 line-km at 50m line spacing) |
|
|
|
| Geoinformatics |
2007-2008 |
Prospect-scale
mapping |
●
8.8 line-km of 2D IP (Whistler area) |
20 |
195 |
nil |
| Kiska |
2009-2011 |
Prospect-scale
mapping |
●
40 line-km of 2D IP (Whistler area, Muddy Creek, Island Mountain)
|
315 |
1425 |
46 |
| |
|
|
●
224 line-km of 3D IP (Whistler area) |
|
|
|
| |
|
|
●
Island Mountain EM (635 line-km at 100m line spacing) |
|
|
|
| U.S.
GoldMining |
2023 |
n/a |
●
Magnetics 3D inversion modelling |
n/a |
na/ |
n/a |
| AM=Airborne
Magnetic survey |
| EM=Airborne
Electro-Magnetic survey |
| IP=Induced
Polarization survey |
The
bulk of the detailed geological mapping and interpretation on the property was undertaken by Kennecott and summarized in a report by
Young (2006). This work laid the foundation for the geological interpretation of porphyry-style mineralization in the Whistler area (including
the Whistler Deposit and the Raintree - Rainmaker deposits), the Breccia Zone at Island Mountain, and Intrusion-Related Au mineralization
in the Muddy Creek area.
An
airborne helicopter geophysical survey was commissioned from Fugro Airborne Surveys (“Fugro”) by Kennecott during 2003. This
survey covered the entire property with a high sensitivity cesium magnetometer and a 256-channel spectrometer.
| Effective Date: September 12, 2024 | Page 58 of 181 |
| | S-K 1300 Technical Summary Report – Whistler Project, Alaska |
Additional
airborne magnetic data were acquired by Kennecott in 2004 over two smaller areas using a helicopter equipped by a Rio Tinto bird operated
by Fugro and a Kennecott geophysicist. One area over the Snow Ridge target was investigated at 200m line spacing (79-line kilometres).
The other grid was flown over the Whistler Deposit and surrounding area using fifty-metre line spacing (1,365-line kilometres).
Results
from these airborne surveys were used by Kennecott to interpret geological contacts, fault structures and potential mineralization in
the Whistler, Island Mountain, and Muddy Creek areas. In particular, the airborne magnetic data showed that the Whistler Deposit displays
a strong 900m by 700m positive magnetic anomaly attributed to the magnetic Whistler Diorite intrusive complex (host to the Whistler Deposit)
in addition to a contribution from secondary magnetite alteration and veining associated with Au-Cu mineralization. This observation
formed that basis for exploration targeting in the Whistler area, particularly those areas covered by a thin veneer of glacial sediments,
such as the Raintree and Rainmaker deposits. These surveys, in addition to 2D Induced Polarization ground geophysical surveys targeted
over airborne magnetic anomalies, were instrumental in the “blind” discovery of the Rainmaker and Raintree deposits by Kennecott
in 2005 and 2006, respectively.
Kiska
commissioned a helicopter borne AeroTEM survey over the Island Mountain area by Aeroquest Airborne in June 2011. The principal geophysical
sensor was an AeroTEM III time domain electromagnetic system, employed in conjunction with a caesium vapour magnetometer. Navigation
was provided by a real-time differential GPS navigation system, plus a radar altimeter and a video recorder mounted in the nose of the
helicopter.
The
survey was flown on east-west flight lines with a spacing of 100 m. Control lines were flown north-south, perpendicular to the survey
lines, with a spacing of 1,000 m. The nominal terrain clearance of the EM bird was 30 m. The magnetometer sensor was mounted in a smaller
bird connected to the tow rope 33 m above the EM bird and 20 m below the helicopter. Nominal survey speed was 75 km/hr., resulting in
a geophysical reading about every 1.5 to 2.5 m along the flight path. The total survey coverage, including tie lines, was 635 km. Mira
Geoscience was subsequently engaged to produce a 3D inversion of the data. The survey was designed to target potential zones of disseminated
and net-textured pyrrhotite mineralization like the pyrrhotite-associated gold-only zone of mineralization on the flanks of the Breccia
Zone. The survey did detect a large 1.5 km long by 1.0 km wide conductivity low anomaly on the southeast side of the Island Mountain
area, referred to as the Super Conductor target. This anomaly was subsequently tested by three drillholes that did suggest that the conductivity
anomaly may be associated with disseminated pyrrhotite mineralization with elevated gold values, yet further drilling is required to
be conclusive and fully test the target.
Cominco
acquired 8.4 line-km of 2D Induced Polarization geophysics from six east-west oriented lines centred over the Whistler Deposit discovery
outcrops. Anomalous results from these lines were used to target the deposit area with subsequent drilling. From 2004 to 2006, Kennecott
completed 39.4 line-km of 2D IP geophysics in the Whistler area. Within this survey, two IP lines were run over the Whistler Deposit
magnetic anomaly and showed that mineralization is coincident with a strong chargeability anomaly. Subsequent lines targeted magnetic
anomalies at the Round Mountain, Canyon Creek, Canyon Ridge, Canyon Mouth, Long Lake Hills, Raintree and Rainmaker deposits. In 2007-2008,
Geoinformatics completed 8.8 line-km of 2D IP from six separate reconnaissance lines in the Whistler area targeting airborne magnetic
highs. Anomalous results from this survey in the Raintree area led to the Raintree West discovery.
| Effective Date: September 12, 2024 | Page 59 of 181 |
| | S-K 1300 Technical Summary Report – Whistler Project, Alaska |
In
2009, Kiska undertook a significant 2D and 3D IP survey over most of the prospective areas in the Whistler, Island Mountain, and Muddy
Creek areas. Kiska commissioned Aurora Geoscience to complete 224 line-km of a 3D Induced Polarization geophysical survey. This was executed
on two grids (Round Mountain; Whistler Area) which were comprised of grid lines ranging from 4 to 9 km long with a line-spacing of 400
m. From November to December 2009, the raw data was delivered to Mira Geoscience for detail data quality control and error analysis prior
to the construction of a 3D inversion model. This survey reaffirmed that the Whistler Deposit is coincident with a discrete 3D chargeability
anomaly and showed that much of the Whistler area contains broad areas of anomalous chargeability (Figure 7-1). In conjunction with the
airborne magnetic data, these zones of anomalous chargeability formed the basis for exploration drilling in the Whistler Area in 2010.
| Effective Date: September 12, 2024 | Page 60 of 181 |
| | S-K 1300 Technical Summary Report – Whistler Project, Alaska |
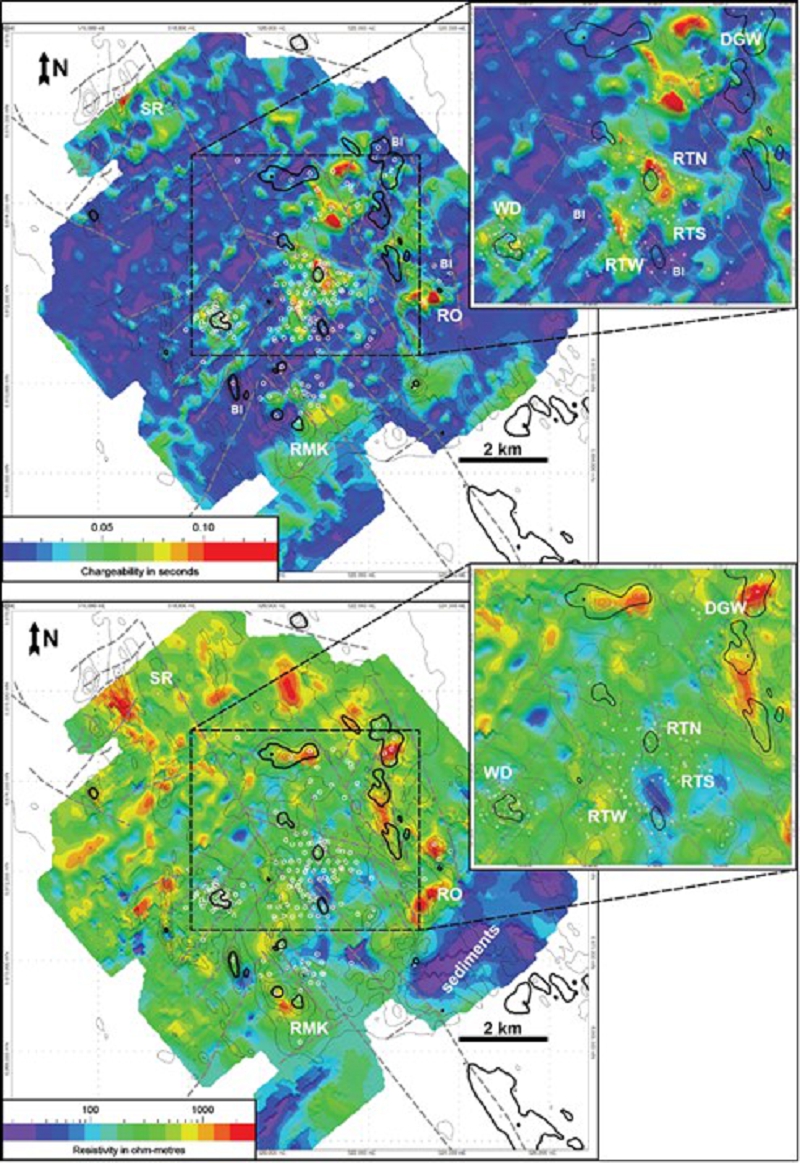
(Source:
Roberts, 2011a)
| Figure
7-1 |
Depth
slices (100m) of the chargeability (top) and resistivity (bottom) inversion model of the 3D IP data in the Whistler Area (with contours
of the 400m line spacing AMAG RTP). WD, Whistler Deposit; RTW, Raintree West; RTN, Raintree North; RTS, Raintree South, DGW, Dagwood;
RMK, Rainmaker |
| Effective Date: September 12, 2024 | Page 61 of 181 |
| | S-K 1300 Technical Summary Report – Whistler Project, Alaska |
In
2009 Kiska commissioned SJ Geophysics to complete 40 line-km of a 2D Induced Polarization geophysical survey. Survey lines were generally
semi-straight reconnaissance-type lines over areas of interest at Alger Peak, Island Mountain, and Muddy Creek. The geophysical survey
was acquired with a pole – dipole 2DIP technique with 100m dipoles.
| 7.4 |
Soil
and Rock Sampling |
From
2004 to 2006 Kennecott collected 1,300 rock samples, close to 2,500 soil samples and 103 stream sediments samples in the Whistler, Island
Mountain, and Muddy Creek areas. Within this program, a soil grid over the Whistler Deposit returned anomalous Au-Cu results coincident
with the magnetic high. Other reconnaissance soil lines in the Whistler area with anomalous Au-Cu results helped to define areas of interest
at the Round Mountain, Canyon Creek, Canyon Ridge, Canyon Mouth, and Long Lake Hills prospects. In addition, soil reconnaissance lines
at Island Mountain led to the Discovery of the Breccia Zone and broad zones of anomalous Au at Muddy Creek. In 2009 and 2010, Kiska collected
1,417 soil samples and 293 rocks samples, which largely confirmed areas of interest in the Whistler, Island Mountain, and Muddy Creek
areas previously defined by Kennecott.
Rock
samples consist of approximately one kilogram of rock collected over a small area surrounding each sampling site using a rock hammer.
The sampling location is located using a handheld GPS unit and marked in the field with a metallic tag. Descriptive information about
the geology of the sample was recorded and aggregated into the project database.
Soil
samples are collected from the surface soils (generally the B-horizon) by extracting approximately one kilogram of soil into a plastic
bag usually with a hand auger. Each sampling site is located using a GPS unit. Descriptive information such sampling depth and physical
attributes are recorded and aggregated into the project database. Typically, field duplicates are collected at a rate of one every twenty
samples.
Soil
samples were collected along traverses as part of multi-kilometre reconnaissance programs, generally at 100 metre spacing. In two areas
(Whistler Deposit and Snow Ridge), samples were collected at a more regular 100 metre grid spacing. This area is illustrated in Figure
7-2 with the whistler-Rainmaker terrain shown in Figure 7-3.
| Effective Date: September 12, 2024 | Page 62 of 181 |
| | S-K 1300 Technical Summary Report – Whistler Project, Alaska |
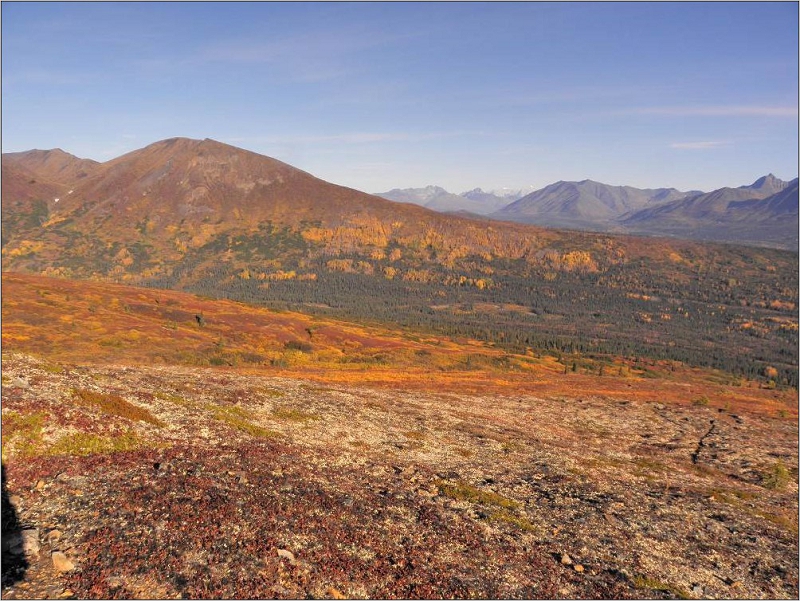
(Source:
MMTS, 2015)
| Figure
7-2 |
From
the Whistler Area looking North to the Snow Ridge Area |
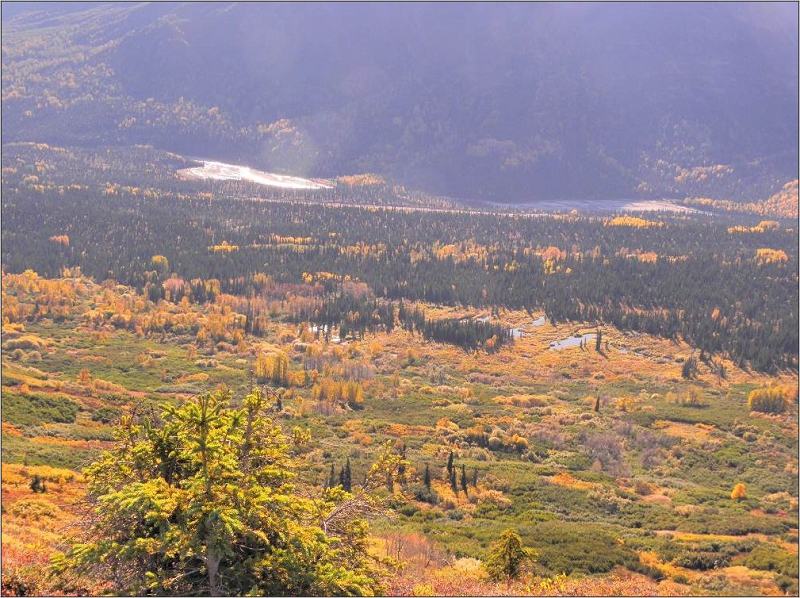
(Source:
MMTS, 2015)
| Figure
7-3 |
From
the Whistler Area looking South to the Rainmaker Area |
| Effective Date: September 12, 2024 | Page 63 of 181 |
| | S-K 1300 Technical Summary Report – Whistler Project, Alaska |
A
total of 71,880 m of diamond drilling in 260 holes are documented in the Whistler database for drilling on the Whistler Project by Cominco,
Kennecott, Geoinformatics, and Kiska from 1986 to the end of 2023. A summary of the drilling is shown in Table 7-2. Of these drillholes
23,334 m in 53 holes have been drilled in the Whistler Deposit area, 5,190 m in 58 holes have been drilled in the Raintree area, and
15,572 m in 40 holes comprise the Island Mountain resource area. There are 29,385 m in 110 holes in areas outside the three resource
areas.
| Table
7-2 |
Summary
of Diamond Drilling on the Whistler Project |
| Operator |
Year |
Whistler |
Raintree |
Island
Mountain |
Outside
Resource Areas |
Total |
| No.
Holes |
Length
(m) |
No.
Holes |
Length
(m) |
No.
Holes |
Length
(m) |
No.
Holes |
Length
(m) |
No.
Holes |
Length
(m) |
| Cominco |
1986-1989
|
16 |
1,677 |
0 |
0 |
0 |
0 |
0 |
0 |
16 |
1,677 |
| Kennecott |
2004
|
5 |
1,997 |
0 |
0 |
0 |
0 |
1 |
310 |
6 |
2,307 |
| 2005
|
9 |
5,251 |
0 |
0 |
0 |
0 |
9 |
1,692 |
18 |
6,943 |
| 2006
|
1 |
705 |
4 |
1,115 |
0 |
0 |
6 |
1,378 |
11 |
3,198 |
| Kennecott
Sub-Total |
31 |
9,630 |
4 |
1,115 |
0 |
0 |
16 |
3,380 |
51 |
14,125 |
| Geoinformatics |
2007
|
7 |
3,321 |
0 |
0 |
0 |
0 |
0 |
0 |
7 |
3,321 |
| 2008
|
5 |
2,462 |
2 |
622 |
0 |
0 |
4 |
1,219 |
11 |
4,303 |
| Geoinformatics
Sub-Total |
12 |
5,783 |
2 |
622 |
0 |
0 |
4 |
1,219 |
18 |
7,624 |
| Kiska |
2009
|
0 |
0 |
0 |
0 |
2 |
601 |
3 |
917 |
5 |
1,518 |
| 2010
|
7 |
5,247 |
0 |
0 |
12 |
5,434 |
17 |
5,993 |
36 |
16,674 |
| 2011
|
0 |
0 |
52 |
3,453 |
26 |
9,537 |
69 |
17,315 |
147 |
30,305 |
| Kiska
Sub-Total |
7 |
5,247 |
52 |
3,453 |
40 |
15,572 |
89 |
24,225 |
188 |
48,497 |
| U.S.
GoldMining |
2023
|
3 |
1,674 |
0 |
0 |
0 |
0 |
1 |
561 |
4 |
2,234 |
| USGO
Sub-Total |
3 |
1,674 |
0 |
0 |
0 |
0 |
1 |
561 |
4 |
2,234 |
| Total |
53 |
22,334 |
58 |
5,190 |
40 |
15,572 |
110 |
29,385 |
261 |
72,480 |
Figure
7-4 through Figure 7-6 are plan views of each deposit illustrating the drillholes by Year / Owner for Whistler, Raintree, and Island
Mountain respectively. The resource pit outline is shown in black on all Figure s, with the underground resource confining shape in grey
for the Raintree deposit.
| Effective Date: September 12, 2024 | Page 64 of 181 |
| | S-K 1300 Technical Summary Report – Whistler Project, Alaska |
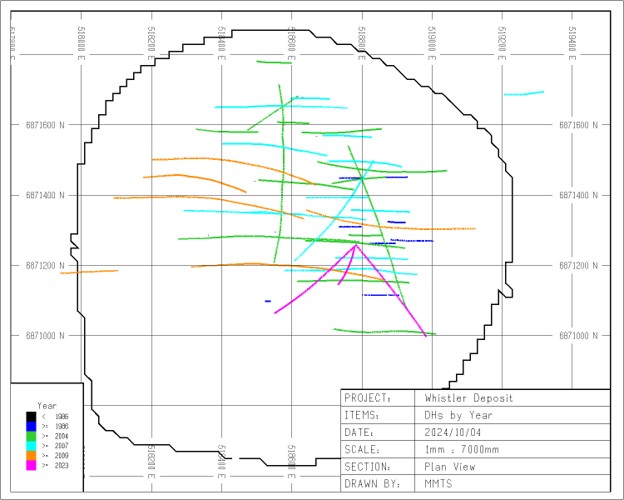
| Figure
7-4 |
Plan
View of Drillholes by Year/Owner – Whistler |
| Effective Date: September 12, 2024 | Page 65 of 181 |
| | S-K 1300 Technical Summary Report – Whistler Project, Alaska |
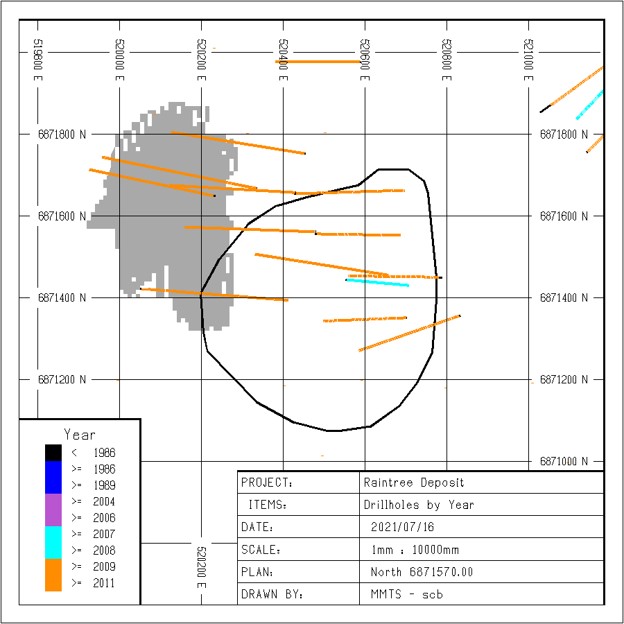
| Figure
7-5 |
Plan
View of Drillholes by Year/Owner – Raintree |
| Effective Date: September 12, 2024 | Page 66 of 181 |
| | S-K 1300 Technical Summary Report – Whistler Project, Alaska |
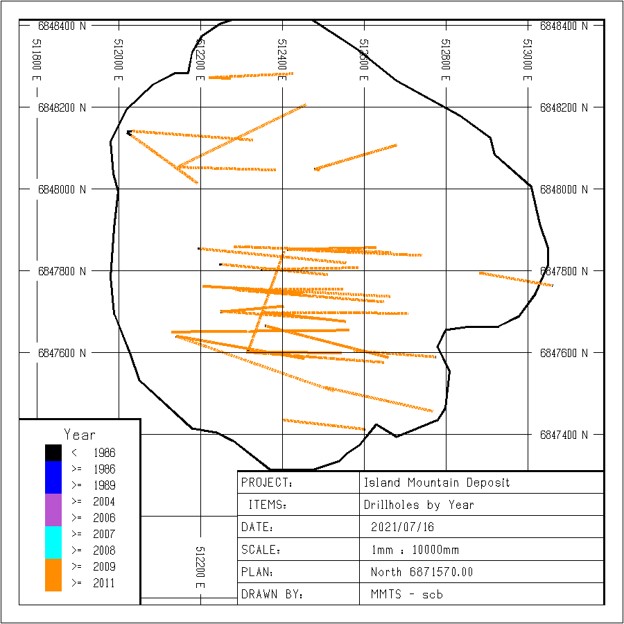
| Figure
7-6 |
Plan
View of Drillholes by Year/Owner – Island Mountain |
| 7.6 |
Drilling
by Cominco Alaska Inc. |
Partial
records documenting the sixteen shallow core boreholes (1,677 m) drilled by Cominco on the Whistler gold-copper deposit in 1988 and 1989
including descriptions of the core, drilling logs and assay results are described by Couture, 2007.
Kennecott
resurveyed the locations of several holes using either a handheld GPS or with a Trimble ProXr receiver providing real-time sub-metre
accuracy. Three holes were unable to be located. The core from the Cominco holes was reportedly donated to the State of Alaska in 1990
and may be stored at a core library in Eagle River, Alaska (Couture, 2007).
| Effective Date: September 12, 2024 | Page 67 of 181 |
| | S-K 1300 Technical Summary Report – Whistler Project, Alaska |
| 7.7 |
Drilling
by Kennecott |
Between
2004 and 2006, Kennecott drilled a total of 31 core holes (9,630 m) on the Whistler Project, with fifteen of those core holes (7,953
m) intersecting the Whistler Deposit. The Kennecott core is partly stored at the site camp with some in a secured warehouse in Wasilla,
Alaska. Drilling operations were conducted by NANA-Dynatec and NANA-Major drilling out of Salt Lake City, Utah using up to three drill
rigs supported by helicopter. Core size was HQ-diameter in 2004 and subsequently NQ in 2005 and 2006 (Couture, 2007).
Drilling
was documented by Kennecott personnel. The collar position of each borehole was laid out with a hand GPS unit, while azimuth and inclination
were determined with a compass. Individual collars were subsequently surveyed using a Trimble ProXr receiver providing real-time sub-metre
accuracy. Flex It Multi-shot readings at twenty-foot (six metre) intervals were taken to monitor downhole deviation. Magnetic susceptibility
and gravity data were also recorded. Drilling, logging, and sampling were directly supervised by a suitably qualified geologist. Core
retrieved from drilling was oriented using EzMark or an ACE device. All casing was pulled after drilling. Core recovery, geotechnical
point load test, and rock quality determination were collected before the geologist recorded detailed information about lithology, mineralogy,
alteration, vein density, and structure. All recorded descriptive data were entered into an acQuire database (Couture, 2007).
Twenty
drillholes (4,746 m) were drilled by Kennecott to investigate exploration targets outside the Whistler deposit. Targets selected for
drilling were typically chosen based on a combination of geology, geochemical and geophysical criteria believed to be indicative of magmatic
hydrothermal processes. Selected targets were explored with vertical or angled drillholes to validate the geological model. One or more
boreholes were drilled with the intent to identify the potassic core of a magmatic hydrothermal system known to be associated with better
copper and gold sulphide mineralization in this area (Couture, 2007).
| 7.8 |
Drilling
by Geoinformatics |
In
2007 and 2008, Geoinformatics drilled twelve holes totaling 5,784 m on the Whistler Deposit, two holes of 622 m at Raintree and 4 holes
totaling 1,219 m on other exploration targets in the Whistler project area. Geoinformatics used the same drilling contractor and drilling
procedures as previously Kennecott except that oriented core was not obtained. Exploration drilling by Geoinformatics in the Whistler
area targeted geophysical anomalies in the Raintree and Rainmaker areas, using the same basic porphyry exploration model as Kennecott
(Roberts, 2011a).
During
the 2009-2011 Kiska drilling campaigns, diamond drilling was performed by Quest America Drilling and Falcon Drilling Ltd. and supervised
by geological staff from Kiska. Drilling was performed by helicopter-portable diamond drill rigs. Drillholes were collared with HQ diameter
tools (6.35 cm) and reduced to NQ diameter tools (4.76 cm) when the rig reached the depth capacity of the HQ equipment. Collar locations
were determined with hand-held GPS devices by Kiska staff. Downhole surveys for all holes were conducted by the drill contractor at 60
m intervals down-hole using a Reflex EZ Shot down-hole camera (Roberts, 2011a).
| Effective Date: September 12, 2024 | Page 68 of 181 |
| | S-K 1300 Technical Summary Report – Whistler Project, Alaska |
During
the 2009-2011 Kiska drilling campaign a total of 188 diamond drillholes were completed for a total of 48,498 m. All drillholes were logged
by Kiska geologists at the core logging facility at the Whistler exploration camp. Logged geological information included lithology type,
alteration type and intensity, vein types, percent vein volume and vein orientations (to core axis), structures (to core axis), the percent
of sulphides and oxides, and magnetic susceptibility at meter intervals. Geotechnical information logged included core recovery and rock
quality designation (RQD). All logging data was entered on paper logging forms in 2009 and transcribed digitally info LogChief software
in 2010 and 2011 (Roberts, 2011a).
A
total of 8 holes totaling 5,475 m were drilled on the Whistler Deposit by Kiska. These holes were targeted to in-fill gaps from the previous
drill campaigns and to test the edges and depth of the intrusive complex that hosts the deposit.
The
Raintree deposit is located 1,800 m to the east of the Whistler Deposit in the area formerly called Raintree West, just off the nose
of Whistler Ridge. The discovery drillhole, RN-08-06, targeted an airborne magnetic high anomaly that is coincident with an IP chargeability
high anomaly detected on a 2D IP reconnaissance line that crossed the Whistler Area. This hole discovered a significant zone of near
surface (below 5 m to 15 m of till cover) gold-copper porphyry mineralization (160 m grading 0.59 gpt gold, 6.02 gpt silver, 0.10% copper).
Kiska expanded on this discovery in 2009 with a scissor hole drilled on the same section as RN-08-06 (WH09-02). This was successful at
duplicating the gold-copper mineralization zone in RN-08-06, and identified a second, deeper zone of porphyry mineralization on the west
side of the Alger Peak fault zone. In 2010, Kiska followed up with an additional four drillholes, and in 2011 further tested the shallow
zone and the deep zone with a total of eight holes for a total of 5,997 m. The majority of drillholes in Raintree were drilled on east-west
sections with section spacing of 100 m.
| 7.9.3 |
Whistler
Area Exploration Drilling |
A
total of 133 exploration holes for 27,464 m of drilling in the Whistler area were completed by Kiska in 2009-2011. A majority of these
holes were drilled in the area that includes much of the broad valley floor to the north, east and south of the Whistler Ridge, that
includes the parts of the Raintree and Rainmaker prospect areas (Figure 7-7). Targeting for this drilling program was developed by a
technical team comprised of Kiska and Kennecott geologists based on blind geophysical targets heavily weighted by the results of the
2009 3D IP survey (chargeability and resistivity anomalies), airborne magnetic anomalies, anomaly size, and proximity to areas of known
mineralization or anomalous surface geochemistry. A majority of these holes intersected andesitic volcanic rocks with moderate to strong
sericite-clay-pyrite alteration and occasional sphalerite- and galena-bearing quartz-carbonate veins with banded and colliform epithermal-like
textures. The holes were spaced on average greater than 500 m apart and alteration and veining indicate that broad areas in the Whistler
Area define the upper, cooler margins of a large porphyry-related hydrothermal system or a cluster of smaller, coalescing porphyry-related
hydrothermal systems. Within this broad area, drilling returned Whistler-like, porphyry-style Au-Cu mineralization with significant intercepts
at the Raintree, Raintree North, and the Rainmaker deposits, and anomalous alteration and geochemistry at the Dagwood prospect.
| Effective Date: September 12, 2024 | Page 69 of 181 |
| | S-K 1300 Technical Summary Report – Whistler Project, Alaska |
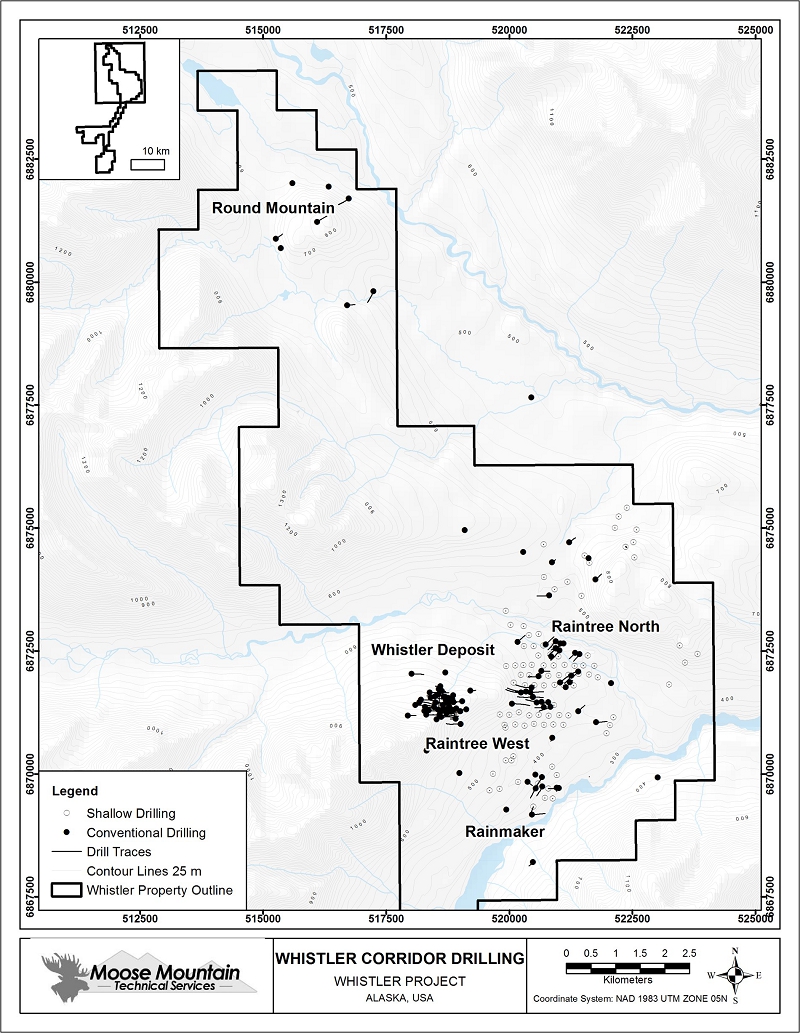
| Figure
7-7 |
Whistler
Area Drilling |
| Effective Date: September 12, 2024 | Page 70 of 181 |
| | S-K 1300 Technical Summary Report – Whistler Project, Alaska |
| 7.9.4 |
Island
Mountain Drilling |
The
35 out of 42 holes completed by Kiska in the Island Mountain area between 2009 and 2011 targeted the Breccia Zone. The remainder targeted
zones of either anomalous surface rock geochemistry and alteration (Cirque Zone) or geophysical anomalies (Super Conductor). Significant
results were only returned from the Breccia Zone and are summarized below. The alteration patterns and geochemical pathfinder elements
from the other areas may be useful for future drill targeting.
At
the Island Mountain Deposit, drilling included in the resource estimate includes 36 drillholes for 14,410 m of drilling. The majority
of these holes were completed on seven east-west cross-sections spaced 50 m apart in a 300 square metre area from 6,847,600N to 6,847,900N
(Figure 7-8). The lithologies, alteration and mineralization of the breccia-related mineralization indicate that the magmatic-hydrothermal
breccia complex defines an irregular pipe-shaped body approximately 300 m by 300 m in plan which from the surface down 500 m. Like the
strike of the faults in the area, this breccia complex is sub-vertical and appears to trend in a northwest-southeast orientation (Roberts,
2011a).
| 7.10 |
Drilling
by U.S. GoldMining Inc. |
A
total of 3 holes totaling 1,373.66 m were drilled on the Whistler Deposit by U.S. GoldMining in 2023. These holes were targeted to in-fill
gaps from the previous drill campaigns and to test potential extensions of mineralization on the southern margin of the Whistler deposit.
| 7.10.1 |
Whistler
Area Exploration Drilling |
One
exploration hole to 560 m depth was drilled at the Rainmaker South target 2023. The hole intersected late-stage porphyry throughout.
| Effective Date: September 12, 2024 | Page 71 of 181 |
| | S-K 1300 Technical Summary Report – Whistler Project, Alaska |
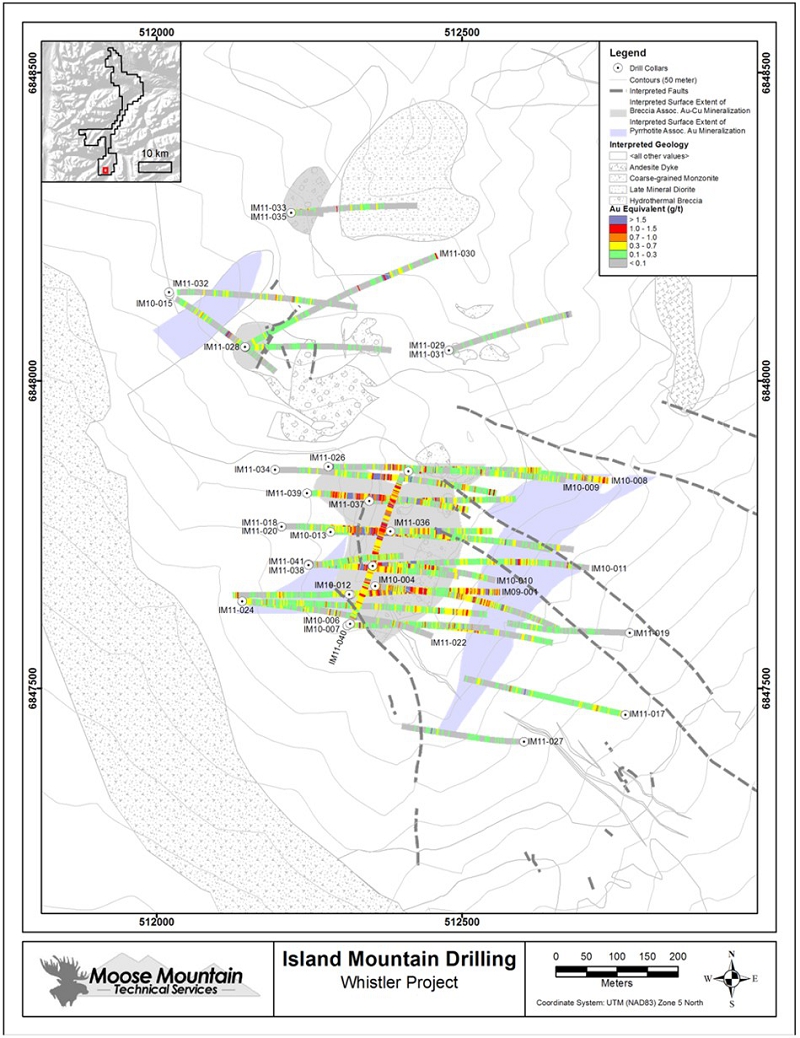
| Figure
7-8 |
Plan
Map of Drillholes and Mineralization Style at the Breccia Zone |
| Effective Date: September 12, 2024 | Page 72 of 181 |
| | S-K 1300 Technical Summary Report – Whistler Project, Alaska |
Surface
mapping, soil geochemistry and drilling has defined other distinct breccia bodies with zones of alteration, surface anomalism and significant
mineralization up to 700 m to the north - northwest of this breccia complex. Significant zones of mineralization are shown in Table 7-3.
| Table
7-3 |
Examples
of Significant Drill Results North of the Island Mountain Deposit |
| Hole |
From
(m) |
To
(m) |
Interval
(m) |
Au
(g/t) |
Ag
(g/t) |
Cu
(%) |
| IM10-015 |
74.3 |
111.0 |
36.7 |
0.27 |
0.37 |
0.01 |
| and |
166.8 |
212.9 |
46.1 |
1.19 |
0.53 |
0.01 |
| Including |
168.5 |
182.2 |
13.7 |
3.69 |
0.56 |
0.01 |
| and |
274.0 |
276.0 |
2.0 |
10.5 |
2.30 |
0.04 |
| IM11-030 |
20.0 |
63.0 |
43.0 |
0.32 |
1.12 |
0.03 |
| and |
364.1 |
438.0 |
73.9 |
0.72 |
2.24 |
0.09 |
| including |
364.1 |
390.0 |
25.9 |
1.79 |
5.05 |
0.09 |
| IM11-032 |
104.0 |
137.0 |
33.0 |
0.21 |
0.62 |
0.02 |
| and |
246.0 |
300.0 |
54.0 |
0.29 |
0.28 |
0.01 |
| IM11-033 |
2.8 |
58.0 |
55.2 |
0.41 |
1.54 |
0.03 |
| including |
2.8 |
42.0 |
39.2 |
0.56 |
1.18 |
0.02 |
| IM11-035 |
3.0 |
44.0 |
41.0 |
0.44 |
2.19 |
0.03 |
| Effective Date: September 12, 2024 | Page 73 of 181 |
| | S-K 1300 Technical Summary Report – Whistler Project, Alaska |
| 8 |
SAMPLE
PREPARATION, ANALYSES, AND SECURITY |
This
section provides an overview of the sample preparation, analyses and security procedures used by the pre-U.S. GoldMining /GoldMining
operators of the Whistler Project. This section summarizes the verification work and practices employed by each of these operators for
which records are available. The independent Qualified Person (QP) responsible for Section 8 of this report, Sue Bird, P. Eng., believes
that these practices are consistent with industry standards and sufficient for their use in mineral resource estimation as detailed herein.
| 8.1 |
Sample
Preparation and Analyses |
| 8.1.1 |
Sample
Preparation and Analysis -Cominco |
There
is no available documentation that describes the sampling used by Cominco. The core is not available for data verification. The sample
preparation and analytical procedures used by Cominco are not known. Core samples were assayed for gold, silver, and copper and occasionally
for a suite of eight other metals (arsenic, cobalt, iron, manganese, molybdenum, nickel, strontium, and zinc) at an unknown laboratory.
No certificates of these analyses are available. It is unknown if quality control samples were inserted into the sampling stream, if
they were, no records of these samples were available.
| 8.1.2 |
Sample
Preparation and Analysis – Kennecott and Geoinformatics |
Sample
preparation protocols for drilling programs on the Whistler project documenting procedures describing all aspects of the field sampling
and sample description process, handling of samples, and preparation for dispatch to the assay laboratory, were initially developed by
Kennecott and subsequently adopted by Geoinformatics (SRK, 2007).
All
soil, rock chips, core, and stream sediments samples were organized into batches of samples of the same type for submission to Alaska
Assay Laboratories Inc. in Fairbanks, Alaska (AAL) for preparation using standard preparation procedures. The AAL laboratory is part
of the Alfred H. Knight group, an established international independent weighing, sampling, and analysis service company (SRK, 2007).
Kennecott
used two primary independent laboratories for assaying samples prepared by AAL. The samples collected during 2004 were assayed at AAL,
however, all prepared pulps collected in 2005 and 2006 were submitted to ALS-Chemex Laboratory in Vancouver, British Columbia for assaying.
The ALS Chemex Vancouver laboratory is accredited to ISO 17025 by the Standards Council of Canada and participates in a number of international
proficiency tests, such as those managed by CANMET and Geostats (SRK, 2007).
It
is reported (SRK, 2007) that Kennecott used two secondary laboratories for check assaying. ALS-Chemex re-assayed 191 pulp samples from
the 2004 sampling programs, and Acme Analytical Laboratories Ltd. of Vancouver, British Columbia (“Acme”) was used as a secondary
laboratory in 2005 and 2006. Acme (now Bureau Veritas) is an ISO 17025 accredited laboratory.
Core
samples were prepared for assaying using industry standard procedures. Splits of 500 g of coarsely crushed core samples were pulverized
to ninety percent passing a -200-mesh screen. Splits of 250 g samples were pulverized to eighty-five percent passing a -150-mesh screen.
In 2004, 30 g pulp samples were assayed by Alaska Assay Laboratories in Fairbanks for gold by fire assay with atomic absorption finish
(AA), and for a suite of nine metals by aqua regia digestion with inductively coupled plasma (ICP). Core and rock samples collected after
2004 were assayed by ALS-Chemex for gold by fire assay with AA finish on thirty-gram sub-samples and for a suite of thirty-four elements
(including copper and silver) by aqua regia digestion and ICP-AES on 0.5 g sub-samples. Elements exceeding concentration limits of ICP-AES
were re-assayed by single element aqua regia digestion and atomic absorption spectrometry (SRK, 2007).
| Effective Date: September 12, 2024 | Page 74 of 181 |
| | S-K 1300 Technical Summary Report – Whistler Project, Alaska |
Kennecott
included quality control (QAQC) samples with all samples submitted for assaying. Each batch of twenty core samples submitted for assaying
contained one sample blank, one of three project specific certified reference materials (CRMs), a field duplicate and a coarse crushed
duplicate. These QAQC samples were inserted blind to the assay laboratory except for the coarsely crushed sample duplicates that were
inserted by the preparation laboratory (SRK, 2007).
Geoinformatics
used the sample preparation and assaying protocols, and quality control measures developed by Kennecott. All samples collected by Geoinformatics
were submitted to Alaska Assay Laboratories for preparation. Pulps were submitted to ALS-Chemex by the preparation laboratory for assaying
using the same tests described previously (SRK 2008).
Two
sample blank materials were collected locally by Kennecott. An andesite rock (OPPBLK-1) collected on outcrop (522,399 m east and 6874,144
m north; NAD27, zone 5) and porphyritic andesite (WP-BLK-1) intersected in borehole 04-DD-WP-01 (SRK, 2007)
For
the Whistler Project, Kennecott fabricated three in house CRMs (WPCO1, WP-MG1 and WP-HG1; from coarse rejects from two boreholes drilled
at Whistler (WP04-04-17 and WH04-01-17) that were used through 2010. Coarse rejects from core samples were selected to create three composite
samples yielding low, medium and high copper and gold values. Each composite sample was prepared at AAL to yield homogenized pulverized
samples for inclusion in the sample stream. Five samples of each standard were then submitted to five commercial laboratories for round-robin
assaying. Each standard sample was assayed twice at each laboratory yielding fifty assay results that were analyzed to determine the
expected values and standard deviation for QAQC analysis (Franklin, et al 2006).
| 8.1.3 |
Sample
Preparation and Analysis – Kiska |
Kiska
geologists marked out samples for assay after logging the drill core, typically 2m to 3m in length, honoring lithological and alteration
contacts. In general, the drillholes were sampled top to bottom, excepting holes that were partially sampled due to a lack of significant
mineralization. After the sample tags were inserted into the core boxes, the core was photographed wet and dry before being cut in half
with a diamond saw. One half was submitted for assay, one half was retained (Roberts, 2011a).
In
2009, Kiska used AAL in Fairbanks as the primary assay lab but switched to ALS-Chemex for the 2010 and 2011 drilling, both laboratories
were independent of Kiska. At AAL samples were dried then crushed to 70% passing 10 mesh, a 250 g split was pulverized to 90% passing
150mesh. A 30-element suite was conducted by three-acid digestion with ICP-AES and gold was analyzed using 30 g samples by fire assay
with AAS finish (Roberts, 2011a).
At
ALS Chemex samples were crushed to 70% passing 2 mm, split, and pulverized to 85% passing 75µm. Gold was analyzed with a 30 g sample
by fire assay with AA finish, 33 element analysis and ore grade were done with four-acid digestion on ICP-AES finish.
| Effective Date: September 12, 2024 | Page 75 of 181 |
| | S-K 1300 Technical Summary Report – Whistler Project, Alaska |
Kiska
included QAQC samples at the rate of one CRM, one blank, and one field duplicate (quarter core) in each batch of 20 samples which were
blind to the laboratory. CRMs purchased from Ore Research & Exploration and silica sand was used for blanks. A sample tag was included
for a lab duplicate. (Roberts, 2011).
| 8.1.4 |
Sample
Preparation and Analysis – US GoldMining |
For
the Whistler Project drill core sampling program in 2023, samples were taken from the NQ/HQ core by sawing the drill core in half, with
one-half sent to Bureau Veritas Commodities Canada Ltd. (“BV”) in Fairbanks for sample preparation, then to BV’s analytical
laboratory in Vancouver, Canada for assaying, and the other half of the core is retained at the site for future reference. Sample lengths
downhole were generally 2.0 m, except where samples were taken to honor geological contacts.
BV
is a certified commercial laboratory and is independent of U.S. GoldMining. The Company has implemented a quality assurance and quality
control program for the sampling and analysis of drill core samples, including duplicates, mineralized standards and blank samples for
each batch of core samples. The gold analyses were completed by lead collection fire assay fusion with AAS finish (FA430 method) on 30
grams test weight. Copper, silver and other base metals (total suite of 45 elements) assays were assayed by 4-acid digestion and ICP-MS
analysis (MA200 method) on 0.25 grams test weight.
| 8.2 |
Security
and Chain of Custody |
Kennecott
devised a documented chain of custody procedure to monitor and track all sample shipments departing the base camp until the final delivery
of the pulp to the assaying laboratory. Geoinformatics is reported to have adopted all procedures developed by Kennecott. These procedures
included the use of security seals on containers used to ship samples, detailed work, and shipping orders. Each transfer point was recorded
on the chain of custody form up to the final delivery of the pulp to the assay laboratory (SRK, 2007).
Kiska
used rice bags closed with security tags to contain the samples for submission as shown in Figure 8-1. The bags were loaded onto Regal
Air flights direct to Anchorage and met by an Alaska Minerals representative who delivered them initially to Lynden transport to be shipped
to the ALS preparation lab in Fairbanks, AK, or later directly to the ALS preparation lab Anchorage, AK. Prepared pulp samples were shipped
to the ALS lab in North Vancouver for assay. Chain of custody tracking was documented on the form shown in Figure 8-2 (Roberts, 2011).
Following
core processing, U.S. GoldMining’s samples were bagged and tagged into separate bags and securely sealed with a zip tie. Samples
were bagged in groups of approximately five samples (with a maximum weight of 50 lbs. per rice bag) and placed into a rice bag sealed
with a security tag. Once finalized, sealed rice bags were put into bulk bags and shipped to Anchorage, Alaska, in batches of up to 100
samples. Sample were backhauled to Anchorage by Desert Air or Regal Air. If samples were shipped by Regal Air, Alaska Minerals Inc. received
the samples and transported them to the Desert Air hanger. The samples were securely stored at Desert Air’s hanger until being
picked up by Carlisle Transportation to be shipped to Bureau Veritas in Fairbanks, Alaska, for sample preparation. Chain of custody documents
with security tag and sample numbers are checked by the Bureau Veritas laboratory management in Fairbanks upon arrival. Upon confirmation
of the security tag and sample numbers, the chain of custody documents is signed by the Bureau Veritas Fairbanks lab manager and sent
back to site management prior to the beginning of sample preparation at the laboratory. An example of the chain of custody tracking documents
is shown in Figure 8-3 below. After sample preparation in Bureau Veritas Fairbanks, samples were shipped by Bureau Veritas Fairbanks
to Bureau Veritas Vancouver for analysis.
| Effective Date: September 12, 2024 | Page 76 of 181 |
| | S-K 1300 Technical Summary Report – Whistler Project, Alaska |
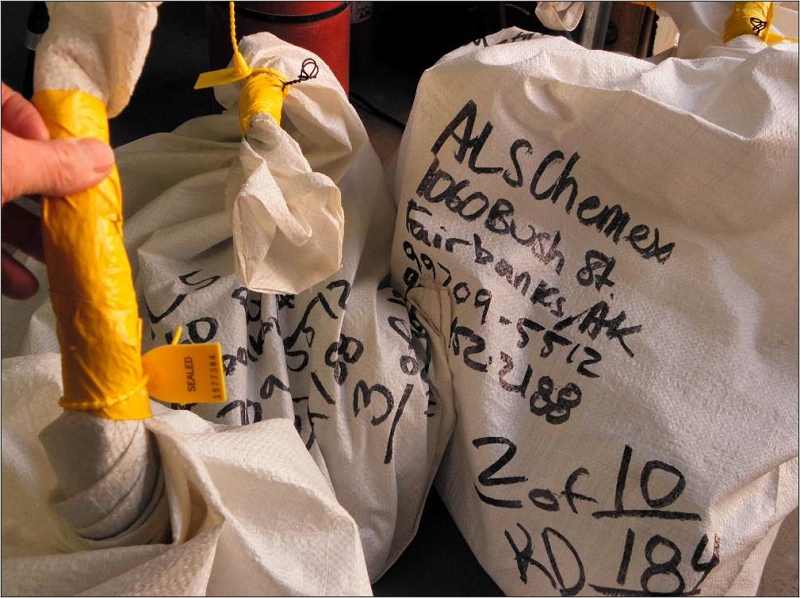
(Source:
Roberts, 2011a)
| Figure
8-1 |
Sample
Bags with Security Tags |
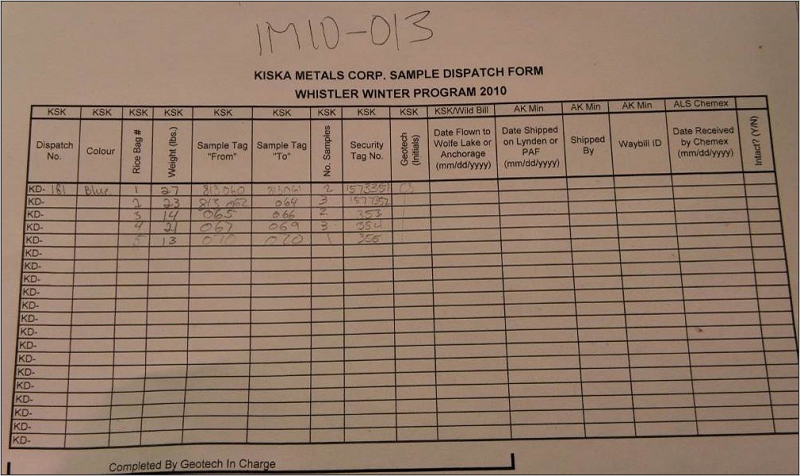
(Source:
Roberts, 2011a)
| Figure
8-2 |
Sample
Dispatch Form |
| Effective Date: September 12, 2024 | Page 77 of 181 |
| | S-K 1300 Technical Summary Report – Whistler Project, Alaska |
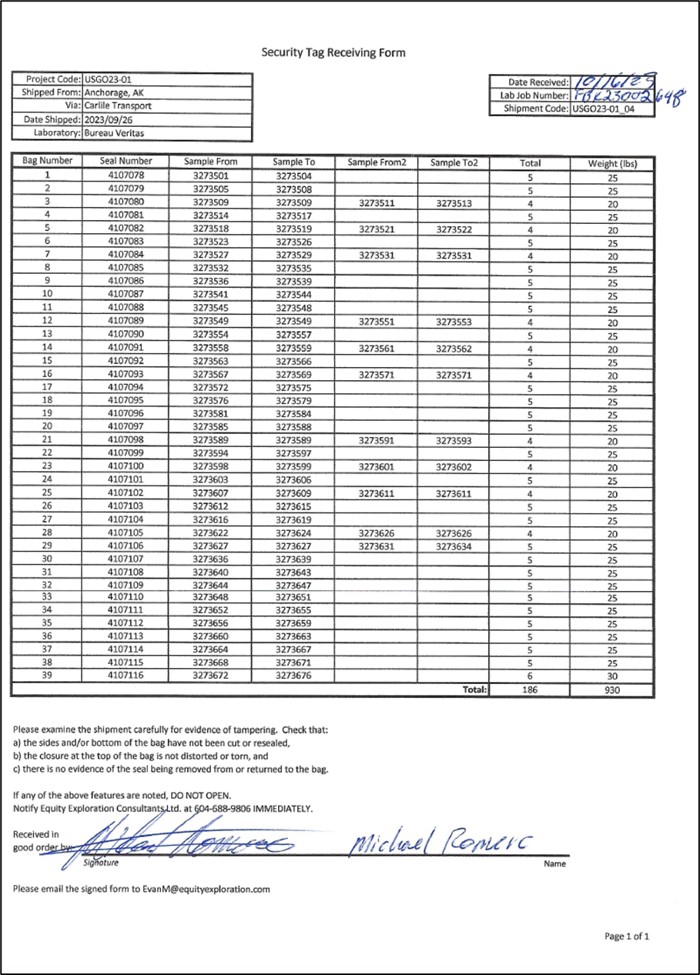
(Source:
U.S. GoldMining, 2024)
| Figure
8-3 |
U.S.
GoldMining Inc. Sample Dispatch Form |
The
total number of assays and QAQC samples including samples identified as Certified Reference Materials (CRM or STD), blanks, field duplicates
and check-assays in the provided database is given in Table 8-1 and shows that the percent of included QAQC samples is 15.1% in Whistler,
15.6% in Raintree and 15.5% in Island Mountain. The year in which the QAQC is counted is by year of analysis, not drilling. All available
lab-internal QAQC data from 2004 to 2023 has also been entered into the company’s database but has not been reviewed in detail
for this report.
| Effective Date: September 12, 2024 | Page 78 of 181 |
| | S-K 1300 Technical Summary Report – Whistler Project, Alaska |
The
QAQC sampling for all three deposits meets industry standards. QAQC data for copper and gold only have been provided and are presented
here. The analysis of the QAQC samples split by deposit follows in Sections 8.3.1 to 8.3.3.
| Table
8-1 |
QAQC
Sample Summary (All Areas and Years) |
| Deposit |
Year |
Samples |
Blanks |
CRMs |
Field
Dups* |
Umpire |
QAQC
all |
%
QAQC |
| Whistler |
1986-1989 |
697 |
n/a |
n/a |
n/a |
n/a |
n/a |
n/a |
| 2004 |
918 |
44 |
46 |
47 |
206 |
343 |
27.2% |
| 2005 |
2,602 |
131 |
132 |
259 |
81 |
615 |
19.1% |
| 2006 |
353 |
22 |
20 |
44 |
0 |
86 |
19.6% |
| 2007 |
1,347 |
74 |
77 |
0 |
0 |
151 |
10.1% |
| 2008 |
1,180 |
76 |
78 |
0 |
0 |
154 |
11.5% |
| 2009 |
116 |
0 |
0 |
0 |
0 |
0 |
0.0% |
| 2010 |
1,726 |
106 |
103 |
108 |
0 |
317 |
15.5% |
| 2023 |
1,365 |
73 |
62 |
25 |
pending |
160 |
10.5% |
| Whistler
All |
10,304 |
526 |
518 |
483 |
299 |
1,832 |
15.1% |
| Raintree |
2005 |
72 |
4 |
4 |
7 |
0 |
15 |
17.2% |
| 2006 |
383 |
22 |
22 |
46 |
0 |
90 |
19.0% |
| 2008 |
249 |
18 |
18 |
0 |
0 |
36 |
12.6% |
| 2009 |
262 |
15 |
16 |
0 |
0 |
31 |
10.6% |
| 2010 |
1,298 |
80 |
87 |
81 |
0 |
248 |
16.0% |
| 2011 |
5,136 |
318 |
324 |
303 |
0 |
945 |
15.5% |
| Raintree
All |
7,400 |
457 |
471 |
437 |
0 |
1,365 |
15.6% |
| Island
Mountain |
2009 |
194 |
12 |
18 |
0 |
0 |
30 |
13.4% |
| 2010 |
2,140 |
135 |
123 |
145 |
0 |
403 |
15.8% |
| 2011 |
3,110 |
193 |
185 |
188 |
0 |
566 |
15.4% |
| Island
Mountain All |
5,444 |
340 |
326 |
333 |
0 |
999 |
15.5% |
| Total |
23,148 |
1,323 |
1,315 |
1,253 |
299 |
4,190 |
15.3% |
*Field
Duplicates and ‘blind’ coarse duplicates combined because of missing classification records
As
is common with projects that have been developed by various owners or operators over multiple decades, several laboratories with different
analytical methods, a wide range of CRMs as well as multiple blank materials have been utilized at Whistler, Raintree and Island Mountain.
Already described in some detail under Section 8.1., the following laboratories in Table 8-2 were contracted for sample preparation and
geochemical analysis of drill core samples over the last 20 years.
| Effective Date: September 12, 2024 | Page 79 of 181 |
| | S-K 1300 Technical Summary Report – Whistler Project, Alaska |
| Table
8-2 |
2004-2023
Assay Laboratories and assay methods for Au and Cu |
| Year |
Primary
lab |
|
Cu
method |
CU
DL ppm |
Au
method |
Au
DL ppm |
| 2004 |
American
Assay |
AAL |
ICP-2A |
1 |
FA30 |
0.003 |
| 2005 |
ALS
Chemex |
ALS |
ME-ICP41a |
5 |
Au-AA23 |
0.005 |
| 2006 |
ALS
Chemex |
ALS |
ME-ICP41a |
5 |
Au-AA23 |
0.005 |
| 2007 |
ALS
Chemex |
ALS |
ME-ICP41 |
1 |
Au-AA23 |
0.005 |
| 2007 |
ALS
Chemex |
ALS |
ME-ICP41a |
5 |
Au-AA23 |
0.005 |
| 2008 |
Alaska
Assays |
AKA |
ICP-4A |
2 |
FA30
AAS |
0.01 |
| 2009 |
Alaska
Assays |
AKA |
ICP-3A |
2 |
FA30
AAS |
0.01 |
| 2010 |
ALS
Chemex |
ALS |
ME-ICP61 |
1 |
Au-AA23 |
0.005 |
| 2010 |
ALS
Chemex |
ALS |
ME-MS61 |
0.2 |
Au-AA23 |
0.005 |
| 2011 |
ALS
Chemex |
ALS |
ME-ICP61 |
1 |
Au-AA23 |
0.005 |
| 2023 |
Bureau
Veritas |
BV |
MA200 |
0.1 |
FA430 |
0.005 |
The
project’s QAQC database currently contains 6 different designations for blank material (see Table 8-3), of which OPPBLK-1 and WP-BLK-1
have been described under 8.1.2. The variability in granularity and hardness of the utilized materials as well as in natural background
concentrations in andesitic to basaltic rocks contributed to significant scatter in blank plots, particularly for copper, potentially
masking true inter-sample contamination during perp work at the respective labs. Several follow-up-checks on theoretical ‘failure’
data points and their preceding samples confirmed contamination to be an unlikely cause for these outliers.
| Table
8-3 |
Blank
Material Details 2004-2023 |
| Blank
name |
Years |
Source |
Comment |
| Blank |
2009 |
n/a |
Basalt
from property outcrop |
| Blank_SS |
2010-2011 |
n/a |
Quartz
sand |
| Blank_Whistler |
2007-2008 |
n/a |
Barren
core of WH05-04 |
| OPPBLK-1 |
2004-2006 |
outcrop |
Andesite
from outcrop |
| VIGORO_blank |
2023 |
n/a |
Purchased
limestone crush |
| WP-BLK-1 |
2005-2006 |
core |
Porphyritic
andesite from core |
To
control accuracy of the reported assay results, between 2 and 5 of the following blind reference materials were inserted into the sample
streams of each drilling and sampling campaign, starting in 2004. Table 8-4 lists all standards, while Figure 8-6, Figure 8-10 and Figure
8-14 in the following chapters detail their respective performances for each project.
| Effective Date: September 12, 2024 | Page 80 of 181 |
| | S-K 1300 Technical Summary Report – Whistler Project, Alaska |
| Table
8-4 |
CRM
Detail 2004-2023 |
| CRM
name |
Years |
EV
Au ppm |
Au
SD |
EV
Cu % |
Cu
SD |
Comment |
| HMM |
2004 |
0.35* |
n/a |
1.2* |
n/a |
*
estimate, unknown material |
| MHH |
2004 |
1.3* |
n/a |
0.44* |
n/a |
*
estimate, unknown material |
| UC-2 |
2004 |
1.28* |
n/a |
0.79* |
n/a |
*
estimate, unknown material |
| UC-5 |
2004 |
0.38* |
n/a |
0.69* |
n/a |
*
estimate, unknown material |
| OREAS-50c |
2010-2011 |
0.836 |
0.028 |
0.742 |
0.016 |
Cu
4A, Au FA |
| OREAS-52c |
2010-2011 |
0.346 |
0.017 |
0.344 |
0.009 |
Cu
4A, Au FA |
| OREAS-52Pb |
2010 |
0.307 |
0.017 |
0.3338 |
0.0067 |
Cu
4A, Au FA |
| OREAS-53Pb |
2010 |
0.623 |
0.021 |
0.546 |
0.013 |
Cu
4A, Au FA |
| OREAS-54Pa |
2010-2011 |
2.9 |
0.11 |
1.55 |
0.02 |
Cu
4A, Au FA |
| OREAS
501d |
2023 |
0.232 |
0.011 |
0.272 |
0.009 |
Cu
4A, Au FA |
| OREAS
503e |
2023 |
0.709 |
0.018 |
0.531 |
0.016 |
Cu
4A, Au FA |
| WP-CO1 |
2005-2009 |
0.481 |
0.026 |
0.2802 |
0.0057 |
project-specific
CRM |
| WP-HG1 |
2005-2009 |
4.693 |
0.19 |
0.616 |
0.0133 |
project-specific
CRM |
| WP-MG1 |
2005-2009 |
1.715 |
0.123 |
0.2594 |
0.0052 |
project-specific
CRM |
The
apparent standards utilized in 2004 by Kennecott (HMM, MHH, UC-2, and UC-5) could not be confirmed to be certified reference material
and have therefore been excluded from the normalized Au and Cu graphs in the following chapters.
As
indicated in Table 8-1, field duplicate data from 2004 to 2006 was combined with coarse duplicate data as no distinction could be made
because the actual classification for each duplicate at the time of drilling and sampling was not available at the time of this report.
| 8.3.1 |
QAQC
Whistler Deposit |
The
summary of the blind gold assays samples of blank material used to assess contamination in the Whistler deposit sample stream is given
inFigure 8-5. The results show an overall 1% failure rate at 10 times detection limit (DL), which is acceptable (5 fails total). The
use of locally sourced andesite and porphyritic andesite taken from drill core as blank material by both Kennecott and Geoinformatics
in 2004 to 2006 and ‘BLANK_WHISTLER’ in 2007-2008 may have contributed to the elevated number of 5*DL warning results (3.3%
of total), given that this material recorded elevated background values in Cu on occasion as well.
The
silica sand utilized by Kiska in 2010 did not produce any warnings or failures but because of its smaller grain size is also unlikely
to have gone through the crushing stage during preparation which is a common source of contamination.
The
VIGORO limestone crush in 2023 did not record any contamination fails.
| Effective Date: September 12, 2024 | Page 81 of 181 |
| | S-K 1300 Technical Summary Report – Whistler Project, Alaska |
| Table
8-5 |
Summary
of Gold Assays of Blanks, Whistler Deposit |
| Blank |
Year
used |
Count |
>
5*DL warning |
%
> 5*DL |
>
10*DL fail |
%
> 10*DL |
| OPPBLK-1 |
2004-2006 |
144 |
5 |
3.5% |
2 |
1.4% |
| WP-BLK-1 |
2005-2006 |
53 |
1 |
1.9% |
0 |
0.0% |
| BLANK_WHISTLER |
2007-2008 |
150 |
9 |
6.0% |
3 |
2.0% |
| BLANK_SS |
2010 |
106 |
0 |
0.0% |
0 |
0.0% |
| VIGORO_Blank |
2023 |
61 |
2 |
3.3% |
0 |
0.0% |
| Total |
2004-2023 |
514 |
17 |
3.3% |
5 |
1.0% |
A
sequential plot of gold assays blanks is presented in Figure 8-3. The purple line indicates the year of drilling, and it is clearly seen
that the performance of the blank material is poorest in 2008 (Alaska Assay), however, with a fire assay Au detection limit of 0.01ppm,
only 3 of the elevated assays in 2008 classify as fails as per definition of >10*DL.
The
use of silica sand as blank material in 2010 produced the fewest Au results above DL.
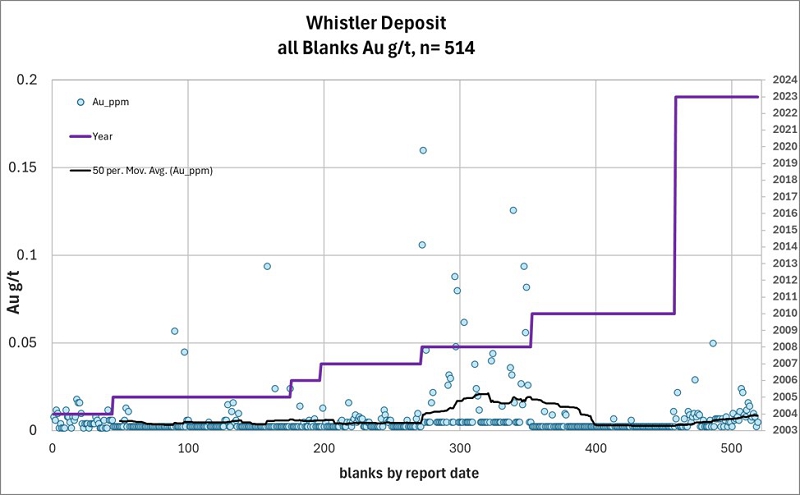
(Source:
MMTS, 2024)
| Figure
8-4 |
Sequential
Plot of Gold Assays of Blanks, Whistler Deposit |
The
DL for copper assays at the Whistler deposit is either 1 or 5 ppm depending on the analysis lab and year and applying a criterion of
5- or 10-times DL would result in an extremely high failure rate due to elevated natural copper concentrations. The copper assays are
therefore compared against a level of 80 ppm, or 0.008%, which appears to be the approximate background level in the blank materials
chosen 2004-2008. 111 of the 343 blanks from 2004-2008 reported >80ppm, but after spot-checking Cu grades of preceding samples to
several select high-Cu outliers MMTS is of the opinion that natural variability in Cu grades is causing the frequent ‘failures’
and cross-sample contamination, while certainly possible on occasion, is likely irrelevant.
| Effective Date: September 12, 2024 | Page 82 of 181 |
| | S-K 1300 Technical Summary Report – Whistler Project, Alaska |
A
combined 167 blanks were introduced in 2010 and 2023, and none indicate any relevant Cu contamination. The highest Cu result reported
was 43ppm.
The
sequential plot of copper assays of blanks in the Whistler deposit is presented in Figure 8-5.
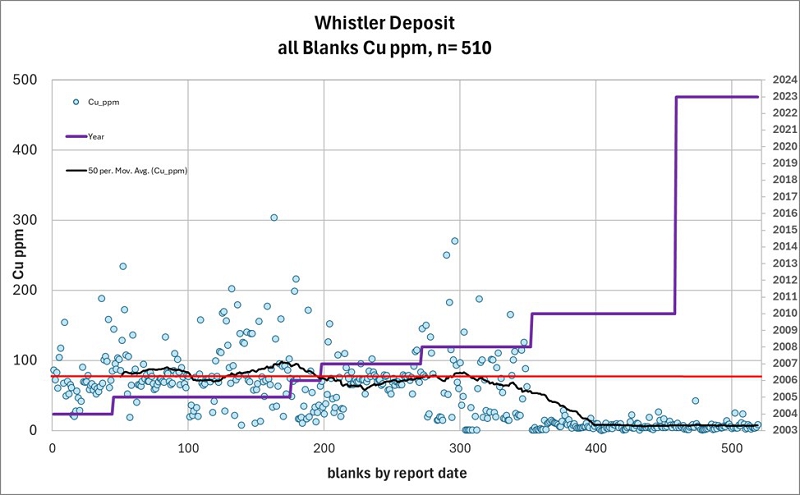
(Source:
MMTS, 2024)
| Figure
8-5 |
Sequential
Plot of Copper Assays of Blanks, Whistler Deposit |
There
are 461 samples of CRMs certified for both gold and copper included in the Whistler sample stream which are used to assess the accuracy
of the laboratory assays, though one Au assay was not reported. The results of analysis of these samples are given in Table 8-6 in order
of increasing grade of the expected value (EV) and shows that the overall failure rate is an acceptable 1.7%. The absolute average percent
error is 1.9% with 9 of 10 CRMs falling between -0.4% and -2.4%, indicating a minor negative bias to the laboratory gold assays. The
CRM with the greatest percentage error (+8.1%) has only been inserted and analyzed twice and its performance is therefore not considered
a concern.
| Effective Date: September 12, 2024 | Page 83 of 181 |
| | S-K 1300 Technical Summary Report – Whistler Project, Alaska |
| Table
8-6 |
Whistler
Deposit CRM Summary, Gold |
| CRM |
Year
used |
Count |
EV
Au (g/t) |
AVG
Au (g/t) |
%
Error |
Low
Fail |
High
Fail |
%
Fail |
| OREAS
501d |
2023 |
32 |
0.232 |
0.230 |
-0.7% |
0 |
0 |
0.0% |
| OREAS-52Pb |
2010 |
2 |
0.307 |
0.334 |
8.1% |
0 |
0 |
0.0% |
| OREAS-52c |
2010 |
50 |
0.346 |
0.343 |
-1.0% |
1 |
0 |
2.0% |
| WP-CO1 |
2005-2010 |
137 |
0.48 |
0.472 |
-1.7% |
2 |
2 |
2.9% |
| OREAS-53Pb |
2010 |
15 |
0.623 |
0.620 |
-0.4% |
0 |
0 |
0.0% |
| OREAS
503e |
2023 |
18 |
0.709 |
0.696 |
-1.8% |
0 |
0 |
0.0% |
| OREAS-50c |
2010 |
12 |
0.836 |
0.827 |
-1.1% |
0 |
0 |
0.0% |
| WP-MG1 |
2005-2008 |
98 |
1.715 |
1.675 |
-2.4% |
0 |
0 |
0.0% |
| OREAS-54Pa |
2010 |
24 |
2.9 |
2.878 |
-0.8% |
1 |
0 |
4.2% |
| WP-HG1 |
2005-2010 |
72 |
4.693 |
4.660 |
-0.7% |
2 |
0 |
2.8% |
| Total |
2005-2023 |
460 |
|
|
|
6 |
2 |
1.7% |
The
normalized process control chart showing results for all CRMS is given in Figure 8-5 and shows the acceptable results across all CRMs.
It does not appear that quality control procedures were always followed. For instance, the high failure in 2008, plotting at almost +6
SD is sample 514915 in drillhole WH-08-08, and follows an assay value of 0.902 g/t. This control sample and the neighboring primary samples
should have been re-assayed and replaced in the database if strict control measures were in place. Although individual lapses control
procedures can be identified, the overall impact of these is not considered material as the number of failures is small.
Figure
8-5 also demonstrates that Alaska Assays in 2008 was able to measure Au concentration in the blind CRMs most accurately, while ALS Chemex
and Bureau Veritas assays exhibit larger spreads.
The
summary of copper assays of the CRMs is given in Table 8-7 in order of increasing grade and shows the overall failure rate to be acceptable
at 2.6% and the percent error to be negligible at +0.2% when straight averaged.
| Effective Date: September 12, 2024 | Page 84 of 181 |
| | S-K 1300 Technical Summary Report – Whistler Project, Alaska |
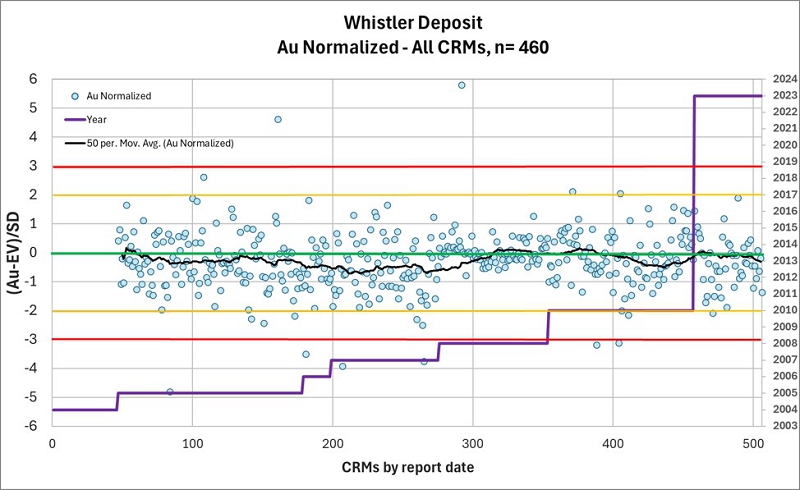
(Source:
MMTS, 2024)
| Figure
8-6 |
Whistler
Deposit Normalized Process Control Chart, Gold |
| Table
8-7 |
Whistler
Deposit CRM Summary, Copper |
| CRM |
Year
used |
Count |
EV
Cu % |
AVG
Cu % |
%
Error |
Low
Fail |
High
Fail |
%
Fail |
| WP-MG1 |
2005-2008 |
98 |
0.2594 |
0.258 |
-0.7% |
0 |
0 |
0.0% |
| OREAS
501d |
2023 |
32 |
0.272 |
0.267 |
-1.9% |
0 |
0 |
0.0% |
| WP-CO1 |
2005-2010 |
137 |
0.2802 |
0.279 |
-0.5% |
5 |
2 |
5.1% |
| OREAS-52Pb |
2010 |
2 |
0.3338 |
0.345 |
3.2% |
0 |
1 |
50.0% |
| OREAS-52c |
2010 |
50 |
0.344 |
0.352 |
2.3% |
0 |
0 |
0.0% |
| OREAS-53Pb |
2010 |
15 |
0.546 |
0.541 |
-0.9% |
0 |
0 |
0.0% |
| OREAS
503e |
2023 |
18 |
0.531 |
0.531 |
0.0% |
0 |
0 |
0.0% |
| WP-HG1 |
2005-2010 |
72 |
0.616 |
0.617 |
0.1% |
0 |
0 |
0.0% |
| OREAS-50c |
2010 |
12 |
0.742 |
0.766 |
3.1% |
0 |
2 |
16.7% |
| OREAS-54Pa |
2010 |
24 |
1.55 |
1.511 |
-2.5% |
2 |
0 |
8.3% |
| Total |
2005-2023 |
460 |
|
|
|
7 |
5 |
2.6% |
The
normalized process control chart is given in Figure 8-6 in order of processing and shows the acceptable results with relatively few failures.
Of note, however, are the moderate negative biases in normalized Cu for 2007 (ALS Chemex) and 2023 (Bureau Veritas). In 2007, 3 certificates
received in November (FA07110167, FA07112984, and FA07127160) delivered consistently low Cu results across the 3 CRMs used at the time
and should have been flagged for review and potential re-assaying at ALS.
| Effective Date: September 12, 2024 | Page 85 of 181 |
| | S-K 1300 Technical Summary Report – Whistler Project, Alaska |
In
2023, the low-range CRM OREAS 501d moderately but consistently underperformed by approx. 2.5% and was also used disproportionately often
in comparison to the other CRM used that year (30 to 18 insertions, respectively).
The
performance of both gold and copper CRMs in the Whistler deposit indicates acceptable accuracy (Figure 8-7).
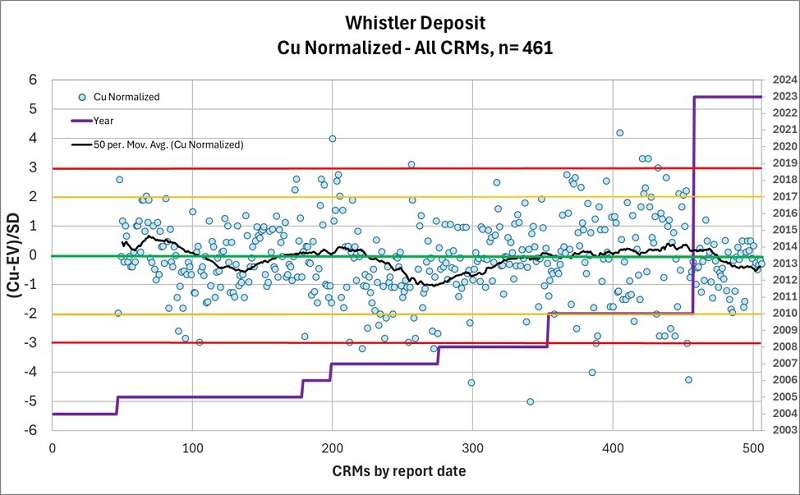
(Source:
MMTS, 2024)
| Figure
8-7 |
Whistler
Deposit Normalized Process Control Chart, Copper |
| 8.3.1.3 |
Whistler
Field Duplicates |
GoldMining’s
assay database provides a significant number of field duplicates for the 2010-2023 periods. Unfortunately, for earlier years 2004-2006,
the distinction between field duplicates and company-initiated coarse reject duplicates has not been retained, so that a general ‘Duplicate’
designation has been given to all QAQC samples that could not be identified as blank or CRM.
The
parent (original) versus daughter (duplicate) relationship however has been consistent, with the parent sample always directly preceding
the daughter in the sample series. These duplicates along with regular field duplicates, where identified, have been combined into the
field duplicate graphs of the following chapters for both Au and Cu.
The
simple statistics of the field duplicates in the Whistler deposit are given in Table 8-8. It is seen in the averaged ARD of the gold
assays that the % difference of the means is 1.3% indicating there is a small positive bias to the duplicate samples as compared to the
originals. There is a weak 0.5% difference in the avg. ARD of the copper assays, favouring the duplicate.
| Effective Date: September 12, 2024 | Page 86 of 181 |
| | S-K 1300 Technical Summary Report – Whistler Project, Alaska |
The
percent below 10% Half Absolute Relative Difference (HARD) is 71.5% for gold and 72% for copper. The expectation for field duplicates
is that 70% or more are below 10%, this is met for copper and gold, indicating the gold mineralization in Whistler is not highly heterogenous.
| Table
8-8 |
Whistler
Field Duplicates Simple Statistics |
| DUP
count |
Element |
Units |
Average |
Count
>10% HARD |
%
<10% HARD |
| Primary |
Duplicate |
ARD
% Avg. |
| 492 |
Gold |
g/t |
0.271 |
0.283 |
1.31% |
140 |
71.5% |
| 492 |
Copper |
ppm |
1069 |
1110 |
0.53% |
138 |
72.0% |
The
small positive bias of gold assays in the duplicate samples is also observed in the scatter plot in Figure 8-8 with the slope of the
best fit line moderately above 1.0. The high correlation coefficient of 0.95 reflects the somewhat homogenous nature of the duplicate
samples.
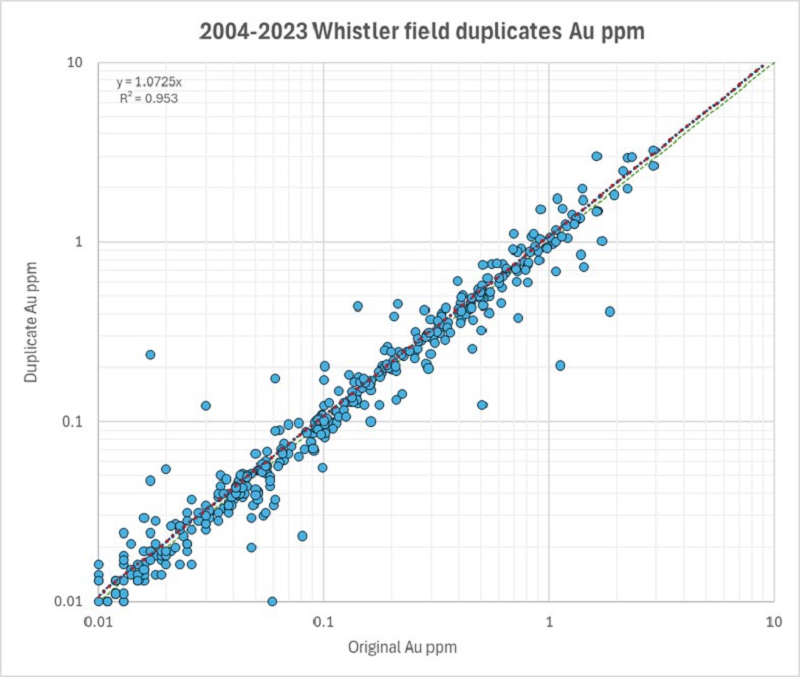
(Source:
MMTS, 2024)
| Figure
8-8 |
Whistler
Deposit Field Duplicate Scatter Plot, Gold |
The
scatter plot of copper field duplicates is given in Figure 8-9 and shows a very good correlation between duplicate pairs with slope of
best fit line slightly above 1.0 and the R2 at 0.95.
| Effective Date: September 12, 2024 | Page 87 of 181 |
| | S-K 1300 Technical Summary Report – Whistler Project, Alaska |
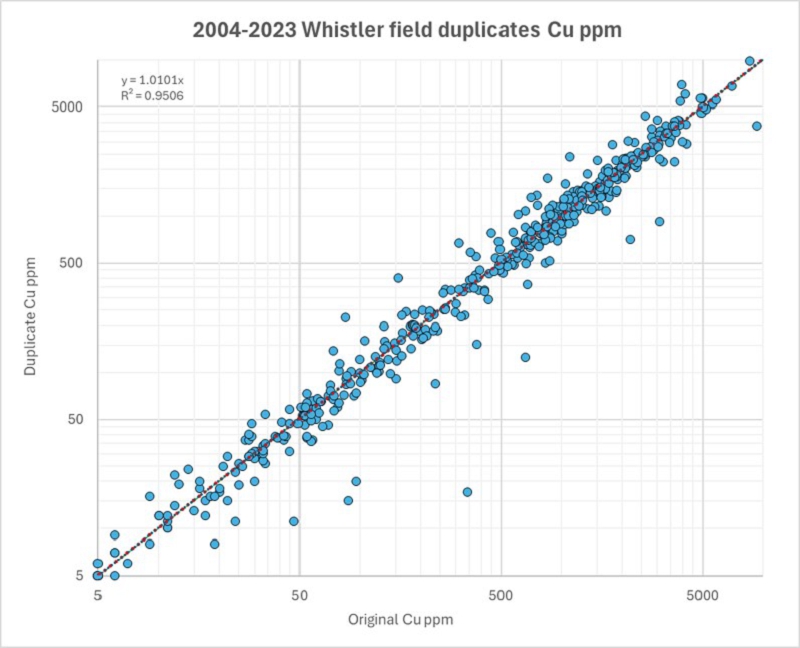
(Source:
MMTS, 2024)
| Figure
8-9 |
Whistler
Deposit Field Duplicate Scatter Plot, Copper |
| 8.3.1.4 |
Whistler
Umpire assays 2004-2005 |
A
total of 206 pulps including blind blanks (9) and CRMs (8) originally prepared and analyzed by American Assay in 2004 were sent to ALS
Chemex in Fairbanks, Alaska, for Au and Cu check-assay purposes. Both labs used a 30g charge for the fire assay Au analysis and an aqua
regia digestion to analyze for Cu.
Figure
8-10 illustrates the very good correlation between the two datasets for Au. The majority of the check-assay pairs is moderately ALS-positive,
particularly in the 0.5-5.0g/t range, which results in a difference of 0.1g/t in average grade (0.97g/t AAL to 1.07g/t ALS Chemex).
| Effective Date: September 12, 2024 | Page 88 of 181 |
| | S-K 1300 Technical Summary Report – Whistler Project, Alaska |
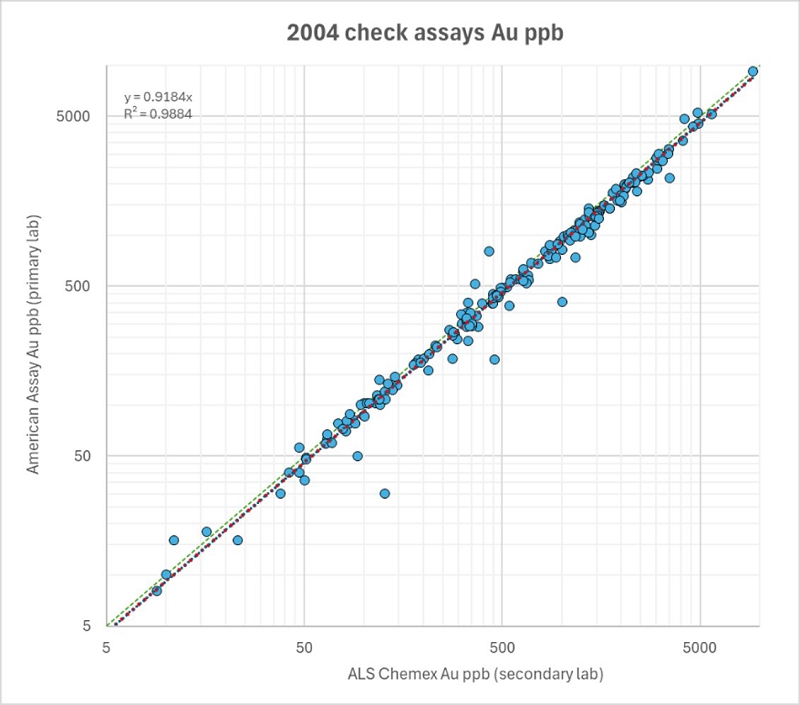
(Source:
MMTS, 2024)
| Figure
8-10 |
Whistler
Deposit Umpire Scatter Plot, Gold |
Figure
8-11 highlights a significant bias towards the Cu ALS Chemex results which are consistently higher in both core sample pulps and CRM
pulps. Additionally, the Cu data appears to split into two populations, which is predominantly caused by samples from drill hole WH04-05
between 185 and 233m for which the ALS Chemex assays are 74% higher on average, while the rest of the data is only 19% biased towards
ALS Chemex. This is excluding results for which AAL overlimit results are not available.
| Effective Date: September 12, 2024 | Page 89 of 181 |
| | S-K 1300 Technical Summary Report – Whistler Project, Alaska |
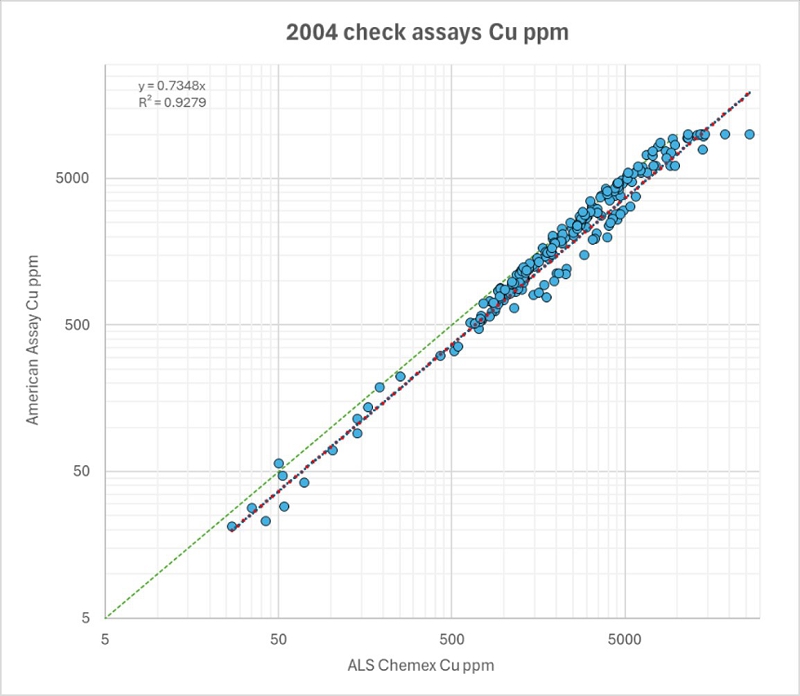
(Source:
MMTS, 2024)
| Figure
8-11 |
Whistler
Deposit Umpire Scatter Plot, Copper |
In
response to the strong bias, Kennecott resubmitted all 2004 pulps to ALS Chemex in Elko, Nevada, for additional Cu analyses, again requesting
Cu-AA45 and Cu-AA46 (overlimit) methods with aqua regia digestion. This most current Cu data is being used for resource estimation. Figure
8-12 shows the perfect correlation between the initial umpire results by ALS and the subsequent Cu-AA45 results also by ALS.
| Effective Date: September 12, 2024 | Page 90 of 181 |
| | S-K 1300 Technical Summary Report – Whistler Project, Alaska |
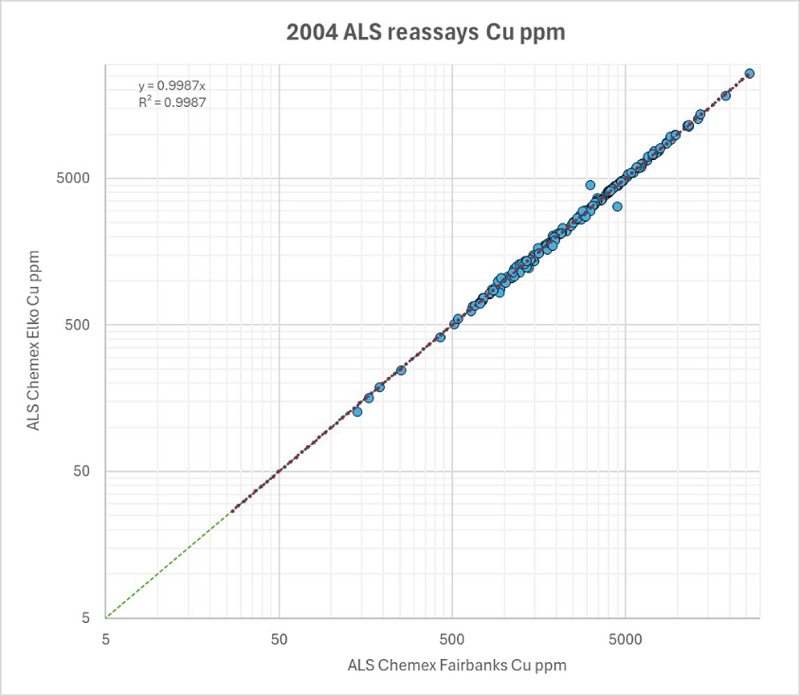
(Source:
MMTS, 2024)
| Figure
8-12 |
Whistler
Deposit ALS Re-Assay Scatter Plot, Copper |
In
2005, Kennecott contracted ALS Chemex as the primary lab and chose ACME to perform the umpire assaying on a select 93 samples, 81 of
which are relevant core samples. Figure 8-13 shows a significant and consistent bias towards the primary ALS Au results (+16% on average)
while for Cu in Figure 8-14 both y and R2 approach 1.0 despite some weak scatter.
| Effective Date: September 12, 2024 | Page 91 of 181 |
| | S-K 1300 Technical Summary Report – Whistler Project, Alaska |
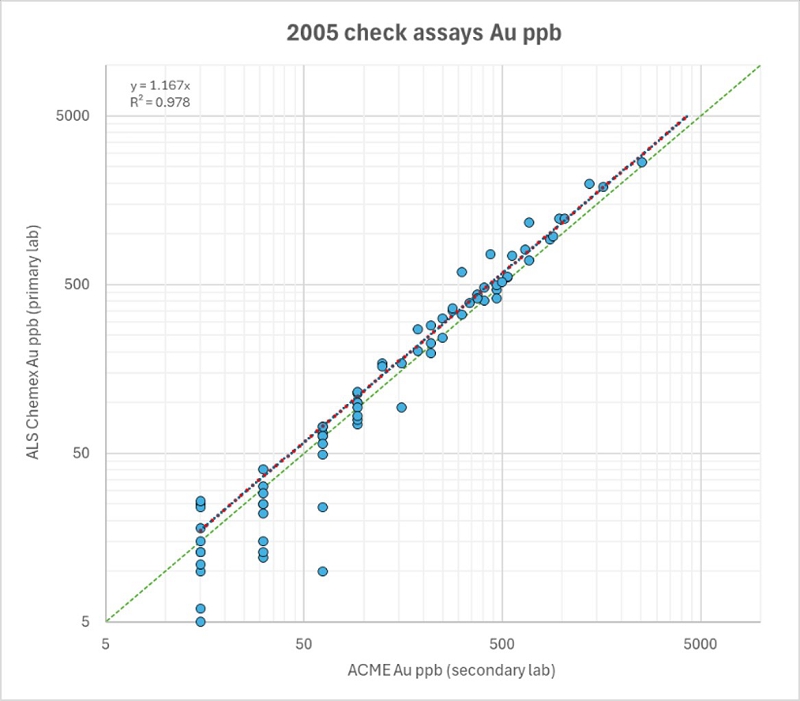
(Source:
MMTS, 2024)
| Figure
8-13 |
Whistler
Deposit Umpire Scatter Plot, Gold |
| Effective Date: September 12, 2024 | Page 92 of 181 |
| | S-K 1300 Technical Summary Report – Whistler Project, Alaska |
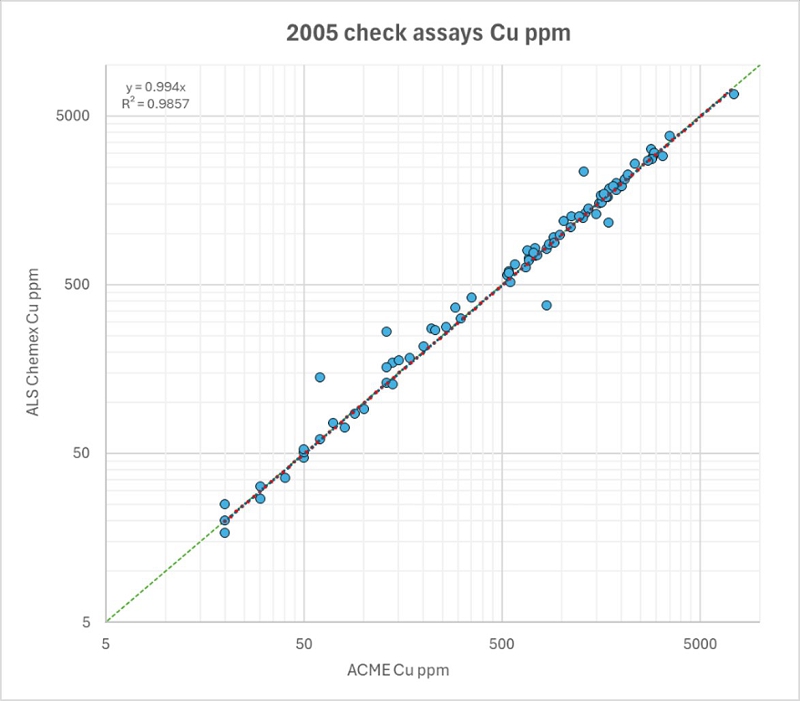
(Source:
MMTS, 2024)
| Figure
8-14 |
Whistler
Deposit Umpire Scatter Plot, Copper |
| 8.3.2 |
QAQC
Raintree Deposit |
The
summary of gold assays of blanks in the Raintree sample stream is presented in Table 8-9 and show acceptable results with only 1.1% of
samples exceeding the 5*DL warning threshold, and 2 failures passing the 10*DL level (0.4% of total).
| Table
8-9 |
Summary
of Gold Assays of Blanks, Raintree Deposit |
| Blank |
Year
used |
Count |
>
5*DL warning |
%
> 5*DL |
>
10*DL fail |
%
> 10*DL |
| OPPBLK-1 |
2004-2006 |
26 |
0 |
0.0% |
0 |
0.0% |
| BLANK |
2009 |
15 |
2 |
13.3% |
1 |
6.7% |
| BLANK_WHISTLER |
2007-2008 |
18 |
0 |
0.0% |
0 |
0.0% |
| BLANK_SS |
2010-2011 |
399 |
3 |
0.8% |
1 |
0.3% |
| Total |
2004-2011 |
458 |
5 |
1.1% |
2 |
0.4% |
The
sequential plot of gold assays of blanks is shown in Figure 8-15 and shows acceptable results indicating contamination is not likely
to be a problem in the Raintree assay stream. The two >0.05g/t outliers of 2009 in certificate 28678 (Alaska Assays) have been reviewed
and preceding samples were found to not have sufficiently high Au concentrations to reasonably explain the results as contamination.
| Effective Date: September 12, 2024 | Page 93 of 181 |
| | S-K 1300 Technical Summary Report – Whistler Project, Alaska |
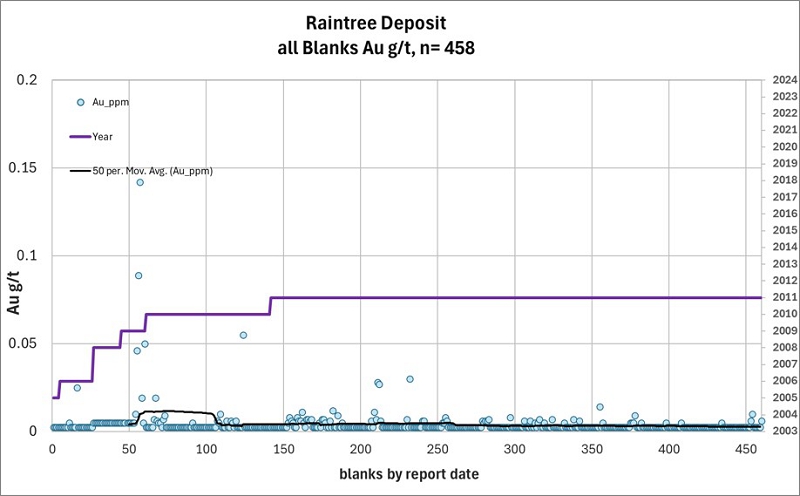
(Source:
MMTS, 2024)
| Figure
8-15 |
Sequential
Plot of Gold Assays of Blanks, Raintree Deposit |
The
sequential plot of copper assays blanks is given in Figure 8-16 and, like the Whistler blanks plot Figure 8-5 in the previous chapter,
shows higher assay results in 2004-2009 due to naturally elevated copper in the blank material, as discussed previously. The assays in
2010 and 2011 have only two blanks exceeding the generic 80ppm level and are predominantly at 10 ppm and below, demonstrating no evidence
of significant contamination in most of the sample stream in Raintree. Sample 845239 reporting 424ppm Cu might be a field duplicate,
not a blank.
| Effective Date: September 12, 2024 | Page 94 of 181 |
| | S-K 1300 Technical Summary Report – Whistler Project, Alaska |
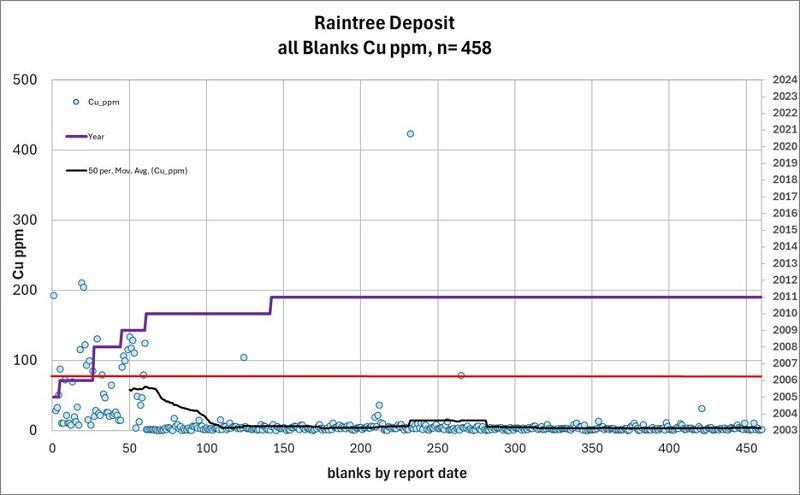
(Source:
MMTS, 2024)
| Figure
8-16 |
Sequential
Plot of Copper Assays of Blanks, Raintree Deposit |
The
summary of CRM gold analyses for samples included in drilling in the Raintree Deposit is given in Table 8-10. It is seen that the overall
failure rate is 2.3% and there is a marginal overall negative bias of -0.3%. By far the most used CRMs are OREAS 50c and OREAS 52c, both
of which performed very well except for a 2-week period in August-September of 2011 where ALS Chemex missed on 3 Cu and 4 Au CRMs over
4 certificates. The samples in these reports should have been re-run.
| Effective Date: September 12, 2024 | Page 95 of 181 |
| | S-K 1300 Technical Summary Report – Whistler Project, Alaska |
| Table
8-10 |
Raintree
Deposit CRM Summary, Gold |
| CRM |
Year
used |
Count |
EV
Au (g/t) |
AVG
Au (g/t) |
%
Error |
Low
Fail |
High
Fail |
%
Fail |
| OREAS-52Pb |
2010 |
16 |
0.307 |
0.324 |
5.3% |
0 |
0 |
0.0% |
| OREAS-52c |
2010-2011 |
118 |
0.346 |
0.342 |
-1.1% |
2 |
0 |
1.7% |
| WP-CO1 |
2005-2009 |
22 |
0.48 |
0.479 |
-0.3% |
0 |
0 |
0.0% |
| OREAS-53Pb |
2010 |
41 |
0.623 |
0.626 |
0.5% |
0 |
0 |
0.0% |
| OREAS-50c |
2010-2011 |
183 |
0.836 |
0.840 |
0.5% |
3 |
4 |
3.8% |
| WP-MG1 |
2005-2009 |
22 |
1.715 |
1.625 |
-5.5% |
1 |
0 |
4.5% |
| OREAS-54Pa |
2010-2011 |
54 |
2.9 |
2.860 |
-1.4% |
0 |
0 |
0.0% |
| WP-HG1 |
2005-2009 |
16 |
4.693 |
4.668 |
-0.5% |
1 |
0 |
6.3% |
| Total |
2005-2011 |
472 |
|
|
|
7 |
4 |
2.3% |
The
normalized process control chart of all gold assays of CRMs in Raintree drilling is presented in Figure 8-17 and shows the reasonable
overall results. 2 negative failures are <-6 and are not shown in the graph.
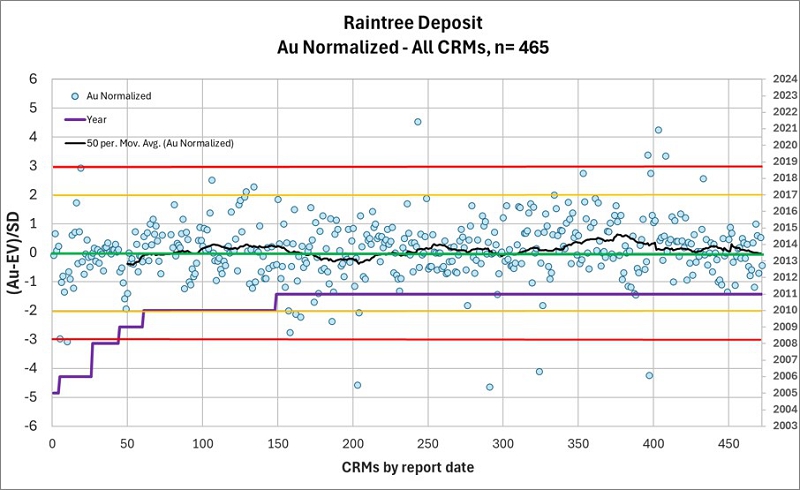
(Source:
MMTS, 2024)
| Figure
8-17 |
Raintree
Deposit Normalized Process Control Chart, Gold |
The
results of the 471 copper analyses of CRMs in Raintree drilling are presented in Table 8-11 and show an overall failure rate of 11.2%
which is significant. The failures are seen to concentrate in three CRMs, OREAS-52c, OREAS-50c and OREAS-54Pa, also the CRMs with the
most entries. The overall % error is slightly negative at -0.6%.
| Effective Date: September 12, 2024 | Page 96 of 181 |
| | S-K 1300 Technical Summary Report – Whistler Project, Alaska |
| Table
8-11 |
Raintree
Deposit CRM Summary, Copper |
| CRM |
Year
used |
Count |
EV
Cu % |
AVG
Cu % |
%
Error |
Low
Fail |
High
Fail |
%
Fail |
| WP-MG1 |
2005-2009 |
22 |
0.2594 |
0.261 |
0.4% |
0 |
0 |
0.0% |
| WP-CO1 |
2005-2009 |
22 |
0.2802 |
0.278 |
-1.0% |
0 |
0 |
0.0% |
| OREAS-52Pb |
2010 |
16 |
0.3338 |
0.335 |
0.5% |
0 |
0 |
0.0% |
| OREAS-52c |
2010-2011 |
118 |
0.344 |
0.346 |
0.5% |
4 |
5 |
7.6% |
| OREAS-53Pb |
2010 |
41 |
0.546 |
0.532 |
-2.7% |
2 |
0 |
4.9% |
| WP-HG1 |
2005-2009 |
16 |
0.616 |
0.620 |
0.7% |
0 |
0 |
0.0% |
| OREAS-50c |
2010-2011 |
183 |
0.742 |
0.745 |
0.4% |
8 |
18 |
14.2% |
| OREAS-54Pa |
2010-2011 |
54 |
1.55 |
1.502 |
-3.2% |
16 |
0 |
29.6% |
| Total |
2005-2011 |
472 |
|
|
|
30 |
23 |
11.2% |
The
normalized process control chart is given in Figure 8-18 and shows some significant trends over time. Samples of the 2010 drilling, analyzed
by ALS Chemex using ME-ICP61 and OG-62 for CRMs >1% Cu, start by reporting generally higher than expected in April, and over the course
of 4 months, trend noticeably low, without a single CRM approaching or exceeding its expected value for Cu in July.
After
a 3-months hiatus in reporting (Aug-Oct 2010), November 2010 and April 2011 ALS certificates again report a significant high bias before
trending lower for the rest of the year, with the 50-sample moving average line illustrating a consistent dip below the expected values
by the end of May 2011. In this context it is of note that OREAS 54Pa as the CRM with the highest Cu grade at 1.55% EV consistently under
performs, including a approx. 30% failure rate.
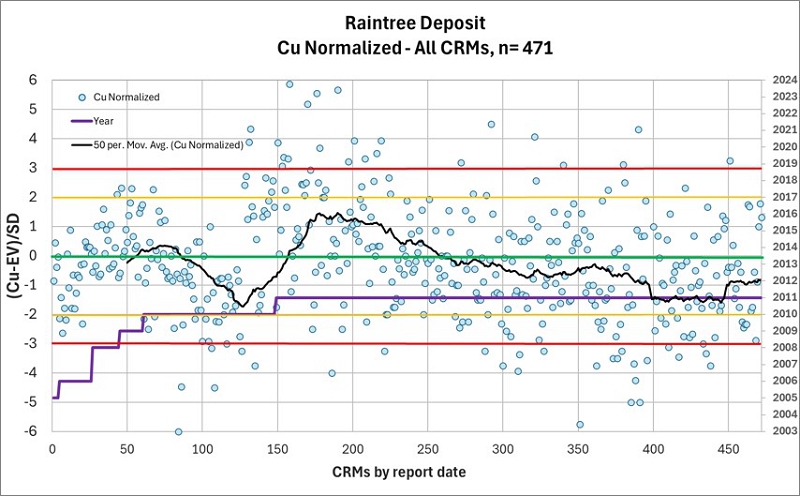
(Source:
MMTS, 2024)
| Figure
8-18 |
Raintree
Deposit Normalized Process Control Chart, Copper |
| Effective Date: September 12, 2024 | Page 97 of 181 |
| | S-K 1300 Technical Summary Report – Whistler Project, Alaska |
Results
for CRM OREAS-50c, with the most samples at 183 and very high failure rate of >14%, are given in Figure 8-19. The graph shows that
despite an initial high bias in the first 50 assays, the overall mean of the population as illustrated by the 5-sample moving average
ends up being 0.745, very close to the expected value of 0.742, aided by a comparable distribution of high and low failures and the absence
of far outliers.
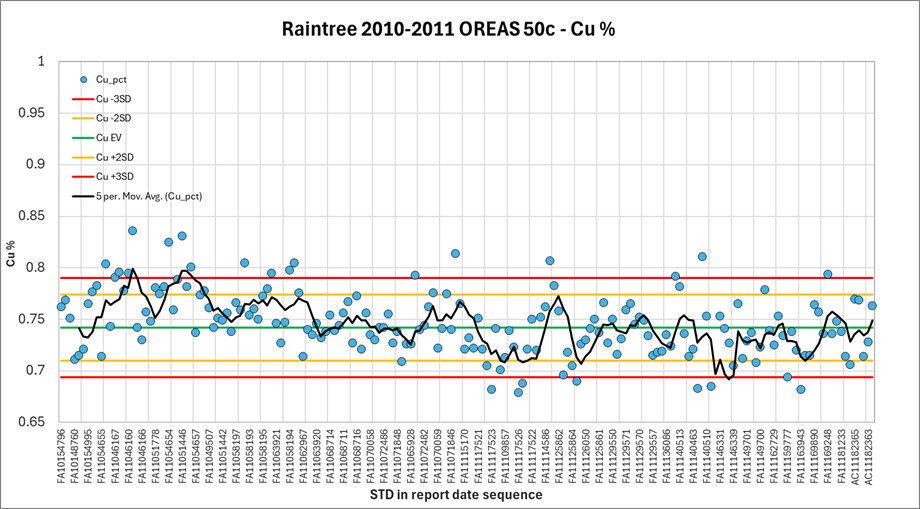
(Source:
MMTS, 2024)
| Figure
8-19 |
Process Control Chart
Raintree OREAS-50c, Copper |
Figure
8-20 for CRM OREAS 54Pb displays a consistent low bias, with only 8 of total 54 results matching or exceeding the 1.55% EV. The poor
accuracy of this specific CRM is consistent across the data of all three deposits in this report. Since the EV of OREAS 54Pb is well
above the expected grade range at Raintree, with only 23 core samples in all three deposits recording 1% Cu or higher, and a theoretical
low bias in the impacted core samples rendering the resource estimate to be more conservative, MMTS does not consider this a major concern.
In
summary, the Cu accuracy control in Raintree shows partially significant bias that previous operators did not address through sample
batch reruns at the respective lab. Equally, a significant number of failures should have triggered review and re-assay at the time.
Overall, MMTS still views the results as acceptable because 4 of the 5 OREAS CRMs used in 2010-2011 performed relatively well, the failures
are not strongly biased and OREAS 54Pa as the poorest control CRM in this dataset is the least applicable CRM in terms of Cu grade.
| Effective Date: September 12, 2024 | Page 98 of 181 |
| | S-K 1300 Technical Summary Report – Whistler Project, Alaska |
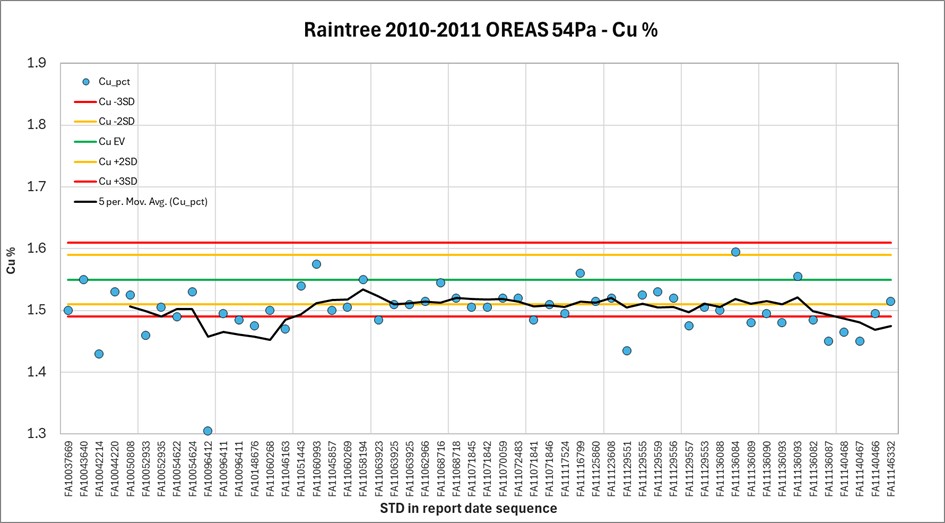
(Source:
MMTS, 2024)
| Figure 8-20 |
Process Control Chart Raintree OREAS-54Pa, Copper |
| 8.3.2.3 | Raintree
Duplicates |
The
simple statistics of the field duplicates from drilling in 2005 to 2011 at the Raintree deposit are given in Table 8-12. Little difference
is seen in the means of the gold assays, though the averaged ARD is slightly negative at -1.74%. The copper assays show no significant
bias at comparatively low Cu grades in the selected duplicate pairs. Both sets of pairs meet the expectation for the HARD statistic,
with 82.5% <10% HARD for Cu aided by the low overall grade.
| Table 8-12 |
Raintree Field Duplicates - Simple Statistics |
| DUP
count |
Element |
Units |
Average |
Count
>10% HARD |
%
<10% HARD |
| Primary |
Duplicate |
ARD
% Avg. |
| 441 |
Gold |
g/t |
0.114 |
0.113 |
-1.74% |
122 |
72.3% |
| 441 |
Copper |
ppm |
238 |
246 |
0.05% |
77 |
82.5% |
The
scatter plot of duplicate pairs of gold assays is given inFigure 8-21, and does not give concern of selection bias and paired with the
HARD statistic, show the gold mineralization to not be highly heterogenous. The y=0.918 is strongly influenced by the highest-grade pair,
which happens to be moderately original-positive. Removing this one data point results in a y=1.01, illustrating the sensitivity of linear
trends to high-grade outliers.
| Effective Date: September 12, 2024 | Page 99 of 181 |
| | S-K 1300 Technical Summary Report – Whistler Project, Alaska |
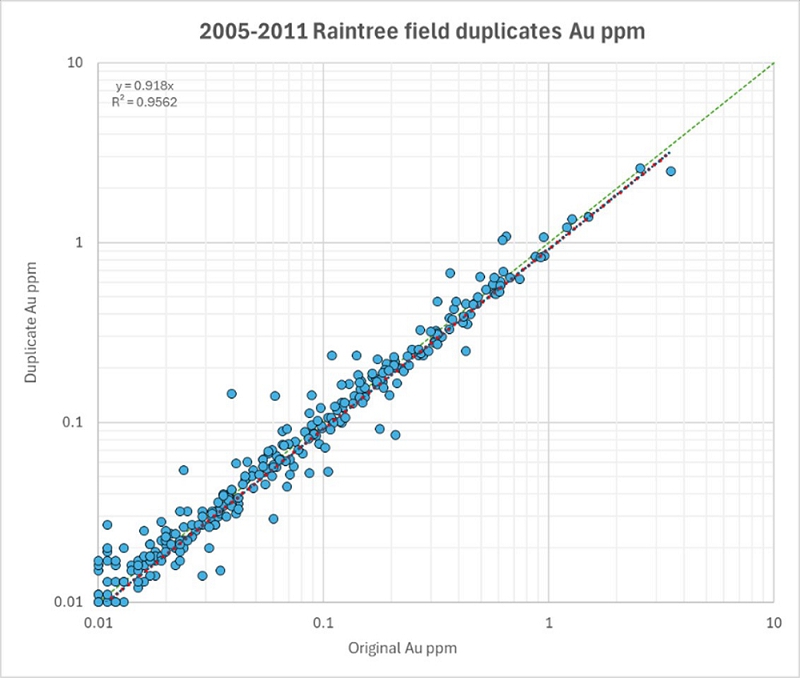
(Source:
MMTS, 2024)
| Figure 8-21 |
Raintree Deposit Field Duplicate Scatter Plot, Gold |
The
scatter plot of copper assays of field duplicates is given in Figure 8-22. The graphed assay data confirms the predominantly low-grade
nature of the selected duplicates at Raintree as most of the results plot between 20ppm and 60ppm, with a second population forming between
500ppm and 800ppm. The correlation is very good and the data un-biased.
| Effective Date: September 12, 2024 | Page 100 of 181 |
| | S-K 1300 Technical Summary Report – Whistler Project, Alaska |
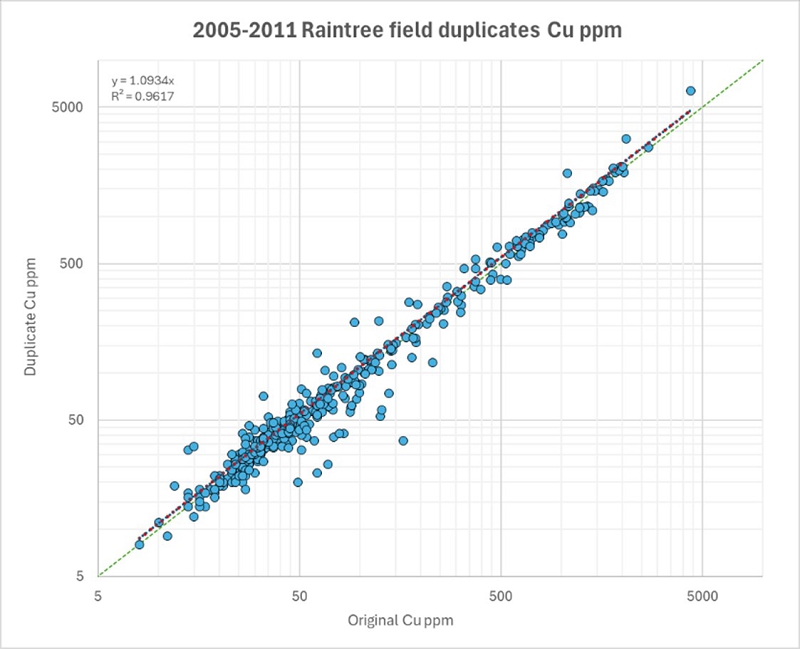
(Source:
MMTS, 2024)
| Figure 8-22 |
Raintree Deposit Field Duplicate Scatter Plot, Copper |
Overall,
analysis of duplicate samples in Raintree do not show evidence of selection bias at the core sampling level, indicate moderate heterogeneity
of gold mineralization, and show that significant bias is unlikely at the sample preparation stage.
| 8.3.3 | QAQC
Island Mountain Deposit |
|
8.3.3.1 | Island
Mountain Blanks |
The
summary of gold assays of blanks in the Island Mountain sample stream is given in Table 8-13 and shows an overall failure rate of 0.6%.
These results are acceptable with little evidence of contamination.
| Table 8-13 |
Summary of Gold Assays of Blanks, Island Mountain Deposit |
| Blank |
Year
used |
Count |
>
5*DL warning |
%
> 5*DL |
>
10*DL fail |
%
> 10*DL |
| BLANK |
2009 |
12 |
0 |
0.0% |
0 |
0.0% |
| BLANK_SS |
2010-2011 |
328 |
4 |
1.2% |
2 |
0.6% |
| Total |
2009-2011 |
340 |
4 |
1.2% |
2 |
0.6% |
The
sequential plot of gold assays of blank material is given in Figure 8-23.
| Effective Date: September 12, 2024 | Page 101 of 181 |
| | S-K 1300 Technical Summary Report – Whistler Project, Alaska |
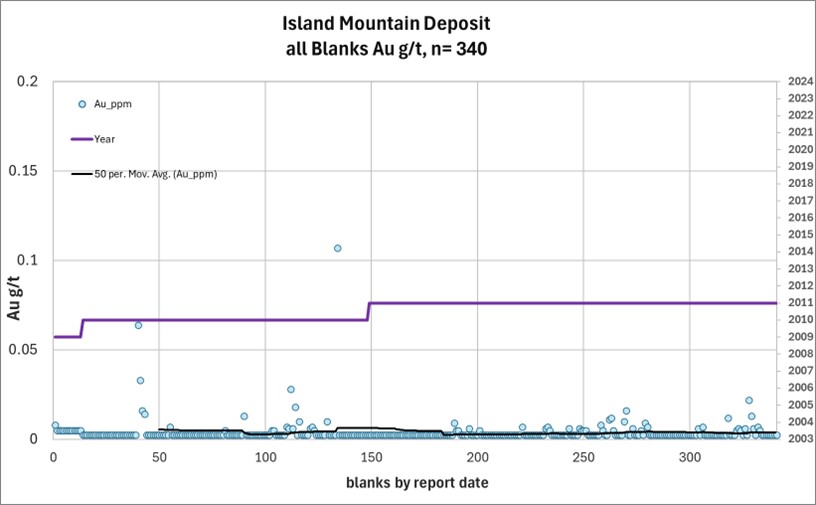
(Source:
MMTS, 2024)
| Figure 8-23 |
Sequential Plot of Gold Assays of Blanks, Island Mountain
Deposit |
The
sequential plot of copper assays of samples of blank material is given in Figure 8-24 and shows 2 results >80ppm which is inconsequential.
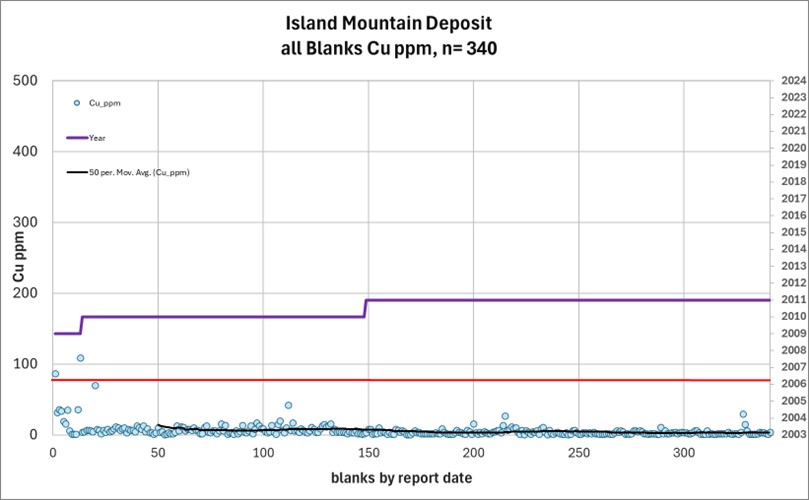
(Source:
MMTS, 2024)
| Figure 8-24 |
Sequential Plot of Copper Assays of Blanks, Island Mountain
Deposit |
| Effective Date: September 12, 2024 | Page 102 of 181 |
| | S-K 1300 Technical Summary Report – Whistler Project, Alaska |
| 8.3.3.2 | Island
Mountain CRMs |
The
summary of results of gold assays for CRM samples included in drilling in Island Mountain are presented in Table 8-14. The overall percentage
of failures is 1.8% and the error is 0.3% indicating a slight positive bias carried the two most frequently used CRMs OREAS 50c and 52c.
The performance is very good.
| Table 8-14 |
Island Mountain Deposit CRM Summary, Gold |
| CRM |
Year
used |
Count |
EV
Cu % |
AVG
Cu % |
%
Error |
Low
Fail |
High
Fail |
%
Fail |
| OREAS-52Pb |
2010 |
16 |
0.307 |
0.326 |
5.8% |
0 |
0 |
0.0% |
| OREAS-52c |
2010-2011 |
133 |
0.346 |
0.348 |
0.4% |
1 |
0 |
0.8% |
| WP-CO1 |
2009 |
8 |
0.48 |
0.478 |
-0.5% |
0 |
0 |
0.0% |
| OREAS-53Pb |
2010 |
26 |
0.623 |
0.617 |
-1.0% |
2 |
0 |
7.7% |
| OREAS-50c |
2010-2011 |
103 |
0.836 |
0.838 |
0.2% |
2 |
1 |
2.9% |
| WP-MG1 |
2009 |
5 |
1.715 |
1.686 |
-1.7% |
0 |
0 |
0.0% |
| OREAS-54Pa |
2010 |
30 |
2.9 |
2.925 |
0.8% |
0 |
0 |
0.0% |
| WP-HG1 |
2009 |
5 |
4.693 |
4.698 |
0.1% |
0 |
0 |
0.0% |
| Total |
2009-2011 |
326 |
|
|
|
5 |
1 |
1.8% |
The
normalized process control chart of gold assays in the Island Mountain drilling is presented in Figure 8-24 showing the mean close to
the expected value and 4 of the 6 failures. Two very strong low failures are not shown, one of which is likely caused by an Au data shift
in the ALS Chemex certificate (sample 813068 in certificate FA10123328).
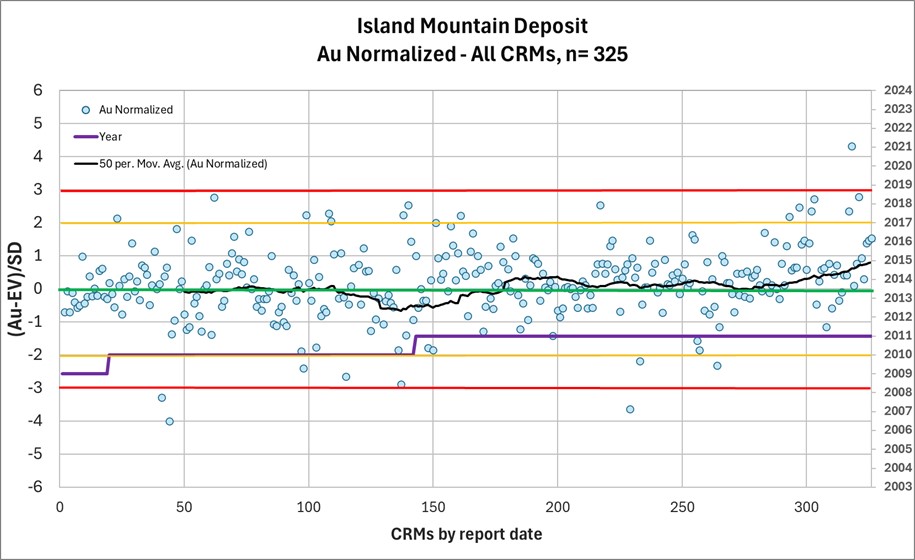
(Source:
MMTS, 2024)
| Figure 8-25 |
Island Mountain Deposit Normalized Process Control Chart,
Gold |
| Effective Date: September 12, 2024 | Page 103 of 181 |
| | S-K 1300 Technical Summary Report – Whistler Project, Alaska |
The
summary of results of 326 copper assays of CRMs in Island Mountain is given in Table 8-15 and shows a higher-than-expected overall failure
rate of 13.5% with overall percent error of -0.5% indicating a moderate negative bias to the copper assays of the CRMs. As was noted
under 8.3.2.2, CRM OREAS 54Pa again performed very poorly with a 43% failure rate and a general under-performance approaching 5% (ALS
Chemex Cu-OG62 method).
| Table 8-15 |
Island Mountain Deposit CRM Summary, Copper |
| CRM |
Year
used |
Count |
EV
Cu % |
AVG
Cu % |
%
Error |
Low
Fail |
High
Fail |
%
Fail |
| WP-MG1 |
2009 |
5 |
0.2594 |
0.269 |
3.5% |
0 |
2 |
40.0% |
| WP-CO1 |
2009 |
8 |
0.2802 |
0.277 |
-1.2% |
1 |
1 |
25.0% |
| OREAS-52Pb |
2010 |
16 |
0.3338 |
0.336 |
0.7% |
2 |
3 |
31.3% |
| OREAS-52c |
2010-2011 |
133 |
0.344 |
0.344 |
0.0% |
5 |
4 |
6.8% |
| OREAS-53Pb |
2010 |
26 |
0.546 |
0.531 |
-2.8% |
1 |
0 |
3.8% |
| WP-HG1 |
2009 |
5 |
0.616 |
0.634 |
2.8% |
0 |
1 |
20.0% |
| OREAS-50c |
2010-2011 |
103 |
0.742 |
0.735 |
-0.9% |
7 |
4 |
10.7% |
| OREAS-54Pa |
2010 |
30 |
1.55 |
1.488 |
-4.2% |
13 |
0 |
43.3% |
| Total |
2009-2011 |
326 |
|
|
|
29 |
15 |
13.5% |
The
normalized process control chart is presented in Figure 8-26 and shows that at the end of June 2010 into the first week of July 2010,
over several certificates, ALS Chemex was not able to accurately measure Cu concentration in any of the blindly inserted CRMs, resulting
in a significant low bias for the data points 19-50 as plotted. The data then shifts to a period of inconsistent Cu results with a weak
high bias and several high outliers for the remainder of 2010. The 2011 drill campaign results are moderately biased low with several
failures between July and September (data points 142-230) before turning more consistent and within the +/-3 SD line.
| Effective Date: September 12, 2024 | Page 104 of 181 |
| | S-K 1300 Technical Summary Report – Whistler Project, Alaska |
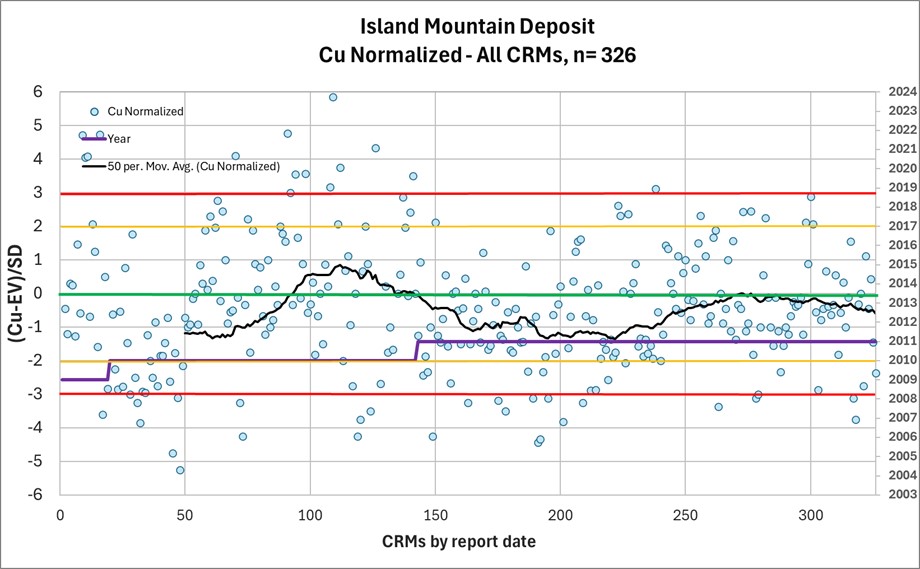
(Source:
MMTS, 2024)
| Figure 8-26 |
Island Mountain Deposit Normalized Process Control Chart |
The
process control chart for CRM OREAS-50c is given in Figure 8-26 and shows that despite the high failure rate of 10.7% at high volume
the results are seen to indicate little bias with the mean close to the expected value of 0.742% Cu. Also, the 11 noted failures are
generally very close to the +/-3SD failure threshold.
| Effective Date: September 12, 2024 | Page 105 of 181 |
| | S-K 1300 Technical Summary Report – Whistler Project, Alaska |
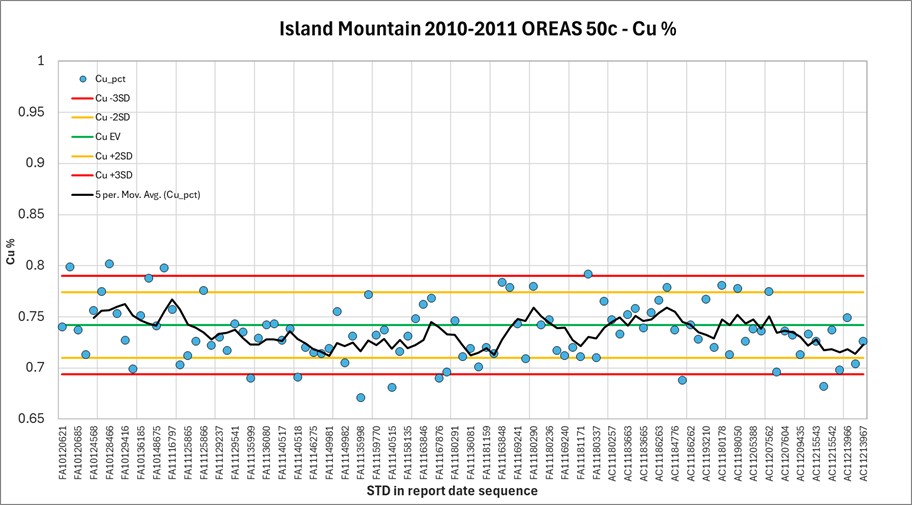
(Source:
MMTS, 2024)
| Figure 8-27 |
Process Control Chart Island Mountain CRM OREAS-50c,
Copper |
For
drilling in Island Mountain, analysis of the CRMs shows fluctuating results for Cu and ALS Chemex should have been requested to investigate
their Cu-OG62 Cu ore grade method performance despite OREAS 54Pa’s too-high Cu grade being unsuitable for accuracy control at Island
Mountain. MMTS sees no indication of bias material to the resource estimate.
| 8.3.3.3 | Island
Mountain Duplicates |
The
simple statistics of the gold and copper assays of the field duplicates from drilling in 2010 and 2011 at Island Mountain is given inTable
8-16. The means of the gold assays of the duplicate pairs show a 0.74% ARD avg. difference with the originals higher, while the originals
of the copper assay pairs are slightly lower than the duplicates, albeit at low grades overall. The HARD statistic expectation of 70%
is more than met for copper and only 59% for gold, indicating higher heterogeneity than Whistler and Raintree. This is being reflected
in the significant but generally un-biased scatter around the 1-1 line in Figure 8-28.
| Table 8-16 |
Island Mountain Field Duplicate Simple Statistics |
| DUP
count |
Element |
Units |
Average |
Count
>10% HARD |
%
<10% HARD |
| Primary |
Duplicate |
ARD
% Avg. |
| 322 |
Gold |
g/t |
0.270 |
0.249 |
0.74% |
132 |
59% |
| 322 |
Copper |
ppm |
410 |
424 |
-2.62% |
39 |
87.9% |
The
scatter plot of field duplicate assays for gold is given in Figure 8-28 and shows the considerable scatter with low coefficient of correlation.
The slope at y=0.77 indicates very strong bias towards the original but the trend line is strongly influenced by two high-grade outliers.
Removing those two data points results in y=1.007 and R2 of 0.93 and would also reduce the 0.74% avg. ARD to practically 0%.
| Effective Date: September 12, 2024 | Page 106 of 181 |
| | S-K 1300 Technical Summary Report – Whistler Project, Alaska |
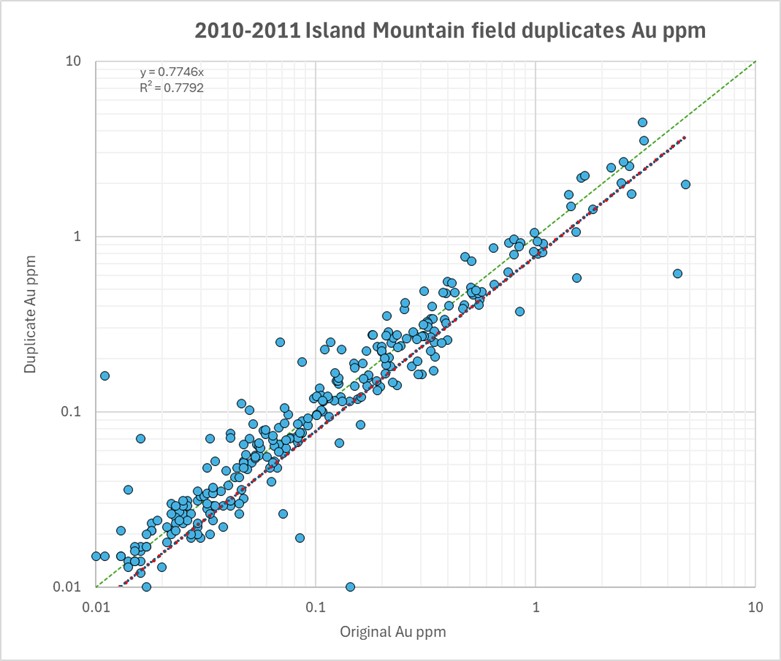
(Source:
MMTS, 2024)
| Figure 8-28 |
Island Mountain Deposit Field Duplicate Scatter Plot,
Gold |
The
scatter plot of copper field duplicate assays is given in Figure 8-28 and shows the excellent correlation of the un-biased pairs. The
grade distribution in the data appears very consistent between 50ppm and approx. 600ppm.
| Effective Date: September 12, 2024 | Page 107 of 181 |
| | S-K 1300 Technical Summary Report – Whistler Project, Alaska |
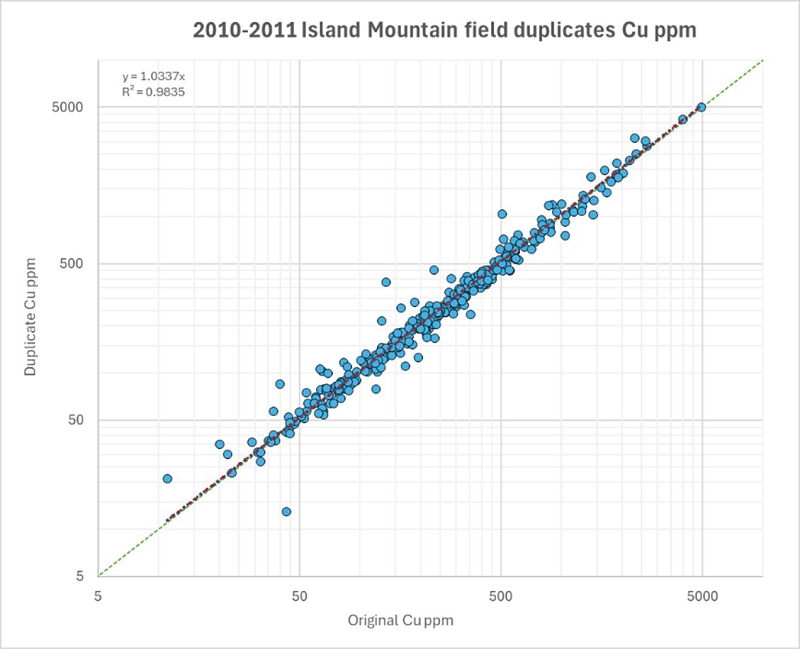
(Source:
MMTS, 2024)
| Figure 8-29 |
Island Mountain Deposit Field Duplicate Scatter Plot,
Copper |
Analysis
of duplicate samples in Island Mountain do not show evidence of selection bias at the core sampling level but indicate higher heterogeneity
of gold mineralization in comparison to the Whistler and Raintree deposits.
| 8.4 | Sample
Preparation, Analyses and Security Conclusions and Recommendations |
The
QP concludes that the sample preparation, analysis, and security are of sufficient quantity and quality for resource estimation. The
author further recommends that:
| ● | For
completeness, QAQC data for silver blanks and duplicates should be collected from the historical
database for analysis in future studies that include silver in the resource estimate. None
of the CRMs used before 2023 were certified for silver. The lack of silver QAQC samples is
not of material significance currently because silver is a minor contributor to the resource
estimate. |
| ● | The
locally sourced material for blanks used prior to 2009 gives inconclusive results for assessing
contamination as it appears to contain trace mineralization. This is particularly pronounced
in the Whistler Deposit where most of the sampling was in 2008 and earlier. Future drilling
campaigns should use coarse crush limestone as was done in 2023 or alternatively a commercially
prepared blank material. |
| ● | 3
CRMs with varying Au-Cu-Ag concentrations that approach the expected deposit grades be used
to better represent low-grade, medium-grade, and high-grade mineralization. The CRMs are
to be inserted blindly and at roughly equal ratios.
|
| Effective Date: September 12, 2024 | Page 108 of 181 |
| | S-K 1300 Technical Summary Report – Whistler Project, Alaska |
This
section summarizes the verification work and practices employed by GoldMining and previous operators of the Whistler Project. The independent
Qualified Person (QP) responsible for Section 9 of this report, Sue Bird, P. Eng., believes the databases are sufficiently validated
and verified to support their use in mineral resource estimation for each of the deposit as presented herein.
Site
visits have been conducted on September 14, 2022, by Sue Bird, P.Eng. of MMTS and again on August 6, 2024. During the site visits collar
locations at Whistler and Raintree were validated. The core storage at both the Whiskey Bravo camp site was visited. The core from each
deposit was examined for mineralization with 4 samples for re-assay obtained in 2022 and an additional 5 samples obtained in 2024. The
buildings at the camp have been re-vamped since 2022 and have been used for the 2023 and 2024 drill programs. An aerial view of the camp
is given in Figure 9-1. The core storage area is also illustrated in Figure 9-2. It should be noted that much of the Whistler core is
also stored at a warehouse in Sterling, Alaska about 140 miles south of Anchorage. A core logging shed is shown in Figure 9-3.
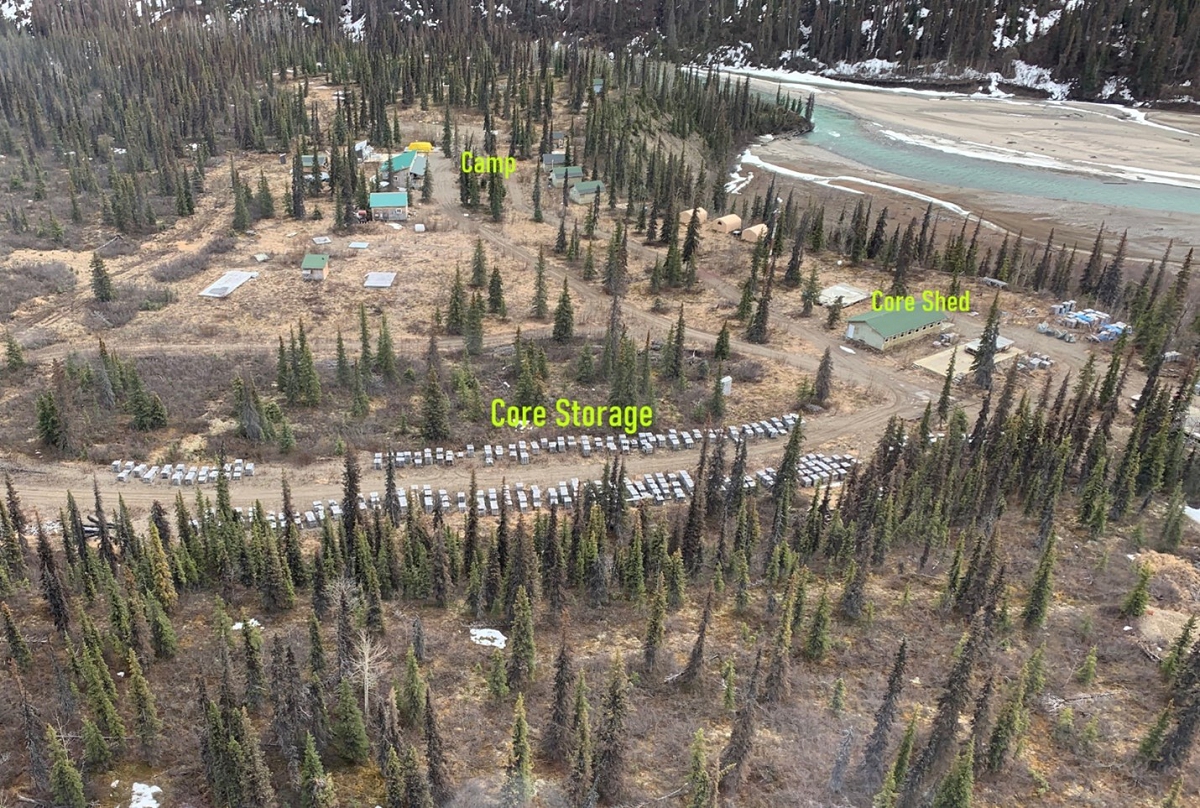
(Source:
MMTS, 2021)
| Figure 9-1 |
Aerial view of Whistler Camp |
| Effective Date: September 12, 2024 | Page 109 of 181 |
| | S-K 1300 Technical Summary Report – Whistler Project, Alaska |
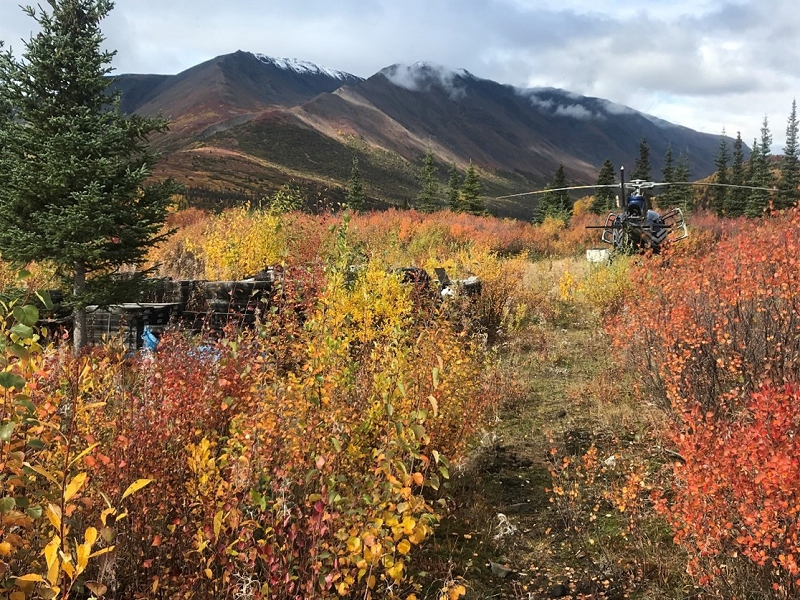
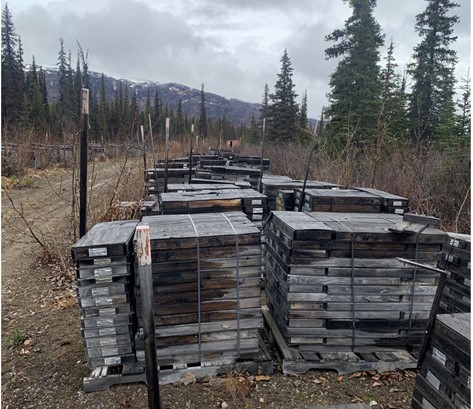
(Source:
MMTS, 2021)
| Figure 9-2 |
Drillcore Boxes in Storage Area |
| Effective Date: September 12, 2024 | Page 110 of 181 |
| | S-K 1300 Technical Summary Report – Whistler Project, Alaska |
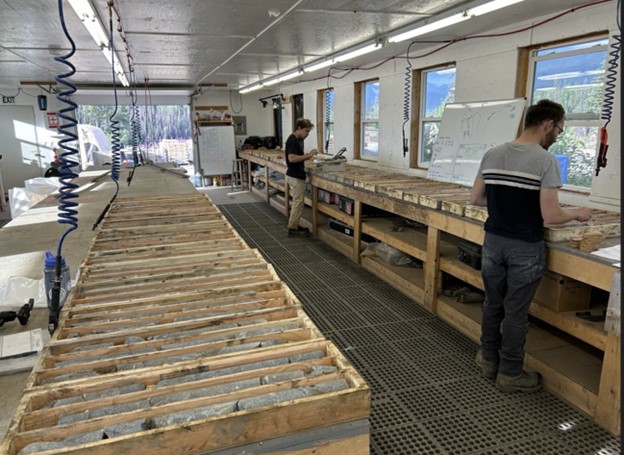
(Source:
U.S. GoldMining Inc, 2024)
| Figure 9-3 |
Core Logging Shed |
Four
intervals of half core were obtained for check assaying. Two sample from Island Mountain, and 1 from each of Whistler and Raintree. The
samples were chosen to be of mineralized intervals, with Au grades ranging from 0.223 gpt to 7.160 gpt and Cu grades between 0.146% and
0.449%. Results of this limited check assay program done in 2022 are shown in Figure 9-4 and Figure 9-5 for Au and Cu respectively. Ag
had only two samples above detection, both of which had a re-assay value higher than the original. The results indicate slightly lower
grades for the higher values of Au. However, it was also noted that the OREAS standards also had lower values than the certified grades,
particularly for Au. The results for both Au and Cu are reasonable when considering the outdoor storage area, the general scatter expected
for Au and the low results of the CRM material.
| Effective Date: September 12, 2024 | Page 111 of 181 |
| | S-K 1300 Technical Summary Report – Whistler Project, Alaska |
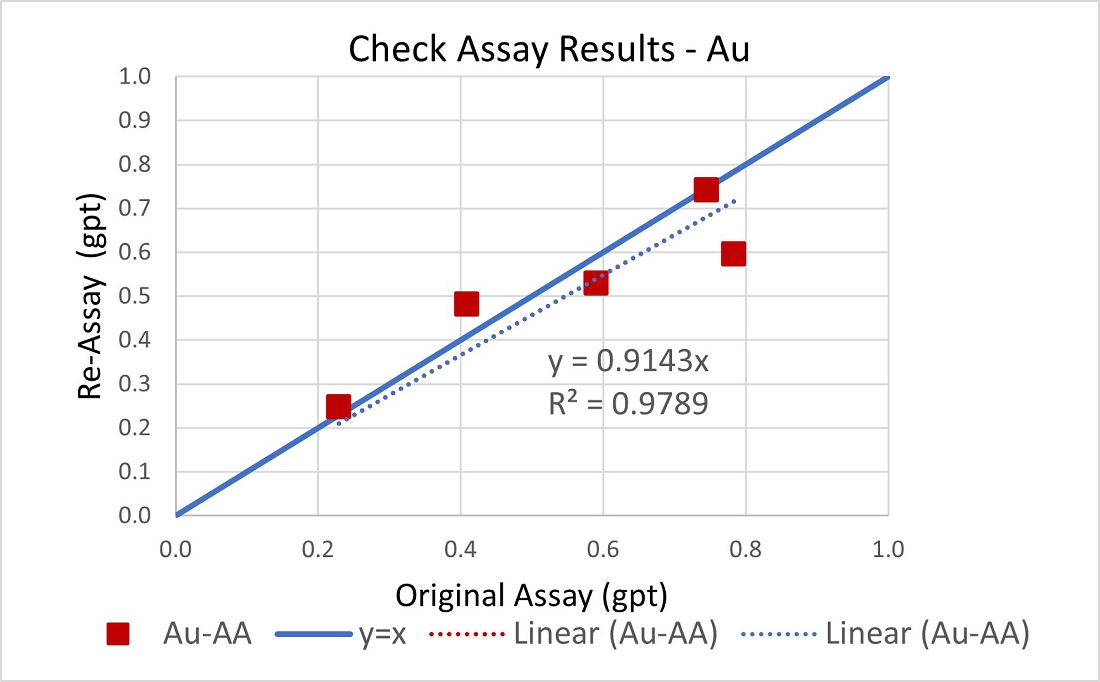
(Source:
MMTS, 2024)
| Figure 9-4 |
Check Assay Results from 2022 and 2024 Site Visits –
Au |
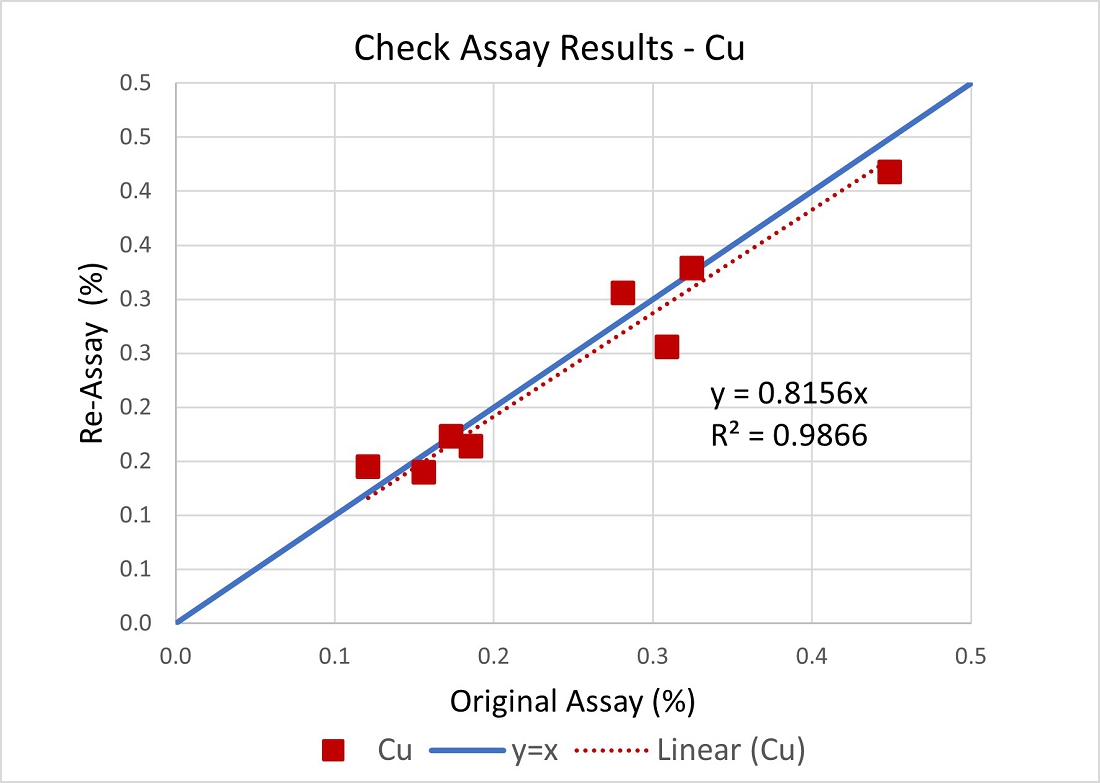
(Source:
MMTS, 2024)
| Figure 9-5 |
Check Assay Results from 2022 and 2024 Site Visits –
Cu |
| Effective Date: September 12, 2024 | Page 112 of 181 |
| | S-K 1300 Technical Summary Report – Whistler Project, Alaska |
The
most current version of the assay database was received on Sep. 11th, 2024. The database contains 27,994 sampled intervals,
excluding QAQC samples, across all areas of the Whistler project. No errors were noted for overlapping intervals or missing assay data.
| 9.3.1 | Certificate
Checks and Database Corrections |
The
assay database as received contained certificate numbers attached to the assay intervals, however for drill holes WH04-01 to WH04-04
two certificates from two laboratories should have been recorded. For validation purposes, MMTS compiled Au and Cu data from 49 randomly
selected certificates from years 2004-2023 and proceeded by comparing the resulting 3,071 RAW data against the data in the database (this
represents approx. 11% of the data, see Table 9-1).
Only
two data issues were detected:
| 1. | 2010
certificate FA10043640: 12 Au data show a small discrepancy, probably related to the proximity
to the ALS Chemex Au-AA23 detection limit (samples 755056 to 755073) |
| 2. | 2023
certificate FBK23002831: 8 samples were rerun at Bureau Veritas, likely because of a moderately
low Cu CRM. The rerun data should replace the original data. |
The
validation showed that for 2004 the original American Assay data for Au and Cu had been replaced by the re-assay data produced by ALS
Chemex data of 2004 and 2005, to which MMTS agreed.
| Table 9-1 |
Certificate Check Results |
| Assayed
Intervals |
27,994 |
| Intervals
Checked |
3,071 |
| %
Checked |
10.9% |
| Errors |
12 |
| %
Errors |
0.4% |
| Lab
corrections not updated in database |
8 |
| Total
Findings |
20 |
The
amount of data by interval length that is supported by certificate and QAQC data (blanks CRMs and field duplicates) is given in Table
9-2 and is reported by drilling year, not analysis as previously presented in the QAQC section. The percentage of assayed length fully
supported by certificate and QAQC in Whistler is 92% because of a limited amount of historical Cominco drill data, in Raintree and Island
Mountain it is 100%.
| Effective Date: September 12, 2024 | Page 113 of 181 |
| | S-K 1300 Technical Summary Report – Whistler Project, Alaska |
| Table 9-2 |
Summary of Data Supported by Certificate and QAQC |
| Year |
Whistler |
Raintree |
Island
Mountain |
| Assayed
Length (m) |
Has
Certificate
(m) |
Has
QAQC
(m) |
%
With Certificate and QAQC |
Assayed
Length (m) |
Has
Certificate
(m) |
Has
QAQC
(m) |
%
With Certificate and QAQC |
Assayed
Length (m) |
Has
Certificate
(m) |
Has
QAQC
(m) |
%
With Certificate and QAQC |
| 1986-1989 |
1,566 |
|
|
0% |
|
|
|
|
|
|
|
|
| 2004 |
1,865 |
1,865 |
1,865 |
100% |
|
|
|
|
|
|
|
|
| 2005 |
5,061 |
5,061 |
5,061 |
100% |
208 |
208 |
208 |
100% |
|
|
|
|
| 2006 |
696 |
696 |
696 |
100% |
845 |
845 |
845 |
100% |
|
|
|
|
| 2007 |
3,243 |
3,243 |
3,243 |
100% |
|
|
|
|
|
|
|
|
| 2008 |
2,660 |
2,660 |
2,660 |
100% |
615 |
615 |
615 |
100% |
|
|
|
|
| 2009 |
214 |
214 |
214 |
100% |
479 |
479 |
479 |
100% |
387 |
387 |
387 |
100% |
| 2010 |
4,500 |
4,500 |
4,500 |
100% |
3,164 |
3,164 |
3,164 |
100% |
4,956 |
4,956 |
4,956 |
100% |
| 2011 |
|
|
|
|
13,799 |
13,799 |
13,799 |
100% |
8,943 |
8,943 |
8,943 |
100% |
| 2023 |
2,048 |
2,048 |
2,048 |
100% |
|
|
|
|
|
|
|
|
| Total |
21,852 |
20,286 |
20,286 |
92% |
19,110 |
18,975 |
18,975 |
100% |
14,286 |
14,286 |
14,286 |
100% |
Check-assays
or umpire assays have been completed for parts of the 2004 and 2005 drilling and assaying campaigns, the data is presented under Section
8.3.1.4. Umpire assaying for the 2023 dataset has not been initiated at the time of this report.
In
2011, it was reported that collar locations for Island Mountain holes had been re-captured using a Trimble Geoexplorer 6000 GPS instrument
(<1 m accuracy) and that the intention was to re-survey most of the holes on the property in 2012 (Roberts, 2011a). DGPS collar re-survey
was completed in 2012.
| 9.5 | Data
Verification Conclusions and Recommendations |
The
QP concludes that the resource database provided is of sufficient quality for resource estimation. It is further recommended that:
| ● | At
least 10% of collar locations in each resource area, to include drilling from all years,
be surveyed with GPS equipment with <1 m accuracy. If significant deviations are determined
from the recorded values, all collars would need resurvey. |
| ● | U.S.
GoldMining continue to pursue matching of assay samples to certificates and collection of
missing certificates. |
| ● | Future
drilling should include third party check assays and the data should be appropriately maintained. |
| 9.6 | Statement
on Adequacy of Data |
The
QP is of the opinion that the data provided and used in the resource estimate for the Whistler project deposits is adequate for resource
estimation. There are no additional limitations to the exploration database for use in resource modeling.
| Effective Date: September 12, 2024 | Page 114 of 181 |
| | S-K 1300 Technical Summary Report – Whistler Project, Alaska |
| 10 | MINERAL
PROCESSING AND METALLURGICAL TESTING |
The
information contained in Section 10 regarding metallurgical testwork is intended to support and substantiate the metallurgical recoveries
used in the Resource Estimate. The information provided is the best available data but may not be fully optimized with respect to the
current resource. The metallurgical testwork was intermittently performed by different laboratories with different primary objectives
on select portions of the overall resource. Metallurgical testing for the Whistler and Island Mountain Deposits had previously been reported
by MMTS in 2015 and is repeated verbatim below solely for the benefit of continuity of data.
No
metallurgical testing was carried out on rocks from the Raintree West deposit, however given the similarities in geological setting,
host rock, mineralization and alteration between Raintree West and the Whistler Deposit, it has been assumed that metallurgical processes
and metal recoveries determined for the Whistler Deposit are a reasonable approximation for the Raintree West Deposit at this time.
Metallurgical
testing has been carried out in three phases starting with the 2004/2005 preliminary testing in Salt Lake City under the general supervision
of Kennecott and culminating in the two phases under Kiska Metals and conducted at G&T Laboratories in Kamloops during 2010-2012.
These three phases are described separately below.
| 10.1 | Summary
of Preliminary Metallurgical Testing, Whistler Deposit (Phase One) |
Preliminary
metallurgical test-work was carried out at Dawson Metallurgical Laboratories Inc. (DML) in Salt Lake City, Utah from September 2004 until
early 2005 with a final report being issued in March of 2005 by George Nadasdy. (Nadasdy, 2005). The work was carried out under the direction
of Rio Tinto Technical Services representing Kennecott.
Three
different sample composites were tested. The samples were differentiated by sample history and particle size and by lead/zinc content.
The three designations were Original Composite, New Core Sample and Low Lead-Zinc Composite.
A
total of approximately 180, coarse assay reject interval samples were received at DML on September 13, 2004, from Kennecott Exploration.
All the individual samples from the entire drillhole WH-04-05-21 (from 2.32 to 328.56 m) were received. Kennecott selected a mineralized
interval (from 117.6 to 200.2 m) from this drillhole for testing.
The
original composite was produced by including every other individual assay reject sample from the 117.6 to 200.2 metre mineralized interval.
The original composite represented a total of 42.2 m of material and weighed 88.7 kg. The composite was air dried, and stage crushed
to minus 10 mesh in preparation for testing. The minus 10 mesh composite was mixed in a “V” cone blender and split into batches.
A 50 kg test sample was rotary table split into 2.0 kg test charges. A 37.6 kg reserve sample was also made. All samples were kept in
the DML freezers to reduce sample oxidation.
Initial
testwork on the original composite produced low rougher concentrate copper grades due to sulfide activation (pyrite, galena and sphalerite
floating along with the chalcopyrite). On November 10, 2004, a second Whistler mineralized sample was received for testing. This second
sample was the remaining ½ of Kennecott’s cut core from the same drillhole (WH-04-05-21) and represented material from 140.6
to 155.3 m. Some of the higher-grade lead-zinc core was removed by Kennecott geologists and not included in this second sample. This
core sample was designated by as the “new core sample”. The new core sample weighed 20 kg; it was stage crushed to minus
10 mesh mixed in a “V” cone blender and then rotary table split into 2 kg test charges.
| Effective Date: September 12, 2024 | Page 115 of 181 |
| | S-K 1300 Technical Summary Report – Whistler Project, Alaska |
A
third Whistler mineralized sample was prepared at DML at the end of November for continued testwork and was designated as the low lead-zinc
composite. The low lead-zinc composite was made from the remaining individual coarse assay reject samples not used in the original composite
(from 117.6 to 200.2 m). At the direction of Kennecott, selected high grade lead-zinc samples were omitted from this low lead-zinc composite.
The low lead-zinc composite weighed 71 kg and was prepared in a similar fashion to the original composite.
Preliminary
metallurgical testwork included gravity concentration or flotation to recover the copper and gold. The three (3) mineralized samples
designated as: the original composite, the new core sample, and the low lead-zinc composite, as described above were tested from September
2004 through March 2005.
Testwork
conducted on the Whistler mineralized samples included the following:
| 1. | Original
Composite: DML comparative (ball mill) grind work index test; a gravity centrifugal concentration
and amalgamation test; a head assay screen at a (RM) P80=140 µm grind; rougher kinetic-reagent
scoping tests; rougher kinetic-pH tests (pH 9.3, 10.0 and 10.8); three (3) stage cleaning
tests at different primary and regrind sizes and cleaner tests at pH 9.3 or 11.0. |
| 2. | New
Core Sample: a gravity concentration and amalgamation test; a rougher kinetic grind series
P80=162, 111, 80 and 66 microns and a three (3) stage cleaner test at a P80=80µm primary
grind, a P80=48 µm regrind size and a cleaner pH of 9.3. |
| 3. | Low
Lead-Zinc Composite: a rougher kinetic test at a P80=80 µm grind; three (3) stage
cleaning tests at a P80=80µm primary grind and P80=37 µm regrind and a cleaner
pH of 9.3 or 11.0. A cleaner test was also conducted with SO2 added to the first
cleaner. A final cleaner test was conducted to generate a third cleaner concentrate for a
suite of assays for smelter evaluation. |
| 10.2.1 | Results
from Preliminary Testing |
The
initial work on the Original Sample resulted in lower than expected rougher and cleaner grades and high levels of lead and zinc reporting
to the cleaner concentrate. This was attributed to both the high lead and zinc in the feed and the fact that the composite was created
from assay rejects that had potentially aged at a relatively fine crush between core preparation and metallurgical testing.
The
high lead and zinc values in the Original Sample were essentially concentrated in two of the twenty-five intervals used to make up the
composite. For the two subsequent composites the high lead-zinc intervals were left out of the mix. In addition, the second sample to
be tested (New Core Sample) was produced from ½ section core that provided less opportunity for the deleterious effects of ageing
when stored under ambient atmospheric conditions at finer sizes.
In
general, it was found in the early work that gravity recovered gold was in the finer size ranges with an average gold grain size of minus
400 mesh (37 microns) so this avenue was not pursued in later testwork on the assumption that liberated gold would be recovered through
flotation.
| Effective Date: September 12, 2024 | Page 116 of 181 |
| | S-K 1300 Technical Summary Report – Whistler Project, Alaska |
In
addition, it was also found that a primary grind of ~80% passing 80 microns was required for best recovery of both copper and gold.
Below
is the table from the Dawson report indicating cleaning test results for the three composites (Table 10-1). The 3rd Cleaner
copper grade increased from 16% to 21% to 23% for the Original, Low Pb-Zn and New Core samples respectively. Copper recoveries were 80%
to 84% with gold ranging from 60% to 65%.
| Table 10-1 |
Three Stage Cleaning Tests |
P
– 2825: Kennecott – Whistler Project
Three
Stage Cleaning Test – pH 9.3 in Rougher and Cleaner |
| |
|
|
Calc.
Head |
Final
Trail |
No.3
Cleaner Concentrate |
Percent
Recovery |
| Test
No. |
Sample |
Grind
Prim/RG
P80=µm |
%
Cu |
ppm
AU |
%
Cu |
ppm
AU |
Wqt.% |
%
Cu |
ppm
Au |
%
Insol. |
Cu |
Au |
| |
|
|
|
|
|
|
|
|
|
|
|
|
| 14 |
Orig.
Comp. |
140/53 |
0.642 |
2.36 |
0.128 |
0.749 |
3.80 |
12.4 |
39.4 |
7.1 |
73.5 |
63.5 |
| 23 |
Orig.
Comp. |
80/34 |
0.635 |
2.56 |
0.087 |
0.842 |
3.20 |
16.4 |
51.9 |
7.2 |
82.6 |
64.8 |
| |
|
|
|
|
|
|
|
|
|
|
|
|
| 21 |
New
Core |
80/48 |
0.804 |
3.21 |
0.087 |
0.983 |
2.99 |
22.5 |
64.4 |
4.9 |
83.5 |
60.0 |
| |
|
|
|
|
|
|
|
|
|
|
|
|
| 30 |
Low
Pb-Zn |
80/37 |
0.531 |
2.54 |
0.077 |
0.942 |
2.04 |
20.8 |
74.1 |
5.5 |
79.9 |
59.4 |
| Cytec
3477 in grind at 0.015 lb/ton and NalPX in scavenger at 0.004 lb/ton. No additional collector added to either regrind
or cleaners. |
Cytec
3477 in grind at 0.015 lb/ton and NalPX in scavenger at 0.004 lb/ton. No additional collector added to either regrind or cleaners.
The
poor performance on the original composite material was attributed to the high lead and zinc content and the effects of sample size and
ageing. The New Core material responded best and the results with the Low Pb-Zn were close but not up to the level of the New Core material.
Thus, there was a significant improvement with the exclusion of the high Pb-Zn intervals and a further improvement with the “fresh”
half core. Crushed assay rejects are generally problematic for testwork with samples containing copper, lead and zinc minerals.
As
per the table above, regrind sizes ranged from 34 to 53 microns. This leaves some potential for finer regrinding to improve cleaner separations,
if necessary, in the future. In addition, there is further potential for copper cleaner enhancement with a higher pH regime in that part
of the circuit if it does not have a significant negative effect on gold recoveries.
The
DML report further indicates that in an analysis of cleaner test products the gold values tend to track closely with the deportment of
the copper as opposed to following the iron.
| 10.2.2 | Preliminary
Conclusions |
In
any future work care must be taken to ensure the material to be tested is as fresh as possible and has been stored in such a manner as
to minimize the potential for surface oxidation. The resource data must be analyzed to assess the presence, level and distribution of
lead and zinc throughout the deposit and appropriate samples selected for metallurgical testing so that they reflect the nature of the
resource and the likely plant feed. Care must also be taken to ensure that the copper and gold grades of the feed for any further testwork
reflect the expected levels in the resource.
| Effective Date: September 12, 2024 | Page 117 of 181 |
| | S-K 1300 Technical Summary Report – Whistler Project, Alaska |
For
first pass metallurgical testing reasonable copper and gold recoveries were achieved at less than optimum concentrate copper grades.
Care and attention to sample preparation and handling (as mentioned above) along with more in-depth testing should allow for improvements
in both recoveries and grades. Further reagent screening should be carried out both to enhance recoveries and selectivity and to attempt
to allow for processing at a coarser primary grind.
Combined
cleaner and scavenger tails accounted for the loss of 29% to 35% of the contained gold and 10% to 14% of the copper. These preliminary
cleaning tests all involved open circuit cleaning. In the normal course of more detailed flowsheet development (reagent and regrind optimization
plus closure of the cleaning circuit) one could potentially expect to be able to improve copper recoveries to ~85% into a concentrate
with a copper grade in the range of 25% to 27%. A combination of the flotation improvements and the application of additional gold recovery
techniques in the cleaner circuit might potentially improve gold recovery to the 75% range.
In
addition, as mentioned above, future test-work should be carried out on material with feed grades reflecting the likely grade that would
be mined and sent to the plant. Lower feed grades tend to somewhat reduce metal recoveries.
| 10.3 | Summary
of Preliminary Metallurgical Testing, Island Mountain Deposit (August 21, 2010) (Phase 2) |
Two
holes (IM09-001 and IM09-002) were drilled at Island Mountain in 2009. These holes produced interesting gold and copper values and what
appeared to be “interesting” associations between the contained gold, copper, pyrrhotite and magnetite. It was decided to
carryout preliminary metallurgical testwork on the available sample material to assess the mineralogical associations and the potential
for effective treatment of the rock to recover gold and copper. Core logging indicated an apparent difference between the upper and lower
mineralized intervals of the drillhole. The upper mineralized interval had higher copper, but lower gold values, and the lower mineralized
interval tended to contain more pyrrhotite. The lower region also represented the greater tonnage potential.
The
drill data had been assessed in terms of a gold equivalent whereby copper and silver values were added to the gold value based on assumed
recoveries of 75% for Au and Ag and 80% for Cu. Assumed prices were US$550/oz, US$8/oz, US$1.50/lb respectively for the three metals.
A simple gold equivalent cut-off of 0.30 gpt (US$5.30/tonne at US$550/oz) was taken. Based on this cut-off, 72 out of 81 two metre intervals
were selected from the upper 162 m of IM09-001 to form an Upper Composite. Similarly, 75 out of 111 two metre intervals were selected
to form a Lower Composite from the lower 222 m of the hole. From hole IM09-002, only 20 of 99 two-metre intervals surpassed the selected
cut-off. As higher-grade intervals were distributed erratically throughout the length of the hole none of this material was used for
the metallurgical work.
Quarter
core was available for composite preparation, and it was shipped to G&T Metallurgical in Kamloops BC for composite assembly and the
metallurgical testing.
| Effective Date: September 12, 2024 | Page 118 of 181 |
| | S-K 1300 Technical Summary Report – Whistler Project, Alaska |
Table
10-2 provides the analyses of the elements of interest in the two composites.
| Table 10-2 |
Summary of Analysis of Composites from IM09-001 and IM09-002 |
| |
Cu |
Pb |
Zn |
Fe |
S |
Ag |
Au |
C |
| % |
% |
% |
% |
% |
gpt |
gpt |
% |
| Upper
Comp Head - 1 |
0.15 |
0.06 |
0.02 |
8.50 |
2.36 |
3.20 |
0.49 |
0.10 |
| Upper
Comp Head - 2 |
0.15 |
0.06 |
0.02 |
8.30 |
2.08 |
3.70 |
0.44 |
0.09 |
| Average |
0.15 |
0.06 |
0.02 |
8.40 |
2.22 |
3.45 |
0.46 |
0.09 |
| Lower
Comp Head - 1 |
0.050 |
0.06 |
0.01 |
5.70 |
2.77 |
2.30 |
0.80 |
0.17 |
| Lower
Comp Head - 2 |
0.048 |
0.06 |
0.01 |
5.90 |
2.82 |
1.60 |
0.90 |
0.19 |
| Average |
0.049 |
0.06 |
0.01 |
5.80 |
2.80 |
1.95 |
0.85 |
0.18 |
The
copper values in the Upper Composite are on the lower side of normal feed grades whereas the copper values in the Lower Composite are
well below where one would generally expect to make saleable copper concentrate grades with any significant recovery. The gold however,
particularly in the Lower Composite, contributes a significant value to the feed.
Various
processing options were applied to the sample material to assess both the association between the gold and the other minerals and to
assess the potential for economic recovery of the copper and gold.
The
preferred and simplest option would be to produce a saleable copper concentrate containing the bulk of the copper and the bulk of the
gold. Another possible route would be to leach the gold from the whole ore with cyanide. The leaching approach could possibly produce
good gold recovery but would not recover copper values and would likely involve significant cyanide consumption due to the copper content
of the feed. Hybrid approaches would involve the selective flotation of a saleable copper concentrate with some of the gold and leaching
of some or all the flotation tailings to recover un-floated gold values.
As
well as recovery considerations, a significant concern in cyanide leaching arises from the consumption of cyanide by other metals and
minerals in the feed material. Of particular interest are copper and pyrrhotite. Depending on the form and activity of the copper and
iron minerals significant quantities of cyanide can be tied up as copper and iron cyanides.
The
current test program included bulk flotation of copper and gold, selective flotation of copper, cyanidation of the feed material and
cyanidation of the combined tailings from selective open circuit cleaning tests performed on each of the composites. Due to the expectation
that the Lower Composite likely represented the greater portion of “minable” material testwork addressed this sample with
confirmatory work then being applied to the Upper Composite.
| Effective Date: September 12, 2024 | Page 119 of 181 |
| | S-K 1300 Technical Summary Report – Whistler Project, Alaska |
| 10.3.5 | Metallurgical
Results |
Bulk
Flotation
Various
grinds plus some pH modifications were applied to the bulk rougher flotation of both composites. In general, the best copper recoveries
were achieved with flotation at a grind of ~80% passing 100 microns and a pH of 10. Gold recoveries were not as sensitive to the changes.
Table 10-3 shows a summary of the bulk flotation results.
| Table 10-3 |
Bulk Flotation Results |
| Material |
Feed |
Copper
Conc |
Rec |
Feed |
Gold
Conc |
Rec |
| %
Cu |
%
Cu |
% |
gpt |
gpt |
% |
| Upper
Composite Rougher |
0.15 |
0.90 |
79.66 |
0.50 |
2.82 |
74.41 |
| Lower
Composite Rougher |
0.05 |
0.41 |
89.15 |
0.96 |
7.12 |
80.41 |
| Lower
Composite Rougher |
0.05 |
0.31 |
87.94 |
0.94 |
5.41 |
81.02 |
| Lower
Composite Cleaner |
0.05 |
1.40 |
76.02 |
0.94 |
39.40 |
70.73 |
Copper
recoveries were reasonable considering the low head grades – particularly in the case of the Lower Composite. However, given the
value of gold in the feed, gold recoveries were too low. In addition, a saleable copper concentrate would require a 15-to-20-fold increase
in the copper grade which would further reduce the recovery of both metals.
The
low gold recoveries also indicate that there is gold associated with some other mineral that is not floating in the non-selective bulk
circuit.
Selective
Flotation
Reagent
changes were made to try and float a cleaner copper concentrate using open circuit cleaning.
| Table 10-4 |
Selective Cleaner Flotation |
| Material |
Feed |
Conc |
Rec. |
Rougher |
Feed |
Conc |
Rec. |
Rougher |
| |
%
Cu |
%
Cu |
Cu
- % |
Rec. |
Au
gpt |
Au
gpt |
Au
- % |
Rec. |
| Upper |
0.14 |
22.5 |
63.4 |
77.3 |
0.50 |
51.3 |
42.7 |
61.5 |
| Lower |
0.05 |
23.3 |
70.6 |
84.1 |
0.99 |
294 |
44.0 |
45.6 |
The
selective flotation produced similar but somewhat lower copper rougher recoveries than those achieved in the bulk flotation circuit (Table
10-4). There is a potential to improve these with further optimization. The copper loss between roughing and cleaning was like that experienced
in the bulk circuit. Both these aspects can be addressed by further reagent and operating condition adjustments. Further testwork with
closed circuit cleaning will significantly reduce the cleaning circuit losses. Gold recovery was much lower during roughing and was significantly
reduced during cleaning for the Upper Composite. This confirms the earlier suggestion that there is a significant portion of the gold
that is associated with some mineral or minerals other than the copper bearing ones.
The
whole ore leach approach worked well – particularly for the Lower Composite (Table 10-5).
| Effective Date: September 12, 2024 | Page 120 of 181 |
| | S-K 1300 Technical Summary Report – Whistler Project, Alaska |
| Table 10-5 |
Whole Ore Cyanidation |
| |
Feed |
Residue |
Recovery |
Cyanide |
Cyanide |
| Material |
|
|
|
Strength |
Consumption |
| |
(gpt) |
(gpt) |
(%) |
(kgpt) |
(kgpt) |
| Upper
Composite |
0.54 |
0.06 |
89.06 |
2.00 |
1.82 |
| Lower
Composite |
0.82 |
0.08 |
90.22 |
0.50 |
0.46 |
For
both composites ~90% of the gold was extracted in 48 hours. Higher solution strength was required for the Upper Composite, and this resulted
in significantly higher cyanide consumption.
| 10.3.7 | Leaching
of Selective Flotation Tails |
Based
on the results of the whole ore leach and the selective cleaner flotation, the flotation tailings for both composites were leached in
cyanide for 48 hours at solution strength of 0.50 kgpt (Table 10-6).
| Table 10-6 |
Cyanidation of Selective Flotation Tailings |
| Material |
Feed
(gpt) |
Residue
(gpt) |
Recovery
(%) |
Cyanide
Strength
(kgpt) |
Cyanide
Consumption
(kgpt) |
Flotation
+ |
| Cyanidation |
| Recovery |
| (%) |
| Upper
Composite |
0.18 |
0.08 |
56.52 |
0.50 |
0.40 |
75.08 |
| Lower
Composite |
0.51 |
0.09 |
81.44 |
0.50 |
0.38 |
89.60 |
Leaching
results were particularly good for the Lower Composite at 81% and the overall recovery by flotation and cyanidation was almost 90%. Similar
to the results of the whole ore leach, the leaching conditions for the Upper Composite can likely be optimized to improve the extent
and rate of leaching for the flotation tailings from the Upper material.
Potentially
90% of the gold in the Lower Composite can be recovered either by direct cyanidation or by flotation followed by cyanidation of the flotation
tailings. Similarly, almost 90% of the gold can be leached from the Upper Composite and further work should improve the overall gold
recovery from this material by the combined flotation-leach approach.
More
in depth work should be performed to improve flotation grades and recoveries. In addition, once an optimized flotation approach has been
established the opportunities to produce a high-grade copper concentrate followed by the production of a low-grade gold concentrate for
subsequent leaching should be investigated. This could substantially reduce the capital and environmental ramifications of whole ore
or full tailings leaching.
The
preliminary testing Indicated that the Island Mountain material tested is amenable to copper recovery by flotation and that the gold
is relatively free milling. This is particularly true of the greater portion of the material represented by the Lower Composite. The
results indicate that in the range of 90% of the gold in the Lower Composite can be recovered by either whole ore leaching or a combination
of flotation and leaching of the tailings. With further development work, copper flotation recoveries will likely rise to the 80% range
for the Lower Composite.
| Effective Date: September 12, 2024 | Page 121 of 181 |
| | S-K 1300 Technical Summary Report – Whistler Project, Alaska |
Similarly,
gold recovery in the range of 90% can be achieved by whole ore leaching of the Upper Composite. Further flotation work on the Upper Composite
will improve both copper and gold recoveries to concentrate.
For
both materials it was concluded that further metallurgical development and assessment work would still be required to develop the best
flowsheet with respect to capital and operating costs, metal recoveries and overall economics.
| 10.4 | Summary
of Whistler Deposit Testwork (2012) (Phase 3) |
The
final round of work was also carried out at G&T Metallurgical Laboratories, now part of ALS Metallurgy, there being continuity of
personnel and experience with the Island Mountain testwork previously reported.
The
work commenced in August 2012 and was completed by year end and the results presented in its report KM3499 of January 2013.
| 10.4.1 | Metallurgical
Samples |
Initial
work was conducted on core from the 2008 drilling campaign, on sample 08-08 which had been kept in carefully controlled conditions and
was believed to be still fresh. Arrangements had been made to obtain a sample from a similar hole planned for the summer 2012 drilling
campaign as a “calibration” check to validate its freshness, especially in view of the aging effects reported in the Kennecott
testwork. Unfortunately, the cancellation of the 2012 campaign negated this process; however, as is evident from the results presented
below, there is no reason to suspect any impact of oxidation on flotation response.
What
was a greater concern with respect to this sample was that, following the update to the geological model reported in AMC’s letter
report of November 2012, it might have been insufficiently representative of the bulk of the mineralization being predominantly in the
central quartz-breccia zone, representing only 20% of the tonnage, although 30% of the metal content.
Accordingly,
a second sample, 10-19 from the 2010 drilling campaign, more representative of the Main Stage Porphyry, although right on the margin
of the proposed ultimate pit, was selected for additional tests and in fact became the basis for setting the predicted metallurgical
parameters.
Both
samples had been divided into high grade, medium grade and low-grade samples in accordance with gold grades, with most of the work carried
on the medium grade samples, being closer to Resource grades.
Sample
grades are tabulated in Table 10-7.
| Table 10-7 |
Sample Head Grades |
| Sample |
%Cu |
%Fe |
%S |
Au
gpt |
%C |
| 08-08
MG (master) |
0.12 |
5.8 |
3.6 |
0.53 |
0.76 |
| 08-08
HG |
0.50 |
4.9 |
1.8 |
1.78 |
0.67 |
| 08-08
LG |
0.08 |
4.1 |
2.7 |
0.34 |
1.30 |
| 10-19
MG |
0.22 |
2.6 |
1.9 |
0.51 |
1.09 |
| 10-19
HG |
0.17 |
3.3 |
1.1 |
0.96 |
1.42 |
| 10-19
LG |
0.22 |
3.4 |
1.7 |
0.38 |
1.24 |
| Effective Date: September 12, 2024 | Page 122 of 181 |
| | S-K 1300 Technical Summary Report – Whistler Project, Alaska |
No
mineralogical work was carried out. However normative mineralogy calculations show that Sample 08-08 generally has almost twice the pyrite
content of Sample 10-19. Sample 08-08 was like Island Mountain in this respect.
The
testwork program focused mainly on conventional copper flotation; however, it soon became evident that improving gold recovery was key.
Therefore, like the direction taken with Island Mountain, the program included work on cyanidation of cleaner tails and investigation
of enhancing gold recovery with pyrite concentrate production.
The
flotation and cyanidation testwork flowsheets are shown in Figure 10-1 (abstracted from the ALS KM3499 report).
The
results of the metallurgical testwork for a conventional comminution/flotation flowsheet are summarized below.
A
single standard Bond ball mill work index test was carried out on 10-19 mg composite towards the end of the program, and at a closing
size of 106 µm.
The
Bond ball mill work index (BWI) was found to be 19.9 kWh/t (compared to the Island Mountain value assumed for the initial flowsheet design
of 18.5 kWh/t). This result puts Whistler in the very hard range of ball mill hardness.
No
SAG mill testing (e.g.) JK Drop weight or SMC tests were included in the program, nor indeed any Bond rod mill work index tests. Some
industry standard benchmarks and approximations have been used in setting appropriate SAG mill design criteria. It is recommended that
these additional comminution tests be a high priority for the next stage of testwork.
Key
parameters in the copper flotation tests were:
| ● | Primary
grind target was generally 100 µm (some later tests, following the receipt of the BWI
result, were done in the 150-200 µm range). |
| ● | Regrind
target was generally 20 µm (test 1 at 76µm was a procedural error). |
| ● | Cytec
3418A, a specialist copper/precious metal flotation reagent, was used as the primary copper
sulphide mineral collector. |
| ● | pH
in the rougher and cleaner circuits was generally maintained at 10 and 11 respectively, using
hydrated lime. |
| Effective Date: September 12, 2024 | Page 123 of 181 |
| | S-K 1300 Technical Summary Report – Whistler Project, Alaska |
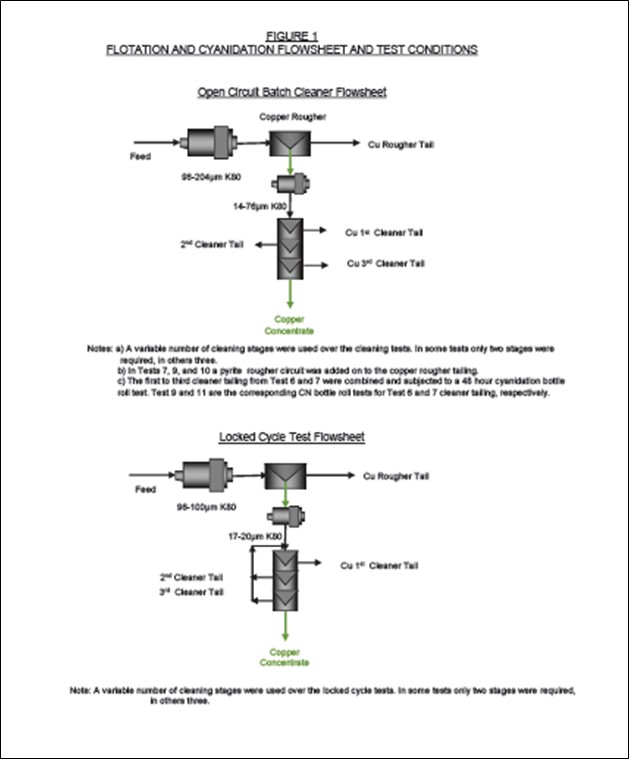
(Source:
MMTS, 2015)
| Figure 10-1 |
Flotation and Cyanidation Flowsheet and Test Conditions
Flotation |
| Effective Date: September 12, 2024 | Page 124 of 181 |
| | S-K 1300 Technical Summary Report – Whistler Project, Alaska |
The
key results are tabulated and graphed in Figure 10-2 (abstracted from the ALS metallurgy KM3499 report).
In
summary the main findings were as follows:
| ● | Open-circuit
batch flotation testing achieved consistently 80-85% copper recovery to a 25% Cu concentrate
grade; however gold recovery was lower (40-50%) due to lower rougher recoveries and low cleaner
recoveries with significant deportment of gold to cleaner tailings streams. |
| ● | From
the flotation results, the gold associations were inferred as follows: |
| | | |
| ● | 60%
with chalcopyrite |
| ● | 20%
with pyrite (± chalcopyrite) |
| ● | 20%
with gangue minerals |
The
QP strongly recommends that mineralogical studies be a high priority for the next phase of testwork.
| ● | Some
attempts were made at recovering gold to a pyrite concentrate for subsequent treatment (a
possible alternative to cyanidation of cleaner tails), but overall recovery fell, and later
work focused on the locked cycle tests as a means of recovering gold reporting in recirculating
streams that were not accounted for in simple batch tests. |
| ● | Locked
cycle tests on both the 08-08 and 10-19 samples proved to be the key to unlocking gold value
with substantial improvements to gold recovery from the recycle of intermediate streams (short
of pilot-plant testing, locked cycle tests are the best way of replicating a full-scale flotation
plant). Averaging the results from both and rounding numbers appropriately yielded the following: |
| | | |
| ● | 92%
copper recovery to a 25% Cu concentrate grade |
| ● | On
receipt of the higher-than-expected BWI results with a significant impact on both capital
and operating costs, some final open circuit batch flotation tests were conducted at coarser
primary grinds (154 µm, 173 µm and 204 µm) but retaining the same 20 µm
regrind size. The results were analyzed in grade-recovery terms and are presented in graphical
form in Figure 10-3 and Figure 10-4. Copper grade-recovery performance was retained up to
173 µm but showed a significant deterioration at the coarsest grind, whereas gold recovery
seemed largely insensitive to primary grind size. Although further work, including definitive
locked cycle testing, is required to validate this, the QP believes it is reasonable to assume
a primary grind size of 175 µm (in round Figure s) as an option for capital / operating
cost sensitivities. |
| ● | Some
very preliminary variability tests (four in total) were carried out on the low grade and
high-grade samples for each main composite. The results showed a high degree of variability
in the 70-90% range for copper recovery and 20-30% Cu in final concentrates. Gold recovery
was generally constant at around 50% although the 08-08 high grade sample did show a significantly
higher recovery of 76%. The QP does not attach much importance to this limited number of
results, their having no spatial relationship to the deposit, and would recommend that future
variability work be based on spatial and mineralogical/textural parameters rather than grade. |
| Effective Date: September 12, 2024 | Page 125 of 181 |
| | S-K 1300 Technical Summary Report – Whistler Project, Alaska |
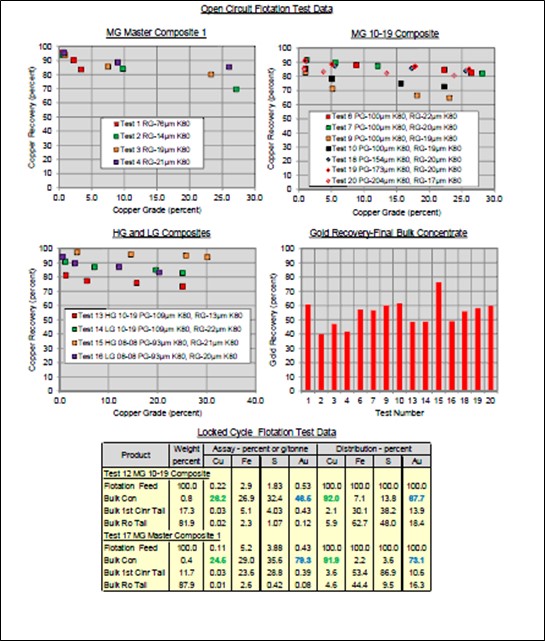
(Source:
MMTS, 2015)
| Figure 10-2 |
Flotation Test Results |
| Effective Date: September 12, 2024 | Page 126 of 181 |
| | S-K 1300 Technical Summary Report – Whistler Project, Alaska |
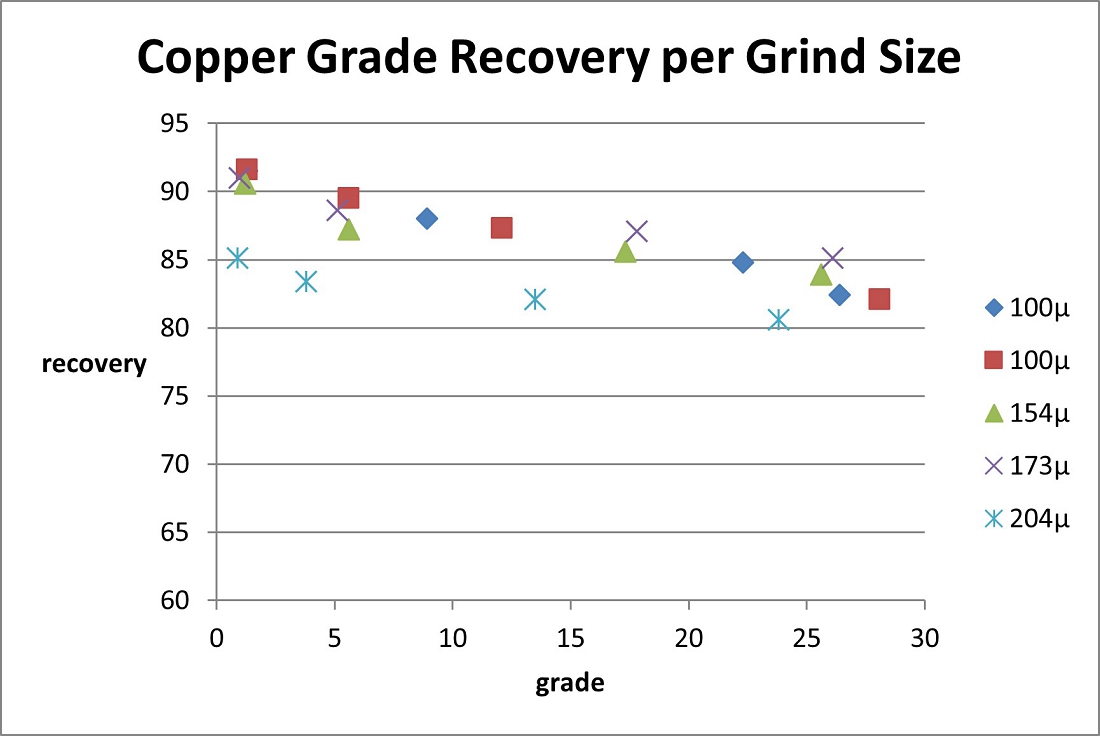
(Source:
MMTS, 2015)
| Figure 10-3 |
Copper Grade Recovery |
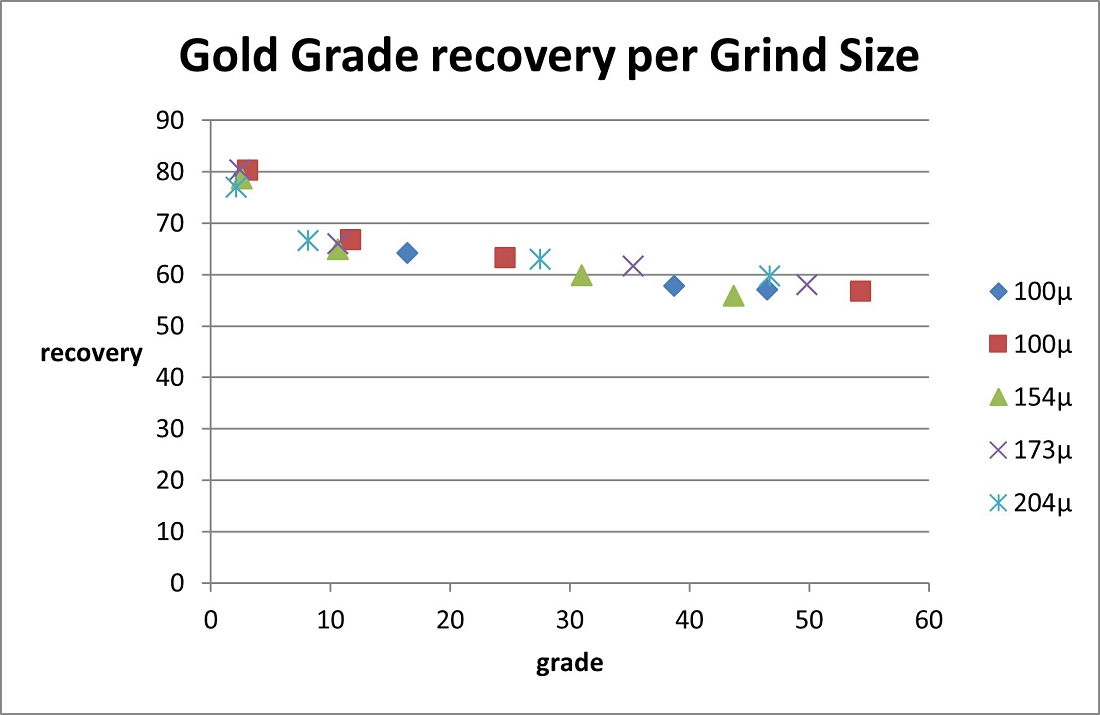
(Source:
MMTS, 2015)
| Figure 10-4 |
Gold Grade Recovery |
| Effective Date: September 12, 2024 | Page 127 of 181 |
| | S-K 1300 Technical Summary Report – Whistler Project, Alaska |
The
batch flotation tests had indicated a substantial amount of the gold was reporting to cleaner tails and, pending the results of the locked
cycle tests, some cyanidation tests were carried out on combined cleaner tails from tests 6 and 7 on 10-19 samples where 23% of the gold
was accounted for in the cleaner tails.
Forty-eight-hour
gold extractions were 77% to solution, thus overall gold recovery would improve from 57% to approximately 74%. However, although cyanide
consumption was moderate for a sulphidic stream, the absolute gold grades in cyanidation feed were still low and the marginal return
versus costs at current gold and cyanide prices exactly that, marginal. Also the use of cyanide requires a different level of onsite
management and therefore is more complicated in terms of its cost benefit.
Given
the excellent locked cycle test results already reported, and with overall gold recoveries by flotation being only in the region of 70%,
it was decided not to pursue further cyanidation testwork.
| 10.6 |
Concentrate
Specifications |
The
final bulk concentrates from cycles II-V of the locked cycle tests 12 (10-19 MG) and 17 (08-08 MG) were analyzed for potentially deleterious
elements and the results are shown in Table 10-8.
Concentrates
from both samples are remarkably clean and would indicate that the specifications would fall well within typical smelter limits for penalty
elements, with no penalty payable.
Normative
mineralogy calculations, assuming a simple chalcopyrite:pyrite sulphide blend, suggest the pyrite concentrate from the 08-08 sample to
be almost twice that of 10-19, i.e., similar to what was observed in the head samples.
| Effective Date: September 12, 2024 | Page 128 of 181 |
| | S-K 1300 Technical Summary Report – Whistler Project, Alaska |
| Table
10.8 |
Minor
Element Data |
| Element |
Symbol |
Units |
Test
12 (10-19) |
Test
17 (08-08) |
| Aluminium |
Al |
% |
0.92 |
0.68 |
| Antimony |
Sb |
% |
0.02 |
0.17 |
| Arsenic |
As |
gpt |
135 |
344 |
| Bismuth |
Bi |
gpt |
<1 |
<1 |
| Cadmium |
Cd |
gpt |
30 |
20 |
| Calcium |
Ca |
% |
0.44 |
0.31 |
| Carbon |
C |
% |
0.33 |
0.39 |
| Cobalt |
Co |
gpt |
46 |
36 |
| Copper |
Cu |
% |
26.1 |
24.9 |
| Fluorine |
F |
gpt |
133 |
123 |
| Iron |
Fe |
% |
26.7 |
29.3 |
| Lead |
Pb |
% |
0.18 |
0.19 |
| Magnesium |
Mg |
% |
0.17 |
0.09 |
| Manganese |
Mn |
% |
0.014 |
0.014 |
| Mercury |
Hg |
gpt |
1 |
4 |
| Molybdenum |
Mo |
% |
0.006 |
0.010 |
| Nickel |
Ni |
gpt |
74 |
94 |
| Phosphorus |
P |
gpt |
118 |
143 |
| Selenium |
Se |
gpt |
86 |
30 |
| Silicon |
Si |
% |
2.73 |
2.33 |
| Sulphur |
S |
% |
32.2 |
35.1 |
| Silver |
Ag |
gpt |
108 |
134 |
| Zinc |
Zn |
% |
0.46 |
0.32 |
From
the metallurgical testwork results and subsequent analysis it appears that the Whistler Deposit is metallurgically very amenable to a
conventional flotation route to produce saleable high quality copper concentrates with gold credits, despite the low head grade, and
that the levels of recovery and upgrade for both copper and gold are relatively insensitive to feed grade. There are no processing factors
or deleterious elements that could have significant effect of potential economic extraction.
Although
some late testwork on ore hardness revealed the ore to be harder than expected with a Bond Work Index of 19.9 kWh/t, some batch flotation
work also showed that the primary grind size could be increased from 100 µm to 175 µm, subject to confirmation with further
locked cycle tests, with net savings in comminution power.
| 10.8 |
Overall
Metallurgical Observations and Comments for 2024 Resource Estimate |
As
noted in the history of exploration of the Whistler deposit, which expanded from an initial Cu-Au porphyry deposit centered on Whistler
and expanding over time to include Raintree West and Island Mountain in the Resource tonnage, as well as additional revenue potential
from Ag, each phase of metallurgical testwork had focused exclusively on the exploration objectives at the time. As a result, the cumulative
metallurgical understanding lags the geological understanding by a considerable margin.
| Effective Date: September 12, 2024 | Page 129 of 181 |
| | S-K 1300 Technical Summary Report – Whistler Project, Alaska |
The
data reported in Sections 10.1 to 10.7 above are an accurate record of the testwork performed at the time, and the conclusions drawn
refer to those made within the scope of the specific test program. They do not, however, provide a complete picture of overall Mineral
Resource with respect to pay metal grades and recoveries for a few reasons:
| |
● |
To
date no mineralogical work has been performed despite recommendations to that effect made in each phase of metallurgical testing. |
| |
|
|
| |
●
|
Assumptions
in the various reports regarding gold recovery have noted that while higher Au recoveries than measured could possibly be achieved
by combining flotation and cyanide leaching, it was noted that for the low grades, high cyanide consumption and environmental control
measures could render the additional gold recovery uneconomical. |
| |
|
|
| |
●
|
Copper
toll smelters are loath to accept copper concentrates containing less than 25% Cu without imposing higher Cu deductions on payable
metal. The early Whistler testwork identified difficulties in obtaining payable Cu grades even with 3 stages of cleaning and consequently
decided to exclude ore samples containing elevated Pb and Zn from subsequent testwork (Section 10.2.1). |
| |
|
|
| |
● |
No
assays of silver were performed during the test programs, apart from Ag grades being reported in the minor element analysis of the
two concentrates produced in the 2012 testwork (Table 10-8), which were not linked to Ag head grades and yield unreliable metallurgical
accounting results. |
| |
|
|
| |
●
|
Flotation
testwork assays covered only Au, Cu, and some Fe and S assays were performed, but Pb, Zn and Ag assays were conspicuous by their
absence. |
| |
|
|
| |
● |
As
seen in the notes in the Resource table (Table 1-1) the overall Indicated resource grades are 0.79 g/t Au; 0.13% Cu, and 2.19 g/t
Ag. Note 4 states silver recovery for Ag grades below 10 g/t are estimated at 65% while no Ag recovery is allowed for Ag grades above
19 g/t as assays indicate a strong association of high Ag values with high Pb and Zn content samples, for which no metallurgical
testwork has been performed except for the single Kennecott test which returned unsatisfactory Au and Cu results in terms of concentrate
grades due to Pb and Zn dilution of the copper concentrate (Section 10.2.1). |
| |
|
|
| |
●
|
For
all the above reasons the metallurgical recommendation of 70% Au recovery, 83% Cu recovery and 65% Ag recovery of ore containing
less than 10 g/t Ag should be used until such time as a more comprehensive metallurgical test program is performed which provides
reliable grade and recovery results on material containing Pb and Zn as well as Au, Cu, and Ag. |
| Effective Date: September 12, 2024 | Page 130 of 181 |
| | S-K 1300 Technical Summary Report – Whistler Project, Alaska |
| 11 |
MINERAL
RESOURCE ESTIMATES |
The
Mineral Resource Estimate (MRE) for the Whistler Project has an effective date of September 12, 2024. The resource estimate was prepared
by Sue Bird, P.Eng., of Moose Mountain Technical Services (MMTS).
| 11.1 |
Mineral
Resource Estimate |
The
Whistler Project total Mineral Resource Estimate (MRE) includes the Whistler, Raintree and Island Mountain deposits and is summarized
in Table 11-1 for the base case cut-off grades. The resource is prepared in accordance with the United States Securities and Exchange
Commission (SEC) regulation S-K subpart 1300 (S-K 1300). In the opinion of the Qualified Person, the Mineral Resource Estimates reported
herein are a reasonable representation of the mineral resources found within the Project at the current level of sampling. The mineral
resources were estimated in accordance with §§229.1300 through 229.1305 (subpart 229.1300 of Regulation S-K). This report is
an update to the previously publicly disclosed report (Bird, 2022).
The
resource utilizes pit shells to constrain resources at the Whistler, Island Mountain, and Raintree West gold-copper deposits, as well
as an underground potentially mineable shape to constrain the mineral resource estimate for the deeper portion of the Raintree West deposit.
The current estimate uses metal prices of US$1,850/oz gold price, US$4.00/lb copper and US$23/oz silver, updated
recoveries, smelter terms and costs, as summarized in the notes to Table 1-1. Metal prices have been chosen based partially on market
consensus research by CIBC Capital Markets (CIBC, 2024) based on mean prices from 2024 and forecast up to 2027 for long term prices.
The metal prices chosen also considered the spot prices and the three-year trailing average prices. For all three metals, the final prices
used for this resource estimate are below both the spot metal price and the three-year trailing average, which is considered an industry
standard in choosing prices.
The
base case cut-off grade for open pit mining is $10.00/tonne for all three deposits, which more than covers the Processing + G&A costs
of US$7.90/tonne processed; this is the marginal cut-off for which mining costs are not included. Cut-off grades for underground mining
are based on Processing costs plus an additional US$17.10/tonne for underground bulk mining, to define the marginal cut-off NSR grade.
There has been drilling in 2023 and 2024 which resulted in updated geologic modelling, resource estimation parameters and an updated
resource estimate (using only 2023 drilling).
For
the mineral resource cut-off grade determination, a
3.0% NSR was assumed. This is derived from the sum of a 2.75% royalty to MF2 plus a 1% royalty to Gold Royalty Corp., with an assumption
that U.S. GoldMining can negotiate a buy back of a 0.75% NSR, for a net 3.0% NSR, as is customary to occur for similar project developments.
In preparing the resource estimate herein, a sensitivity analysis has also been conducted by the author. Based on such analysis, utilizing
a higher 3.75% NSR royalty rate in determining a cut-off grade would not materially impact the estimates contained herein and would be
de minimis (approx. 0.7% differential of total metal in the Whistler pit on a gold equivalent basis).
These
mineral resource estimates include inferred mineral resources that are considered too speculative geologically to have economic considerations
applied to them that would enable them to be categorized as mineral reserves. Mineral Resources that are not Mineral Reserves do not
have demonstrated economic viability.
| Effective Date: September 12, 2024 | Page 131 of 181 |
| | S-K 1300 Technical Summary Report – Whistler Project, Alaska |
The
Qualified Person is of the opinion that issues relating to all relevant technical and economic factors likely to influence the prospect
of economic extraction can be resolved with further work. These factors may include environmental permitting, infrastructure, sociopolitical,
marketing, or other relevant factors.
The
sensitivity to the resource by deposits is presented in Table 11-2 through Table 11-4 for the Whistler,
Raintree, and Island Mountain deposits respectively. As a point of reference, the in-situ gold, copper and silver mineralization
are inventoried and reported by intended processing method.
| Table
11-1 |
Mineral
Resource Estimate for the Total Whistler Project (Effective date: September 12, 2024) |
| Class |
Deposit |
Cut-off
Value |
ROM
tonnage |
In
situ Grades |
In
situ Metal |
| (US$/t) |
(ktonnes) |
NSR
(US$/t) |
AuEqv
(gpt) |
Au
(gpt) |
Cu
(%) |
Ag
(gpt) |
AuEqv
(koz) |
Au
(koz) |
Cu
(mlbs) |
Ag
(koz) |
| Indicated |
Whistler |
10 |
282,205 |
22.84 |
0.68 |
0.41 |
0.16 |
1.89 |
6,201 |
3,724 |
999 |
17,166 |
| Raintree-Pit |
10 |
8,905 |
21.08 |
0.63 |
0.46 |
0.08 |
4.81 |
180 |
131 |
16 |
1,378 |
| Indicated
Open Pit |
varies |
291,410 |
22.79 |
0.68 |
0.41 |
0.16 |
1.98 |
6,381 |
3,855 |
1,015 |
18,544 |
| Raintree-UG |
25 |
3,064 |
34.41 |
1.03 |
0.79 |
0.13 |
4.49 |
101 |
78 |
9 |
443 |
| Total
Indicated |
varies |
294,474 |
22.91 |
0.68 |
0.42 |
0.16 |
2.01 |
6,482 |
3,933 |
1,024 |
18,987 |
| Inferred |
Whistler |
10 |
18,224 |
21.01 |
0.63 |
0.40 |
0.13 |
1.75 |
368 |
233 |
54 |
1,025 |
| Island
Mountain |
10 |
124,529 |
18.21 |
0.54 |
0.45 |
0.05 |
1.02 |
2,180 |
1,817 |
139 |
4,084 |
| Raintree-Pit |
10 |
15,056 |
23.12 |
0.69 |
0.55 |
0.06 |
4.36 |
335 |
267 |
21 |
2,112 |
| Inferred
Open Pit |
varies |
157,809 |
19.00 |
0.57 |
0.45 |
0.06 |
1.42 |
2,883 |
2,317 |
214 |
7,221 |
| Raintree-UG |
25 |
40,432 |
32.81 |
0.98 |
0.76 |
0.12 |
3.31 |
1,275 |
994 |
103 |
4,300 |
| Total
Inferred |
varies |
198,241 |
21.82 |
0.65 |
0.52 |
0.07 |
1.81 |
4,158 |
3,311 |
317 |
11,521 |
Notes
to Table 11-1 through 11-4:
| |
1.
|
Mineral
resources are not mineral reserves and do not have demonstrated economic viability. There is no certainty that all or any part of
the mineral resources will be converted into mineral reserves. |
| |
2. |
The
Mineral Resource for the Whistler, Island Mountain, and the upper portions of the Raintree West deposits have been confined by an
open pit with “reasonable prospects of economic extraction” using the following assumptions: |
| |
● |
Metal
prices of US$1,850/oz Au, US$4.00/lb Cu and US$23/oz Ag; |
| |
● |
Payable
metal of 95% payable for Au and Ag, and 96.5% payable for Cu |
| |
● |
Refining
costs for Au of US$8.00/oz, for Ag of US$0.60/oz and for Cu of US$0.05/lb |
| |
● |
Offsite
costs for Au of US$77.50/wmt, for Ag of US$3.50/wmt and for Cu of US$55.00/wmt. |
| |
● |
Royalty
of 3% NSR; |
| |
● |
Pit
slopes are 50 degrees; |
| |
● |
Mining
cost of US$2.25/t for waste and mineralized material; and |
| |
● |
Processing,
general and administrative costs of US$7.90/t. |
| |
3.
|
The
lower portion of the Raintree West deposit has been constrained by a mineable shape with “reasonable prospects of eventual
economic extraction” using a US$25.00/t cut-off. |
| |
4. |
Metallurgical
recoveries are: 70% for Au, 83% for Cu, and 65% Ag for Ag grades below 10g/t. The Ag recovery is 0% for values above 10g/t for all
deposits. |
| |
5. |
The
NSR equations are: below 10g/t Ag: NSR (US$/t)=(100%-3%)*((Au*70%*US$54.646/t) + (Cu*83%*US$3.702*2204.62 + Ag*65%*US$0.664)), and
above 10g/t Ag: NSR (US$/t)=(100%-3%)*((Au*70%*US$56.646g/t) + (Cu*83%*US$3.702*2204.62)) ; |
| |
6. |
The
Au Equivalent equations are: below 10g/t Ag: AuEq=Au + Cu*1.771 +0.0113Ag, and above 10g/t Ag: AuEq=Au + Cu*1.771 |
| |
7.
|
The
specific gravity for each deposit and domain ranges from 2.76 to 2.91 for Island Mountain, 2.60 to 2.72 for Whistler with an average
value of 2.80 for Raintree West. |
| |
8.
|
Numbers
may not add due to rounding. |
| Effective Date: September 12, 2024 | Page 132 of 181 |
| | S-K 1300 Technical Summary Report – Whistler Project, Alaska |
| Table
11-2 |
Mineral
Resource Estimate and Sensitivity – Whistler Deposit |
| Class |
Cutoff |
ROM
tonnage |
In
situ Grades |
In
situ metal |
| (US$/t) |
(ktonnes) |
NSR
(US$/t) |
AuEqv
(gpt) |
Au
(gpt) |
Cu
(%) |
Ag
(gpt) |
AuEqv
(Koz) |
Au
(koz) |
Cu
(klbs) |
Ag
(koz) |
| Indicated |
6 |
321,811 |
21.08 |
0.630 |
0.373 |
0.151 |
1.9 |
6,518 |
3,855 |
1,070,592 |
19,141 |
| 7 |
316,712 |
21.31 |
0.637 |
0.377 |
0.152 |
1.9 |
6,486 |
3,843 |
1,063,404 |
18,939 |
| 7.9 |
309,204 |
21.65 |
0.647 |
0.384 |
0.154 |
1.9 |
6,432 |
3,820 |
1,051,146 |
18,491 |
| 10 |
282,505 |
22.84 |
0.683 |
0.410 |
0.160 |
1.9 |
6,201 |
3,724 |
998,997 |
17,166 |
| 15 |
200,102 |
27.09 |
0.810 |
0.509 |
0.178 |
1.9 |
5,209 |
3,273 |
785,245 |
12,481 |
| 20 |
127,831 |
32.61 |
0.975 |
0.644 |
0.196 |
2.0 |
4,006 |
2,648 |
552,928 |
8,220 |
| 25 |
83,573 |
38.09 |
1.139 |
0.785 |
0.211 |
2.1 |
3,059 |
2,108 |
388,208 |
5,616 |
| 30 |
56,402 |
43.33 |
1.295 |
0.919 |
0.224 |
2.2 |
2,348 |
1,666 |
278,657 |
3,971 |
| Inferred |
6 |
20,022 |
19.85 |
0.593 |
0.370 |
0.130 |
1.7 |
382 |
238 |
57,383 |
1,107 |
| 7 |
19,737 |
20.05 |
0.599 |
0.375 |
0.131 |
1.7 |
380 |
238 |
56,914 |
1,098 |
| 7.9 |
19,254 |
20.36 |
0.609 |
0.382 |
0.132 |
1.7 |
377 |
236 |
56,031 |
1,077 |
| 10 |
18,224 |
21.01 |
0.628 |
0.397 |
0.135 |
1.8 |
368 |
233 |
54,118 |
1,025 |
| 15 |
13,632 |
23.78 |
0.711 |
0.462 |
0.146 |
1.8 |
312 |
202 |
43,938 |
771 |
| 20 |
8,720 |
27.38 |
0.818 |
0.561 |
0.151 |
1.8 |
229 |
157 |
29,106 |
491 |
| 25 |
5,507 |
30.22 |
0.903 |
0.643 |
0.153 |
1.8 |
160 |
114 |
18,575 |
320 |
| 30 |
1,876 |
36.16 |
1.081 |
0.791 |
0.171 |
1.9 |
65 |
48 |
7,085 |
115 |
| Table
11-3 |
Mineral
Resource Estimate and Sensitivity – Raintree Deposit |
| Class |
Source |
Cutoff |
ROM
tonnage |
In
situ Grades |
In
situ metal |
| (US$/t) |
(ktonnes) |
NSR
(US$/t) |
AuEqv
(gpt) |
Au
(gpt) |
Cu
(%) |
Ag
(gpt) |
AuEqv
(Koz) |
Au
(koz) |
Cu
(klbs) |
Ag
(koz) |
| Indicated |
Open
Pit |
6 |
11,389 |
18.19 |
0.544 |
0.392 |
0.071 |
4.591 |
199 |
144 |
17827.0 |
1,681 |
| 7 |
10,624 |
19.04 |
0.569 |
0.411 |
0.075 |
4.689 |
194 |
140 |
17,473 |
1,602 |
| 7.9 |
10,097 |
19.65 |
0.587 |
0.425 |
0.077 |
4.721 |
191 |
138 |
17,118 |
1,533 |
| 10 |
8,905 |
21.08 |
0.630 |
0.459 |
0.082 |
4.813 |
180 |
131 |
16,098 |
1,378 |
| 15 |
6,134 |
24.99 |
0.747 |
0.554 |
0.095 |
4.907 |
147 |
109 |
12,779 |
968 |
| 20 |
3,618 |
30.25 |
0.904 |
0.690 |
0.107 |
5.063 |
105 |
80 |
8,567 |
589 |
| 25 |
2,137 |
35.71 |
1.067 |
0.838 |
0.116 |
5.366 |
73 |
58 |
5,451 |
369 |
| 30 |
1,227 |
41.89 |
1.252 |
1.018 |
0.119 |
5.405 |
49 |
40 |
3,222 |
213 |
| UG |
US$25
shell |
3,064 |
34.41 |
1.028 |
0.791 |
0.128 |
4.494 |
101 |
78 |
8,613 |
443 |
| Total |
varies |
13,688 |
22.48 |
0.672 |
0.496 |
0.086 |
4.645 |
296 |
218 |
26,085 |
2,044 |
| Inferred |
Open
Pit |
6 |
22,235 |
18.22 |
0.544 |
0.424 |
0.053 |
4.150 |
389 |
303 |
25,784 |
2,967 |
| 7 |
20,257 |
19.36 |
0.579 |
0.453 |
0.056 |
4.192 |
377 |
295 |
24,875 |
2,730 |
| 7.9 |
18,695 |
20.36 |
0.608 |
0.479 |
0.058 |
4.223 |
366 |
288 |
23,905 |
2,538 |
| 10 |
15,056 |
23.12 |
0.691 |
0.552 |
0.064 |
4.363 |
335 |
267 |
21,210 |
2,112 |
| 15 |
9,223 |
29.88 |
0.893 |
0.736 |
0.074 |
4.435 |
265 |
218 |
15,006 |
1,315 |
| 20 |
5,439 |
38.76 |
1.159 |
0.988 |
0.082 |
4.490 |
203 |
173 |
9,881 |
785 |
| 25 |
3,476 |
48.11 |
1.438 |
1.254 |
0.091 |
4.815 |
161 |
140 |
6,958 |
538 |
| 30 |
2,268 |
59.32 |
1.773 |
1.571 |
0.102 |
5.020 |
129 |
115 |
5,085 |
366 |
| Underground |
US$25
shell |
40,432 |
32.81 |
0.981 |
0.764 |
0.116 |
3.308 |
1,275 |
994 |
102,953 |
4,300 |
| Total |
varies |
60,689 |
28.32 |
0.846 |
0.661 |
0.096 |
3.603 |
1,652 |
1,289 |
127,829 |
7,030 |
| Effective Date: September 12, 2024 | Page 133 of 181 |
| | S-K 1300 Technical Summary Report – Whistler Project, Alaska |
| Table
11-4 |
Mineral
Resource Estimate and Sensitivity – Island Mountain Deposit |
| Class |
Cutoff |
ROM
tonnage |
In
situ Grades |
In
situ metal |
| (US$/t) |
(ktonnes) |
NSR
(US$/t) |
AuEqv
(gpt) |
Au
(gpt) |
Cu
(%) |
Ag
(gpt) |
AuEqv
(Koz) |
Au
(koz) |
Cu
(klbs) |
Ag
(koz) |
| Inferred |
6 |
204,993 |
14.17 |
0.424 |
0.35 |
0.04 |
0.88 |
2,792 |
2,286 |
192,975 |
5,800 |
| 7 |
182,535 |
15.12 |
0.452 |
0.37 |
0.04 |
0.91 |
2,651 |
2,185 |
178,272 |
5,340 |
| 7.9 |
164,585 |
15.96 |
0.477 |
0.39 |
0.05 |
0.93 |
2,524 |
2,090 |
165,821 |
4,921 |
| 10 |
124,529 |
18.21 |
0.544 |
0.45 |
0.05 |
1.02 |
2,180 |
1,817 |
138,642 |
4,084 |
| 15 |
60,590 |
24.49 |
0.732 |
0.61 |
0.07 |
1.31 |
1,426 |
1,191 |
90,432 |
2,552 |
| 20 |
32,025 |
31.10 |
0.929 |
0.78 |
0.09 |
1.60 |
957 |
799 |
60,930 |
1,647 |
| 25 |
19,129 |
37.11 |
1.109 |
0.93 |
0.10 |
1.83 |
682 |
573 |
42,467 |
1,125 |
| 30 |
12,264 |
42.58 |
1.273 |
1.08 |
0.11 |
1.93 |
502 |
427 |
29,146 |
761 |
The
flagship Whistler Deposit contains a high-grade core defined by coincident approximately ≥0.40 g/t gold and ≥0.20% Cu grade contours
that extend approximately 500 m in the north-south dimension, 250m in the east-west dimension and extend to 600 m depth (from surface),
where it remains open down dip. The Whistler Deposit high-grade core offers the option to consider low strip ratio, higher – grade
starter-pit scenarios. Table 11-5 provides summary of the phases illustrating the higher grade and very low strip ratio in the initial
phases. The conceptual pits are shown in the section through the center of the deposit in Figure 11-1 which also plots the NSR of the
blocks.
| Table
11-5 |
Whistler
Deposit MRE Conceptual Phased Pit Shells at a US$10/tonne NSR Cutoff |
| PIT
PHASE |
CLASS |
Mineralized
Tonnage |
NSR |
AuEQ |
Au |
Cu |
Ag |
In
Situ Metal |
Waste
Tonnage |
Strip
Ratio |
| (ktonnes) |
(US$/tonne) |
(gpt) |
(gpt) |
(%) |
(gpt) |
(AuEq
koz) |
(ktonnes) |
Waste:Minz |
| PHASE
1 |
Indicated |
22,425 |
34.81 |
1.04 |
0.65 |
0.23 |
2.30 |
750 |
1,776 |
0.08 |
| Inferred |
- |
- |
- |
- |
- |
- |
— |
| PHASE
2 |
Indicated |
42,703 |
29.4 |
0.88 |
0.56 |
0.19 |
2.00 |
1,206 |
17,684 |
0.41 |
| Inferred |
910 |
16.28 |
0.49 |
0.26 |
0.13 |
2.00 |
14 |
| PHASE
3 |
Indicated |
106,892 |
23.71 |
0.71 |
0.43 |
0.16 |
1.80 |
2,435 |
117,922 |
1.04 |
| Inferred |
6,722 |
22.39 |
0.67 |
0.44 |
0.14 |
1.70 |
145 |
| PHASE
4 |
Indicated |
69,425 |
17.61 |
0.53 |
0.29 |
0.14 |
1.80 |
1,175 |
145,808 |
1.96 |
| Inferred |
4,944 |
19.81 |
0.59 |
0.36 |
0.14 |
1.60 |
94 |
| PHASE
5 |
Indicated |
41,061 |
16.08 |
0.48 |
0.257 |
0.13 |
1.8 |
634 |
238,127 |
5.10 |
| Inferred |
5,648 |
21.18 |
0.633 |
0.409 |
0.13 |
1.9 |
115 |
| Total
Indicated |
282,506 |
22.84 |
0.68 |
0.41 |
0.16 |
1.87 |
6,201 |
521,317
|
1.70 |
| Total
Inferred |
18,224 |
21.01 |
0.63 |
0.40 |
0.13 |
1.75 |
368 |
| Effective Date: September 12, 2024 | Page 134 of 181 |
| | S-K 1300 Technical Summary Report – Whistler Project, Alaska |
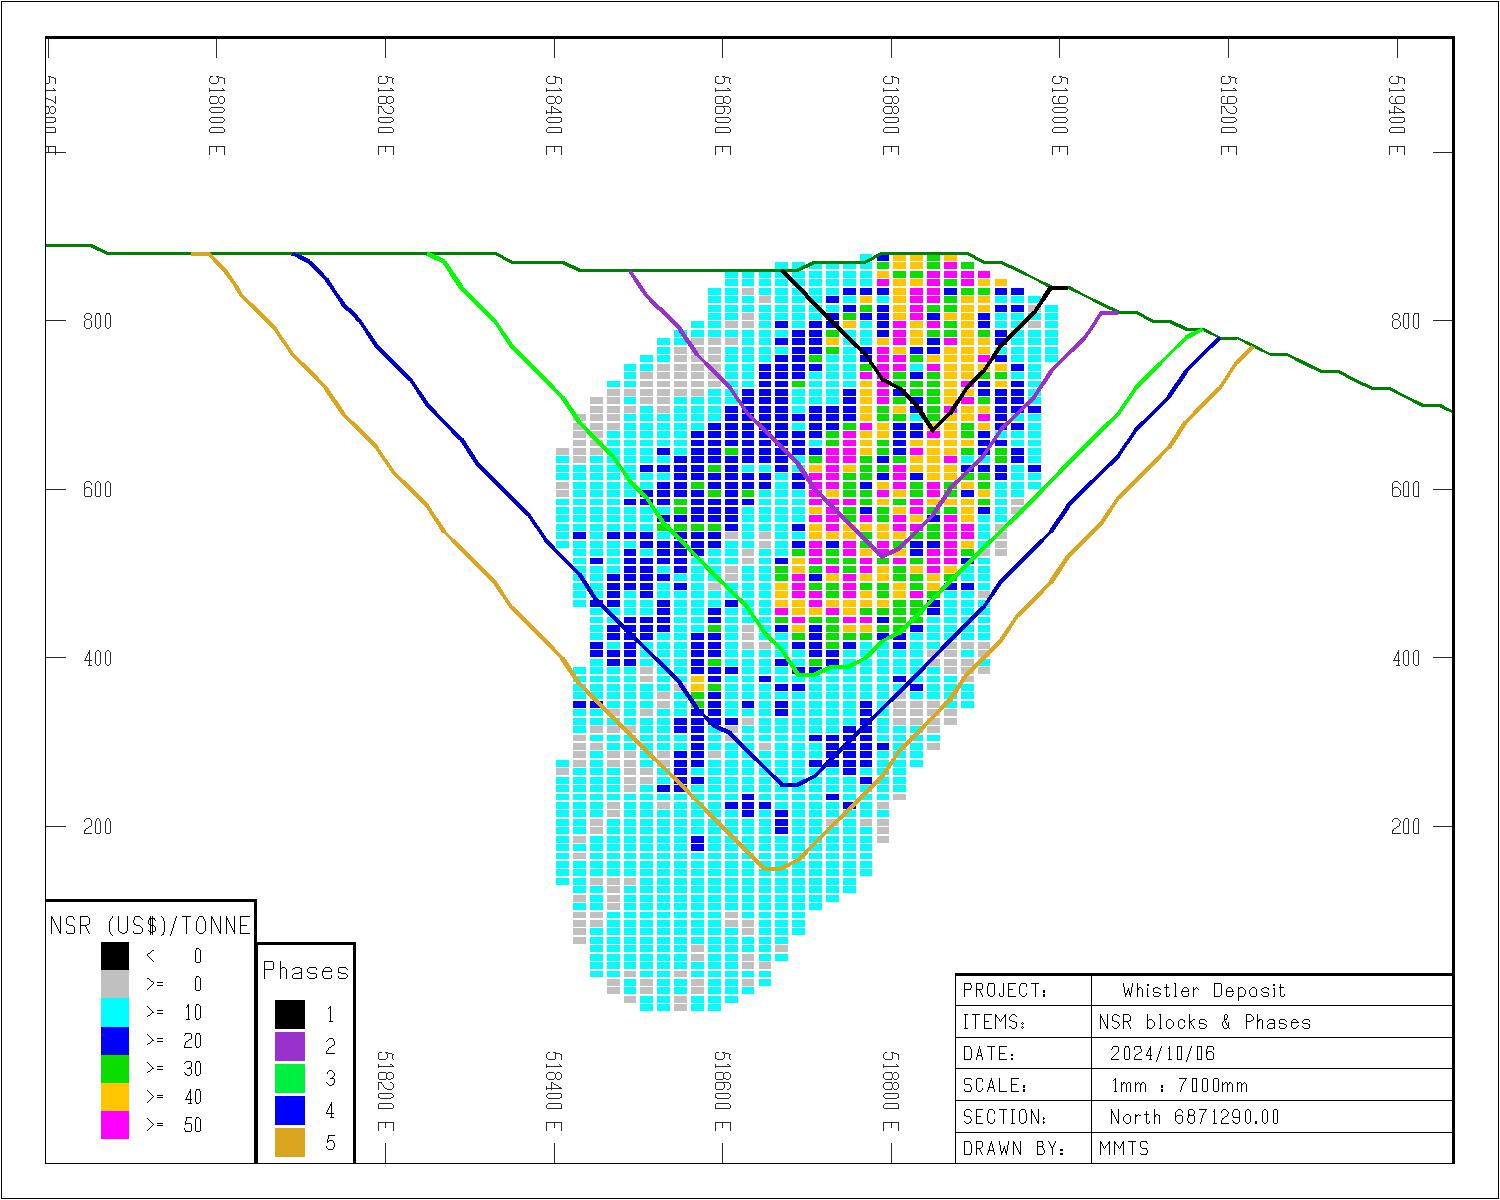
| Figure
11-1 |
Whistler
Deposit Resource Pit and Conceptual Phases |
| 11.2 |
Key
Assumptions and Data used in the Estimate |
The
total Whistler Project area comprises a database of 250 drillholes totaling more than 70,000 m with 182 drillholes and 53,200 m of assayed
length within the three deposit block models and other targets in the Project.
A
summary of the drillholes within each of the Whistler Project block model areas is provided in Table 11-6.
| Effective Date: September 12, 2024 | Page 135 of 181 |
| | S-K 1300 Technical Summary Report – Whistler Project, Alaska |
| Table
11-6 |
Summary
of Whistler Project Drillhole Data within Block Models |
| Operator |
Year |
Whistler |
Raintree |
Island
Mountain |
Total |
| No.
Holes |
Length
(m) |
No.
Holes |
Length
(m) |
No.
Holes |
Length
(m) |
No.
Holes |
Length
(m) |
| Cominco |
1986-1989
|
16 |
1,677 |
0 |
0 |
0 |
0 |
16 |
1,677 |
| Kennecott |
2004
|
5 |
1,997 |
0 |
0 |
0 |
0 |
5 |
1,997 |
| 2005
|
9 |
5,251 |
0 |
0 |
0 |
0 |
9 |
5,251 |
| 2006
|
1 |
705 |
4 |
1,115 |
0 |
0 |
5 |
1,820 |
| Kennecott
Sub-Total |
31 |
9,630 |
4 |
1,115 |
0 |
0 |
35 |
10,745 |
| Geoinformatics |
2007
|
7 |
3,321 |
0 |
0 |
0 |
0 |
7 |
3,321 |
| 2008
|
5 |
2,462 |
2 |
622 |
0 |
0 |
7 |
3,084 |
| Geoinformatics
Sub-Total |
12 |
5,783 |
2 |
622 |
0 |
0 |
14 |
6,405 |
| Kiska |
2009
|
0 |
0 |
0 |
0 |
2 |
601 |
2 |
601 |
| 2010
|
7 |
5,247 |
0 |
0 |
12 |
5,434 |
19 |
10,681 |
| 2011
|
0 |
0 |
52 |
3,453 |
26 |
9,537 |
78 |
12,990 |
| Kiska
Sub-Total |
7 |
5,247 |
52 |
3,453 |
40 |
15,572 |
99 |
24,272 |
| U.S.
GoldMining |
2023
|
3 |
1,674 |
0 |
0 |
0 |
0 |
3 |
1,674 |
| USGO
Sub-Total |
3 |
1,674 |
0 |
0 |
0 |
0 |
3 |
1,674 |
| Total |
53 |
22,334 |
58 |
5,190 |
40 |
15,572 |
151 |
43,096 |
Three-dimensional
wireframe solids based on geology have been used to constrain the grade interpolations.
At
Whistler, three dimensional solids of the “productive” and “non-productive” diorite intrusions have been created
by the site geologists. These were used as a guide to create mineralization shells for both Au-Ag and Cu separately. The shells include
a higher grade “core” with a lower grade “halo” for both Au-Ag shells and for Cu shells. The previously modelled
Divide Fault is no longer considered a major fault through the entire deposit and is no longer considered to divide the mineralization.
Dykes have not been modelled explicitly because they are too thin both to model and to separate when mining. Therefore, the un-mineralized
assays within the solids have been included in the interpolations. A three-dimensional view looking northwest of the Whistler higher
grade core domains (Au-Ag high grade domain in red, with Cu higher grade core in yellow) is illustrated in Figure 11-2, also showing
the resource pit.
Figure
11-3 illustrates the mineralized domain for Raintree, looking northeast and plotting the resource pit and underground mineralized shape.
| Effective Date: September 12, 2024 | Page 136 of 181 |
| | S-K 1300 Technical Summary Report – Whistler Project, Alaska |
Figure
11-4 illustrates the domains for Island Mountain. There are six sub-vertical domains (plotted in shades of blue) that are based on lithology
as various mineralized dykes. These were combined into one domain for the interpolations. Two domains surrounding the central core at
a nominal cut-off of 0.1 gpt and 0.3 gpt AuEqv are used to confine the interpolation outside of the dyke boundaries (plotted in yellows).
The outline of the resource pit on surface is also plotted for reference.
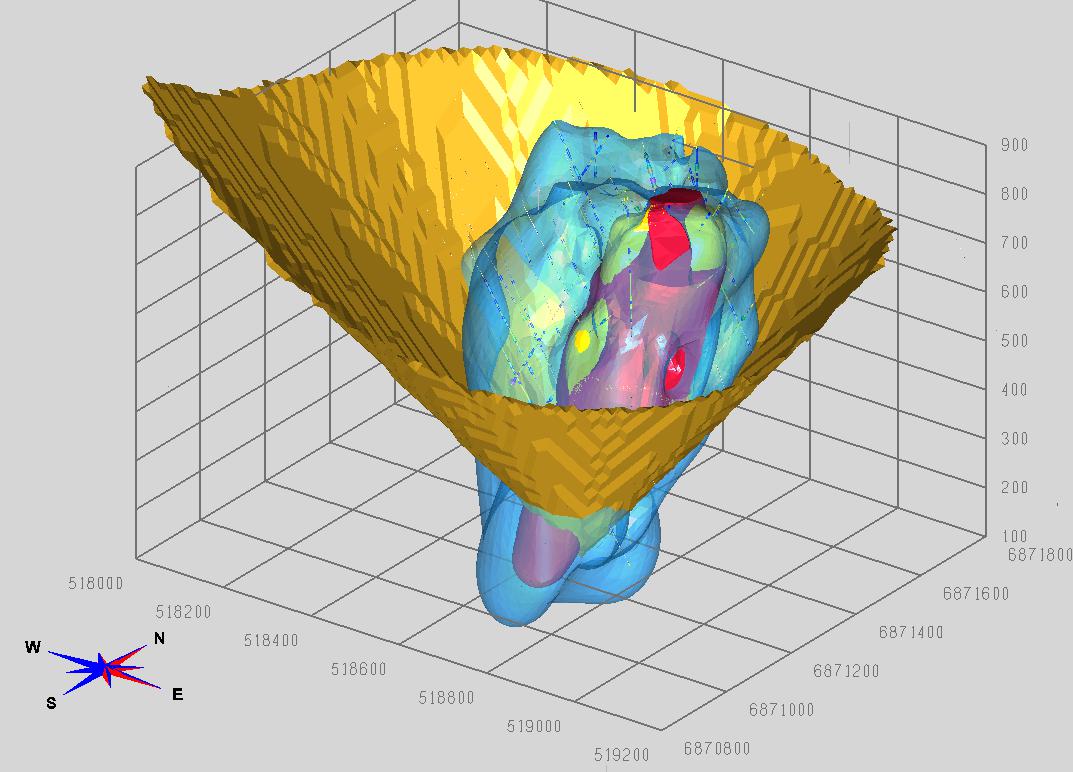
(Source:
MMTS, 2024)
| Figure
11-2 |
Whistler
Deposit – Au-Ag high grade domain (red), Cu high grade domain (yellow) lower grade halo (blue) |
| Effective Date: September 12, 2024 | Page 137 of 181 |
| | S-K 1300 Technical Summary Report – Whistler Project, Alaska |
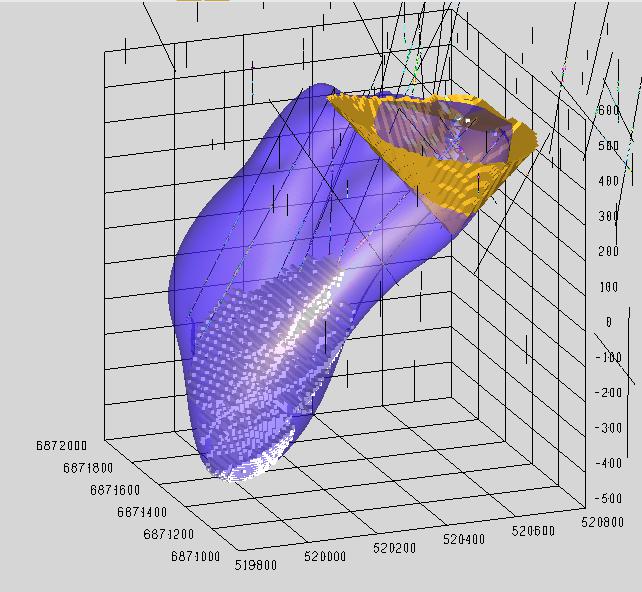
(Source:
MMTS, 2021)
| Figure
11-3 |
Domains
Modeled for Raintree Deposit |
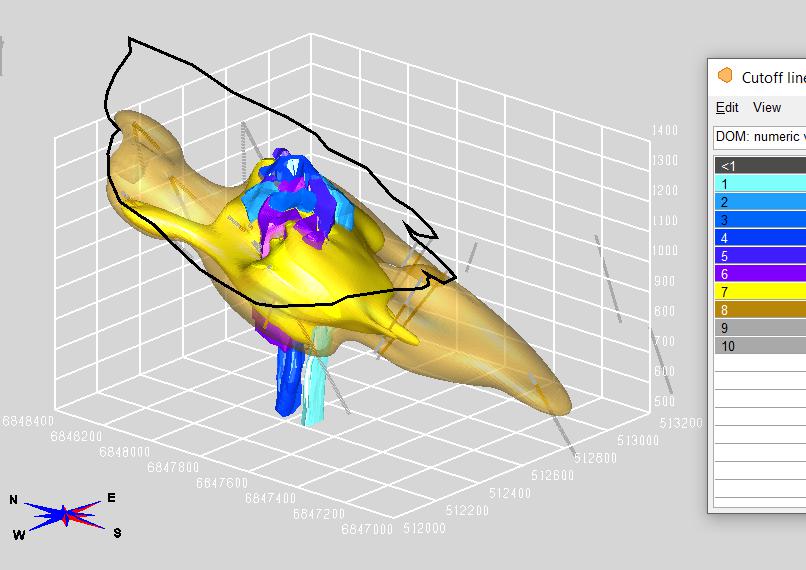
(Source:
MMTS, 2021)
| Figure
11-4 |
Domains
Modelled for Island Mountain Capping |
| Effective Date: September 12, 2024 | Page 138 of 181 |
| | S-K 1300 Technical Summary Report – Whistler Project, Alaska |
Cumulative
probability plots (CPP) are used to define capping values and potential outlier restrictions during interpolations. Figure 11-5 and Figure
11-6 show the CPP plots for Au and Cu respectively for Whistler. Figure 11-7 and Figure 11-8 show the CPP plots for Au and Cu respectively
for Raintree and Figure 11-9 and Figure 11-10 are the CPPs for Island Mountain for Au and Cu respectively.
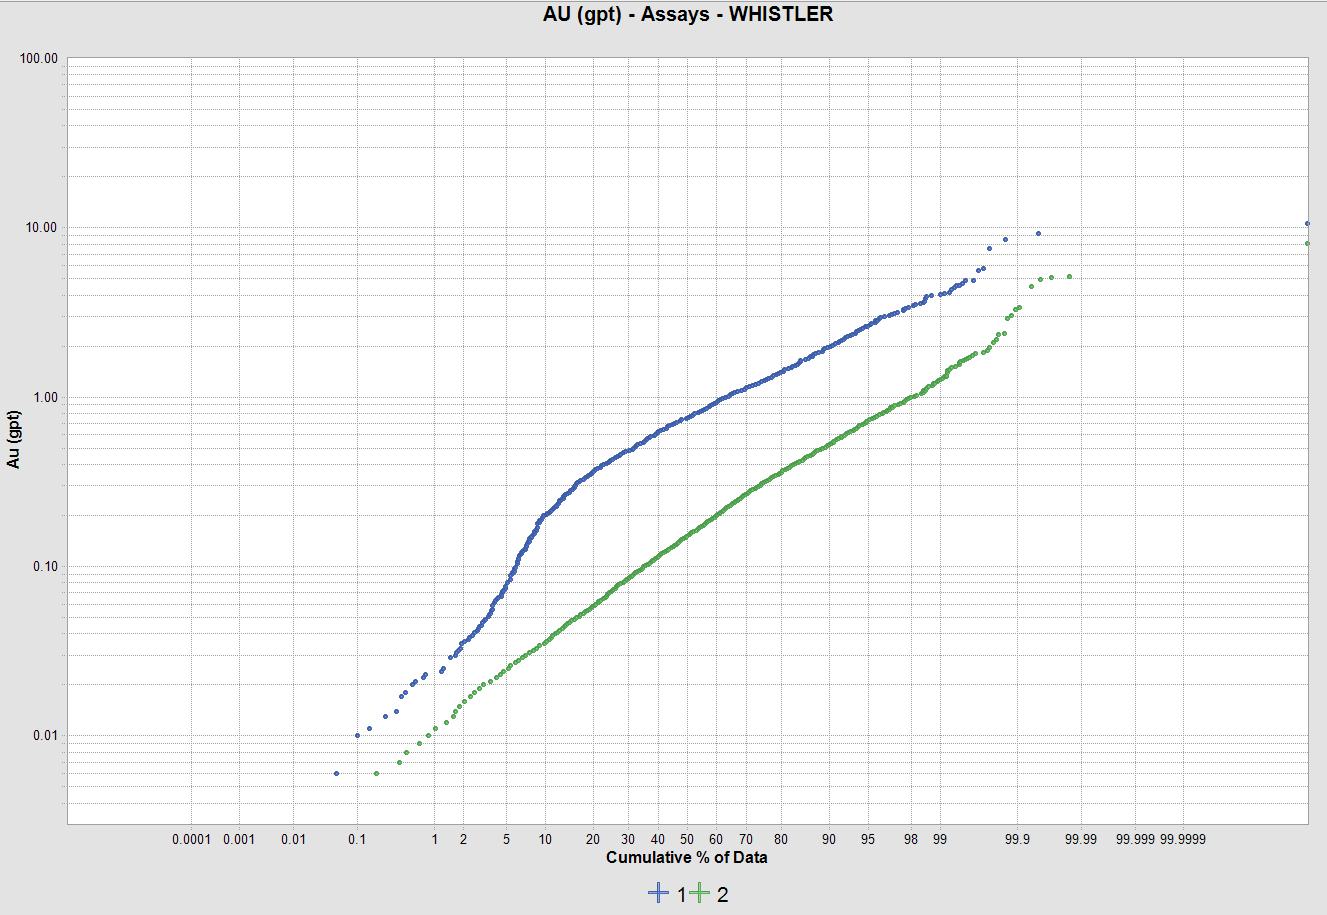
(Source:
MMTS, 2024)
| Figure
11-5 |
CPP
of Au Assay Data by Domain - Whistler |
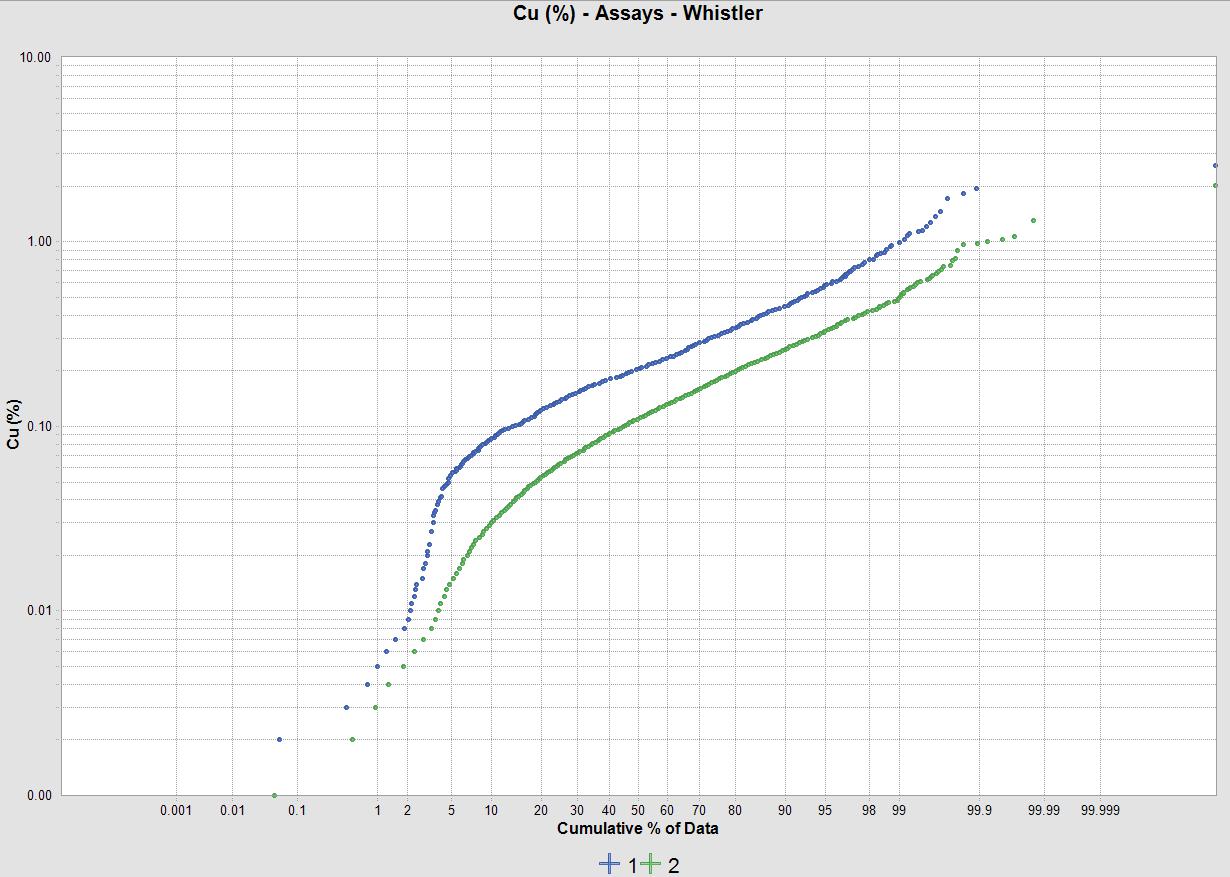
(Source:
MMTS, 2024)
| Figure 11-6 |
CPP
of Cu Assay Data by Domain – Whistler |
| Effective Date: September 12, 2024 | Page 139 of 181 |
| | S-K 1300 Technical Summary Report – Whistler Project, Alaska |
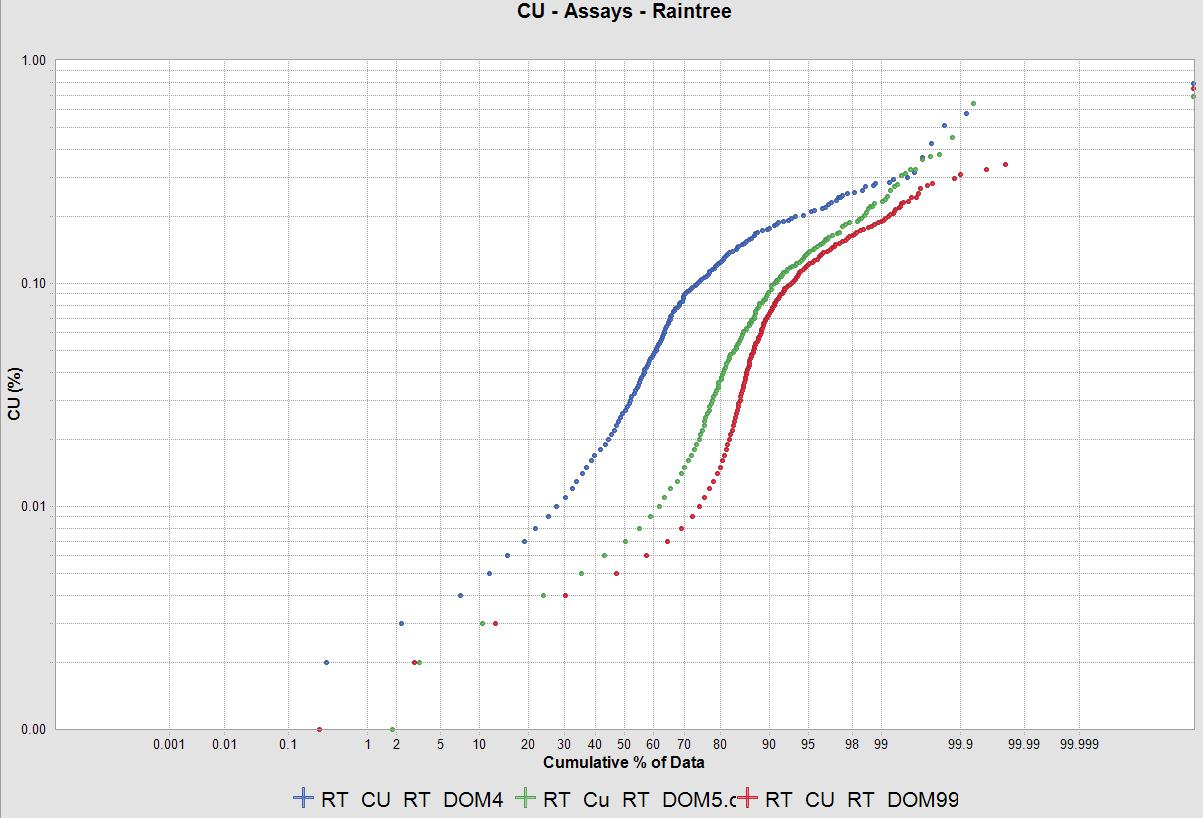
(Source:
MMTS, 2021)
| Figure
11-7 |
CPP
of Au Assay Data by Domain – Raintree |
(Source:
MMTS, 2021)
| Figure
11-8 |
CPP
of Cu Assay Data by Domain – Raintree |
| Effective Date: September 12, 2024 | Page 140 of 181 |
| | S-K 1300 Technical Summary Report – Whistler Project, Alaska |
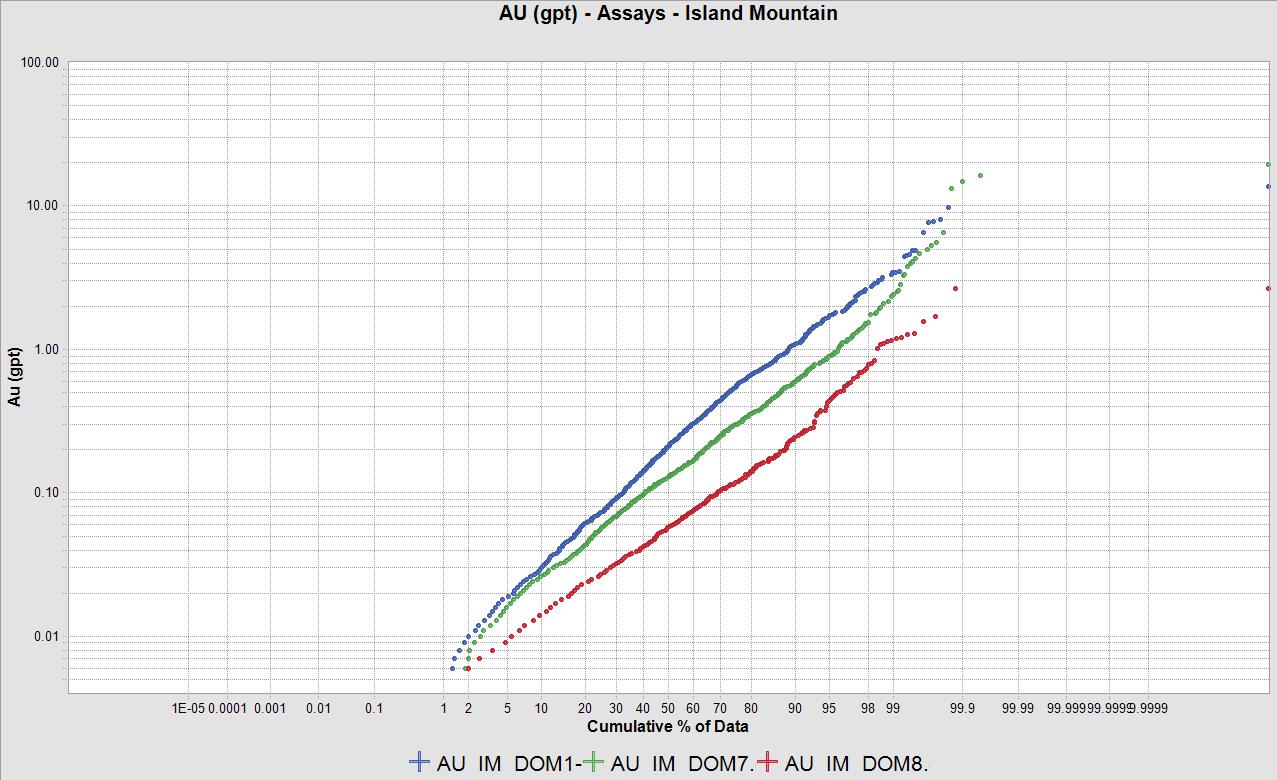
(Source:
MMTS, 2021)
| Figure
11-9 |
CPP
of Au Assay Data by Domain – Island Mountain |
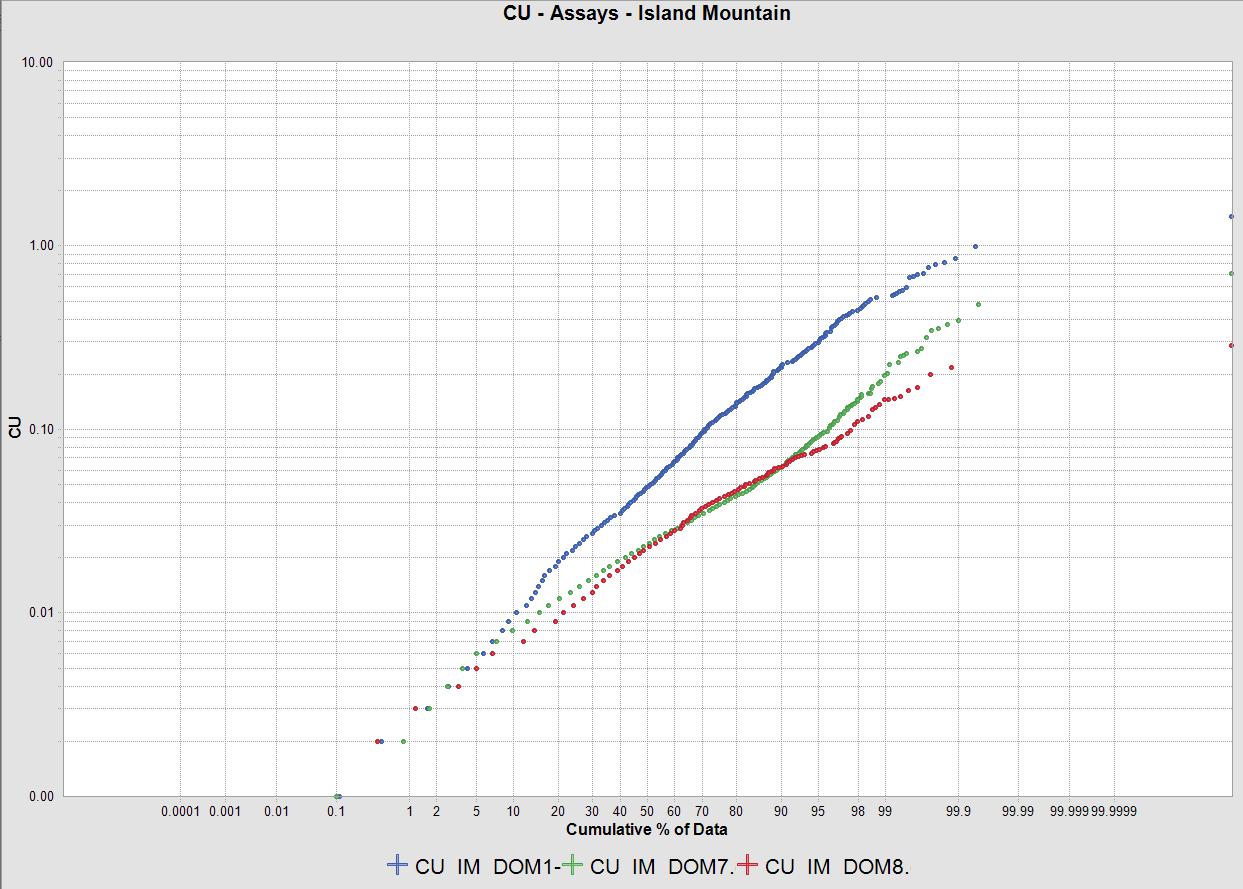
(Source:
MMTS, 2021)
| Figure
11-10 |
CPP
of Cu Assay Data by Domain – Island Mountain |
Capping
and Outlier values are summarized in Table 11-7 below. Values above the capping value are equal to the capping value in the assay file
prior to compositing. Composite values above the Outlier value are restricted during interpolations to the Outlier value for distance
greater than 5 m from the composite interval.
| Effective Date: September 12, 2024 | Page 141 of 181 |
| | S-K 1300 Technical Summary Report – Whistler Project, Alaska |
| Table
11-7 |
Summary
of Capping and Outlier Restriction Values |
| ITEM |
AREA |
Domain |
CAP |
Outlier |
| From |
To |
| Au
(gpt) |
Whistler |
1 |
1 |
4 |
3 |
| 2 |
2 |
2 |
2 |
| Raintree |
1 |
1 |
2 |
10 |
| Island
Mountain |
1 |
6 |
10 |
5 |
| 7 |
7 |
10 |
5 |
| 8 |
8 |
3 |
5 |
| Cu
(%) |
Whistler |
1 |
1 |
2 |
1 |
| 2 |
2 |
1 |
1 |
| Raintree |
2 |
2 |
2 |
0.6 |
| Island
Mountain |
1 |
6 |
1 |
na |
| 7 |
7 |
0.6 |
na |
| 8 |
8 |
0.3 |
na |
| Ag
(gpt) |
Whistler |
1 |
1 |
100 |
10 |
| 2 |
2 |
100 |
10 |
| Raintree |
1 |
1 |
100 |
80 |
| Island
Mountain |
1 |
6 |
30 |
12 |
| 7 |
7 |
20 |
7 |
| 8 |
8 |
20 |
7 |
The
capped assay and composite statistics of each domain are summarized in the Table 11-8 through Table 11-10 for Au, Cu and Ag respectively.
These table illustrate that no significant bias has been introduced during the compositing process. They also indicate that the distributions
have low CV confirming the choice of linear interpolation methods are appropriate.
| Table
11-8 |
Capped
Assay and Composite Statistics by Domain - Au |
| Source |
Parameters |
Whistler |
Raintree |
Island
Mountain |
| 1 |
2 |
5 |
6-7 |
7 |
8 |
| Assays |
Num
Samples |
2,005 |
6,385 |
2,731 |
1,795 |
1,999 |
767 |
| Num
Missing |
65 |
547 |
1 |
12 |
0 |
1 |
| Min
(gpt) |
0.005 |
0.002 |
0.003 |
0.003 |
0.003 |
0.003 |
| Max
(gpt) |
4.000 |
2.000 |
14.150 |
10.000 |
10.000 |
2.660 |
| Wtd
mean (gpt) |
0.953 |
0.241 |
0.260 |
0.452 |
0.253 |
0.122 |
| Wtd
CV |
0.825 |
1.092 |
2.067 |
1.746 |
2.187 |
1.899 |
| Composites |
Num
Samples |
617 |
2,065 |
1,305 |
841 |
917 |
411 |
| Num
Missing |
16 |
131 |
1 |
0 |
0 |
0 |
| Min
(gpt) |
0.011 |
0.004 |
0.003 |
0.003 |
0.003 |
0.004 |
| Max
(gpt) |
4.000 |
2.000 |
6.068 |
6.412 |
4.626 |
1.167 |
| Wtd
mean (gpt) |
0.953 |
0.241 |
0.260 |
0.452 |
0.253 |
0.122 |
| Wtd
CV |
0.703 |
0.944 |
1.562 |
1.447 |
1.570 |
1.409 |
| Difference
in Wtd. Means (%) |
0.0% |
0.0% |
0.0% |
0.0% |
0.0% |
0.0% |
| Effective Date: September 12, 2024 | Page 142 of 181 |
| | S-K 1300 Technical Summary Report – Whistler Project, Alaska |
| Table
11-9 |
Capped
Assay and Composite Statistics by Domain - Cu |
| Source |
Parameters |
Whistler |
Raintree |
Island
Mountain |
| 1 |
2 |
5 |
6-7 |
7 |
8 |
| Assays |
Num
Samples |
1,844 |
6,566 |
2,731 |
1,795 |
1,999 |
767 |
| Num
Missing |
5 |
587 |
1 |
12 |
0 |
1 |
| Min
(gpt) |
0.001 |
0.000 |
0.000 |
0.000 |
0.000 |
0.001 |
| Max
(gpt) |
2.000 |
1.000 |
0.786 |
1.000 |
0.600 |
0.288 |
| Wtd
mean (gpt) |
0.250 |
0.132 |
0.037 |
0.083 |
0.032 |
0.030 |
| Wtd
CV |
0.748 |
0.803 |
1.623 |
1.271 |
1.160 |
0.912 |
| Composites |
Num
Samples |
568 |
2,116 |
1,305 |
841 |
917 |
411 |
| Num
Missing |
3 |
143 |
1 |
0 |
0 |
0 |
| Min
(gpt) |
0.003 |
0.000 |
0.000 |
0.001 |
0.001 |
0.003 |
| Max
(gpt) |
1.396 |
0.736 |
0.317 |
0.654 |
0.397 |
0.223 |
| Wtd
mean (gpt) |
0.250 |
0.132 |
0.037 |
0.083 |
0.032 |
0.030 |
| Wtd
CV |
0.626 |
0.674 |
1.489 |
1.124 |
0.998 |
0.826 |
| Difference
in Wtd. Means (%) |
0.1% |
0.3% |
0.0% |
0.0% |
0.0% |
0.0% |
| Table
11-10 |
Capped
Assay and Composite Statistics by Domain – Ag |
| Source |
Parameters |
Whistler |
Raintree |
Island
Mountain |
| 1 |
2 |
5 |
6-7 |
7 |
8 |
| Assays |
Num
Samples |
1,870 |
5,035 |
2,731 |
1,795 |
1,999 |
767 |
| Num
Missing |
200 |
1897 |
1 |
12 |
0 |
1 |
| Min
(gpt) |
0.200 |
0.050 |
0.250 |
0.250 |
0.250 |
0.250 |
| Max
(gpt) |
100.000 |
100.000 |
200.000 |
30.000 |
20.000 |
14.700 |
| Wtd
mean (gpt) |
2.413 |
2.092 |
3.305 |
1.649 |
0.709 |
0.627 |
| Wtd
CV |
1.745 |
2.101 |
2.337 |
1.339 |
1.556 |
1.420 |
| Composites |
Num
Samples |
604 |
1,873 |
1,305 |
841 |
917 |
411 |
| Num
Missing |
29 |
323 |
1 |
0 |
0 |
0 |
| Min
(gpt) |
0.233 |
0.145 |
0.250 |
0.250 |
0.250 |
0.250 |
| Max
(gpt) |
25.126 |
73.486 |
83.468 |
11.180 |
5.198 |
3.812 |
| Wtd
mean (gpt) |
2.390 |
2.067 |
3.305 |
1.616 |
0.684 |
0.602 |
| Wtd
CV |
1.045 |
1.663 |
1.680 |
1.028 |
0.965 |
0.868 |
| Difference
in Wtd. Means (%) |
-0.9% |
-1.2% |
0.0% |
-2.1% |
-3.7% |
-4.3% |
| Effective Date: September 12, 2024 | Page 143 of 181 |
| | S-K 1300 Technical Summary Report – Whistler Project, Alaska |
Compositing
of Au, Ag and Cu grades have been done as 5 m fixed length composites. Small intervals less than 2.5 m are merged with the up-hole composite
if the composite length is less than 5 m. The length of 5 m is chosen to be half the size of the block height, and longer than the majority
of assay lengths, as illustrated in Figure 11-11. Domain boundaries are honored during compositing.
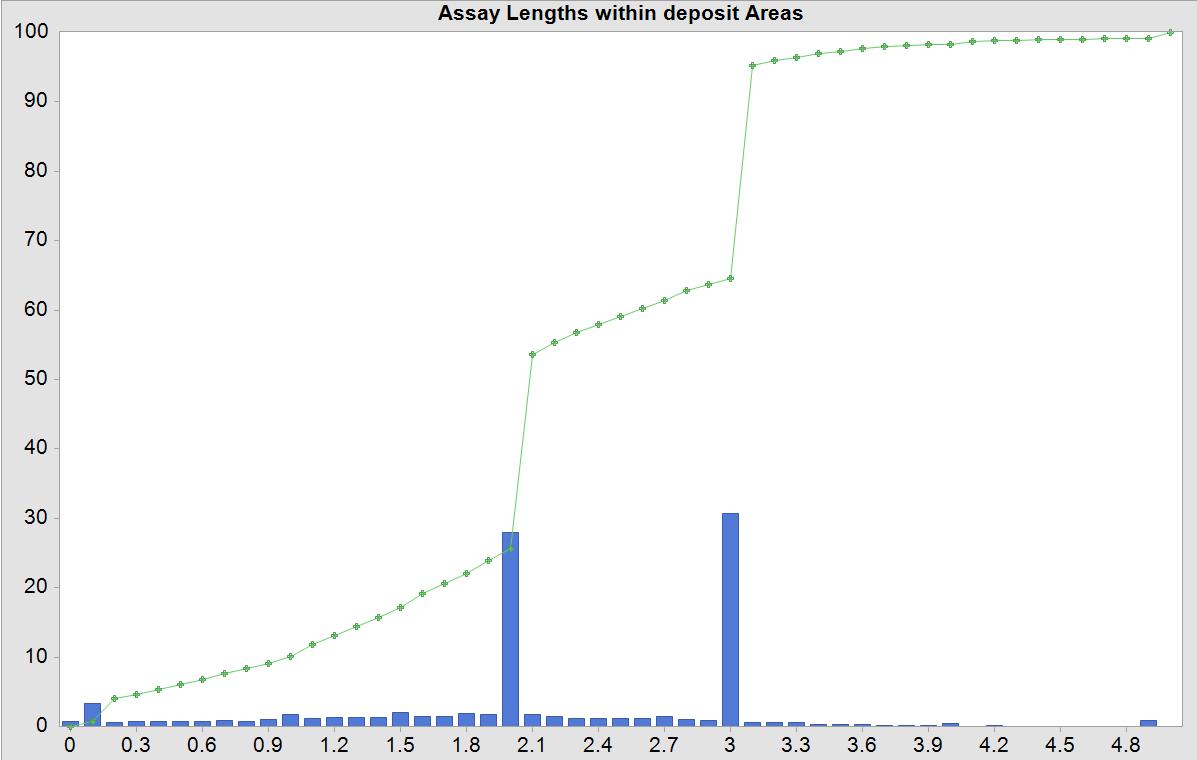
(Source:
MMTS, 2024)
| Figure
11-11 |
Histogram
of Assay Lengths |
Correlograms
have been created for each domain within each deposit. A summary of the spherical correlogram parameters is given in Table 11-11 through
Table 11-13 for Whistler, Raintree, and Island Mountain respectively.
| Table
11-11 |
Variogram
Parameters - Whistler |
| Element |
Domain |
Rotation
(GSLIB-MS) |
Axis |
Total
Range (m) |
Nugget |
Sill1 |
Sill2 |
Sill3 |
Range
1 (m) |
Range
2 (m) |
Range
3 (m) |
| CU |
1 |
ROT |
310 |
Major |
350 |
0.2 |
0.3 |
0.3 |
0.2 |
80 |
120 |
350 |
| DIPN |
0 |
Minor |
350 |
50 |
200 |
350 |
| DIPE |
-30 |
Vert |
400 |
30 |
120 |
400 |
| 2 |
ROT |
330 |
Major |
250 |
0.1 |
0.3 |
0.4 |
0.2 |
30 |
100 |
250 |
| DIPN |
0 |
Minor |
450 |
150 |
250 |
450 |
| DIPE |
75 |
Vert |
180 |
20 |
60 |
180 |
| AU |
1 |
ROT |
310 |
Major |
220 |
0.2 |
0.3 |
0.3 |
0.2 |
80 |
160 |
220 |
| DIPN |
0 |
Minor |
120 |
10 |
45 |
120 |
| DIPE |
-30 |
Vert |
300 |
25 |
80 |
300 |
| 2 |
ROT |
235 |
Major |
450 |
0.1 |
0.3 |
0.2 |
0.4 |
50 |
140 |
450 |
| DIPN |
-60 |
Minor |
180 |
20 |
60 |
180 |
| DIPE |
-15 |
Vert |
80 |
10 |
30 |
80 |
| AG |
1 |
ROT |
0 |
Major |
120 |
0.5 |
0.4 |
0.1 |
|
50 |
120 |
|
| DIPN |
0 |
Minor |
120 |
50 |
120 |
|
| DIPE |
0 |
Vert |
60 |
25 |
60 |
|
| 2 |
ROT |
235 |
Major |
80 |
0.6 |
0.3 |
0.1 |
|
50 |
80 |
|
| DIPN |
-60 |
Minor |
80 |
50 |
80 |
|
| DIPE |
-15 |
Vert |
80 |
50 |
80 |
|
| Effective Date: September 12, 2024 | Page 144 of 181 |
| | S-K 1300 Technical Summary Report – Whistler Project, Alaska |
| Table
11-12 |
Variogram
Parameters - Raintree |
| Element |
Domain |
Rotation
(GSLIB-MS) |
Axis |
Total
Range (m) |
Nugget |
Sill1 |
Sill2 |
Sill3 |
Range
1 (m) |
Range
2 (m) |
Range
3 (m) |
| CU |
5 |
ROT |
90 |
Major |
500 |
0.1 |
0.4 |
0.4 |
0.1 |
200 |
300 |
500 |
| DIPN |
55 |
Minor |
350 |
40 |
200 |
350 |
| DIPE |
0 |
Vert |
300 |
80 |
200 |
300 |
| AU |
5 |
ROT |
90 |
Major |
500 |
0.2 |
0.3 |
0.2 |
0.3 |
50 |
250 |
500 |
| DIPN |
55 |
Minor |
350 |
30 |
150 |
350 |
| DIPE |
0 |
Vert |
150 |
20 |
80 |
150 |
| AG |
5 |
ROT |
90 |
Major |
140 |
0.2 |
0.4 |
0.4 |
|
20 |
140 |
|
| DIPN |
55 |
Minor |
120 |
15 |
120 |
|
| DIPE |
0 |
Vert |
120 |
15 |
120 |
|
| Table
11-13 |
Variogram
Parameters – Island Mountain |
| Element |
Domain |
Rotation
(GSLIB-MS) |
Axis |
Total
Range (m) |
Nugget |
Sill1 |
Sill2 |
Sill3 |
Range
1 (m) |
Range
2 (m) |
Range
3 (m) |
| CU |
1-6 |
ROT |
0 |
Major |
300 |
0.2 |
0.5 |
0.1 |
0.2 |
40 |
150 |
300 |
| DIPN |
-90 |
Minor |
150 |
60 |
100 |
150 |
| DIPE |
0 |
Vert |
120 |
20 |
80 |
120 |
| 7,8 |
ROT |
25 |
Major |
150 |
0.1 |
0.3 |
0.3 |
0.3 |
50 |
80 |
150 |
| DIPN |
0 |
Minor |
150 |
30 |
80 |
150 |
| DIPE |
-20 |
Vert |
120 |
30 |
35 |
120 |
| AU |
1-6 |
ROT |
0 |
Major |
200 |
0.3 |
0.4 |
0.2 |
0.1 |
50 |
140 |
200 |
| DIPN |
-90 |
Minor |
150 |
50 |
80 |
150 |
| DIPE |
0 |
Vert |
100 |
20 |
50 |
100 |
| 7,8 |
ROT |
25 |
Major |
100 |
0.2 |
0.4 |
0.3 |
0.1 |
50 |
80 |
100 |
| DIPN |
0 |
Minor |
150 |
40 |
90 |
150 |
| DIPE |
-20 |
Vert |
100 |
15 |
70 |
100 |
| AG |
1-6 |
ROT |
0 |
Major |
150 |
0.3 |
0.4 |
0.3 |
|
30 |
150 |
|
| DIPN |
-90 |
Minor |
100 |
20 |
100 |
|
| DIPE |
0 |
Vert |
100 |
20 |
100 |
|
| 7,8 |
ROT |
25 |
Major |
150 |
0.1 |
0.6 |
0.3 |
|
50 |
150 |
|
| DIPN |
0 |
Minor |
160 |
30 |
160 |
|
| DIPE |
-20 |
Vert |
75 |
15 |
75 |
|
| Effective Date: September 12, 2024 | Page 145 of 181 |
| | S-K 1300 Technical Summary Report – Whistler Project, Alaska |
An
example of the Variogram Model for Cu in Domain 1 in the major and minor axes directions is illustrated in Figure 11-12 for Cu and Figure
11-13 for Au in the Whistler deposit. Figure 11-14 is the variograms for Cu at Raintree in Domain 5. And Figure 11-15 illustrates the
variogram for Island Mountain for the major and minor axes for Au.
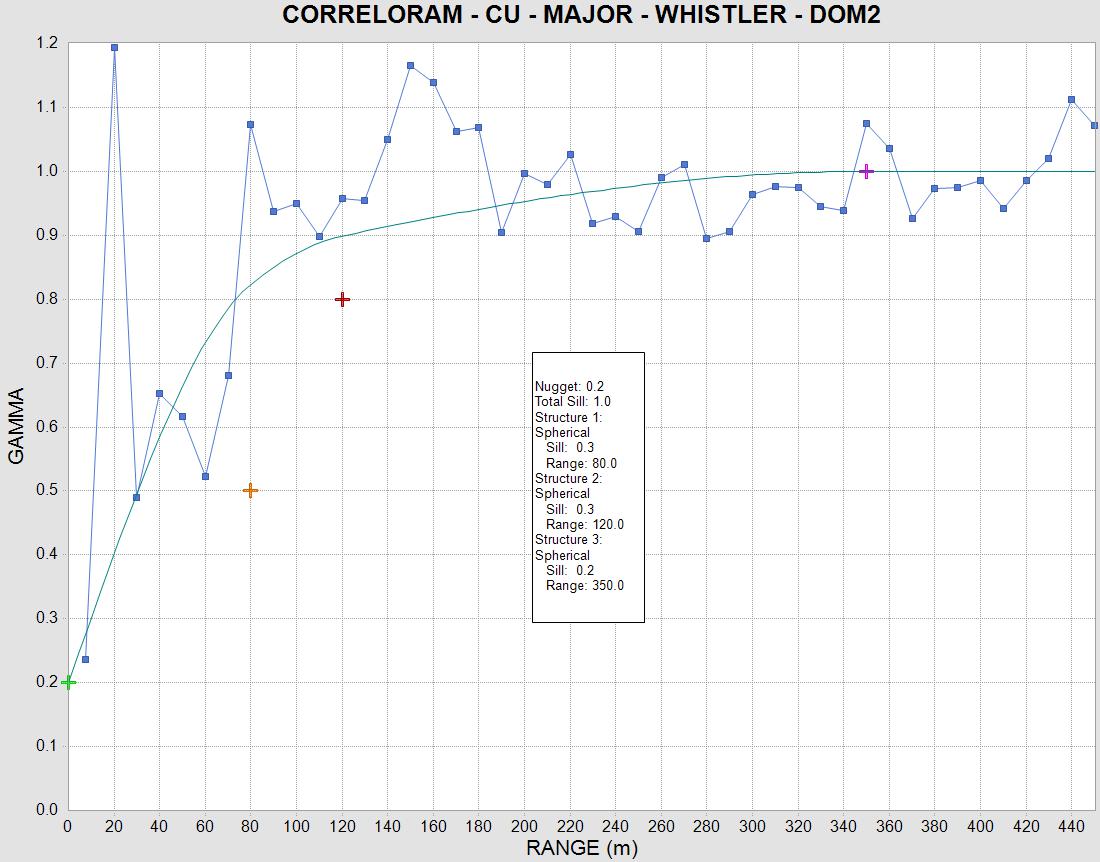
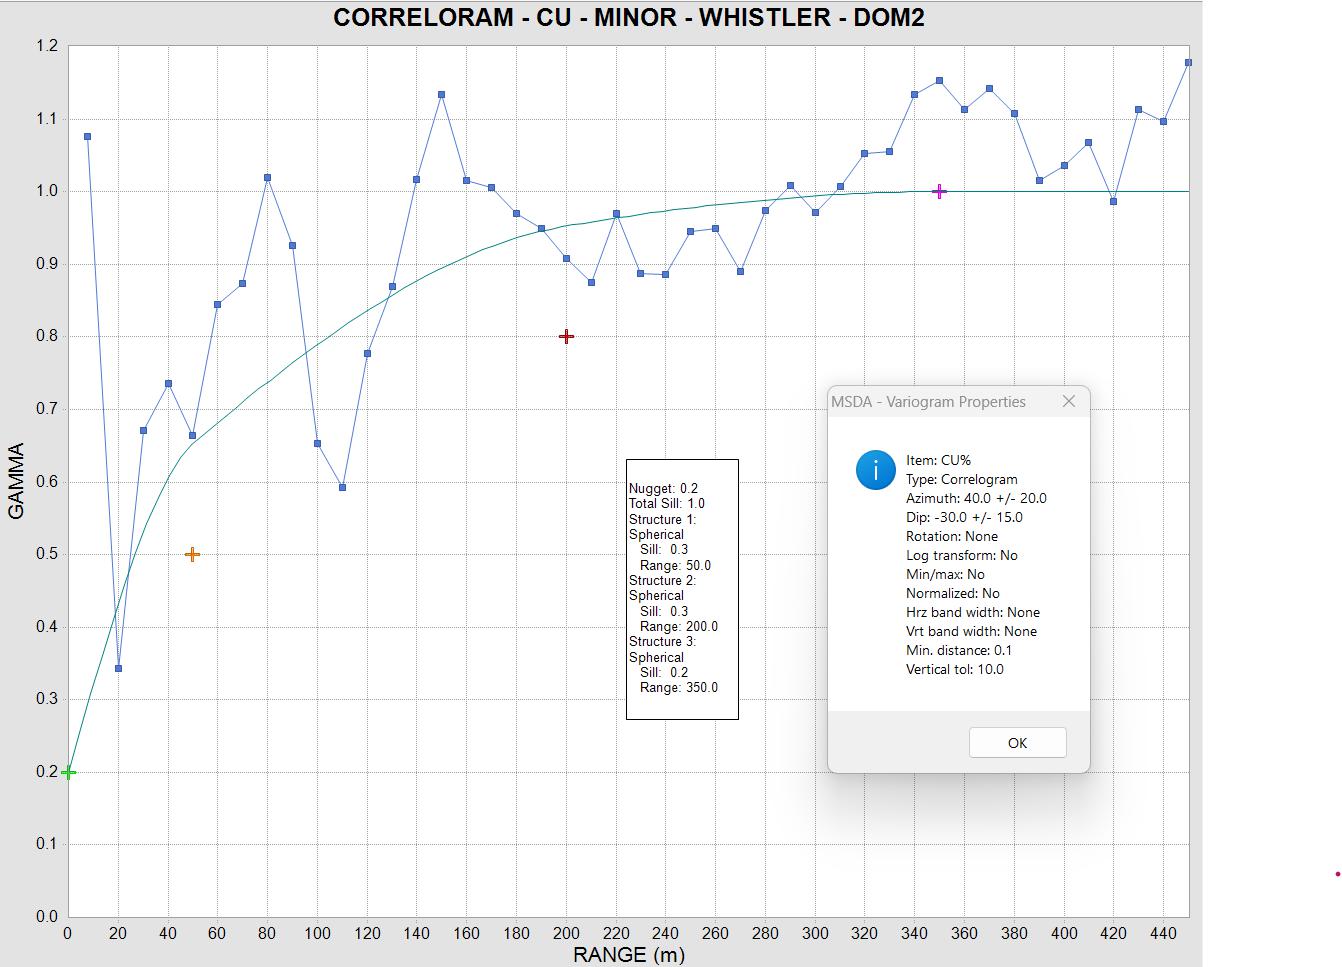
(Source:
MMTS, 2024)
| Figure 11-12 Variogram Model for
Cu Lower Grade “Halo” – Major and Minor Axes – Whistler Deposit |
| Effective Date: September 12, 2024 | Page 146 of 181 |
| | S-K 1300 Technical Summary Report – Whistler Project, Alaska |
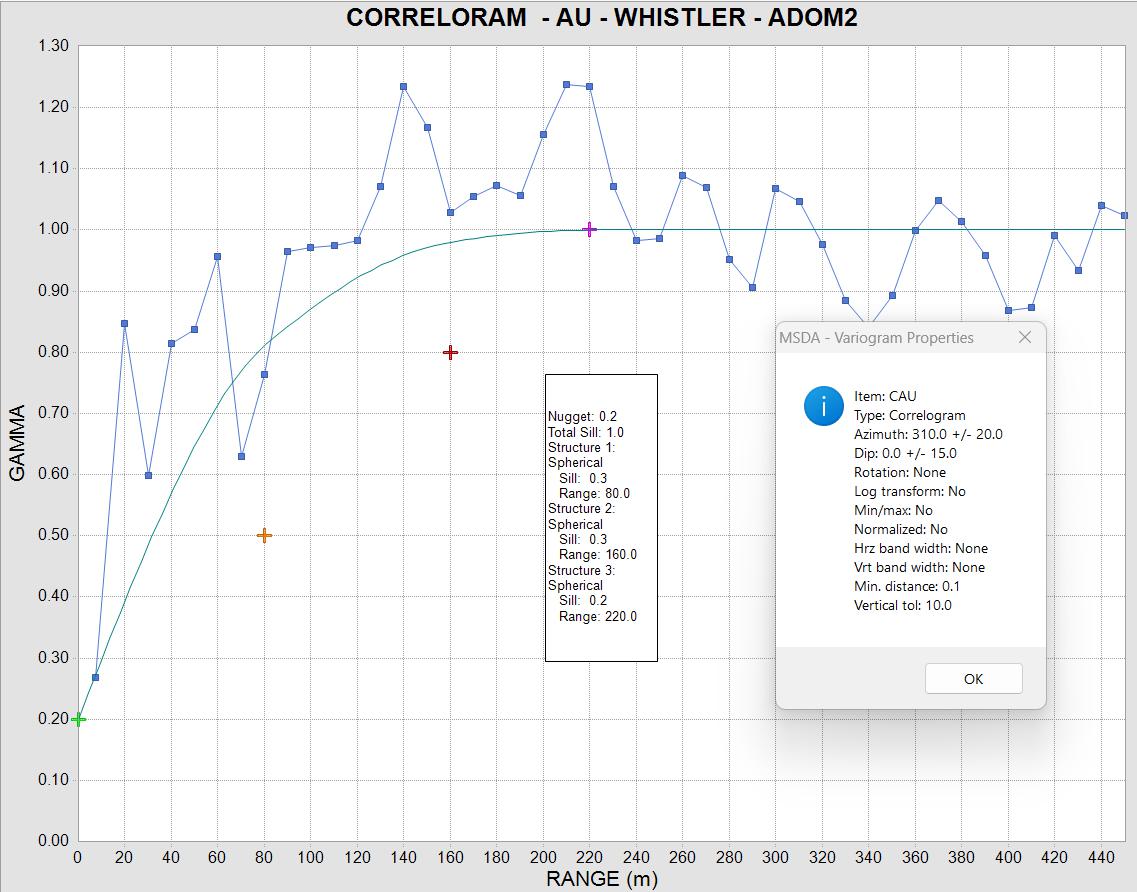
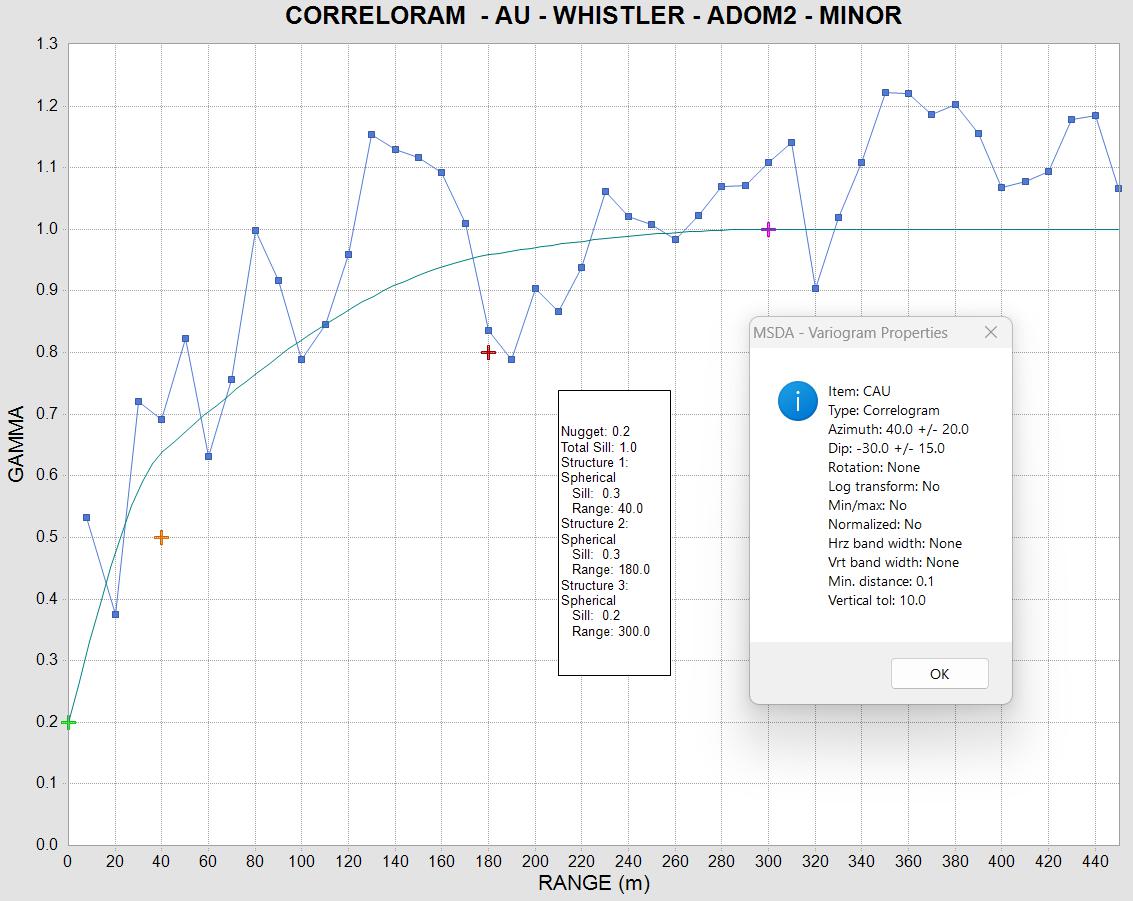
(Source:
MMTS, 2024)
| Figure
11-13 |
Variogram
Model for Au in Domain 1 – Major and Minor Axes – Whistler Deposit |
| Effective Date: September 12, 2024 | Page 147 of 181 |
| | S-K 1300 Technical Summary Report – Whistler Project, Alaska |
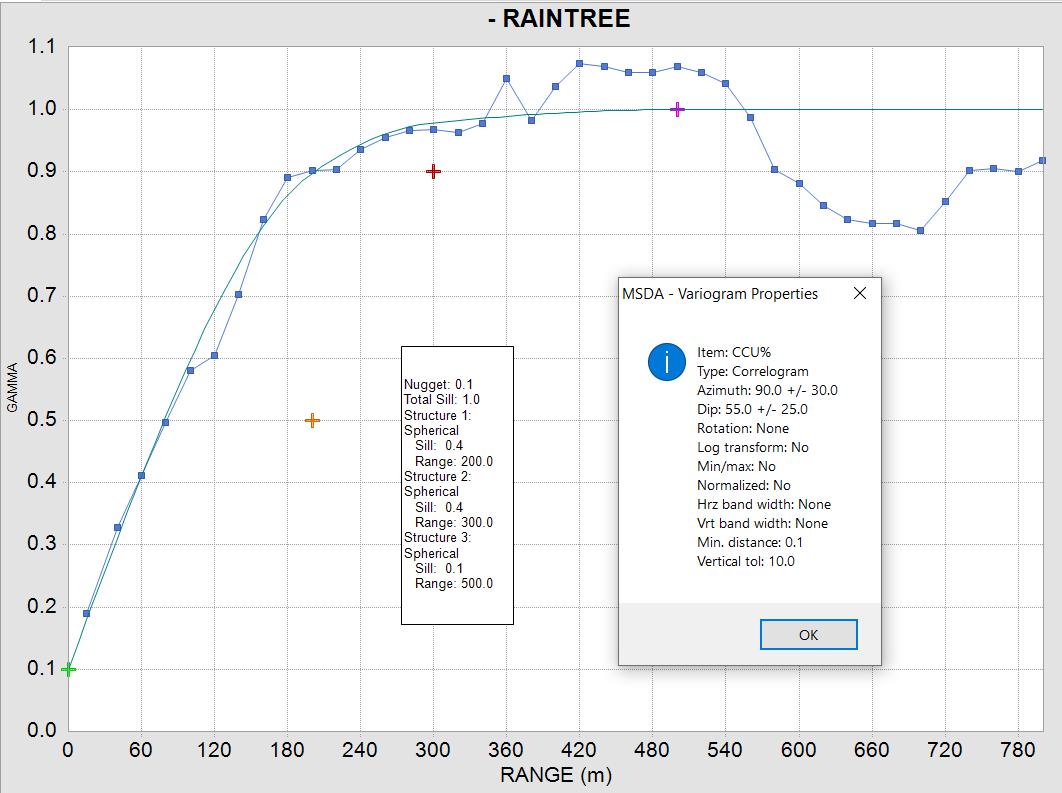
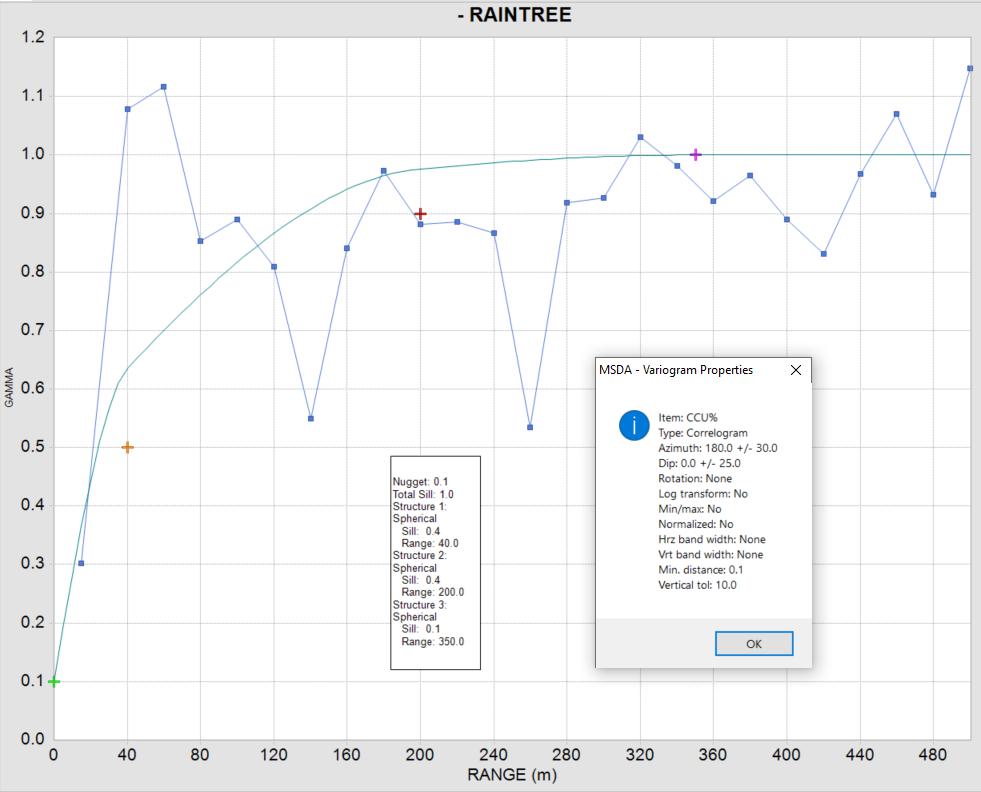
(Source:
MMTS, 2024)
| Figure
11-14 |
Variogram
Model for Cu in Domain 5 – Major and Minor Axes – Raintree Deposit |
| Effective Date: September 12, 2024 | Page 148 of 181 |
| | S-K 1300 Technical Summary Report – Whistler Project, Alaska |
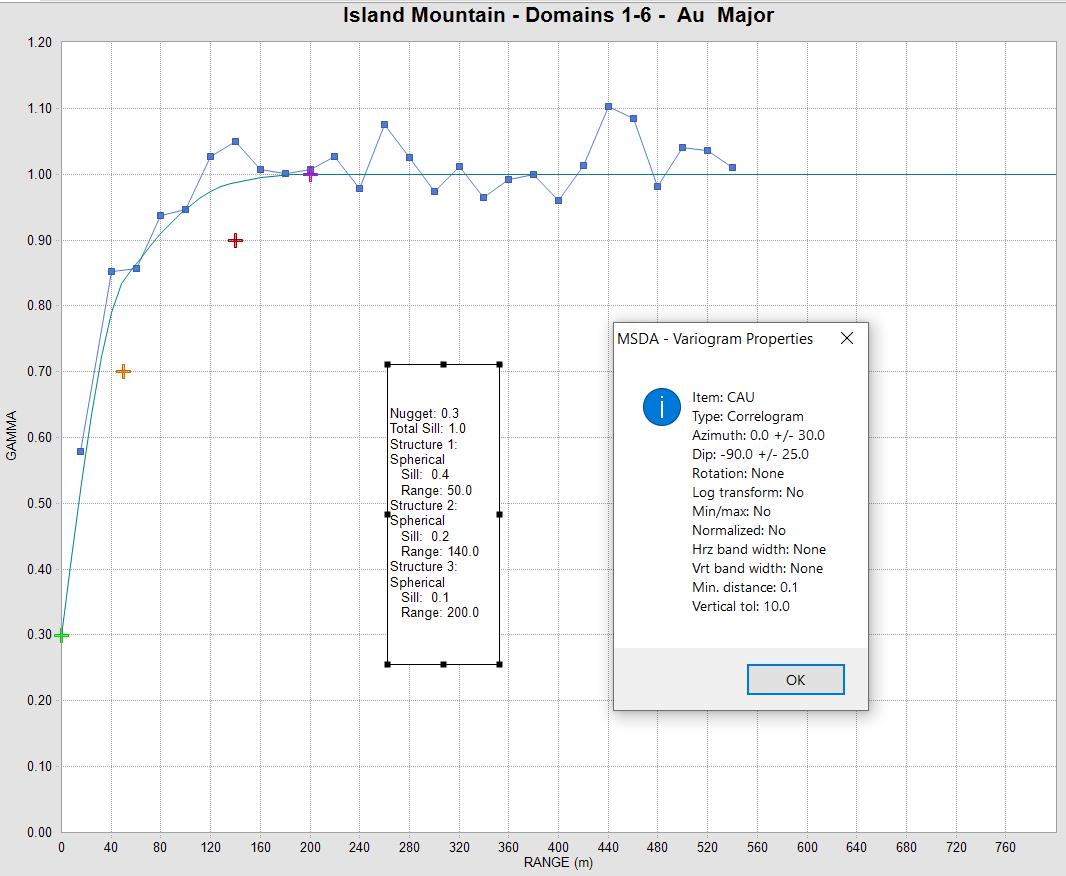
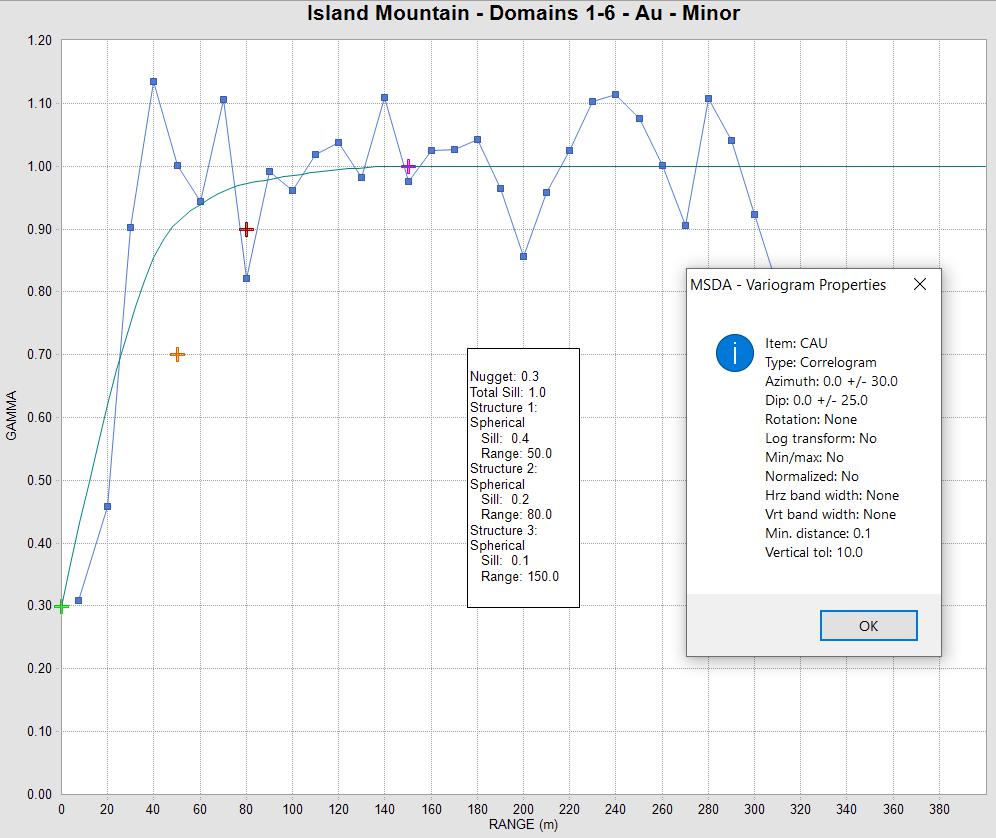
(Source:
MMTS, 2024)
| Figure
11-15 |
Variogram
Model for Au in Domains 1-6 – Major and Minor Axes – Island Mountain Deposit |
| Effective Date: September 12, 2024 | Page 149 of 181 |
| | S-K 1300 Technical Summary Report – Whistler Project, Alaska |
| 11.6 |
Block Model Interpolations |
The
block model limits and block size for each deposit are as given in Table 11-14.
Table
11-14 Block Model Limits
| Deposit |
Direction |
From |
To |
Block
size |
#
Blocks |
| Whistler |
East |
517,200 |
519,860 |
20 |
133 |
| North |
6,870,000 |
6,873,000 |
20 |
150 |
| Elevation |
-50 |
1,280 |
10 |
133 |
| Raintree
West |
East |
519,700 |
521,100 |
10 |
140 |
| North |
6,871,000 |
6,872,000 |
10 |
100 |
| Elevation |
-260 |
730 |
10 |
99 |
| Island
Mountain |
East |
511,500 |
513,600 |
10 |
210 |
| North |
6,847,000 |
6,848,400 |
10 |
140 |
| Elevation |
490 |
1,470 |
10 |
98 |
Interpolation of Au, Cu and Ag values is done by ordinary kriging (OK)
in four passes based on the variogram parameters. Interpolations used hard boundaries, with composites and block codes required to match
within each domain. Search parameters are summarized in Table 11-15 through Table 11-17 below.
| Table 11-15 |
Search Rotation and Distances – Whistler |
| Element |
Domain |
Rot |
Dist1 |
Dist
2 |
Dist3 |
Dist4 |
Dist5 |
| CU |
1 |
310 |
80 |
160 |
263 |
350 |
700 |
| 0 |
50 |
100 |
200 |
350 |
700 |
| -30 |
30 |
60 |
120 |
400 |
800 |
| 2 |
330 |
30 |
60 |
120 |
250 |
500 |
| 0 |
113 |
225 |
338 |
450 |
900 |
| 75 |
20 |
40 |
80 |
180 |
360 |
| AU |
1 |
310 |
55 |
110 |
165 |
220 |
440 |
| 0 |
10 |
20 |
40 |
120 |
240 |
| -30 |
25 |
50 |
100 |
300 |
600 |
| 2 |
235 |
113 |
150 |
225 |
450 |
900 |
| -60 |
45 |
60 |
90 |
180 |
360 |
| -15 |
20 |
27 |
40 |
80 |
160 |
| AG |
1 |
0 |
30 |
60 |
90 |
120 |
240 |
| 0 |
30 |
60 |
90 |
120 |
240 |
| 0 |
15 |
30 |
45 |
60 |
120 |
| 2 |
235 |
20 |
27 |
40 |
80 |
160 |
| -60 |
20 |
27 |
40 |
80 |
160 |
| -15 |
20 |
27 |
40 |
80 |
160 |
| Effective Date: September 12, 2024 | Page 150 of 181 |
| | S-K 1300 Technical Summary Report – Whistler Project, Alaska |
| Table
11-16 |
Search
Rotation and Distances – Raintree |
| Element |
Domain |
Rot |
Dist1 |
Dist2 |
Dist3 |
Dist4 |
| CU |
1 |
90 |
125 |
250 |
375 |
500 |
| 55 |
88 |
175 |
263 |
350 |
| 0 |
75 |
150 |
225 |
300 |
| AU |
1 |
90 |
125 |
250 |
375 |
500 |
| 55 |
88 |
175 |
263 |
350 |
| 0 |
38 |
75 |
113 |
150 |
| AG |
1 |
90 |
35 |
70 |
105 |
140 |
| 55 |
30 |
60 |
90 |
120 |
| 0 |
30 |
60 |
90 |
120 |
| Table
11-17 |
Search
Rotation and Distances – Island Mountain |
| Element |
Domain |
Rot |
Dist1 |
Dist2 |
Dist3 |
Dist4 |
| CU |
1-6 |
0 |
40 |
80 |
160 |
300 |
| -90 |
37.5 |
75 |
112.5 |
150 |
| 0 |
20 |
40 |
80 |
120 |
| 7,8 |
25 |
37.5 |
75 |
112.5 |
150 |
| 0 |
30 |
60 |
112.5 |
150 |
| -20 |
30 |
60 |
90 |
120 |
| AU |
1-6 |
0 |
50 |
100 |
150 |
200 |
| -90 |
37.5 |
75 |
112.5 |
150 |
| 0 |
20 |
40 |
75 |
100 |
| 7,8 |
25 |
25 |
50 |
75 |
100 |
| 0 |
37.5 |
75 |
112.5 |
150 |
| -20 |
15 |
30 |
60 |
100 |
| AG |
1-6 |
0 |
30 |
60 |
112.5 |
150 |
| -90 |
20 |
40 |
75 |
100 |
| 0 |
20 |
40 |
75 |
100 |
| 7,8 |
25 |
37.5 |
75 |
112.5 |
150 |
| 0 |
30 |
60 |
120 |
160 |
| -20 |
15 |
30 |
56.25 |
75 |
Additional
search criteria on composite selection are summarized in Table 11-18. Search criteria are used to ensure that more than one drillhole
is used for all passes, and more than one quadrant is used for the first three passes, as well as to limit smoothing of grade by limiting
the maximum number of composites to be used.
| Effective Date: September 12, 2024 | Page 151 of 181 |
| | S-K 1300 Technical Summary Report – Whistler Project, Alaska |
| Table
11-18 |
Additional
Search Criteria |
| Criteria |
Pass
1 |
Pass
2 |
Pass
3 |
Pass
4 |
| Minimum
# composites |
3 |
3 |
3 |
3 |
| Maximum
# Composites |
12 |
12 |
12 |
12 |
| Maximum
/ drillhole |
2 |
2 |
2 |
2 |
| Maximum
/ quadrant |
2 |
2 |
2 |
na |
Classification has been done in accordance with 229.1302(d)(1)(iii)(A)
(Item 1302(d)(1)(iii)(A) of Regulation S-K. The Classification is based on the variogram parameters, with the required average distance
to the nearest two drillholes required to be less than the distance of the range at 80% of the sill (R80 value) for each domain as summarized
in Table 11-19.
| Table
11-19 |
Classification
Criteria |
| Deposit |
Whistler |
Raintree |
Island
Mountain |
| Domain |
1 |
2 |
5 |
99 |
1-6 |
7-8 |
| Average
Distance to 2 DHs |
120 |
120 |
100 |
100 |
80 |
80 |
| Distance
to furthest DH |
170 |
170 |
na |
na |
na |
na |
| 11.8 |
Block Model Validation |
| 11.8.1 |
Comparison of Tonnage and Grades |
Interpolations have also been completed using a Nearest Neighbour
method to essentially de-cluster the composite data for grade comparisons with the modelled grades. Table 11-19 gives a summary of the
mean grades for de-clustered composites (NN interpolation), and OK grades at a 0.1% Cu cut-off. Table 11-20 gives a summary of the mean
grades for de-clustered composites (NN interpolation), and OK grades at a 0.1% Cu cut-off. The tonnage, grade and metal content are variable,
but conservative compared to the un-capped de-clustered composites.
This
comparison is illustrated more succinctly in the plots of tonnage-grade curves. Cut-off grade plots (tonnage-grade curves) are constructed
for each metal to check the validity of the modelling. The NN values for Au and Cu are plotted and compared to the modelled OK values
for the Whistler deposit in Figure 11-16 and Figure 11-17. For Raintree, the tonnage-grade curves for Au and Cu are presented in Figure
11-18 and Figure 11-19. And for Island Mountain the tonnage grade curves are presented in Figure 11-20 and Figure 11-21. The curves for
Whistler and Island Mountain are within the Resource confining pit shape. For Raintree, all blocks within modelled domains are plotted
due to the underground component of the resource. In each case, the distributions show good correlation, and thus the change of support
are valid.
| Effective Date: September 12, 2024 | Page 152 of 181 |
| | S-K 1300 Technical Summary Report – Whistler Project, Alaska |
| Table
11-20 |
Comparison
of De-clustered Composite and OK Modelled Grades for Cu |
| |
|
|
Modelled
OK |
De-clustered
composites (NN) |
|
| Cutoff |
Class |
Deposit |
ROM |
Grade |
Metal |
ROM |
Grade |
Metal |
Difference |
| Cu
(%) |
Tonnage
(kt) |
Cu
(%) |
(Mlbs) |
Tonnage
(kt) |
Cu
(%) |
(Mlbs) |
(%) |
| 0.1 |
Indicated |
Whistler |
243,503 |
0.175 |
941.6 |
221,759 |
0.1917 |
937.2 |
0.5% |
| Raintree |
2,310 |
2310.000 |
0.0 |
3,689 |
3689 |
0.0 |
-5.4% |
| Inferred |
Whistler |
14,365 |
0.151 |
47.9 |
12,809 |
0.1765 |
49.8 |
-4.0% |
| Raintree |
1,680 |
1680.000 |
0.0 |
1,330 |
1330 |
0.0 |
-36.3% |
| Island
Mtn. |
15,582 |
0.153 |
52.5 |
16,123 |
0.1859 |
66.1 |
-25.8% |
| Table 11-21 |
Comparison of De-clustered Composite and OK Modelled Grades for Au
|
| |
|
|
Modelled
OK |
De-clustered
composites (NN) |
|
| Cutoff |
Class |
Deposit |
ROM |
Grade |
Metal |
ROM |
Grade |
Metal |
Difference |
| Au
(gpt) |
Tonnage
(kt) |
Au
(gpt) |
(Koz) |
Tonnage
(kt) |
Au
(gpt) |
(Koz) |
(%) |
| 0.1 |
Indicated |
Whistler |
290,826 |
0.405 |
3,783 |
260,958 |
0.4564 |
3,829 |
-1.2% |
| Raintree |
12,257 |
0.373 |
147 |
9,861 |
0.4463 |
141 |
3.7% |
| Inferred |
Whistler |
19,035 |
0.388 |
237 |
14,849 |
0.5679 |
271 |
-14.3% |
| Raintree |
24,334 |
0.398 |
311 |
18,258 |
0.4959 |
291 |
6.5% |
| Island
Mtn. |
209,394 |
0.334 |
2,247 |
157,142 |
0.4727 |
2,388 |
-6.3% |
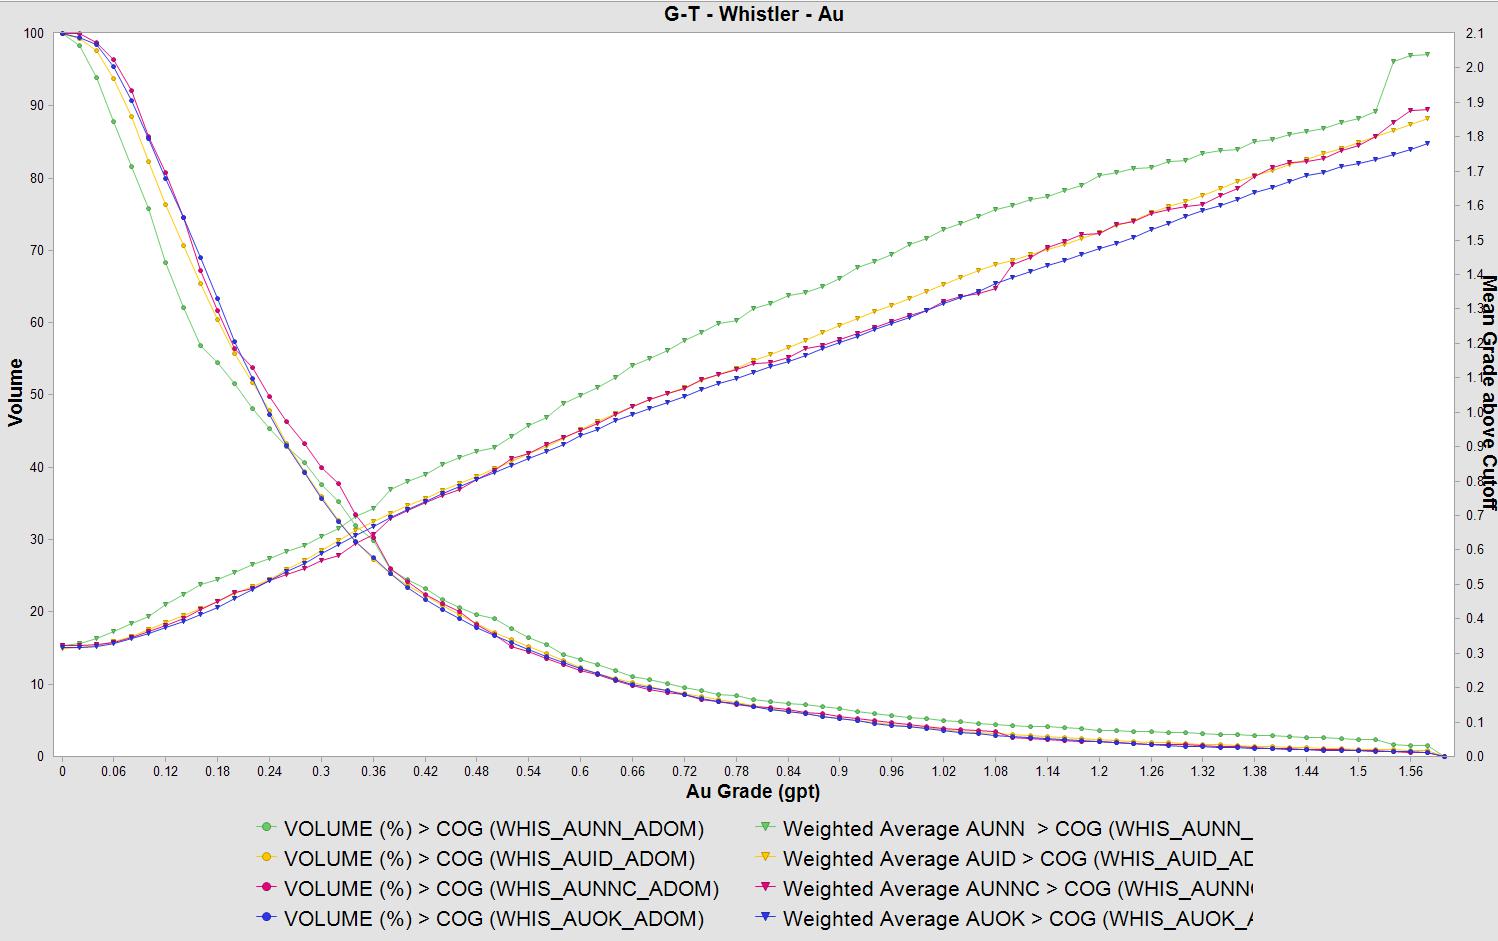
(Source:
MMTS, 2024)
| Figure
11-16 |
Tonnage-Grade
Curves for Au – Comparison of Interpolation Methods – Whistler |
| Effective Date: September 12, 2024 | Page 153 of 181 |
| | S-K 1300 Technical Summary Report – Whistler Project, Alaska |
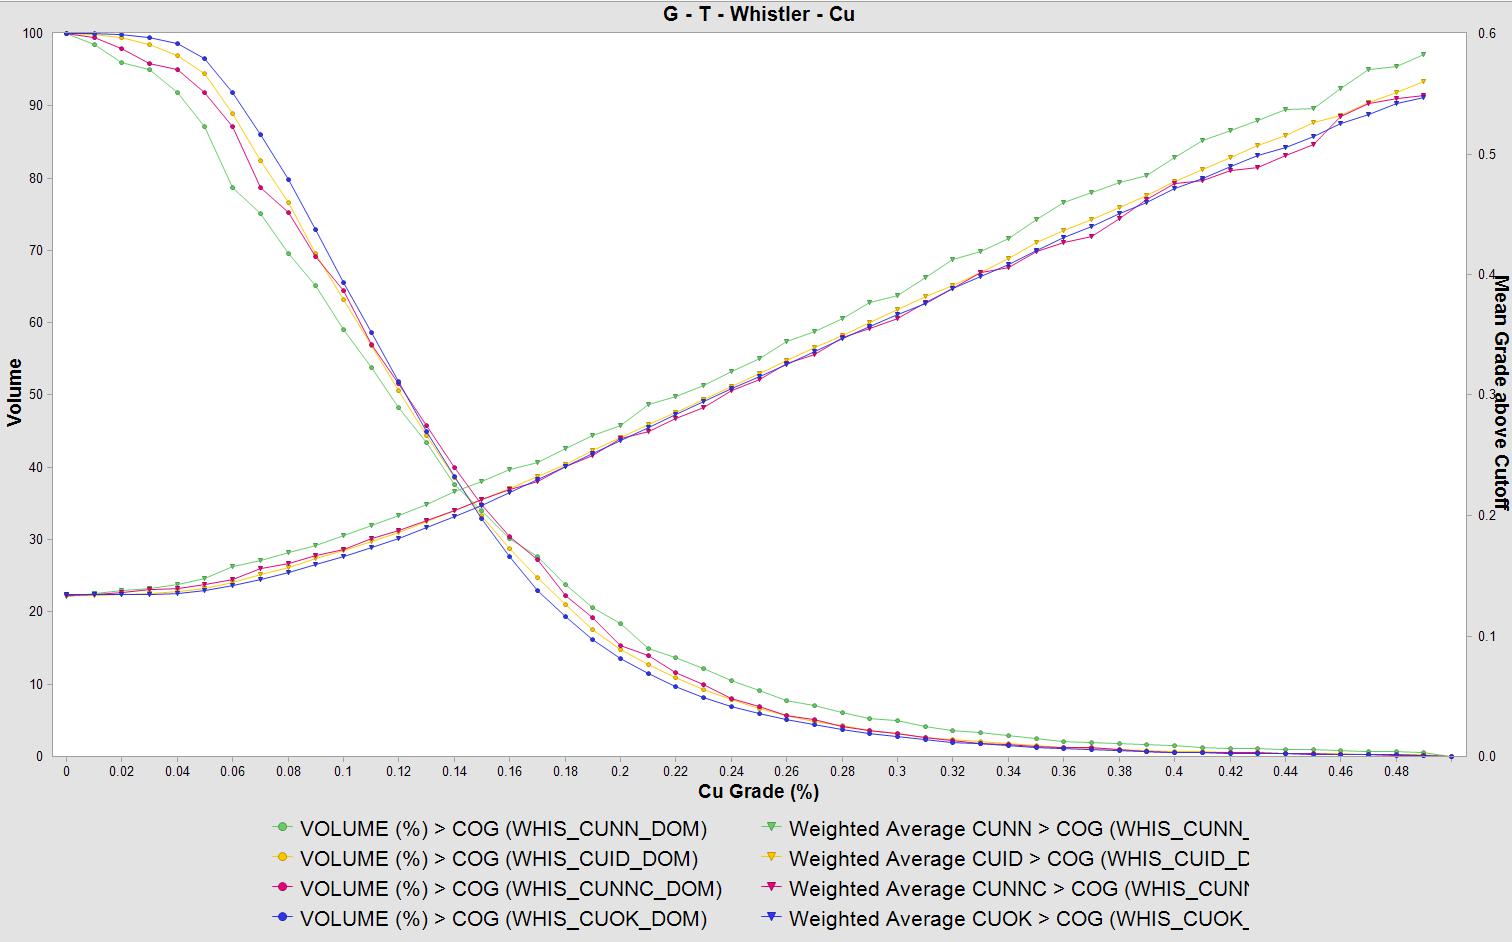
(Source:
MMTS, 2024)
| Figure 11-17 |
Tonnage-Grade
Curves for Cu – Comparison of Interpolation Methods - Whistler |
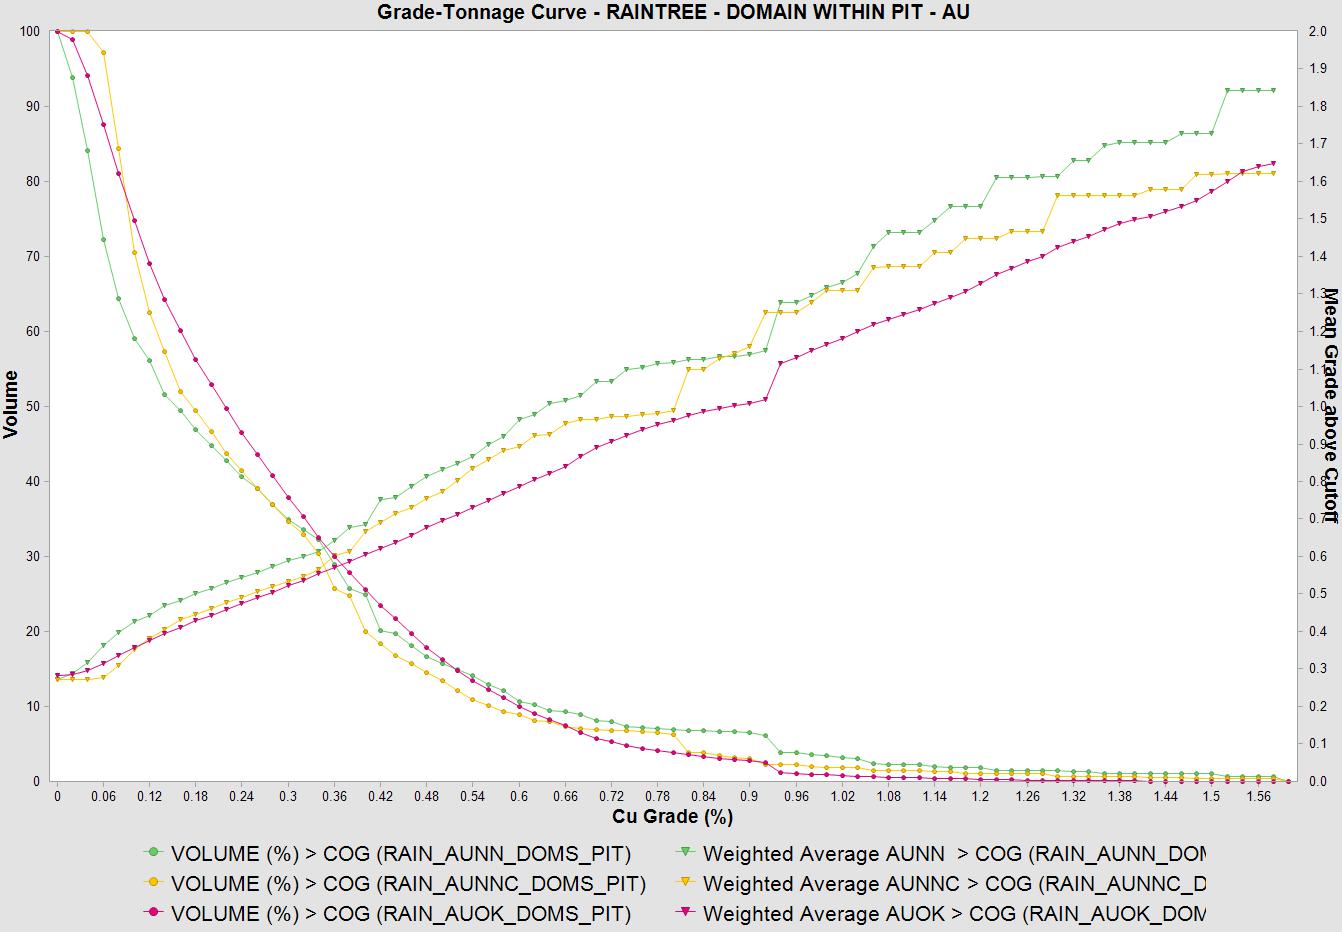
(Source:
MMTS, 2024)
| Figure 11-18 |
Tonnage-Grade
Curves for Au – Comparison of Interpolation Methods – Raintree |
| Effective Date: September 12, 2024 | Page 154 of 181 |
| | S-K 1300 Technical Summary Report – Whistler Project, Alaska |
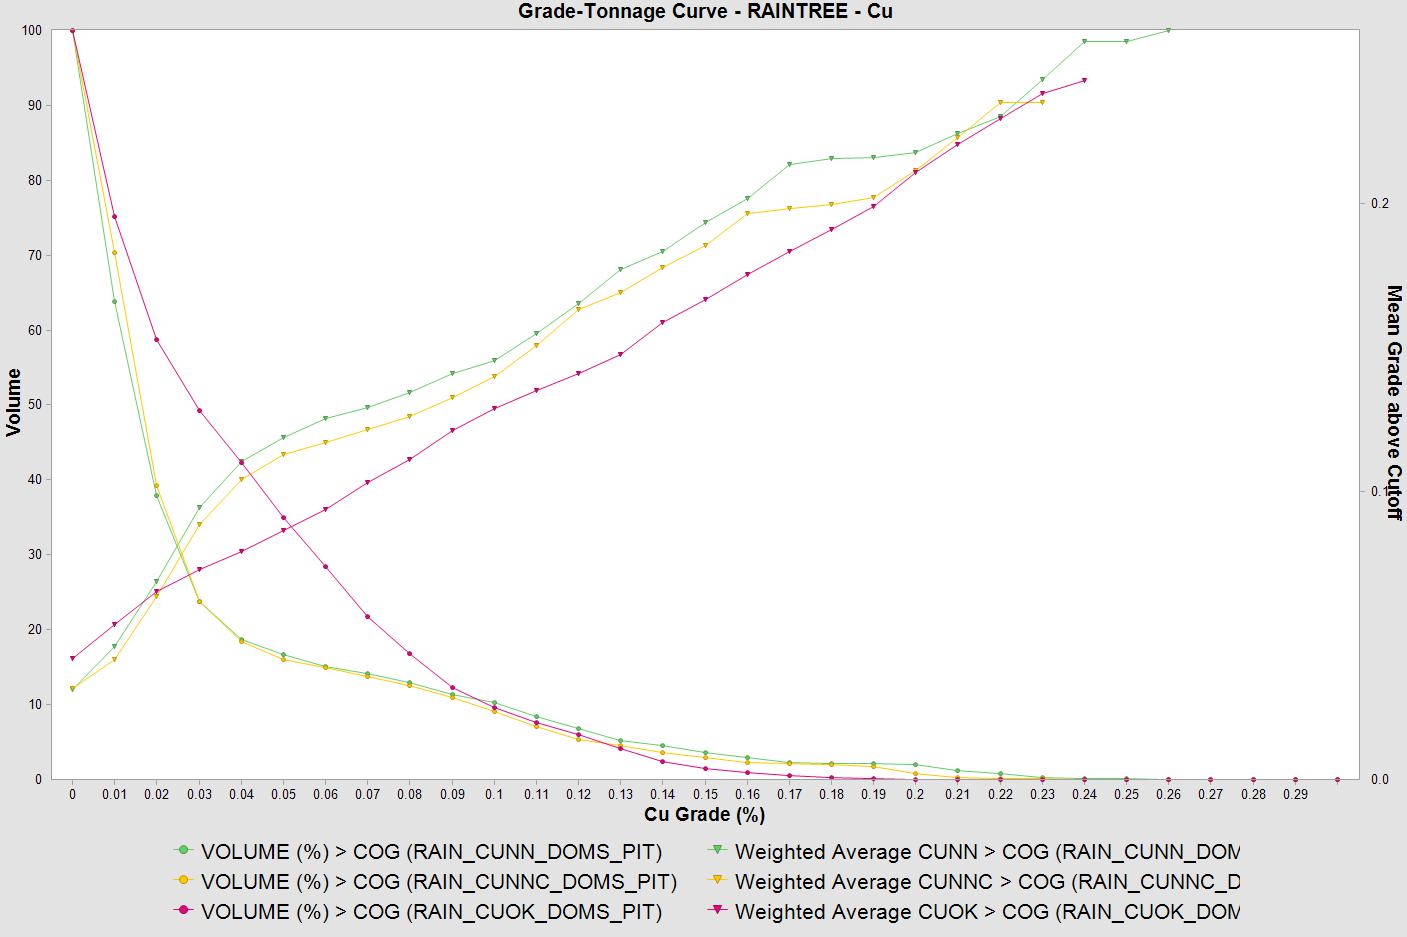
(Source:
MMTS, 2024)
| Figure
11-19 |
Tonnage-Grade
Curves for Cu – Comparison of Interpolation Methods - Raintree |
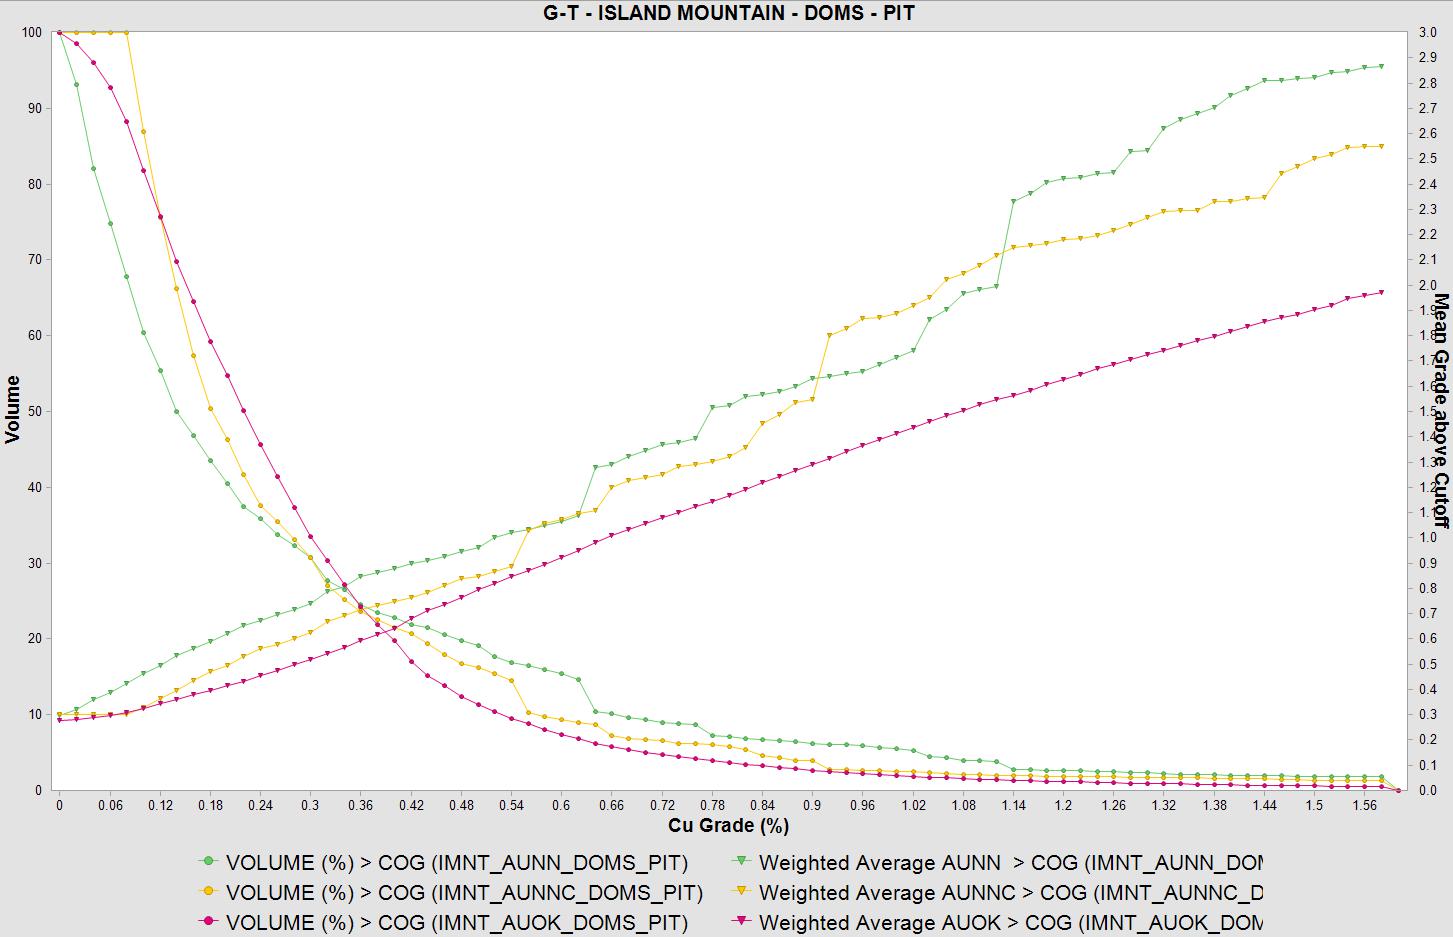
(Source:
MMTS, 2024)
| Figure
11-20 |
Tonnage-Grade
Curves for Au – Comparison of Interpolation Methods – Island Mountain |
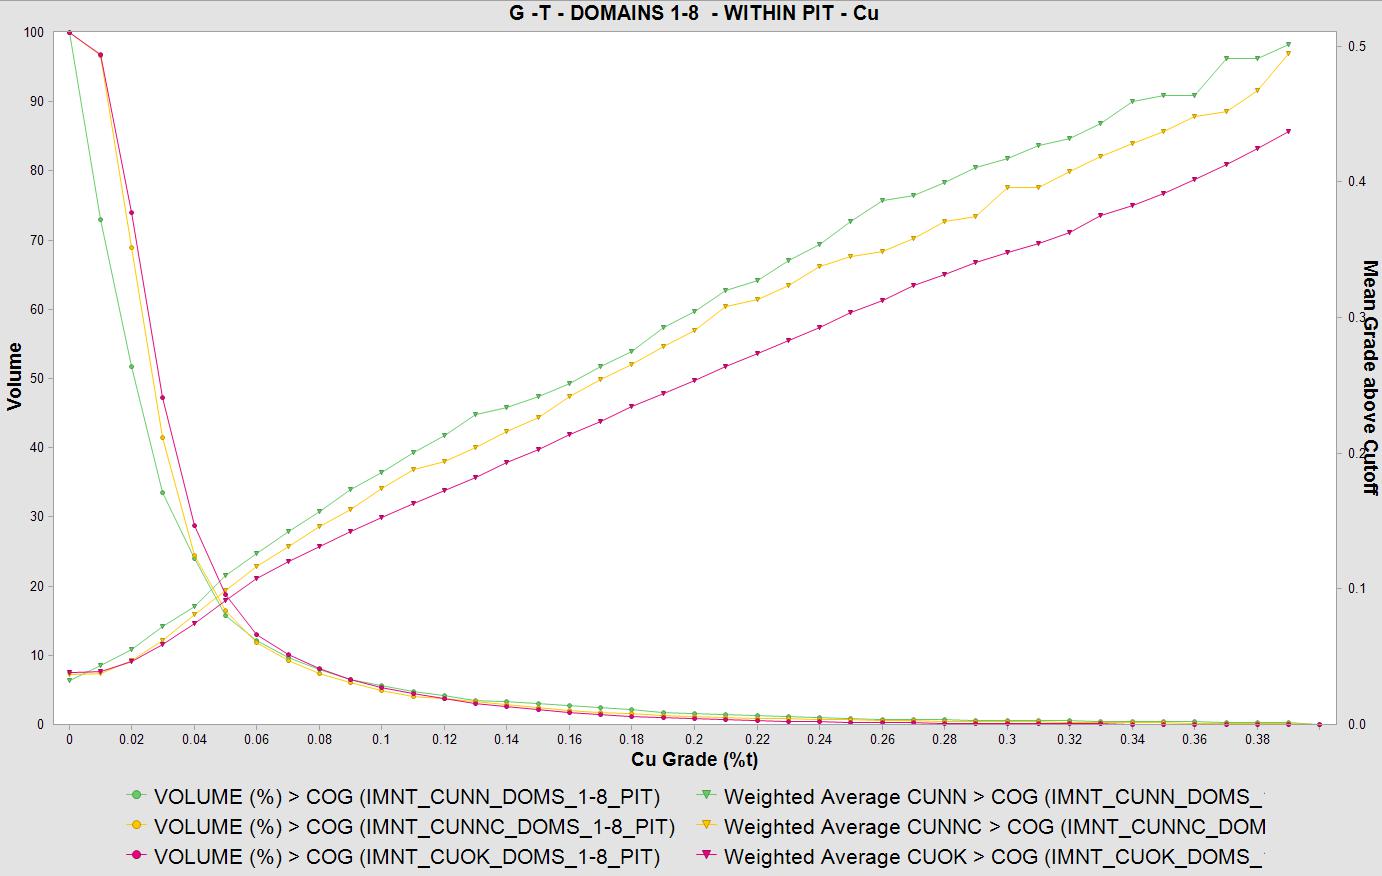
(Source:
MMTS, 2024)
| Figure
11-21 |
Tonnage-Grade
Curves for Cu – Comparison of Interpolation Methods - Island Mountain |
A
series of E-W, N-S sections (every 20 m) and plans (every 10 m) have been used to inspect the ordinary kriging (OK) block model grades
with the original assay data. Figure 11-22 and Figure 11-23 give examples of this comparison at Whistler for the E-W section at 6871330N,
for Au and Cu grades respectively. Figure 11-24 and Figure 11-25 illustrate the grade comparisons at Raintree through the center of the
deposit with looking SW at an azimuth of 135 degrees. Figure 11-26 and Figure 11-27 are plots of the Au and Cu grades respectively for
Island Mountain through the center of the deposit at 6847740N.
Plots
throughout the model confirmed that the block model grades corresponded well with the assayed grades.
| Effective Date: September 12, 2024 | Page 155 of 181 |
| | S-K 1300 Technical Summary Report – Whistler Project, Alaska |
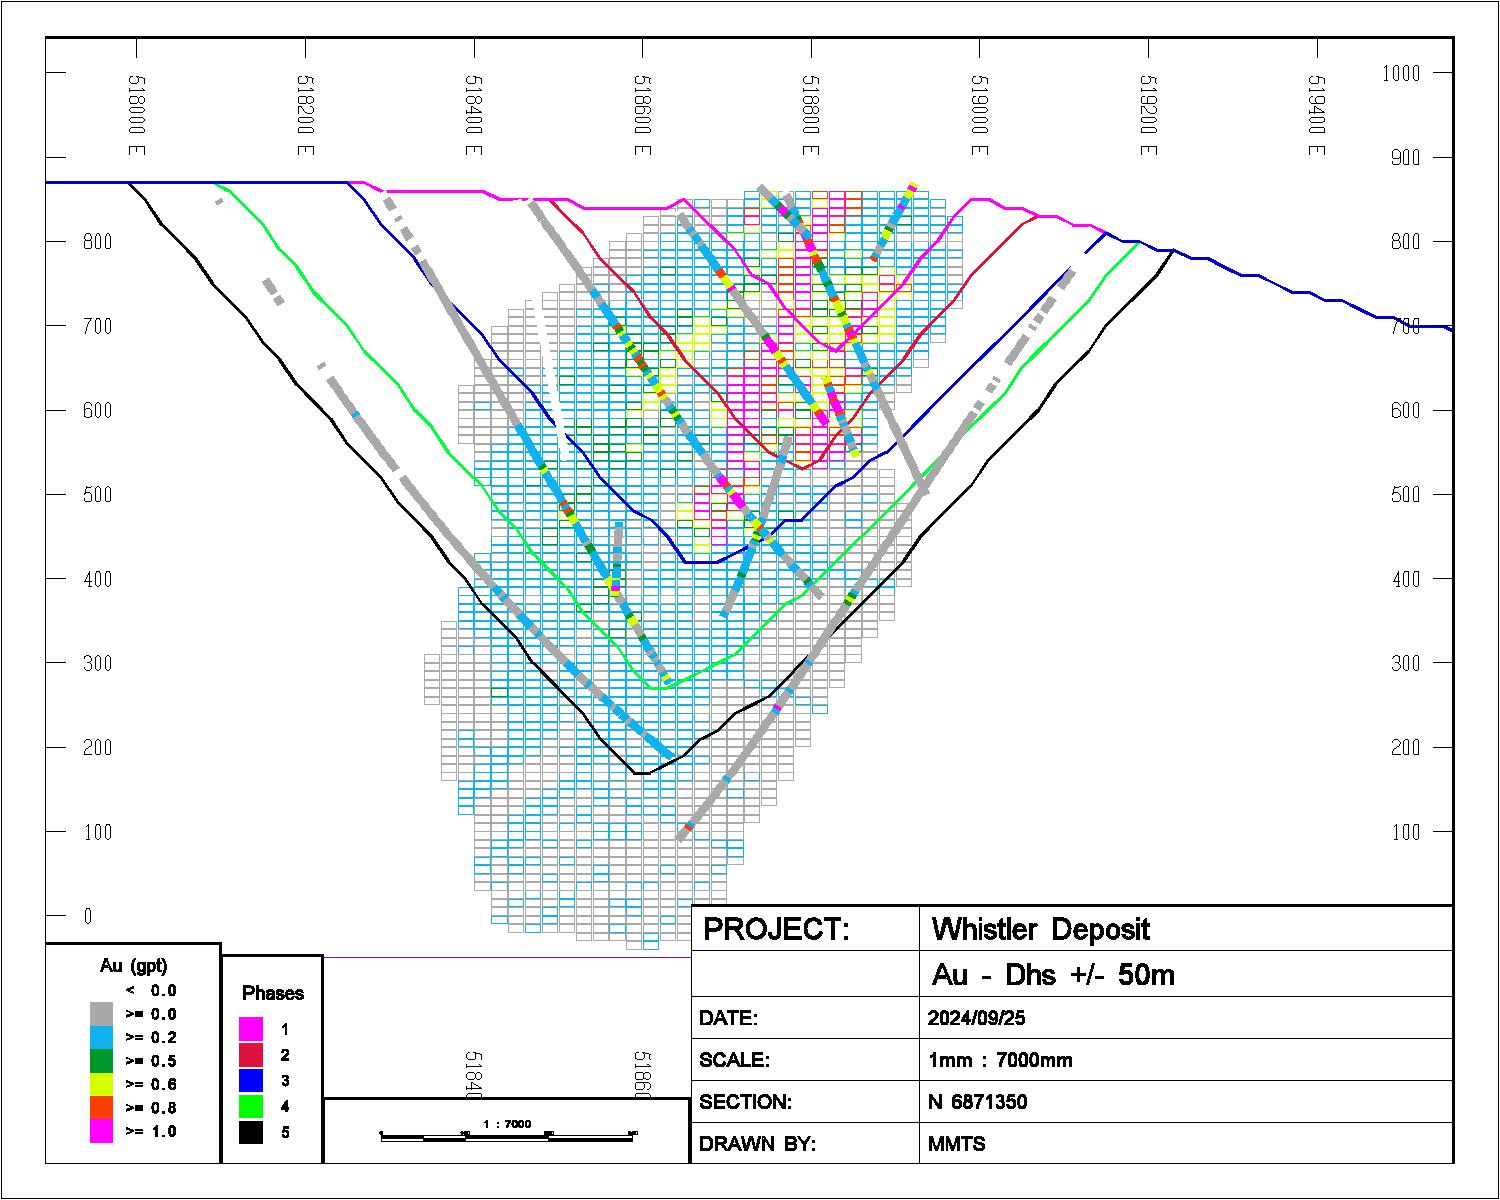
| Figure
11-22 |
E-W
Section Comparing Au Grades for Block Model and Assay Data - Whistler |
| Effective Date: September 12, 2024 | Page 156 of 181 |
| | S-K 1300 Technical Summary Report – Whistler Project, Alaska |
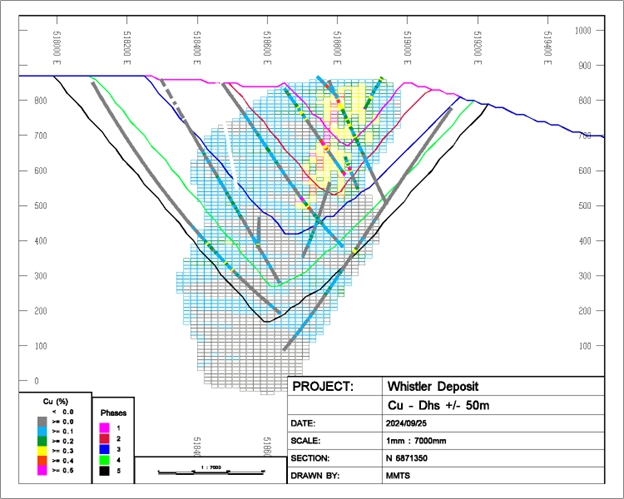
| Figure 11-23 |
E-W Section Comparing Cu Grades for Block Model and Assay
Data - Whistler |
| Effective Date: September 12, 2024 | Page 157 of 181 |
| | S-K 1300 Technical Summary Report – Whistler Project, Alaska |
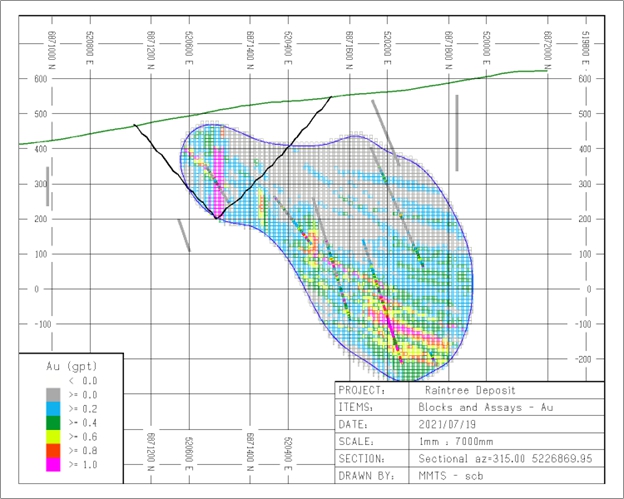
| Figure
11-24 |
Section Looking SW - Comparing
Au Grades for Block Model and Assay Data – Raintree |
| Effective Date: September 12, 2024 | Page 158 of 181 |
| | S-K 1300 Technical Summary Report – Whistler Project, Alaska |
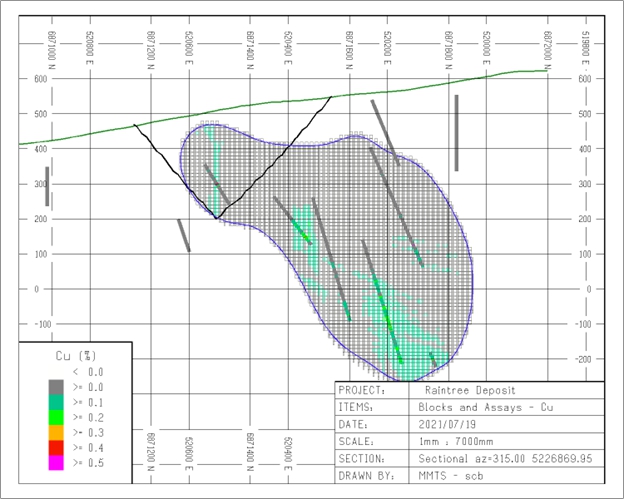
| Figure
11-25 |
Section Looking SW - Comparing
Cu Grades for Block Model and Assay Data – Raintree |
| Effective Date: September 12, 2024 | Page 159 of 181 |
| | S-K 1300 Technical Summary Report – Whistler Project, Alaska |
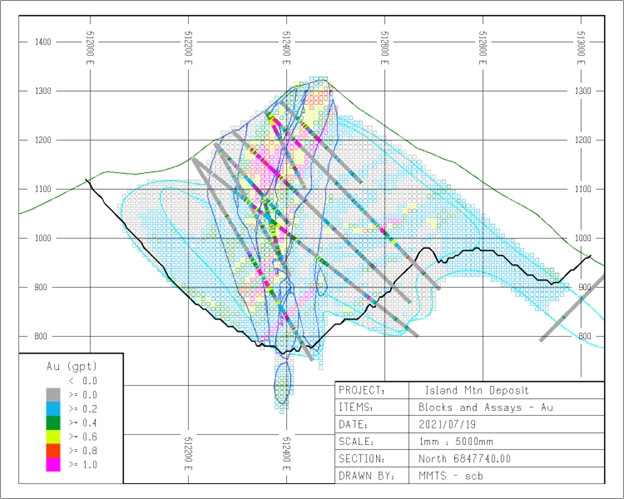
| Figure
11-26 |
E-W Section Comparing Cu
Grades for Block Model and Assay Data – Island Mountain |
| Effective Date: September 12, 2024 | Page 160 of 181 |
| | S-K 1300 Technical Summary Report – Whistler Project, Alaska |
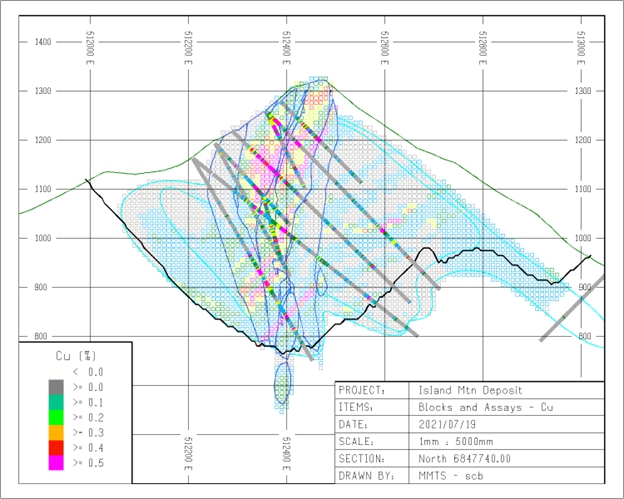
| Figure 11-27 |
E-W Section Comparing Cu Grades for Block Model and Assay
Data – Island Mountain |
| 11.10 |
Reasonable Prospects of Eventual
Economic Extraction |
The
resource confining pit and/or underground shapes defines a boundary for continuous mineralization with suitable grades and with a reasonable
expectation that an engineered plan will produce an economic plan. The net smelter return calculation for both the open pit and underground
resources as well as the metallurgical recoveries are summarized in Table 11-22.
Lerchs-Grossman
pits were run for each deposit using the following parameters:
| |
● |
Pit
slopes of 50 degrees; |
| |
|
|
| |
● |
Mining
costs of US$2.25/t for both mineralized material and; and |
| |
|
|
| |
● |
Processing,
general and administrative costs of US$7.90/t. The cut-off grade for the open pits is considered to be US$10.00/tonne which more than
covers the Processing + G&A costs. The base case cutoff for the underground portion of the resource is US$25.00/tonne which includes
Process + G&A + Underground mining costs. |
| Effective Date: September 12, 2024 | Page 161 of 181 |
| | S-K 1300 Technical Summary Report – Whistler Project, Alaska |
The
lower portion of the Raintree West deposit has been constrained by a mineable shape within a “reasonable prospects of economic
extraction” using a US$25.00/t cut-off, assuming the same processing costs as for the open pit, and a bulk mining scenario. Material
within a cohesive shape above this cut-off has been included in the Raintree underground resource estimate. Metal prices are based on
the 3-year trailing average (Kitco, 2021) and are consistent with those seen to be used throughout the industry.
| Table 11-22 |
Economic Inputs and Metallurgical Recoveries |
| Parameter |
Value |
Units |
| Gold
Price |
$1,850.00 |
US$/Oz |
| Cu
Price |
$4.00 |
US$/lbs |
| Silver
Price |
$23.00 |
US$/Oz |
| Gold
Payable |
95.0% |
% |
| Cu
payable |
96.5% |
% |
| Silver
Payable |
95.0% |
% |
| Gold
Refining |
8.00 |
US$/oz |
| Cu
Refining + PP |
0.05 |
US$/lb |
| Silver
Refining |
0.60 |
US$/oz |
| Gold
Offsites |
77.50 |
US$/WMT |
| Cu
Offsite |
55.00 |
US$/WMT |
| Silver
Offsites |
3.50 |
US$/WMT |
| Royalty
|
3.00% |
% |
| |
|
|
| Net
Smelter Gold Price |
54.646 |
US$/g |
| Net
Smelter Cu |
3.702 |
US$/lb |
| Net
Smelter Silver Price |
0.664 |
US$/g |
| |
|
|
| Gold
Process Recovery |
70% |
% |
| Cu
Process Recovery |
83% |
% |
| Silver
Process recovery |
65% |
% |
*Indicated
and Inferred resources are used for pit optimization.
The
pit delineated resource is given in Table 11-2 through Table 11-4 for each deposit and for a range of NSR cut-offs with the base case
cut-off of US$10.00/tonne highlighted. Process recoveries, as well as mining, processing and offsite costs have been applied in order
to determine that the pit resource has a reasonable prospect of economic extraction. The US$10.00/tonne cut-off (an Au Equivalent grade
of approximately 0.27 gpt at the base case prices) yields an Indicated resource of 294.5 Mt at 0.42 gpt gold, 0.16% copper and 2.0 gpt
silver (0.68 gpt AuEq) for 6.48 Moz AuEqv and an Inferred resource of 198.0 Mt at 0.52 gpt gold, 0.07% copper and 1.81 gpt silver (0.65gpt
AuEq) for a total of 4.16 Moz AuEqv metal.
| 11.11 |
Statement on Prospect of
Economic Extraction |
The
QP is of the opinion that all relevant technical and economic factors likely to influence the prospect of economic extraction can be
resolved with further work.
| Effective Date: September 12, 2024 | Page 162 of 181 |
| | S-K 1300 Technical Summary Report – Whistler Project, Alaska |
| 11.12 |
Factors That May Affect the
Mineral Resource Estimate |
Areas
of uncertainty that may materially impact the Mineral Resource estimate include:
| |
● |
Commodity
price assumptions |
| |
|
|
| |
● | Metal
recovery assumptions |
| |
|
|
| |
● | Mining
and processing cost assumptions |
There
are no other known factors or issues known to the QP that materially affect the estimate other than normal risks faced by mining projects
in the province in terms of environmental, permitting, taxation, socio-economic, marketing, and political factors.
A
description of potential risk factors is given in Table 11-23 along with either the justification for the approach taken or mitigating
factors in place to reduce any risk.
| Table 11-23 |
List of Risks and Mitigations/Justifications |
| # |
Description |
Justification/Mitigation |
| 1 |
Classification
Criteria |
Classification
based on the Range of the Variogram and therefore the variability of the mineralization within each deposit. |
| 2 |
Gold
and silver Price Assumptions |
Based
on three-year trailing average (CIBC, 2024) |
| 3 |
Capping |
CPP,
swath plots and grade-tonnage curves show model validates well with composite data throughout the grade distribution. |
| 4 |
Processing
and Mining Costs |
Based
on comparable projects in Alaska. |
| Effective Date: September 12, 2024 | Page 163 of 181 |
| | S-K 1300 Technical Summary Report – Whistler Project, Alaska |
| 12 |
MINERAL RESERVE ESTIMATES |
There
are no reserve estimates currently.
Open
pit and underground mining methods are being considered for the project, though no details have been developed at this time.
| 14 |
PROCESS AND RECOVERY METHODS |
Not
applicable to the resource statement.
Preliminary
infrastructure is discussed in Section 4, while detailed infrastructure has not been determined at this time.
No
concentrate market studies have been done at this time.
| Effective Date: September 12, 2024 | Page 164 of 181 |
| | S-K 1300 Technical Summary Report – Whistler Project, Alaska |
| 17 |
ENVIRONMENTAL STUDIES, PERMITTING
AND PLANS, NEGOTIATIONS, OR AREEMENTS WITH LOCAL INDIVIDUALS OR GROUPS |
U.S.
GoldMining submitted an Application for Permit to Mine in Alaska (APMA) to Alaska’s Department of Natural Resources (ADNR) on 30
June 2022. On 22 September 2022, the Alaska Department Natural Resources, Division of Mining, Land and Water, approved Multi-Year 2022-2026
Exploration and Reclamation Permit Number 2778 for Hardrock Exploration – Skwentna River - Yentna Mining District, and in addition
also approved Reclamation Plan Approval Number 2778. Subsequent amendments were approved incorporating alterations to U.S. GoldMining’s
exploration plans in 2023 and 2024.
U.S.
GoldMining commenced environmental studies in August 2022, comprising an aquatics survey completed by Owl Ridge Natural Resource Consultants
Inc (Owl Ridge). The aquatics survey is summarized in a report compiled by Owl Ridge (Owl Ridge, 2024), in addition to subsequent work
completed during 2023 including surface water quality sampling, additional terrestrial wildlife resources acid rock drainage and leachate
potential studies, and heritage resources studies. Subsequent work completed in 2024 to date has included water quality sampling, eagle
nest mapping, and on ground archaeological surveying.
U.S.
GoldMining Inc. has developed a Stakeholder Engagement Plan (Parkan, 2023) which provides a comprehensive roadmap to engaging with community
and native organizations, regulators and legislators, and special interest groups, to ensure broad consultation with regards to current
and future activities at the Whistler Project. Currently U.S .GoldMining does not have any ongoing negotiations or agreements signed
with respect to stakeholders.
| Effective Date: September 12, 2024 | Page 165 of 181 |
| | S-K 1300 Technical Summary Report – Whistler Project, Alaska |
| 18 |
CAPITAL AND OPERATING COSTS |
Capital
and operating costs have not been developed in detail at this time.
Economic
analysis has not been completed at this time.
The
Estelle Gold Project owned by Nova Minerals Limited of Australia is currently in exploration phase and shares the Whiskey Bravo runway.
| 21 |
OTHER RELEVANT DATA AND INFORMATION |
There
is no additional relevant data and information for the Whistler, Raintree West, and Island Mountain deposits.
| Effective Date: September 12, 2024 | Page 166 of 181 |
| | S-K 1300 Technical Summary Report – Whistler Project, Alaska |
| 22 |
INTERPRETATION AND CONCLUSIONS |
| 22.1 |
Sampling, Preparation, Analysis |
The
procedures documented by Kennecott, Geoinformatics and Kiska and U.S. GoldMining for sampling, analysis and security are deemed adequate.
Analysis of the QAQC samples indicates the laboratory results are of sufficient quality for resource estimation.
The
amount of data fully supported by certificate and QAQC is 92% in Whistler, 100% in Raintree and 100% in Island Mountain, which is typical
or better than similar projects with most of the drilling completed before 2010. Inconsistencies detected during validation of the assay
database are minimal. Measurements made during the site visit and previous reports indicate a collar survey is to be considered.
| 22.3 |
Metallurgical Testwork |
The
recoveries used for Resource estimate are reasonable for this level of study based on the metallurgical testing to date.
In
the opinion of the QP the block model resource estimate and resource classification reported herein are a reasonable representation of
the global gold, copper and silver mineral resources found in the Whistler, Raintree West, and Island Mountain deposits. Mineral resources
are not mineral reserves and do not have demonstrated economic viability. There is no certainty that all or any part of the mineral resource
will be converted into mineral reserve.
| 22.5 |
Risks and Opportunities |
| 22.5.1 |
Sampling, Preparation, Analysis
and Data Risks and Opportunities |
U.S.
GoldMining could add QAQC data for silver and to collect and complete the missing certificate numbers in the database. This information
would more completely support the assay database.
The
drill core is stored in wood boxes subject to weathering on site, they are beginning to fall apart. An opportunity exists to protect
these samples from further weathering by moving them or building dry storage. The risk of continued decay is that the historic core may
no longer be available to future potential owners for review and verification.
| 22.5.2 |
Metallurgical Testwork Risks
and Opportunities |
Analyses
and accounting of Ag were omitted from the metallurgical testwork, which focused on Cu and Au grades and recoveries in what was anticipated
initially to be a Cu-Au resource. Future testwork which includes Ag accounting would likely result in improved estimates of silver recovery
and revenue contribution.
| 22.5.3 |
Resource Estimate Risks and
Opportunities |
Risk
in the geologic interpretations relating to the continuity of the mineralization exist and can be mitigated by additional geologic modelling
for use in controlling the block model interpolations. A description of additional potential risk factors concerning the resource estimate
is given in Table 11-23 along with either the justification for the approach taken or mitigating factors in place to reduce any risk.
Opportunities to increase the confidence in the resource through infill drilling and to expand the resource from step-out and exploration
drilling are discussed in the recommendations section below.
| Effective Date: September 12, 2024 | Page 167 of 181 |
| | S-K 1300 Technical Summary Report – Whistler Project, Alaska |
| 23.1 |
Sample Preparation, Analyses
and Security |
To
ensure and further improve data quality, MMTS recommends that:
| |
● |
Three suitable CRMs that
are made of porphyry copper material and represent expected low, medium, high mineralization grades for Au, Cu, and Ag be sourced and
included in any future drilling. None of the CRMs used before 2023 were certified for silver. |
| |
|
|
| |
● |
Future drilling should continue
using coarse/crush blank material (quartz or limestone) |
| |
|
|
| |
● |
Individual failed samples
need to be identified in a timely manner and the neighboring primary assays samples be re-assayed if warranted. If this was indeed
done in the past, the database has not been correctly maintained as the provided re-assay certificates do not cover all failures. The
number of failures does not appear to be of material significance currently. Future programs should adhere to standardized control
procedures. |
For
further data verification it is recommended that:
| |
● |
At least 10% of collar locations
in each resource area, to include drilling from all years, be surveyed with GPS equipment with <1m accuracy. If significant deviations
are determined from the recorded values, all collars would need resurvey. |
| |
|
|
| |
● |
Future drilling should include
third party check-assays and the data should be appropriately maintained. |
| |
|
|
| |
● |
Further attempts should be
made to identify 2004-2009 field duplicate and coarse duplicate distinctions from respective reports or internal documents and update
the assay database accordingly. |
Metallurgical
recommendations include:
| |
● |
Mineralogical studies to
better understand the gold associations |
| |
|
|
| |
● |
Comminution testing specifically
to address SAG mill power requirements and design |
| |
|
|
| |
● |
Variability testing |
| |
|
|
| |
● |
Confirmatory locked cycle
flotation testing at the coarser primary grind size |
| |
|
|
| |
● |
Testwork to include feed
material containing Pb, Zn sulphide, and higher Ag grade material |
| 23.4 |
Exploration and Resource |
At
the Whistler Deposit, recommendations include:
| |
● |
Ongoing development of the
geologic model to provide a better understanding of how the three stages of intrusion relate to the mineralization geometry and continuity.
This would involve utilizing the 2023 and 2024 drill logging, plus selective re-logging of historic core, with the current knowledge
of the multi-element assay values and hyperspectral data. Solids modelling of each intrusive phase and alteration facies could be constructed
from this interpretation. |
| |
|
|
| |
● |
A better understanding of
the current known faults could be an opportunity for increasing the resource at Whistler, especially in the northern section of the
deposit where the Rover Fault system dissects and complicates the geometry of lithological contacts, alteration and mineralization
facies. |
| |
|
|
| |
● |
Additional deep drilling
to investigate the potential for the High-Grade Core, or other potential zones of high-grade mineralization, to extend to depth. Noting
that the Raintree Underground Resource lies at a deeper vertical horizon compared with the Whistler deposit, there is potential for
Whistler mineralization to extend well beyond the base of the currently estimated open pit mineral resource. |
For
the Raintree Deposit, the following recommendations are made:
| |
● |
Infill and step-out drilling
to the north and south of the current deposit to potentially upgrade the classification of the current resource estimate and to potentially
increase the resource. Specifically shallow holes (200 to 250 m) dipping east on sections 6,871,350 N and 6,871,400 N and 6,871,500
N should be drilled to increase the confidence in near surface mineralization. |
| |
|
|
| |
● |
In concert with the new drilling,
the previous drill core should be relogged and a robust geological model/domains should be constructed for future resource estimates. |
| |
|
|
| |
● |
Further specific gravity
measurements should be collected from current and future drillholes. |
| |
|
|
| |
● |
Metallurgical testing should
be conducted on Raintree West samples. |
For
the Island Mountain deposit, the following recommendations are made:
| |
● |
Infill and step-out drilling
to the north and south of the deposit. This drilling should be done to potentially upgrade the classification of the current resource
estimate and to potentially increase the resource. Drilling should aim to link the mineralized breccias drilled north of the resource
area, with the main breccia complex. Deep drilling under the breccia complex is also warranted to potentially locate the causative,
and potentially mineralized, intrusive driving the brecciation. |
| 23.4.4 |
Exploration Program and Budget |
The
recommended exploration program is divided into two streams: 1. Known deposit expansion and delineation, and; 2. Exploration for discovery
of new porphyry deposits.
1.
Known deposit expansion and delineation – Whistler, Raintree and Island Mountain – up to 10,000 meters core drilling
to test the wingspan expansion of the existing deposits and upgrade resource classification.
| |
● |
Follow-up drilling of the
Whistler deposit (~5000 meters) should target lateral and depth expansion opportunities to grow the mineral resource estimate
(MRE), especially within the existing MRE constraining pit shell where waste can potentially be converted to mineralization with additional
drilling. |
| |
|
|
| |
● |
Grid drilling program and
step out drilling at Raintree (2,500 m). Any significant mineralized intercepts from this phase of step-out drilling should
be sent for metallurgical testing with particular focus on the impact of the relatively high lead-zinc concentrations. |
| |
|
|
| |
● |
Approximately 2,500 m of
diamond drilling to in-fill and expand mineralization at the Breccia Zone at Island Mountain. Mineralization is open to south
and north, and undrilled breccia bodies occur for 700 m to the north of the Breccia Zone. |
| 2. |
Exploration for discovery
of new porphyry deposits. |
| |
● |
Focussed on the Whistler
Orbit and Island Mountain areas which represent classic ‘porphyry clusters’. |
| |
|
|
| |
● |
Review of previous soil/till
geochemical sampling coupled with surficial geological mapping, and further surface mapping and sampling, plus “top-of-bedrock”
relogging and resampling of existing core holes in the Whistler Orbit area, and potentially additional top of bedrock grid drilling
program in the Whistler Orbit area. The grid drilling program would penetrate the glacial cover and drill approximately 25m into bedrock
to obtain geological and geochemical data. Drilling on 200 metre centres from fifty holes (1,250 m) would cover the most prospective
areas in the Whistler area. |
| |
● |
This data, in conjunction
with the existing airborne magnetic data and 3D IP data, would considerably enhance exploration targeting for deeper drill testing
of high priority targets: 2500 meters at Whistler and 2500 meters at Island Mountain. |
| |
|
|
| |
● |
Compilation work to rank
and prioritize other exploration targets on the project area (Muddy Creek, Snow Ridge, Puntilla, Round Mountain, Howell Zone, Super
Conductor), with the aim to test one or more of these targets with drilling (1,500 m). |
| 23.4.5 |
Initial Mining Assessment
/ Preliminary Economic Assessment (PEA) |
The
MRE should be combined with benchmarked mining costs and other assumptions to develop an Initial Assessment / PEA to test the potential
to develop an economic mining opportunity at the Whistler Project. Initial Assessment / PEA should test options for mine design and throughput,
ore processing and waste/tailings storage, include trade-off studies for power generation/transmission and access road costs, and ultimately
optimize capital and operating costs to develop a positive economic base case and support investment into future mine feasibility studies.
| Effective Date: September 12, 2024 | Page 168 of 181 |
| | S-K 1300 Technical Summary Report – Whistler Project, Alaska |
Baseline
surveys and stakeholder consultation should ramp up in support of eventual mine permitting.
Table
23-1 shows the proposed exploration budget.
| Table 23-1 |
Proposed Exploration Budget |
| Work
Program |
Quantum |
Units |
Rate* |
Sub-total
CDN $ |
| Phase
1: Known Deposits Wingspan Expansion and Infill to Upgrade Resource Classification |
| Core
Drilling Whistler |
5,000 |
m |
$1,000 |
$5,000,000 |
| Core
Drilling Raintree |
2,500 |
m |
$1,000 |
$2,500,000 |
| Core
Drilling Island Mountain |
2,500 |
m |
$1,000 |
$2,500,000 |
| Metallurgical
Testwork |
|
|
|
$200,000 |
| Modelling
and Reporting - PEA |
|
|
|
$250,000 |
| |
Sub-total
Phase 1 |
|
All
inclusive |
$10,450,000 |
| Phase
2: Exploration for discovery of new porphyry deposits |
| Wages
- Geologists & Database |
|
|
|
$250,000 |
| Grid
Top of Bedrock Drilling (RC or Auger) |
1,250 |
m |
$250 |
$312,500 |
| Wages
- Mappers and Samplers |
|
|
|
$100,000 |
| Rock
and Soil Assays |
500 |
samples |
$100 |
$50,000 |
| New
target drilling - Whistler Orbit Area |
2,500 |
m |
$1,000 |
$2,500,000 |
| New
target drilling - Island Mountain Area |
2,500 |
m |
$1,000 |
$2,500,000 |
| New
target drilling - Other Targets |
1,500 |
m |
$1,000 |
$1,500,000 |
| |
Sub-total
Phase 2 |
|
|
$7,212,500 |
| Sub-Total
Phases 1 + 2 |
|
|
|
$17,662,500 |
| Management,
Planning and Supervision Wages |
|
|
|
$500,000 |
| Contingency |
|
|
10% |
$1,766,250 |
| TOTAL |
|
|
|
$19,928,750 |
*all-in
cost includes mobilization/demobilization, drilling, assays, helicopter-support, camp costs, wages and G&A
| Effective Date: September 12, 2024 | Page 169 of 181 |
| | S-K 1300 Technical Summary Report – Whistler Project, Alaska |
AMC
Mining Consultants (Canada) Ltd., 2012 712024 Kiska Letter Report Resource Update 4Dec 2012
Bank
of Montreal, 2021a, February. Market Research on Gold Price Forecast used for Resources and Reserves.
Bank
of Montreal, 2021b, May. Street Consensus Silver and Copper Prices.
Beikman,
H., 1980, Compiler. Geology of Alaska. Digital geology data obtained from the Alaska Geospatial Data Clearinghouse and modified using
MapInfo Professional. (http://agdc.usgs.gov/data/usgs/geology/).
Bird,
2022. S-K 1300 Technical Report Summary Initial Assessment for the Whistler Project. Submitted to U.S. GoldMining Inc. Effective Date
22 September 2023, Revised Date of Issue 16 December 2022. 183 Pages.
CIBC,
2024. Analyst Consensus Commodity Prices
Couture,
JF. 2007. Independent Technical Report on the Whistler Copper-Gold Exploration Project. SRK Consulting (Canada) Inc. 92 pages. Available
at www.sedar.com.
Franklin,
R. 2007. Whistler Project Synopsis. Kennecott Exploration Company, unpublished internal report, 52 pages.
Franklin,
R., Young, L., and Boyer, L. 2006. Whistler Project – 2005 Exploration Summary Report. Kennecott Exploration Company, unpublished
internal report, 180 pages.
Franklin,
R. 2005. Whistler Project – 2004 Exploration Summary Report. Kennecott Exploration Company, unpublished internal report, 29 pages.
Giroux,
G.H., 2016. NI43-101 Resource Estimate for the Whistler project, effective date 24 March 2016, Amended date: May 30, 2016
Geoinformatics
News Release dated February 12, 2005 and announcing revisions to an Exploration Alliance with Kennecott.
Geoinformatics
News Release dated June 7, 2007 and announcing the signature of an agreement with Kennecott concerning the acquisition of the Whistler
Project in Alaska.
Gross
T. G. 2014. Controls and distribution of Cu-Au- mineralization that developed the Island Mountain Deposit, Whistler Property, South-Central
Alaska, Colorado School of Mine, Master’s Thesis, 157 pages.
Hames,
B. P. 2014. Evolution of the Late-Cretaceous Whistler Au-(Cu) Corridor and magmatic-hydrothermal system, Kahiltna Terrane, Southwestern
Alaska, USA, University of British Columbia Master’s Thesis, 249 pages.
Kiska
2011, 2011 Geological, Geochemical, Geophysical and Diamond Drilling Report on the Whistler Regional Area, Whistler Property, Alaska,
Internal Report, 77 pages.
Kitco,
2021. Historical Au and Ag charts, www.kitco.com.
Layer,
P., and Drake, J., 2005, 40Ar/39Ar step heat analysis of Kennecott samples: Geochronology Laboratory, University of Alaska, Fairbanks.
MMTS
2011, “Resource Estimate Update for the Whistler Gold Copper Deposit and Results of Property wide Exploration”, March 17,
2011, 136 pages.
MMTS
2015, “NI 43-101 Resource Estimate for the Whistler Project”, November 12, 2015, 185 pages.
| Effective Date: September 12, 2024 | Page 170 of 181 |
| | S-K 1300 Technical Summary Report – Whistler Project, Alaska |
MMTS
2021, “NI 43-101 Resource Estimate for the Whistler Project”, June 11, 2021, 190 pages.
Nadasdy,
G.S., 2005. Results of Preliminary Metallurgical Test Work Conducted on Three Ore Samples from the Copper and Gold Bearing Whistler Project.
Dawson Metallurgical Laboratories Inc. report to Rio Tinto Technical Services, dated March 24, 2005, 76 pages.
novaminerals.com.au/estelle-gold/,
2021
Owl
Ridge, 2024. Whistler Baseline Environmental Studies, 2022 -2023 Summary Report. Prepared for U.S. GoldMining Inc., February 2024.
Parkan,
K. 2023 Whistler Stakeholder Engagement Plan, August 2023 V.2. Prepared for U.S. GoldMining Inc., by Owl Ridge Natural Resource Consultants.
Proffett,
J. 2005. Report on work done on the Whistler Project, including Island Mountain and Round Mountain, unpublished report submitted to Kennecott
Exploration Company, 11 pages.
Roberts,
M., 2009. 2009-2010 Geological, geochemical, geophysical and diamond drilling report on the Whistler Property, Alaska. Kiska Metals Corporation
internal report 140 pages.
Roberts,
M., 2011a. 2011 Geological, geochemical, geophysical and diamond drilling report on the Whistler Property, Alaska: The Whistler Corridor.
Kiska Metals Corporation internal report, 209 pages.
Roberts,
M., 2011b. 2011 Geological, geochemical, geophysical and diamond drilling report on the Whistler Property, Alaska: Island Mountain prospect.
Kiska Metals Corporation internal report, 152 pages.
Roberts,
M., 2011c. 2011 Geological, geochemical, geophysical and diamond drilling report on the Whistler Property, Alaska: Muddy Creek prospect.
Kiska Metals Corporation internal report, 101 pages.
Rowins,
S.M. 2000. Reduced porphyry copper-gold deposits: A new variation on an old theme. Geology, v. 28, p. 491-494.
Seedorf,
E., Dilles, J.D., Proffett, J.M., Jr., Einaudi, M.T., Zurcher, L., Stavast, W.J.A., Johnson, D.A., and Barton, M.D., 2005, Porphyry Deposits:
Characteristics and Origin of Hypogene Features, in Hedenquist, J.W., Thompson, J.F.H., Goldfarb, R.J., and Richards, J.R., eds., Economic
Geology 100th Anniversary Volume: Society of Economic Geologists, Littleton, Colorado, p. 251-298.
Sillitoe,
R.H., 2010. Porphyry Copper System, Economic Geology, v 105, no 1, p 3-41.
SRK
2007, “Technical Report on the Whistler Copper-Gold Exploration Project, Alaska Range, Alaska”.
SRK
2008, “Mineral Resource Estimation Whistler Copper-Gold Project, Alaska Range, Alaska”.
Stoel
Rives, LLP dated January 11, 2021 and titled: Net Smelter Return Royalty Agreement
Stoel
Rives, LLP dated December 6, 2023, and titled: Limited Title Review for Alaska State Mining Claims.
U.S.
Securities and Exchange Commission, 2020. S-K 1300 229.1300. Modernization of Property Disclosure for Mining Registrants.
Young,
L. 2006. Geological Framework of the Whistler Region, Alaska, 2003-2005. Kennecott Exploration Company, unpublished internal report,
181 pages.
Young,
L. 2005. Geological Setting of the Whistler Porphyry Copper Prospect, Alaska. Kennecott Exploration Company, unpublished internal report,
88 pages.
Wilson,
P. 2007. 2007 Whistler Drilling QA/QC Results. Geoinformatics Exploration Inc. unpublished internal report, 19 pages.
| Effective Date: September 12, 2024 | Page 171 of 181 |
| | S-K 1300 Technical Summary Report – Whistler Project, Alaska |
| 25 | RELIANCE
ON INFORMATION PROVIDED BY THE REGISTRANT |
The
QP authors of this Report state that they are qualified persons for those areas as identified in the “Certificate of Qualified
Person” for each QP, as included in this Report. The QPs have relied, and believe there is a reasonable basis for this reliance,
upon the following other expert reports, which provided information regarding mineral rights, surface rights, and environmental status
in sections of this Report as noted below.
| 25.1 | Mineral
Tenure and Surface Rights |
The
QPs have not reviewed the mineral tenure, nor independently verified the legal status, ownership of the Project area or underlying property
agreements. The QPs have fully relied upon, and disclaim responsibility for, information supplied by U.S. GoldMining, through its parent,
GoldMining, experts and experts retained by GoldMining for this information through the following documents:
| ● | Letter
from Stoel Rives, LLP dated December 6, 2023, and titled: Limited Title Review for Alaska
State Mining Claims. |
This
title information is used in Section 3.0 and 3.1 of the Report.
| 25.2 | Royalties
and Incumbrances |
The
QPs have not reviewed the royalty agreements nor independently verified the legal status of the royalties and other potential incumbrances.
The QPs have fully relied upon, and disclaim responsibility for, information supplied by U.S. GoldMining, for this information through
the following documents. This information was provided as a series of documents from U.S. GoldMining:
| ● | Funding
Agreement and Net Smelter Returns Royalty Agreement dated January 11, 2021; |
| ● | Notice
confirming Osisko Mining (USA) Inc. Is the royalty holder; |
| ● | Notice
of Address Change & Assignment of Buyback Right - Osisko Mining (USA) Inc.; and, |
| ● | Royalty
Holder Notice to U.S. GoldMining (Whistler Royalty), Nevada Select Royalty Inc. |
This
title information is used in Section 3.1 of the Report.
| Effective Date: September 12, 2024 | Page 172 of 181 |
| | S-K 1300 Technical Summary Report – Whistler Project, Alaska |
| 26 | DATE
AND SIGNATURE PAGE |
This
report, entitled “S-K 1300 Technical Report Summary iNITIAL aSSESSMENT for THE Whistler
Project” has the following report dates:
| Report
Date is: |
|
7
October 2024 |
| |
|
|
| Mineral
Resource Effective Date is: |
|
12
September 2024 |
The
report was prepared and signed by the author as shown in the following QP certificate:
| Effective Date: September 12, 2024 | Page 173 of 181 |
| | S-K 1300 Technical Summary Report – Whistler Project, Alaska |
CERTIFICATE
OF QUALIFIED PERSON – SUE BIRD
I,
Sue Bird, P.Eng., am employed as a Geological Engineer with Moose Mountain Technical Services, with an office address of #210 1510 2nd
Street North Cranbrook, BC V1C 3L2. This certificate applies to the technical report titled “S-K 1300 Technical Report Summary
iNITIAL aSSESSMENT for THE Whistler Project” that has an effective date of September
12, 2024 (the “technical report”).
| ● | I
am a member of the self-regulating Association of Professional Engineers and Geoscientists
of British Columbia (#25007). I graduated with a Geologic Engineering degree (B.Sc.) from
the Queen’s University in 1989 and a M.Sc. in Mining from Queen’s University
in 1993. |
| ● | I
have worked as an engineering geologist for over 25 years since my graduation from university.
I have worked on precious metals, base metals and coal mining projects, including mine operations
and evaluations. Similar resource estimate projects specifically include those done for Artemis’
Blackwater gold project, Ascot’s Premier Gold Project, Spanish Mountain Gold, all in
BC; O3’s Marban and Garrison, gold projects in Quebec and Ontario, respectively, as
well as numerous due diligence gold projects in the southern US done confidentially for various
clients. |
| ● | I
have read the definition of “qualified person” set out in subpart 1300 of regulation
S-K ( S-K 1300) and as a result of my experience, professional association and qualifications,
I fulfill the requirements of a Qualified Person as set out in this form. |
| ● | I
visited the property on September 14, 2022 and again on August 6, 2024. |
| ● | I
am responsible for all Sections of the technical report. |
| ● | I
am independent of GoldMining Inc. and U.S. GoldMining Inc. |
| ● | I
have previously prepared NI43-101 resource estimates for the Whistler Deposit for Kiska Metals
Corporation in March, 2011 which was re-issued by Brazil Resources Inc. (now GoldMining Inc.)
in May 2016 and another NI 43-101 report completed for GoldMining Inc. with effective date
June 11, 2021 (MMTS, 2021) and a previous S-K 1300 report with an effective date of September
22, 2022. |
| ● | I
have read S-K 1300 and the sections of the technical report for which I am responsible have
been prepared in compliance with that Form. |
As
of the effective date of the technical report, to the best of my knowledge, information and belief, the sections of the technical report
for which I am responsible contain all scientific and technical information that is required to be disclosed to make the technical report
not misleading.
| Dated:
7 October 2024 |
|
| |
|
| “Signed
and Sealed” |
|
| |
|
| |
|
| Signature
of Qualified Person |
|
| Sue
Bird, P.Eng. |
|
| Effective Date: September 12, 2024 | Page 174 of 181 |
| | S-K 1300 Technical Summary Report – Whistler Project, Alaska |
APPENDIX
A: CLAIMS LIST
[MTRS
= Meridian, Township, Range, Section; Q = ¼ Section; Q-Q = ¼ ¼ Section]
| No. |
|
ADL
Serial Number |
|
Claim
Name |
|
Claim
Owner |
|
MTRS
Q or Q-Q |
| 1 |
|
633446 |
|
PORT
2151* |
|
U.S.
GoldMining Inc. |
|
S
22N 18W Sec. 30 NE4NW4 |
| 2 |
|
633447 |
|
PORT
2152* |
|
U.S.
GoldMining Inc. |
|
S
22N 18W Sec. 30 NW4NE4 |
| 3 |
|
633448 |
|
PORT
2153* |
|
U.S.
GoldMining Inc. |
|
S
22N 18W Sec. 30 NE4NE4 |
| 4 |
|
633449 |
|
PORT
2251* |
|
U.S.
GoldMining Inc. |
|
S
22N 18W Sec. 19 SE4SW4 |
| 5 |
|
633450 |
|
PORT
2252* |
|
U.S.
GoldMining Inc. |
|
S
22N 18W Sec. 19 SW4SE4 |
| 6 |
|
633451 |
|
PORT
2253* |
|
U.S.
GoldMining Inc. |
|
S
22N 18W Sec. 19 SE4SE4 |
| 7 |
|
633452 |
|
PORT
2351* |
|
U.S.
GoldMining Inc. |
|
S
22N 18W Sec. 19 NE4SW4 |
| 8 |
|
633453 |
|
PORT
2352* |
|
U.S.
GoldMining Inc. |
|
S
22N 18W Sec. 19 NW4SE4 |
| 9 |
|
633454 |
|
PORT
2353* |
|
U.S.
GoldMining Inc. |
|
S
22N 18W Sec. 19 NE4SE4 |
| 10 |
|
633455 |
|
PORT
2354* |
|
U.S.
GoldMining Inc. |
|
S
22N 18W Sec. 20 NW4SW4 |
| 11 |
|
633456 |
|
PORT
2355* |
|
U.S.
GoldMining Inc. |
|
S
22N 18W Sec. 20 NE4SW4 |
| 12 |
|
633457 |
|
PORT
2454* |
|
U.S.
GoldMining Inc. |
|
S
22N 18W Sec. 20 SW4NW4 |
| 13 |
|
633458 |
|
PORT
2455* |
|
U.S.
GoldMining Inc. |
|
S
22N 18W Sec. 20 SE4NW4 |
| 14 |
|
633459 |
|
PORT
2456* |
|
U.S.
GoldMining Inc. |
|
S
22N 18W Sec. 20 SW4NE4 |
| 15 |
|
633460 |
|
PORT
2457* |
|
U.S.
GoldMining Inc. |
|
S
22N 18W Sec. 20 SE4NE4 |
| 16 |
|
633461 |
|
PORT
2458* |
|
U.S.
GoldMining Inc. |
|
S
22N 18W Sec. 21 SW4NW4 |
| 17 |
|
633462 |
|
PORT
2459* |
|
U.S.
GoldMining Inc. |
|
S
22N 18W Sec. 21 SE4NW4 |
| 18 |
|
633463 |
|
PORT
2555* |
|
U.S.
GoldMining Inc. |
|
S
22N 18W Sec. 20 NE4NW4 |
| 19 |
|
633464 |
|
PORT
2556* |
|
U.S.
GoldMining Inc. |
|
S
22N 18W Sec. 20 NW4NE4 |
| 20 |
|
633465 |
|
PORT
2557* |
|
U.S.
GoldMining Inc. |
|
S
22N 18W Sec. 20 NE4NE4 |
| 21 |
|
633466 |
|
PORT
2558* |
|
U.S.
GoldMining Inc. |
|
S
22N 18W Sec. 21 NW4NW4 |
| 22 |
|
633467 |
|
PORT
2559* |
|
U.S.
GoldMining Inc. |
|
S
22N 18W Sec. 21 NE4NW4 |
| 23 |
|
633468 |
|
PORT
2655* |
|
U.S.
GoldMining Inc. |
|
S
22N 18W Sec. 17 SE4SW4 |
| 24 |
|
633469 |
|
PORT
2656* |
|
U.S.
GoldMining Inc. |
|
S
22N 18W Sec. 17 SW4SE4 |
| 25 |
|
633470 |
|
PORT
2657* |
|
U.S.
GoldMining Inc. |
|
S
22N 18W Sec. 17 SE4SE4 |
| 26 |
|
641182 |
|
WHISPER
105* |
|
U.S.
GoldMining Inc. |
|
S
22N 18W Sec. 17 NW4SW4 |
| 27 |
|
641183 |
|
WHISPER
106* |
|
U.S.
GoldMining Inc. |
|
S
22N 18W Sec. 17 SW4SW4 |
| 28 |
|
641184 |
|
WHISPER
107* |
|
U.S.
GoldMining Inc. |
|
S
22N 18W Sec. 17 NE4SW4 |
| 29 |
|
641185 |
|
WHISPER
108* |
|
U.S.
GoldMining Inc. |
|
S
22N 18W Sec. 17 NW4SE4 |
| 30 |
|
641186 |
|
WHISPER
109* |
|
U.S.
GoldMining Inc. |
|
S
22N 18W Sec. 17 NE4SE4 |
| 31 |
|
641187 |
|
WHISPER
120* |
|
U.S.
GoldMining Inc. |
|
S
22N 18W Sec. 20 NW4NW4 |
| 32 |
|
641188 |
|
WHISPER
127* |
|
U.S.
GoldMining Inc. |
|
S
22N 18W Sec. 19 NW4SW4 |
| 33 |
|
641189 |
|
WHISPER
128* |
|
U.S.
GoldMining Inc. |
|
S
22N 18W Sec. 19 SW4SW4 |
| 34 |
|
641190 |
|
WHISPER
129* |
|
U.S.
GoldMining Inc. |
|
S
22N 18W Sec. 20 SW4SW4 |
| 35 |
|
641191 |
|
WHISPER
130* |
|
U.S.
GoldMining Inc. |
|
S
22N 18W Sec. 20 SE4SW4 |
| 36 |
|
641192 |
|
WHISPER
139* |
|
U.S.
GoldMining Inc. |
|
S
22N 18W Sec. 30 NW4NW4 |
| 37 |
|
641193 |
|
WHISPER
140* |
|
U.S.
GoldMining Inc. |
|
S
22N 18W Sec. 30 SW4NW4 |
| 38 |
|
641194 |
|
WHISPER
141* |
|
U.S.
GoldMining Inc. |
|
S
22N 18W Sec. 30 SE4NW4 |
| 39 |
|
641195 |
|
WHISPER
142* |
|
U.S.
GoldMining Inc. |
|
S
22N 18W Sec. 30 SW4NE4 |
| 40 |
|
641196 |
|
WHISPER
143* |
|
U.S.
GoldMining Inc. |
|
S
22N 18W Sec. 30 SE4NE4 |
| 41 |
|
641197 |
|
WHISPER
1 |
|
U.S.
GoldMining Inc. |
|
S
23N 19W Sec. 23 NW4 |
| 42 |
|
641198 |
|
WHISPER
2 |
|
U.S.
GoldMining Inc. |
|
S
23N 19W Sec. 23 NE4 |
| 43 |
|
641199 |
|
WHISPER
3 |
|
U.S.
GoldMining Inc. |
|
S
23N 19W Sec. 24 NW4 |
| 44 |
|
641201 |
|
WHISPER
9 |
|
U.S.
GoldMining Inc. |
|
S
23N 19W Sec. 23 SW4 |
| 45 |
|
641202 |
|
WHISPER
10 |
|
U.S.
GoldMining Inc. |
|
S
23N 19W Sec. 23 SE4 |
| 46 |
|
641203 |
|
WHISPER
11 |
|
U.S.
GoldMining Inc. |
|
S
23N 19W Sec. 24 SW4 |
| 47 |
|
641204 |
|
WHISPER
12 |
|
U.S.
GoldMining Inc. |
|
S
23N 19W Sec. 24 SE4 |
| 48 |
|
641206 |
|
WHISPER
17 |
|
U.S.
GoldMining Inc. |
|
S
23N 19W Sec. 26 NW4 |
| 49 |
|
641207 |
|
WHISPER
18 |
|
U.S.
GoldMining Inc. |
|
S
23N 19W Sec. 26 NE4 |
| 50 |
|
641208 |
|
WHISPER
19 |
|
U.S.
GoldMining Inc. |
|
S
23N 19W Sec. 25 NW4 |
| 51 |
|
641209 |
|
WHISPER
20 |
|
U.S.
GoldMining Inc. |
|
S
23N 19W Sec. 25 NE4 |
| Effective Date: September 12, 2024 | Page 175 of 181 |
| | S-K 1300 Technical Summary Report – Whistler Project, Alaska |
| No. |
|
ADL
Serial Number |
|
Claim
Name |
|
Claim
Owner |
|
MTRS
Q or Q-Q |
| 52 |
|
641212 |
|
WHISPER
27 |
|
U.S.
GoldMining Inc. |
|
S
23N 19W Sec. 26 SW4 |
| 53 |
|
641213 |
|
WHISPER
28 |
|
U.S.
GoldMining Inc. |
|
S
23N 19W Sec. 26 SE4 |
| 54 |
|
641214 |
|
WHISPER
29 |
|
U.S.
GoldMining Inc. |
|
S
23N 19W Sec. 25 SW4 |
| 55 |
|
641215 |
|
WHISPER
30 |
|
U.S.
GoldMining Inc. |
|
S
23N 19W Sec. 25 SE4 |
| 56 |
|
641218 |
|
WHISPER
37 |
|
U.S.
GoldMining Inc. |
|
S
23N 19W Sec. 35 NW4 |
| 57 |
|
641219 |
|
WHISPER
38 |
|
U.S.
GoldMining Inc. |
|
S
23N 19W Sec. 35 NE4 |
| 58 |
|
641220 |
|
WHISPER
39 |
|
U.S.
GoldMining Inc. |
|
S
23N 19W Sec. 36 NW4 |
| 59 |
|
641221 |
|
WHISPER
40 |
|
U.S.
GoldMining Inc. |
|
S
23N 19W Sec. 36 NE4 |
| 60 |
|
641227 |
|
WHISPER
48 |
|
U.S.
GoldMining Inc. |
|
S
23N 19W Sec. 35 SE4 |
| 61 |
|
641228 |
|
WHISPER
49 |
|
U.S.
GoldMining Inc. |
|
S
23N 19W Sec. 36 SW4 |
| 62 |
|
641229 |
|
WHISPER
50 |
|
U.S.
GoldMining Inc. |
|
S
23N 19W Sec. 36 SE4 |
| 63 |
|
641241 |
|
WHISPER
63 |
|
U.S.
GoldMining Inc. |
|
S
22N 18W Sec. 6 SW4 |
| 64 |
|
641242 |
|
WHISPER
64 |
|
U.S.
GoldMining Inc. |
|
S
22N 18W Sec. 6 SE4 |
| 65 |
|
641247 |
|
WHISPER
69 |
|
U.S.
GoldMining Inc. |
|
S
22N 18W Sec. 7 NW4 |
| 66 |
|
641248 |
|
WHISPER
70 |
|
U.S.
GoldMining Inc. |
|
S
22N 18W Sec. 7 NE4 |
| 67 |
|
641249 |
|
WHISPER
71 |
|
U.S.
GoldMining Inc. |
|
S
22N 18W Sec. 8 NW4 |
| 68 |
|
641250 |
|
WHISPER
72 |
|
U.S.
GoldMining Inc. |
|
S
22N 18W Sec. 8 NE4 |
| 69 |
|
641251 |
|
WHISPER
73 |
|
U.S.
GoldMining Inc. |
|
S
22N 18W Sec. 9 NW4 |
| 70 |
|
641252 |
|
WHISPER
74 |
|
U.S.
GoldMining Inc. |
|
S
22N 18W Sec. 9 NE4 |
| 71 |
|
641257 |
|
WHISPER
79 |
|
U.S.
GoldMining Inc. |
|
S
22N 18W Sec. 7 SW4 |
| 72 |
|
641258 |
|
WHISPER
80 |
|
U.S.
GoldMining Inc. |
|
S
22N 18W Sec. 7 SE4 |
| 73 |
|
641259 |
|
WHISPER
81 |
|
U.S.
GoldMining Inc. |
|
S
22N 18W Sec. 8 SW4 |
| 74 |
|
641260 |
|
WHISPER
82 |
|
U.S.
GoldMining Inc. |
|
S
22N 18W Sec. 8 SE4 |
| 75 |
|
641261 |
|
WHISPER
83 |
|
U.S.
GoldMining Inc. |
|
S
22N 18W Sec. 9 SW4 |
| 76 |
|
641262 |
|
WHISPER
84 |
|
U.S.
GoldMining Inc. |
|
S
22N 18W Sec. 9 SE4 |
| 77 |
|
641263 |
|
WHISPER
85 |
|
U.S.
GoldMining Inc. |
|
S
22N 18W Sec. 10 SW4 |
| 78 |
|
641267 |
|
WHISPER
89 |
|
U.S.
GoldMining Inc. |
|
S
22N 19W Sec. 13 NW4 |
| 79 |
|
641268 |
|
WHISPER
90 |
|
U.S.
GoldMining Inc. |
|
S
22N 19W Sec. 13 NE4 |
| 80 |
|
641269 |
|
WHISPER
91 |
|
U.S.
GoldMining Inc. |
|
S
22N 18W Sec. 18 NW4 |
| 81 |
|
641270 |
|
WHISPER
92 |
|
U.S.
GoldMining Inc. |
|
S
22N 18W Sec. 18 NE4 |
| 82 |
|
641271 |
|
WHISPER
93 |
|
U.S.
GoldMining Inc. |
|
S
22N 18W Sec. 17 NW4 |
| 83 |
|
641272 |
|
WHISPER
94 |
|
U.S.
GoldMining Inc. |
|
S
22N 18W Sec. 17 NE4 |
| 84 |
|
641273 |
|
WHISPER
95 |
|
U.S.
GoldMining Inc. |
|
S
22N 18W Sec. 16 NW4 |
| 85 |
|
641274 |
|
WHISPER
96 |
|
U.S.
GoldMining Inc. |
|
S
22N 18W Sec. 16 NE4 |
| 86 |
|
641275 |
|
WHISPER
181 |
|
U.S.
GoldMining Inc. |
|
S
22N 19W Sec. 12 SE4 |
| 87 |
|
641276 |
|
WHISPER
97 |
|
U.S.
GoldMining Inc. |
|
S
22N 18W Sec. 15 NW4 |
| 88 |
|
641280 |
|
WHISPER
101 |
|
U.S.
GoldMining Inc. |
|
S
22N 19W Sec. 13 SW4 |
| 89 |
|
641281 |
|
WHISPER
102 |
|
U.S.
GoldMining Inc. |
|
S
22N 19W Sec. 13 SE4 |
| 90 |
|
641282 |
|
WHISPER
103 |
|
U.S.
GoldMining Inc. |
|
S
22N 18W Sec. 18 SW4 |
| 91 |
|
641283 |
|
WHISPER
104 |
|
U.S.
GoldMining Inc. |
|
S
22N 18W Sec. 18 SE4 |
| 92 |
|
641284 |
|
WHISPER
110 |
|
U.S.
GoldMining Inc. |
|
S
22N 18W Sec. 16 SW4 |
| 93 |
|
641285 |
|
WHISPER
111 |
|
U.S.
GoldMining Inc. |
|
S
22N 18W Sec. 16 SE4 |
| 94 |
|
641286 |
|
WHISPER
112 |
|
U.S.
GoldMining Inc. |
|
S
22N 18W Sec. 15 SW4 |
| 95 |
|
641287 |
|
WHISPER
113 |
|
U.S.
GoldMining Inc. |
|
S
22N 18W Sec. 15 SE4 |
| 96 |
|
641291 |
|
WHISPER
117 |
|
U.S.
GoldMining Inc. |
|
S
22N 19W Sec. 24 NE4 |
| 97 |
|
641292 |
|
WHISPER
118 |
|
U.S.
GoldMining Inc. |
|
S
22N 18W Sec. 19 NW4 |
| 98 |
|
641293 |
|
WHISPER
119 |
|
U.S.
GoldMining Inc. |
|
S
22N 18W Sec. 19 NE4 |
| 99 |
|
641294 |
|
WHISPER
121 |
|
U.S.
GoldMining Inc. |
|
S
22N 18W Sec. 21 NE4 |
| 100 |
|
641295 |
|
WHISPER
122 |
|
U.S.
GoldMining Inc. |
|
S
22N 18W Sec. 22 NW4 |
| 101 |
|
641296 |
|
WHISPER
123 |
|
U.S.
GoldMining Inc. |
|
S
22N 18W Sec. 22 NE4 |
| 102 |
|
641299 |
|
WHISPER
126 |
|
U.S.
GoldMining Inc. |
|
S
22N 19W Sec. 24 SE4 |
| 103 |
|
641300 |
|
WHISPER
131 |
|
U.S.
GoldMining Inc. |
|
S
22N 18W Sec. 20 SE4 |
| 104 |
|
641301 |
|
WHISPER
132 |
|
U.S.
GoldMining Inc. |
|
S
22N 18W Sec. 21 SW4 |
| Effective Date: September 12, 2024 | Page 176 of 181 |
| | S-K 1300 Technical Summary Report – Whistler Project, Alaska |
| No. |
|
ADL
Serial Number |
|
Claim
Name |
|
Claim
Owner |
|
MTRS
Q or Q-Q |
| 105 |
|
641302 |
|
WHISPER
133 |
|
U.S.
GoldMining Inc. |
|
S
22N 18W Sec. 21 SE4 |
| 106 |
|
641303 |
|
WHISPER
134 |
|
U.S.
GoldMining Inc. |
|
S
22N 18W Sec. 22 SW4 |
| 107 |
|
641304 |
|
WHISPER
135 |
|
U.S.
GoldMining Inc. |
|
S
22N 18W Sec. 22 SE4 |
| 108 |
|
641305 |
|
WHISPER
138 |
|
U.S.
GoldMining Inc. |
|
S
22N 19W Sec. 25 NE4 |
| 109 |
|
641306 |
|
WHISPER
144 |
|
U.S.
GoldMining Inc. |
|
S
22N 18W Sec. 29 NW4 |
| 110 |
|
641307 |
|
WHISPER
145 |
|
U.S.
GoldMining Inc. |
|
S
22N 18W Sec. 29 NE4 |
| 111 |
|
641308 |
|
WHISPER
146 |
|
U.S.
GoldMining Inc. |
|
S
22N 19W Sec. 25 SE4 |
| 112 |
|
641309 |
|
WHISPER
147 |
|
U.S.
GoldMining Inc. |
|
S
22N 18W Sec. 30 SW4 |
| 113 |
|
641310 |
|
WHISPER
148 |
|
U.S.
GoldMining Inc. |
|
S
22N 18W Sec. 30 SE4 |
| 114 |
|
641311 |
|
WHISPER
149 |
|
U.S.
GoldMining Inc. |
|
S
22N 18W Sec. 29 SW4 |
| 115 |
|
641312 |
|
WHISPER
150 |
|
U.S.
GoldMining Inc. |
|
S
22N 18W Sec. 29 SE4 |
| 116 |
|
641313 |
|
WHISPER
151 |
|
U.S.
GoldMining Inc. |
|
S
22N 18W Sec. 28 SW4 |
| 117 |
|
641314 |
|
WHISPER
152 |
|
U.S.
GoldMining Inc. |
|
S
22N 18W Sec. 28 NW4 |
| 118 |
|
641315 |
|
WHISPER
153 |
|
U.S.
GoldMining Inc. |
|
S
22N 18W Sec. 28 SE4 |
| 119 |
|
641316 |
|
WHISPER
154 |
|
U.S.
GoldMining Inc. |
|
S
22N 18W Sec. 28 NE4 |
| 120 |
|
641317 |
|
WHISPER
155 |
|
U.S.
GoldMining Inc. |
|
S
22N 18W Sec. 27 SW4 |
| 121 |
|
641318 |
|
WHISPER
156 |
|
U.S.
GoldMining Inc. |
|
S
22N 18W Sec. 27 NW4 |
| 122 |
|
641319 |
|
WHISPER
182 |
|
U.S.
GoldMining Inc. |
|
S
22N 18W Sec. 31 NW4 |
| 123 |
|
641320 |
|
WHISPER
157 |
|
U.S.
GoldMining Inc. |
|
S
22N 18W Sec. 27 SE4 |
| 124 |
|
641321 |
|
WHISPER
158 |
|
U.S.
GoldMining Inc. |
|
S
22N 18W Sec. 27 NE4 |
| 125 |
|
641322 |
|
WHISPER
159 |
|
U.S.
GoldMining Inc. |
|
S
22N 18W Sec. 31 NE4 |
| 126 |
|
641323 |
|
WHISPER
160 |
|
U.S.
GoldMining Inc. |
|
S
22N 18W Sec. 32 NW4 |
| 127 |
|
641324 |
|
WHISPER
161 |
|
U.S.
GoldMining Inc. |
|
S
22N 18W Sec. 32 NE4 |
| 128 |
|
641325 |
|
WHISPER
162 |
|
U.S.
GoldMining Inc. |
|
S
22N 18W Sec. 33 NW4 |
| 129 |
|
641326 |
|
WHISPER
163 |
|
U.S.
GoldMining Inc. |
|
S
22N 18W Sec. 33 NE4 |
| 130 |
|
641327 |
|
WHISPER
164 |
|
U.S.
GoldMining Inc. |
|
S
22N 18W Sec. 34 NW4 |
| 131 |
|
641329 |
|
WHISPER
166 |
|
U.S.
GoldMining Inc. |
|
S
22N 18W Sec. 31 SE4 |
| 132 |
|
641330 |
|
WHISPER
167 |
|
U.S.
GoldMining Inc. |
|
S
22N 18W Sec. 32 SW4 |
| 133 |
|
641331 |
|
WHISPER
168 |
|
U.S.
GoldMining Inc. |
|
S
22N 18W Sec. 32 SE4 |
| 134 |
|
641332 |
|
WHISPER
169 |
|
U.S.
GoldMining Inc. |
|
S
22N 18W Sec. 33 SW4 |
| 135 |
|
641333 |
|
WHISPER
170 |
|
U.S.
GoldMining Inc. |
|
S
22N 18W Sec. 33 SE4 |
| 136 |
|
641334 |
|
WHISPER
171 |
|
U.S.
GoldMining Inc. |
|
S
21N 18W Sec. 5 NW4 |
| 137 |
|
641335 |
|
WHISPER
172 |
|
U.S.
GoldMining Inc. |
|
S
21N 18W Sec. 5 NE4 |
| 138 |
|
641337 |
|
WHISPER
174 |
|
U.S.
GoldMining Inc. |
|
S
22N 19W Sec. 1 NW4 |
| 139 |
|
641338 |
|
WHISPER
175 |
|
U.S.
GoldMining Inc. |
|
S
22N 19W Sec. 1 NE4 |
| 140 |
|
641339 |
|
WHISPER
176 |
|
U.S.
GoldMining Inc. |
|
S
22N 19W Sec. 1 SW4 |
| 141 |
|
641340 |
|
WHISPER
177 |
|
U.S.
GoldMining Inc. |
|
S
22N 19W Sec. 1 SE4 |
| 142 |
|
641341 |
|
WHISPER
178 |
|
U.S.
GoldMining Inc. |
|
S
22N 19W Sec. 12 NW4 |
| 143 |
|
641342 |
|
WHISPER
179 |
|
U.S.
GoldMining Inc. |
|
S
22N 19W Sec. 12 NE4 |
| 144 |
|
641343 |
|
WHISPER
180 |
|
U.S.
GoldMining Inc. |
|
S
22N 19W Sec. 12 SW4 |
| 145 |
|
644845 |
|
WHISPER
183 |
|
U.S.
GoldMining Inc. |
|
S
23N 19W Sec. 14 NW4 |
| 146 |
|
644846 |
|
WHISPER
185 |
|
U.S.
GoldMining Inc. |
|
S
23N 19W Sec. 14 SW4 |
| 147 |
|
644847 |
|
WHISPER
186 |
|
U.S.
GoldMining Inc. |
|
S
23N 19W Sec. 14 SE4 |
| 148 |
|
644848 |
|
WHISPER
187 |
|
U.S.
GoldMining Inc. |
|
S
23N 19W Sec. 15 NE4 |
| 149 |
|
645698 |
|
IM
1 |
|
U.S.
GoldMining Inc. |
|
S
19N 19W Sec. 6 SW4 |
| 150 |
|
645699 |
|
IM
2 |
|
U.S.
GoldMining Inc. |
|
S
19N 19W Sec. 6 SE4 |
| 151 |
|
645700 |
|
IM
3 |
|
U.S.
GoldMining Inc. |
|
S
19N 19W Sec. 5 SW4 |
| 152 |
|
645701 |
|
IM
4 |
|
U.S.
GoldMining Inc. |
|
S
19N 19W Sec. 5 SE4 |
| 153 |
|
645702 |
|
IM
5 |
|
U.S.
GoldMining Inc. |
|
S
19N 19W Sec. 4 SW4 |
| 154 |
|
645703 |
|
IM
10 |
|
U.S.
GoldMining Inc. |
|
S
19N 19W Sec. 6 NW4 |
| 155 |
|
645704 |
|
IM
11 |
|
U.S.
GoldMining Inc. |
|
S
19N 19W Sec. 6 NE4 |
| 156 |
|
645705 |
|
IM
12 |
|
U.S.
GoldMining Inc. |
|
S
19N 19W Sec. 5 NW4 |
| 157 |
|
645706 |
|
IM
13 |
|
U.S.
GoldMining Inc. |
|
S
19N 19W Sec. 5 NE4 |
| 158 |
|
645707 |
|
IM
14 |
|
U.S.
GoldMining Inc. |
|
S
19N 19W Sec. 4 NW4 |
| Effective Date: September 12, 2024 | Page 177 of 181 |
| | S-K 1300 Technical Summary Report – Whistler Project, Alaska |
| No. |
|
ADL
Serial Number |
|
Claim
Name |
|
Claim
Owner |
|
MTRS
Q or Q-Q |
| 159 |
|
645708 |
|
IM
15 |
|
U.S.
GoldMining Inc. |
|
S
19N 19W Sec. 4 NE4 |
| 160 |
|
645709 |
|
IM
19 |
|
U.S.
GoldMining Inc. |
|
S
20N 19W Sec. 31 SW4 |
| 161 |
|
645710 |
|
IM
20 |
|
U.S.
GoldMining Inc. |
|
S
20N 19W Sec. 31 SE4 |
| 162 |
|
645711 |
|
IM
21 |
|
U.S.
GoldMining Inc. |
|
S
20N 19W Sec. 32 SW4 |
| 163 |
|
645712 |
|
IM
22 |
|
U.S.
GoldMining Inc. |
|
S
20N 19W Sec. 32 SE4 |
| 164 |
|
645713 |
|
IM
23 |
|
U.S.
GoldMining Inc. |
|
S
20N 19W Sec. 33 SW4 |
| 165 |
|
645714 |
|
IM
24 |
|
U.S.
GoldMining Inc. |
|
S
20N 19W Sec. 33 SE4 |
| 166 |
|
645715 |
|
IM
28 |
|
U.S.
GoldMining Inc. |
|
S
20N 19W Sec. 31 NW4 |
| 167 |
|
645716 |
|
IM
29 |
|
U.S.
GoldMining Inc. |
|
S
20N 19W Sec. 31 NE4 |
| 168 |
|
645717 |
|
IM
30 |
|
U.S.
GoldMining Inc. |
|
S
20N 19W Sec. 32 NW4 |
| 169 |
|
645718 |
|
IM
31 |
|
U.S.
GoldMining Inc. |
|
S
20N 19W Sec. 32 NE4 |
| 170 |
|
645719 |
|
IM
32 |
|
U.S.
GoldMining Inc. |
|
S
20N 19W Sec. 33 NW4 |
| 171 |
|
645720 |
|
IM
33 |
|
U.S.
GoldMining Inc. |
|
S
20N 19W Sec. 33 NE4 |
| 172 |
|
645721 |
|
IM
34 |
|
U.S.
GoldMining Inc. |
|
S
20N 19W Sec. 34 NW4 |
| 173 |
|
645723 |
|
IM
37 |
|
U.S.
GoldMining Inc. |
|
S
20N 19W Sec. 29 SW4 |
| 174 |
|
645724 |
|
IM
38 |
|
U.S.
GoldMining Inc. |
|
S
20N 19W Sec. 29 SE4 |
| 175 |
|
645725 |
|
IM
39 |
|
U.S.
GoldMining Inc. |
|
S
20N 19W Sec. 28 SW4 |
| 176 |
|
645726 |
|
IM
40 |
|
U.S.
GoldMining Inc. |
|
S
20N 19W Sec. 28 SE4 |
| 177 |
|
645727 |
|
IM
41 |
|
U.S.
GoldMining Inc. |
|
S
20N 19W Sec. 27 SW4 |
| 178 |
|
645729 |
|
IM
44 |
|
U.S.
GoldMining Inc. |
|
S
20N 19W Sec. 29 NW4 |
| 179 |
|
645730 |
|
IM
45 |
|
U.S.
GoldMining Inc. |
|
S
20N 19W Sec. 29 NE4 |
| 180 |
|
645731 |
|
IM
46 |
|
U.S.
GoldMining Inc. |
|
S
20N 19W Sec. 28 NW4 |
| 181 |
|
645732 |
|
IM
47 |
|
U.S.
GoldMining Inc. |
|
S
20N 19W Sec. 28 NE4 |
| 182 |
|
645733 |
|
IM
48 |
|
U.S.
GoldMining Inc. |
|
S
20N 19W Sec. 27 NW4 |
| 183 |
|
645736 |
|
IM
52 |
|
U.S.
GoldMining Inc. |
|
S
20N 19W Sec. 20 SE4 |
| 184 |
|
645737 |
|
IM
53 |
|
U.S.
GoldMining Inc. |
|
S
20N 19W Sec. 22 SW4 |
| 185 |
|
645740 |
|
IM
57 |
|
U.S.
GoldMining Inc. |
|
S
20N 19W Sec. 20 NE4 |
| 186 |
|
646059 |
|
IM
6 |
|
U.S.
GoldMining Inc. |
|
S
20N 19W Sec. 30 SW4 |
| 187 |
|
646060 |
|
IM
7 |
|
U.S.
GoldMining Inc. |
|
S
20N 19W Sec. 30 SE4 |
| 188 |
|
646074 |
|
IM
61 |
|
U.S.
GoldMining Inc. |
|
S
19N 19W Sec. 7 NW4 |
| 189 |
|
646075 |
|
IM
62 |
|
U.S.
GoldMining Inc. |
|
S
19N 19W Sec. 7 NE4 |
| 190 |
|
646076 |
|
IM
63 |
|
U.S.
GoldMining Inc. |
|
S
19N 19W Sec. 8 NW4 |
| 191 |
|
646077 |
|
IM
64 |
|
U.S.
GoldMining Inc. |
|
S
19N 19W Sec. 8 NE4 |
| 192 |
|
646078 |
|
IM
65 |
|
U.S.
GoldMining Inc. |
|
S
19N 19W Sec. 9 NW4 |
| 193 |
|
646325 |
|
WHISPER
428 |
|
U.S.
GoldMining Inc. |
|
S
22N 18W Sec. 31 SW4 |
| 194 |
|
646327 |
|
WHISPER
430 |
|
U.S.
GoldMining Inc. |
|
S
21N 18W Sec. 6 NW4 |
| 195 |
|
646328 |
|
WHISPER
431 |
|
U.S.
GoldMining Inc. |
|
S
21N 18W Sec. 6 NE4 |
| 196 |
|
646330 |
|
WHISPER
433 |
|
U.S.
GoldMining Inc. |
|
S
21N 18W Sec. 6 SW4 |
| 197 |
|
646331 |
|
WHISPER
434 |
|
U.S.
GoldMining Inc. |
|
S
21N 18W Sec. 6 SE4 |
| 198 |
|
646338 |
|
WHISPER
441 |
|
U.S.
GoldMining Inc. |
|
S
21N 18W Sec. 7 NW4 |
| 199 |
|
646339 |
|
WHISPER
442 |
|
U.S.
GoldMining Inc. |
|
S
21N 18W Sec. 7 NE4 |
| 200 |
|
646343 |
|
WHISPER
446 |
|
U.S.
GoldMining Inc. |
|
S
21N 19W Sec. 12 SE4 |
| 201 |
|
646344 |
|
WHISPER
447 |
|
U.S.
GoldMining Inc. |
|
S
21N 18W Sec. 7 SW4 |
| 202 |
|
646350 |
|
WHISPER
453 |
|
U.S.
GoldMining Inc. |
|
S
21N 19W Sec. 13 NE4 |
| 203 |
|
646351 |
|
WHISPER
454 |
|
U.S.
GoldMining Inc. |
|
S
21N 18W Sec. 18 NW4 |
| 204 |
|
646355 |
|
WHISPER
458 |
|
U.S.
GoldMining Inc. |
|
S
21N 19W Sec. 13 SW4 |
| 205 |
|
646356 |
|
WHISPER
459 |
|
U.S.
GoldMining Inc. |
|
S
21N 19W Sec. 13 SE4 |
| 206 |
|
646764 |
|
IM
71 |
|
U.S.
GoldMining Inc. |
|
S
20N 19W Sec. 6 NE4 |
| 207 |
|
646765 |
|
IM
72 |
|
U.S.
GoldMining Inc. |
|
S
20N 19W Sec. 5 NW4 |
| 208 |
|
646766 |
|
IM
73 |
|
U.S.
GoldMining Inc. |
|
S
20N 19W Sec. 5 NE4 |
| 209 |
|
646767 |
|
IM
74 |
|
U.S.
GoldMining Inc. |
|
S
20N 19W Sec. 4 NW4 |
| 210 |
|
646774 |
|
IM
81 |
|
U.S.
GoldMining Inc. |
|
S
20N 19W Sec. 5 SE4 |
| 211 |
|
646775 |
|
IM
82 |
|
U.S.
GoldMining Inc. |
|
S
20N 19W Sec. 4 SW4 |
| 212 |
|
646783 |
|
IM
90 |
|
U.S.
GoldMining Inc. |
|
S
20N 19W Sec. 8 NE4 |
| Effective Date: September 12, 2024 | Page 178 of 181 |
| | S-K 1300 Technical Summary Report – Whistler Project, Alaska |
| No. |
|
ADL
Serial Number |
|
Claim
Name |
|
Claim
Owner |
|
MTRS
Q or Q-Q |
| 213 |
|
646784 |
|
IM
91 |
|
U.S.
GoldMining Inc. |
|
S
20N 19W Sec. 9 NW4 |
| 214 |
|
646792 |
|
IM
99 |
|
U.S.
GoldMining Inc. |
|
S
20N 19W Sec. 8 SE4 |
| 215 |
|
646793 |
|
IM
100 |
|
U.S.
GoldMining Inc. |
|
S
20N 19W Sec. 9 SW4 |
| 216 |
|
646801 |
|
IM
108 |
|
U.S.
GoldMining Inc. |
|
S
20N 19W Sec. 17 NE4 |
| 217 |
|
646802 |
|
IM
109 |
|
U.S.
GoldMining Inc. |
|
S
20N 19W Sec. 16 NW4 |
| 218 |
|
646810 |
|
IM
117 |
|
U.S.
GoldMining Inc. |
|
S
20N 19W Sec. 17 SE4 |
| 219 |
|
646819 |
|
IM
126 |
|
U.S.
GoldMining Inc. |
|
S
20N 19W Sec. 21 SW4 |
| 220 |
|
646820 |
|
IM
127 |
|
U.S.
GoldMining Inc. |
|
S
20N 19W Sec. 21 SE4 |
| 221 |
|
646824 |
|
WHISPER
464 |
|
U.S.
GoldMining Inc. |
|
S
23N 19W Sec. 27 NW4 |
| 222 |
|
646825 |
|
WHISPER
465 |
|
U.S.
GoldMining Inc. |
|
S
23N 19W Sec. 27 SW4 |
| 223 |
|
646826 |
|
WHISPER
466 |
|
U.S.
GoldMining Inc. |
|
S
23N 19W Sec. 34 NW4 |
| 224 |
|
646839 |
|
WHISPER
479 |
|
U.S.
GoldMining Inc. |
|
S
23N 19W Sec. 22 SE4 |
| 225 |
|
646840 |
|
WHISPER
480 |
|
U.S.
GoldMining Inc. |
|
S
23N 19W Sec. 27 NE4 |
| 226 |
|
646841 |
|
WHISPER
481 |
|
U.S.
GoldMining Inc. |
|
S
23N 19W Sec. 27 SE4 |
| 227 |
|
646842 |
|
WHISPER
482 |
|
U.S.
GoldMining Inc. |
|
S
23N 19W Sec. 34 NE4 |
| 228 |
|
646855 |
|
WHISPER
495 |
|
U.S.
GoldMining Inc. |
|
S
22N 19W Sec. 2 SW4 |
| 229 |
|
646856 |
|
WHISPER
496 |
|
U.S.
GoldMining Inc. |
|
S
22N 19W Sec. 11 NW4 |
| 230 |
|
646857 |
|
WHISPER
497 |
|
U.S.
GoldMining Inc. |
|
S
22N 19W Sec. 11 SW4 |
| 231 |
|
646858 |
|
WHISPER
498 |
|
U.S.
GoldMining Inc. |
|
S
22N 19W Sec. 14 NW4 |
| 232 |
|
646864 |
|
WHISPER
504 |
|
U.S.
GoldMining Inc. |
|
S
22N 19W Sec. 2 NE4 |
| 233 |
|
646865 |
|
WHISPER
505 |
|
U.S.
GoldMining Inc. |
|
S
22N 19W Sec. 2 SE4 |
| 234 |
|
646866 |
|
WHISPER
506 |
|
U.S.
GoldMining Inc. |
|
S
22N 19W Sec. 11 NE4 |
| 235 |
|
646867 |
|
WHISPER
507 |
|
U.S.
GoldMining Inc. |
|
S
22N 19W Sec. 11 SE4 |
| 236 |
|
646868 |
|
WHISPER
508 |
|
U.S.
GoldMining Inc. |
|
S
22N 19W Sec. 14 NE4 |
| 237 |
|
646869 |
|
WHISPER
509 |
|
U.S.
GoldMining Inc. |
|
S
22N 19W Sec. 14 SE4 |
| 238 |
|
646927 |
|
WHISPER
567 |
|
U.S.
GoldMining Inc. |
|
S
21N 19W Sec. 24 NW4 |
| 239 |
|
646928 |
|
WHISPER
568 |
|
U.S.
GoldMining Inc. |
|
S
21N 19W Sec. 24 NE4 |
| 240 |
|
646934 |
|
WHISPER
574 |
|
U.S.
GoldMining Inc. |
|
S
21N 19W Sec. 23 SE4 |
| 241 |
|
646935 |
|
WHISPER
575 |
|
U.S.
GoldMining Inc. |
|
S
21N 19W Sec. 24 SW4 |
| 242 |
|
646942 |
|
WHISPER
582 |
|
U.S.
GoldMining Inc. |
|
S
21N 19W Sec. 26 NW4 |
| 243 |
|
646943 |
|
WHISPER
583 |
|
U.S.
GoldMining Inc. |
|
S
21N 19W Sec. 26 NE4 |
| 244 |
|
646944 |
|
WHISPER
584 |
|
U.S.
GoldMining Inc. |
|
S
21N 19W Sec. 25 NW4 |
| 245 |
|
646952 |
|
WHISPER
592 |
|
U.S.
GoldMining Inc. |
|
S
21N 19W Sec. 26 SW4 |
| 246 |
|
646953 |
|
WHISPER
593 |
|
U.S.
GoldMining Inc. |
|
S
21N 19W Sec. 26 SE4 |
| 247 |
|
646958 |
|
WHISPER
598 |
|
U.S.
GoldMining Inc. |
|
S
21N 19W Sec. 33 NW4 |
| 248 |
|
646959 |
|
WHISPER
599 |
|
U.S.
GoldMining Inc. |
|
S
21N 19W Sec. 33 NE4 |
| 249 |
|
646960 |
|
WHISPER
600 |
|
U.S.
GoldMining Inc. |
|
S
21N 19W Sec. 34 NW4 |
| 250 |
|
646961 |
|
WHISPER
601 |
|
U.S.
GoldMining Inc. |
|
S
21N 19W Sec. 34 NE4 |
| 251 |
|
646962 |
|
WHISPER
602 |
|
U.S.
GoldMining Inc. |
|
S
21N 19W Sec. 35 NW4 |
| 252 |
|
646968 |
|
WHISPER
608 |
|
U.S.
GoldMining Inc. |
|
S
21N 19W Sec. 33 SW4 |
| 253 |
|
646969 |
|
WHISPER
609 |
|
U.S.
GoldMining Inc. |
|
S
21N 19W Sec. 33 SE4 |
| 254 |
|
646970 |
|
WHISPER
610 |
|
U.S.
GoldMining Inc. |
|
S
21N 19W Sec. 34 SW4 |
| 255 |
|
646971 |
|
WHISPER
611 |
|
U.S.
GoldMining Inc. |
|
S
21N 19W Sec. 34 SE4 |
| 256 |
|
646972 |
|
WHISPER
612 |
|
U.S.
GoldMining Inc. |
|
S
21N 19W Sec. 35 SW4 |
| 257 |
|
650959 |
|
MUD
1 |
|
U.S.
GoldMining Inc. |
|
S
21N 19W Sec. 32 NE4 |
| 258 |
|
650960 |
|
MUD
2 |
|
U.S.
GoldMining Inc. |
|
S
21N 19W Sec. 32 NW4 |
| 259 |
|
650961 |
|
MUD
3 |
|
U.S.
GoldMining Inc. |
|
S
21N 19W Sec. 31 NE4 |
| 260 |
|
650962 |
|
MUD
4 |
|
U.S.
GoldMining Inc. |
|
S
21N 19W Sec. 31 NW4 |
| 261 |
|
650963 |
|
MUD
5 |
|
U.S.
GoldMining Inc. |
|
S
21N 20W Sec. 36 NE4 |
| 262 |
|
650964 |
|
MUD
6 |
|
U.S.
GoldMining Inc. |
|
S
21N 20W Sec. 36 NW4 |
| 263 |
|
650965 |
|
MUD
7 |
|
U.S.
GoldMining Inc. |
|
S
21N 20W Sec. 35 NE4 |
| 264 |
|
650966 |
|
MUD
8 |
|
U.S.
GoldMining Inc. |
|
S
21N 20W Sec. 35 NW4 |
| 265 |
|
650967 |
|
MUD
9* |
|
U.S.
GoldMining Inc. |
|
S
21N 20W Sec. 34 NE4NE4 |
| 266 |
|
650968 |
|
MUD
10* |
|
U.S.
GoldMining Inc. |
|
S
21N 20W Sec. 34 SE4NE4 |
| Effective Date: September 12, 2024 | Page 179 of 181 |
| | S-K 1300 Technical Summary Report – Whistler Project, Alaska |
| No. |
|
ADL
Serial Number |
|
Claim
Name |
|
Claim
Owner |
|
MTRS
Q or Q-Q |
| 267 |
|
650969 |
|
MUD
11* |
|
U.S.
GoldMining Inc. |
|
S
21N 20W Sec. 34 NE4SE4 |
| 268 |
|
650970 |
|
MUD
12* |
|
U.S.
GoldMining Inc. |
|
S
21N 20W Sec. 34 SE4SE4 |
| 269 |
|
650971 |
|
MUD
13 |
|
U.S.
GoldMining Inc. |
|
S
21N 20W Sec. 35 SW4 |
| 270 |
|
650972 |
|
MUD
14* |
|
U.S.
GoldMining Inc. |
|
S
21N 20W Sec. 35 NW4SE4 |
| 271 |
|
650973 |
|
MUD
15* |
|
U.S.
GoldMining Inc. |
|
S
21N 20W Sec. 35 NE4SE4 |
| 272 |
|
650974 |
|
MUD
16* |
|
U.S.
GoldMining Inc. |
|
S
21N 20W Sec. 35 SW4SE4 |
| 273 |
|
650975 |
|
MUD
17 |
|
U.S.
GoldMining Inc. |
|
S
21N 20W Sec. 36 SW4 |
| 274 |
|
650976 |
|
MUD
18 |
|
U.S.
GoldMining Inc. |
|
S
21N 20W Sec. 36 SE4 |
| 275 |
|
650977 |
|
MUD
19 |
|
U.S.
GoldMining Inc. |
|
S
21N 19W Sec. 31 SW4 |
| 276 |
|
650978 |
|
MUD
20 |
|
U.S.
GoldMining Inc. |
|
S
21N 19W Sec. 31 SE4 |
| 277 |
|
650979 |
|
MUD
21 |
|
U.S.
GoldMining Inc. |
|
S
21N 19W Sec. 32 SW4 |
| 278 |
|
650980 |
|
MUD
22 |
|
U.S.
GoldMining Inc. |
|
S
21N 19W Sec. 32 SE4 |
| 279 |
|
650981 |
|
MUD
23 |
|
U.S.
GoldMining Inc. |
|
S
20N 19W Sec. 6 NW4 |
| 280 |
|
650982 |
|
MUD
24 |
|
U.S.
GoldMining Inc. |
|
S
20N 20W Sec. 1 NE4 |
| 281 |
|
650983 |
|
MUD
25 |
|
U.S.
GoldMining Inc. |
|
S
20N 20W Sec. 1 NW4 |
| 282 |
|
650984 |
|
MUD
26 |
|
U.S.
GoldMining Inc. |
|
S
20N 20W Sec. 2 NE4 |
| 283 |
|
650985 |
|
MUD
27 |
|
U.S.
GoldMining Inc. |
|
S
20N 20W Sec. 2 NW4 |
| 284 |
|
650986 |
|
MUD
28* |
|
U.S.
GoldMining Inc. |
|
S
20N 20W Sec. 3 NE4NE4 |
| 285 |
|
650987 |
|
MUD
29* |
|
U.S.
GoldMining Inc. |
|
S
20N 20W Sec. 3 SE4NE4 |
| 286 |
|
650988 |
|
MUD
30* |
|
U.S.
GoldMining Inc. |
|
S
20N 20W Sec. 3 NE4SE4 |
| 287 |
|
650989 |
|
MUD
31* |
|
U.S.
GoldMining Inc. |
|
S
20N 20W Sec. 3 SE4SE4 |
| 288 |
|
650990 |
|
MUD
32 |
|
U.S.
GoldMining Inc. |
|
S
20N 20W Sec. 2 SW4 |
| 289 |
|
650991 |
|
MUD
33 |
|
U.S.
GoldMining Inc. |
|
S
20N 20W Sec. 2 SE4 |
| 290 |
|
650992 |
|
MUD
34 |
|
U.S.
GoldMining Inc. |
|
S
20N 20W Sec. 1 SW4 |
| 291 |
|
650993 |
|
MUD
35 |
|
U.S.
GoldMining Inc. |
|
S
20N 20W Sec. 1 SE4 |
| 292 |
|
650994 |
|
MUD
36 |
|
U.S.
GoldMining Inc. |
|
S
20N 19W Sec. 6 SW4 |
| 293 |
|
650995 |
|
MUD
37 |
|
U.S.
GoldMining Inc. |
|
S
20N 20W Sec. 11 NE4 |
| 294 |
|
650996 |
|
MUD
38 |
|
U.S.
GoldMining Inc. |
|
S
20N 20W Sec. 11 NW4 |
| 295 |
|
650997 |
|
MUD
39 |
|
U.S.
GoldMining Inc. |
|
S
20N 20W Sec. 10 NE4 |
| 296 |
|
650998 |
|
MUD
40* |
|
U.S.
GoldMining Inc. |
|
S
20N 20W Sec. 3 SW4SE4 |
| 297 |
|
650999 |
|
MUD
41 |
|
U.S.
GoldMining Inc. |
|
S
20N 20W Sec. 10 SE4 |
| 298 |
|
651000 |
|
MUD
42 |
|
U.S.
GoldMining Inc. |
|
S
20N 20W Sec. 11 SW4 |
| 299 |
|
651001 |
|
MUD
43 |
|
U.S.
GoldMining Inc. |
|
S
20N 20W Sec. 11 SE4 |
| 300 |
|
656421 |
|
MUD
44 |
|
U.S.
GoldMining Inc. |
|
S
20N 20W Sec. 12 NW4 |
| 301 |
|
656422 |
|
MUD
45 |
|
U.S.
GoldMining Inc. |
|
S
20N 20W Sec. 12 NE4 |
| 302 |
|
656423 |
|
MUD
46 |
|
U.S.
GoldMining Inc. |
|
S
20N 20W Sec. 12 SW4 |
| 303 |
|
656424 |
|
MUD
47 |
|
U.S.
GoldMining Inc. |
|
S
20N 20W Sec. 12 SE4 |
| 304 |
|
667695 |
|
BT049 |
|
U.S.
GoldMining Inc. |
|
S
19N 19W Sec. 4 SE4 |
| 305 |
|
738137 |
|
WHI
001 |
|
U.S.
GoldMining Inc. |
|
S
22N 18W Sec. 5 SW4 |
| 306 |
|
738138 |
|
WHI
002 |
|
U.S.
GoldMining Inc. |
|
S
22N 18W Sec. 5 SE4 |
| 307 |
|
738139 |
|
WHI
003 |
|
U.S.
GoldMining Inc. |
|
S
22N 18W Sec. 4 SW4 |
| 308 |
|
738140 |
|
WHI
004 |
|
U.S.
GoldMining Inc. |
|
S
22N 18W Sec. 4 SE4 |
| 309 |
|
738141 |
|
WHI
005 |
|
U.S.
GoldMining Inc. |
|
S
22N 18W Sec. 3 SW4 |
| 310 |
|
738142 |
|
WHI
006 |
|
U.S.
GoldMining Inc. |
|
S
22N 18W Sec. 3 SE4 |
| 311 |
|
738143 |
|
WHI
007 |
|
U.S.
GoldMining Inc. |
|
S
22N 18W Sec. 2 SW4 |
| 312 |
|
738144 |
|
WHI
008 |
|
U.S.
GoldMining Inc. |
|
S
22N 18W Sec. 2 SE4 |
| 313 |
|
738145 |
|
WHI
009 |
|
U.S.
GoldMining Inc. |
|
S
22N 18W Sec. 10 NW4 |
| 314 |
|
738146 |
|
WHI
010 |
|
U.S.
GoldMining Inc. |
|
S
22N 18W Sec. 10 NE4 |
| 315 |
|
738147 |
|
WHI
011 |
|
U.S.
GoldMining Inc. |
|
S
22N 18W Sec. 11 NW4 |
| 316 |
|
738148 |
|
WHI
012 |
|
U.S.
GoldMining Inc. |
|
S
22N 18W Sec. 11 NE4 |
| 317 |
|
738149 |
|
WHI
013 |
|
U.S.
GoldMining Inc. |
|
S
22N 18W Sec. 12 NW4 |
| 318 |
|
738150 |
|
WHI
014 |
|
U.S.
GoldMining Inc. |
|
S
22N 18W Sec. 12 NE4 |
| 319 |
|
738151 |
|
WHI
015 |
|
U.S.
GoldMining Inc. |
|
S
22N 17W Sec. 7 NW4 |
| 320 |
|
738152 |
|
WHI
016 |
|
U.S.
GoldMining Inc. |
|
S
22N 18W Sec. 10 SE4 |
| Effective Date: September 12, 2024 | Page 180 of 181 |
| | S-K 1300 Technical Summary Report – Whistler Project, Alaska |
| No. |
|
ADL
Serial Number |
|
Claim
Name |
|
Claim
Owner |
|
MTRS
Q or Q-Q |
| 321 |
|
738153 |
|
WHI
017 |
|
U.S.
GoldMining Inc. |
|
S
22N 18W Sec. 11 SW4 |
| 322 |
|
738154 |
|
WHI
018 |
|
U.S.
GoldMining Inc. |
|
S
22N 18W Sec. 11 SE4 |
| 323 |
|
738155 |
|
WHI
019 |
|
U.S.
GoldMining Inc. |
|
S
22N 18W Sec. 12 SW4 |
| 324 |
|
738156 |
|
WHI
020 |
|
U.S.
GoldMining Inc. |
|
S
22N 18W Sec. 12 SE4 |
| 325 |
|
738157 |
|
WHI
021 |
|
U.S.
GoldMining Inc. |
|
S
22N 17W Sec. 7 SW4 |
| 326 |
|
738158 |
|
WHI
022 |
|
U.S.
GoldMining Inc. |
|
S
22N 18W Sec. 15 NE4 |
| 327 |
|
738159 |
|
WHI
023 |
|
U.S.
GoldMining Inc. |
|
S
22N 18W Sec. 14 NW4 |
| 328 |
|
738160 |
|
WHI
024 |
|
U.S.
GoldMining Inc. |
|
S
22N 18W Sec. 14 NE4 |
| 329 |
|
738161 |
|
WHI
025 |
|
U.S.
GoldMining Inc. |
|
S
22N 18W Sec. 13 NW4 |
| 330 |
|
738162 |
|
WHI
026 |
|
U.S.
GoldMining Inc. |
|
S
22N 18W Sec. 13 NE4 |
| 331 |
|
738163 |
|
WHI
027 |
|
U.S.
GoldMining Inc. |
|
S
22N 17W Sec. 18 NW4 |
| 332 |
|
738164 |
|
WHI
028 |
|
U.S.
GoldMining Inc. |
|
S
22N 18W Sec. 14 SW4 |
| 333 |
|
738165 |
|
WHI
029 |
|
U.S.
GoldMining Inc. |
|
S
22N 18W Sec. 14 SE4 |
| 334 |
|
738166 |
|
WHI
030 |
|
U.S.
GoldMining Inc. |
|
S
22N 18W Sec. 13 SW4 |
| 335 |
|
738167 |
|
WHI
031 |
|
U.S.
GoldMining Inc. |
|
S
22N 18W Sec. 13 SE4 |
| 336 |
|
738168 |
|
WHI
032 |
|
U.S.
GoldMining Inc. |
|
S
22N 17W Sec. 18 SW4 |
| 337 |
|
738169 |
|
WHI
033 |
|
U.S.
GoldMining Inc. |
|
S
22N 18W Sec. 23 NW4 |
| 338 |
|
738170 |
|
WHI
034 |
|
U.S.
GoldMining Inc. |
|
S
22N 18W Sec. 23 NE4 |
| 339 |
|
738171 |
|
WHI
035 |
|
U.S.
GoldMining Inc. |
|
S
22N 18W Sec. 24 NW4 |
| 340 |
|
738172 |
|
WHI
036 |
|
U.S.
GoldMining Inc. |
|
S
22N 18W Sec. 24 NE4 |
| 341 |
|
738173 |
|
WHI
037 |
|
U.S.
GoldMining Inc. |
|
S
22N 17W Sec. 19 NW4 |
| 342 |
|
738174 |
|
WHI
038 |
|
U.S.
GoldMining Inc. |
|
S
22N 18W Sec. 23 SW4 |
| 343 |
|
738175 |
|
WHI
039 |
|
U.S.
GoldMining Inc. |
|
S
22N 18W Sec. 23 SE4 |
| 344 |
|
738176 |
|
WHI
040 |
|
U.S.
GoldMining Inc. |
|
S
22N 18W Sec. 24 SW4 |
| 345 |
|
738177 |
|
WHI
041 |
|
U.S.
GoldMining Inc. |
|
S
22N 18W Sec. 24 SE4 |
| 346 |
|
738178 |
|
WHI
042 |
|
U.S.
GoldMining Inc. |
|
S
22N 19W Sec. 36 NE4 |
| 347 |
|
738179 |
|
WHI
043 |
|
U.S.
GoldMining Inc. |
|
S
22N 19W Sec. 36 SE4 |
| 348 |
|
738180 |
|
WHI
044 |
|
U.S.
GoldMining Inc. |
|
S
21N 19W Sec. 1 NW4 |
| 349 |
|
738181 |
|
WHI
045 |
|
U.S.
GoldMining Inc. |
|
S
21N 19W Sec. 1 NE4 |
| 350 |
|
738182 |
|
WHI
046 |
|
U.S.
GoldMining Inc. |
|
S
21N 19W Sec. 2 SE4 |
| 351 |
|
738183 |
|
WHI
047 |
|
U.S.
GoldMining Inc. |
|
S
21N 19W Sec. 1 SW4 |
| 352 |
|
738184 |
|
WHI
048 |
|
U.S.
GoldMining Inc. |
|
S
21N 19W Sec. 1 SE4 |
| 353 |
|
738185 |
|
WHI
049 |
|
U.S.
GoldMining Inc. |
|
S
21N 19W Sec. 11 NE4 |
| 354 |
|
738186 |
|
WHI
050 |
|
U.S.
GoldMining Inc. |
|
S
21N 19W Sec. 12 NW4 |
| 355 |
|
738187 |
|
WHI
051 |
|
U.S.
GoldMining Inc. |
|
S
21N 19W Sec. 12 NE4 |
| 356 |
|
738188 |
|
WHI
052 |
|
U.S.
GoldMining Inc. |
|
S
21N 19W Sec. 11 SW4 |
| 357 |
|
738189 |
|
WHI
053 |
|
U.S.
GoldMining Inc. |
|
S
21N 19W Sec. 11 SE4 |
| 358 |
|
738190 |
|
WHI
054 |
|
U.S.
GoldMining Inc. |
|
S
21N 19W Sec. 12 SW4 |
| 359 |
|
738191 |
|
WHI
055 |
|
U.S.
GoldMining Inc. |
|
S
21N 19W Sec. 14 NW4 |
| 360 |
|
738192 |
|
WHI
056 |
|
U.S.
GoldMining Inc. |
|
S
21N 19W Sec. 14 NE4 |
| 361 |
|
738193 |
|
WHI
057 |
|
U.S.
GoldMining Inc. |
|
S
21N 19W Sec. 13 NW4 |
| 362 |
|
738194 |
|
WHI
058 |
|
U.S.
GoldMining Inc. |
|
S
21N 19W Sec. 15 SE4 |
| 363 |
|
738195 |
|
WHI
059 |
|
U.S.
GoldMining Inc. |
|
S
21N 19W Sec. 14 SW4 |
| 364 |
|
738196 |
|
WHI
060 |
|
U.S.
GoldMining Inc. |
|
S
21N 19W Sec. 14 SE4 |
| 365 |
|
738197 |
|
WHI
061 |
|
U.S.
GoldMining Inc. |
|
S
21N 19W Sec. 22 NW4 |
| 366 |
|
738198 |
|
WHI
062 |
|
U.S.
GoldMining Inc. |
|
S
21N 19W Sec. 22 NE4 |
| 367 |
|
738199 |
|
WHI
063 |
|
U.S.
GoldMining Inc. |
|
S
21N 19W Sec. 23 NW4 |
| 368 |
|
738200 |
|
WHI
064 |
|
U.S.
GoldMining Inc. |
|
S
21N 19W Sec. 23 NE4 |
| 369 |
|
738201 |
|
WHI
065 |
|
U.S.
GoldMining Inc. |
|
S
21N 19W Sec. 22 SW4 |
| 370 |
|
738202 |
|
WHI
066 |
|
U.S.
GoldMining Inc. |
|
S
21N 19W Sec. 22 SE4 |
| 371 |
|
738203 |
|
WHI
067 |
|
U.S.
GoldMining Inc. |
|
S
21N 19W Sec. 23 SW4 |
| 372 |
|
738204 |
|
WHI
068 |
|
U.S.
GoldMining Inc. |
|
S
21N 19W Sec. 28 NE4 |
| 373 |
|
738205 |
|
WHI
069 |
|
U.S.
GoldMining Inc. |
|
S
21N 19W Sec. 27 NW4 |
| 374 |
|
738206 |
|
WHI
070 |
|
U.S.
GoldMining Inc. |
|
S
21N 19W Sec. 27 NE4 |
| 375 |
|
738207 |
|
WHI
071 |
|
U.S.
GoldMining Inc. |
|
S
21N 19W Sec. 28 SE4 |
| 376 |
|
738208 |
|
WHI
072 |
|
U.S.
GoldMining Inc. |
|
S
21N 19W Sec. 27 SW4 |
| 377 |
|
738209 |
|
WHI
073 |
|
U.S.
GoldMining Inc. |
|
S
21N 19W Sec. 27 SE4 |
*
Denotes 40-acre claims
| Effective Date: September 12, 2024 | Page 181 of 181 |
| | S-K 1300 Technical Summary Report – Whistler Project, Alaska |