uti-20260805
0001261654FALSE00012616542026-08-052026-08-05

____________________________________________________________________________________________________________
UNITED STATES
SECURITIES AND EXCHANGE COMMISSION
WASHINGTON, D.C. 20549

FORM 8-K

CURRENT REPORT

PURSUANT TO SECTION 13 OR 15(d) OF THE SECURITIES EXCHANGE ACT OF 1934

Date of Report (Date of earliest event reported): August 5, 2026

UNIVERSAL TECHNICAL INSTITUTE, INC.
(Exact name of registrant as specified in its charter)
Delaware1-3192386-0226984
(State or other jurisdiction
of incorporation)
(Commission
File Number)
(IRS Employer
Identification No.)
4225 E. Windrose Drive, Suite 200
Phoenix, AZ
(Address of principal executive offices)
85032
(Zip Code)

(623) 445-9500
(Registrant’s telephone number, including area code)

N/A
(Former name or former address, if changed since last report)

Check the appropriate box below if the Form 8-K filing is intended to simultaneously satisfy the filing obligation of the registrant under any of the following provisions:

Written communications pursuant to Rule 425 under the Securities Act (17 CFR 230.425)
Soliciting material pursuant to Rule 14a-12 under the Exchange Act (17 CFR 240.14a-12)
Pre-commencement communications pursuant to Rule 14d-2(b) under the Exchange Act (17 CFR 240.14d-2(b))
Pre-commencement communications pursuant to Rule 13e-4(c) under the Exchange Act (17 CFR 240.13e-4(c))

Securities registered pursuant to Section 12(b) of the Act:
Title of each classTrading Symbol(s)Name of each exchange on which registered
Common Stock, $0.0001 par value per shareUTINew York Stock Exchange

Indicate by check mark whether the registrant is an emerging growth company as defined in Rule 405 of the Securities Act of 1933 (§ 230.405 of this chapter) or Rule 12b-2 of the Securities Exchange Act of 1934 (§ 240.12b-2 of this chapter).
Emerging growth company
If an emerging growth company, indicate by check mark if the registrant has elected not to use the extended transition period for complying with any new or revised financial accounting standards provided pursuant to Section 13(a) of the Exchange Act.


Item 2.02 Results of Operations and Financial Condition.

On August 5, 2026, Universal Technical Institute, Inc. (the "Company") issued a press release reporting its third quarter results for fiscal 2026. A copy of the press release is furnished as Exhibit 99.1 to this Current Report on Form 8-K (this “Form 8-K”) and is incorporated into this Item 2.02 by reference.

Item 7.01 Regulation FD Disclosure.

The Company also posted to the investor relations section of its website (https://investor.uti.edu): (i) an investor presentation, furnished herewith as Exhibit 99.2 (the “Investor Presentation”), and (ii) and a financial supplement, furnished herewith as Exhibit 99.3 (the “Financial Supplement”). Each of the Investor Presentation and the Financial Supplement will be used by the Company during meetings with investors and analysts. This information may be amended or updated at any time and from time to time through another Form 8-K, a later company filing, or other means.

The information in Item 2.02 and Item 7.01 of this Form 8-K, including Exhibit 99.1, Exhibit 99.2 and Exhibit 99.3 attached hereto, is intended to be furnished and shall not be deemed “filed” for purposes of Section 18 of the Securities Exchange Act of 1934, as amended (the “Exchange Act”), or otherwise subject to the liabilities of that section, nor shall it be deemed incorporated by reference in any filing under the Securities Act of 1933, as amended, or the Exchange Act, except as shall be expressly set forth by specific reference in such filing.

Item 9.01 Financial Statements and Exhibits.

(d) Exhibits
Exhibit No.Description
99.1
99.2
99.3
104Cover Page Interactive Data File (embedded within the Inline XBRL document)


SIGNATURES

Pursuant to the requirements of the Securities Exchange Act of 1934, the registrant has duly caused this report to be signed on its behalf by the undersigned hereunto duly authorized.
UNIVERSAL TECHNICAL INSTITUTE, INC.
  
August 5, 2026By:/s/ Bruce Schuman
Name: Bruce Schuman
Title:Executive Vice President and Chief Financial Officer


Exhibit 99.1

Universal Technical Institute Reports Fiscal Year 2026 Third Quarter Results

Total New Student Start Growth Exceeded Expectations Driven by Strong Demand and Continued Momentum Across New Campuses, Reinforcing Confidence in Long-Term North Star Targets

PHOENIX, ARIZ. - August 5, 2026 - Universal Technical Institute, Inc. (NYSE: UTI), a leading workforce solutions provider of transportation, skilled trades and healthcare education programs, reported financial results for the fiscal 2026 third quarter ended June 30, 2026. Universal Technical Institute, Inc. operates in two reportable segments, Universal Technical Institute (UTI) and Concorde Career Colleges (Concorde), and together with its segments and subsidiaries is referred to as the “Company,” “we,” “us” or “our.”
Financial Highlights
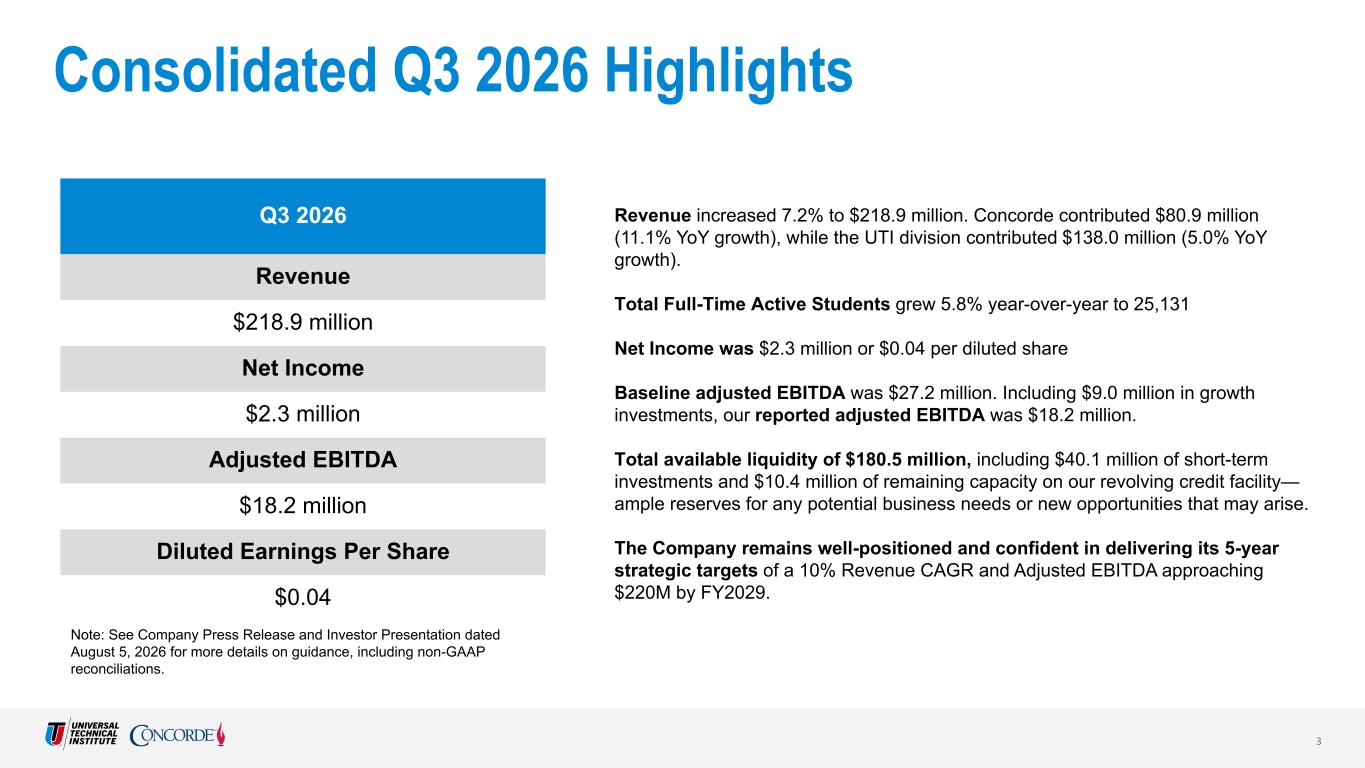
Revenue of $218.9 million, an increase of 7.2% over the comparable period.
Net income of $2.3 million, a decrease of $8.4 million over the comparable period due to strategic growth expenses.
Adjusted EBITDA(1) of $18.2 million, a decrease of 27.8% over the comparable period due to $9.0 million in strategic growth expenses.
Reaffirming confidence in the mid- and long-term financial outlook and revising fiscal 2026 guidance.

Operational Highlights and North Star Strategy Developments
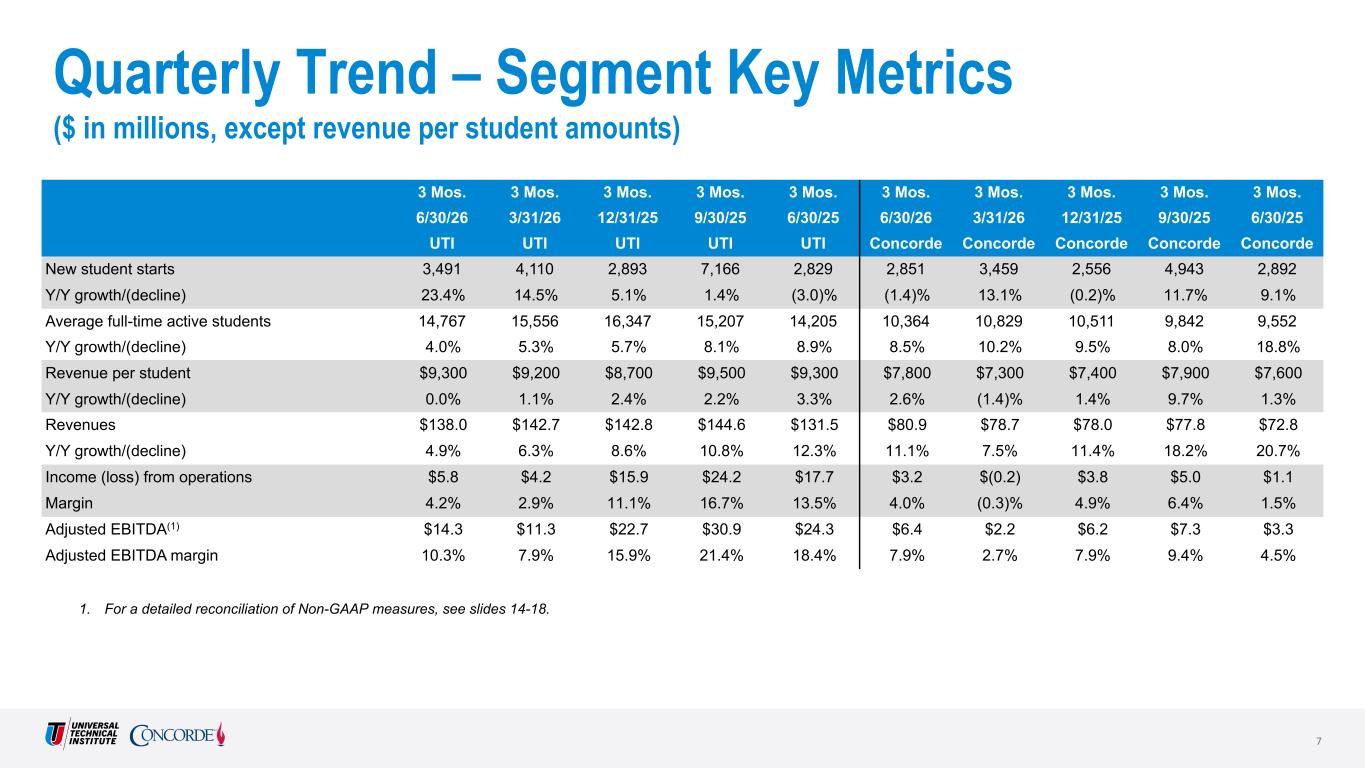
Average full-time active students of 25,131, an increase of 5.8% versus the comparable period, with total new student starts of 6,342, an increase of 10.9% over the comparable period.
UTI-Atlanta campus opened in July with initial student starts approximately 30% ahead of the Company’s expectations, highlighting continued demand for UTI’s skilled-trades portfolio and repeatability of the Company’s growth strategy.
Announcing a key planned milestone within the “Optimization” pillar of North Star, beginning a multi-year transition to a simplified and unified operating model that will enable the Company to leverage enterprise capabilities, standardize processes, streamline operations, and better align resources to support long-term growth.

“Our third quarter results reinforce our confidence in both the demand environment for our students and the strength of the North Star strategy we've been executing," said Jerome Grant, CEO of Universal Technical Institute, Inc. "New student starts grew 11%, exceeding our expectations, driven by a robust performance from our UTI division. Additionally, our newer campuses continue to outperform, with UTI-San Antonio and UTI-Atlanta both tracking well ahead of their launch models, validating the diversification strategy we've been pursuing.

“We have unified all programs under one corporate structure, enabling us to better align resources with demand, improve execution and advance the optimization pillar of North Star while preserving the strength of the UTI and Concorde brands. Over the past several years, we have successfully executed the growth and diversification pillars of North Star, building the programs, campuses and employer relationships needed to meet ever-evolving student demand. That demand is now shifting toward skilled trades faster than anticipated, driving outperformance across newer campuses, capacity expansions and recently launched programs. At the same time, our fourth-quarter high school starts in Auto and Diesel are tracking below plan, as we missed the opportunity to reach every prospective student who expressed interest, creating a clear opportunity to strengthen engagement and improve conversion as we start to look at fiscal 2027.”

Financial Results for the Three-Month Period Ended June 30, 2026 Compared to June 30, 2025
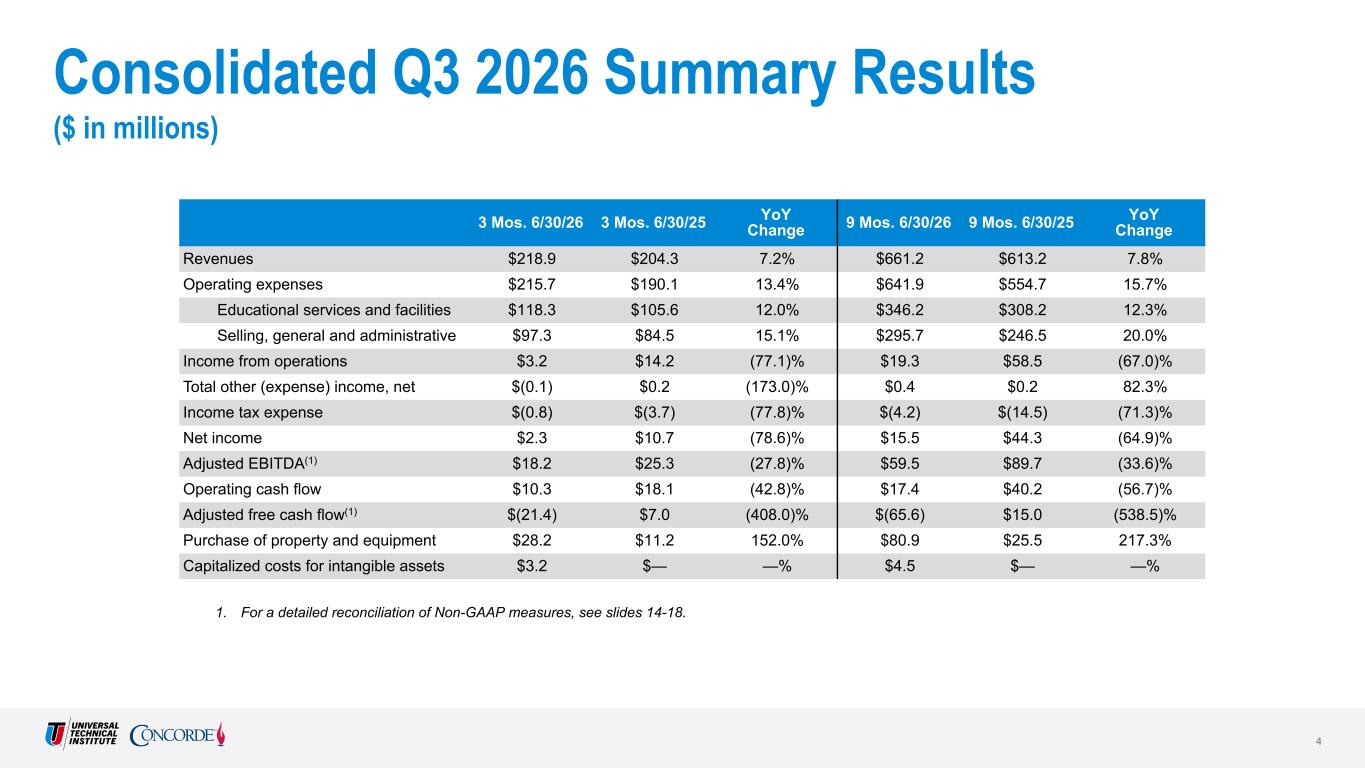
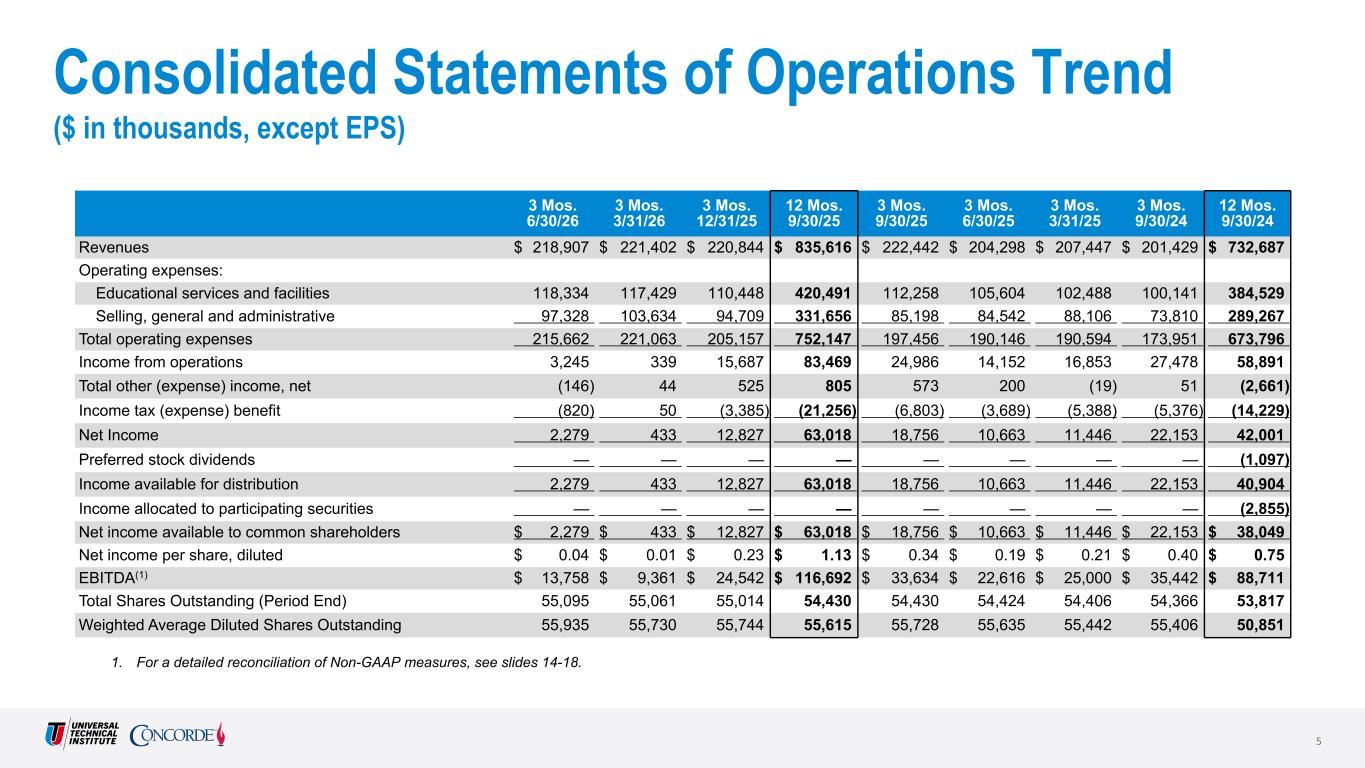
Revenues increased 7.2% to $218.9 million compared to $204.3 million.
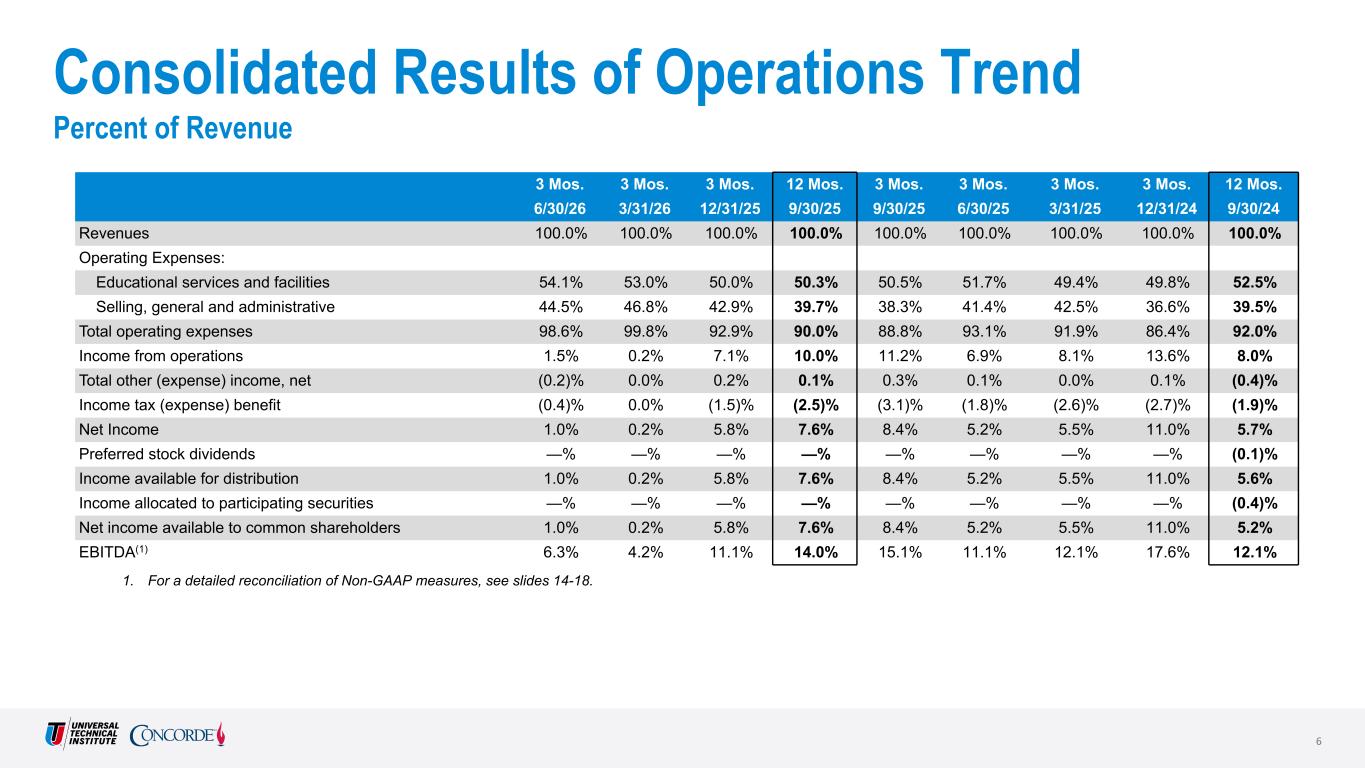
Operating expenses increased 13.4% to $215.7 million, compared to $190.1 million primarily due to the growth in both UTI and Concorde average full-time active students and strategic growth expenses
1


associated with new campus launches and program expansions currently underway or completed over the last year.
Operating income of $3.2 million compared to $14.2 million primarily due to strategic growth expenses.
Net income decreased to $2.3 million compared to $10.7 million primarily due to strategic growth expenses.
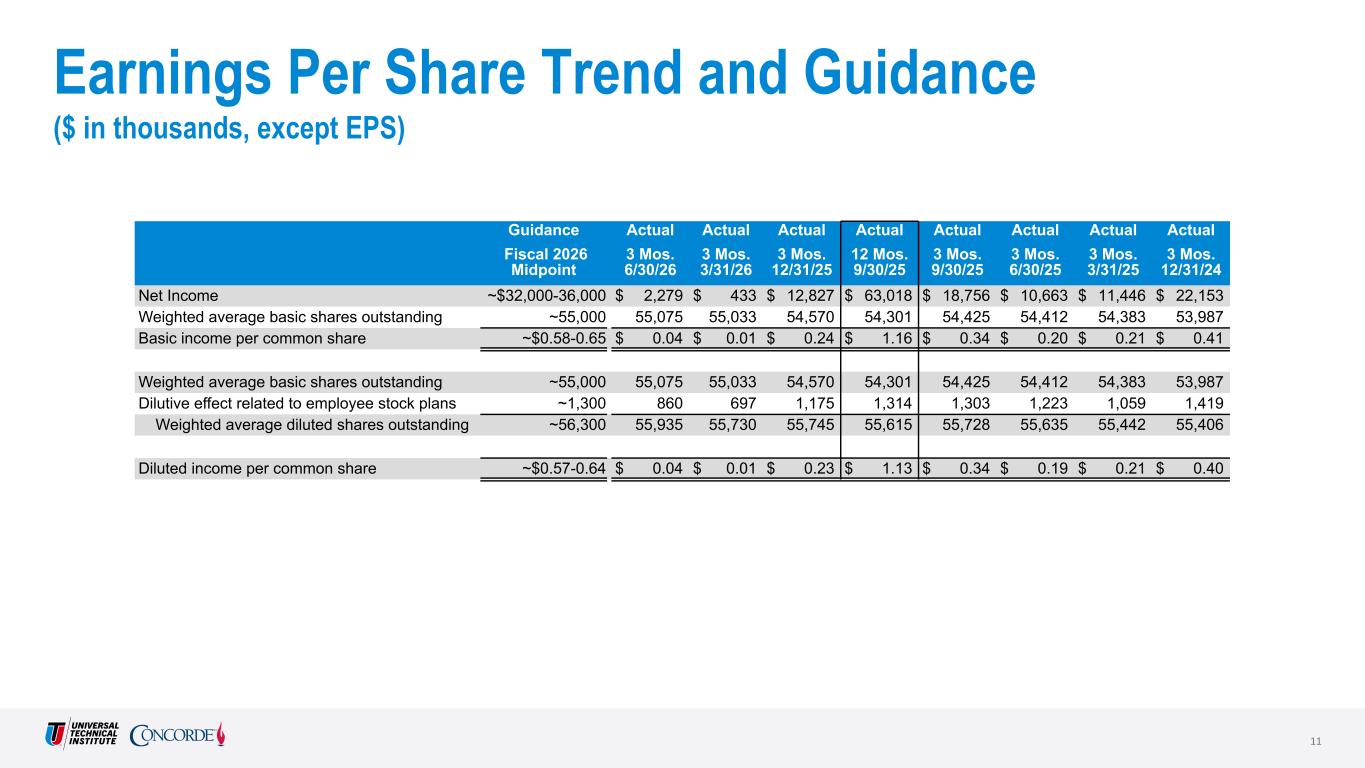
Basic and diluted earnings per share (EPS) were $0.04, compared to $0.20 and $0.19, respectively.
Adjusted EBITDA(1) decreased 27.8% to $18.2 million compared to $25.3 million due to $9.0 million in strategic growth investments.
Average full-time active students increased 5.8%, with total new student starts of 6,342 compared to 5,721.
“Our third quarter results reflect continued operational strength across the business, with solid enrollment growth, revenue expansion, and disciplined execution against our North Star strategy,” said Bruce Schuman, CFO of Universal Technical Institute, Inc. “Average full-time active students increased 5.8% year-over-year, while new student starts increased 10.9%, driven by continued momentum across recently launched campuses, new programs and sustained demand across both divisions.

“Based on the timing of fourth-quarter enrollment trends, we are updating our fiscal 2026 outlook to reflect a more measured fourth-quarter expectation. We now expect fiscal 2026 revenue of $893 million to $900 million, baseline Adjusted EBITDA to exceed $135 million and reported Adjusted EBITDA of $100 million to $103 million, giving effect to approximately $35 million of growth investments. We are also tightening our total new student starts outlook, which is now expected to be between 31,900 and 32,300. Importantly, these adjustments reflect largely timing and, to a lesser degree, mix considerations, rather than a change in the underlying demand environment. Employer demand remains strong, student interest continues to be healthy, and our newer campuses and programs continue to perform well. We believe the investments we are making today are strengthening our platform and positioning Universal Technical Institute, Inc. to deliver on the long-term financial targets outlined in our North Star Phase II strategy.”

Financial Results for the Nine-Month Period Ended June 30, 2026 Compared to June 30, 2025
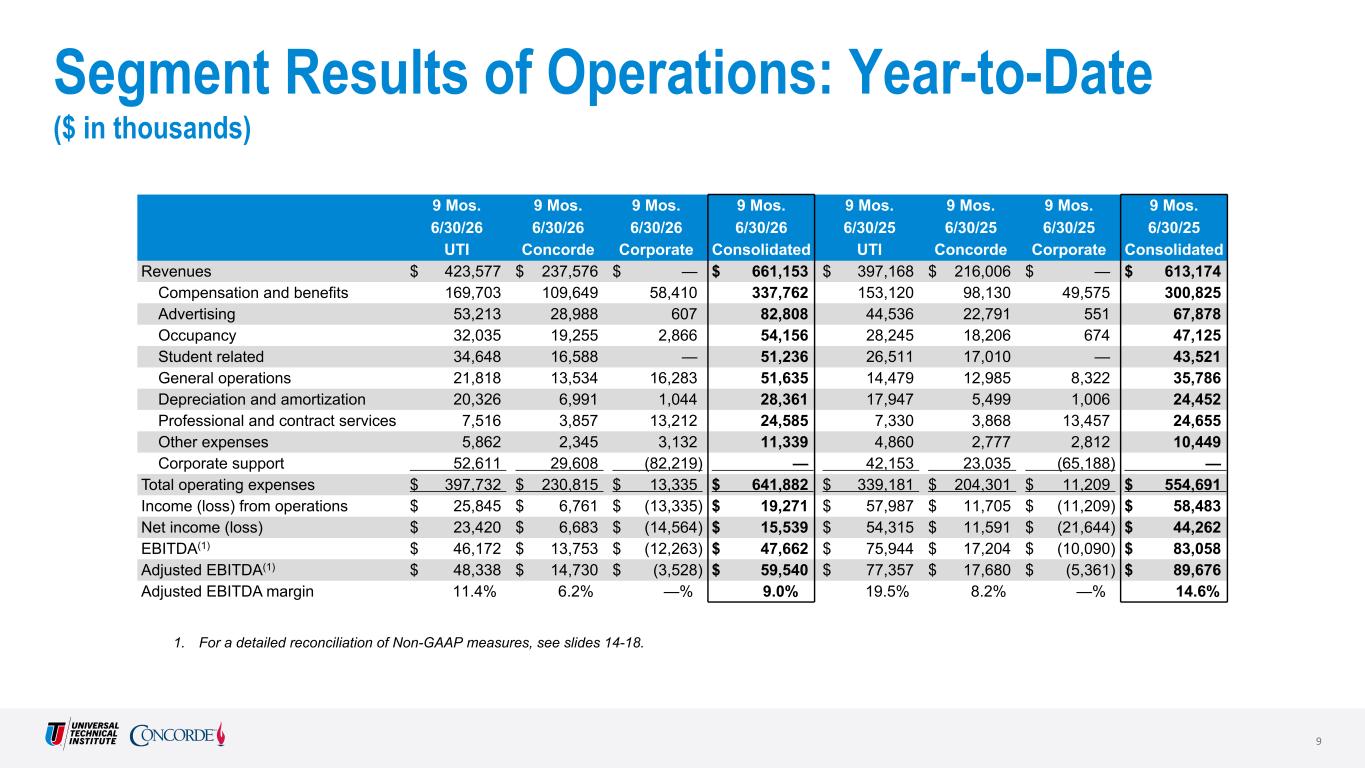
Revenues increased 7.8% to $661.2 million compared to $613.2 million.
Operating expenses increased by 15.7% to $641.9 million compared to $554.7 million primarily due to the growth in both UTI and Concorde average full-time active students and costs associated with new campus launches and program expansions currently underway or completed over the last year.
Operating income decreased 67.0% to $19.3 million compared to $58.5 million primarily due to strategic growth expenses.
Net income decreased 64.9% to $15.5 million compared to $44.3 million primarily due to strategic growth expenses.
Basic and diluted EPS were $0.28 compared to $0.82 and $0.80, respectively.
Adjusted EBITDA(1) decreased 33.6% to $59.5 million compared to $89.7 million due to approximately $27.6 million in strategic growth investments.
Average full-time active students increased 6.7%, with total new student starts of 19,360 compared to 17,684.

Balance Sheet and Liquidity
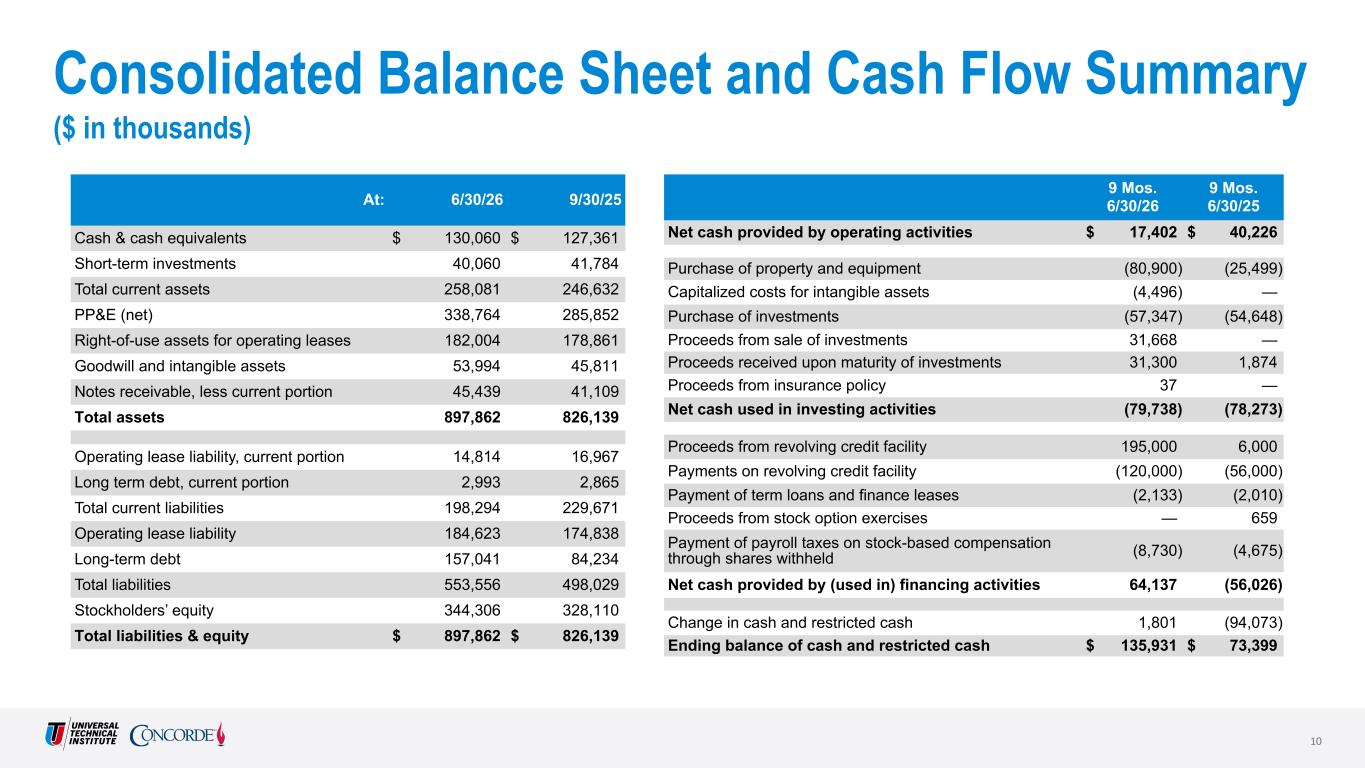
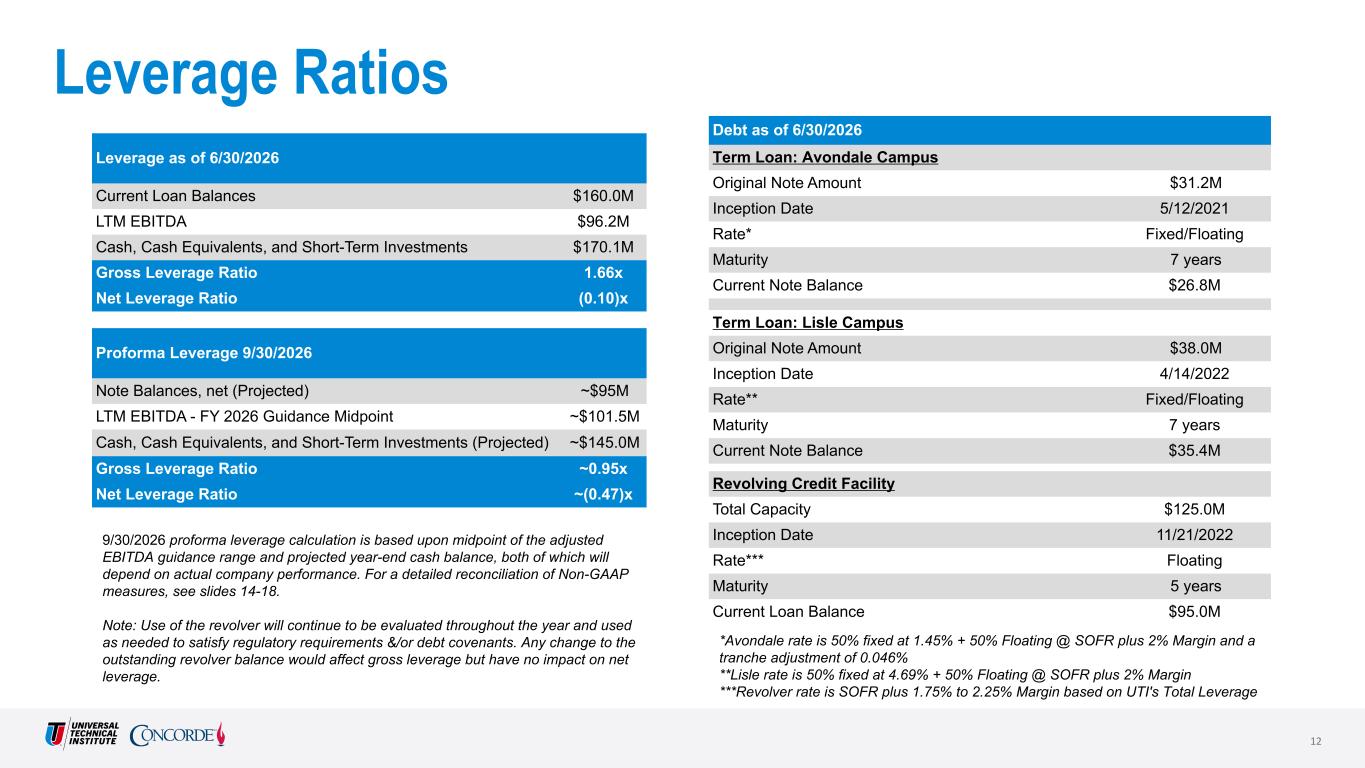
At June 30, 2026, total available liquidity was $180.5 million including cash and cash equivalents, short-term investments, and capacity from our revolving credit facility. Total debt at June 30, 2026 was $160.0 million, including $95.0 million drawn on the revolving credit facility. As of June 30, 2026, the Company incurred $85.4 million of cash capital expenditures ("capex") driven primarily by investments in new campus and program expansions for both UTI and Concorde, along with spending associated with curriculum and equipment refresh and upgrades, facility and leasehold improvements and IT investments.

2


Updated Fiscal 2026 Financial Outlook
PreviousUpdated
FY 2026
FY 2026
($ in millions, except EPS)GuidanceGuidance
New student starts31,500 - 33,00031,900 - 32,300
Revenue$905 - 915$893 - 900
Net Income$40 - 45$32 - 36
Diluted EPS$0.71 - 0.80$0.57 - 0.64
Adjusted EBITDA(1)
$114 - 119$100 - 103
Adjusted free cash flow(1)(2)
$20 - 25$(20) - 0
(1)    See the "Use of Non-GAAP Financial Information" below. For a detailed reconciliation of the non-GAAP measures, see the tables following the earnings release.
(2)    For FY 2026, assumes approximately $110 million of cash capex, including investments for new campus launches and program expansions, and maintenance capex.
For the Company’s most recent investor presentation and quarterly financial supplement, please see its investor relations website at https://investor.uti.edu.
Conference Call
Management will hold a conference call to discuss the financial results for the fiscal 2026 third quarter ended June 30, 2026, on Wednesday, August 5, 2026, at 4:30 p.m. ET.
To participate in the live call, investors are invited to dial (844) 881-0138 (domestic) or (412) 317-6790 (international). A live webcast of the call will be available via the Universal Technical Institute, Inc. investor relations website at https://investor.uti.edu. Please go to the website at least 10 minutes early to register, download and install any necessary audio software. The conference call webcast will be archived for fourteen days at https://investor.uti.edu. Alternatively, the telephone replay can be accessed through August 19, 2026, by dialing (855) 669-9658 (domestic) or (412) 317-0088 (international) and entering passcode 2037119.

Use of Non-GAAP Financial Information
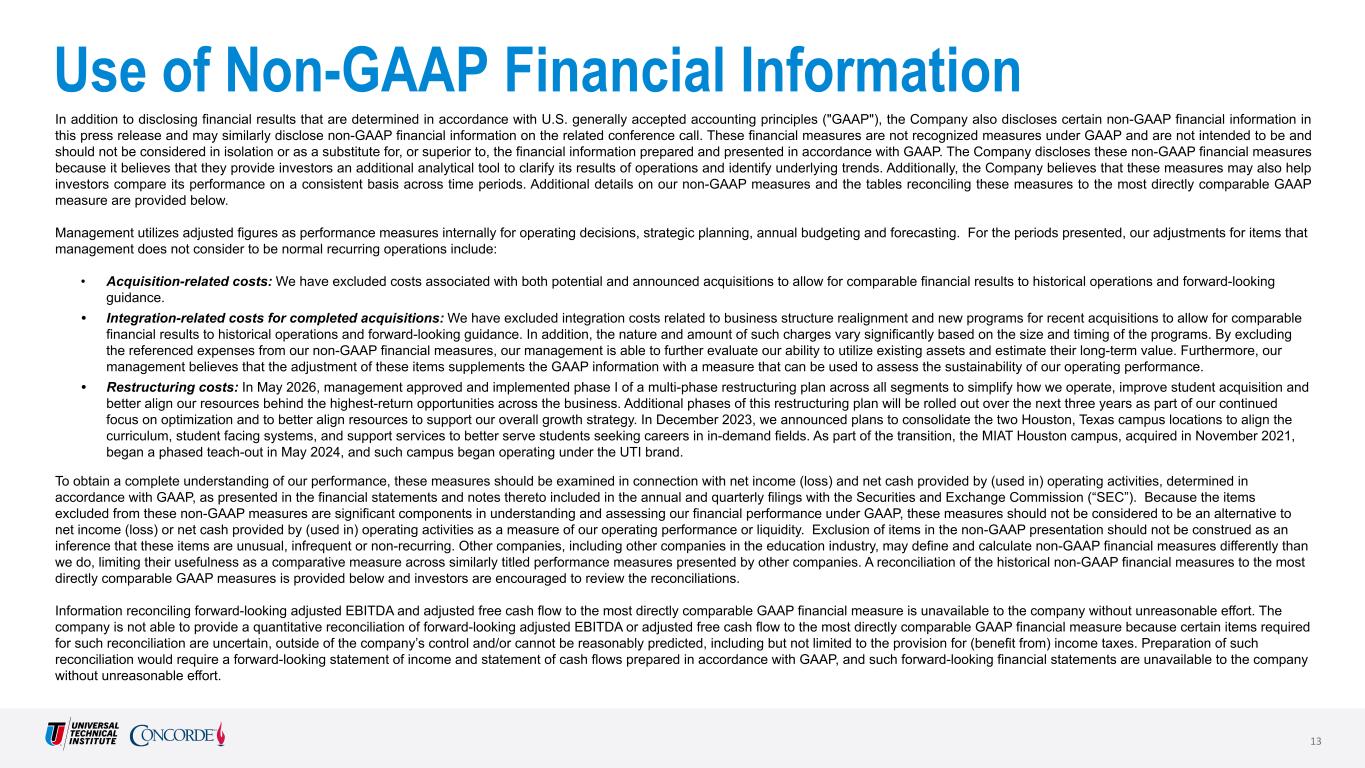
In addition to disclosing financial results that are determined in accordance with U.S. generally accepted accounting principles ("GAAP"), the Company also discloses certain non-GAAP financial information in this press release and may similarly disclose non-GAAP financial information on the related conference call. These financial measures are not recognized measures under GAAP and are not intended to be and should not be considered in isolation or as a substitute for, or superior to, the financial information prepared and presented in accordance with GAAP. The Company discloses these non-GAAP financial measures because it believes that they provide investors an additional analytical tool to clarify its results of operations and identify underlying trends. Additionally, the Company believes that these measures may also help investors compare its performance on a consistent basis across time periods. Additional details on our non-GAAP measures and the tables reconciling these measures to the most directly comparable GAAP measure are provided below.
Adjusted EBITDA: The Company defines adjusted EBITDA as net income (loss) before interest expense, interest income, income taxes, depreciation and amortization, adjusted for stock-based compensation expense and items not considered normal recurring operations.
Adjusted Free Cash Flow: The Company defines adjusted free cash flow as net cash provided by (used in) operating activities less capital expenditures, adjusted for items not considered normal recurring operations.
Management utilizes adjusted figures as performance measures internally for operating decisions, strategic planning, annual budgeting and forecasting. For the periods presented, our adjustments for items that management does not consider to be normal recurring operations include:
Acquisition-related costs: We have excluded costs associated with both potential and announced acquisitions to allow for comparable financial results to historical operations and forward-looking guidance.
3


Integration-related costs for completed acquisitions: We have excluded integration costs related to business structure realignment and new programs for recent acquisitions to allow for comparable financial results to historical operations and forward-looking guidance. In addition, the nature and amount of such charges vary significantly based on the size and timing of the programs. By excluding the referenced expenses from our non-GAAP financial measures, our management is able to further evaluate our ability to utilize existing assets and estimate their long-term value. Furthermore, our management believes that the adjustment of these items supplements the GAAP information with a measure that can be used to assess the sustainability of our operating performance.
Restructuring costs: In May 2026, management approved and implemented phase I of a multi-phase restructuring plan across all segments to simplify how we operate, improve student acquisition and better align our resources behind the highest-return opportunities across the business. Additional phases of this restructuring plan will be rolled out over the next three years as part of our continued focus on optimization and to better align resources to support our overall growth strategy. In December 2023, we announced plans to consolidate the two Houston, Texas campus locations to align the curriculum, student facing systems, and support services to better serve students seeking careers in in-demand fields. As part of the transition, the MIAT Houston campus, acquired in November 2021, began a phased teach-out in May 2024, and such campus began operating under the UTI brand.
To obtain a complete understanding of our performance, these measures should be examined in connection with net income (loss) and net cash provided by (used in) operating activities, determined in accordance with GAAP, as presented in the financial statements and notes thereto included in the annual and quarterly filings with the Securities and Exchange Commission (“SEC”). Because the items excluded from these non-GAAP measures are significant components in understanding and assessing our financial performance under GAAP, these measures should not be considered to be an alternative to net income (loss) or net cash provided by (used in) operating activities as a measure of our operating performance or liquidity. Exclusion of items in the non-GAAP presentation should not be construed as an inference that these items are unusual, infrequent or non-recurring. Other companies, including other companies in the education industry, may define and calculate non-GAAP financial measures differently than we do, limiting their usefulness as a comparative measure across similarly titled performance measures presented by other companies. A reconciliation of the historical non-GAAP financial measures to the most directly comparable GAAP measures is provided below and investors are encouraged to review the reconciliations.

Forward Looking Statements
All statements contained in this press release and the related conference call, other than statements of historical fact, are "forward-looking" statements within the meaning of the safe harbor from civil liability provided for such statements by the Private Securities Litigation Reform Act of 1995 (set forth in Section 27A of the Securities Act of 1933, as amended, and Section 21E of the Securities Exchange Act of 1934, as amended). These forward-looking statements which address our expected future business and financial performance, may contain words such as "goal," "target," "future," "estimate," "expect," "anticipate," "intend," "plan," "believe," "seek," "project," "may," "should," "will," the negative form of these expressions or similar expressions. Examples of forward-looking statements include, among others, statements regarding (1) the Company’s expectation that it will meet its fiscal year 2026 guidance for new student start growth, revenue growth, net income, diluted earnings per share, Adjusted EBITDA and Adjusted Free Cash Flow; (2) the Company’s expectation that it will continue to expand its value proposition and build a business that can grow in double digits with potential upside, regardless of the economic environment; and (3) the Company’s expectation that it will succeed in new program launches next year. Forward-looking statements are neither historical facts nor assurances of future performance. Instead, they are based only on the Company’s current beliefs, expectations and assumptions regarding the future of its business, future plans and strategies, projections, anticipated events and trends, the economy and other future conditions. Because forward-looking statements relate to the future, they are subject to inherent uncertainties, risks and changes in circumstances that are difficult to predict and many of which are outside of our control. Our actual results and financial condition may differ materially from those indicated in the forward-looking statements. Therefore, you should not rely on any of these forward-looking statements. Important factors that could affect our actual results include, among other things, failure of our schools to comply with the extensive regulatory requirements for school operations; shifts in higher education laws, regulation and policy at the federal and state levels; our failure to maintain eligibility for or our ability to process federal student financial assistance funds; the effect of current and future Title IV Program regulations arising out of negotiated rulemakings, including any
4


potential reductions in funding or restrictions on the use of funds received through Title IV Programs; the effect of future legislative or regulatory initiatives related to veterans’ benefit programs; continued Congressional examination of the for-profit education sector; regulatory investigations of, or actions commenced against, us or other companies in our industry; our failure to execute on our growth and diversification strategy, including effectively identifying, establishing and operating additional schools, programs or campuses; our failure to realize the expected benefits of our acquisitions, or our failure to successfully integrate our acquisitions.; our failure to improve underutilized capacity at certain of our campuses; enrollment declines or challenges in our students’ ability to find employment as a result of macroeconomic conditions; our failure to maintain and expand existing industry relationships and develop new industry relationships; our ability to update and expand the content of existing programs and develop and integrate new programs in a timely and cost-effective manner while maintaining positive student outcomes; a loss of our senior management or other key employees; failure to comply with the restrictive covenants and our ability to pay the amounts when due under the credit agreement; the effect of our principal stockholder owning a significant percentage of our capital stock, and thus being able to influence certain corporate matters and the potential in the future to gain substantial control over our company; the effect of public health pandemics, epidemics or outbreak, including COVID-19, and other risks that are described from time to time in our public filings. Further information on these and other potential factors that could affect the financial results or condition may be found in the company's filings with the SEC. Any forward-looking statements made by us in this press release and the related conference call are based only on information currently available to us and speak only as of the date on which it is made. We expressly disclaim any obligation to publicly update any forward-looking statements, whether written or oral, that may be made from time to time, whether as a result of new information, future developments, changes in expectations, any changes in events, conditions or circumstances, or otherwise.

Social Media Disclosure
Universal Technical Institute, Inc uses its websites (https://www.uti.edu/, https://concorde.edu, and https://investor.uti.edu/) and LinkedIn pages (https://www.linkedin.com/school/universal-technical-institute/ and https://www.linkedin.com/school/concorde-career-colleges/) as channels of distribution of information about its programs, its planned financial and other announcements, its attendance at upcoming investor and industry conferences, and other matters. Such information may be deemed material information, and the Company may use these channels to comply with its disclosure obligations under Regulation FD. Therefore, investors should monitor the company's website and its social media accounts in addition to following the company's press releases, SEC filings, public conference calls, and webcasts.

About Universal Technical Institute, Inc.
Founded in 1965, Universal Technical Institute, Inc. (NYSE: UTI) is a national leader in workforce solutions for transportation, skilled trades, healthcare and dental education programs. The company’s industry-aligned programs are offered at 35 campuses nationwide and online under the brands Universal Technical Institute (UTI) and Concorde Career Colleges and include auto/diesel, aviation, welding, HVACR, electrical and energy, allied health, dental, nursing, patient care and diagnostic training. For more information, visit www.uti.edu or www.concorde.edu; LinkedIn at @UniversalTechnicalInstitute and @Concorde Career Colleges; or X at @news_UTI and @ConcordeCareer.

Company Contact:
Matt Kempton
VP Corporate Finance & Investor Relations
Universal Technical Institute, Inc.
(623) 445-9392
[email protected]


5


Media Contact:
Susan Aspey
Vice President, Corporate Affairs & External Communications
Universal Technical Institute, Inc.
(202) 549-0534
[email protected]

Investor Relations Contact:
Matt Glover or Ralf Esper
Gateway Group, Inc.
(949) 574-3860
[email protected]

(Tables Follow)
6


UNIVERSAL TECHNICAL INSTITUTE, INC. AND SUBSIDIARIES
CONDENSED CONSOLIDATED STATEMENTS OF OPERATIONS
(In thousands, except per share amounts)
(Unaudited)


Three Months Ended June 30,Nine Months Ended June 30,
2026202520262025
Revenues$218,907 $204,298 $661,153 $613,174 
Operating expenses:
Educational services and facilities118,334 105,604 346,211 308,233 
Selling, general and administrative97,328 84,542 295,671 246,458 
Total operating expenses215,662 190,146 641,882 554,691 
Income from operations3,245 14,152 19,271 58,483 
Other income (expense):
Interest income764 1,445 3,370 4,833 
Interest expense(1,013)(1,394)(2,977)(4,724)
Other income (expense), net103 149 30 123 
Total other (expense) income, net(146)200 423 232 
Income before income taxes3,099 14,352 19,694 58,715 
Income tax expense(820)(3,689)(4,155)(14,453)
Net income$2,279 $10,663 $15,539 $44,262 
Earnings per share:
Net income per share - basic$0.04 $0.20 $0.28 $0.82 
Net income per share - diluted$0.04 $0.19 $0.28 $0.80 
Weighted average number of shares outstanding:
Basic55,075 54,412 54,891 54,260 
Diluted55,935 55,635 55,818 55,502 


7


UNIVERSAL TECHNICAL INSTITUTE, INC. AND SUBSIDIARIES
CONDENSED CONSOLIDATED BALANCE SHEETS
(In thousands, except par value and per share amounts)
(Unaudited)

June 30, 2026September 30, 2025
Assets
Cash and cash equivalents$130,060 $127,361 
Restricted cash5,871 6,769 
Short-term investments40,060 41,784 
Receivables, net49,824 46,078 
Notes receivable, current portion6,707 6,597 
Prepaid expenses17,456 12,526 
Other current assets8,103 5,517 
Total current assets258,081 246,632 
Property and equipment, net338,764 285,852 
Goodwill28,459 28,459 
Intangible assets, net25,535 17,352 
Notes receivable, less current portion45,439 41,109 
Right-of-use assets for operating leases182,004 178,861 
Deferred tax assets, net2,324 4,283 
Other assets17,256 23,591 
Total assets$897,862 $826,139 
Liabilities and Shareholders’ Equity
Accounts payable and accrued expenses$105,763 $104,644 
Deferred revenue70,720 91,525 
Operating lease liabilities, current portion14,814 16,967 
Long-term debt, current portion2,993 2,865 
Other current liabilities4,004 13,670 
Total current liabilities198,294 229,671 
Deferred tax liabilities, net4,144 4,144 
Operating lease liabilities184,623 174,838 
Long-term debt157,041 84,234 
Other liabilities9,454 5,142 
Total liabilities553,556 498,029 
Commitments and contingencies
Shareholders’ equity:
Common stock, $0.0001 par value, 100,000 shares authorized, 55,177 and 54,512 shares issued, 55,095 and 54,430 shares outstanding as of June 30, 2026 and September 30, 2025, respectively.
Paid-in capital226,727 226,031 
Treasury stock, at cost, 82 shares as of June 30, 2026 and September 30, 2025.
(365)(365)
Retained earnings117,066 101,527 
Accumulated other comprehensive income 872 912 
Total shareholders’ equity344,306 328,110 
Total liabilities and shareholders’ equity$897,862 $826,139 
8


UNIVERSAL TECHNICAL INSTITUTE, INC. AND SUBSIDIARIES
CONDENSED CONSOLIDATED STATEMENTS OF CASH FLOWS
(In thousands)
(Unaudited)

Nine Months Ended June 30,
20262025
Cash flows from operating activities:
Net income $15,539 $44,262 
Adjustments to reconcile net income to net cash provided by operating activities:
Depreciation and amortization28,361 24,452 
Amortization of right-of-use assets for operating leases19,656 17,492 
Provision for credit losses22,403 15,063 
Stock-based compensation9,426 6,402 
Deferred income taxes1,999 579 
Training equipment credits earned, net487 (108)
Unrealized gain (loss) on interest rate swaps, net of taxes121 (92)
Other gains (losses), net545 1,179 
Changes in assets and liabilities:
Receivables(26,477)(21,895)
Prepaid expenses and other current assets(11,684)(4,499)
Other assets2,155 (5,383)
Notes receivable(4,440)(4,051)
Accounts payable, accrued expenses and other current liabilities4,371 6,455 
Deferred revenue(20,805)(25,495)
Income tax payable/receivable(7,064)3,598 
Operating lease liabilities(15,167)(16,758)
Other liabilities(2,024)(975)
Net cash provided by operating activities17,402 40,226 
Cash flows from investing activities:
Purchase of property and equipment(80,900)(25,499)
Capitalized costs for intangible assets(4,496)— 
Purchase of investments(57,347)(54,648)
Proceeds from sale of investments31,668 — 
Proceeds received upon maturity of investments31,300 1,874 
Proceeds from insurance policy37 — 
Net cash used in investing activities(79,738)(78,273)
Cash flows from financing activities:
Proceeds from revolving credit facility195,000 6,000 
Payments on revolving credit facility(120,000)(56,000)
Payment of term loans and finance leases(2,133)(2,010)
Proceeds from stock option exercises— 659 
Payment of payroll taxes on stock-based compensation through shares withheld(8,730)(4,675)
Net cash provided by (used in) financing activities64,137 (56,026)
Change in cash, cash equivalents and restricted cash1,801 (94,073)
Cash and cash equivalents, beginning of period127,361 161,900 
Restricted cash, beginning of period6,769 5,572 
Cash, cash equivalents and restricted cash, beginning of period134,130 167,472 
Cash and cash equivalents, end of period130,060 70,672 
Restricted cash, end of period5,871 2,727 
Cash, cash equivalents and restricted cash, end of period$135,931 $73,399 

9


UNIVERSAL TECHNICAL INSTITUTE, INC. AND SUBSIDIARIES
SELECTED SUPPLEMENTAL NON-FINANCIAL AND FINANCIAL INFORMATION BY SEGMENT
(In thousands, except for Student Metrics)
(Unaudited)


Student Metrics
Three Months Ended June 30, 2026Three Months Ended June 30, 2025
UTIConcordeTotalUTIConcordeTotal
Total new student starts3,491 2,851 6,342 2,829 2,892 5,721 
Year-over-year growth23.4 %(1.4)%10.9 %(3.0)%9.1 %2.8 %
Average full-time active students14,767 10,364 25,131 14,205 9,552 23,757 
Year-over-year growth4.0 %8.5 %5.8 %8.9 %18.8 %12.7 %
End of period full-time active students14,602 9,806 24,408 13,874 8,495 22,369 
Year-over-year growth5.2 %15.4 %9.1 %9.4 %14.1 %11.1 %


Nine Months Ended June 30, 2026Nine Months Ended June 30, 2025
UTIConcordeTotalUTIConcordeTotal
Total new student starts10,4948,86619,3609,1738,51117,684
Year-over-year growth14.4%4.2%9.5%13.7%16.2%14.9%
Average full-time active students15,55710,56826,12514,8159,65924,474
Year-over-year growth5.0%9.4%6.7%7.9%16.9%11.3%
End of period full-time active students14,6029,80624,40813,8748,49522,369
Year-over-year growth5.2%15.4%9.1%9.4%14.1%11.1%

10


UNIVERSAL TECHNICAL INSTITUTE, INC. AND SUBSIDIARIES
SELECTED SUPPLEMENTAL NON-FINANCIAL AND FINANCIAL INFORMATION BY SEGMENT
(In thousands)
(Unaudited)


Financial Summary by Segment and Consolidated

As part of Phase II of our North Star growth strategy and to support our new campus growth initiatives, we have further refined our operating model to best pursue future growth goals and support the business. In furtherance of the foregoing, we have centralized the operations of our accounting, finance, information technology, human resources, and real estate departments to leverage economies of scale and create efficiencies to support our continued growth. Due to this centralization, as of October 1, 2025, we have adjusted our allocation methodology to allocate the majority of the Corporate segment’s costs to the UTI and Concorde segments based upon a percentage of revenue. Due to these changes in allocation methodology, the prior year segment disclosures have been recast for comparability to the current year presentation.

Three Months Ended June 30, 2026Three Months Ended June 30, 2025
UTIConcordeCorporateConsolidatedUTIConcordeCorporateConsolidated
Revenue$138,015 $80,892 $— $218,907 $131,462 $72,836 $— $204,298 
Total operating expenses132,201 77,721 5,740 215,662 113,737 71,713 4,696 190,146 
Net income (loss)5,020 3,130 (5,871)2,279 16,439 1,084 (6,860)10,663 


Nine Months Ended June 30, 2026Nine Months Ended June 30, 2025
UTIConcordeCorporateConsolidatedUTIConcordeCorporateConsolidated
Revenue$423,577 $237,576 $— $661,153 $397,168 $216,006 $— $613,174 
Total operating expenses397,732 230,815 13,335 641,882 339,181 204,301 11,209 554,691 
Net income (loss)23,420 6,683 (14,564)15,539 54,315 11,591 (21,644)44,262 

11


UNIVERSAL TECHNICAL INSTITUTE, INC. AND SUBSIDIARIES
SELECTED SUPPLEMENTAL NON-FINANCIAL AND FINANCIAL INFORMATION BY SEGMENT
(In thousands)
(Unaudited)


Major Expense Categories by Segment and Consolidated

Three Months Ended June 30, 2026
UTIConcordeCorporateConsolidated
Operating Expenses
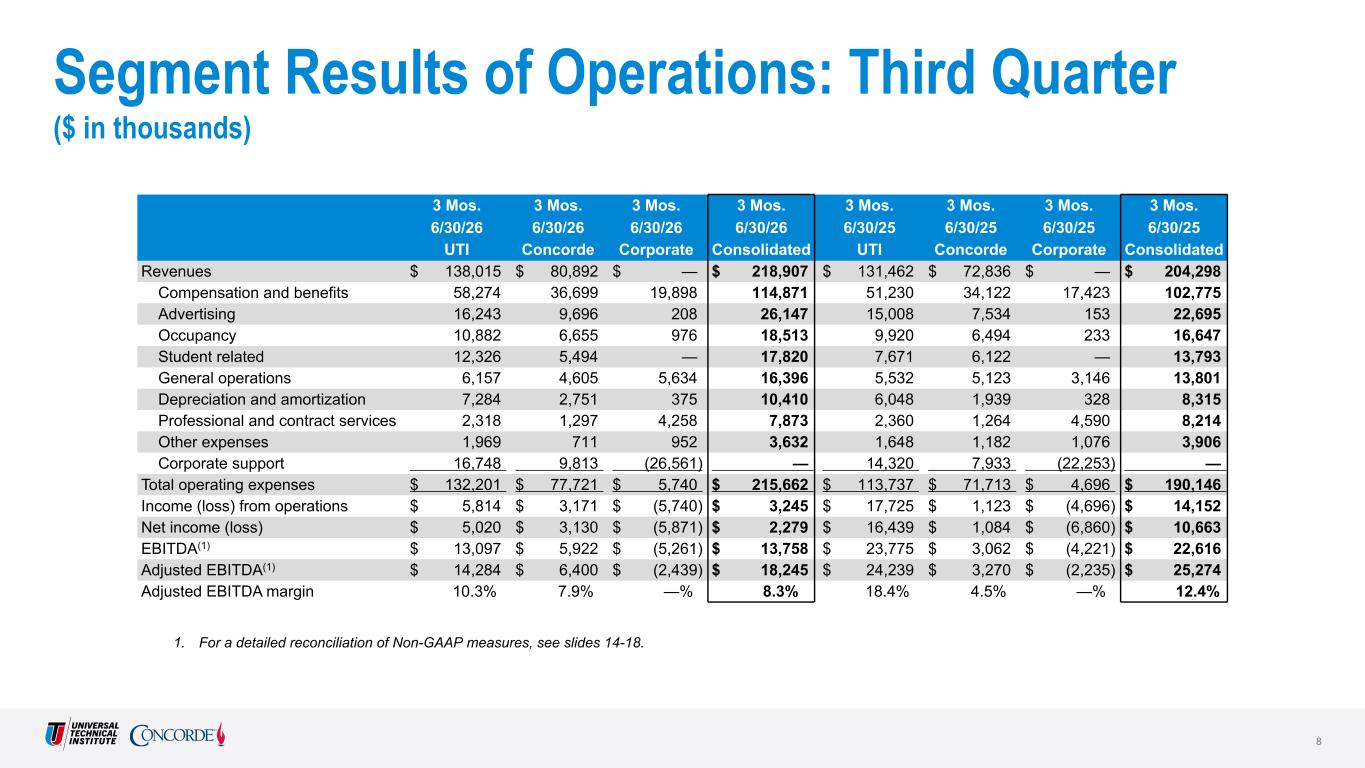
Compensation and benefits$58,274 $36,699 $19,898 $114,871 
Advertising16,243 9,696 208 26,147 
Occupancy10,882 6,655 976 18,513 
Student related12,326 5,494 — 17,820 
General operations6,157 4,605 5,634 16,396 
Depreciation and amortization7,284 2,751 375 10,410 
Professional and contract services2,318 1,297 4,258 7,873 
Other expenses1,969 711 952 3,632 
Corporate support16,748 9,813 (26,561)— 
Total Operating Expenses$132,201 $77,721 $5,740 $215,662 

Three Months Ended June 30, 2025
UTIConcordeCorporateConsolidated
Operating Expenses
Compensation and benefits$51,230 $34,122 $17,423 $102,775 
Advertising15,008 7,534 153 22,695 
Occupancy9,920 6,494 233 16,647 
Student related7,671 6,122 — 13,793 
General operations5,532 5,123 3,146 13,801 
Depreciation and amortization6,048 1,939 328 8,315 
Professional and contract services2,360 1,264 4,590 8,214 
Other expenses1,648 1,182 1,076 3,906 
Corporate support14,320 7,933 (22,253)— 
Total Operating Expenses$113,737 $71,713 $4,696 $190,146 

12


UNIVERSAL TECHNICAL INSTITUTE, INC. AND SUBSIDIARIES
SELECTED SUPPLEMENTAL NON-FINANCIAL AND FINANCIAL INFORMATION BY SEGMENT
(In thousands)
(Unaudited)


Major Expense Categories by Segment and Consolidated

Nine Months Ended June 30, 2026
UTIConcordeCorporateConsolidated
Operating Expenses
Compensation and benefits$169,703 $109,649 $58,410 $337,762 
Advertising53,213 28,988 607 82,808 
Occupancy32,035 19,255 2,866 54,156 
Student related34,648 16,588 — 51,236 
General operations21,818 13,534 16,283 51,635 
Depreciation and amortization20,326 6,991 1,044 28,361 
Professional and contract services7,516 3,857 13,212 24,585 
Other expenses5,862 2,345 3,132 11,339 
Corporate support52,611 29,608 (82,219)— 
Total Operating Expenses$397,732 $230,815 $13,335 $641,882 


Nine Months Ended June 30, 2025
UTIConcordeCorporateConsolidated
Operating Expenses
Compensation and benefits$153,120 $98,130 $49,575 $300,825 
Advertising44,536 22,791 551 67,878 
Occupancy28,245 18,206 674 47,125 
Student related26,511 17,010 — 43,521 
General operations14,479 12,985 8,322 35,786 
Depreciation and amortization17,947 5,499 1,006 24,452 
Professional and contract services7,330 3,868 13,457 24,655 
Other expenses4,860 2,777 2,812 10,449 
Corporate support42,153 23,035 (65,188)— 
Total Operating Expenses$339,181 $204,301 $11,209 $554,691 
13


UNIVERSAL TECHNICAL INSTITUTE, INC. AND SUBSIDIARIES
RECONCILIATION OF GAAP FINANCIAL INFORMATION TO NON-GAAP FINANCIAL INFORMATION
(In thousands)
(Unaudited)


Reconciliation of Net Income (Loss) to EBITDA and Adjusted EBITDA

Three Months Ended June 30, 2026
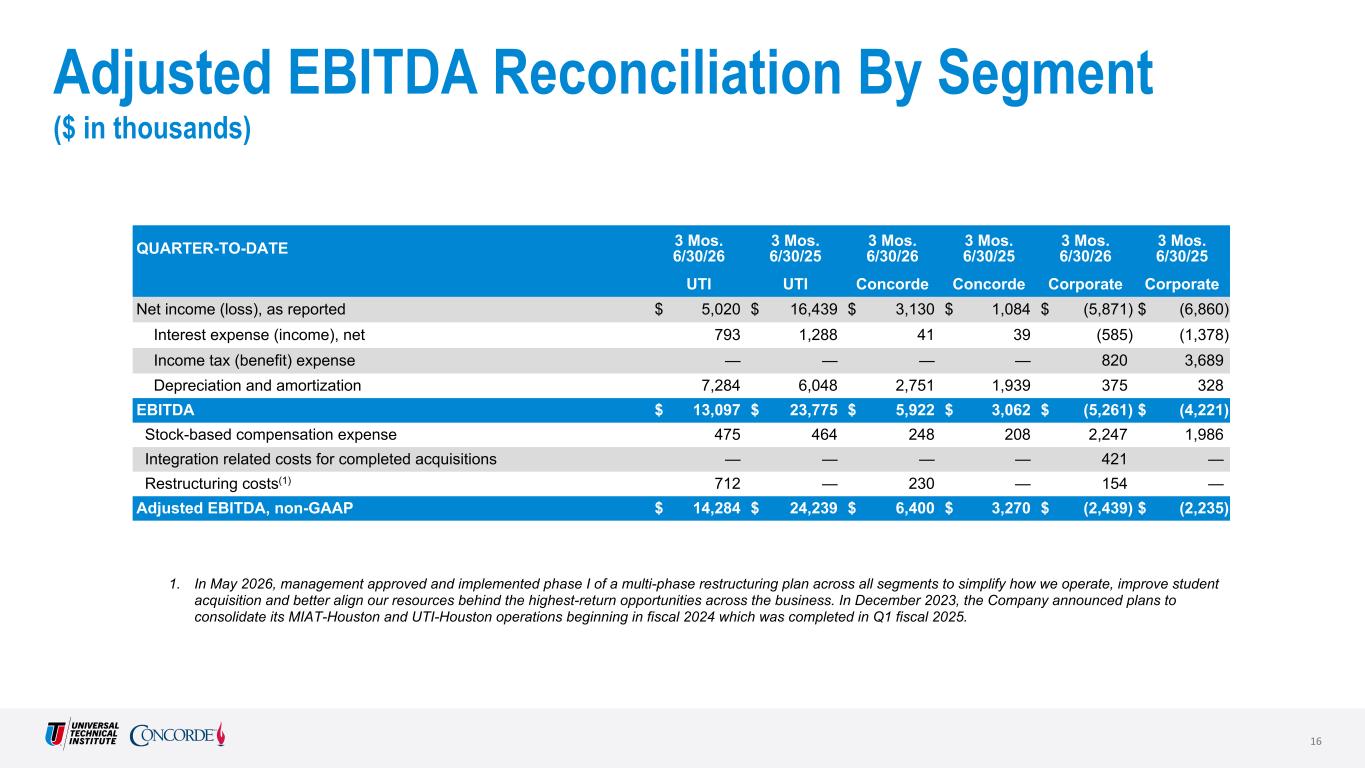
UTIConcordeCorporateConsolidated
Net income (loss)$5,020 $3,130 $(5,871)$2,279 
Interest expense (income), net793 41 (585)249 
Income tax expense— — 820 820 
Depreciation and amortization7,284 2,751 375 10,410 
EBITDA13,097 5,922 (5,261)13,758 
Stock-based compensation expense475 248 2,247 2,970 
Integration-related costs for completed acquisitions— — 421 421 
Restructuring costs712 230 154 1,096 
Adjusted EBITDA, non-GAAP$14,284 $6,400 $(2,439)$18,245 


Three Months Ended June 30, 2025
UTIConcordeCorporateConsolidated
Net income (loss)$16,439 $1,084 $(6,860)$10,663 
Interest expense (income), net1,288 39 (1,378)(51)
Income tax expense— — 3,689 3,689 
Depreciation and amortization6,048 1,939 328 8,315 
EBITDA23,775 3,062 (4,221)22,616 
Stock-based compensation expense464 208 1,986 2,658 
Adjusted EBITDA, non-GAAP$24,239 $3,270 $(2,235)$25,274 


14


UNIVERSAL TECHNICAL INSTITUTE, INC. AND SUBSIDIARIES
RECONCILIATION OF GAAP FINANCIAL INFORMATION TO NON-GAAP FINANCIAL INFORMATION
(In thousands)
(Unaudited)


Reconciliation of Net Income (Loss) to EBITDA and Adjusted EBITDA


Nine Months Ended June 30, 2026
UTIConcordeCorporateConsolidated
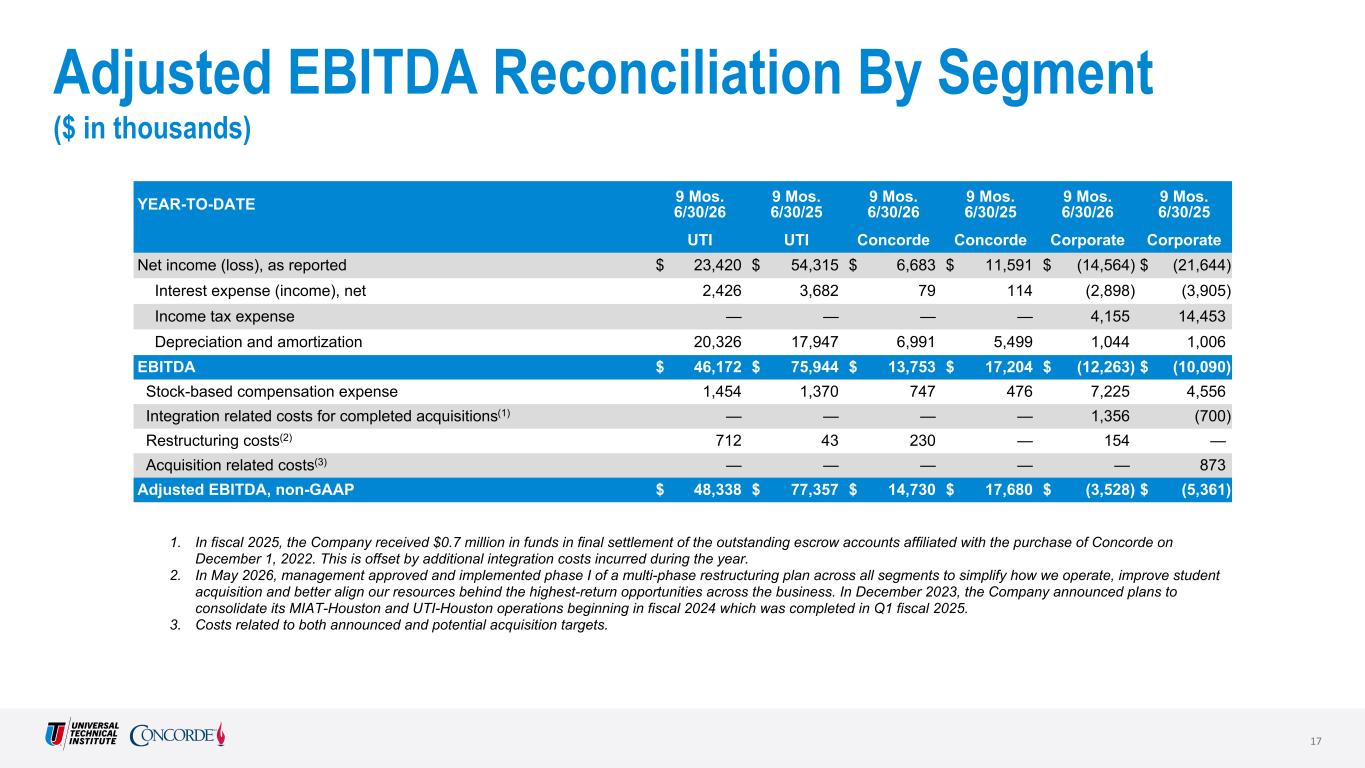
Net income (loss)$23,420 $6,683 $(14,564)$15,539 
Interest expense (income), net2,426 79 (2,898)(393)
Income tax expense— — 4,155 4,155 
Depreciation and amortization20,326 6,991 1,044 28,361 
EBITDA46,172 13,753 (12,263)47,662 
Stock-based compensation expense1,454 747 7,225 9,426 
Integration-related costs for completed acquisitions— — 1,356 1,356 
Restructuring costs712 230 154 1,096 
Adjusted EBITDA, non-GAAP$48,338 $14,730 $(3,528)$59,540 


Nine Months Ended June 30, 2025
UTIConcordeCorporateConsolidated
Net income (loss)$54,315 $11,591 $(21,644)$44,262 
Interest expense (income), net3,682 114 (3,905)(109)
Income tax expense— — 14,453 14,453 
Depreciation and amortization17,947 5,499 1,006 24,452 
EBITDA75,944 17,204 (10,090)83,058 
Stock-based compensation expense1,370 476 4,556 6,402 
Acquisition-related costs— — 873 873 
Integration-related costs for completed acquisitions(1)
— — (700)(700)
Restructuring costs43 — — 43 
Adjusted EBITDA, non-GAAP$77,357 $17,680 $(5,361)$89,676 

(1)    During the nine months ended June 30, 2025, the Company received $0.7 million in funds in final settlement of the outstanding escrow accounts affiliated with the purchase of Concorde on December 1, 2022.

15


UNIVERSAL TECHNICAL INSTITUTE, INC. AND SUBSIDIARIES
RECONCILIATION OF GAAP FINANCIAL INFORMATION TO NON-GAAP FINANCIAL INFORMATION
(In thousands)
(Unaudited)


Reconciliation of Net Cash Provided by Operating Activities to Adjusted Free Cash Flow

Nine Months Ended June 30,
20262025
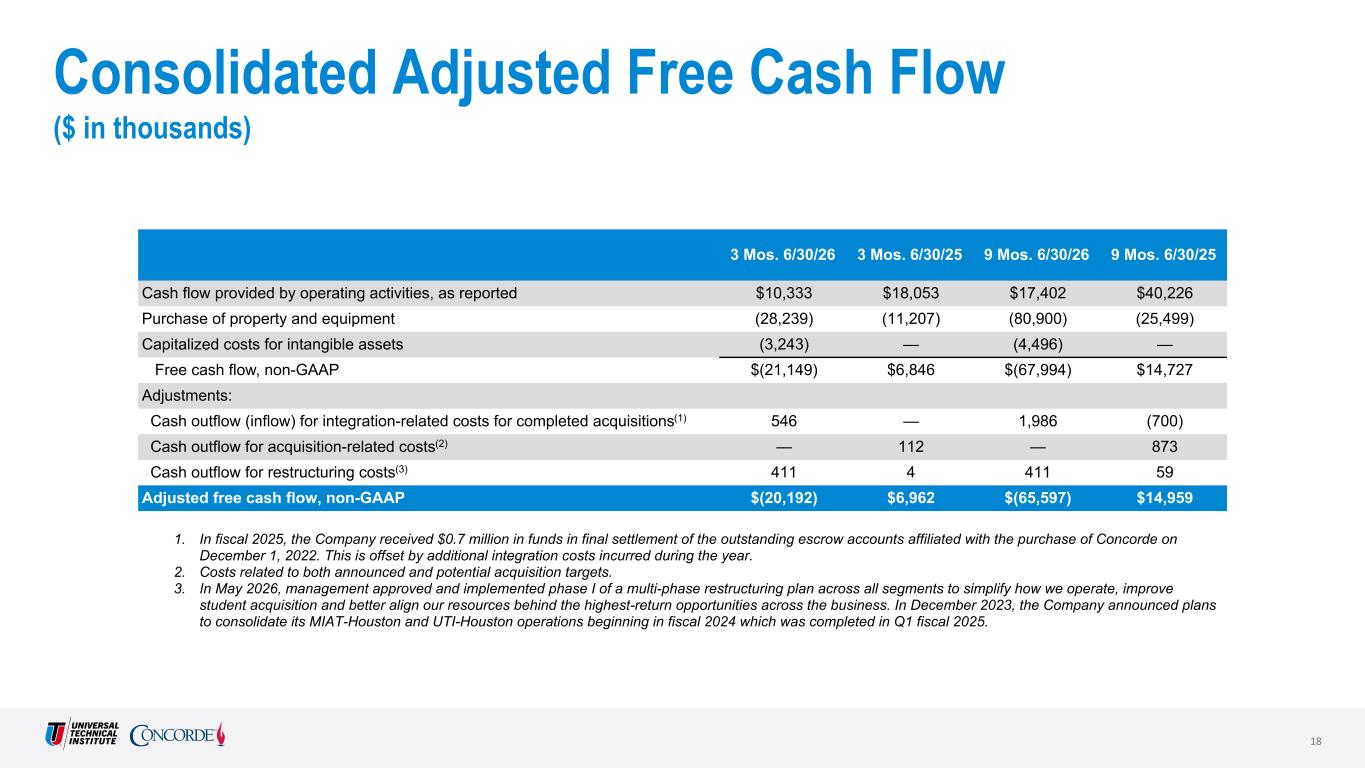
Net cash provided by operating activities, as reported$17,402 $40,226 
Purchase of property and equipment(80,900)(25,499)
Capitalized costs for intangible assets(4,496)— 
Free cash flow, non-GAAP(67,994)14,727 
Adjustments:
Cash outflow (inflow) for integration-related costs for completed acquisitions(1)
1,986 (700)
Cash outflow for acquisition-related costs— 873 
Cash outflow for restructuring costs 411 59 
Adjusted free cash flow, non-GAAP$(65,597)$14,959 

(1)    During the nine months ended June 30, 2025, the Company received $0.7 million in funds in final settlement of the outstanding escrow accounts affiliated with the purchase of Concorde on December 1, 2022.


16


UNIVERSAL TECHNICAL INSTITUTE, INC. AND SUBSIDIARIES
RECONCILIATION OF GAAP FINANCIAL INFORMATION TO NON-GAAP FINANCIAL
INFORMATION FOR UPDATED FISCAL 2026 GUIDANCE
(In thousands)
(Unaudited)

For each of the non-GAAP reconciliations provided for updated fiscal 2026 guidance, we are reconciling to the midpoint of the guidance range. The adjustments reflected below for updated fiscal 2026 are illustrative only and may change throughout the year, both in amount or the adjustments themselves.

Reconciliation of Net Income to EBITDA and Adjusted EBITDA for Fiscal 2026 Guidance
Updated
Twelve Months Ended
September 30,
2026
Net income~$34,000
Interest expense (income), net~200
Income tax expense ~12,500
Depreciation and amortization~39,500
EBITDA~86,200
Stock-based compensation expense~12,300
Integration-related costs for completed acquisitions~2,000
Restructuring costs~1,000
Adjusted EBITDA, non-GAAP~$101,500
FY 2026 Guidance Range
~$100,000 - 103,000


Reconciliation of Net Cash Provided by Operating Activities to Adjusted Free Cash Flow for Fiscal 2026 Guidance

Updated
Twelve Months Ended
September 30,
2026
Net cash provided by operating activities~$97,000
Purchase of property and equipment & capitalized costs for intangible assets~(110,000)
Free cash flow, non-GAAP~(13,000)
Adjustments:
Cash outflow for integration-related costs for completed acquisitions~2,000
Cash outflow for restructuring costs~1,000
Adjusted free cash flow, non-GAAP~$(10,000)
FY 2026 Guidance Range
~$(20,000) - 0


17
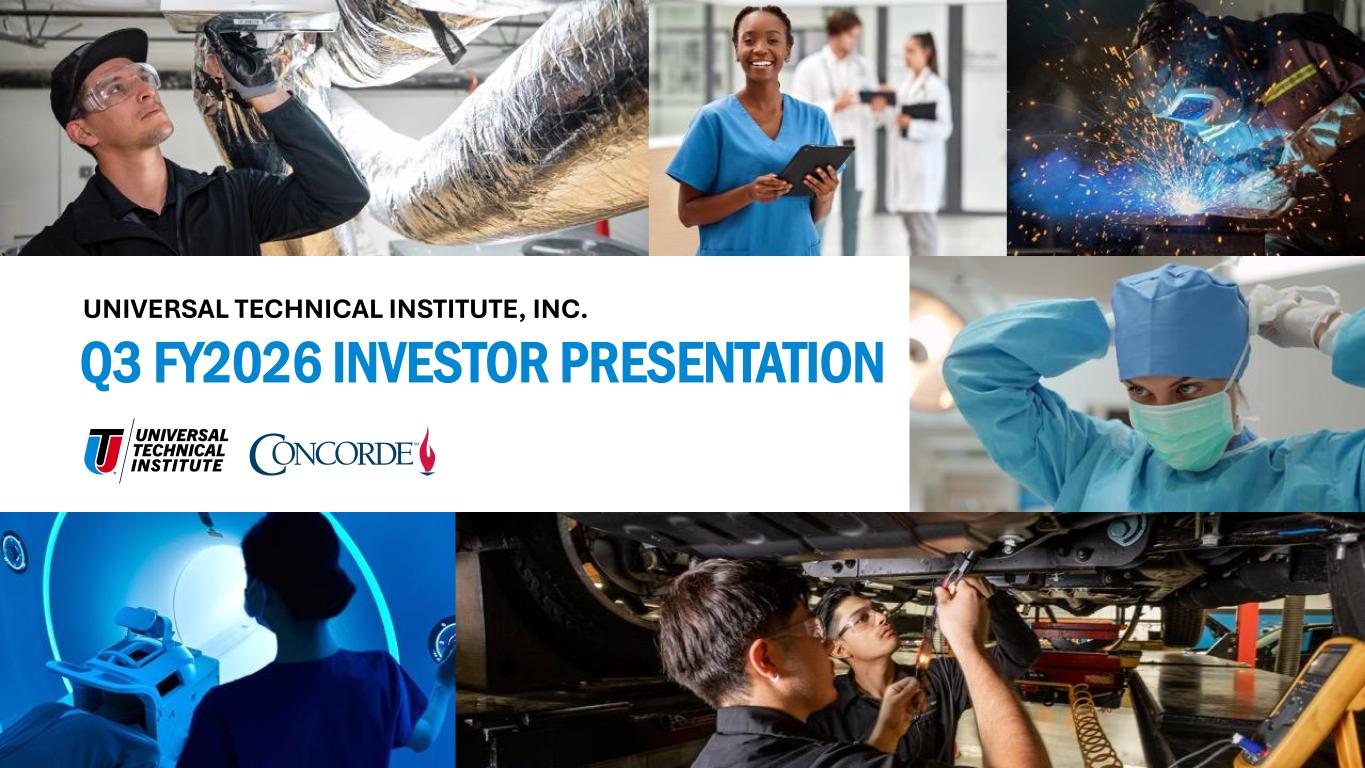
UNIVERSAL TECHNICAL INSTITUTE, INC. Q3 FY2026 INVESTOR PRESENTATION

 
This presentation contains forward-looking statements within the meaning of the safe harbor from civil liability provided for such statements by the Private Securities Litigation Reform Act of 1995 (set forth in Section 27A of the Securities Act of 1933, as amended, and Section 21E of the Securities Exchange Act of 1934, as amended). Forward-looking statements may contain words such as "goal," "target," "future," "estimate," "expect," "anticipate," "intend," "plan," "believe," "seek," "project," "may," "should," "will," the negative form of these expressions or similar expressions. These statements are based on our management’s current beliefs, expectations and assumptions about future events, conditions and results and on information currently available to us. Although we believe that the expectations reflected in the forward-looking statements are reasonable, we cannot guarantee future results, levels of activity, performance, achievements or events and circumstances reflected in the forward-looking statements will occur. Discussions containing these forward-looking statements may be found, among other places, in the sections entitled “Business,” “Risk Factors” and “Management’s Discussion and Analysis of Financial Condition and Results of Operations” incorporated by reference from our most recent Annual Report on Form 10-K, in our subsequent Quarterly Reports on Form 10-Q and certain of our Current Reports on Form 8-K, as well as any amendments thereto, filed with the Securities and Exchange Commission (the “SEC”). In addition, statements that refer to projections of earnings, revenue, costs or other financial items in future periods; anticipated growth and trends in our business or key markets; cost synergies, growth opportunities and other potential financial and operating benefits; future growth and revenues; future economic conditions and performance; anticipated performance of curriculum; plans, objectives and strategies for future operations; and other characterizations of future events or circumstances, and all other statements that are not statements of historical fact are forward-looking statements. Such statements are based on currently available operating, financial and competitive information and are subject to various risks, uncertainties and assumptions that could cause actual results to differ materially from those anticipated or implied in our forward-looking statements due to a number of factors, including, but not limited to, those set forth under the section entitled “Risk Factors” in our filings with the SEC. Important factors that could affect our actual results include, among other things, failure of our schools to comply with the extensive regulatory requirements for school operations; our failure to maintain eligibility for or our ability to process federal student financial assistance funds; the effect of current and future Title IV Program regulations arising out of negotiated rulemakings, including any potential reductions in funding or restrictions on the use of funds received through Title IV Programs; the effect of future legislative or regulatory initiatives related to veterans’ benefit programs; continued Congressional examination of the for-profit education sector; investigations of, or actions commenced against, us or other companies in our industry; changes in the state regulatory environment or budgetary constraints; our growth and diversification strategy, including effectively identifying, establishing and operating additional schools, programs or campuses; our failure to realize the expected benefits of our acquisitions, or our failure to successfully integrate our acquisitions; our failure to improve underutilized capacity at certain of our campuses; enrollment declines or challenges in our students’ ability to find employment as a result of macroeconomic conditions; our failure to maintain and expand existing industry relationships and develop new industry relationships; our ability to update and expand the content of existing programs and develop and integrate new programs in a timely and cost-effective manner while maintaining positive student outcomes; a loss of our senior management or other key employees; failure to comply with the restrictive covenants and our ability to pay the amounts when due under our credit agreement; and other risks that are described from time to time in our public filings. Given these risks, uncertainties and other factors, many of which are beyond our control, you should not place undue reliance on these forward-looking statements. Neither we nor any other person makes any representation as to the accuracy or completeness of these forward-looking statements and, except as required by law, we assume no obligation to update these forward-looking statements publicly, or to revise any forward-looking statements, even if new information becomes available in the future. This presentation also contains estimates and other statistical data made by independent parties, and by us, relating to market size and growth and other data about our industry and our business. This data involves several assumptions and limitations, and you are cautioned not to give undue weight to such estimates. In addition, projections, assumptions and estimates of our future performance and the future performance of the markets in which we operate are necessarily subject to a high degree of uncertainty and risk. Forward-Looking Statements 2
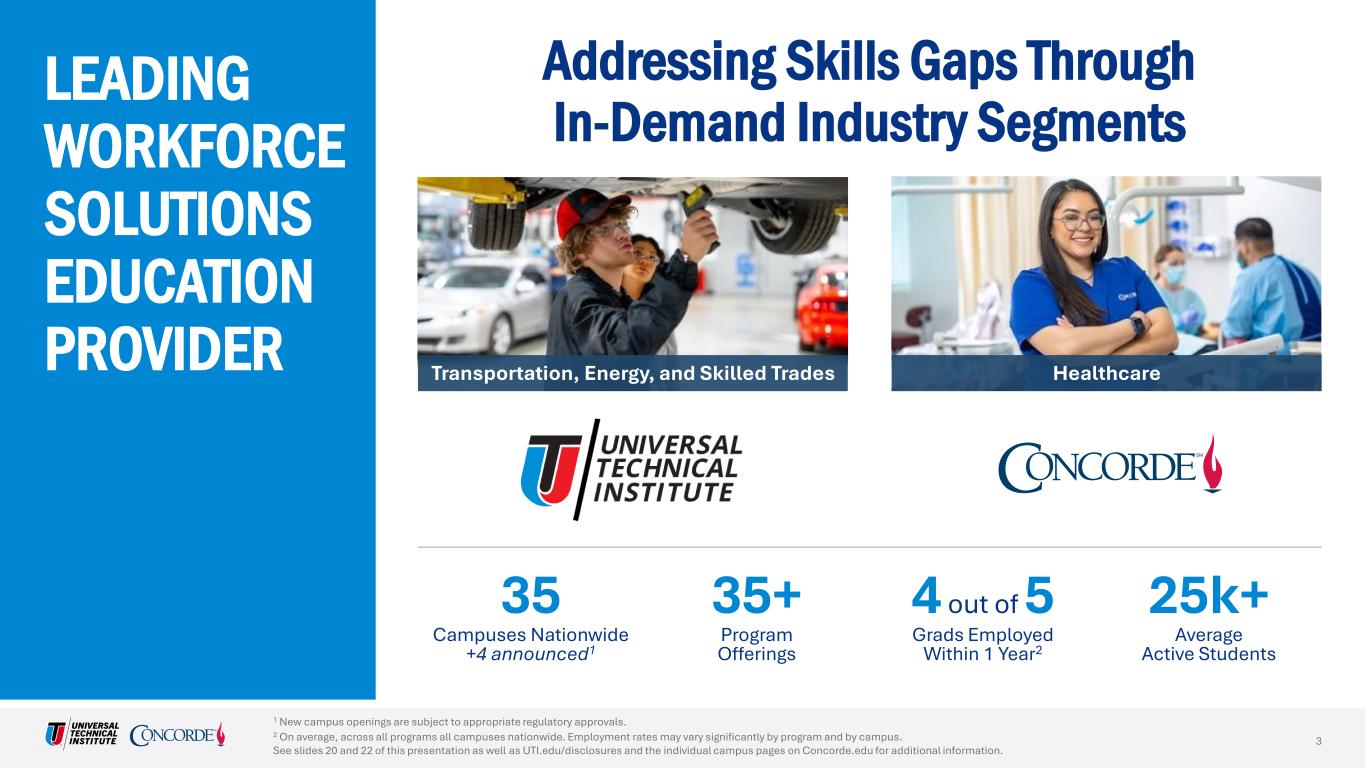

 
3 Addressing Skills Gaps Through In-Demand Industry Segments LEADING WORKFORCE SOLUTIONS EDUCATION PROVIDER 4 out of 5 Grads Employed Within 1 Year2 35+ Program Offerings Transportation, Energy, and Skilled Trades 35 Campuses Nationwide +4 announced1 1 New campus openings are subject to appropriate regulatory approvals. 2 On average, across all programs all campuses nationwide. Employment rates may vary significantly by program and by campus. See slides 20 and 22 of this presentation as well as UTI.edu/disclosures and the individual campus pages on Concorde.edu for additional information. Healthcare 25k+ Average Active Students
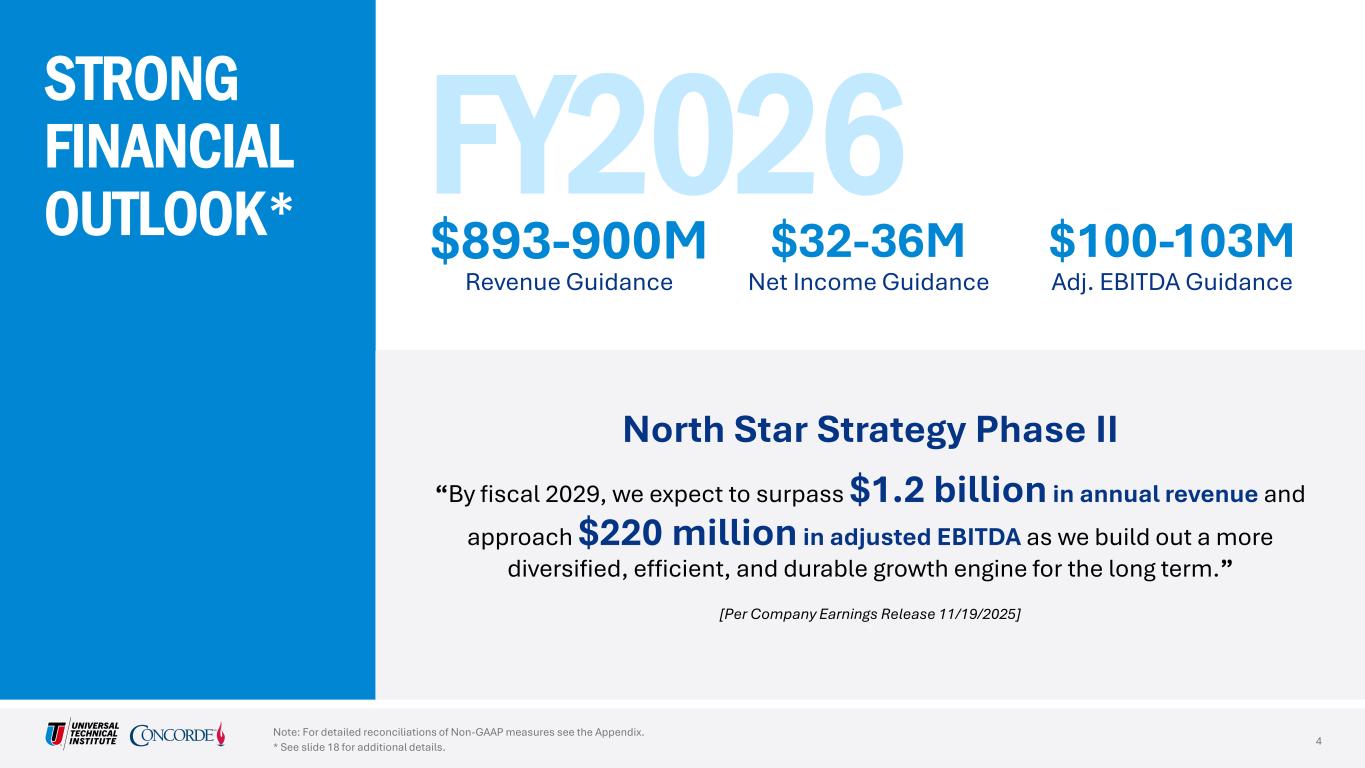

 
North Star Strategy Phase II “By fiscal 2029, we expect to surpass $1.2 billion in annual revenue and approach $220 million in adjusted EBITDA as we build out a more diversified, efficient, and durable growth engine for the long term.” [Per Company Earnings Release 11/19/2025] == 4 FY2026 STRONG FINANCIAL OUTLOOK* Note: For detailed reconciliations of Non-GAAP measures see the Appendix. * See slide 18 for additional details. $100-103M$32-36M$893-900M Revenue Guidance Net Income Guidance Adj. EBITDA Guidance
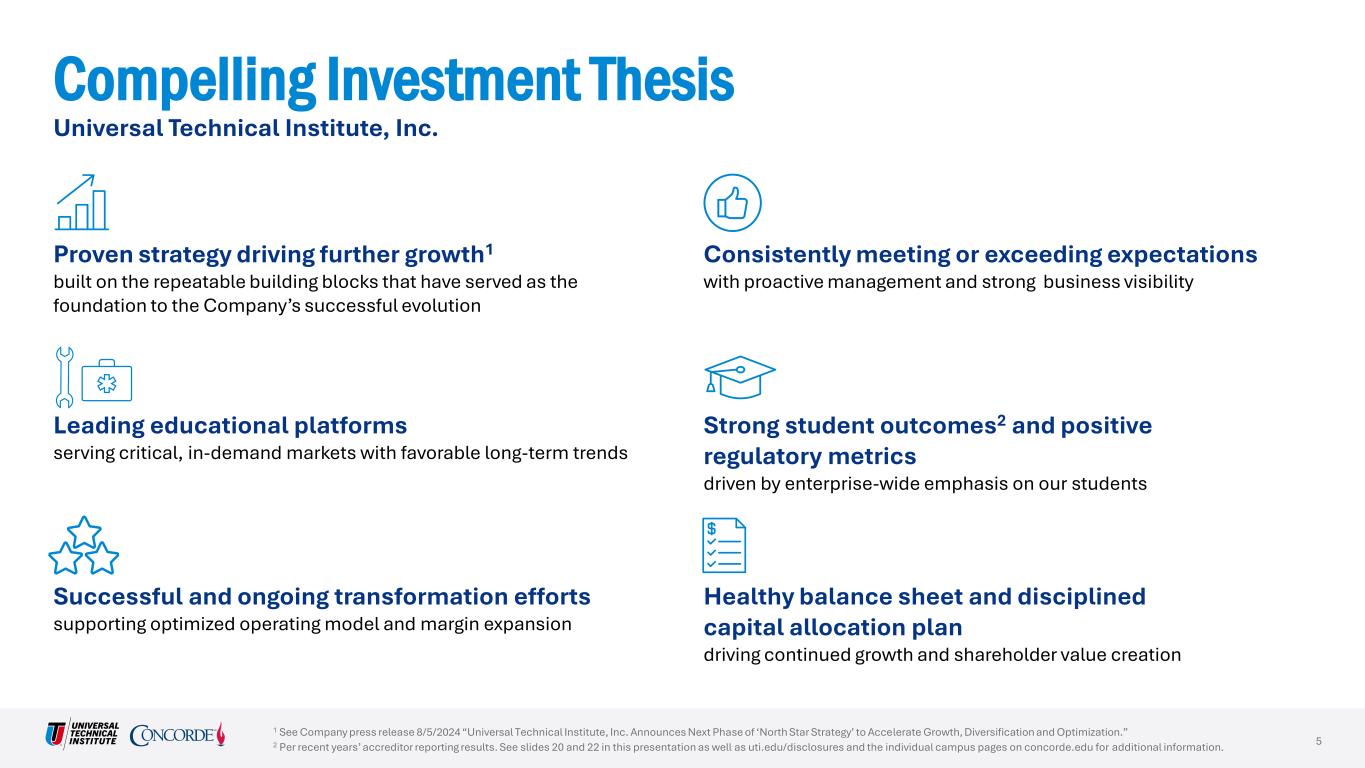

 
Compelling Investment Thesis 1 See Company press release 8/5/2024 “Universal Technical Institute, Inc. Announces Next Phase of ‘North Star Strategy’ to Accelerate Growth, Diversification and Optimization.” 2 Per recent years’ accreditor reporting results. See slides 20 and 22 in this presentation as well as uti.edu/disclosures and the individual campus pages on concorde.edu for additional information. Universal Technical Institute, Inc. 5 Leading educational platforms serving critical, in-demand markets with favorable long-term trends Strong student outcomes2 and positive regulatory metrics driven by enterprise-wide emphasis on our students Consistently meeting or exceeding expectations with proactive management and strong business visibility Successful and ongoing transformation efforts supporting optimized operating model and margin expansion Healthy balance sheet and disciplined capital allocation plan driving continued growth and shareholder value creation Proven strategy driving further growth1 built on the repeatable building blocks that have served as the foundation to the Company’s successful evolution
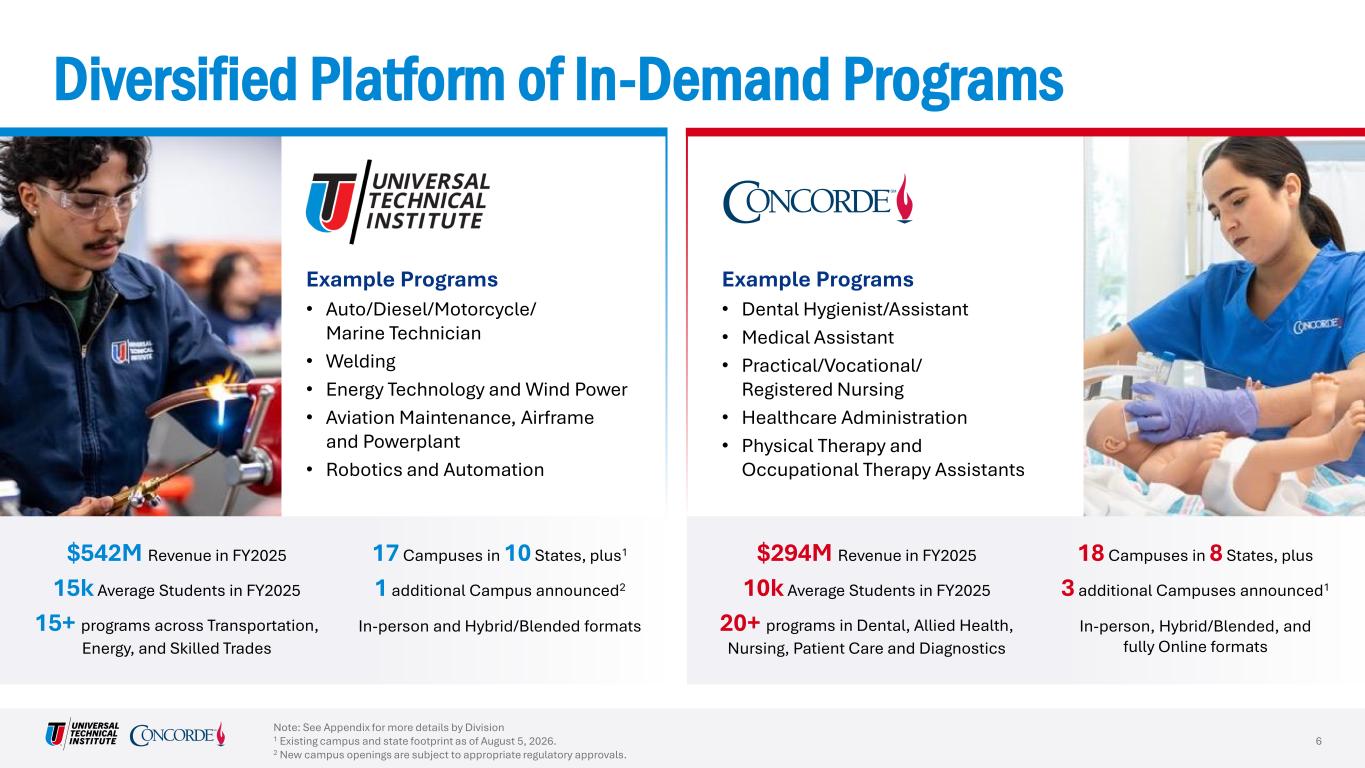

 
Diversified Platform of In-Demand Programs 6 Note: See Appendix for more details by Division 1 Existing campus and state footprint as of August 5, 2026. 2 New campus openings are subject to appropriate regulatory approvals. Example Programs • Auto/Diesel/Motorcycle/ Marine Technician • Welding • Energy Technology and Wind Power • Aviation Maintenance, Airframe and Powerplant • Robotics and Automation Example Programs • Dental Hygienist/Assistant • Medical Assistant • Practical/Vocational/ Registered Nursing • Healthcare Administration • Physical Therapy and Occupational Therapy Assistants $542M Revenue in FY2025 15k Average Students in FY2025 15+ programs across Transportation, Energy, and Skilled Trades 17 Campuses in 10 States, plus1 1 additional Campus announced2 In-person and Hybrid/Blended formats $294M Revenue in FY2025 10k Average Students in FY2025 20+ programs in Dental, Allied Health, Nursing, Patient Care and Diagnostics 18 Campuses in 8 States, plus 3 additional Campuses announced1 In-person, Hybrid/Blended, and fully Online formats
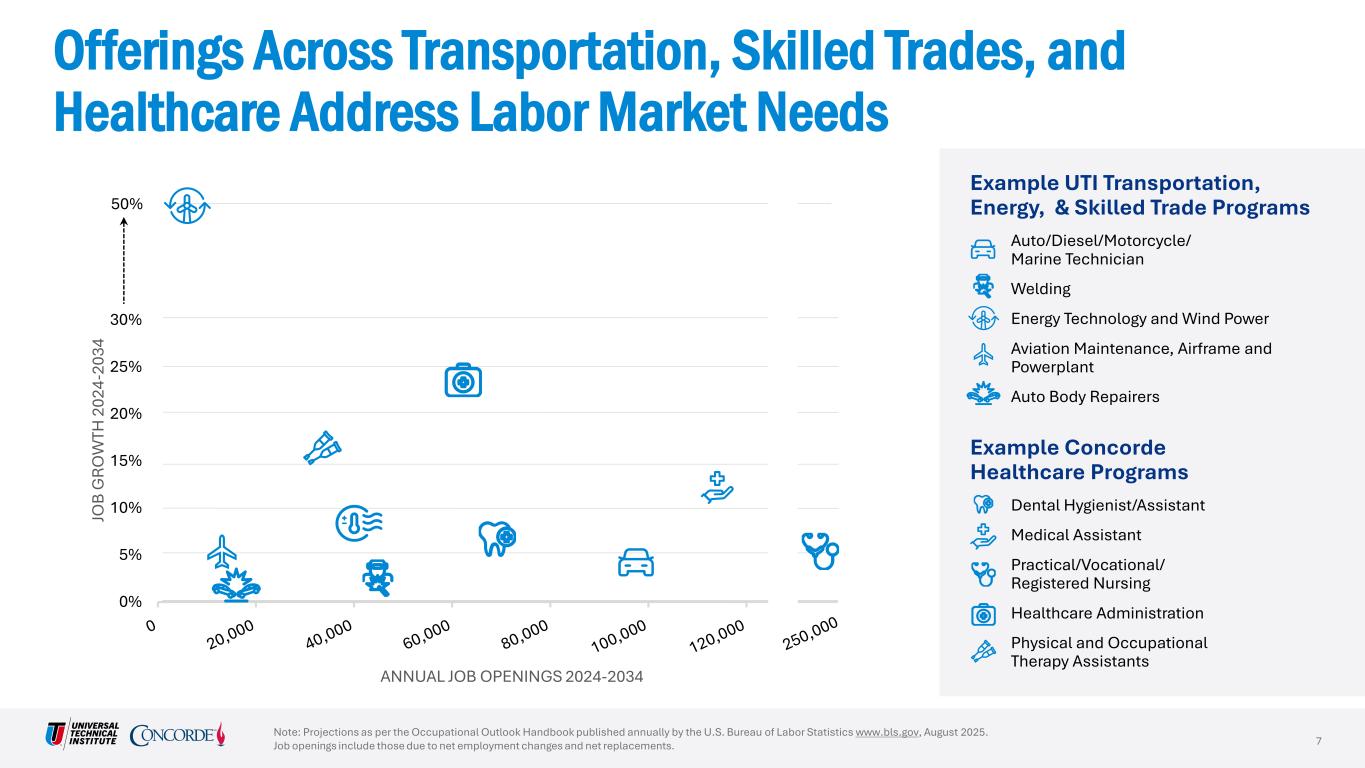

 
7 Offerings Across Transportation, Skilled Trades, and Healthcare Address Labor Market Needs Note: Projections as per the Occupational Outlook Handbook published annually by the U.S. Bureau of Labor Statistics www.bls.gov, August 2025. Job openings include those due to net employment changes and net replacements. Example UTI Transportation, Energy, & Skilled Trade Programs Auto/Diesel/Motorcycle/ Marine Technician Welding Energy Technology and Wind Power Aviation Maintenance, Airframe and Powerplant Auto Body Repairers Example Concorde Healthcare Programs Dental Hygienist/Assistant Medical Assistant Practical/Vocational/ Registered Nursing Healthcare Administration Physical and Occupational Therapy Assistants 0% 5% 10% 15% 20% 25% 30% JO B G R O W TH 2 02 4- 20 34 ANNUAL JOB OPENINGS 2024-2034 50%
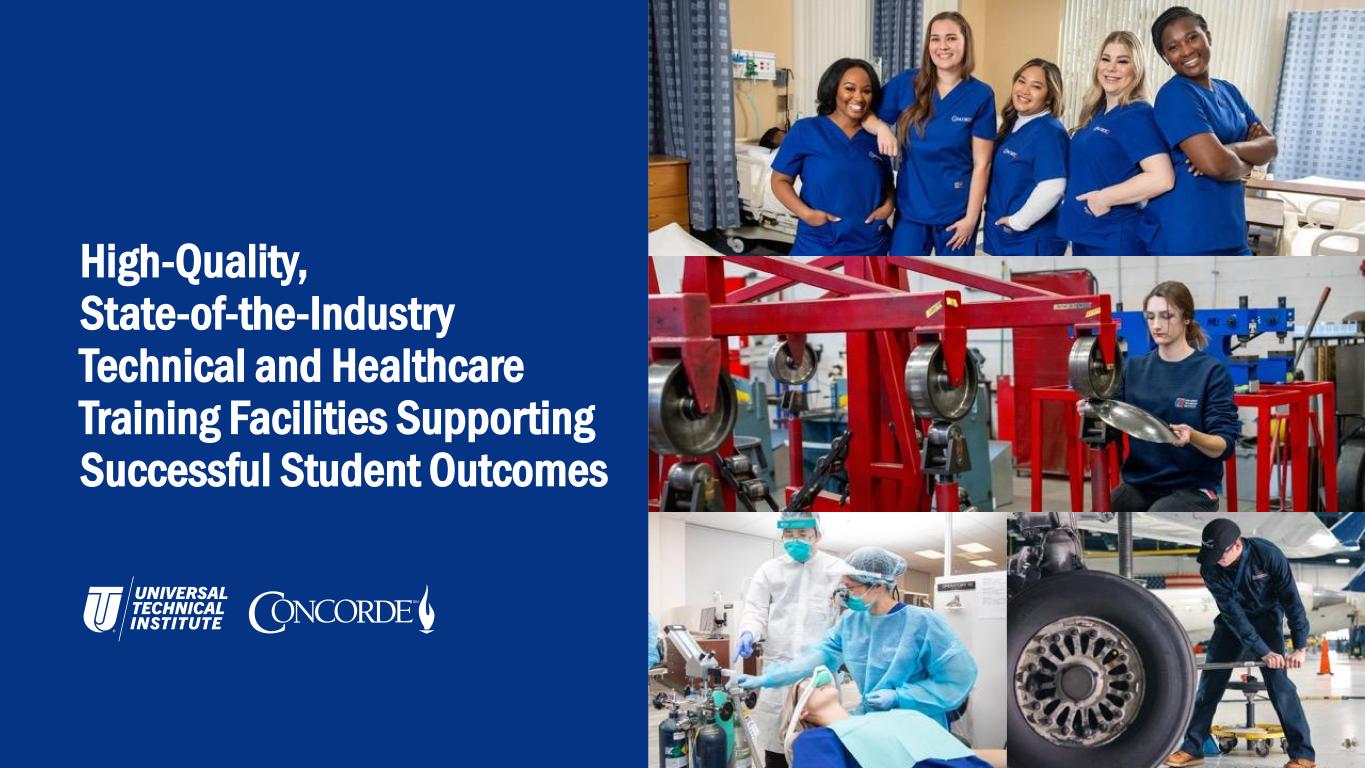

 
High-Quality, State-of-the-Industry Technical and Healthcare Training Facilities Supporting Successful Student Outcomes
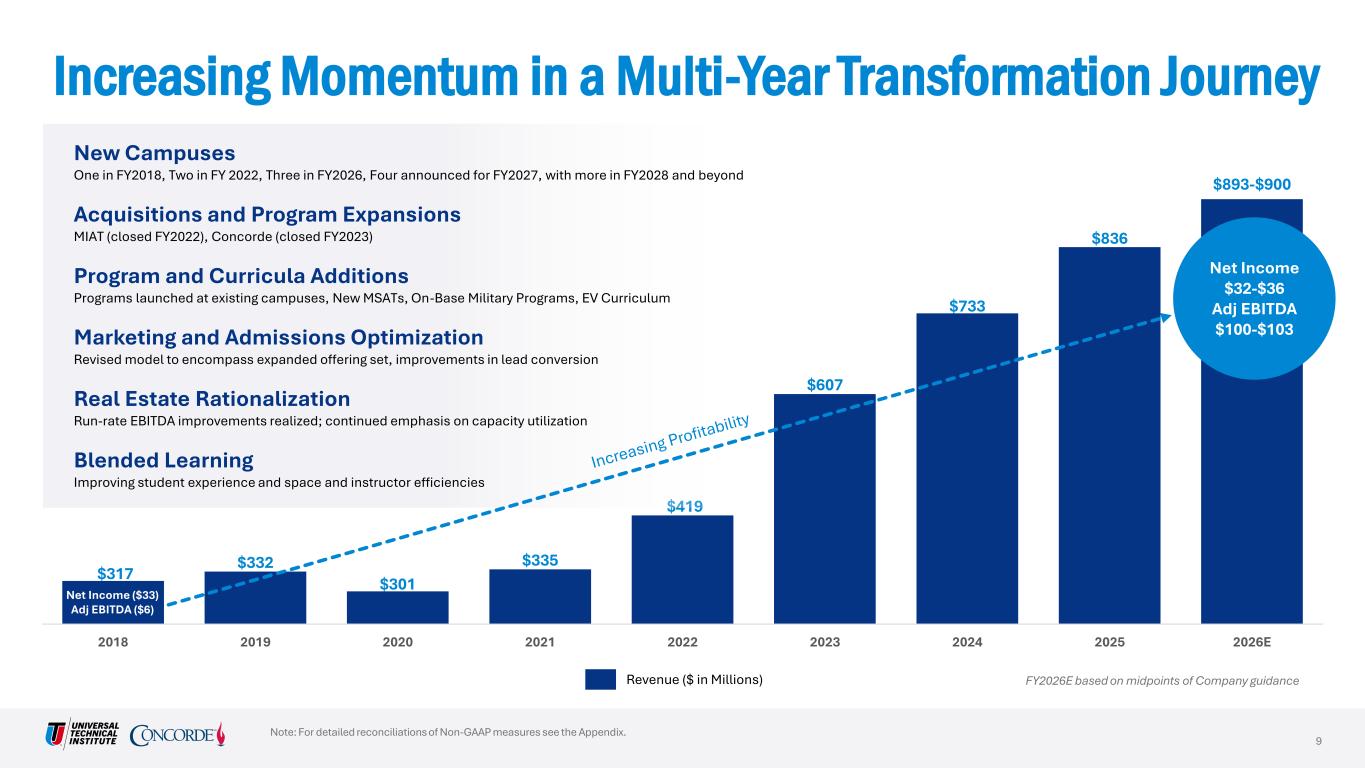

 
$317 $332 $301 $335 $419 $607 $733 $836 $893-$900 2018 2019 2020 2021 2022 2023 2024 2025 2026E Increasing Momentum in a Multi-Year Transformation Journey Note: For detailed reconciliations of Non-GAAP measures see the Appendix. FY2026E based on midpoints of Company guidance New Campuses One in FY2018, Two in FY 2022, Three in FY2026, Four announced for FY2027, with more in FY2028 and beyond Acquisitions and Program Expansions MIAT (closed FY2022), Concorde (closed FY2023) Program and Curricula Additions Programs launched at existing campuses, New MSATs, On-Base Military Programs, EV Curriculum Marketing and Admissions Optimization Revised model to encompass expanded offering set, improvements in lead conversion Real Estate Rationalization Run-rate EBITDA improvements realized; continued emphasis on capacity utilization Blended Learning Improving student experience and space and instructor efficiencies Revenue ($ in Millions) Net Income $32-$36 Adj EBITDA $100-$103 Net Income ($33) Adj EBITDA ($6) 9
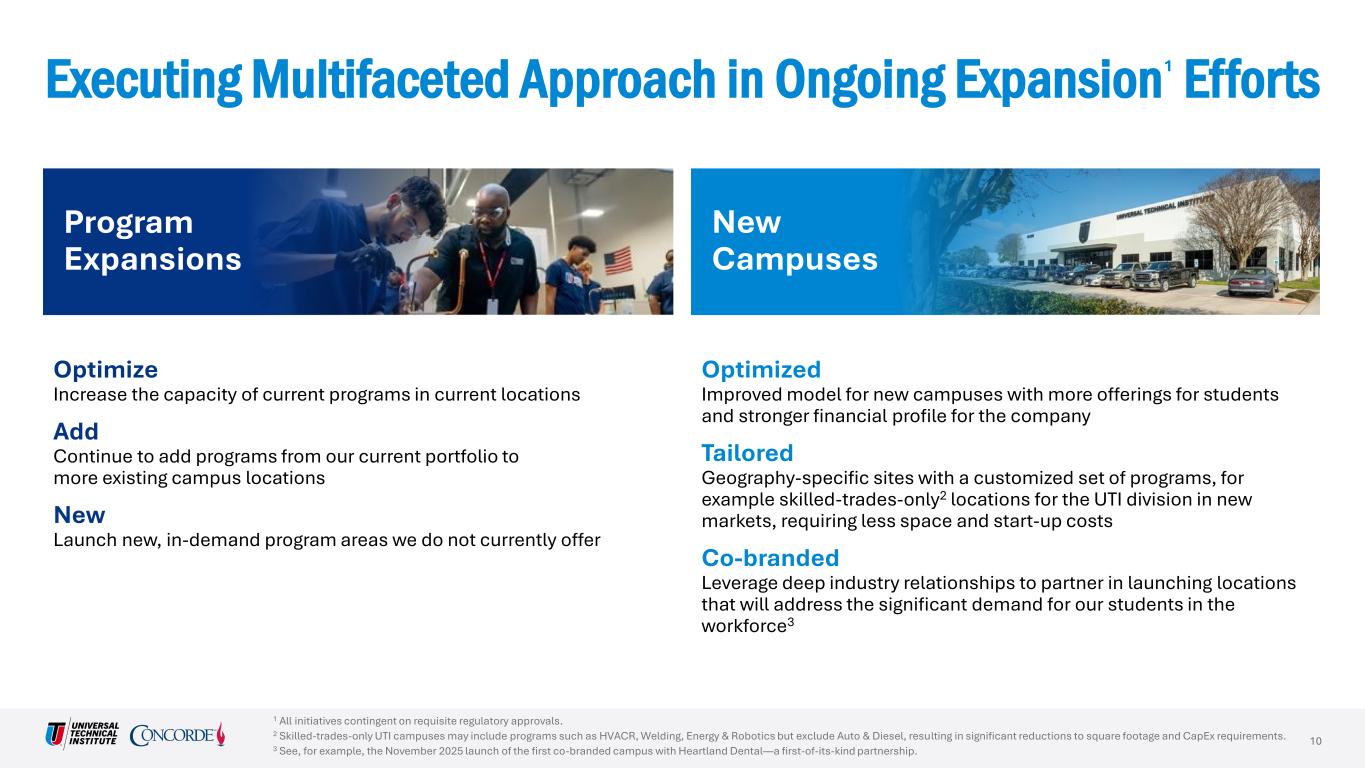

 
Optimized Improved model for new campuses with more offerings for students and stronger financial profile for the company Tailored Geography-specific sites with a customized set of programs, for example skilled-trades-only2 locations for the UTI division in new markets, requiring less space and start-up costs Co-branded Leverage deep industry relationships to partner in launching locations that will address the significant demand for our students in the workforce3 Executing Multifaceted Approach in Ongoing Expansion 1 Efforts Program Expansions New Campuses 10 1 All initiatives contingent on requisite regulatory approvals. 2 Skilled-trades-only UTI campuses may include programs such as HVACR, Welding, Energy & Robotics but exclude Auto & Diesel, resulting in significant reductions to square footage and CapEx requirements. 3 See, for example, the November 2025 launch of the first co-branded campus with Heartland Dental—a first-of-its-kind partnership. Optimize Increase the capacity of current programs in current locations Add Continue to add programs from our current portfolio to more existing campus locations New Launch new, in-demand program areas we do not currently offer
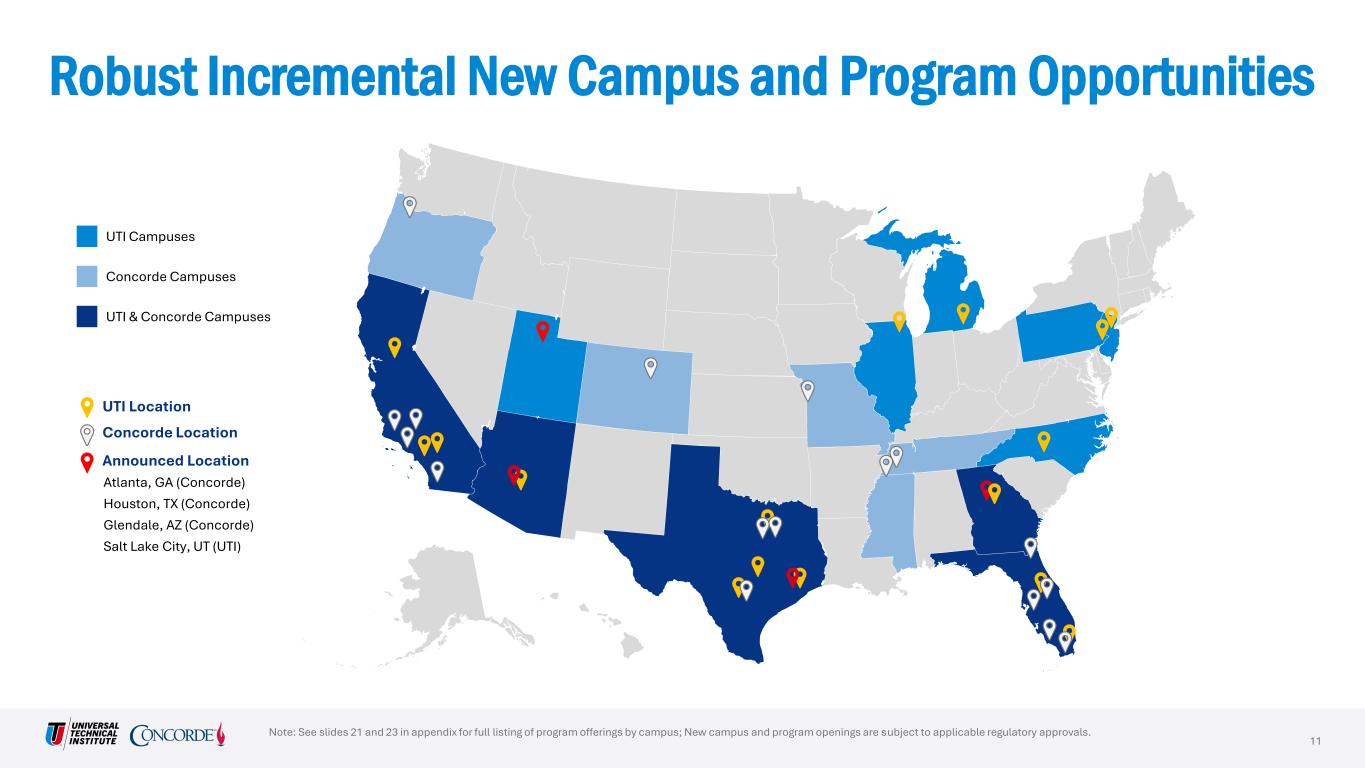

 
Robust Incremental New Campus and Program Opportunities Note: See slides 21 and 23 in appendix for full listing of program offerings by campus; New campus and program openings are subject to applicable regulatory approvals. UTI Campuses Concorde Campuses UTI & Concorde Campuses UTI Location Concorde Location Announced Location 11 © GeoNames, Microsoft, TomTom Powered by Bing Atlanta, GA (Concorde) Houston, TX (Concorde) Glendale, AZ (Concorde) Salt Lake City, UT (UTI)
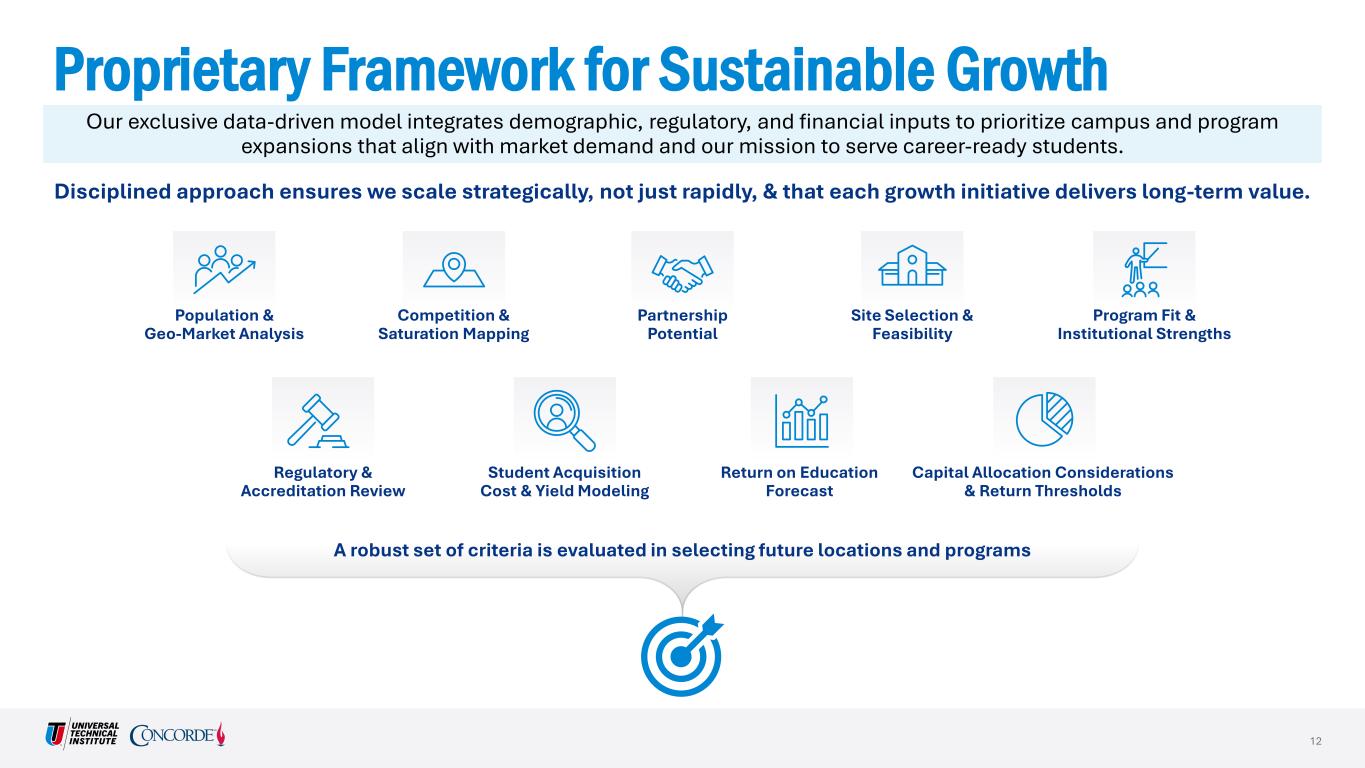

 
Our exclusive data-driven model integrates demographic, regulatory, and financial inputs to prioritize campus and program expansions that align with market demand and our mission to serve career-ready students. Proprietary Framework for Sustainable Growth A robust set of criteria is evaluated in selecting future locations and programs Population & Geo-Market Analysis Competition & Saturation Mapping Partnership Potential Site Selection & Feasibility Program Fit & Institutional Strengths Regulatory & Accreditation Review Student Acquisition Cost & Yield Modeling Return on Education Forecast Capital Allocation Considerations & Return Thresholds 12 Disciplined approach ensures we scale strategically, not just rapidly, & that each growth initiative delivers long-term value.
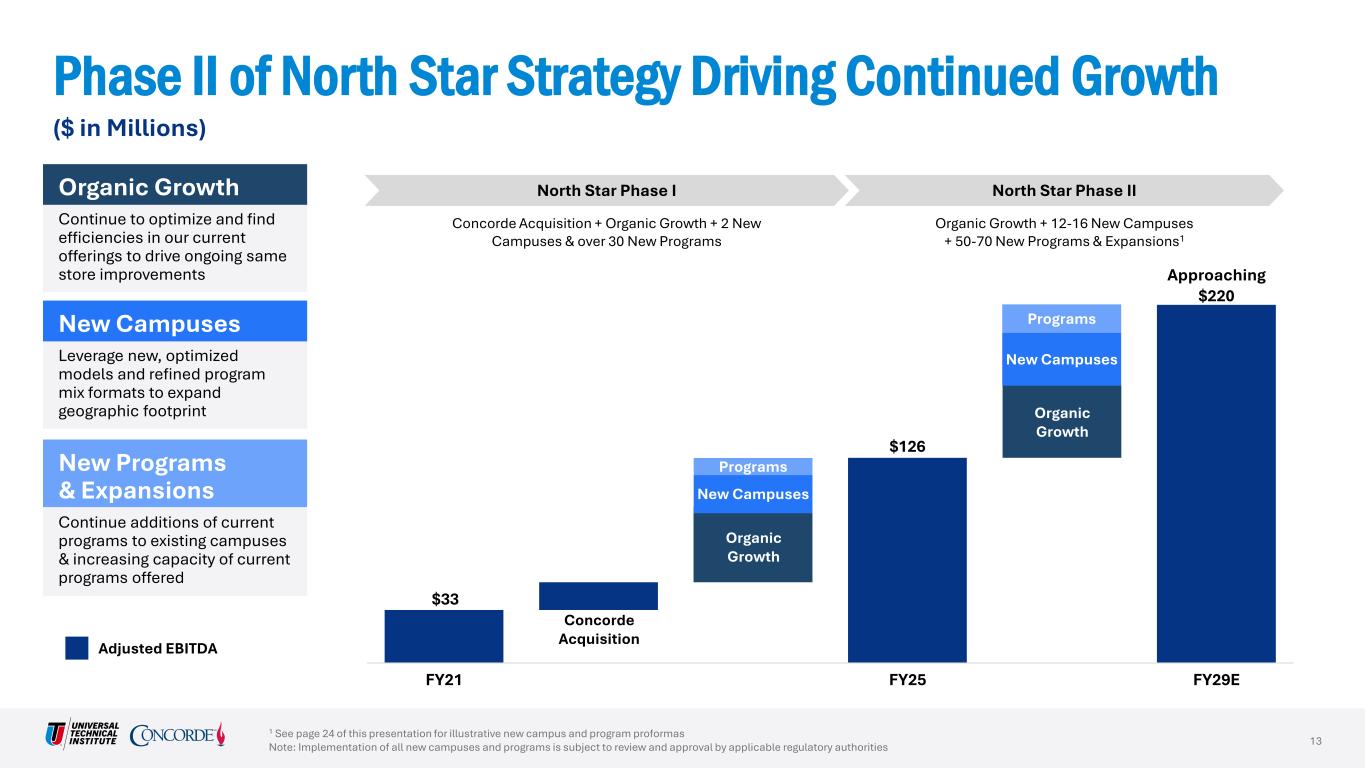

 
$33 $126 Approaching $220 FY21 FY25 FY29E Concorde Acquisition New Campuses Programs New Campuses Programs Organic Growth Organic Growth Phase II of North Star Strategy Driving Continued Growth 1 See page 24 of this presentation for illustrative new campus and program proformas Note: Implementation of all new campuses and programs is subject to review and approval by applicable regulatory authorities ($ in Millions) Adjusted EBITDA Organic Growth Continue to optimize and find efficiencies in our current offerings to drive ongoing same store improvements New Campuses Leverage new, optimized models and refined program mix formats to expand geographic footprint New Programs & Expansions Continue additions of current programs to existing campuses & increasing capacity of current programs offered 13 North Star Phase I North Star Phase II Concorde Acquisition + Organic Growth + 2 New Campuses & over 30 New Programs Organic Growth + 12-16 New Campuses + 50-70 New Programs & Expansions1
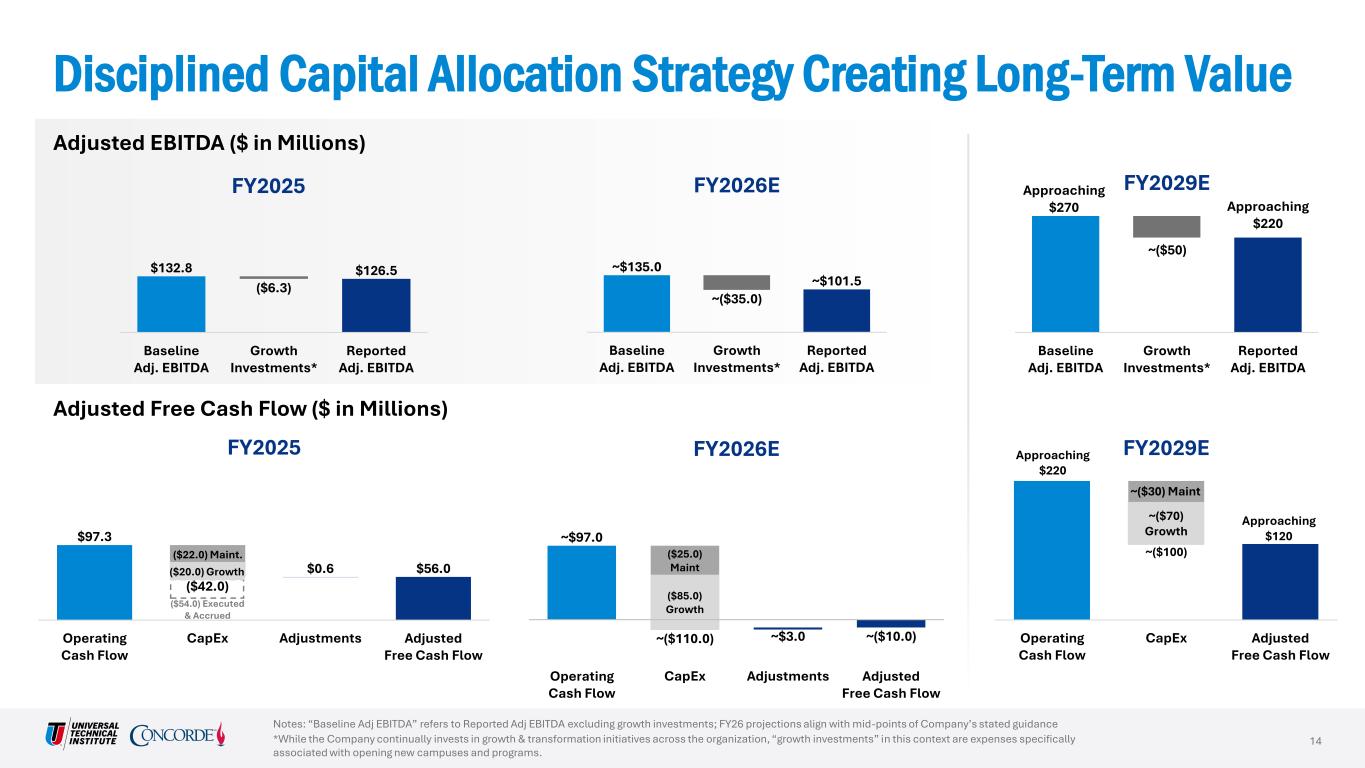

 
~$97.0 ~($110.0) ~$3.0 ~($10.0) Operating Cash Flow CapEx Adjustments Adjusted Free Cash Flow FY2026E ($85.0) Growth ~$135.0 ~($35.0) ~$101.5 Baseline Adj. EBITDA Growth Investments* Reported Adj. EBITDA FY2026E Disciplined Capital Allocation Strategy Creating Long-Term Value Notes: “Baseline Adj EBITDA” refers to Reported Adj EBITDA excluding growth investments; FY26 projections align with mid-points of Company’s stated guidance *While the Company continually invests in growth & transformation initiatives across the organization, “growth investments” in this context are expenses specifically associated with opening new campuses and programs. Adjusted EBITDA ($ in Millions) 14 ~($100) Operating Cash Flow CapEx Adjusted Free Cash Flow FY2029E ~($70) Growth ~($30) Maint Approaching $220 Approaching $120 Adjusted Free Cash Flow ($ in Millions) $97.3 $0.6 $56.0 ($42.0) Operating Cash Flow CapEx Adjustments Adjusted Free Cash Flow FY2025 ($54.0) Executed & Accrued ($22.0) Maint. ($20.0) Growth Baseline Adj. EBITDA Growth Investments* Reported Adj. EBITDA FY2029EApproaching $270 Approaching $220 ~($50) $132.8 ($6.3) $126.5 Baseline Adj. EBITDA Growth Investments* Reported Adj. EBITDA FY2025 ($25.0) Maint
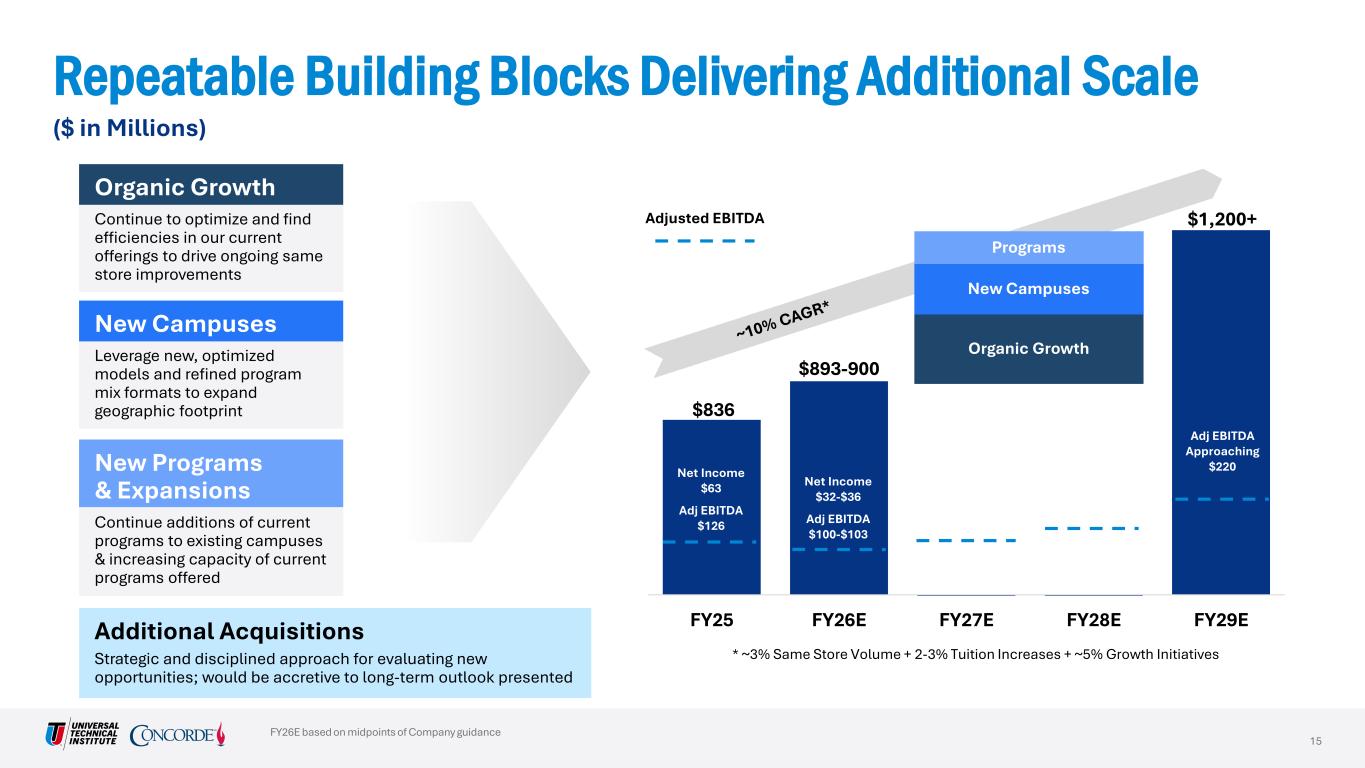

 
$836 $893-900 $1,200+ FY25 FY26E FY27E FY28E FY29E Adj EBITDA Approaching $220Net Income $63 Adj EBITDA $126 Net Income $32-$36 Adj EBITDA $100-$103 Organic Growth New Campuses Programs * ~3% Same Store Volume + 2-3% Tuition Increases + ~5% Growth Initiatives Repeatable Building Blocks Delivering Additional Scale FY26E based on midpoints of Company guidance ($ in Millions) New Campuses Leverage new, optimized models and refined program mix formats to expand geographic footprint New Programs & Expansions Continue additions of current programs to existing campuses & increasing capacity of current programs offered Additional Acquisitions Strategic and disciplined approach for evaluating new opportunities; would be accretive to long-term outlook presented Adjusted EBITDA 15 Organic Growth Continue to optimize and find efficiencies in our current offerings to drive ongoing same store improvements


 
Business Outlook Fiscal 2026 Guidance
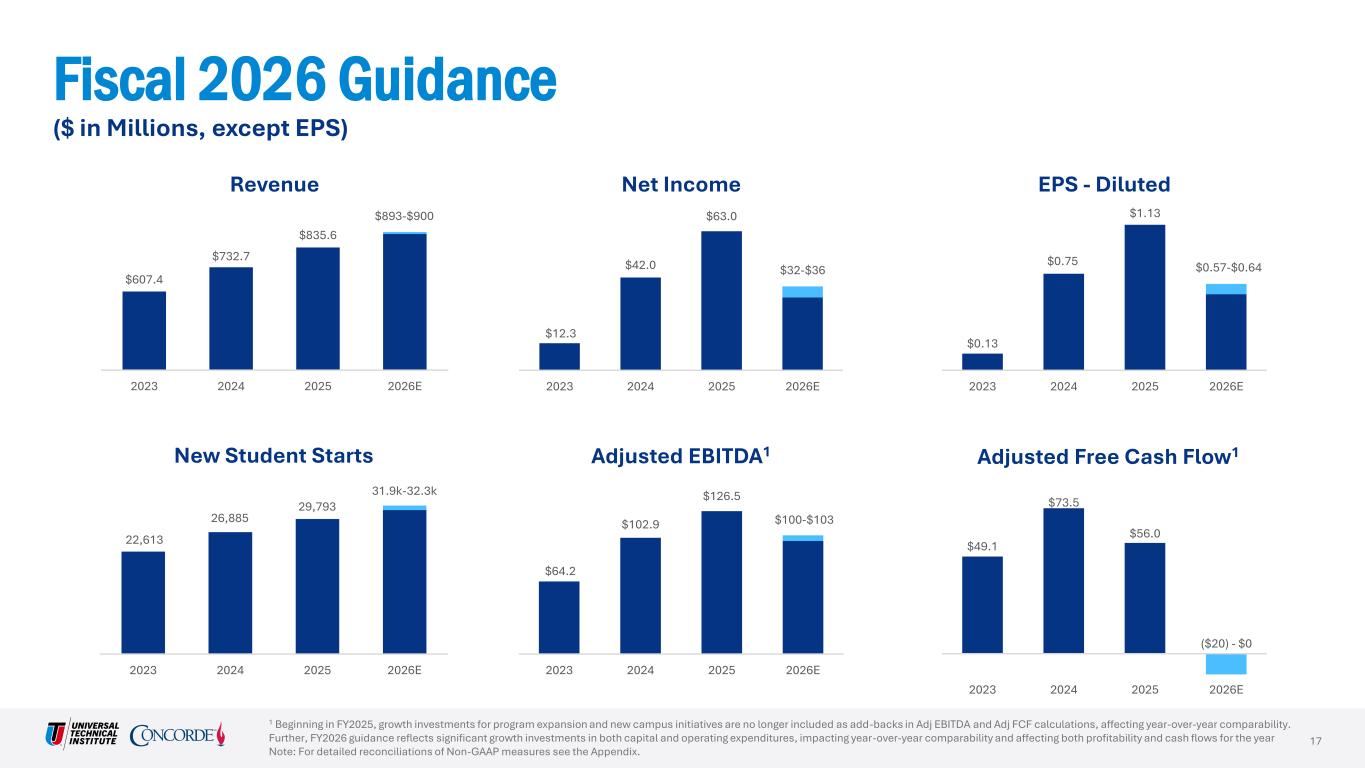

 
$49.1 $73.5 $56.0 ($20) - $0 2023 2024 2025 2026E Adjusted Free Cash Flow1 22,613 26,885 29,793 2023 2024 2025 2026E New Student Starts 31.9k-32.3k Fiscal 2026 Guidance 1 Beginning in FY2025, growth investments for program expansion and new campus initiatives are no longer included as add-backs in Adj EBITDA and Adj FCF calculations, affecting year-over-year comparability. Further, FY2026 guidance reflects significant growth investments in both capital and operating expenditures, impacting year-over-year comparability and affecting both profitability and cash flows for the year Note: For detailed reconciliations of Non-GAAP measures see the Appendix. ($ in Millions, except EPS) $607.4 $732.7 $835.6 2023 2024 2025 2026E Revenue $893-$900 17 $12.3 $42.0 $63.0 $32-$36 2023 2024 2025 2026E Net Income $0.13 $0.75 $1.13 $0.57-$0.64 2023 2024 2025 2026E EPS - Diluted $64.2 $102.9 $126.5 2023 2024 2025 2026E Adjusted EBITDA1 $100-$103

 
Appendix
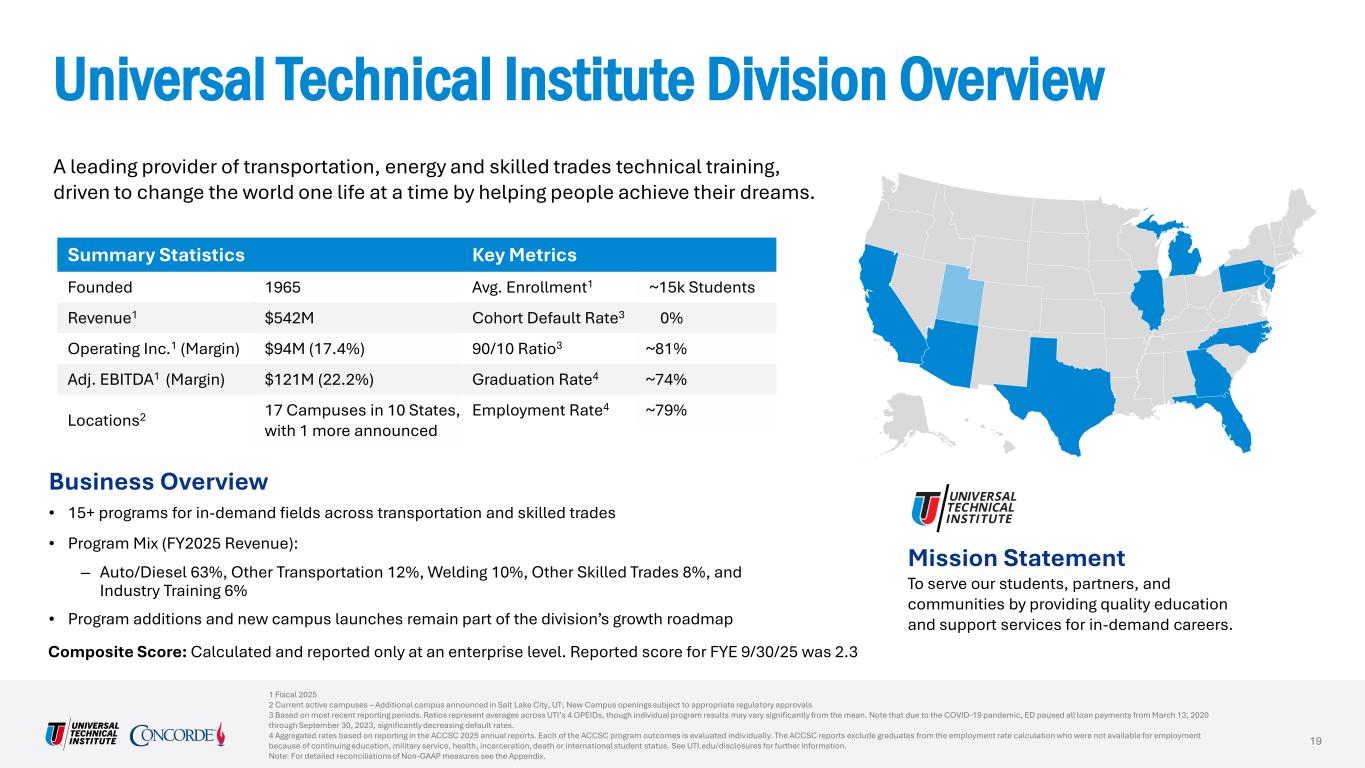

 
© GeoNames, Microsoft, TomTom Powered by Bing 19 Business Overview • 15+ programs for in-demand fields across transportation and skilled trades • Program Mix (FY2025 Revenue): – Auto/Diesel 63%, Other Transportation 12%, Welding 10%, Other Skilled Trades 8%, and Industry Training 6% • Program additions and new campus launches remain part of the division’s growth roadmap Universal Technical Institute Division Overview 1 Fiscal 2025 2 Current active campuses – Additional campus announced in Salt Lake City, UT; New Campus openings subject to appropriate regulatory approvals 3 Based on most recent reporting periods. Ratios represent averages across UTI’s 4 OPEIDs, though individual program results may vary significantly from the mean. Note that due to the COVID-19 pandemic, ED paused all loan payments from March 13, 2020 through September 30, 2023, significantly decreasing default rates. 4 Aggregated rates based on reporting in the ACCSC 2025 annual reports. Each of the ACCSC program outcomes is evaluated individually. The ACCSC reports exclude graduates from the employment rate calculation who were not available for employment because of continuing education, military service, health, incarceration, death or international student status. See UTI.edu/disclosures for further information. Note: For detailed reconciliations of Non-GAAP measures see the Appendix. Mission Statement To serve our students, partners, and communities by providing quality education and support services for in-demand careers. A leading provider of transportation, energy and skilled trades technical training, driven to change the world one life at a time by helping people achieve their dreams. Summary Statistics Founded 1965 Revenue1 $542M Operating Inc.1 (Margin) $94M (17.4%) Adj. EBITDA1 (Margin) $121M (22.2%) Locations2 17 Campuses in 10 States, with 1 more announced Key Metrics Avg. Enrollment1 ~15k Students Cohort Default Rate3 0% 90/10 Ratio3 ~81% Graduation Rate4 ~74% Employment Rate4 ~79% Composite Score: Calculated and reported only at an enterprise level. Reported score for FYE 9/30/25 was 2.3
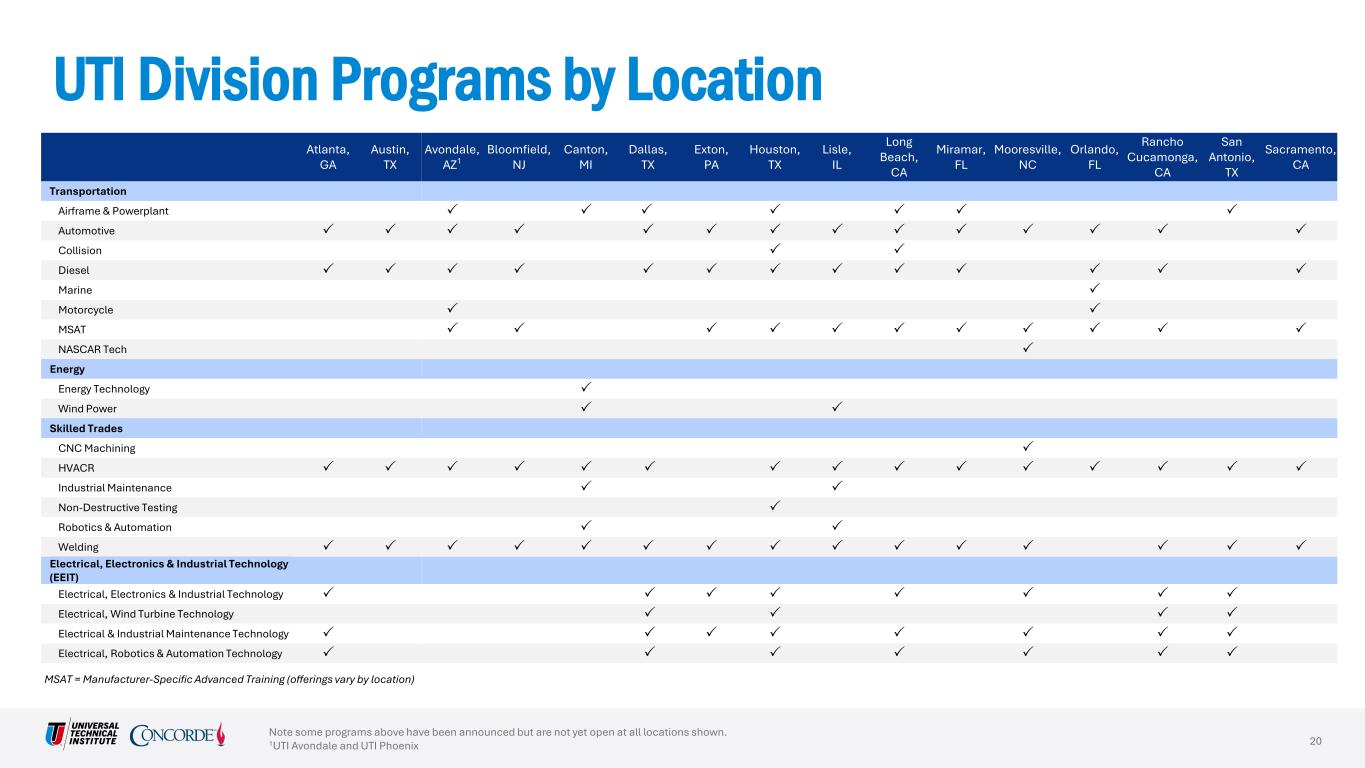

 
UTI Division Programs by Location Note some programs above have been announced but are not yet open at all locations shown. 1UTI Avondale and UTI Phoenix MSAT = Manufacturer-Specific Advanced Training (offerings vary by location) Atlanta, GA Austin, TX Avondale, AZ1 Bloomfield, NJ Canton, MI Dallas, TX Exton, PA Houston, TX Lisle, IL Long Beach, CA Miramar, FL Mooresville, NC Orlando, FL Rancho Cucamonga, CA San Antonio, TX Sacramento, CA Transportation Airframe & Powerplant        Automotive               Collision   Diesel              Marine  Motorcycle   MSAT            NASCAR Tech  Energy Energy Technology  Wind Power   Skilled Trades CNC Machining  HVACR                Industrial Maintenance   Non-Destructive Testing  Robotics & Automation   Welding                Electrical, Electronics & Industrial Technology (EEIT) Electrical, Electronics & Industrial Technology         Electrical, Wind Turbine Technology     Electrical & Industrial Maintenance Technology         Electrical, Robotics & Automation Technology        20


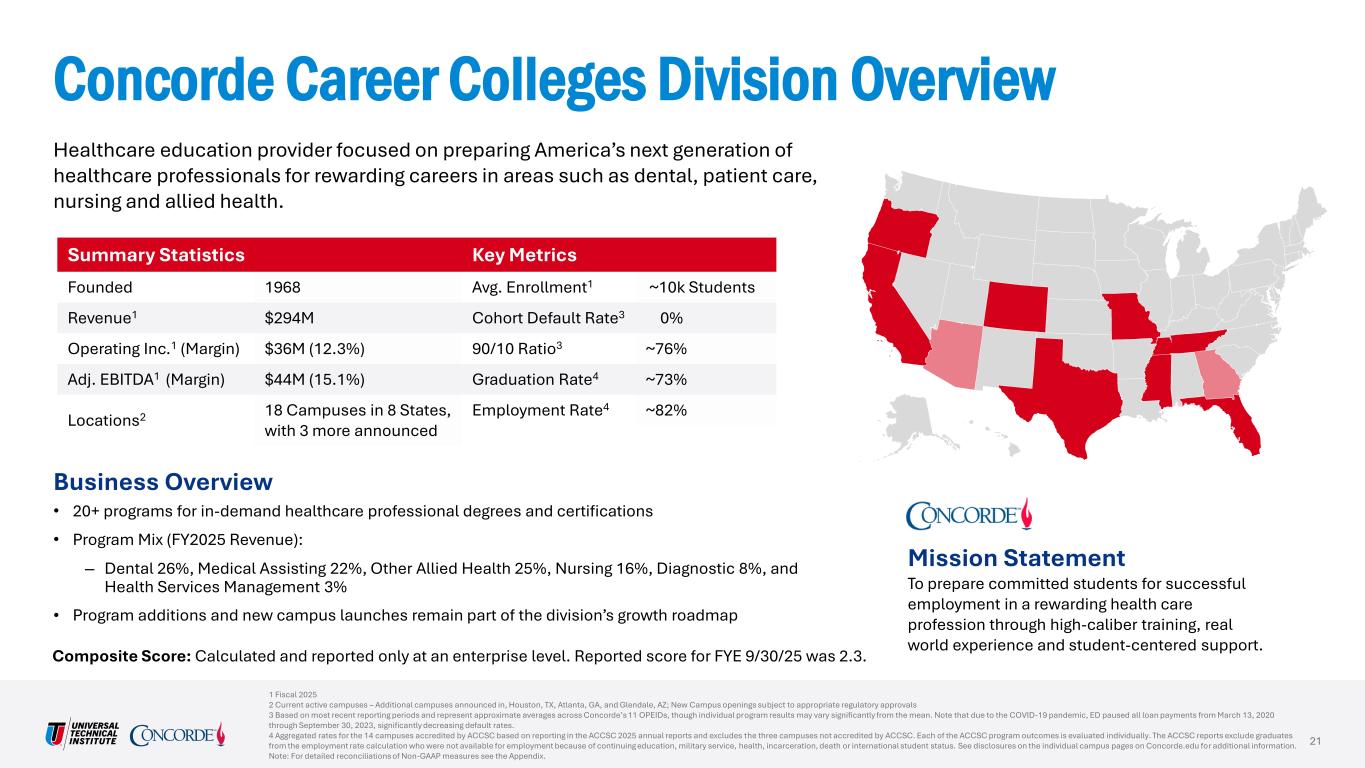
© GeoNames, Microsoft, TomTom Powered by Bing 21 Business Overview • 20+ programs for in-demand healthcare professional degrees and certifications • Program Mix (FY2025 Revenue): – Dental 26%, Medical Assisting 22%, Other Allied Health 25%, Nursing 16%, Diagnostic 8%, and Health Services Management 3% • Program additions and new campus launches remain part of the division’s growth roadmap Concorde Career Colleges Division Overview 1 Fiscal 2025 2 Current active campuses – Additional campuses announced in, Houston, TX, Atlanta, GA, and Glendale, AZ; New Campus openings subject to appropriate regulatory approvals 3 Based on most recent reporting periods and represent approximate averages across Concorde’s 11 OPEIDs, though individual program results may vary significantly from the mean. Note that due to the COVID-19 pandemic, ED paused all loan payments from March 13, 2020 through September 30, 2023, significantly decreasing default rates. 4 Aggregated rates for the 14 campuses accredited by ACCSC based on reporting in the ACCSC 2025 annual reports and excludes the three campuses not accredited by ACCSC. Each of the ACCSC program outcomes is evaluated individually. The ACCSC reports exclude graduates from the employment rate calculation who were not available for employment because of continuing education, military service, health, incarceration, death or international student status. See disclosures on the individual campus pages on Concorde.edu for additional information. Note: For detailed reconciliations of Non-GAAP measures see the Appendix. Mission Statement To prepare committed students for successful employment in a rewarding health care profession through high-caliber training, real world experience and student-centered support. Healthcare education provider focused on preparing America’s next generation of healthcare professionals for rewarding careers in areas such as dental, patient care, nursing and allied health. Composite Score: Calculated and reported only at an enterprise level. Reported score for FYE 9/30/25 was 2.3. Summary Statistics Founded 1968 Revenue1 $294M Operating Inc.1 (Margin) $36M (12.3%) Adj. EBITDA1 (Margin) $44M (15.1%) Locations2 18 Campuses in 8 States, with 3 more announced Key Metrics Avg. Enrollment1 ~10k Students Cohort Default Rate3 0% 90/10 Ratio3 ~76% Graduation Rate4 ~73% Employment Rate4 ~82%
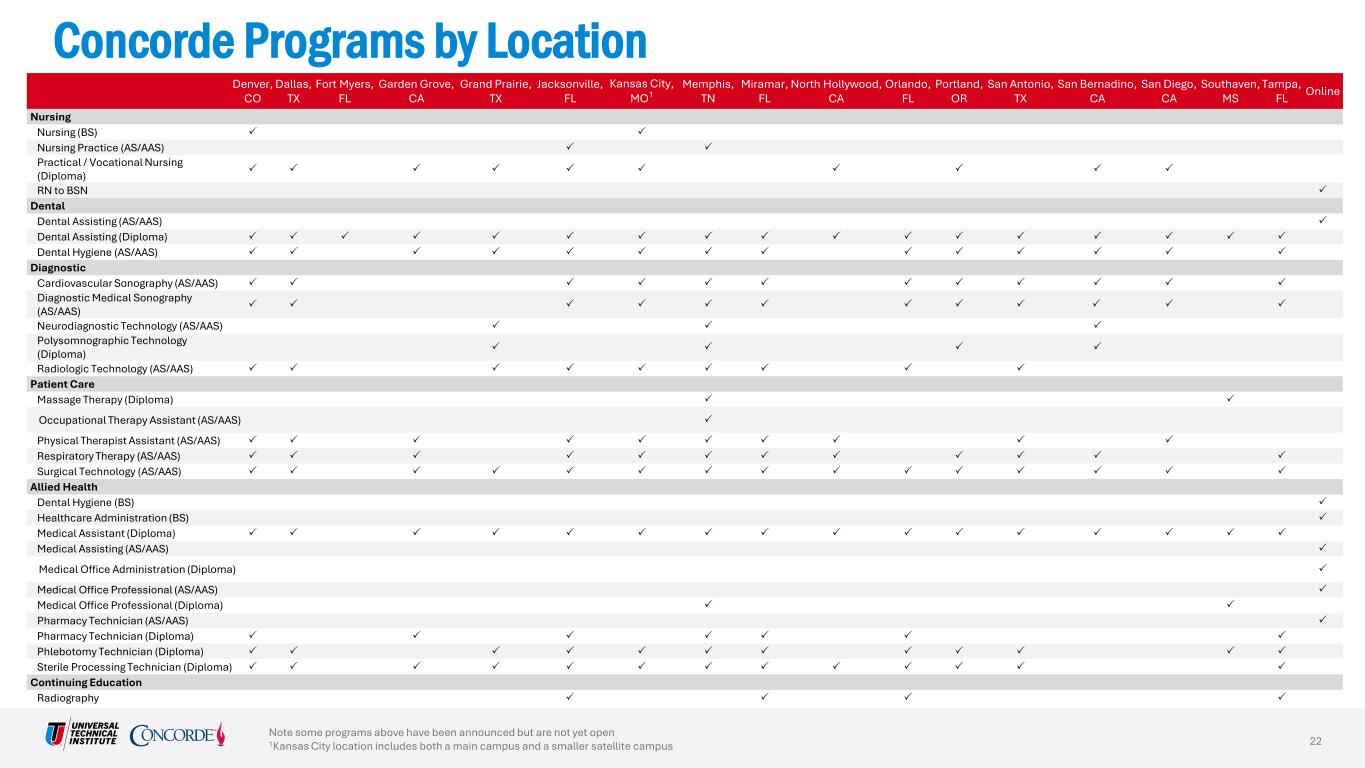

 
Concorde Programs by Location Note some programs above have been announced but are not yet open 1Kansas City location includes both a main campus and a smaller satellite campus Denver, CO Dallas, TX Fort Myers, FL Garden Grove, CA Grand Prairie, TX Jacksonville, FL Kansas City, MO1 Memphis, TN Miramar, FL North Hollywood, CA Orlando, FL Portland, OR San Antonio, TX San Bernadino, CA San Diego, CA Southaven, MS Tampa, FL Online Nursing Nursing (BS)   Nursing Practice (AS/AAS)   Practical / Vocational Nursing (Diploma)           RN to BSN  Dental Dental Assisting (AS/AAS)  Dental Assisting (Diploma)                  Dental Hygiene (AS/AAS)               Diagnostic Cardiovascular Sonography (AS/AAS)             Diagnostic Medical Sonography (AS/AAS)             Neurodiagnostic Technology (AS/AAS)    Polysomnographic Technology (Diploma)     Radiologic Technology (AS/AAS)          Patient Care Massage Therapy (Diploma)   Occupational Therapy Assistant (AS/AAS)  Physical Therapist Assistant (AS/AAS)           Respiratory Therapy (AS/AAS)             Surgical Technology (AS/AAS)                Allied Health Dental Hygiene (BS)  Healthcare Administration (BS)  Medical Assistant (Diploma)                 Medical Assisting (AS/AAS)  Medical Office Administration (Diploma)  Medical Office Professional (AS/AAS)  Medical Office Professional (Diploma)   Pharmacy Technician (AS/AAS)  Pharmacy Technician (Diploma)        Phlebotomy Technician (Diploma)             Sterile Processing Technician (Diploma)              Continuing Education Radiography     22


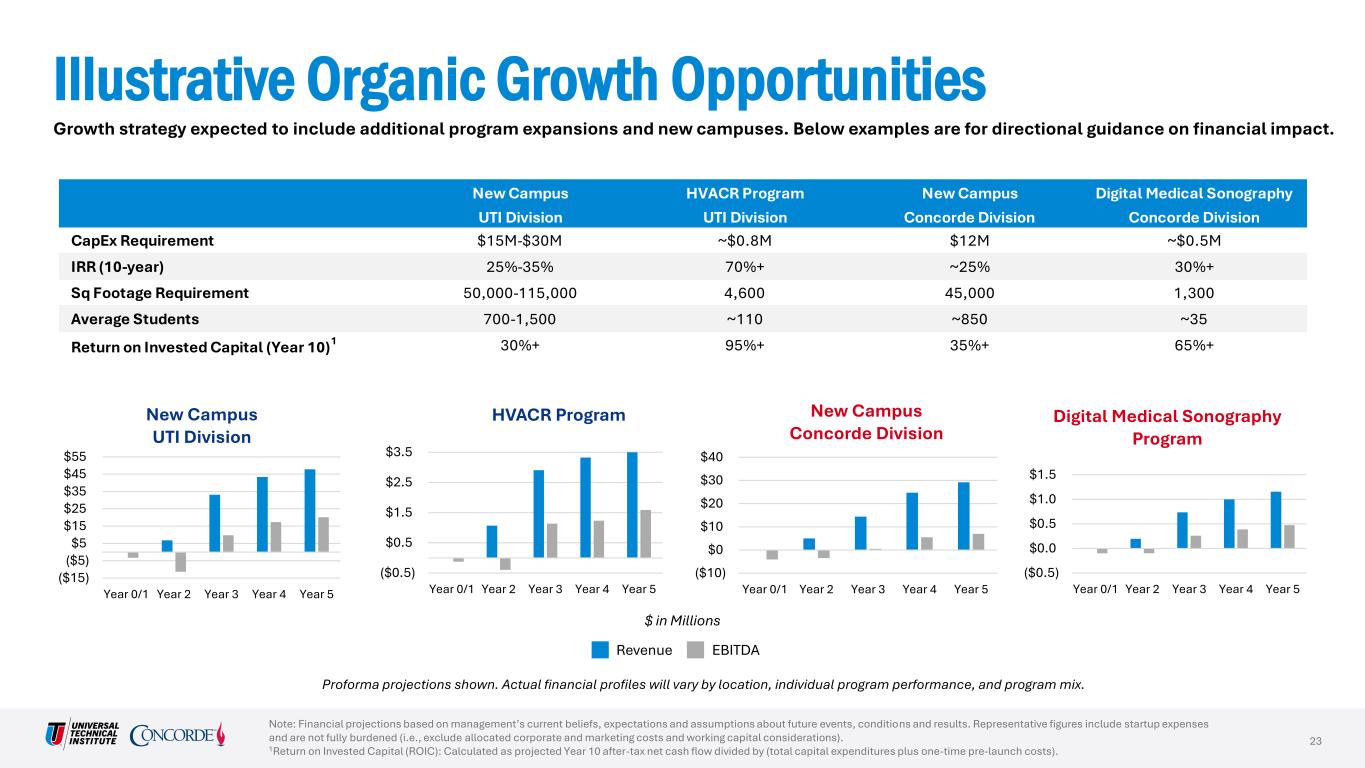
Illustrative Organic Growth Opportunities Note: Financial projections based on management’s current beliefs, expectations and assumptions about future events, conditions and results. Representative figures include startup expenses and are not fully burdened (i.e., exclude allocated corporate and marketing costs and working capital considerations). 1Return on Invested Capital (ROIC): Calculated as projected Year 10 after-tax net cash flow divided by (total capital expenditures plus one-time pre-launch costs). Growth strategy expected to include additional program expansions and new campuses. Below examples are for directional guidance on financial impact. ($15) ($5) $5 $15 $25 $35 $45 $55 Year 0/1 Year 2 Year 3 Year 4 Year 5 New Campus UTI Division ($0.5) $0.5 $1.5 $2.5 $3.5 Year 0/1 Year 2 Year 3 Year 4 Year 5 HVACR Program ($0.5) $0.0 $0.5 $1.0 $1.5 Year 0/1 Year 2 Year 3 Year 4 Year 5 Digital Medical Sonography Program Proforma projections shown. Actual financial profiles will vary by location, individual program performance, and program mix. ($10) $0 $10 $20 $30 $40 Year 0/1 Year 2 Year 3 Year 4 Year 5 New Campus Concorde Division Revenue EBITDA New Campus HVACR Program New Campus Digital Medical Sonography UTI Division UTI Division Concorde Division Concorde Division CapEx Requirement $15M-$30M ~$0.8M $12M ~$0.5M IRR (10-year) 25%-35% 70%+ ~25% 30%+ Sq Footage Requirement 50,000-115,000 4,600 45,000 1,300 Average Students 700-1,500 ~110 ~850 ~35 Return on Invested Capital (Year 10)1 30%+ 95%+ 35%+ 65%+ 23 $ in Millions
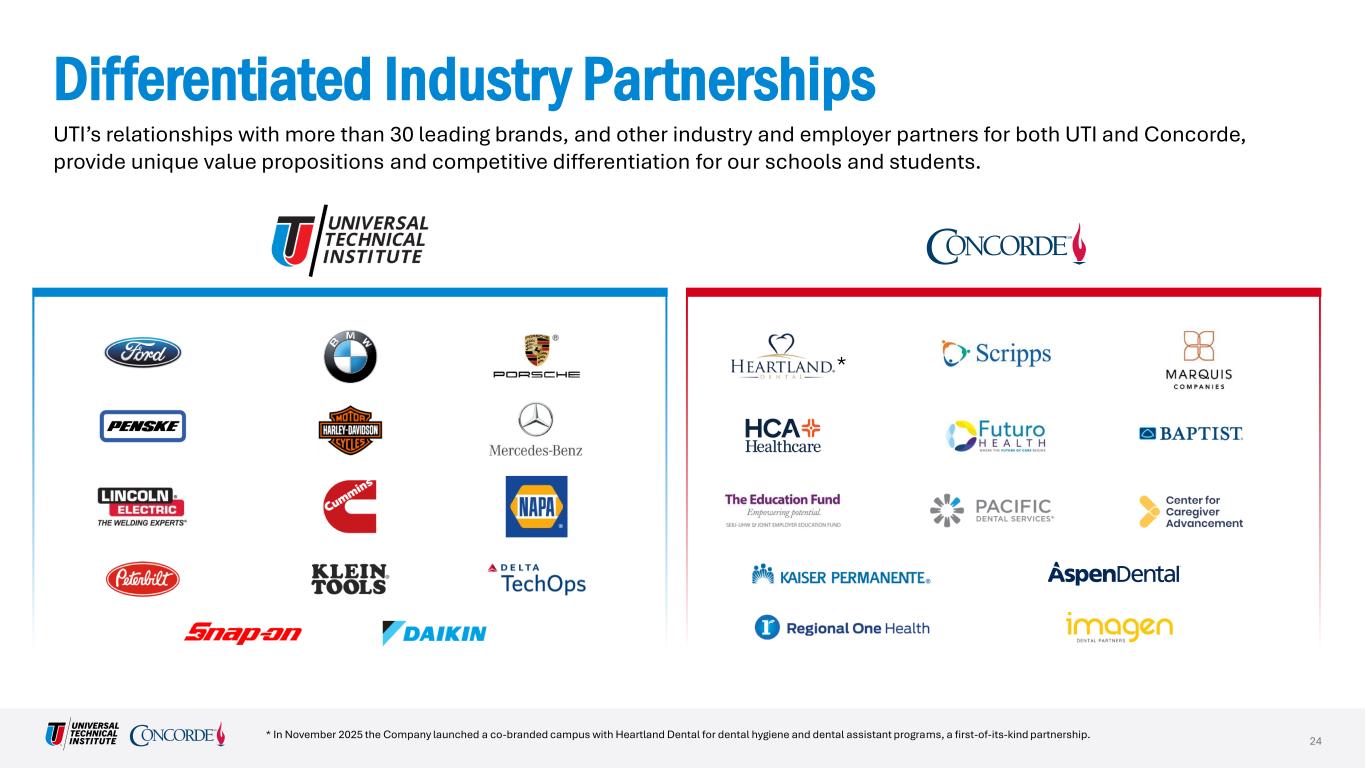

 
Differentiated Industry Partnerships UTI’s relationships with more than 30 leading brands, and other industry and employer partners for both UTI and Concorde, provide unique value propositions and competitive differentiation for our schools and students. * In November 2025 the Company launched a co-branded campus with Heartland Dental for dental hygiene and dental assistant programs, a first-of-its-kind partnership. * 24


 
Non-GAAP Information
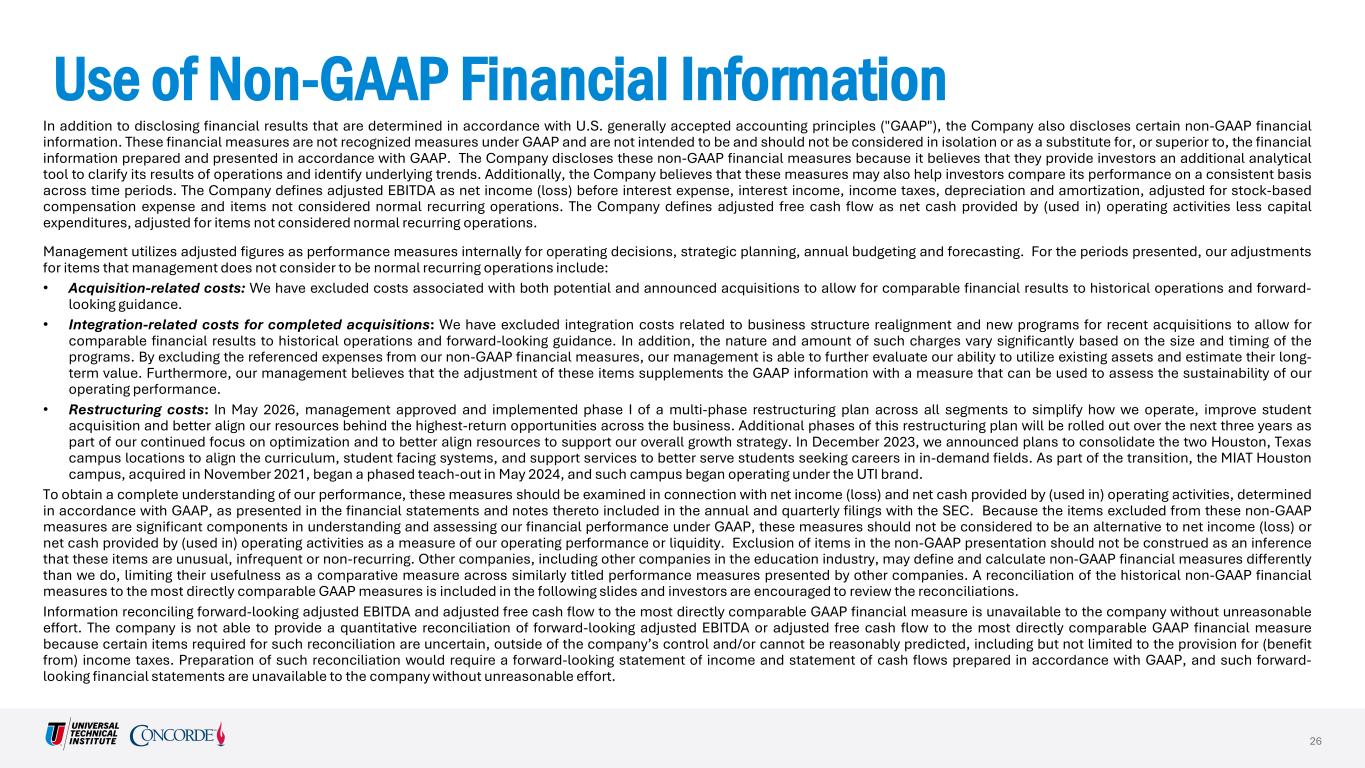

 
Use of Non-GAAP Financial Information In addition to disclosing financial results that are determined in accordance with U.S. generally accepted accounting principles ("GAAP"), the Company also discloses certain non-GAAP financial information. These financial measures are not recognized measures under GAAP and are not intended to be and should not be considered in isolation or as a substitute for, or superior to, the financial information prepared and presented in accordance with GAAP. The Company discloses these non-GAAP financial measures because it believes that they provide investors an additional analytical tool to clarify its results of operations and identify underlying trends. Additionally, the Company believes that these measures may also help investors compare its performance on a consistent basis across time periods. The Company defines adjusted EBITDA as net income (loss) before interest expense, interest income, income taxes, depreciation and amortization, adjusted for stock-based compensation expense and items not considered normal recurring operations. The Company defines adjusted free cash flow as net cash provided by (used in) operating activities less capital expenditures, adjusted for items not considered normal recurring operations. Management utilizes adjusted figures as performance measures internally for operating decisions, strategic planning, annual budgeting and forecasting. For the periods presented, our adjustments for items that management does not consider to be normal recurring operations include: • Acquisition-related costs: We have excluded costs associated with both potential and announced acquisitions to allow for comparable financial results to historical operations and forward- looking guidance. • Integration-related costs for completed acquisitions: We have excluded integration costs related to business structure realignment and new programs for recent acquisitions to allow for comparable financial results to historical operations and forward-looking guidance. In addition, the nature and amount of such charges vary significantly based on the size and timing of the programs. By excluding the referenced expenses from our non-GAAP financial measures, our management is able to further evaluate our ability to utilize existing assets and estimate their long- term value. Furthermore, our management believes that the adjustment of these items supplements the GAAP information with a measure that can be used to assess the sustainability of our operating performance. • Restructuring costs: In May 2026, management approved and implemented phase I of a multi-phase restructuring plan across all segments to simplify how we operate, improve student acquisition and better align our resources behind the highest-return opportunities across the business. Additional phases of this restructuring plan will be rolled out over the next three years as part of our continued focus on optimization and to better align resources to support our overall growth strategy. In December 2023, we announced plans to consolidate the two Houston, Texas campus locations to align the curriculum, student facing systems, and support services to better serve students seeking careers in in-demand fields. As part of the transition, the MIAT Houston campus, acquired in November 2021, began a phased teach-out in May 2024, and such campus began operating under the UTI brand. To obtain a complete understanding of our performance, these measures should be examined in connection with net income (loss) and net cash provided by (used in) operating activities, determined in accordance with GAAP, as presented in the financial statements and notes thereto included in the annual and quarterly filings with the SEC. Because the items excluded from these non-GAAP measures are significant components in understanding and assessing our financial performance under GAAP, these measures should not be considered to be an alternative to net income (loss) or net cash provided by (used in) operating activities as a measure of our operating performance or liquidity. Exclusion of items in the non-GAAP presentation should not be construed as an inference that these items are unusual, infrequent or non-recurring. Other companies, including other companies in the education industry, may define and calculate non-GAAP financial measures differently than we do, limiting their usefulness as a comparative measure across similarly titled performance measures presented by other companies. A reconciliation of the historical non-GAAP financial measures to the most directly comparable GAAP measures is included in the following slides and investors are encouraged to review the reconciliations. Information reconciling forward-looking adjusted EBITDA and adjusted free cash flow to the most directly comparable GAAP financial measure is unavailable to the company without unreasonable effort. The company is not able to provide a quantitative reconciliation of forward-looking adjusted EBITDA or adjusted free cash flow to the most directly comparable GAAP financial measure because certain items required for such reconciliation are uncertain, outside of the company’s control and/or cannot be reasonably predicted, including but not limited to the provision for (benefit from) income taxes. Preparation of such reconciliation would require a forward-looking statement of income and statement of cash flows prepared in accordance with GAAP, and such forward- looking financial statements are unavailable to the company without unreasonable effort. 26
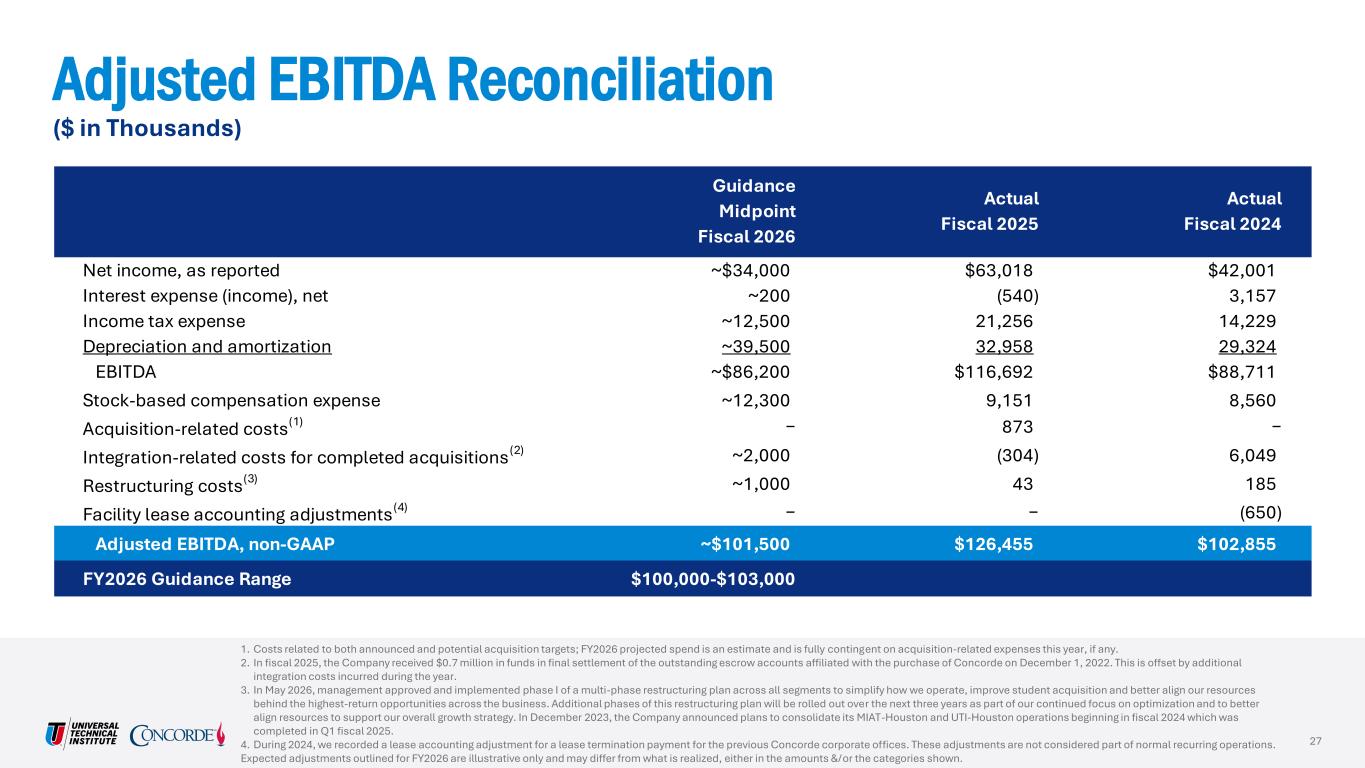

 
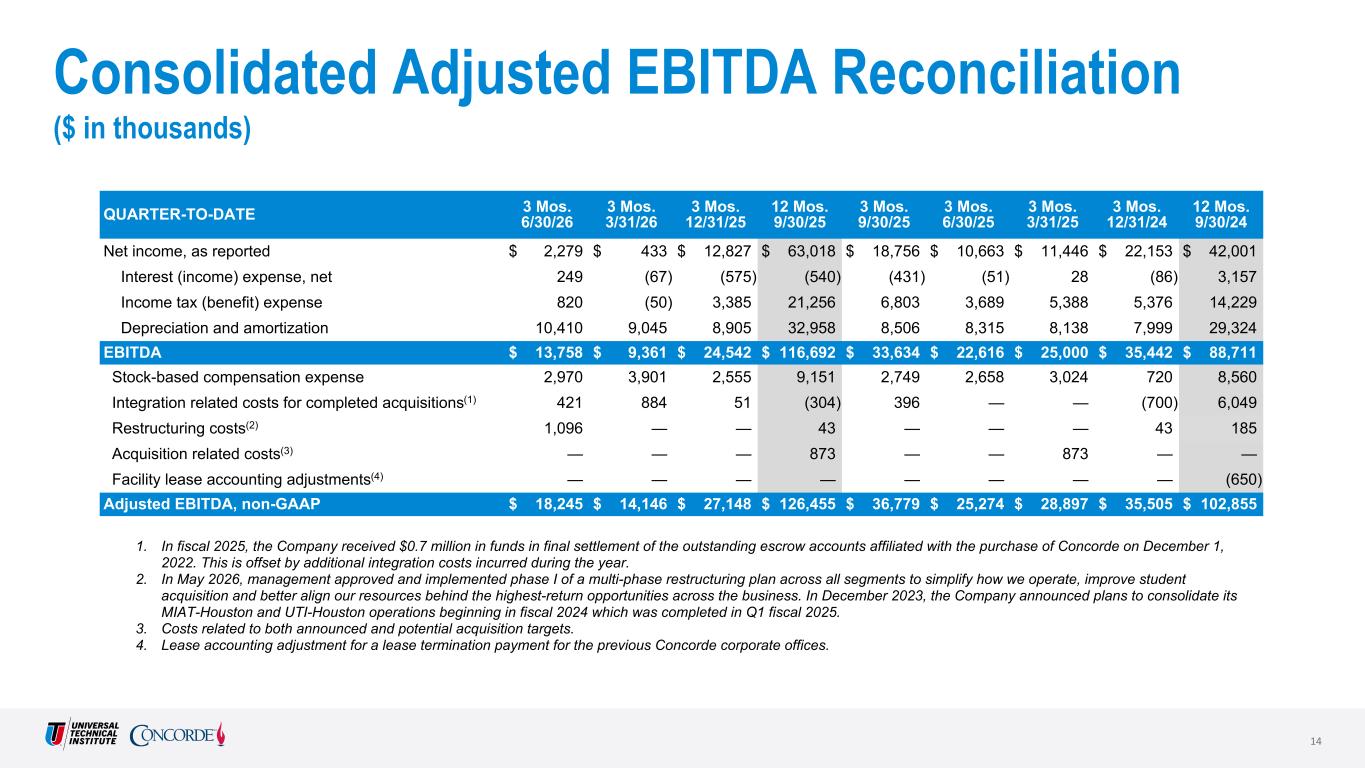
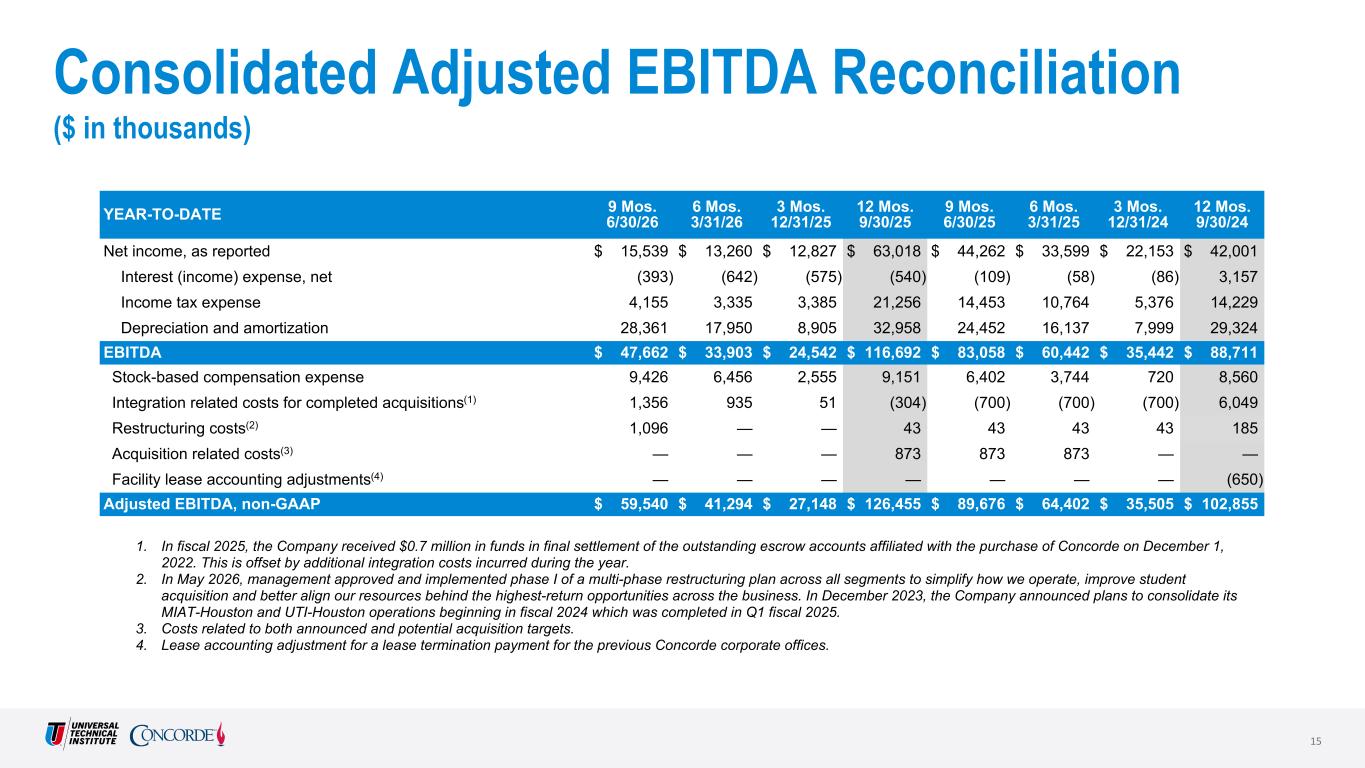
Adjusted EBITDA Reconciliation ($ in Thousands) 1. Costs related to both announced and potential acquisition targets; FY2026 projected spend is an estimate and is fully contingent on acquisition-related expenses this year, if any. 2. In fiscal 2025, the Company received $0.7 million in funds in final settlement of the outstanding escrow accounts affiliated with the purchase of Concorde on December 1, 2022. This is offset by additional integration costs incurred during the year. 3. In May 2026, management approved and implemented phase I of a multi-phase restructuring plan across all segments to simplify how we operate, improve student acquisition and better align our resources behind the highest-return opportunities across the business. Additional phases of this restructuring plan will be rolled out over the next three years as part of our continued focus on optimization and to better align resources to support our overall growth strategy. In December 2023, the Company announced plans to consolidate its MIAT-Houston and UTI-Houston operations beginning in fiscal 2024 which was completed in Q1 fiscal 2025. 4. During 2024, we recorded a lease accounting adjustment for a lease termination payment for the previous Concorde corporate offices. These adjustments are not considered part of normal recurring operations. Expected adjustments outlined for FY2026 are illustrative only and may differ from what is realized, either in the amounts &/or the categories shown. Net income, as reported ~$34,000 $63,018 $42,001 Interest expense (income), net ~200 (540) 3,157 Income tax expense ~12,500 21,256 14,229 Depreciation and amortization ~39,500 32,958 29,324 EBITDA ~$86,200 $116,692 $88,711 Stock-based compensation expense ~12,300 9,151 8,560 Acquisition-related costs(1) − 873 − Integration-related costs for completed acquisitions(2) ~2,000 (304) 6,049 Restructuring costs(3) ~1,000 43 185 Facility lease accounting adjustments(4) − − (650) Adjusted EBITDA, non-GAAP ~$101,500 $126,455 $102,855 FY2026 Guidance Range $100,000-$103,000 Guidance Midpoint Fiscal 2026 Actual Fiscal 2025 Actual Fiscal 2024 27
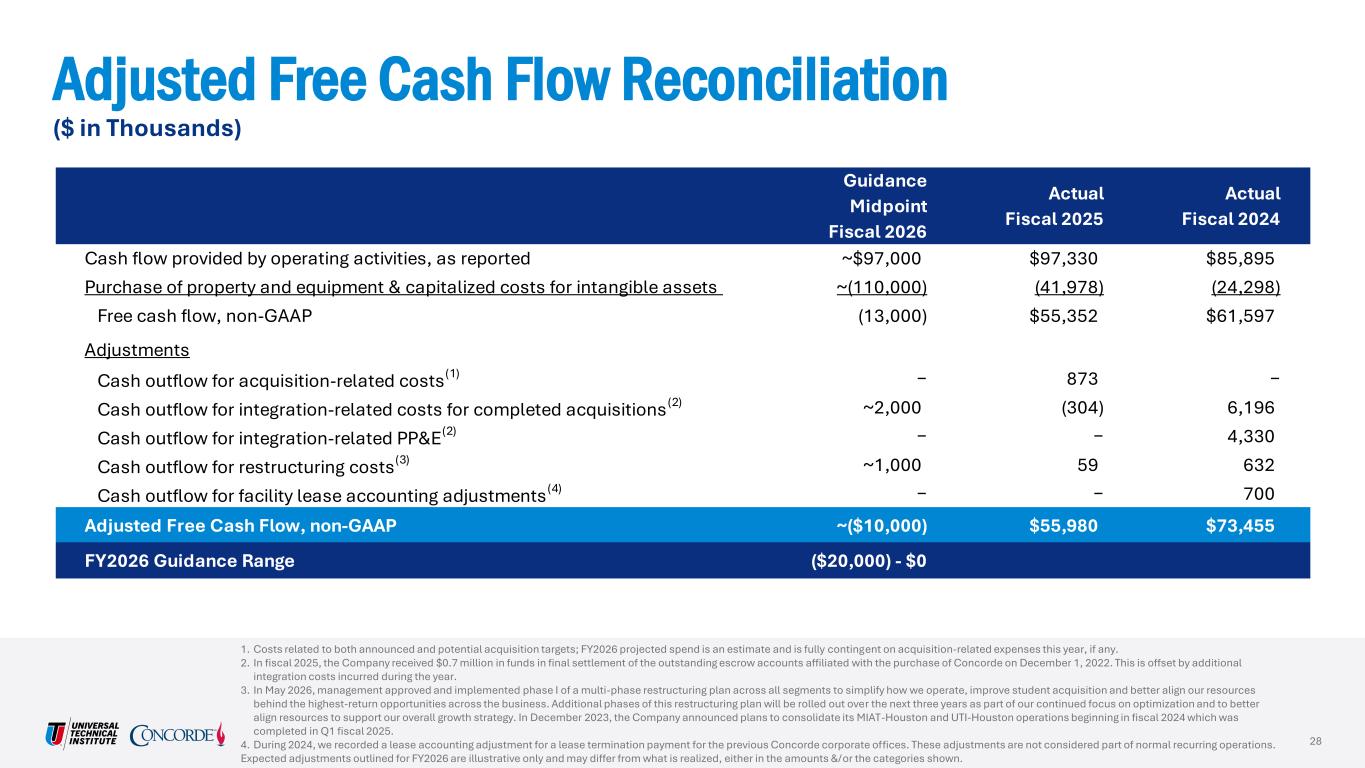

 
Adjusted Free Cash Flow Reconciliation ($ in Thousands) 1. Costs related to both announced and potential acquisition targets; FY2026 projected spend is an estimate and is fully contingent on acquisition-related expenses this year, if any. 2. In fiscal 2025, the Company received $0.7 million in funds in final settlement of the outstanding escrow accounts affiliated with the purchase of Concorde on December 1, 2022. This is offset by additional integration costs incurred during the year. 3. In May 2026, management approved and implemented phase I of a multi-phase restructuring plan across all segments to simplify how we operate, improve student acquisition and better align our resources behind the highest-return opportunities across the business. Additional phases of this restructuring plan will be rolled out over the next three years as part of our continued focus on optimization and to better align resources to support our overall growth strategy. In December 2023, the Company announced plans to consolidate its MIAT-Houston and UTI-Houston operations beginning in fiscal 2024 which was completed in Q1 fiscal 2025. 4. During 2024, we recorded a lease accounting adjustment for a lease termination payment for the previous Concorde corporate offices. These adjustments are not considered part of normal recurring operations. Expected adjustments outlined for FY2026 are illustrative only and may differ from what is realized, either in the amounts &/or the categories shown. Guidance Midpoint Fiscal 2026 Actual Fiscal 2025 Actual Fiscal 2024 Cash flow provided by operating activities, as reported ~$97,000 $97,330 $85,895 Purchase of property and equipment & capitalized costs for intangible assets ~(110,000) (41,978) (24,298) Free cash flow, non-GAAP (13,000) $55,352 $61,597 Adjustments Cash outflow for acquisition-related costs(1) − 873 − Cash outflow for integration-related costs for completed acquisitions (2) ~2,000 (304) 6,196 Cash outflow for integration-related PP&E(2) − − 4,330 Cash outflow for restructuring costs(3) ~1,000 59 632 Cash outflow for facility lease accounting adjustments(4) − − 700 Adjusted Free Cash Flow, non-GAAP ~($10,000) $55,980 $73,455 FY2026 Guidance Range ($20,000) - $0 28



UNIVERSAL TECHNICAL INSTITUTE, INC. Q3 FY2026 FINANCIAL SUPPLEMENT


This presentation contains forward-looking statements within the meaning of the safe harbor from civil liability provided for such statements by the Private Securities Litigation Reform Act of 1995 (set forth in Section 27A of the Securities Act of 1933, as amended, and Section 21E of the Securities Exchange Act of 1934, as amended). Forward-looking statements may contain words such as "goal," "target," "future," "estimate," "expect," "anticipate," "intend," "plan," "believe," "seek," "project," "may," "should," "will," the negative form of these expressions or similar expressions. These statements are based on our management’s current beliefs, expectations and assumptions about future events, conditions and results and on information currently available to us. Although we believe that the expectations reflected in the forward-looking statements are reasonable, we cannot guarantee future results, levels of activity, performance, achievements or events and circumstances reflected in the forward-looking statements will occur. Discussions containing these forward-looking statements may be found, among other places, in the sections entitled “Business,” “Risk Factors” and “Management’s Discussion and Analysis of Financial Condition and Results of Operations” incorporated by reference from our most recent Annual Report on Form 10-K, in our subsequent Quarterly Reports on Form 10-Q and certain of our Current Reports on Form 8-K, as well as any amendments thereto, filed with the Securities and Exchange Commission (the “SEC”). In addition, statements that refer to projections of earnings, revenue, costs or other financial items in future periods; anticipated growth and trends in our business or key markets; cost synergies, growth opportunities and other potential financial and operating benefits; future growth and revenues; future economic conditions and performance; anticipated performance of curriculum; plans, objectives and strategies for future operations; and other characterizations of future events or circumstances, and all other statements that are not statements of historical fact are forward-looking statements. Such statements are based on currently available operating, financial and competitive information and are subject to various risks, uncertainties and assumptions that could cause actual results to differ materially from those anticipated or implied in our forward-looking statements due to a number of factors, including, but not limited to, those set forth under the section entitled “Risk Factors” in our filings with the SEC. Important factors that could affect our actual results include, among other things, failure of our schools to comply with the extensive regulatory requirements for school operations; our failure to maintain eligibility for or our ability to process federal student financial assistance funds; the effect of current and future Title IV Program regulations arising out of negotiated rulemakings, including any potential reductions in funding or restrictions on the use of funds received through Title IV Programs; the effect of future legislative or regulatory initiatives related to veterans’ benefit programs; continued Congressional examination of the for-profit education sector; regulatory investigations of, or actions commenced against, us or other companies in our industry; changes in the state regulatory environment or budgetary constraints; our failure to execute on our growth and diversification strategy, including effectively identifying, establishing and operating additional schools, programs or campuses; our failure to realize the expected benefits of our acquisitions, or our failure to successfully integrate our acquisitions; our failure to improve underutilized capacity at certain of our campuses; enrollment declines or challenges in our students’ ability to find employment as a result of macroeconomic conditions; our failure to maintain and expand existing industry relationships and develop new industry relationships; our ability to update and expand the content of existing programs and develop and integrate new programs in a timely and cost-effective manner while maintaining positive student outcomes; a loss of our senior management or other key employees; failure to comply with the restrictive covenants and our ability to pay the amounts when due under our credit agreements; and other risks that are described from time to time in our public filings. Given these risks, uncertainties and other factors, many of which are beyond our control, you should not place undue reliance on these forward-looking statements. Neither we nor any other person makes any representation as to the accuracy or completeness of these forward-looking statements and, except as required by law, we assume no obligation to update these forward-looking statements publicly, or to revise any forward-looking statements, even if new information becomes available in the future. This presentation also contains estimates and other statistical data made by independent parties, and by us, relating to market size and growth and other data about our industry and our business. This data involves several assumptions and limitations, and you are cautioned not to give undue weight to such estimates. In addition, projections, assumptions and estimates of our future performance and the future performance of the markets in which we operate are necessarily subject to a high degree of uncertainty and risk. Forward-Looking Statements 2


Consolidated Q3 2026 Highlights 3 Q3 2026 Revenue $218.9 million Net Income $2.3 million Adjusted EBITDA $18.2 million Diluted Earnings Per Share $0.04 Note: See Company Press Release and Investor Presentation dated August 5, 2026 for more details on guidance, including non-GAAP reconciliations. Revenue increased 7.2% to $218.9 million. Concorde contributed $80.9 million (11.1% YoY growth), while the UTI division contributed $138.0 million (5.0% YoY growth). Total Full-Time Active Students grew 5.8% year-over-year to 25,131 Net Income was $2.3 million or $0.04 per diluted share Baseline adjusted EBITDA was $27.2 million. Including $9.0 million in growth investments, our reported adjusted EBITDA was $18.2 million. Total available liquidity of $180.5 million, including $40.1 million of short-term investments and $10.4 million of remaining capacity on our revolving credit facility— ample reserves for any potential business needs or new opportunities that may arise. The Company remains well-positioned and confident in delivering its 5-year strategic targets of a 10% Revenue CAGR and Adjusted EBITDA approaching $220M by FY2029.


4 1. For a detailed reconciliation of Non-GAAP measures, see slides 14-18. 3 Mos. 6/30/26 3 Mos. 6/30/25 YoY Change 9 Mos. 6/30/26 9 Mos. 6/30/25 YoY Change Revenues $218.9 $204.3 7.2% $661.2 $613.2 7.8% Operating expenses $215.7 $190.1 13.4% $641.9 $554.7 15.7% Educational services and facilities $118.3 $105.6 12.0% $346.2 $308.2 12.3% Selling, general and administrative $97.3 $84.5 15.1% $295.7 $246.5 20.0% Income from operations $3.2 $14.2 (77.1)% $19.3 $58.5 (67.0)% Total other (expense) income, net $(0.1) $0.2 (173.0)% $0.4 $0.2 82.3% Income tax expense $(0.8) $(3.7) (77.8)% $(4.2) $(14.5) (71.3)% Net income $2.3 $10.7 (78.6)% $15.5 $44.3 (64.9)% Adjusted EBITDA(1) $18.2 $25.3 (27.8)% $59.5 $89.7 (33.6)% Operating cash flow $10.3 $18.1 (42.8)% $17.4 $40.2 (56.7)% Adjusted free cash flow(1) $(21.4) $7.0 (408.0)% $(65.6) $15.0 (538.5)% Purchase of property and equipment $28.2 $11.2 152.0% $80.9 $25.5 217.3% Capitalized costs for intangible assets $3.2 $— —% $4.5 $— —% Consolidated Q3 2026 Summary Results ($ in millions)


5 Consolidated Statements of Operations Trend ($ in thousands, except EPS) 3 Mos. 6/30/26 3 Mos. 3/31/26 3 Mos. 12/31/25 12 Mos. 9/30/25 3 Mos. 9/30/25 3 Mos. 6/30/25 3 Mos. 3/31/25 3 Mos. 9/30/24 12 Mos. 9/30/24 Revenues $ 218,907 $ 221,402 $ 220,844 $ 835,616 $ 222,442 $ 204,298 $ 207,447 $ 201,429 $ 732,687 Operating expenses: Educational services and facilities 118,334 117,429 110,448 420,491 112,258 105,604 102,488 100,141 384,529 Selling, general and administrative 97,328 103,634 94,709 331,656 85,198 84,542 88,106 73,810 289,267 Total operating expenses 215,662 221,063 205,157 752,147 197,456 190,146 190,594 173,951 673,796 Income from operations 3,245 339 15,687 83,469 24,986 14,152 16,853 27,478 58,891 Total other (expense) income, net (146) 44 525 805 573 200 (19) 51 (2,661) Income tax (expense) benefit (820) 50 (3,385) (21,256) (6,803) (3,689) (5,388) (5,376) (14,229) Net Income 2,279 433 12,827 63,018 18,756 10,663 11,446 22,153 42,001 Preferred stock dividends — — — — — — — — (1,097) Income available for distribution 2,279 433 12,827 63,018 18,756 10,663 11,446 22,153 40,904 Income allocated to participating securities — — — — — — — — (2,855) Net income available to common shareholders $ 2,279 $ 433 $ 12,827 $ 63,018 $ 18,756 $ 10,663 $ 11,446 $ 22,153 $ 38,049 Net income per share, diluted $ 0.04 $ 0.01 $ 0.23 $ 1.13 $ 0.34 $ 0.19 $ 0.21 $ 0.40 $ 0.75 EBITDA(1) $ 13,758 $ 9,361 $ 24,542 $ 116,692 $ 33,634 $ 22,616 $ 25,000 $ 35,442 $ 88,711 Total Shares Outstanding (Period End) 55,095 55,061 55,014 54,430 54,430 54,424 54,406 54,366 53,817 Weighted Average Diluted Shares Outstanding 55,935 55,730 55,744 55,615 55,728 55,635 55,442 55,406 50,851 1. For a detailed reconciliation of Non-GAAP measures, see slides 14-18.


6 3 Mos. 3 Mos. 3 Mos. 12 Mos. 3 Mos. 3 Mos. 3 Mos. 3 Mos. 12 Mos. 6/30/26 3/31/26 12/31/25 9/30/25 9/30/25 6/30/25 3/31/25 12/31/24 9/30/24 Revenues 100.0% 100.0% 100.0% 100.0% 100.0% 100.0% 100.0% 100.0% 100.0% Operating Expenses: Educational services and facilities 54.1% 53.0% 50.0% 50.3% 50.5% 51.7% 49.4% 49.8% 52.5% Selling, general and administrative 44.5% 46.8% 42.9% 39.7% 38.3% 41.4% 42.5% 36.6% 39.5% Total operating expenses 98.6% 99.8% 92.9% 90.0% 88.8% 93.1% 91.9% 86.4% 92.0% Income from operations 1.5% 0.2% 7.1% 10.0% 11.2% 6.9% 8.1% 13.6% 8.0% Total other (expense) income, net (0.2)% 0.0% 0.2% 0.1% 0.3% 0.1% 0.0% 0.1% (0.4)% Income tax (expense) benefit (0.4)% 0.0% (1.5)% (2.5)% (3.1)% (1.8)% (2.6)% (2.7)% (1.9)% Net Income 1.0% 0.2% 5.8% 7.6% 8.4% 5.2% 5.5% 11.0% 5.7% Preferred stock dividends —% —% —% —% —% —% —% —% (0.1)% Income available for distribution 1.0% 0.2% 5.8% 7.6% 8.4% 5.2% 5.5% 11.0% 5.6% Income allocated to participating securities —% —% —% —% —% —% —% —% (0.4)% Net income available to common shareholders 1.0% 0.2% 5.8% 7.6% 8.4% 5.2% 5.5% 11.0% 5.2% EBITDA(1) 6.3% 4.2% 11.1% 14.0% 15.1% 11.1% 12.1% 17.6% 12.1% Consolidated Results of Operations Trend Percent of Revenue 1. For a detailed reconciliation of Non-GAAP measures, see slides 14-18.


7 Quarterly Trend – Segment Key Metrics ($ in millions, except revenue per student amounts) 3 Mos. 3 Mos. 3 Mos. 3 Mos. 3 Mos. 3 Mos. 3 Mos. 3 Mos. 3 Mos. 3 Mos. 6/30/26 3/31/26 12/31/25 9/30/25 6/30/25 6/30/26 3/31/26 12/31/25 9/30/25 6/30/25 UTI UTI UTI UTI UTI Concorde Concorde Concorde Concorde Concorde New student starts 3,491 4,110 2,893 7,166 2,829 2,851 3,459 2,556 4,943 2,892 Y/Y growth/(decline) 23.4% 14.5% 5.1% 1.4% (3.0)% (1.4)% 13.1% (0.2)% 11.7% 9.1% Average full-time active students 14,767 15,556 16,347 15,207 14,205 10,364 10,829 10,511 9,842 9,552 Y/Y growth/(decline) 4.0% 5.3% 5.7% 8.1% 8.9% 8.5% 10.2% 9.5% 8.0% 18.8% Revenue per student $9,300 $9,200 $8,700 $9,500 $9,300 $7,800 $7,300 $7,400 $7,900 $7,600 Y/Y growth/(decline) 0.0% 1.1% 2.4% 2.2% 3.3% 2.6% (1.4)% 1.4% 9.7% 1.3% Revenues $138.0 $142.7 $142.8 $144.6 $131.5 $80.9 $78.7 $78.0 $77.8 $72.8 Y/Y growth/(decline) 4.9% 6.3% 8.6% 10.8% 12.3% 11.1% 7.5% 11.4% 18.2% 20.7% Income (loss) from operations $5.8 $4.2 $15.9 $24.2 $17.7 $3.2 $(0.2) $3.8 $5.0 $1.1 Margin 4.2% 2.9% 11.1% 16.7% 13.5% 4.0% (0.3)% 4.9% 6.4% 1.5% Adjusted EBITDA(1) $14.3 $11.3 $22.7 $30.9 $24.3 $6.4 $2.2 $6.2 $7.3 $3.3 Adjusted EBITDA margin 10.3% 7.9% 15.9% 21.4% 18.4% 7.9% 2.7% 7.9% 9.4% 4.5% 1. For a detailed reconciliation of Non-GAAP measures, see slides 14-18.


8 3 Mos. 3 Mos. 3 Mos. 3 Mos. 3 Mos. 3 Mos. 3 Mos. 3 Mos. 6/30/26 6/30/26 6/30/26 6/30/26 6/30/25 6/30/25 6/30/25 6/30/25 UTI Concorde Corporate Consolidated UTI Concorde Corporate Consolidated Revenues $ 138,015 $ 80,892 $ — $ 218,907 $ 131,462 $ 72,836 $ — $ 204,298 Compensation and benefits 58,274 36,699 19,898 114,871 51,230 34,122 17,423 102,775 Advertising 16,243 9,696 208 26,147 15,008 7,534 153 22,695 Occupancy 10,882 6,655 976 18,513 9,920 6,494 233 16,647 Student related 12,326 5,494 — 17,820 7,671 6,122 — 13,793 General operations 6,157 4,605 5,634 16,396 5,532 5,123 3,146 13,801 Depreciation and amortization 7,284 2,751 375 10,410 6,048 1,939 328 8,315 Professional and contract services 2,318 1,297 4,258 7,873 2,360 1,264 4,590 8,214 Other expenses 1,969 711 952 3,632 1,648 1,182 1,076 3,906 Corporate support 16,748 9,813 (26,561) — 14,320 7,933 (22,253) — Total operating expenses $ 132,201 $ 77,721 $ 5,740 $ 215,662 $ 113,737 $ 71,713 $ 4,696 $ 190,146 Income (loss) from operations $ 5,814 $ 3,171 $ (5,740) $ 3,245 $ 17,725 $ 1,123 $ (4,696) $ 14,152 Net income (loss) $ 5,020 $ 3,130 $ (5,871) $ 2,279 $ 16,439 $ 1,084 $ (6,860) $ 10,663 EBITDA(1) $ 13,097 $ 5,922 $ (5,261) $ 13,758 $ 23,775 $ 3,062 $ (4,221) $ 22,616 Adjusted EBITDA(1) $ 14,284 $ 6,400 $ (2,439) $ 18,245 $ 24,239 $ 3,270 $ (2,235) $ 25,274 Adjusted EBITDA margin 10.3% 7.9% —% 8.3% 18.4% 4.5% —% 12.4% 1. For a detailed reconciliation of Non-GAAP measures, see slides 14-18. Segment Results of Operations: Third Quarter ($ in thousands)


9 9 Mos. 9 Mos. 9 Mos. 9 Mos. 9 Mos. 9 Mos. 9 Mos. 9 Mos. 6/30/26 6/30/26 6/30/26 6/30/26 6/30/25 6/30/25 6/30/25 6/30/25 UTI Concorde Corporate Consolidated UTI Concorde Corporate Consolidated Revenues $ 423,577 $ 237,576 $ — $ 661,153 $ 397,168 $ 216,006 $ — $ 613,174 Compensation and benefits 169,703 109,649 58,410 337,762 153,120 98,130 49,575 300,825 Advertising 53,213 28,988 607 82,808 44,536 22,791 551 67,878 Occupancy 32,035 19,255 2,866 54,156 28,245 18,206 674 47,125 Student related 34,648 16,588 — 51,236 26,511 17,010 — 43,521 General operations 21,818 13,534 16,283 51,635 14,479 12,985 8,322 35,786 Depreciation and amortization 20,326 6,991 1,044 28,361 17,947 5,499 1,006 24,452 Professional and contract services 7,516 3,857 13,212 24,585 7,330 3,868 13,457 24,655 Other expenses 5,862 2,345 3,132 11,339 4,860 2,777 2,812 10,449 Corporate support 52,611 29,608 (82,219) — 42,153 23,035 (65,188) — Total operating expenses $ 397,732 $ 230,815 $ 13,335 $ 641,882 $ 339,181 $ 204,301 $ 11,209 $ 554,691 Income (loss) from operations $ 25,845 $ 6,761 $ (13,335) $ 19,271 $ 57,987 $ 11,705 $ (11,209) $ 58,483 Net income (loss) $ 23,420 $ 6,683 $ (14,564) $ 15,539 $ 54,315 $ 11,591 $ (21,644) $ 44,262 EBITDA(1) $ 46,172 $ 13,753 $ (12,263) $ 47,662 $ 75,944 $ 17,204 $ (10,090) $ 83,058 Adjusted EBITDA(1) $ 48,338 $ 14,730 $ (3,528) $ 59,540 $ 77,357 $ 17,680 $ (5,361) $ 89,676 Adjusted EBITDA margin 11.4% 6.2% —% 9.0% 19.5% 8.2% —% 14.6% 1. For a detailed reconciliation of Non-GAAP measures, see slides 14-18. Segment Results of Operations: Year-to-Date ($ in thousands)


10 Consolidated Balance Sheet and Cash Flow Summary ($ in thousands) At: 6/30/26 9/30/25 Cash & cash equivalents $ 130,060 $ 127,361 Short-term investments 40,060 41,784 Total current assets 258,081 246,632 PP&E (net) 338,764 285,852 Right-of-use assets for operating leases 182,004 178,861 Goodwill and intangible assets 53,994 45,811 Notes receivable, less current portion 45,439 41,109 Total assets 897,862 826,139 Operating lease liability, current portion 14,814 16,967 Long term debt, current portion 2,993 2,865 Total current liabilities 198,294 229,671 Operating lease liability 184,623 174,838 Long-term debt 157,041 84,234 Total liabilities 553,556 498,029 Stockholders’ equity 344,306 328,110 Total liabilities & equity $ 897,862 $ 826,139 9 Mos. 6/30/26 9 Mos. 6/30/25 Net cash provided by operating activities $ 17,402 $ 40,226 Purchase of property and equipment (80,900) (25,499) Capitalized costs for intangible assets (4,496) — Purchase of investments (57,347) (54,648) Proceeds from sale of investments 31,668 — Proceeds received upon maturity of investments 31,300 1,874 Proceeds from insurance policy 37 — Net cash used in investing activities (79,738) (78,273) Proceeds from revolving credit facility 195,000 6,000 Payments on revolving credit facility (120,000) (56,000) Payment of term loans and finance leases (2,133) (2,010) Proceeds from stock option exercises — 659 Payment of payroll taxes on stock-based compensation through shares withheld (8,730) (4,675) Net cash provided by (used in) financing activities 64,137 (56,026) Change in cash and restricted cash 1,801 (94,073) Ending balance of cash and restricted cash $ 135,931 $ 73,399


11 Earnings Per Share Trend and Guidance ($ in thousands, except EPS) Guidance Actual Actual Actual Actual Actual Actual Actual Actual Fiscal 2026 Midpoint 3 Mos. 6/30/26 3 Mos. 3/31/26 3 Mos. 12/31/25 12 Mos. 9/30/25 3 Mos. 9/30/25 3 Mos. 6/30/25 3 Mos. 3/31/25 3 Mos. 12/31/24 Net Income ~$32,000-36,000 $ 2,279 $ 433 $ 12,827 $ 63,018 $ 18,756 $ 10,663 $ 11,446 $ 22,153 Weighted average basic shares outstanding ~55,000 55,075 55,033 54,570 54,301 54,425 54,412 54,383 53,987 Basic income per common share ~$0.58-0.65 $ 0.04 $ 0.01 $ 0.24 $ 1.16 $ 0.34 $ 0.20 $ 0.21 $ 0.41 Weighted average basic shares outstanding ~55,000 55,075 55,033 54,570 54,301 54,425 54,412 54,383 53,987 Dilutive effect related to employee stock plans ~1,300 860 697 1,175 1,314 1,303 1,223 1,059 1,419 Weighted average diluted shares outstanding ~56,300 55,935 55,730 55,745 55,615 55,728 55,635 55,442 55,406 Diluted income per common share ~$0.57-0.64 $ 0.04 $ 0.01 $ 0.23 $ 1.13 $ 0.34 $ 0.19 $ 0.21 $ 0.40


12 Leverage Ratios Leverage as of 6/30/2026 Current Loan Balances $160.0M LTM EBITDA $96.2M Cash, Cash Equivalents, and Short-Term Investments $170.1M Gross Leverage Ratio 1.66x Net Leverage Ratio (0.10)x Proforma Leverage 9/30/2026 Note Balances, net (Projected) ~$95M LTM EBITDA - FY 2026 Guidance Midpoint ~$101.5M Cash, Cash Equivalents, and Short-Term Investments (Projected) ~$145.0M Gross Leverage Ratio ~0.95x Net Leverage Ratio ~(0.47)x 9/30/2026 proforma leverage calculation is based upon midpoint of the adjusted EBITDA guidance range and projected year-end cash balance, both of which will depend on actual company performance. For a detailed reconciliation of Non-GAAP measures, see slides 14-18. Note: Use of the revolver will continue to be evaluated throughout the year and used as needed to satisfy regulatory requirements &/or debt covenants. Any change to the outstanding revolver balance would affect gross leverage but have no impact on net leverage. Debt as of 6/30/2026 Term Loan: Avondale Campus Original Note Amount $31.2M Inception Date 5/12/2021 Rate* Fixed/Floating Maturity 7 years Current Note Balance $26.8M Term Loan: Lisle Campus Original Note Amount $38.0M Inception Date 4/14/2022 Rate** Fixed/Floating Maturity 7 years Current Note Balance $35.4M Revolving Credit Facility Total Capacity $125.0M Inception Date 11/21/2022 Rate*** Floating Maturity 5 years Current Loan Balance $95.0M *Avondale rate is 50% fixed at 1.45% + 50% Floating @ SOFR plus 2% Margin and a tranche adjustment of 0.046% **Lisle rate is 50% fixed at 4.69% + 50% Floating @ SOFR plus 2% Margin ***Revolver rate is SOFR plus 1.75% to 2.25% Margin based on UTI's Total Leverage


13 In addition to disclosing financial results that are determined in accordance with U.S. generally accepted accounting principles ("GAAP"), the Company also discloses certain non-GAAP financial information in this press release and may similarly disclose non-GAAP financial information on the related conference call. These financial measures are not recognized measures under GAAP and are not intended to be and should not be considered in isolation or as a substitute for, or superior to, the financial information prepared and presented in accordance with GAAP. The Company discloses these non-GAAP financial measures because it believes that they provide investors an additional analytical tool to clarify its results of operations and identify underlying trends. Additionally, the Company believes that these measures may also help investors compare its performance on a consistent basis across time periods. Additional details on our non-GAAP measures and the tables reconciling these measures to the most directly comparable GAAP measure are provided below. Management utilizes adjusted figures as performance measures internally for operating decisions, strategic planning, annual budgeting and forecasting. For the periods presented, our adjustments for items that management does not consider to be normal recurring operations include: • Acquisition-related costs: We have excluded costs associated with both potential and announced acquisitions to allow for comparable financial results to historical operations and forward-looking guidance. • Integration-related costs for completed acquisitions: We have excluded integration costs related to business structure realignment and new programs for recent acquisitions to allow for comparable financial results to historical operations and forward-looking guidance. In addition, the nature and amount of such charges vary significantly based on the size and timing of the programs. By excluding the referenced expenses from our non-GAAP financial measures, our management is able to further evaluate our ability to utilize existing assets and estimate their long-term value. Furthermore, our management believes that the adjustment of these items supplements the GAAP information with a measure that can be used to assess the sustainability of our operating performance. • Restructuring costs: In May 2026, management approved and implemented phase I of a multi-phase restructuring plan across all segments to simplify how we operate, improve student acquisition and better align our resources behind the highest-return opportunities across the business. Additional phases of this restructuring plan will be rolled out over the next three years as part of our continued focus on optimization and to better align resources to support our overall growth strategy. In December 2023, we announced plans to consolidate the two Houston, Texas campus locations to align the curriculum, student facing systems, and support services to better serve students seeking careers in in-demand fields. As part of the transition, the MIAT Houston campus, acquired in November 2021, began a phased teach-out in May 2024, and such campus began operating under the UTI brand. To obtain a complete understanding of our performance, these measures should be examined in connection with net income (loss) and net cash provided by (used in) operating activities, determined in accordance with GAAP, as presented in the financial statements and notes thereto included in the annual and quarterly filings with the Securities and Exchange Commission (“SEC”). Because the items excluded from these non-GAAP measures are significant components in understanding and assessing our financial performance under GAAP, these measures should not be considered to be an alternative to net income (loss) or net cash provided by (used in) operating activities as a measure of our operating performance or liquidity. Exclusion of items in the non-GAAP presentation should not be construed as an inference that these items are unusual, infrequent or non-recurring. Other companies, including other companies in the education industry, may define and calculate non-GAAP financial measures differently than we do, limiting their usefulness as a comparative measure across similarly titled performance measures presented by other companies. A reconciliation of the historical non-GAAP financial measures to the most directly comparable GAAP measures is provided below and investors are encouraged to review the reconciliations. Information reconciling forward-looking adjusted EBITDA and adjusted free cash flow to the most directly comparable GAAP financial measure is unavailable to the company without unreasonable effort. The company is not able to provide a quantitative reconciliation of forward-looking adjusted EBITDA or adjusted free cash flow to the most directly comparable GAAP financial measure because certain items required for such reconciliation are uncertain, outside of the company’s control and/or cannot be reasonably predicted, including but not limited to the provision for (benefit from) income taxes. Preparation of such reconciliation would require a forward-looking statement of income and statement of cash flows prepared in accordance with GAAP, and such forward-looking financial statements are unavailable to the company without unreasonable effort. Use of Non-GAAP Financial Information


14 QUARTER-TO-DATE 3 Mos. 6/30/26 3 Mos. 3/31/26 3 Mos. 12/31/25 12 Mos. 9/30/25 3 Mos. 9/30/25 3 Mos. 6/30/25 3 Mos. 3/31/25 3 Mos. 12/31/24 12 Mos. 9/30/24 Net income, as reported $ 2,279 $ 433 $ 12,827 $ 63,018 $ 18,756 $ 10,663 $ 11,446 $ 22,153 $ 42,001 Interest (income) expense, net 249 (67) (575) (540) (431) (51) 28 (86) 3,157 Income tax (benefit) expense 820 (50) 3,385 21,256 6,803 3,689 5,388 5,376 14,229 Depreciation and amortization 10,410 9,045 8,905 32,958 8,506 8,315 8,138 7,999 29,324 EBITDA $ 13,758 $ 9,361 $ 24,542 $ 116,692 $ 33,634 $ 22,616 $ 25,000 $ 35,442 $ 88,711 Stock-based compensation expense 2,970 3,901 2,555 9,151 2,749 2,658 3,024 720 8,560 Integration related costs for completed acquisitions(1) 421 884 51 (304) 396 — — (700) 6,049 Restructuring costs(2) 1,096 — — 43 — — — 43 185 Acquisition related costs(3) — — — 873 — — 873 — — Facility lease accounting adjustments(4) — — — — — — — — (650) Adjusted EBITDA, non-GAAP $ 18,245 $ 14,146 $ 27,148 $ 126,455 $ 36,779 $ 25,274 $ 28,897 $ 35,505 $ 102,855 Consolidated Adjusted EBITDA Reconciliation ($ in thousands) 1. In fiscal 2025, the Company received $0.7 million in funds in final settlement of the outstanding escrow accounts affiliated with the purchase of Concorde on December 1, 2022. This is offset by additional integration costs incurred during the year. 2. In May 2026, management approved and implemented phase I of a multi-phase restructuring plan across all segments to simplify how we operate, improve student acquisition and better align our resources behind the highest-return opportunities across the business. In December 2023, the Company announced plans to consolidate its MIAT-Houston and UTI-Houston operations beginning in fiscal 2024 which was completed in Q1 fiscal 2025. 3. Costs related to both announced and potential acquisition targets. 4. Lease accounting adjustment for a lease termination payment for the previous Concorde corporate offices.


15 YEAR-TO-DATE 9 Mos. 6/30/26 6 Mos. 3/31/26 3 Mos. 12/31/25 12 Mos. 9/30/25 9 Mos. 6/30/25 6 Mos. 3/31/25 3 Mos. 12/31/24 12 Mos. 9/30/24 Net income, as reported $ 15,539 $ 13,260 $ 12,827 $ 63,018 $ 44,262 $ 33,599 $ 22,153 $ 42,001 Interest (income) expense, net (393) (642) (575) (540) (109) (58) (86) 3,157 Income tax expense 4,155 3,335 3,385 21,256 14,453 10,764 5,376 14,229 Depreciation and amortization 28,361 17,950 8,905 32,958 24,452 16,137 7,999 29,324 EBITDA $ 47,662 $ 33,903 $ 24,542 $ 116,692 $ 83,058 $ 60,442 $ 35,442 $ 88,711 Stock-based compensation expense 9,426 6,456 2,555 9,151 6,402 3,744 720 8,560 Integration related costs for completed acquisitions(1) 1,356 935 51 (304) (700) (700) (700) 6,049 Restructuring costs(2) 1,096 — — 43 43 43 43 185 Acquisition related costs(3) — — — 873 873 873 — — Facility lease accounting adjustments(4) — — — — — — — (650) Adjusted EBITDA, non-GAAP $ 59,540 $ 41,294 $ 27,148 $ 126,455 $ 89,676 $ 64,402 $ 35,505 $ 102,855 Consolidated Adjusted EBITDA Reconciliation ($ in thousands) 1. In fiscal 2025, the Company received $0.7 million in funds in final settlement of the outstanding escrow accounts affiliated with the purchase of Concorde on December 1, 2022. This is offset by additional integration costs incurred during the year. 2. In May 2026, management approved and implemented phase I of a multi-phase restructuring plan across all segments to simplify how we operate, improve student acquisition and better align our resources behind the highest-return opportunities across the business. In December 2023, the Company announced plans to consolidate its MIAT-Houston and UTI-Houston operations beginning in fiscal 2024 which was completed in Q1 fiscal 2025. 3. Costs related to both announced and potential acquisition targets. 4. Lease accounting adjustment for a lease termination payment for the previous Concorde corporate offices.


16 Adjusted EBITDA Reconciliation By Segment ($ in thousands) QUARTER-TO-DATE 3 Mos. 6/30/26 3 Mos. 6/30/25 3 Mos. 6/30/26 3 Mos. 6/30/25 3 Mos. 6/30/26 3 Mos. 6/30/25 UTI UTI Concorde Concorde Corporate Corporate Net income (loss), as reported $ 5,020 $ 16,439 $ 3,130 $ 1,084 $ (5,871) $ (6,860) Interest expense (income), net 793 1,288 41 39 (585) (1,378) Income tax (benefit) expense — — — — 820 3,689 Depreciation and amortization 7,284 6,048 2,751 1,939 375 328 EBITDA $ 13,097 $ 23,775 $ 5,922 $ 3,062 $ (5,261) $ (4,221) Stock-based compensation expense 475 464 248 208 2,247 1,986 Integration related costs for completed acquisitions — — — — 421 — Restructuring costs(1) 712 — 230 — 154 — Adjusted EBITDA, non-GAAP $ 14,284 $ 24,239 $ 6,400 $ 3,270 $ (2,439) $ (2,235) 1. In May 2026, management approved and implemented phase I of a multi-phase restructuring plan across all segments to simplify how we operate, improve student acquisition and better align our resources behind the highest-return opportunities across the business. In December 2023, the Company announced plans to consolidate its MIAT-Houston and UTI-Houston operations beginning in fiscal 2024 which was completed in Q1 fiscal 2025.


17 Adjusted EBITDA Reconciliation By Segment ($ in thousands) YEAR-TO-DATE 9 Mos. 6/30/26 9 Mos. 6/30/25 9 Mos. 6/30/26 9 Mos. 6/30/25 9 Mos. 6/30/26 9 Mos. 6/30/25 UTI UTI Concorde Concorde Corporate Corporate Net income (loss), as reported $ 23,420 $ 54,315 $ 6,683 $ 11,591 $ (14,564) $ (21,644) Interest expense (income), net 2,426 3,682 79 114 (2,898) (3,905) Income tax expense — — — — 4,155 14,453 Depreciation and amortization 20,326 17,947 6,991 5,499 1,044 1,006 EBITDA $ 46,172 $ 75,944 $ 13,753 $ 17,204 $ (12,263) $ (10,090) Stock-based compensation expense 1,454 1,370 747 476 7,225 4,556 Integration related costs for completed acquisitions(1) — — — — 1,356 (700) Restructuring costs(2) 712 43 230 — 154 — Acquisition related costs(3) — — — — — 873 Adjusted EBITDA, non-GAAP $ 48,338 $ 77,357 $ 14,730 $ 17,680 $ (3,528) $ (5,361) 1. In fiscal 2025, the Company received $0.7 million in funds in final settlement of the outstanding escrow accounts affiliated with the purchase of Concorde on December 1, 2022. This is offset by additional integration costs incurred during the year. 2. In May 2026, management approved and implemented phase I of a multi-phase restructuring plan across all segments to simplify how we operate, improve student acquisition and better align our resources behind the highest-return opportunities across the business. In December 2023, the Company announced plans to consolidate its MIAT-Houston and UTI-Houston operations beginning in fiscal 2024 which was completed in Q1 fiscal 2025. 3. Costs related to both announced and potential acquisition targets.


18 3 Mos. 6/30/26 3 Mos. 6/30/25 9 Mos. 6/30/26 9 Mos. 6/30/25 Cash flow provided by operating activities, as reported $10,333 $18,053 $17,402 $40,226 Purchase of property and equipment (28,239) (11,207) (80,900) (25,499) Capitalized costs for intangible assets (3,243) — (4,496) — Free cash flow, non-GAAP $(21,149) $6,846 $(67,994) $14,727 Adjustments: Cash outflow (inflow) for integration-related costs for completed acquisitions(1) 546 — 1,986 (700) Cash outflow for acquisition-related costs(2) — 112 — 873 Cash outflow for restructuring costs(3) 411 4 411 59 Adjusted free cash flow, non-GAAP $(20,192) $6,962 $(65,597) $14,959 1. In fiscal 2025, the Company received $0.7 million in funds in final settlement of the outstanding escrow accounts affiliated with the purchase of Concorde on December 1, 2022. This is offset by additional integration costs incurred during the year. 2. Costs related to both announced and potential acquisition targets. 3. In May 2026, management approved and implemented phase I of a multi-phase restructuring plan across all segments to simplify how we operate, improve student acquisition and better align our resources behind the highest-return opportunities across the business. In December 2023, the Company announced plans to consolidate its MIAT-Houston and UTI-Houston operations beginning in fiscal 2024 which was completed in Q1 fiscal 2025. Consolidated Adjusted Free Cash Flow ($ in thousands)


THANK YOU