Utz Brands Reports Record First Quarter Net Sales
Hanover, PA – May 12, 2022 – Utz Brands, Inc. (NYSE: UTZ) (“Utz” or the “Company”), a leading U.S. manufacturer of branded salty snacks, today reported financial results for the Company’s fiscal first quarter ended April 3, 2022.
Highlights:
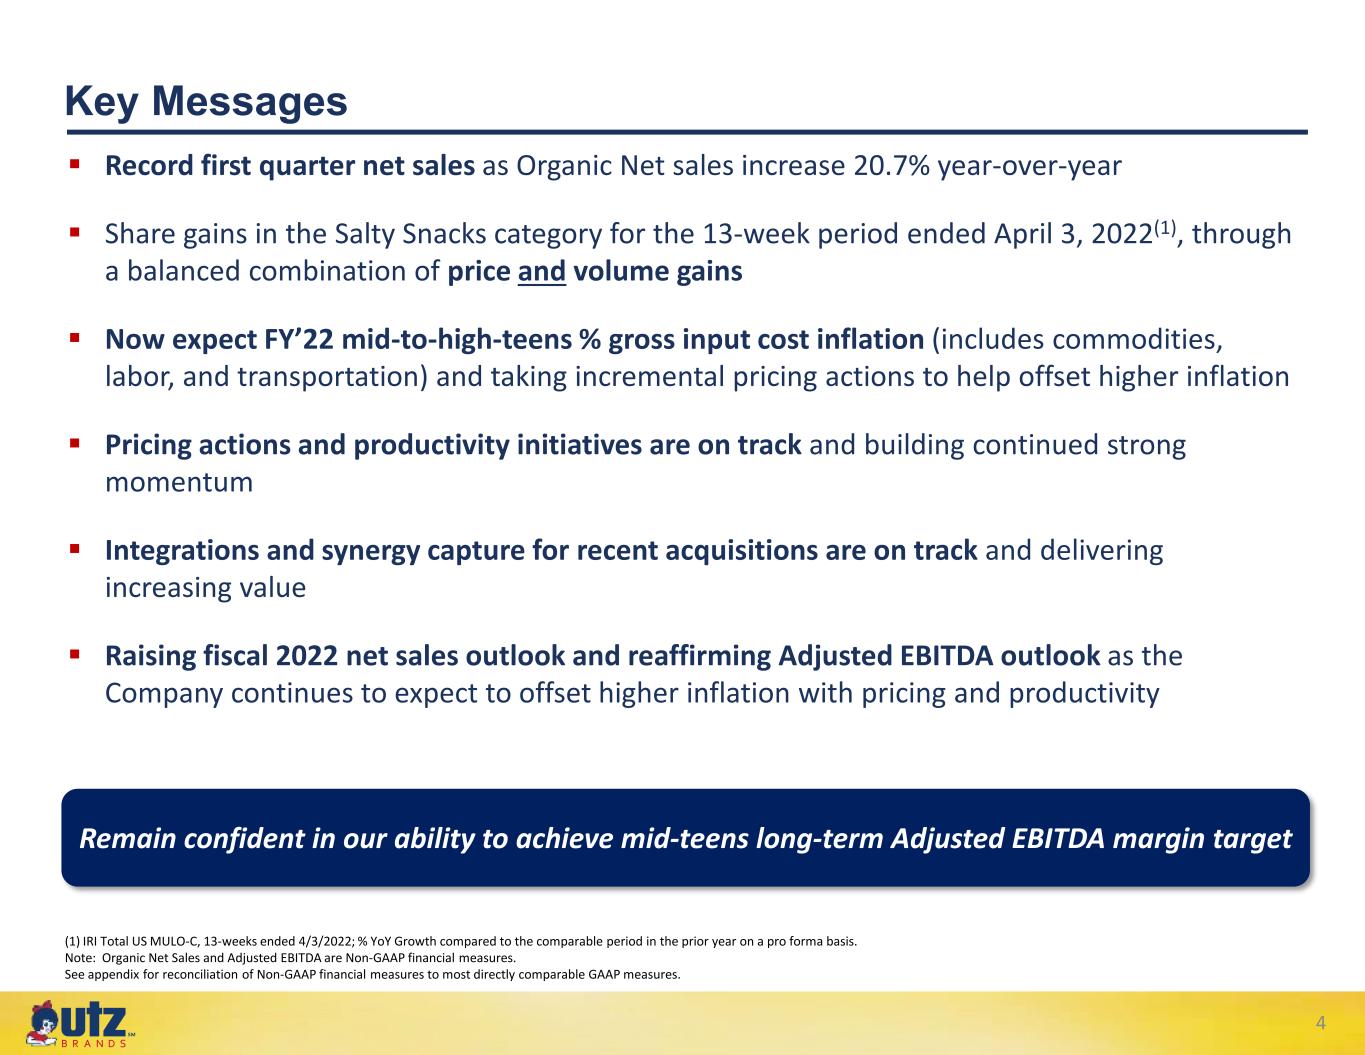
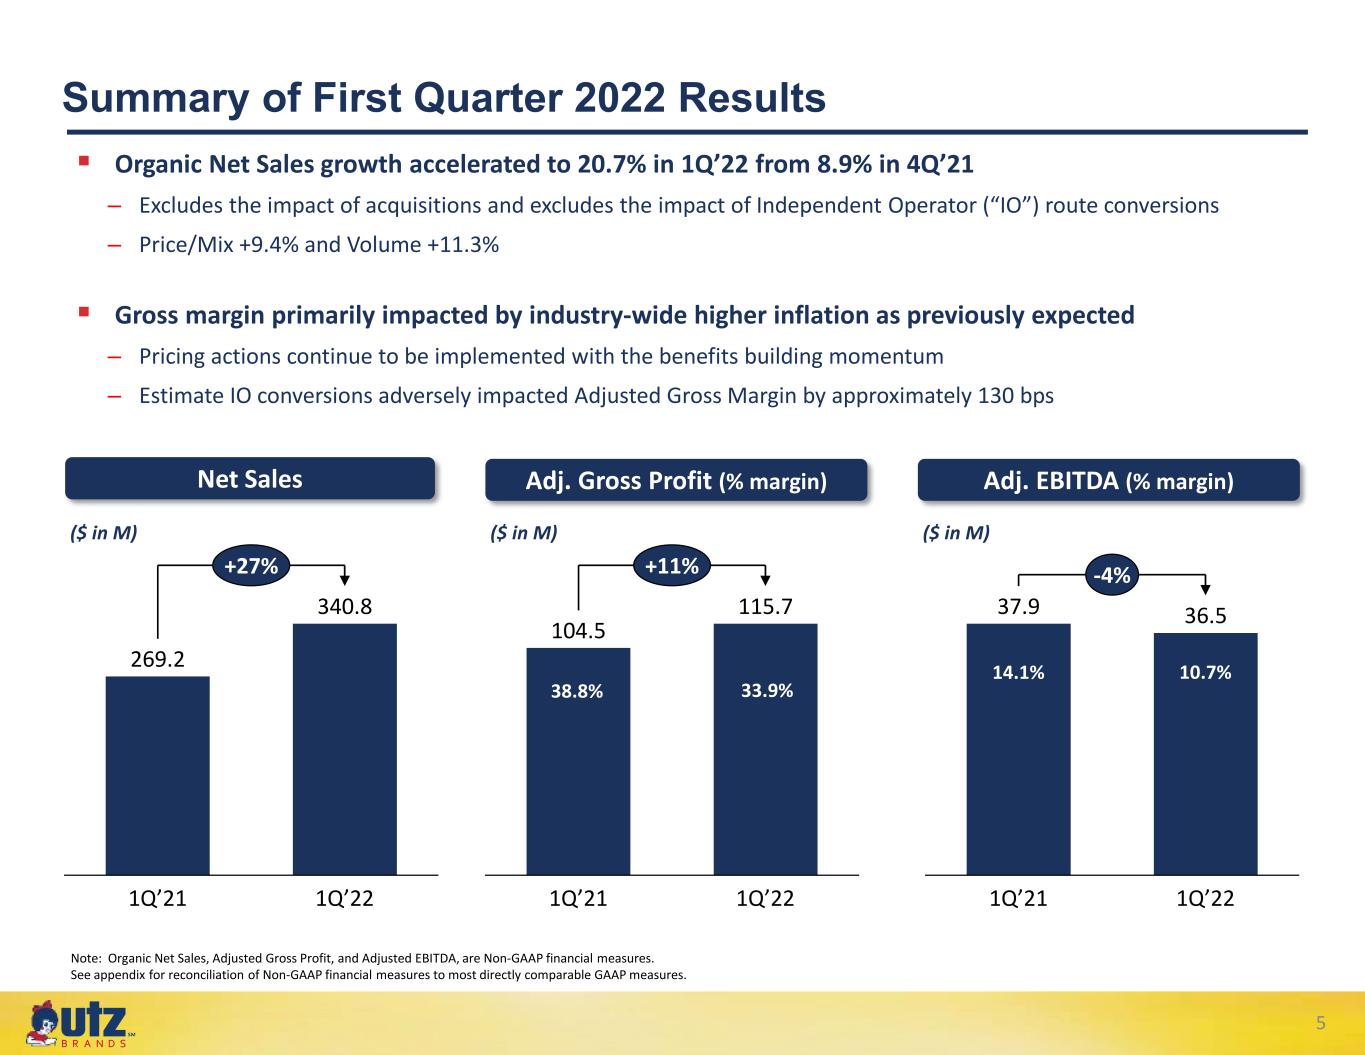
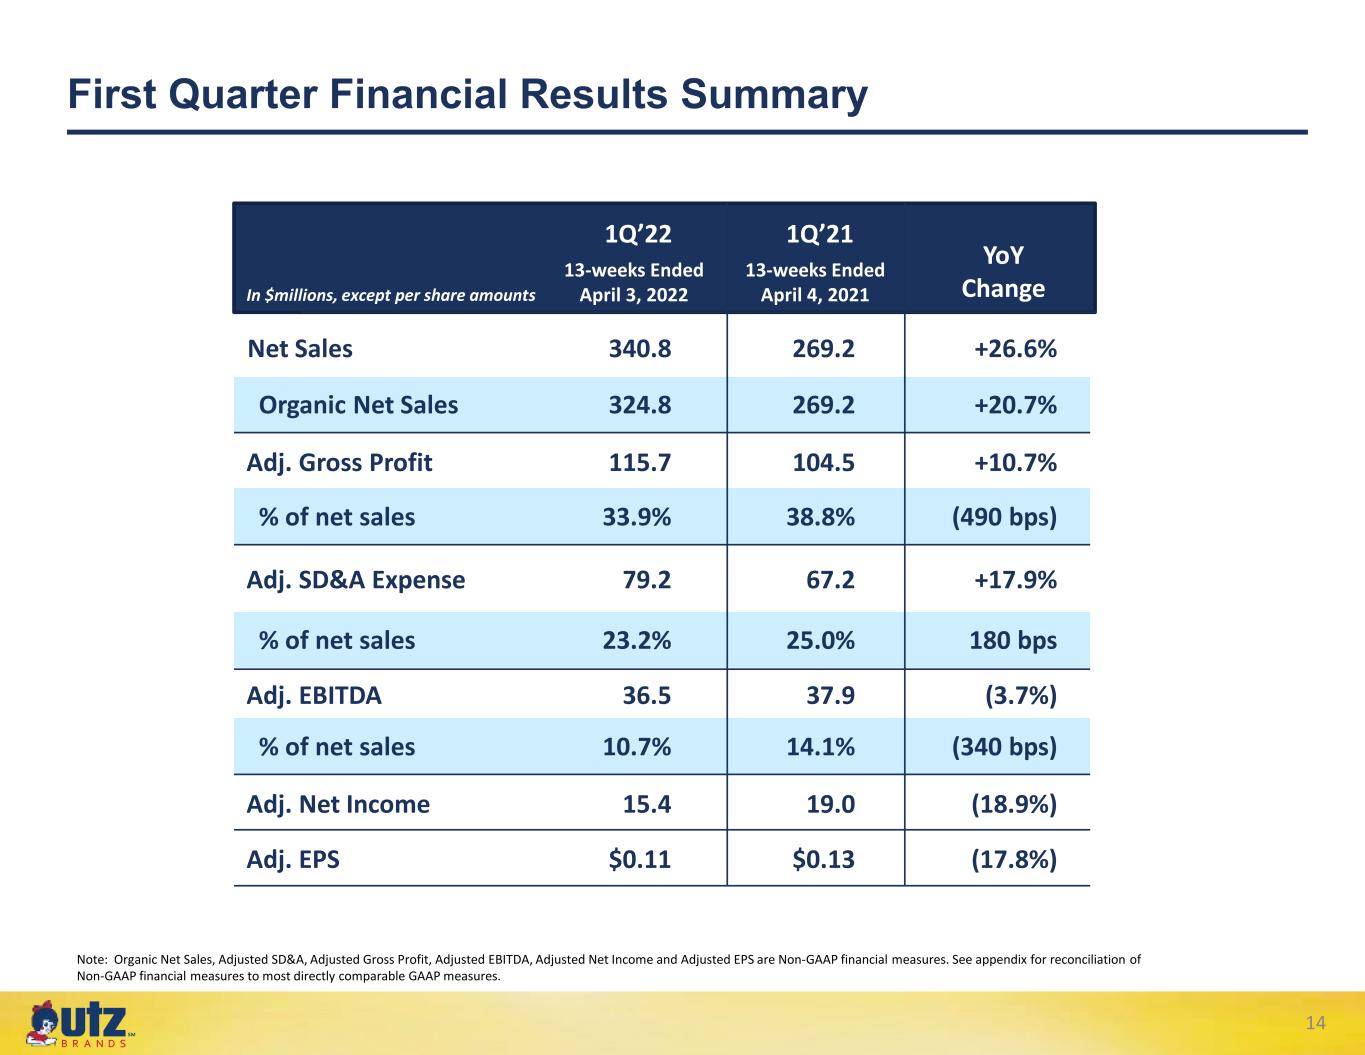
•Net sales increased 26.6% year-over-year. Organic Net Sales increased 20.7% year over year.
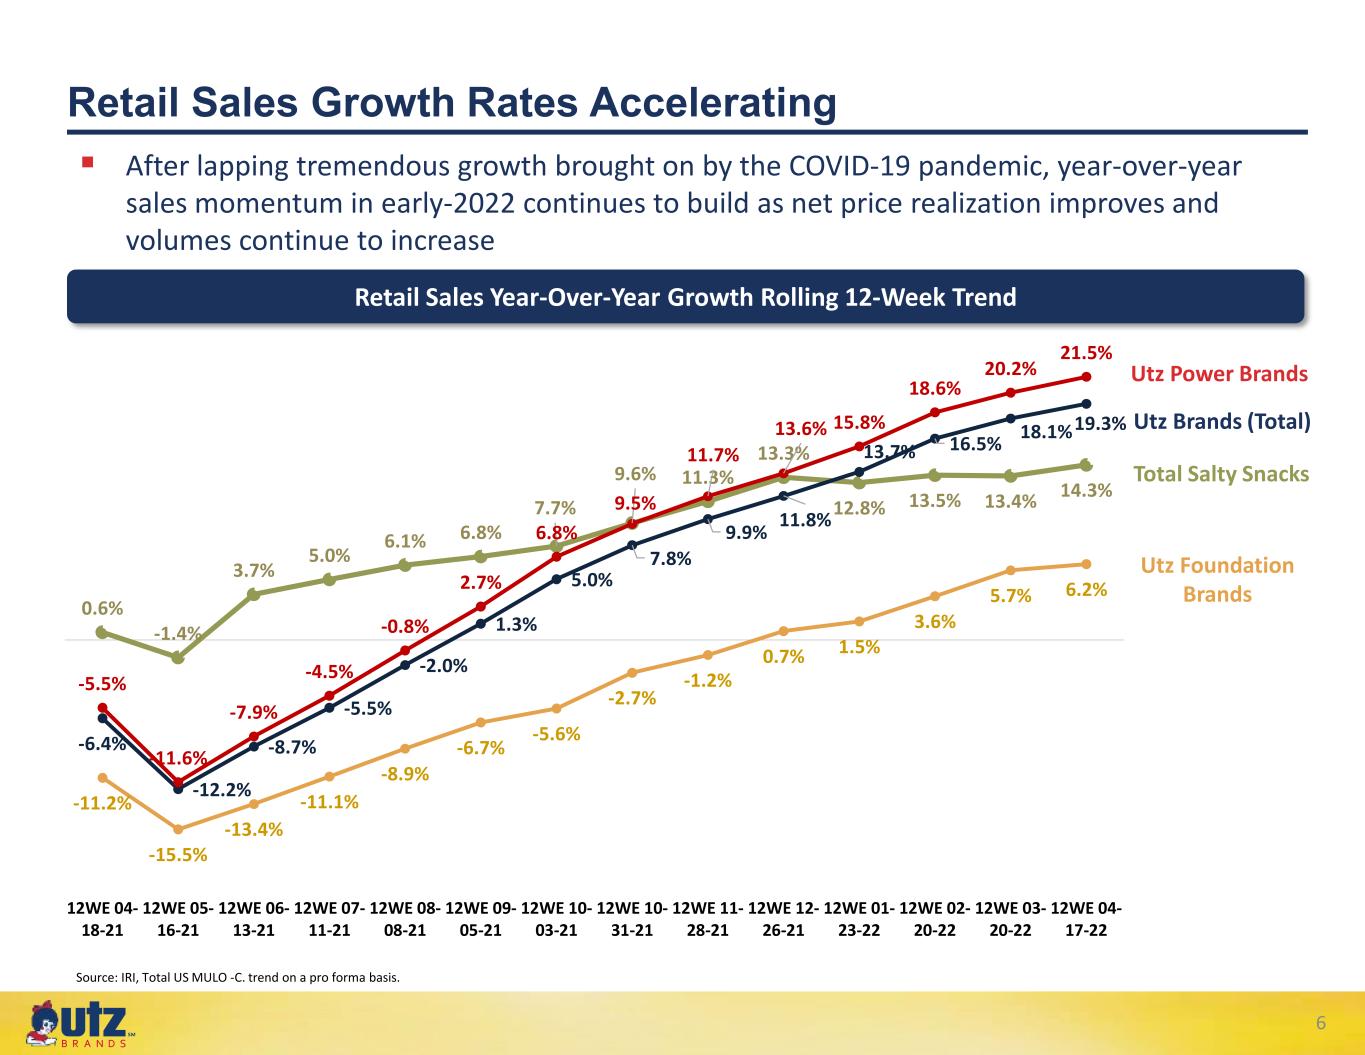
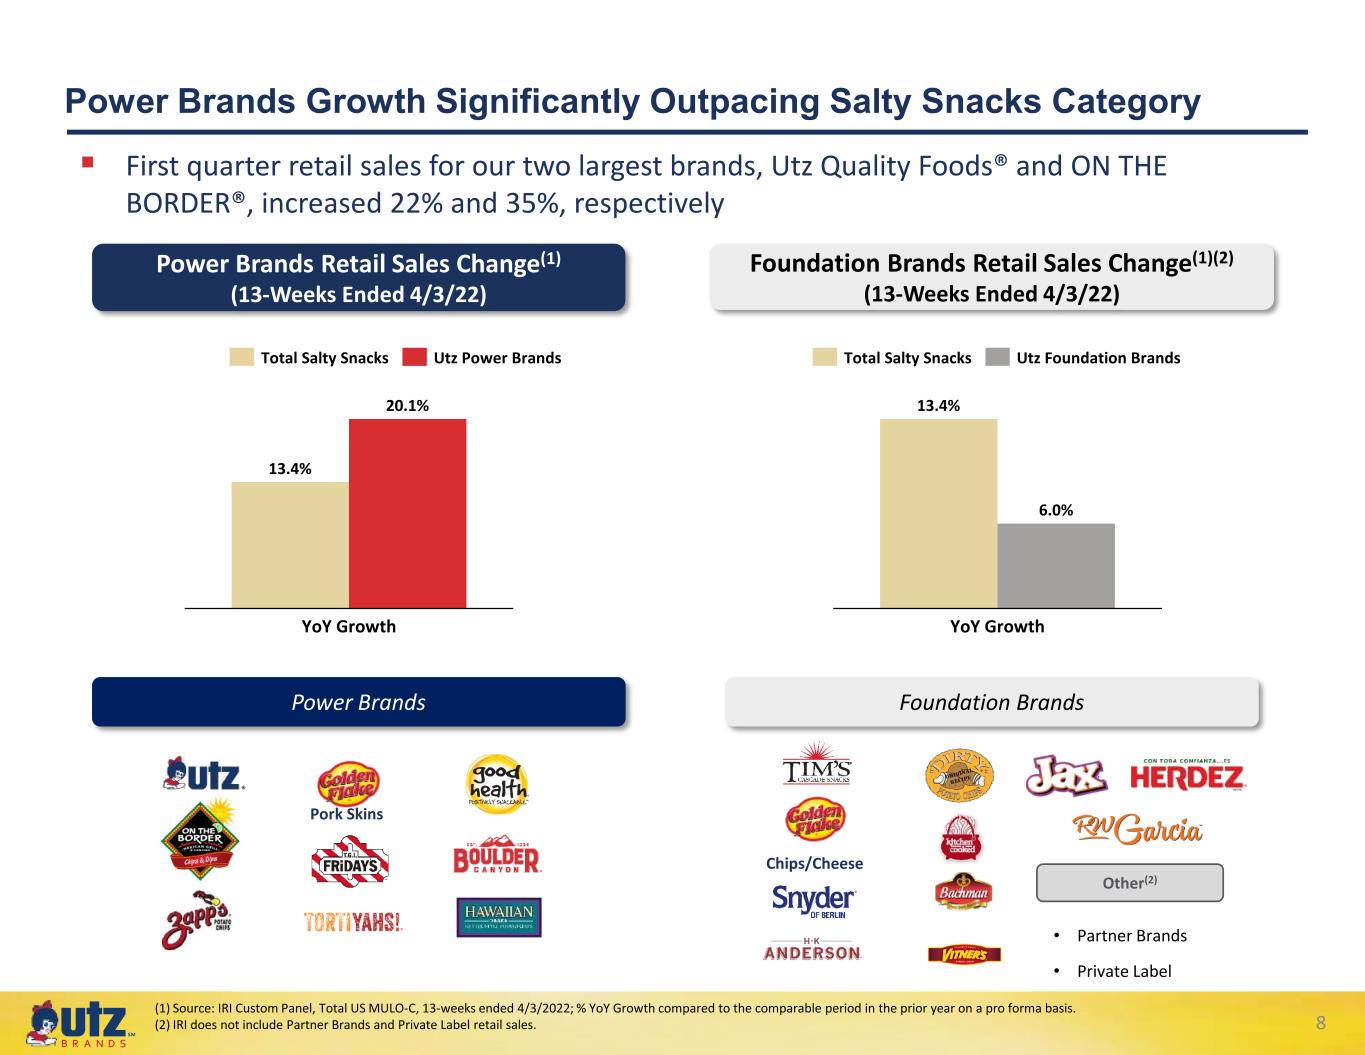
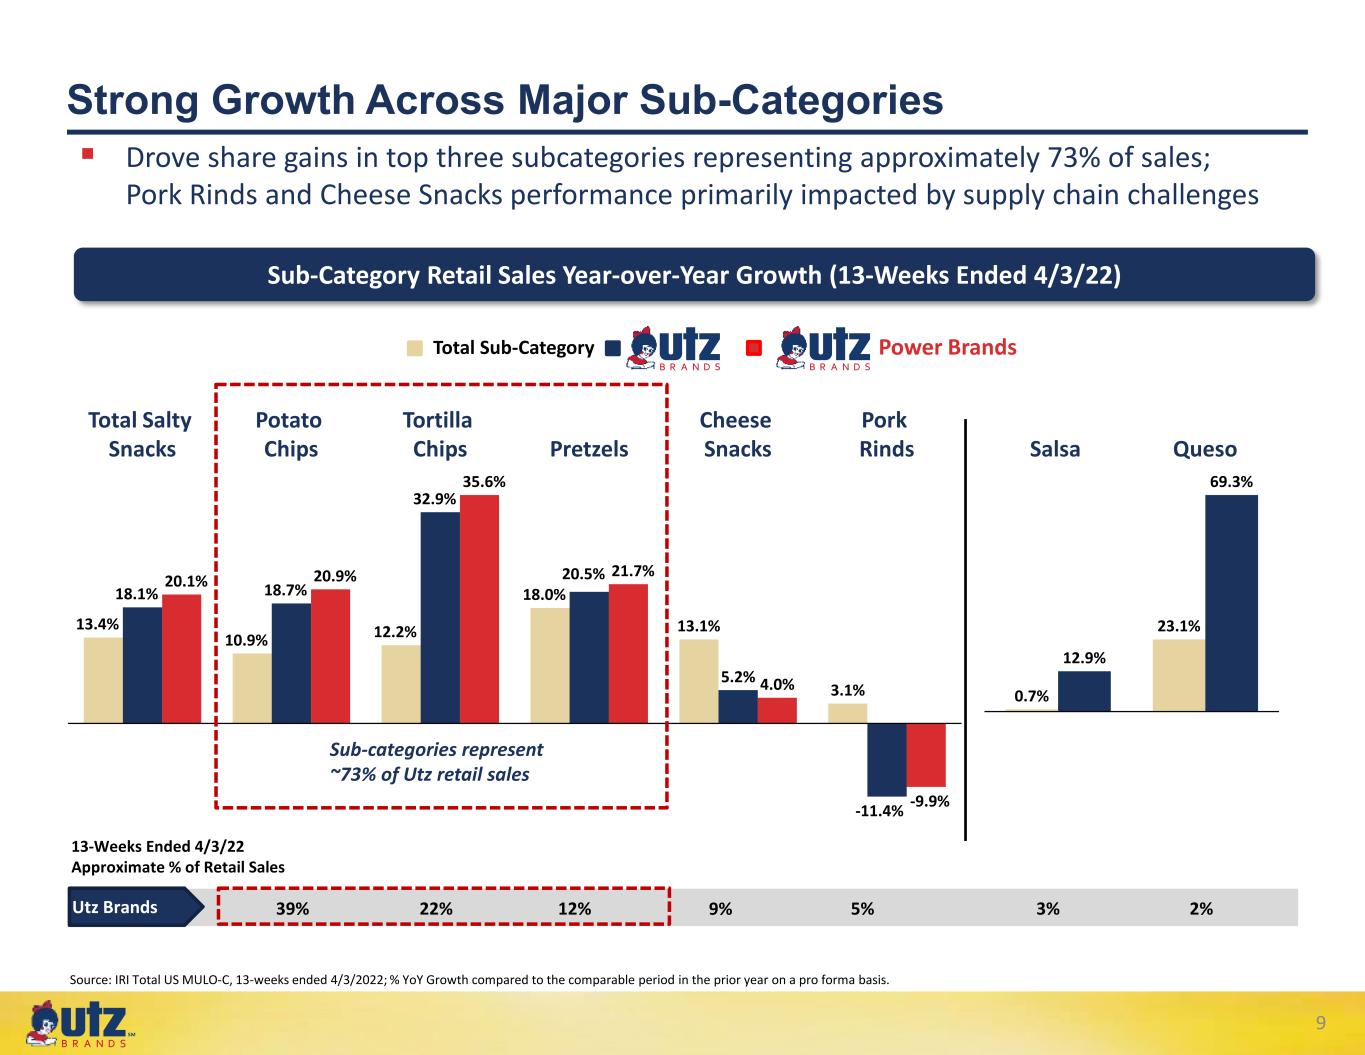
•IRI retail sales increased 18.1% year-over-year driven by strong Power Brands growth of 20.1%(1).
•GAAP Net loss was $(31.9) million(2) vs. $(23.3) million in the year-ago period.
•Adjusted EBITDA was $36.5 million vs. $37.9 million in the year-ago period.
•The Company is raising its full-year fiscal 2022 net sales outlook and reaffirming its Adjusted EBITDA outlook.
(1) IRI total US MULO-C, on a pro forma basis, 13-weeks ended April 3, 2022.
(2) 1Q’22 GAAP net loss primarily driven by the $23.0 million buyout of multiple third-party DSD rights in the quarter that were treated as contract termination costs and booked as an expense on the income statement and not as an investing activity on the Statement of Cash Flows.
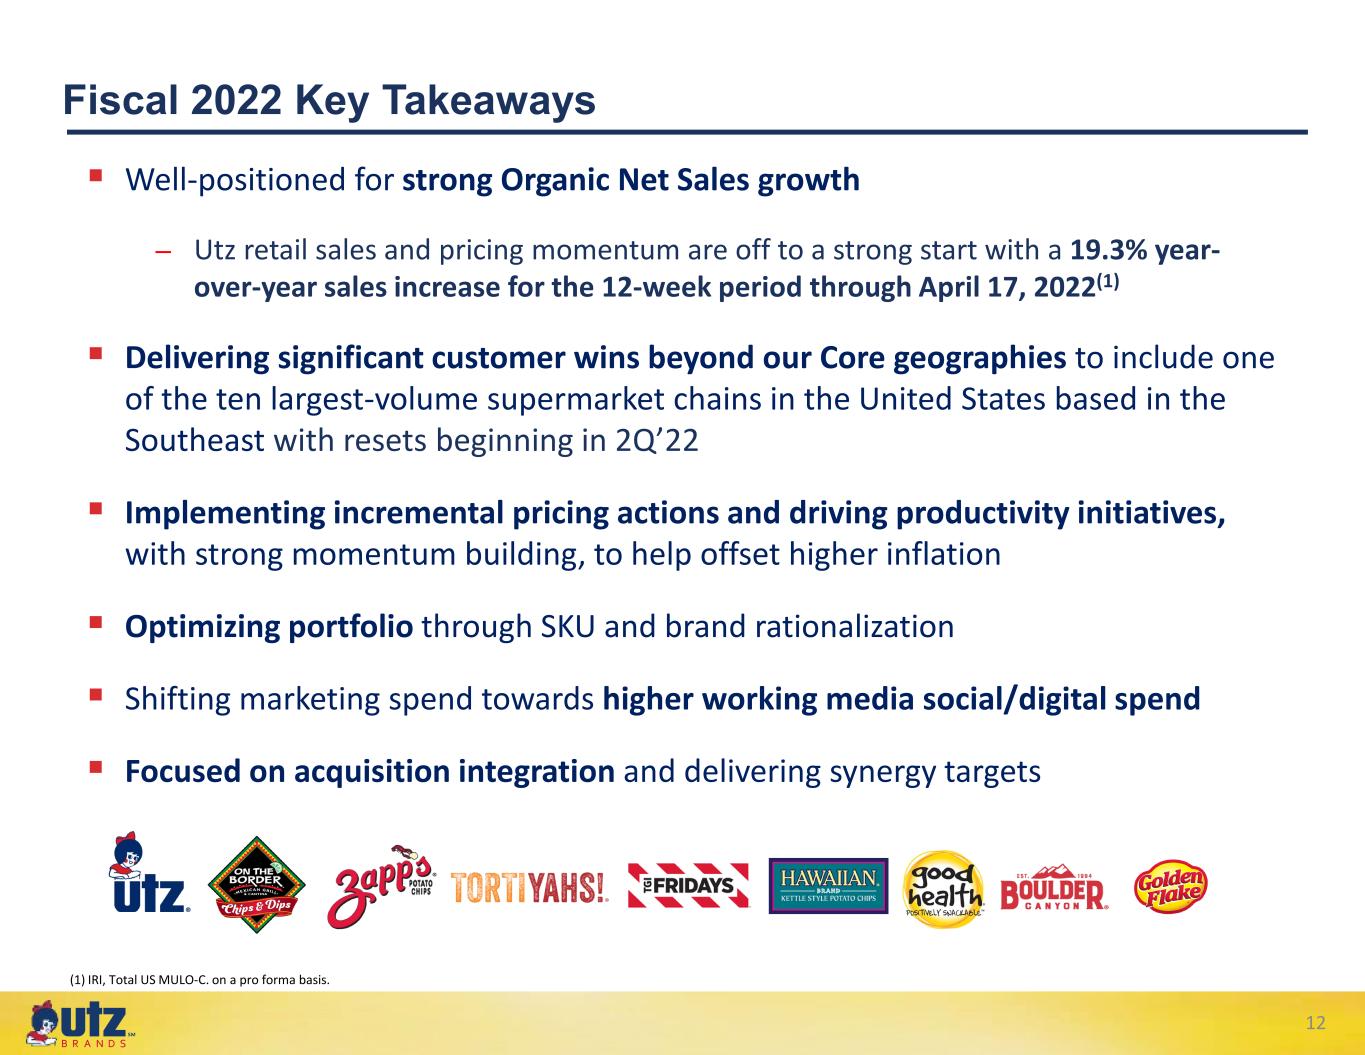
“We are pleased to deliver record first quarter net sales with Organic Net Sales growth of nearly 21 percent,” said Dylan Lissette, Chief Executive Officer of Utz. “Consumer demand for our strong portfolio of brands is at an all-time high, and we are incredibly excited about the continued opportunity to improve our market position in key growth channels and geographies. In addition, as inflation continues to increase, we are taking incremental price actions to help offset higher costs, and we are encouraged by our continued sales volume increases as price elasticity is better than we anticipated.”
Mr. Lissette continued, “As a result of our strong top-line trends, we are raising our net sales growth expectations for fiscal 2022. Furthermore, we remain on track to achieve our profit outlook as our pricing actions, along with our productivity programs, give us confidence that we will be able to offset the continuing high inflation as we exit 2022 and move into 2023.”
First Quarter 2022 Financial Highlights
| Quarter Ended | ||||||||||||||||||||
| (in $millions, except per share amounts) | April 3, 2022 | April 4, 2021 | % Change | |||||||||||||||||
| Net Sales | $ | 340.8 | $ | 269.2 | 26.6 | % | ||||||||||||||
| Organic Net Sales | 324.8 | 269.2 | 20.7 | % | ||||||||||||||||
| Gross Profit | 103.8 | 95.2 | 9.0 | % | ||||||||||||||||
| Adjusted Gross Profit | 115.7 | 104.5 | 10.7 | % | ||||||||||||||||
| Adjusted Gross Profit Margin | 33.9 | % | 38.8 | % | (487) | bps | ||||||||||||||
| Net Loss | (31.9) | (23.3) | nm | |||||||||||||||||
| Adjusted Net Income | 15.4 | 19.0 | (18.9) | % | ||||||||||||||||
| Adjusted EBITDA | 36.5 | 37.9 | (3.7) | % | ||||||||||||||||
| Adjusted EBITDA Margin | 10.7 | % | 14.1 | % | (337) | bps | ||||||||||||||
| Adjusted Earnings Per Share | $ | 0.11 | $ | 0.13 | (17.8) | % | ||||||||||||||
Note: See description of Non-GAAP financial measures and reconciliations of GAAP measures to Non-GAAP adjusted measures in the tables that accompany this release.
First Quarter Growth Highlights
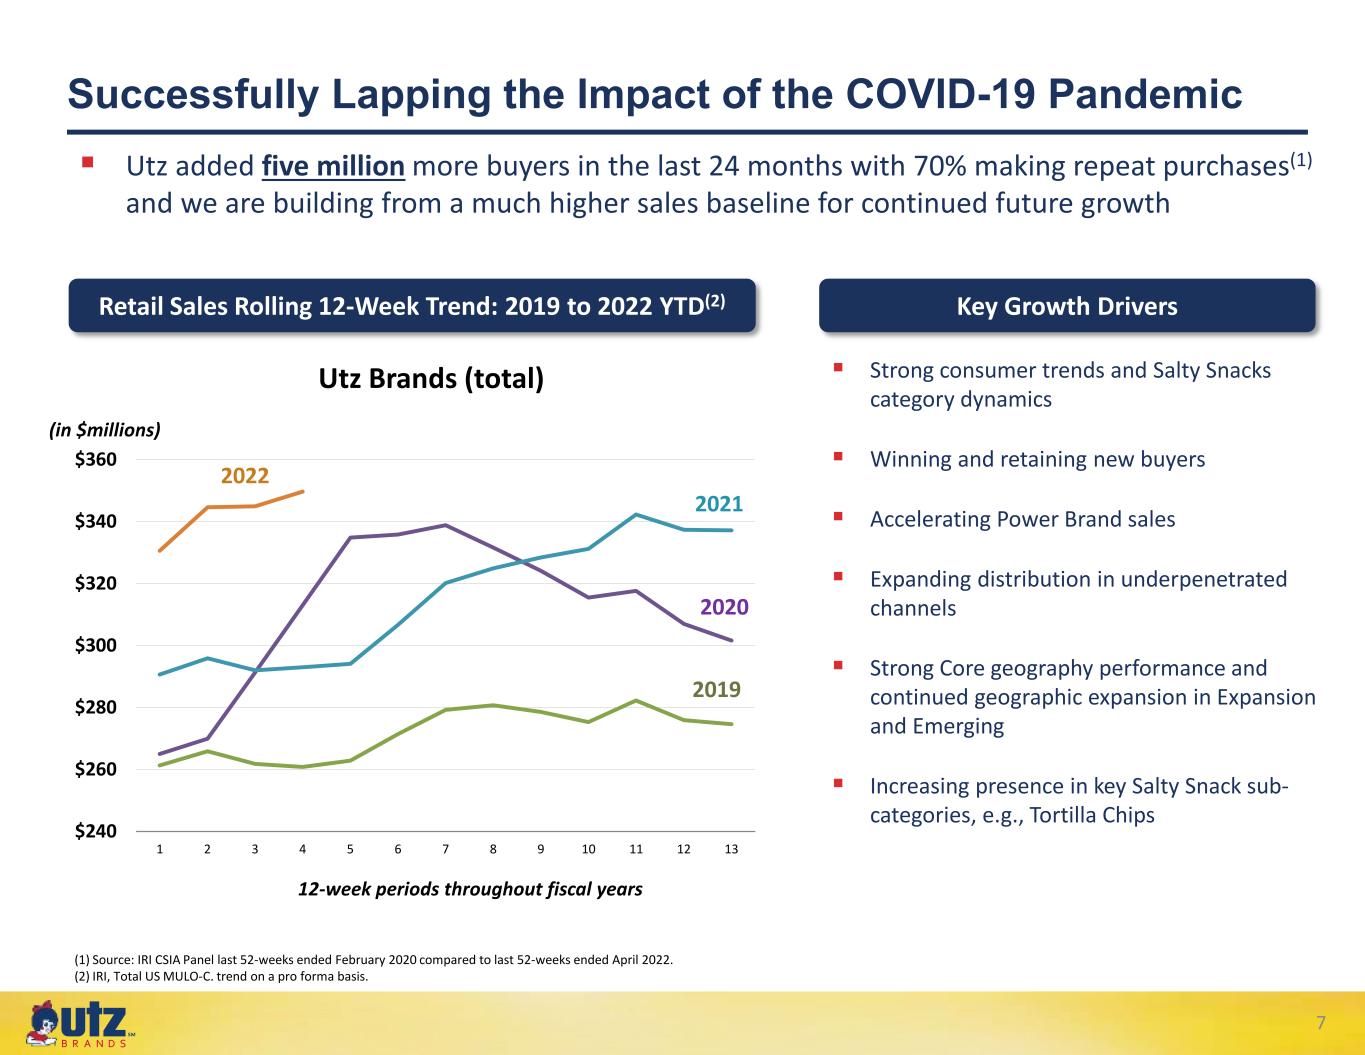
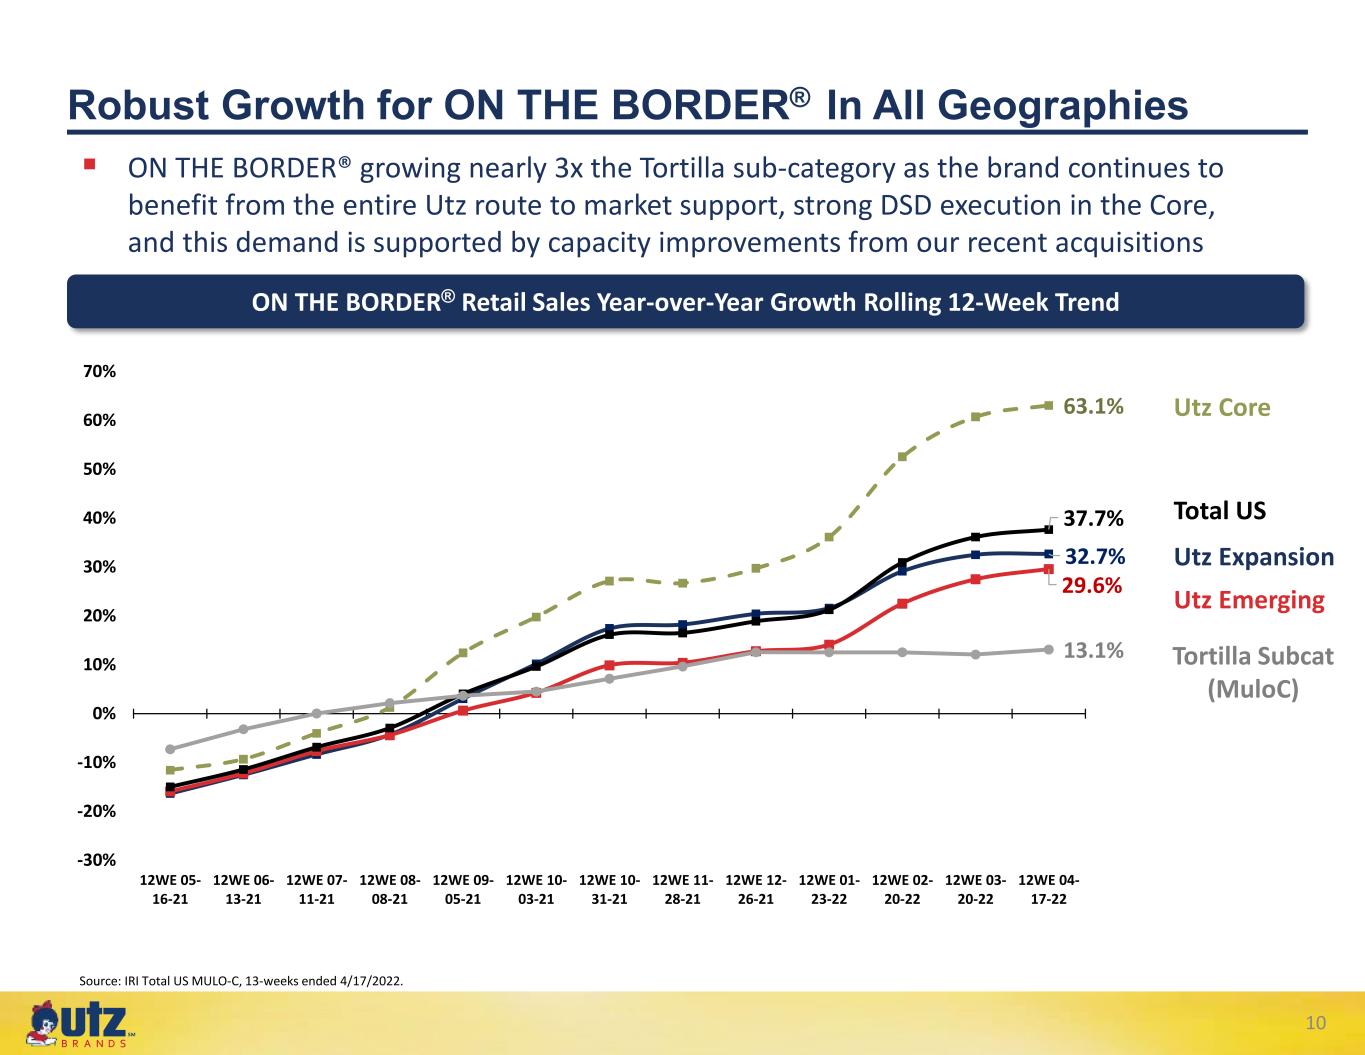
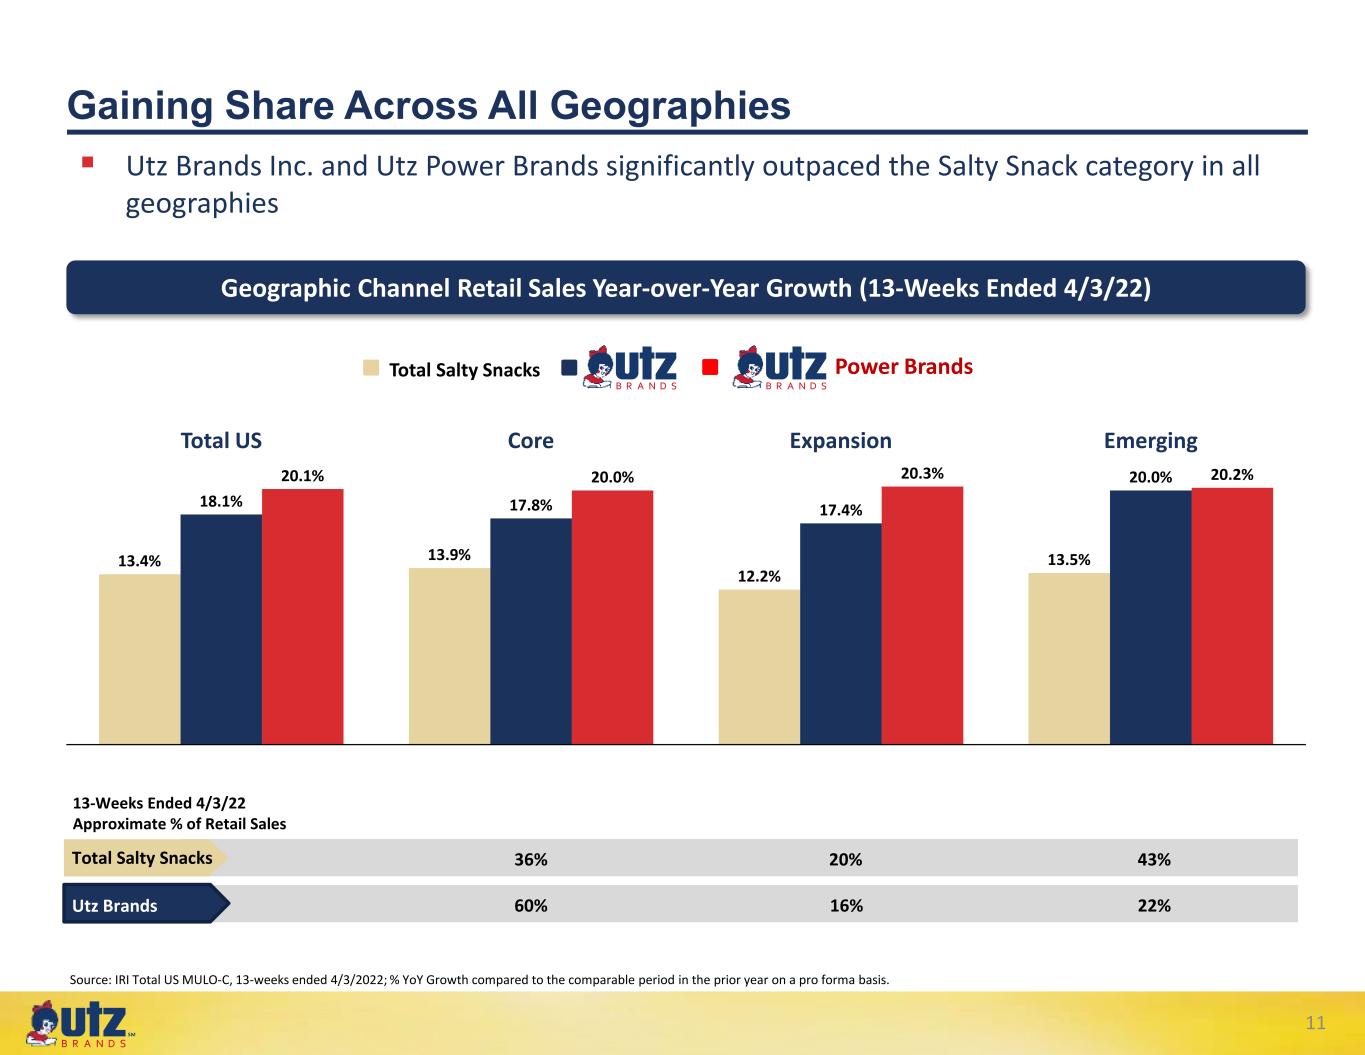
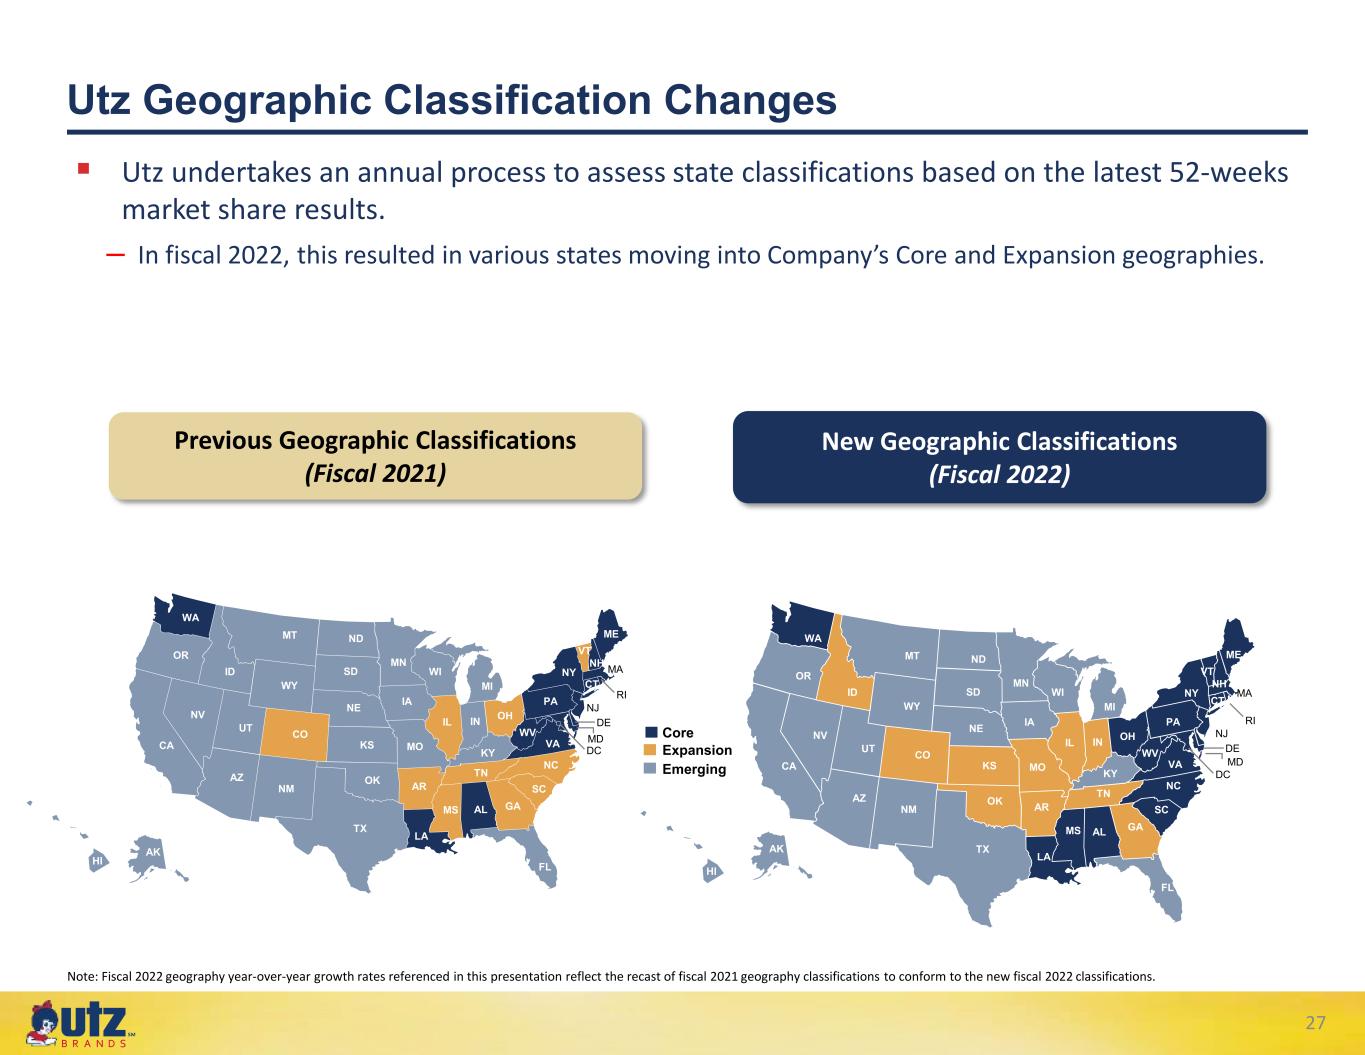
For the 13-week period ended April 3, 2022, the Company’s retail sales as measured by IRI MULO-C increased 18.1% versus the prior-year period, as compared to Salty Snack Category growth of 13.4%. Sales growth was driven by a healthy balance of net price realization and volume gains. The Company’s Power Brands’ retail sales increased 20.1% versus the prior-year period. Power Brands’ sales growth versus the prior-year period was led by Utz®, ON THE BORDER®, Zapp’s®, TORTIYAHS!®, Hawaiian®, TGI Fridays®, and Boulder Canyon®. Retail sales increased double digits with share gains across all three Geographies: Core, Expansion, and Emerging. The Company’s Foundation Brands increased 6.0% reflecting the continued strategy to focus its resources on its Power Brands.
IRI Retail Sales Growth Summary
| Last 13-Weeks Ended April 3, 2022 | ||||||||
| (in $millions) | YoY Change | |||||||
Total Retail Sales Growth(1) | ||||||||
| Salty Snack Category | 13.4 | % | ||||||
| Utz | 18.1 | % | ||||||
| Power Brands | 20.1 | % | ||||||
Foundation Brands(2) | 6.0 | % | ||||||
Sales by Geography Growth(1) | ||||||||
| Core | ||||||||
| Salty Snack Category | 13.9 | % | ||||||
| Utz | 17.8 | % | ||||||
| Power Brands | 20.0 | % | ||||||
| Expansion | ||||||||
| Salty Snack Category | 12.2 | % | ||||||
| Utz | 17.4 | % | ||||||
| Power Brands | 20.3 | % | ||||||
| Emerging | ||||||||
| Salty Snack Category | 13.5 | % | ||||||
| Utz | 20.0 | % | ||||||
| Power Brands | 20.2 | % | ||||||
(1) IRI Custom Panel, Total US MULO-C, on a pro forma basis.
(2) IRI does not include Partner Brands and Private Label retail sales.
Fiscal Year 2022 Outlook
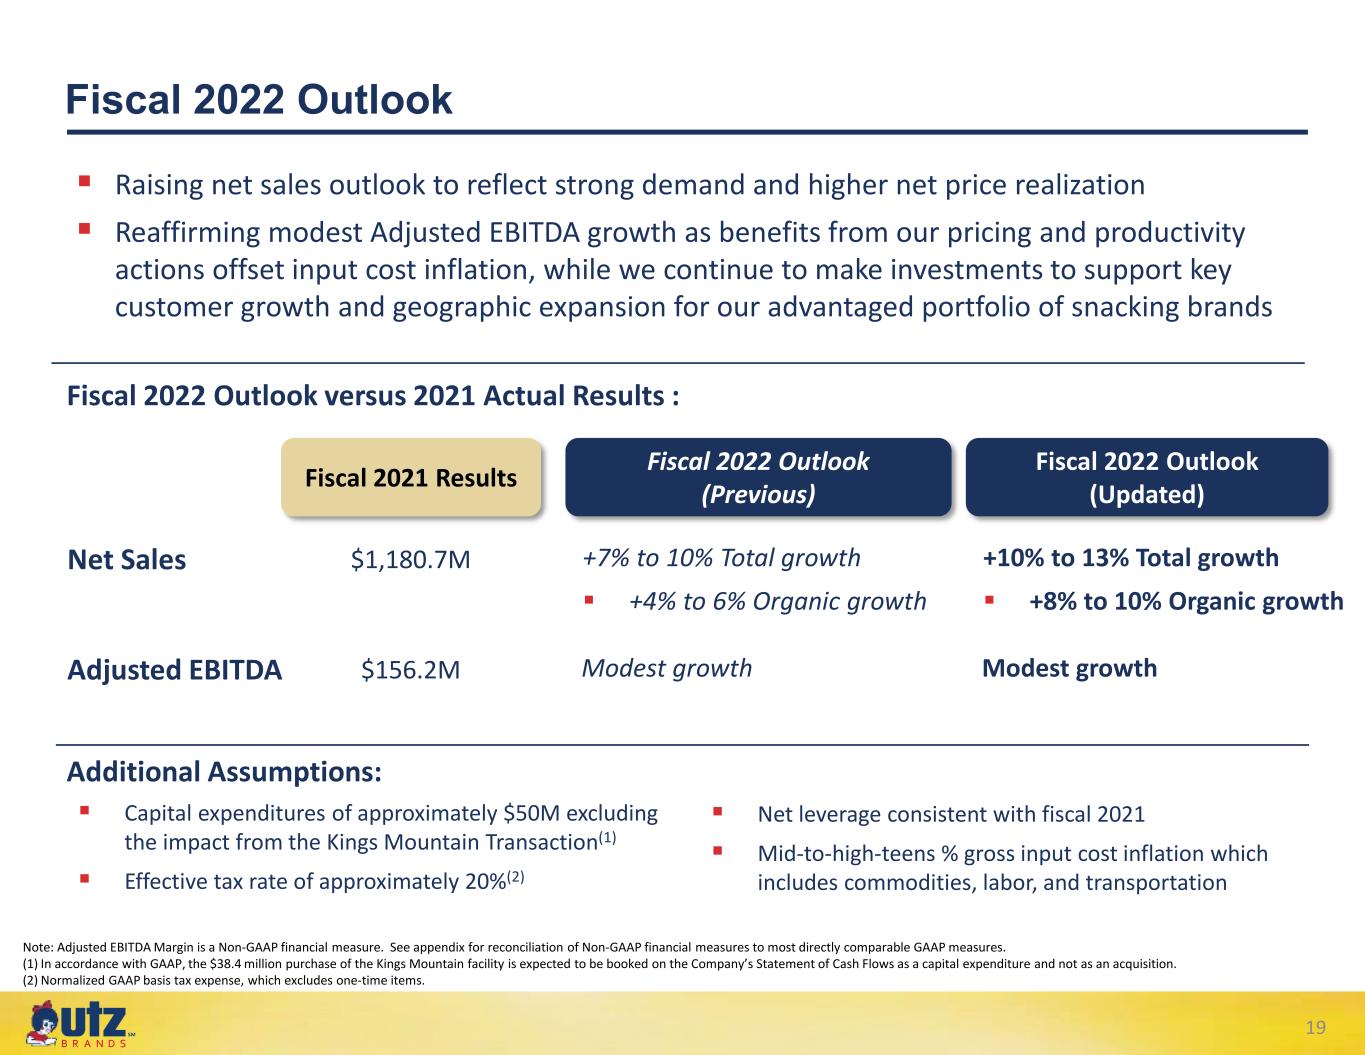
For fiscal 2022, the Company is raising its total net sales growth outlook from 7-10% to 10-13%, and its Organic Net Sales growth outlook from 4-6% to 8-10%. This improved outlook for net sales growth reflects continued strong consumer demand for the Company’s advantaged portfolio of snacking brands, and higher pricing related to increased input costs.
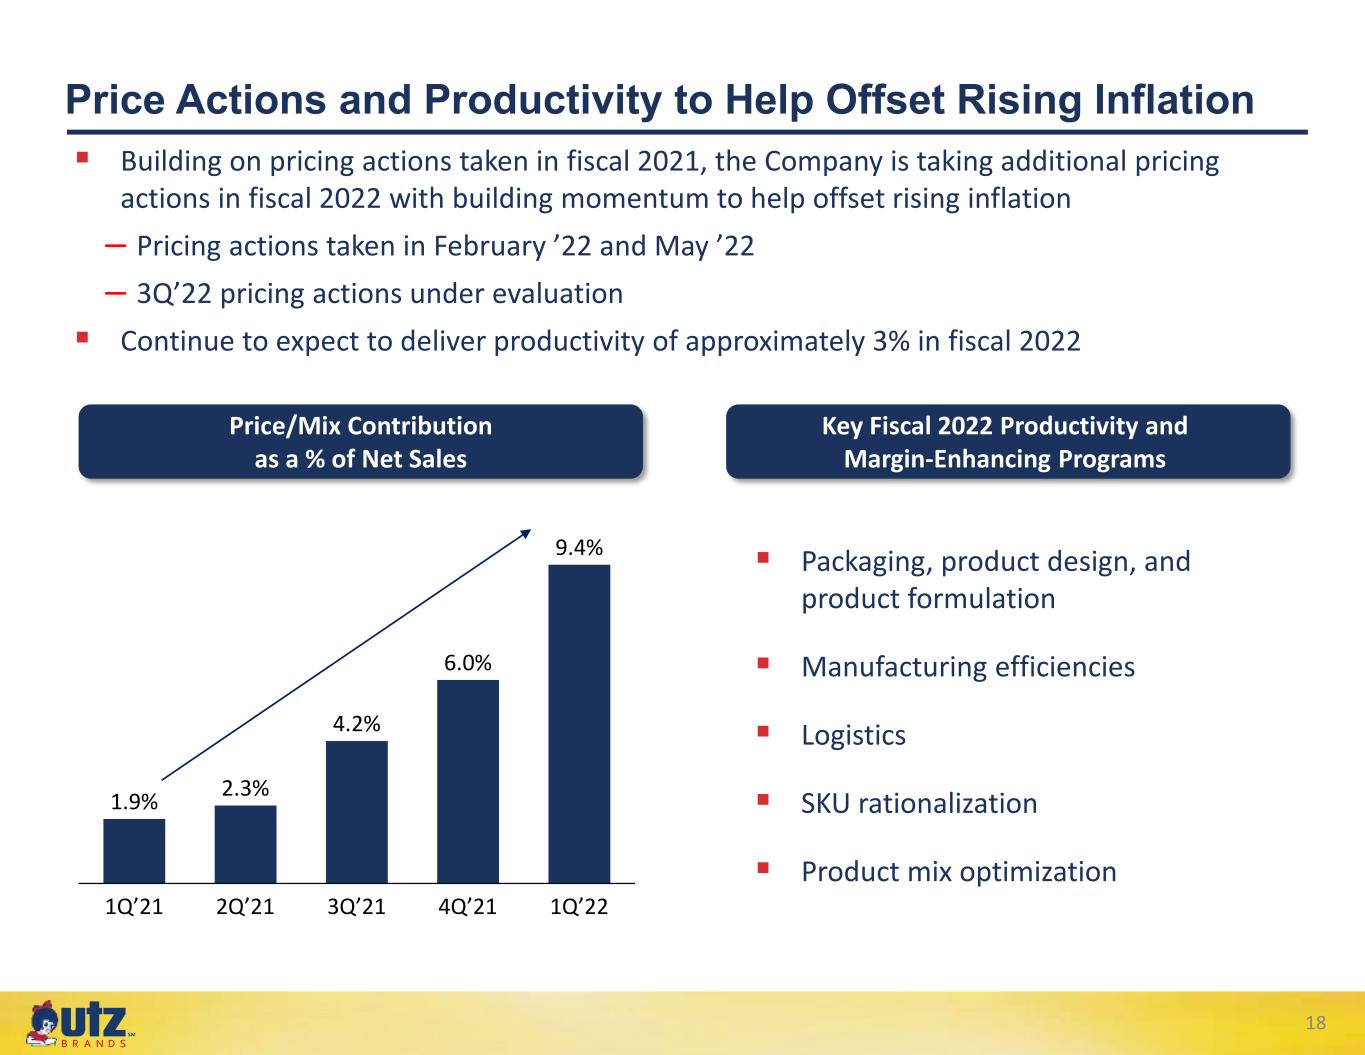
For fiscal 2022, the Company is raising its expectation for gross input cost inflation from the low-double digits to mid-to-high-teens as key input costs have increased significantly largely due to geopolitical events. That being said, the Company is taking incremental pricing actions this year to help offset these cost increases. As the benefits of the Company’s pricing actions and productivity programs continue to build, the Company continues to expect to offset higher inflation in fiscal 2022. As a result, the Company’s Adjusted EBITDA outlook is unchanged and expects fiscal 2022 Adjusted EBITDA to grow modestly versus fiscal 2021 Adjusted EBITDA of $156.2 million. Utz continues to expect stronger Adjusted EBITDA performance in the second half of fiscal 2022, and in fiscal 2023.
Additionally, in fiscal year 2022, the Company now expects capital expenditures of approximately $50 million, excluding the impact of the Kings Mountain transaction. In accordance with Generally Accepted Accounting Principles (“GAAP”), the $38.4 million purchase of the Kings Mountain facility is expected to be booked on the Company’s Statement of Cash Flows as a capital expenditure and not as an acquisition. Finally, the Company continues to expect an effective tax rate of approximately 20% (normalized GAAP basis tax expense, which excludes one-time items) and net leverage at year-end fiscal 2022 to be consistent with year-end fiscal 2021.
With respect to projected fiscal year 2022 Adjusted EBITDA, a quantitative reconciliation is not available without unreasonable efforts due to the high variability, complexity, and low visibility with respect to certain items, which are excluded from Adjusted EBITDA. We expect the variability of these items to have a potentially unpredictable, and potentially significant, impact on our future financial results.
First Quarter 2022 Financial Results
See the description of the Non-GAAP financial measures mentioned in this press release and reconciliations of the Non-GAAP adjusted measures to the GAAP measures in the tables that accompany this release. In addition, see the description of the periods representing the Predecessor and Successor periods in the Company's Form 10-K for the fiscal year ended, January 2, 2022.
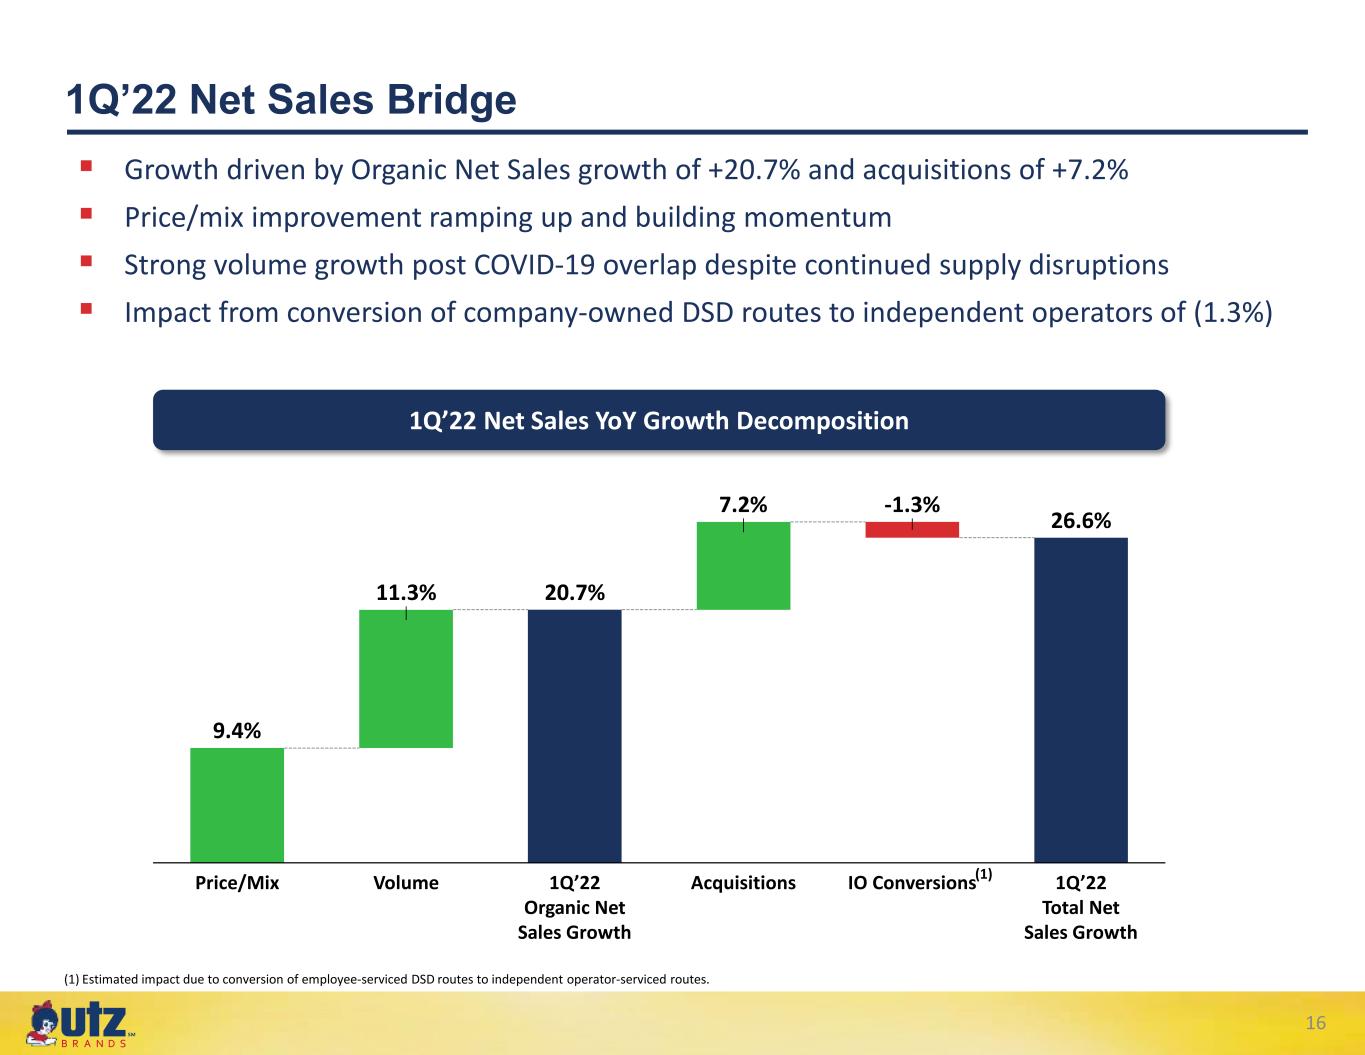
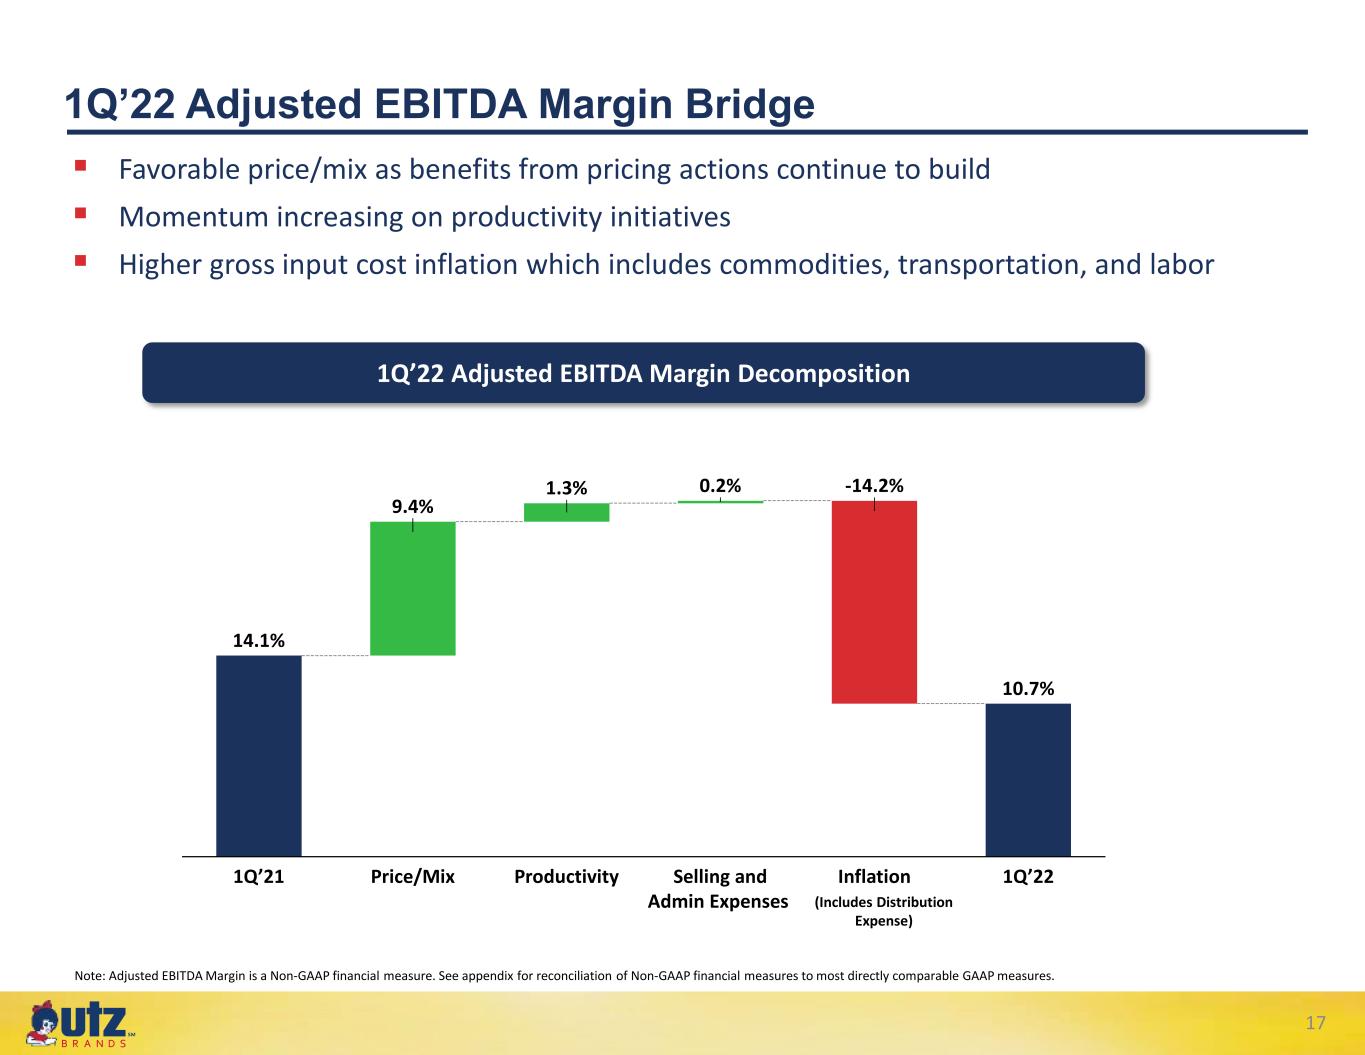
Net sales in the quarter increased 26.6% to $340.8 million compared to $269.2 million in the first quarter of 2021. The increase in net sales was driven by Organic Net Sales growth of 20.7% and acquisitions of 7.2%, partially offset by the Company’s continued shift to independent operators (“IO”) and the resulting increase in sales discounts that impacted net sales growth by (1.3%). Organic Net Sales growth was driven by favorable price/mix of 9.4% and volume gains of 11.3%.
Gross profit was $103.8 million, or 30.5% as a percentage of net sales. Adjusted Gross Profit increased 10.7% to $115.7 million, or 33.9% as a percentage of net sales, compared to Adjusted Gross Profit of $104.5 million, or 38.8% as a percentage of net sales, in the prior year period. The decrease in Adjusted Gross Profit as a percentage of net sales was primarily driven by higher commodity, transportation, and labor inflation, which are collectively the result of industry-wide supply chain challenges. Additionally, the Company estimates that the continued shift to independent operators impacted Adjusted Gross Margins by approximately 130 basis points, but with offsetting benefits in Selling, Distribution, and Administrative (“SD&A”) expense. These headwinds were partially offset by higher net price realization, improved mix, and ongoing benefits from the Company’s productivity programs.
The Company reported a net loss of $(31.9) million, primarily driven by the $23.0 million buyout of multiple third-party DSD rights in the quarter. In adherence to GAAP, these buyouts were treated as contract termination costs and booked as an expense on the income statement and not as an investing activity on the Statement of Cash Flows. Adjusted Net Income in the first quarter of 2022 was $15.4 million and this compares to Adjusted Net Income of $19.0 million in the prior year period.
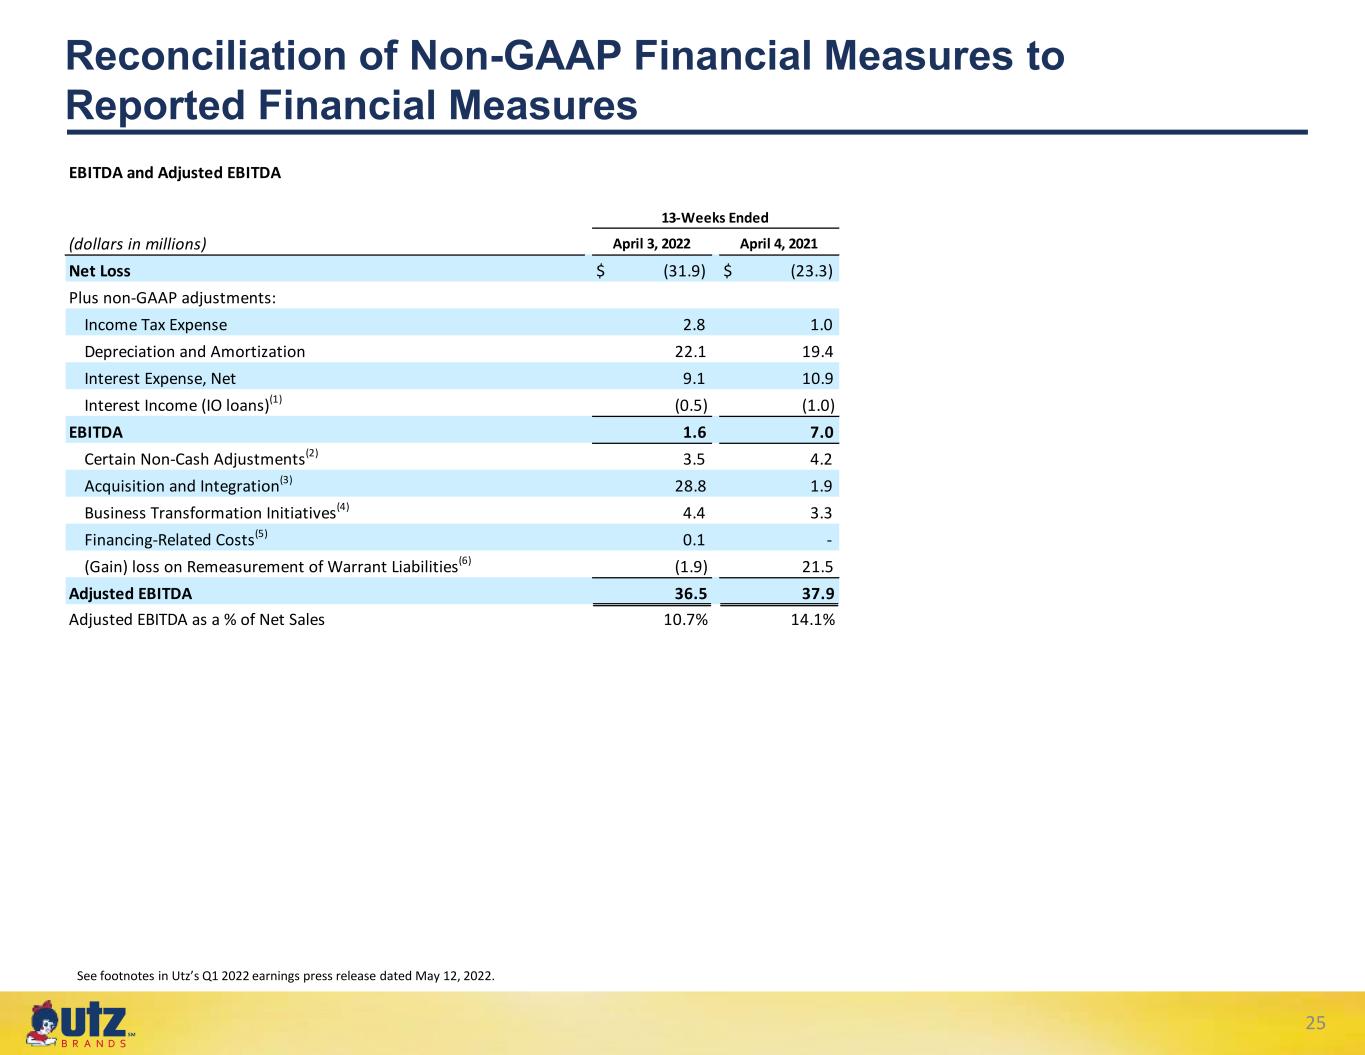
Adjusted EBITDA decreased (3.7)% to $36.5 million, or 10.7% as a percentage of net sales, compared to Adjusted EBITDA of $37.9 million, or 14.1% as a percentage of net sales, in the prior year period. The expected decrease in Adjusted EBITDA margin was driven by the Adjusted Gross Profit as a percentage of sales performance as described above, partially offset by lower SD&A expenses as a percentage of sales versus the prior-year period.
Balance Sheet and Cash Flow Highlights
•As of April 3, 2022
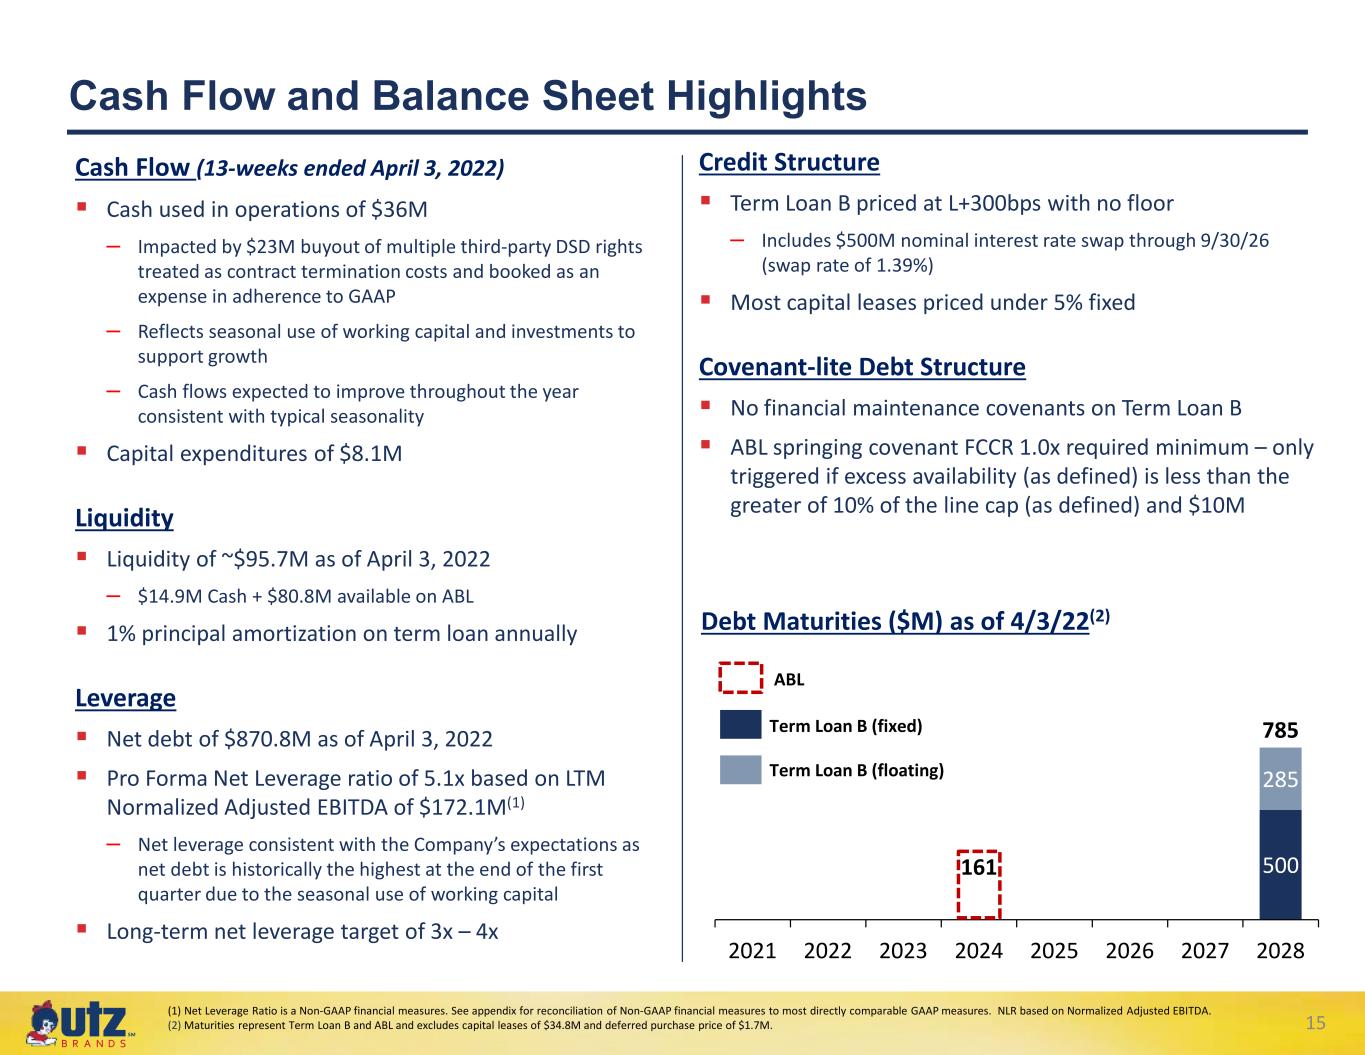
◦Cash on hand of $14.9 million and $80.8 million was available under the Company’s revolving credit facility, providing liquidity of approximately $95.7 million.
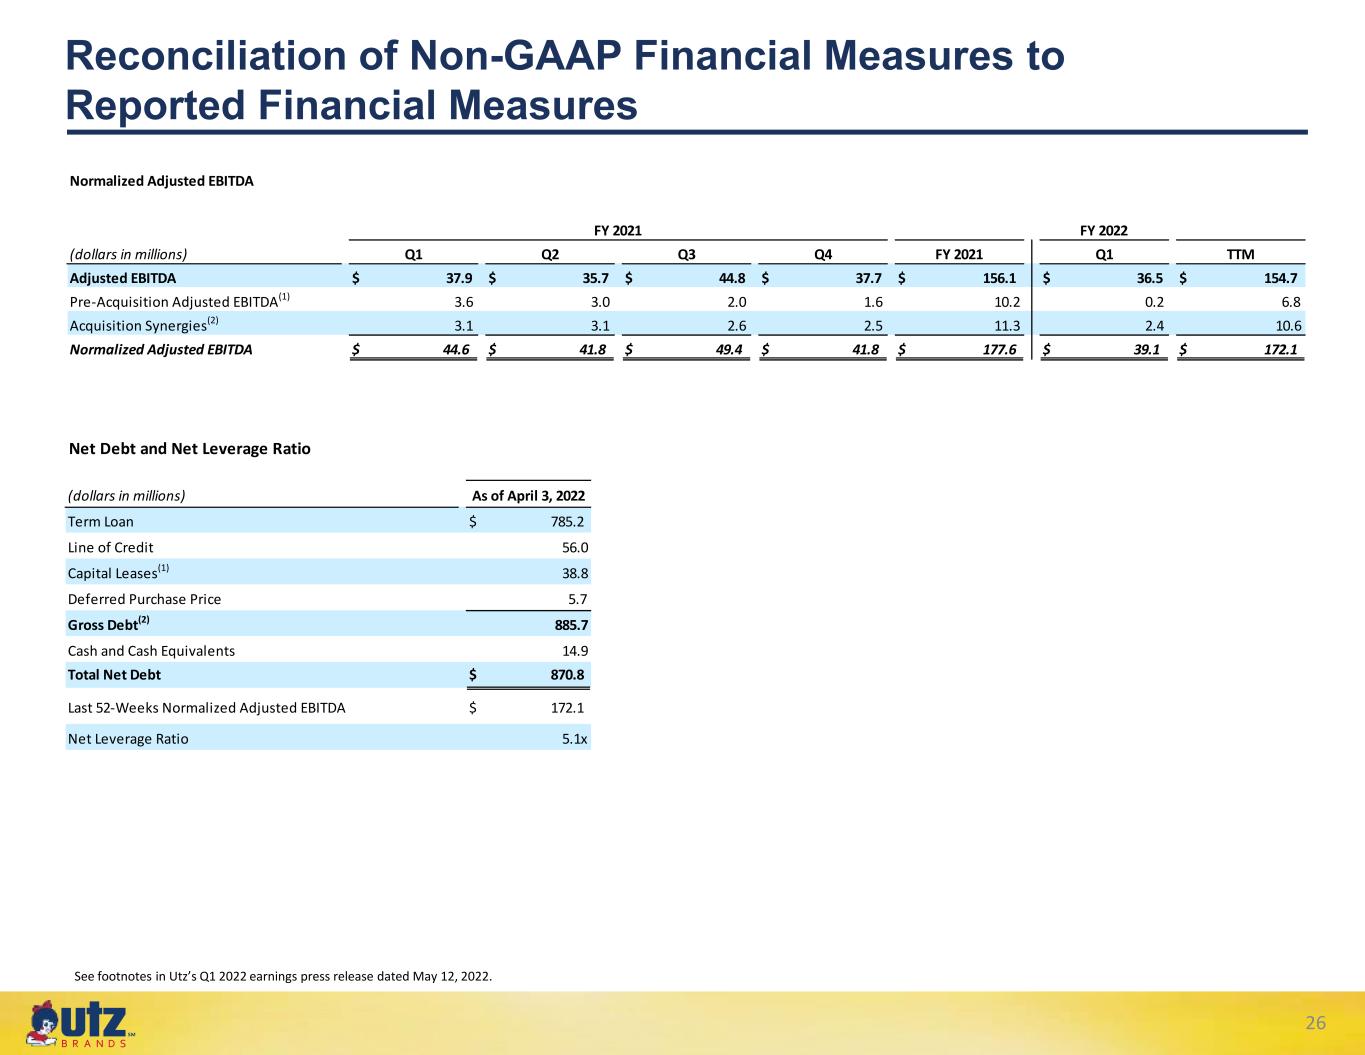
◦Net debt of $870.8 million resulting in a Pro Forma Net Leverage ratio of 5.1x based on Normalized Adjusted EBITDA of $172.1 million. The net leverage is consistent with the Company’s expectations as net debt is historically the highest at the end of the first quarter due to the seasonal use of working capital.
•For the 13-weeks ended April 3, 2022
◦Cash flow used in operations of $(36.0) million.
▪As described above in the net loss discussion, the $23.0 million buyout of multiple third-party DSD rights in the quarter were treated as contract termination costs and booked as an expense on the income statement in adherence to GAAP. As such, these acquisitions were not booked as investing activities and impacted cash flow from operations.
▪Cash flow performance reflects the seasonal use of working capital.
◦Capital expenditures of $8.1 million.
Conference Call and Webcast Presentation
The Company will host a conference call to discuss these results today at 8:30 a.m. Eastern Time. Please visit the “Events & Presentations” section of Utz’s Investor Relations website at https://investors.utzsnacks.com/ to access the live listen-only webcast and presentation. Participants can also dial in over the phone by calling 1 (888) 510-2008. The Event Plus passcode is 1774171. The Company has also posted presentation slides and additional supplemental financial information, which are available now on Utz’s Investor Relations website.
A replay will be archived online and is also available telephonically approximately two hours after the call concludes through Thursday, May 19, 2022, by dialing 1-800-770-2030, and entering confirmation code 1774171.
About Utz Brands, Inc.
Utz Brands, Inc. (NYSE: UTZ) manufactures a diverse portfolio of savory snacks through popular brands including Utz®, ON THE BORDER® Chips & Dips, Golden Flake®, Zapp’s®, Good Health®, Boulder Canyon®, Hawaiian Brand®, and TORTIYAHS!®, among others.
After a century with strong family heritage, Utz continues to have a passion for exciting and delighting consumers with delicious snack foods made from top-quality ingredients. Utz’s products are distributed nationally through grocery, mass merchandisers, club, convenience, drug, and other channels. Based in Hanover, Pennsylvania, Utz operates 18 facilities located in Alabama, Arizona, Illinois, Indiana, Louisiana, Massachusetts, Michigan, Nevada, North Carolina, Pennsylvania, and Washington. For more information, please visit www.utzsnacks.com or call 1‐800‐FOR‐SNAX.
Investors and others should note that Utz announces material financial information to its investors using its investor relations website (https://investors.utzsnacks.com/investors/default.aspx), SEC filings, press releases, public conference calls, and webcasts. Utz uses these channels, as well as social media, to communicate with our stockholders and the public about the Company, the Company’s products and other issues. It is possible that the information that Utz posts on social media could be deemed to be material information. Therefore, Utz encourages investors, the media, and others interested in the Company to review the information posted on the social media channels listed on Utz’s investor relations website.
Investor Contact
Kevin Powers
Utz Brands, Inc.
Media Contact
Kevin Brick
Utz Brands, Inc.
Forward-Looking Statements
This press release includes certain statements made herein are not historical facts but are “forward-looking statements” within the meaning of the “safe harbor” provisions of the Private Securities Litigation Reform Act of 1995, as amended. The forward-looking statements generally are accompanied by or include, without limitation, statements such as “will”, “expect”, “intends”, “goal” or other similar words, phrases or expressions. These forward-looking statements include the expected effects from the COVID-19 pandemic, future plans for Utz Brands, Inc. (the “Company”), the estimated or anticipated future results and benefits of the Company’s future plans and operations, future capital structure, future opportunities for the Company, and other statements that are not historical facts. These statements are based on the current expectations of the Company’s management and are not predictions of actual performance. These statements are subject to a number of risks and uncertainties and the Company’s business and actual results may differ materially. Factors that may cause such differences include, but are not limited to: the risk that the recently completed business combination with Collier Creek Holdings and other acquisitions recently completed by the Company (collectively, the “Business Combinations”) disrupt plans and operations; the ability to recognize the anticipated benefits of such Business Combinations, which may be affected by, among other things, competition and the ability of the Company to grow and manage growth profitably and retain its key employees; the outcome of any legal proceedings that may be instituted against the Company following the consummation of such Business Combinations; changes in applicable law or regulations; costs related to the Business Combinations; the
inability of the Company to maintain the listing of the Company’s Class A Common Stock on the New York Stock Exchange; the inability of the Company to develop and maintain effective internal controls; the risk that the Company’s gross profit margins may be adversely impacted by a variety of factors, including variations in raw materials pricing, retail customer requirements and mix, sales velocities and required promotional support; changes in consumers’ loyalty to the Company’s brands due to factors beyond the Company’s control; changes in demand for the Company’s products affected by changes in consumer preferences and tastes or if the Company is unable to innovate or market its products effectively; costs associated with building brand loyalty and interest in the Company’s products, which may be affected by the Company’s competitors’ actions that result in the Company’s products not suitably differentiated from the products of competitors; fluctuations in results of operations of the Company from quarter to quarter because of changes in promotional activities; the possibility that the Company may be adversely affected by other economic, business or competitive factors; and other risks and uncertainties set forth in the section entitled “Risk Factors” and “Forward-Looking Statements” in the Company’s Annual Report on Form 10-K filed with the U.S. Securities and Exchange Commission, as amended (the “Commission”) for the fiscal year ended January 2, 2022 and other reports filed by the Company with the Commission. In addition, forward-looking statements provide the Company’s expectations, plans or forecasts of future events and views as of the date of this communication. Except as required by law, the Company undertakes no obligation to update such statements to reflect events or circumstances arising after such date, and cautions investors not to place undue reliance on any such forward-looking statements. These forward-looking statements should not be relied upon as representing the Company’s assessments as of any date subsequent to the date of this communication. The Company cautions investors not to place undue reliance upon any forward-looking statements, which speak only as of the date made. The Company does not undertake or accept any obligation or undertaking to release publicly any updates or revisions to any forward-looking statements to reflect any change in its expectations or any change in events, conditions or circumstances on which any such statement is based, except as otherwise required by law.
Non-GAAP Financial Measures:
Utz uses non-GAAP financial information and believes it is useful to investors as it provides additional information to facilitate comparisons of historical operating results, identify trends in our underlying operating results and provides additional insight and transparency on how we evaluate the business. We use non-GAAP financial measures to budget, make operating and strategic decisions, and evaluate our performance. These non-GAAP financial measures do not represent financial performance in accordance with GAAP and may exclude items that are significant in understanding and assessing financial results. Therefore, these measures should not be considered in isolation or as an alternative to net income, cash flows from operations or other measures of profitability, liquidity or performance under GAAP. You should be aware that the presentation of these measures may not be comparable to similarly titled measures used by other companies.
Management believes that non-GAAP financial measures should be considered as supplements to the GAAP reported measures, should not be considered replacements for, or superior to, the GAAP measures and may not be comparable to similarly named measures used by other companies. We believe that these non-GAAP measures of financial results provide useful information to investors regarding certain financial and business trends relating to the financial condition and results of operations of the Company to date and that the presentation of non-GAAP financial measures is useful to investors in the evaluation of our operating performance compared to other companies in the salty snack industry, as similar measures are commonly used by the companies in this industry. These non-GAAP financial measures are subject to inherent limitations as they reflect the exercise of judgments by management about which expense and income are excluded or included in determining these non-GAAP financial measures. The non-GAAP financial measures are not recognized in accordance with GAAP and should not be viewed as an alternative to GAAP measures of performance.
Utz uses the following non-GAAP financial measures in its financial communications, and in the future could use others:
•Organic Net Sales
•Adjusted Gross Profit
•Adjusted Gross Profit as % of Net Sales (Adjusted Gross Profit Margin)
•Adjusted Selling, Distribution, and Administrative Expense
•Adjusted Selling, Distribution, and Administrative Expense as % of Net Sales
•Adjusted Net Income
•Adjusted Earnings Per Share
•EBITDA
•Adjusted EBITDA
•Adjusted EBITDA as % of Net Sales (Adjusted EBITDA Margin)
•Normalized Adjusted EBITDA
Organic Net Sales is defined as net sales excluding the impact of acquisitions and excluding the impact of Independent Operator route conversions.
Adjusted Gross Profit represents Gross Profit excluding Depreciation and Amortization expense, a non-cash item. In addition, Adjusted Gross Profit excludes the impact of costs that fall within the categories of non-cash adjustments and non-recurring items such as those related to stock-based compensation, hedging and purchase commitments adjustments, asset impairments, acquisition, and integration costs, business transformation initiatives, and financing-related costs. Adjusted Gross Profit is one of the key performance indicators that our management uses to evaluate operating performance. We also report Adjusted Gross Profit as a percentage of Net Sales as an additional measure for investors to evaluate our Adjusted Gross Profit margins on Net Sales.
Adjusted Selling, Distribution, and Administrative Expense is defined as all Selling, Distribution, and Administrative expense excluding Depreciation and Amortization expense, a non- cash item. In addition, Adjusted Selling, Distribution, and Administrative Expenses exclude the impact of costs that fall within the categories of non-cash adjustments and non-recurring items such as those related to stock-based compensation, hedging and purchase commitments adjustments, asset impairments, acquisition and integration costs, business transformation initiatives, and financing-related costs. We also report Adjusted Selling, Distribution, and Administrative Expense as a percentage of Net Sales as an additional measure for investors to evaluate our Adjusted Selling, Distribution, and Administrative margin on Net Sales.
Adjusted Net Income is defined as Net Income excluding the additional Depreciation and Amortization expense, a non-cash item, related to the Business Combination with Collier Creek Holdings and the acquisitions of Kennedy Endeavors, Kitchen Cooked, Inventure, Golden Flake, and Truco Enterprises. In addition, Adjusted Net Income is also adjusted to exclude deferred financing fees, interest income, and expense relating to IO loans and certain non-cash items, such as those related to stock-based compensation, hedging, and purchase commitments adjustments, asset impairments, acquisition and integration costs, business transformation initiatives, remeasurement of warrant liabilities and financing-related costs. Lastly, Adjusted Net Income normalizes the income tax provision to account for the above-mentioned adjustments.
Adjusted Earnings Per Share is defined as Adjusted Net Income (as defined, herein) divided by the weighted average shares outstanding for each period on a fully diluted basis, assuming the Private Placement Warrants are net settled and the Shares of Class V Common Stock held by Continuing Members is converted to Class A Common Stock.
EBITDA is defined as Net Income before Interest, Income Taxes, and Depreciation and Amortization.
Adjusted EBITDA is defined as EBITDA further adjusted to exclude certain non-cash items, such as stock-based compensation, hedging and purchase commitments adjustments, and asset impairments; acquisition and integration costs; business transformation initiatives; and financing-related costs. Adjusted EBITDA is one of the key performance indicators we use in evaluating our operating performance and in making financial, operating, and planning decisions. We believe Adjusted EBITDA is useful to the users of this release and financial information contained in the release in the evaluation of Utz’s operating performance compared to other companies in the salty snack industry, as similar measures are commonly used by companies in this industry. We have historically reported an Adjusted EBITDA metric to investors and banks for covenant compliance. We also provide in this release, Adjusted EBITDA as a percentage of Net Sales, as an additional measure for readers to evaluate our Adjusted EBITDA margins on Net Sales.
Normalized Adjusted EBITDA is defined as Adjusted EBITDA after giving effect to pre-acquisition Adjusted EBITDA of the Festida Foods and R.W. Garcia acquisitions, and the buyout of Clem and J&D Snacks, along with adjustments for estimated unrealized cost synergies related to the acquisition of Truco Enterprises, Vitner’s, Festida Foods, R.W. Garcia, and the buyouts and contract terminations of Clem and J&D Snacks.
Management believes that the non-GAAP financial measures are meaningful to investors because they increase transparency and assists investors to understand and analyze our ongoing operational performance. The financial measures are shown as supplemental disclosures in this release because they are widely used by the investment community for analysis and comparative evaluation. They also provide additional metrics to evaluate the Company’s operations and, when considered with both the GAAP results and the reconciliation to the most comparable GAAP measures, provide a more complete understanding of the Company’s business than could be obtained absent this disclosure. The non-GAAP measures are not and should not be considered an alternative to the most comparable GAAP measures or any other figure calculated in accordance with GAAP, or as an indicator of operating performance. The Company’s calculation of the non-GAAP financial measures may differ from methods used by other companies. Management believes that the non-GAAP measures are important to have an understanding of the Company’s overall operating results in the periods presented. The non-GAAP financial measures are not recognized in accordance with GAAP and should not be viewed as an alternative to GAAP measures of performance. As new events or circumstances arise, these definitions could change. When the definitions change, we will provide the updated definitions and present the related non-GAAP historical results on a comparable basis.
Utz Brands, Inc.
CONSOLIDATED STATEMENTS OF OPERATIONS AND COMPREHENSIVE LOSS
For the thirteen weeks ended April 3, 2022 and April 4, 2021
(In thousands, except share information)
(Unaudited)
| Thirteen weeks ended April 3, 2022 | Thirteen weeks ended April 4, 2021 | ||||||||||
| Net sales | $ | 340,767 | $ | 269,182 | |||||||
| Cost of goods sold | 236,960 | 173,941 | |||||||||
| Gross profit | 103,807 | 95,241 | |||||||||
| Selling, distribution, and administrative expenses | |||||||||||
| Selling and distribution | 88,110 | 56,728 | |||||||||
| Administrative | 38,551 | 29,933 | |||||||||
| Total selling, distribution, and administrative expenses | 126,661 | 86,661 | |||||||||
| Gain on sale of assets, net | 367 | 719 | |||||||||
| (Loss) income from operations | (22,487) | 9,299 | |||||||||
| Other (expense) income | |||||||||||
| Interest expense | (9,103) | (10,861) | |||||||||
| Other income | 520 | 718 | |||||||||
| Gain (loss) on remeasurement of warrant liability | 1,944 | (21,501) | |||||||||
| Other (expense) income, net | (6,639) | (31,644) | |||||||||
| Loss before taxes | (29,126) | (22,345) | |||||||||
| Income tax expense | 2,772 | 1,004 | |||||||||
| Net loss | (31,898) | (23,349) | |||||||||
| Net loss attributable to noncontrolling interest | 14,328 | 820 | |||||||||
| Net loss attributable to controlling interest | $ | (17,570) | $ | (22,529) | |||||||
Earnings (loss) per Class A Common stock: (in dollars) | |||||||||||
| Basic & diluted | $ | (0.22) | $ | (0.30) | |||||||
| Weighted-average shares of Class A Common stock outstanding | |||||||||||
| Basic & diluted | 78,572,404 | 75,927,005 | |||||||||
| Net loss | $ | (31,898) | $ | (23,349) | |||||||
| Other comprehensive income: | |||||||||||
| Change in fair value of interest rate swap | 27,809 | 822 | |||||||||
| Comprehensive loss | (4,089) | (22,527) | |||||||||
| Net comprehensive loss attributable to noncontrolling interest | 2,362 | — | |||||||||
| Net comprehensive loss attributable to controlling interest | $ | (1,727) | $ | (22,527) | |||||||
Utz Brands, Inc.
CONSOLIDATED BALANCE SHEETS
April 3, 2022 and January 2, 2022
(In thousands)
| As of April 3, 2022 | As of January 2, 2022 | ||||||||||
| (Unaudited) | |||||||||||
| ASSETS | |||||||||||
| Current Assets | |||||||||||
| Cash and cash equivalents | $ | 14,899 | $ | 41,898 | |||||||
| Accounts receivable, less allowance of $1,302 and $1,391, respectively | 148,432 | 131,388 | |||||||||
| Inventories | 93,778 | 79,517 | |||||||||
| Prepaid expenses and other assets | 17,042 | 18,395 | |||||||||
| Current portion of notes receivable | 6,401 | 6,706 | |||||||||
| Total current assets | 280,552 | 277,904 | |||||||||
| Non-current Assets | |||||||||||
| Property, plant and equipment, net | 298,656 | 303,807 | |||||||||
| Goodwill | 915,490 | 915,438 | |||||||||
| Intangible assets, net | 1,130,208 | 1,142,509 | |||||||||
| Non-current portion of notes receivable | 19,614 | 20,725 | |||||||||
| Other assets | 78,505 | 55,963 | |||||||||
| Total non-current assets | 2,442,473 | 2,438,442 | |||||||||
| Total assets | $ | 2,723,025 | $ | 2,716,346 | |||||||
| LIABILITIES AND EQUITY | |||||||||||
| Current Liabilities | |||||||||||
| Current portion of term debt | $ | 11,414 | $ | 11,414 | |||||||
| Current portion of other notes payable | 13,057 | 9,957 | |||||||||
| Accounts payable | 104,967 | 95,369 | |||||||||
| Accrued expenses and other | 53,356 | 71,280 | |||||||||
| Total current liabilities | 182,794 | 188,020 | |||||||||
| Non-current portion of term debt and revolving credit facility | 852,722 | 830,548 | |||||||||
| Non-current portion of other notes payable | 23,129 | 24,709 | |||||||||
| Non-current accrued expenses and other | 56,109 | 55,838 | |||||||||
| Non-current warrant liability | 44,280 | 46,224 | |||||||||
| Deferred tax liability | 136,837 | 136,334 | |||||||||
| Total non-current liabilities | 1,113,077 | 1,093,653 | |||||||||
| Total liabilities | 1,295,871 | 1,281,673 | |||||||||
| Commitments and Contingencies | |||||||||||
| Equity | |||||||||||
| Shares of Class A Common Stock, $0.0001 par value; 1,000,000,000 shares authorized; 78,597,175 and 77,644,645 shares issued and outstanding as of April 3, 2022 and January 2, 2022, respectively. | 8 | 8 | |||||||||
| Shares of Class V Common Stock, $0.0001 par value; 61,249,000 shares authorized; 59,349,000 shares issued and outstanding as of April 3, 2022 and January 2, 2022. | 6 | 6 | |||||||||
| Additional paid-in capital | 909,144 | 912,574 | |||||||||
| Accumulated deficit | (254,168) | (236,598) | |||||||||
| Accumulated other comprehensive income | 19,558 | 3,715 | |||||||||
| Total stockholders' equity | 674,548 | 679,705 | |||||||||
| Noncontrolling interest | 752,606 | 754,968 | |||||||||
| Total equity | 1,427,154 | 1,434,673 | |||||||||
| Total liabilities and equity | $ | 2,723,025 | $ | 2,716,346 | |||||||
Utz Brands, Inc.
CONSOLIDATED STATEMENTS OF CASH FLOWS
For the thirteen weeks ended April 3, 2022 and April 4, 2021
(In thousands)
(Unaudited)
| Thirteen weeks ended April 3, 2022 | Thirteen weeks ended April 4, 2021 | ||||||||||
| Cash flows from operating activities | |||||||||||
| Net loss | $ | (31,898) | $ | (23,349) | |||||||
| Adjustments to reconcile net loss to net cash used in operating activities: | |||||||||||
| Impairment and other charges | 3,319 | — | |||||||||
| Depreciation and amortization | 22,121 | 19,407 | |||||||||
| (Gain) loss on remeasurement of warrant liability | (1,944) | 21,501 | |||||||||
| Gain on sale of assets | (367) | (719) | |||||||||
| Share-based compensation | 1,379 | 2,883 | |||||||||
| Deferred taxes | 1,912 | 1,061 | |||||||||
| Deferred financing costs | 341 | 2,870 | |||||||||
| Changes in assets and liabilities: | |||||||||||
| Accounts receivable, net | (17,044) | (11,176) | |||||||||
| Inventories | (14,261) | (7,040) | |||||||||
| Prepaid expenses and other assets | (26) | 866 | |||||||||
| Accounts payable and accrued expenses and other | 464 | (19,487) | |||||||||
| Net cash used in operating activities | (36,004) | (13,183) | |||||||||
| Cash flows from investing activities | |||||||||||
| Acquisitions, net of cash acquired | (75) | (25,189) | |||||||||
| Purchases of property and equipment | (8,137) | (2,134) | |||||||||
| Purchases of intangibles | — | (1,200) | |||||||||
| Proceeds from sale of property and equipment | 1,138 | 391 | |||||||||
| Proceeds from sale of routes | 4,604 | 1,450 | |||||||||
| Proceeds from the sale of IO notes | — | 2,295 | |||||||||
| Proceeds from insurance claims | 2,000 | — | |||||||||
| Notes receivable, net | 221 | (924) | |||||||||
| Net cash used in investing activities | (249) | (25,311) | |||||||||
| Cash flows from financing activities | |||||||||||
| Line of credit borrowings, net | 20,000 | 15,000 | |||||||||
| Borrowings on term debt and notes payable | 8,726 | 720,000 | |||||||||
| Repayments on term debt and notes payable | (9,066) | (783,735) | |||||||||
| Payment of debt issuance cost | — | (8,372) | |||||||||
| Payments of tax withholding requirements for employee stock awards | (6,217) | — | |||||||||
| Exercised warrants | — | 57,232 | |||||||||
| Dividends | (4,189) | (4,261) | |||||||||
| Distribution to noncontrolling interest | — | (181) | |||||||||
| Net cash provided by (used in) financing activities | 9,254 | (4,317) | |||||||||
| Net decrease in cash and cash equivalents | (26,999) | (42,811) | |||||||||
| Cash and cash equivalents at beginning of period | 41,898 | 46,831 | |||||||||
| Cash and cash equivalents at end of period | $ | 14,899 | $ | 4,020 | |||||||
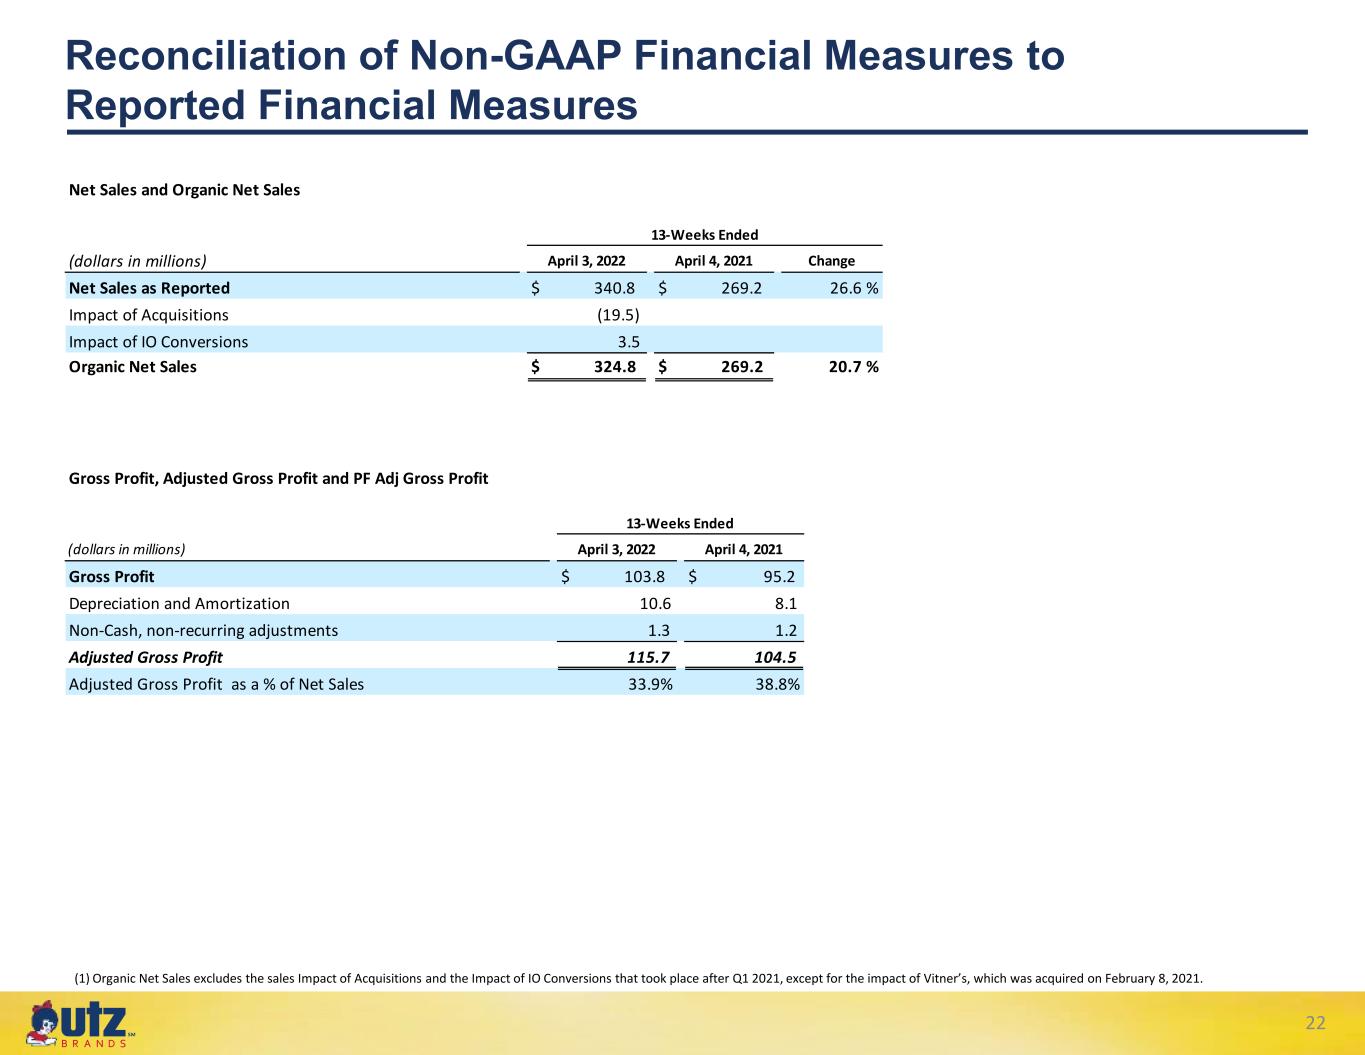
Reconciliation of Non-GAAP Financial Measures to Reported Financial Measures
Net Sales and Organic Net Sales
| 13-Weeks Ended | ||||||||||||||||||||
| (dollars in millions) | April 3, 2022 | April 4, 2021 | Change | |||||||||||||||||
| Net Sales as Reported | $ | 340.8 | $ | 269.2 | 26.6 | % | ||||||||||||||
| Impact of Acquisitions | (19.5) | |||||||||||||||||||
| Impact of IO Conversions | 3.5 | |||||||||||||||||||
| Organic Net Sales | $ | 324.8 | $ | 269.2 | 20.7 | % | ||||||||||||||
(1) Organic Net Sales excludes the Impact of Acquisitions and the Impact of IO Conversions that took place after Q1 2021, except for the impact of Vitner’s, which was acquired on February 8, 2021.
Gross Profit and Adjusted Gross Profit
| 13-Weeks Ended | ||||||||||||||
| (dollars in millions) | April 3, 2022 | April 4, 2021 | ||||||||||||
| Gross Profit | $ | 103.8 | $ | 95.2 | ||||||||||
| Depreciation and Amortization | 10.6 | 8.1 | ||||||||||||
| Non-Cash, non-recurring adjustments | 1.3 | 1.2 | ||||||||||||
| Adjusted Gross Profit | $ | 115.7 | $ | 104.5 | ||||||||||
| Adjusted Gross Profit as a % of Net Sales | 33.9 | % | 38.8 | % | ||||||||||
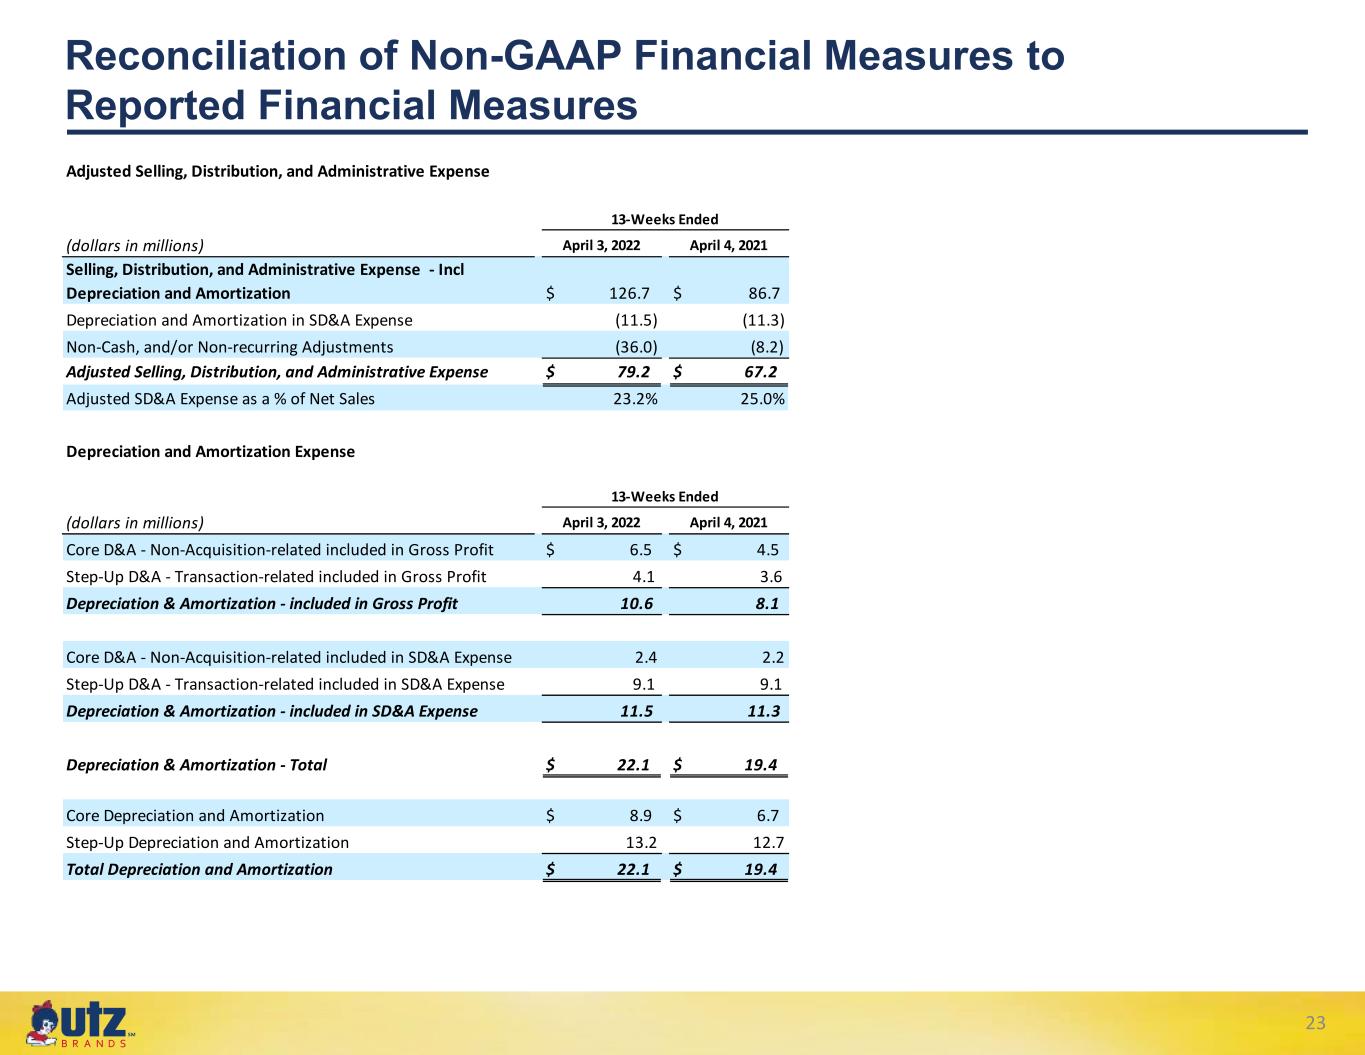
Adjusted Selling, Distribution, and Administrative Expense
| 13-Weeks Ended | ||||||||||||||
| (dollars in millions) | April 3, 2022 | April 4, 2021 | ||||||||||||
| Selling, Distribution, and Administrative Expense - Incl Depreciation and Amortization | $ | 126.7 | $ | 86.7 | ||||||||||
| Depreciation and Amortization in SD&A Expense | (11.5) | (11.3) | ||||||||||||
| Non-Cash, and/or Non-recurring Adjustments | (36.0) | (8.2) | ||||||||||||
| Adjusted Selling, Distribution, and Administrative Expense | $ | 79.2 | $ | 67.2 | ||||||||||
| Adjusted SD&A Expense as a % of Net Sales | 23.2 | % | 25.0 | % | ||||||||||
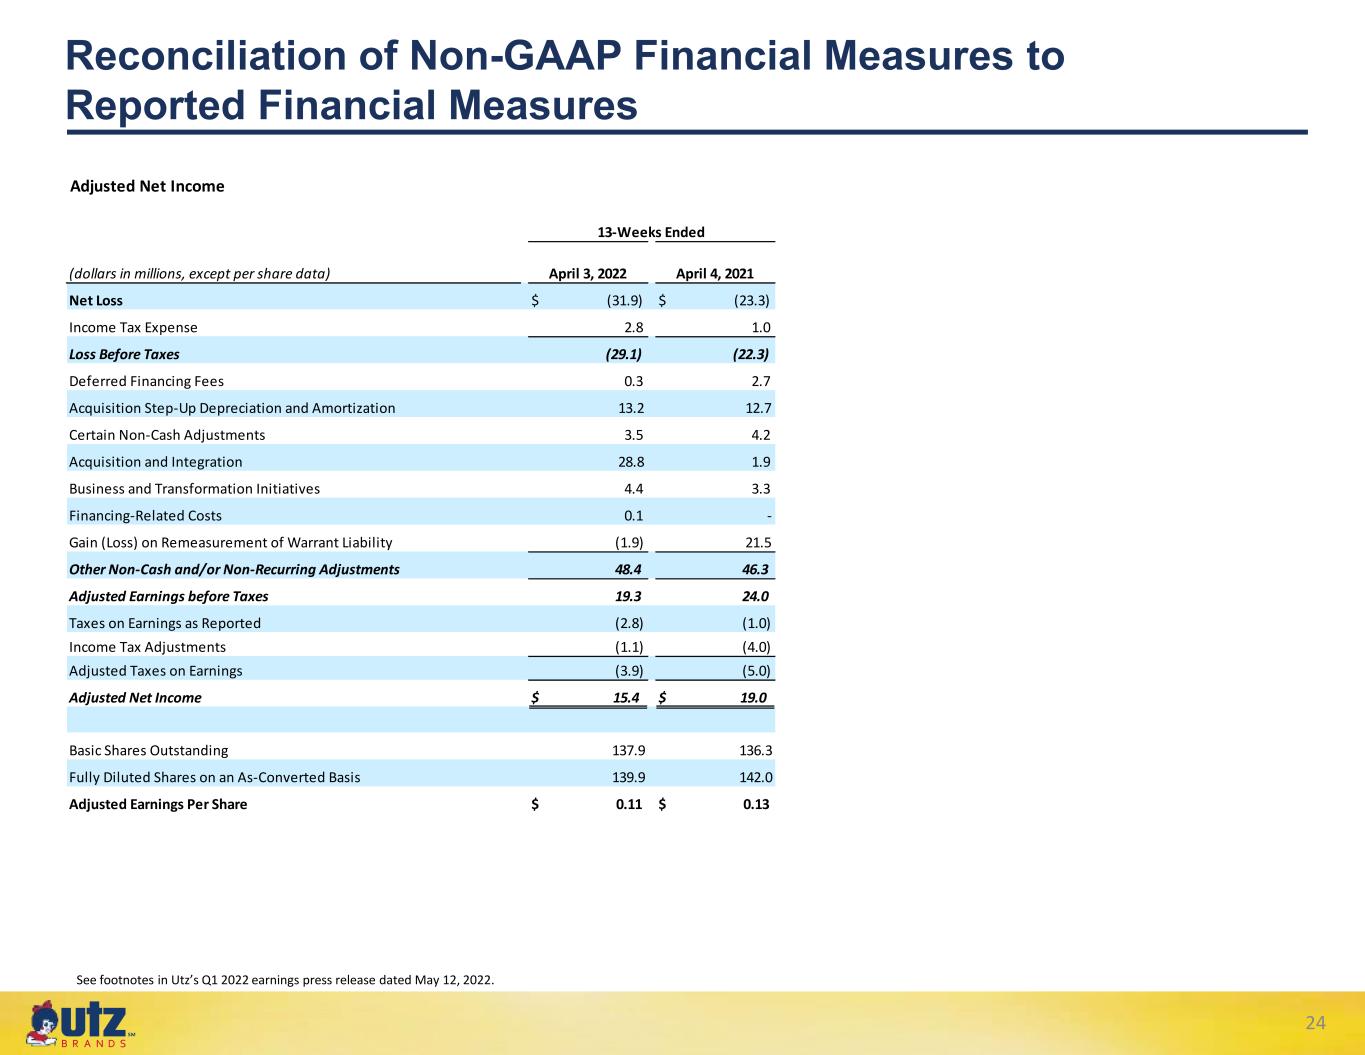
Adjusted Net Income
| 13-Weeks Ended | ||||||||||||||
| (dollars in millions, except per share data) | April 3, 2022 | April 4, 2021 | ||||||||||||
| Net Loss | $ | (31.9) | $ | (23.3) | ||||||||||
| Income Tax Expense | 2.8 | 1.0 | ||||||||||||
| Loss Before Taxes | (29.1) | (22.3) | ||||||||||||
| Deferred Financing Fees | 0.3 | 2.7 | ||||||||||||
| Acquisition Step-Up Depreciation and Amortization | 13.2 | 12.7 | ||||||||||||
| Certain Non-Cash Adjustments | 3.5 | 4.2 | ||||||||||||
| Acquisition and Integration | 28.8 | 1.9 | ||||||||||||
| Business and Transformation Initiatives | 4.4 | 3.3 | ||||||||||||
| Financing-Related Costs | 0.1 | — | ||||||||||||
| Gain (Loss) on Remeasurement of Warrant Liability | (1.9) | 21.5 | ||||||||||||
| Other Non-Cash and/or Non-Recurring Adjustments | 48.4 | 46.3 | ||||||||||||
| Adjusted Earnings before Taxes | 19.3 | 24.0 | ||||||||||||
| Taxes on Earnings as Reported | (2.8) | (1.0) | ||||||||||||
Income Tax Adjustments(1) | (1.1) | (4.0) | ||||||||||||
| Adjusted Taxes on Earnings | (3.9) | (5.0) | ||||||||||||
| Adjusted Net Income | $ | 15.4 | $ | 19.0 | ||||||||||
| Basic Shares Outstanding | 137.9 | 136.3 | ||||||||||||
| Fully Diluted Shares on an As-Converted Basis | 139.9 | 142.0 | ||||||||||||
| Adjusted Earnings Per Share | $ | 0.11 | $ | 0.13 | ||||||||||
(1) Income Tax Rate Adjustment calculated as (Loss) Income before taxes plus (i) Acquisition, Step-Up Depreciation and Amortization and (ii) Other Non-Cash and/or Non-Recurring Adjustments, multiplied by a normalized GAAP effective tax rate, minus the actual tax provision recorded in the Consolidated Statement of Operations and Comprehensive Loss. The normalized GAAP effective tax rate excludes one-time items such as the impact of tax rate changes on deferred taxes and changes in valuation allowances.
Depreciation & Amortization
| 13-Weeks Ended | ||||||||||||||
| (dollars in millions) | April 3, 2022 | April 4, 2021 | ||||||||||||
| Core D&A - Non-Acquisition-related included in Gross Profit | $ | 6.5 | $ | 4.5 | ||||||||||
| Step-Up D&A - Transaction-related included in Gross Profit | 4.1 | 3.6 | ||||||||||||
| Depreciation & Amortization - included in Gross Profit | 10.6 | 8.1 | ||||||||||||
| Core D&A - Non-Acquisition-related included in SD&A Expense | 2.4 | 2.2 | ||||||||||||
| Step-Up D&A - Transaction-related included in SD&A Expense | 9.1 | 9.1 | ||||||||||||
| Depreciation & Amortization - included in SD&A Expense | 11.5 | 11.3 | ||||||||||||
| Depreciation & Amortization - Total | $ | 22.1 | $ | 19.4 | ||||||||||
| Core Depreciation and Amortization | $ | 8.9 | $ | 6.7 | ||||||||||
| Step-Up Depreciation and Amortization | 13.2 | 12.7 | ||||||||||||
| Total Depreciation and Amortization | $ | 22.1 | $ | 19.4 | ||||||||||
EBITDA and Adjusted EBITDA
| 13-Weeks Ended | ||||||||||||||
| (dollars in millions) | April 3, 2022 | April 4, 2021 | ||||||||||||
| Net Loss | $ | (31.9) | $ | (23.3) | ||||||||||
| Plus non-GAAP adjustments: | ||||||||||||||
| Income Tax Expense | 2.8 | 1.0 | ||||||||||||
| Depreciation and Amortization | 22.1 | 19.4 | ||||||||||||
| Interest Expense, Net | 9.1 | 10.9 | ||||||||||||
Interest Income (IO loans)(1) | (0.5) | (1.0) | ||||||||||||
| EBITDA | 1.6 | 7.0 | ||||||||||||
Certain Non-Cash Adjustments(2) | 3.5 | 4.2 | ||||||||||||
Acquisition and Integration(3) | 28.8 | 1.9 | ||||||||||||
Business Transformation Initiatives(4) | 4.4 | 3.3 | ||||||||||||
Financing-Related Costs(5) | 0.1 | — | ||||||||||||
(Gain) Loss on Remeasurement of Warrant Liabilities(6) | (1.9) | 21.5 | ||||||||||||
| Adjusted EBITDA | $ | 36.5 | $ | 37.9 | ||||||||||
| Adjusted EBITDA as a % of Net Sales | 10.7 | % | 14.1 | % | ||||||||||
(1)Interest Income from IO Loans refers to Interest Income that we earn from IO notes receivable that have resulted from our initiatives to transition from RSP distribution to IO distribution ("Business Transformation Initiatives"). There is a Notes Payable recorded that mirrors most of the IO notes receivable, and the interest expense associated with the Notes Payable is part of the Interest Expense, Net adjustment.
(2)Certain Non-Cash Adjustments are comprised primarily of the following:
Incentive programs – For the thirteen weeks ended April 3, 2022 and April 4, 2021, the Company incurred $1.4 million and $2.9 million, respectively, of share based compensation and employee stock purchase plan. During the thirteen weeks ended April 3, 2022, the Company recorded an impairment of $2.0 million related to the termination of distribution agreements.
(3)Adjustment for Acquisition and Integration Costs – This is comprised of consulting, transaction services, and legal fees incurred for acquisitions and certain potential acquisitions. The majority of charges are related to the buyout of multiple distributors, which was accounted for as a contract termination resulting in expense of $23.0 million for the thirteen weeks ended April 3, 2022, versus the costs incurred for the Vitner's acquisition, the Truco acquisition, and related integration expenditures where we incurred costs of $1.9 million for the thirteen weeks ended April 4, 2021.
(4)Business Transformation Initiatives Adjustment – This adjustment is related to consultancy, professional, and legal fees incurred for specific initiatives and structural changes to the business that do not reflect the cost of normal business operations. In addition, gains realized from the sale of distribution rights to IOs and the subsequent disposal of trucks, and ERP transition costs, offset by severance costs associated with the elimination of RSP positions, fall into this category. The Company incurred such costs of $4.4 million and $3.3 million for the thirteen weeks ended April 3, 2022 and April 4, 2021, respectively.
(5)Financing-Related Costs – These costs include adjustments for various items related to raising debt and preferred equity capital or debt extinguishment costs. The Company incurred expenses of $0.3 million for the thirteen weeks ended April 3, 2022.
(6)Gains and losses related to the changes in the remeasurement of warrant liabilities are not expected to be settled in cash, and when exercised would result in a cash inflow to the Company with the Warrants converting to Class A Common Stock with the liability being extinguished and the fair value of the Warrants at the time of exercise being recorded as an increase to equity.
Normalized Adjusted EBITDA
| FY 2021 | FY 2022 | ||||||||||||||||||||||||||||||||||||||||||||||
| (dollars in millions) | Q1 | Q2 | Q3 | Q4 | FY 2021 | Q1 | TTM | ||||||||||||||||||||||||||||||||||||||||
| Adjusted EBITDA | $ | 37.9 | $ | 35.7 | $ | 44.8 | $ | 37.7 | $ | 156.1 | $ | 36.5 | $ | 154.7 | |||||||||||||||||||||||||||||||||
Pre-Acquisition Adjusted EBITDA(1) | 3.6 | 3.0 | 2.0 | 1.6 | 10.2 | 0.2 | 6.8 | ||||||||||||||||||||||||||||||||||||||||
Acquisition Synergies(2) | 3.1 | 3.1 | 2.6 | 2.5 | 11.3 | 2.4 | 10.6 | ||||||||||||||||||||||||||||||||||||||||
| Normalized Adjusted EBITDA | $ | 44.6 | $ | 41.8 | $ | 49.4 | $ | 41.8 | $ | 177.6 | $ | 39.1 | $ | 172.1 | |||||||||||||||||||||||||||||||||
(1) Pre-Acquisition Adjusted EBITDA - This adjustment represents the Adjusted EBITDA of acquired companies,Festida Foods and R.W. Garcia, prior to the acquisition date, as well as from the buyout date of Clem and J&D Snacks.
(2) Represents identified integration-related cost savings expected to be realized from the elimination of certain procurement, manufacturing, and logistics as well as selling, distribution, and administrative expenses, in connection with the acquisitions of Truco Enterprises, Vitner’s, Festida Foods, R.W. Garcia, and the buyouts of Clem and J&D Snacks.
Net Debt and Leverage Ratio
| (dollars in millions) | As of April 3, 2022 | |||||||
| Term Loan | $ | 785.2 | ||||||
| Revolving Credit Facility | 56.0 | |||||||
Capital Leases(1) | 38.8 | |||||||
| Deferred Purchase Price | 5.7 | |||||||
Gross Debt(2) | 885.7 | |||||||
| Cash and Cash Equivalents | 14.9 | |||||||
| Total Net Debt | $ | 870.8 | ||||||
| Last 52-Weeks Normalized Adjusted EBITDA | $ | 172.1 | ||||||
| Net Leverage Ratio | 5.1x | |||||||
(1) Capital Leases include equipment term loans and excludes the impact of step-up accounting.
(2) Excludes amounts related to guarantees on IO loans which are collateralized by routes. We have the ability to recover substantially all of the outstanding loan value in the event of a default scenario, which is uncommon.