Utz Brands Reports Second Quarter 2025 Results
Raises Organic Net Sales Growth Guidance and Advances Supply Chain Transformation
Hanover, PA – July 31, 2025 – Utz Brands, Inc. (NYSE: UTZ) (“Utz” or the “Company”), a leading U.S. manufacturer of branded Salty Snacks and a small-cap value Staples equity, today reported financial results for the Company’s second fiscal quarter ended June 29, 2025.
2Q’25 Summary(1)
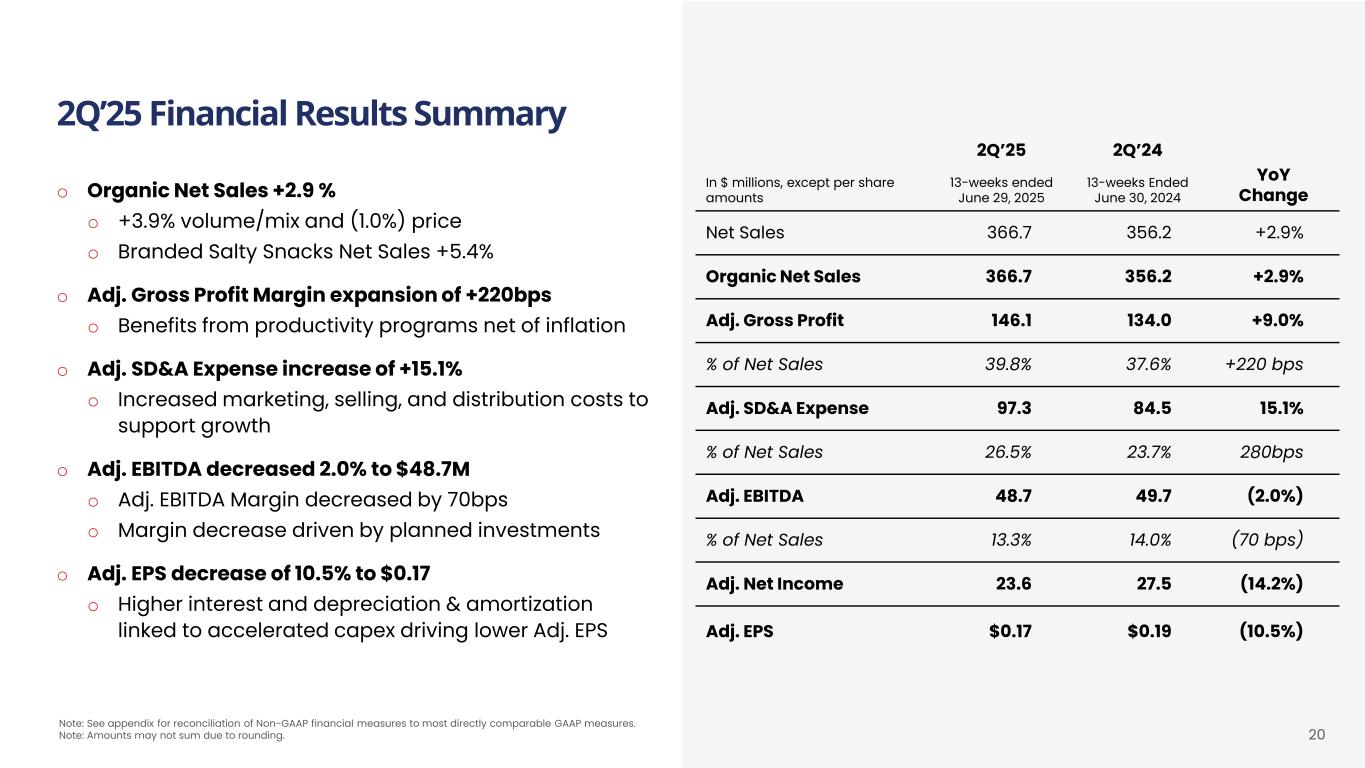
•Net Sales increased 2.9% to $366.7 million
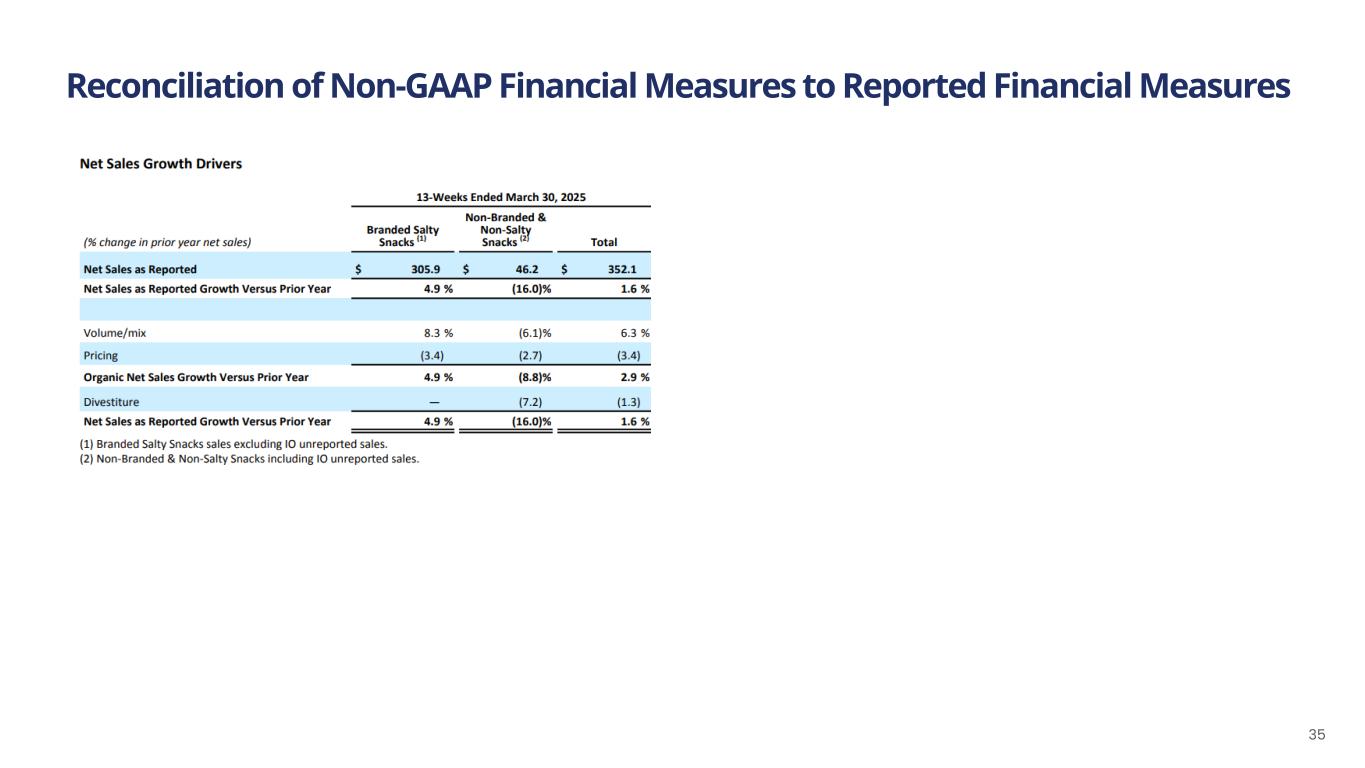
•Total Organic Net Sales increased 2.9%; Branded Salty Snacks increased 5.4%
•Gross Profit Margin decline of 40bps
•Adjusted Gross Profit Margin expansion of 220bps
•Net Income decreased 60.2% to $10.1 million
•Adjusted Net Income decreased 14.2% to $23.6 million
•Adjusted EBITDA decreased 2.0% to $48.7 million
•Diluted Earnings Per Share decreased 47.8% to $0.12
•Adjusted Earnings Per Share decreased 10.5% to $0.17
(1) All comparisons for the second quarter of 2025 are to the second quarter of 2024 (ended June 30, 2024).
“I am pleased with our strong performance in the second quarter, with Organic Net Sales growth of nearly 3%(1). Our Branded Salty Snacks portfolio is accelerating, with 5.4% growth in the quarter(1). We gained value and volume shares in both our Core and Expansion Geographies(3). Our proactive approach to cost management and operational excellence has enabled us to achieve significant Adjusted Gross Profit Margin expansion,” said Howard Friedman, Chief Executive Officer of Utz.
Mr. Friedman continued, “We’re encouraged by our summer sales performance thus far, as we successfully capitalize on seasonal demand and snacking occasions. Our strong performance illustrates our ability to deliver growth independent of the category in a rational competitive environment. Looking ahead to the remainder of 2025, we expect our strong productivity cost savings will continue to provide us with the flexibility to invest in our brands, while expanding profit margins. With geographic expansion driving much of our growth strategy, we remain on track to deliver solid results in 2025 and continue to create long-term shareholder value.”
“We are raising our 2025 Organic Net Sales outlook to reflect stronger revenue trends through the first half and our confidence in the growth drivers ahead,” said Bill Kelley, EVP and Chief Financial Officer of Utz. “We now expect Organic Net Sales growth of 2.5% or better, driven by our advantaged portfolio of brands and expansion geographies. We are also tightening our Adjusted EBITDA range to 7% to 10% growth, reflecting our confidence in the significant productivity programs ramping in the second half. We are lowering our Adjusted Earnings Per Share guidance to 7 to 10% growth due to higher interest and depreciation & amortization linked to our accelerated capex investments. We believe these strategic investments in our manufacturing network and automation capabilities will position us for sustained Adjusted EBITDA margin expansion and continued geographic expansion in 2026 and beyond.”
Second Quarter 2025 Results
Second quarter Net Sales increased 2.9% to $366.7 million compared to $356.2 million in the prior year period. Organic Net Sales also increased 2.9% year-over-year, driven by a favorable volume/mix contribution of 3.9%, or 3.1% excluding
a 0.8 percentage point benefit from bonus packs in April. This was partially offset by lower net price realization of (1.0)%, which included a (0.8) percentage point impact from bonus packs and other net price impacts of (0.2) percentage points. The net impact on second quarter sales from bonus packs was neutral. Branded Salty Snacks Organic Net Sales(3) (representing 88% of total Net Sales) increased 5.4% led by our Power Four Brands, offset by an 11.8% decline in Non-Branded & Non-Salty Snacks Organic Net Sales(3), primarily due to Partner Brands and Dips & Salsas.
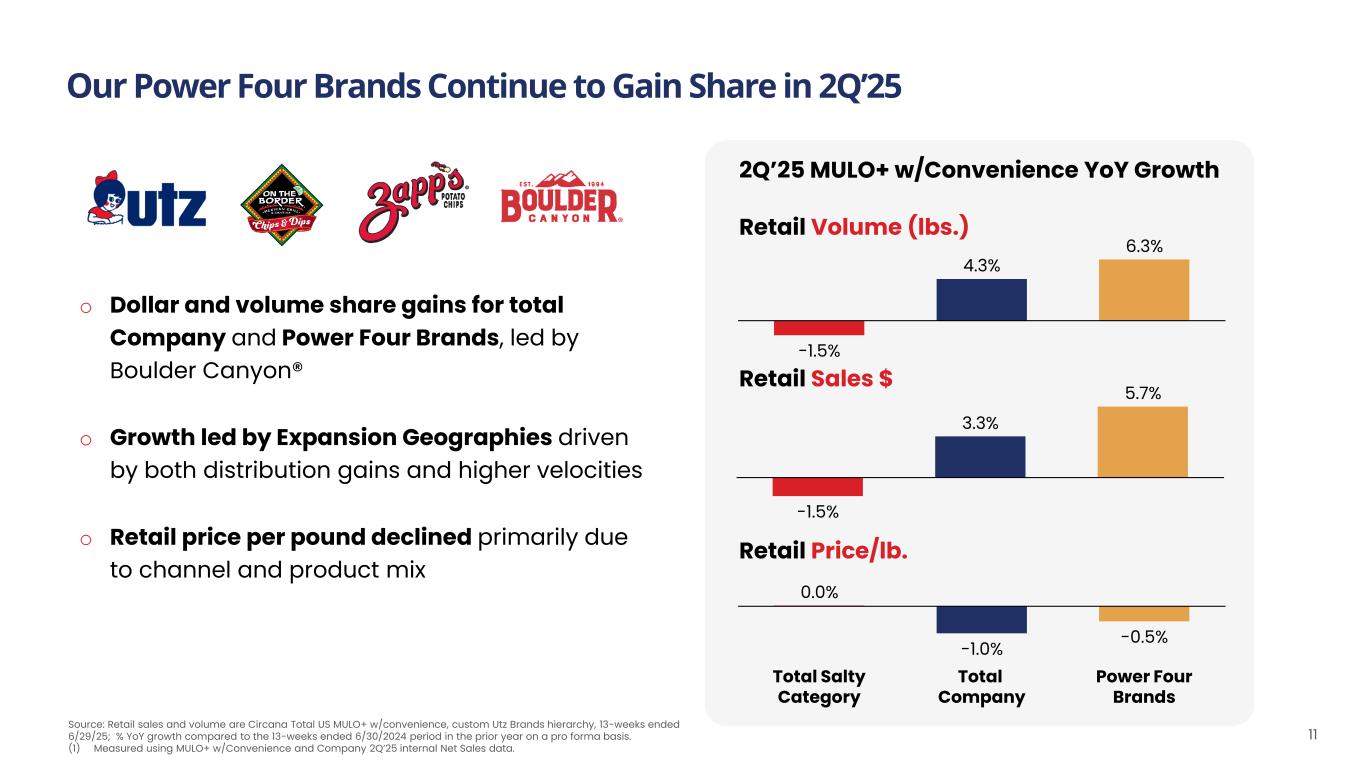
For the 13-week period ended June 29, 2025, the Company’s Branded Salty Snacks Retail Sales increased 3.3% versus the prior year period compared to a 1.5% decline for the Salty Snack category overall(3). The Company’s Retail Volumes increased by 4.3% compared to a 1.5% decline for the Salty Snack category, and the Company drove volume share gains in both its Core and Expansion geographies(2)(3) . The Company’s Power Four Brands of Utz®, On The Border®, Zapp’s® and Boulder Canyon® Retail Sales increased by 5.7%.
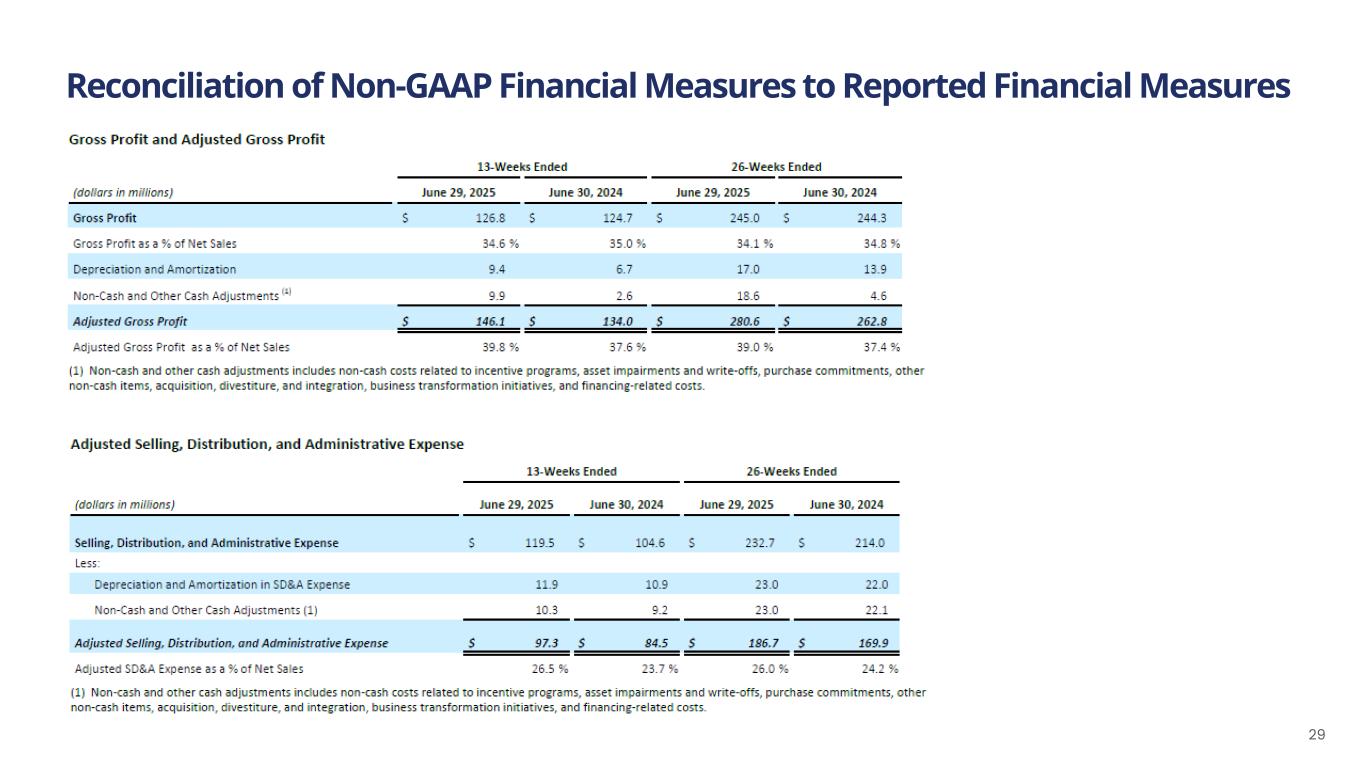
Gross Profit Margin of 34.6% declined 40bps compared to 35.0% in the prior year period. Adjusted Gross Profit Margin of 39.8% expanded 220bps compared to 37.6% in the prior year period. The increase was driven by productivity savings, which more than offset increased investments to support capacity expansion and growth.
Selling, Distribution, and Administrative Expenses (“SD&A Expenses”) were $119.5 million, or 32.6% of Net Sales, compared to $104.6 million, or 29.4% of Net Sales, in the prior year period. Adjusted SD&A Expenses were $97.3 million, or 26.5% of Net Sales, compared to $84.5 million, or 23.7% of Net Sales, in the prior year period. The increase as a percentage of Net Sales was primarily due to adding capabilities, selling, and delivery costs to support the Company’s geographic expansion and growth initiatives.
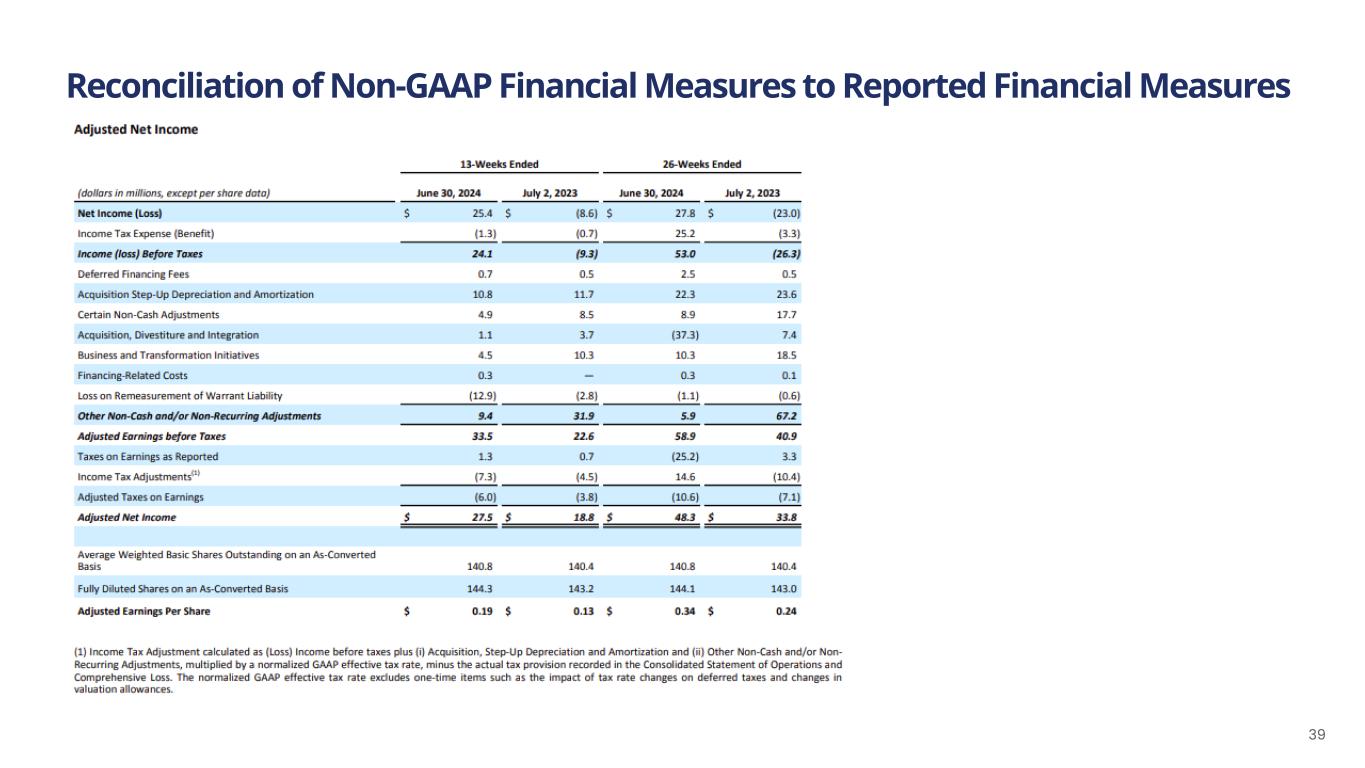
The Company reported Net Income of $10.1 million compared to Net Income of $25.4 million in the prior year period. Adjusted Net Income in the quarter decreased 14.2% to $23.6 million compared to $27.5 million in the prior year period. Adjusted Earnings Per Share decreased 10.5% to $0.17 compared to $0.19 in the prior year period. The Adjusted Earnings Per Share decline in the second quarter was the result of higher SD&A expenses, higher depreciation and amortization, and higher interest expense.
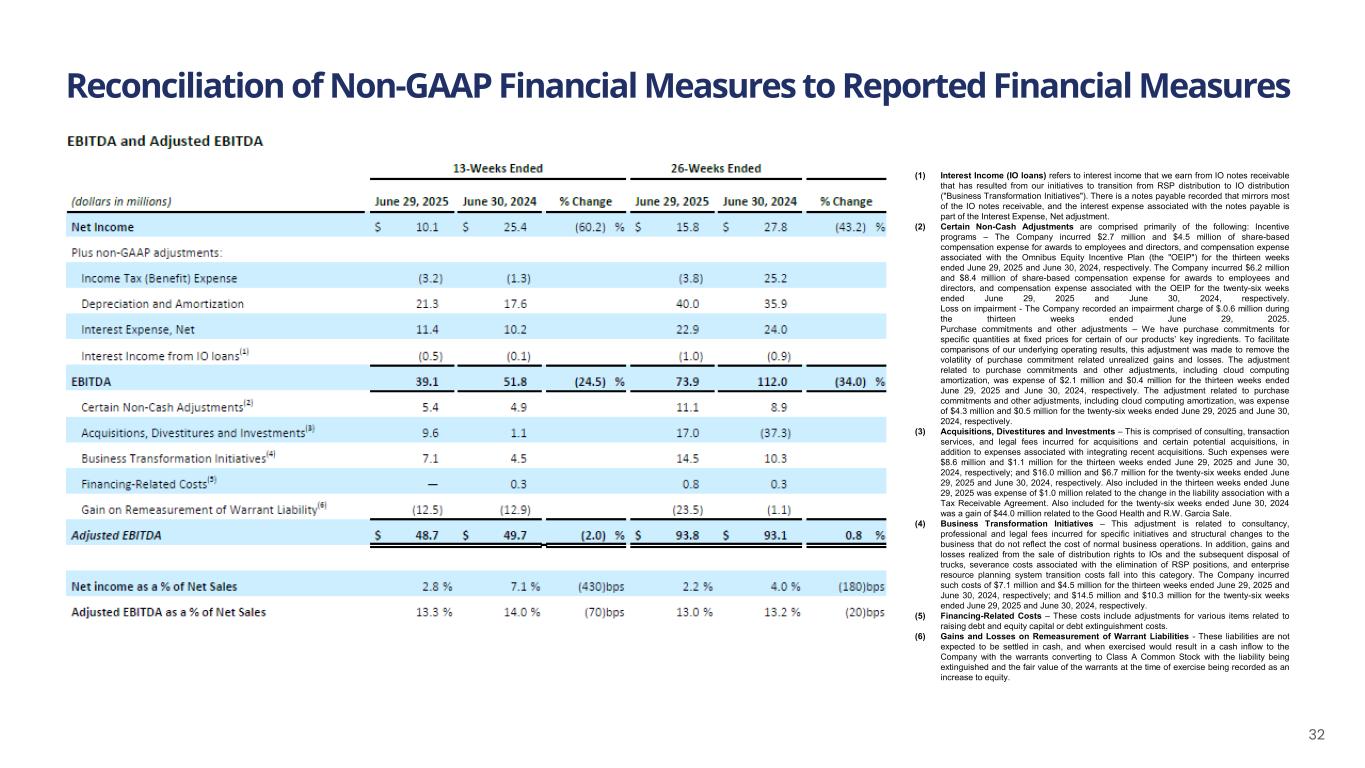
Adjusted EBITDA decreased 2.0% to $48.7 million, or 13.3% as a percentage of Net Sales, compared to $49.7 million, or 14.0% as a percentage of Net Sales, in the prior year period. The decline in Adjusted EBITDA was driven by increased SD&A expenses, which more than offset the positive impact of Adjusted Gross Profit Margin expansion.
(1) Versus prior year period.
(2) As measured by Circana MULO+ w/convenience.
(3) See “Other Defined Terms” for definitions.
Balance Sheet and Cash Flow Highlights
•As of June 29, 2025
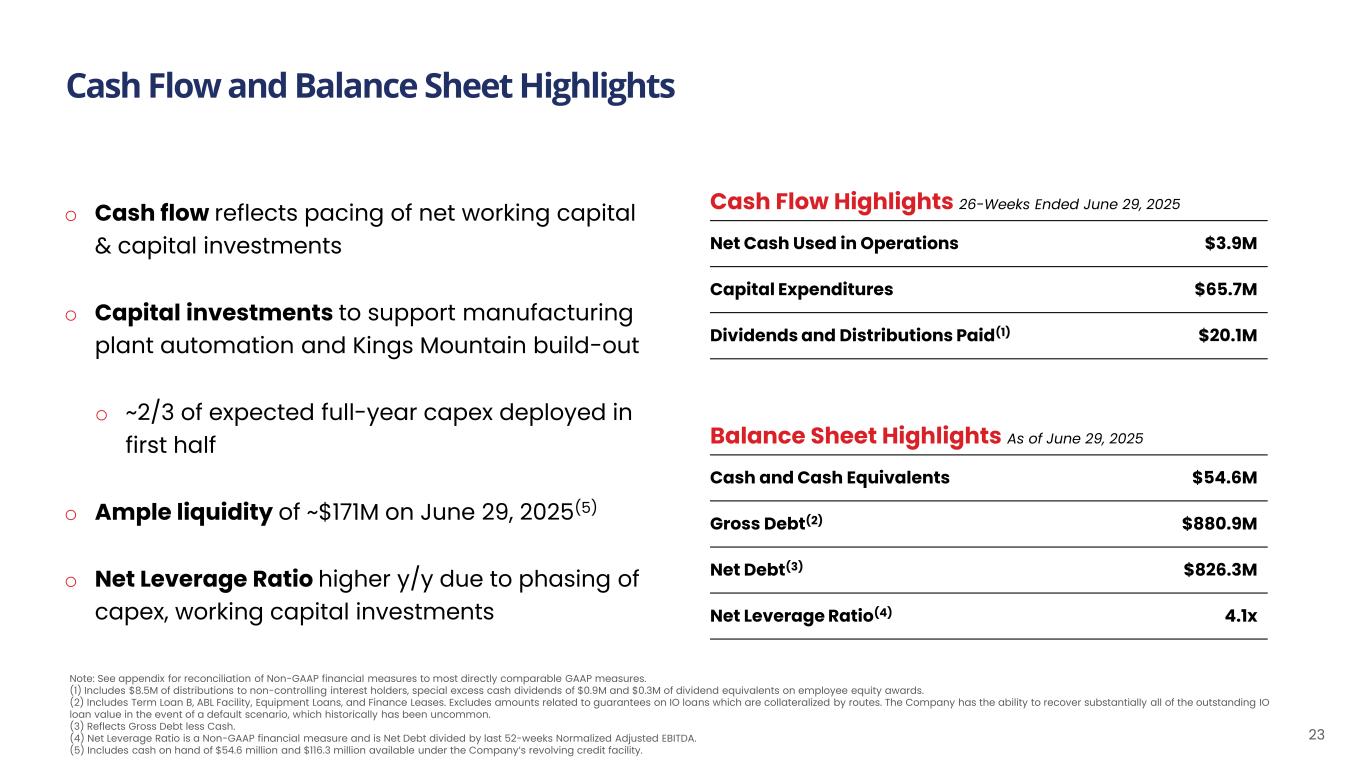
◦Total liquidity of $170.9 million, consisting of cash on hand of $54.6 million and $116.3 million available under the Company’s revolving credit facility.
◦Net debt of $826.3 million resulting in a Net Leverage Ratio of 4.1x based on trailing twelve months Normalized Adjusted EBITDA of $200.9 million.
•For the twenty-six weeks ended June 29, 2025
◦Cash flow used in operations was $3.9 million, which reflects the seasonal use of working capital.
◦Capital expenditures were $65.7 million, and dividends and distributions paid were $20.1 million.
Supply Chain Transformation Plan Update
As part of Utz's ongoing supply chain transformation, the Company is announcing the strategic decision to consolidate its manufacturing footprint from eight primary(1) plants to seven, with the closure of its Grand Rapids, Michigan manufacturing facility. This decision is a key component of the Company’s long-term strategic roadmap, and is expected
to generate cost savings during the second half of 2025. These savings are part of Utz’s previously communicated target of approximately 6% productivity savings as a percentage of Adjusted COGS in fiscal year 2025.
This transition is planned to begin in August and be completed by early 2026. The consolidation should enable the Company to allocate more volume to its larger, more efficient facilities, while driving fixed cost leverage and enhanced automation capabilities across its remaining network. In addition to the expected cost savings, the Company expects the optimized footprint to support its ongoing geographic expansion.
“The decision is a reflection of our commitment to operational excellence and ongoing transformation,” said Friedman. “While these types of decisions are never easy, they are necessary steps to streamline our operations and strengthen our supply chain for the long-term. We are deeply grateful for the contributions of our Grand Rapids team and are committed to supporting them through this transition.”
All impacted associates will be encouraged to apply for opportunities at other Utz facilities, and provided transition assistance including on-site job fairs and severance pay if they cannot relocate.
(1) Excludes Plant 1 in Hanover given limited production.
Fiscal Year 2025 Outlook
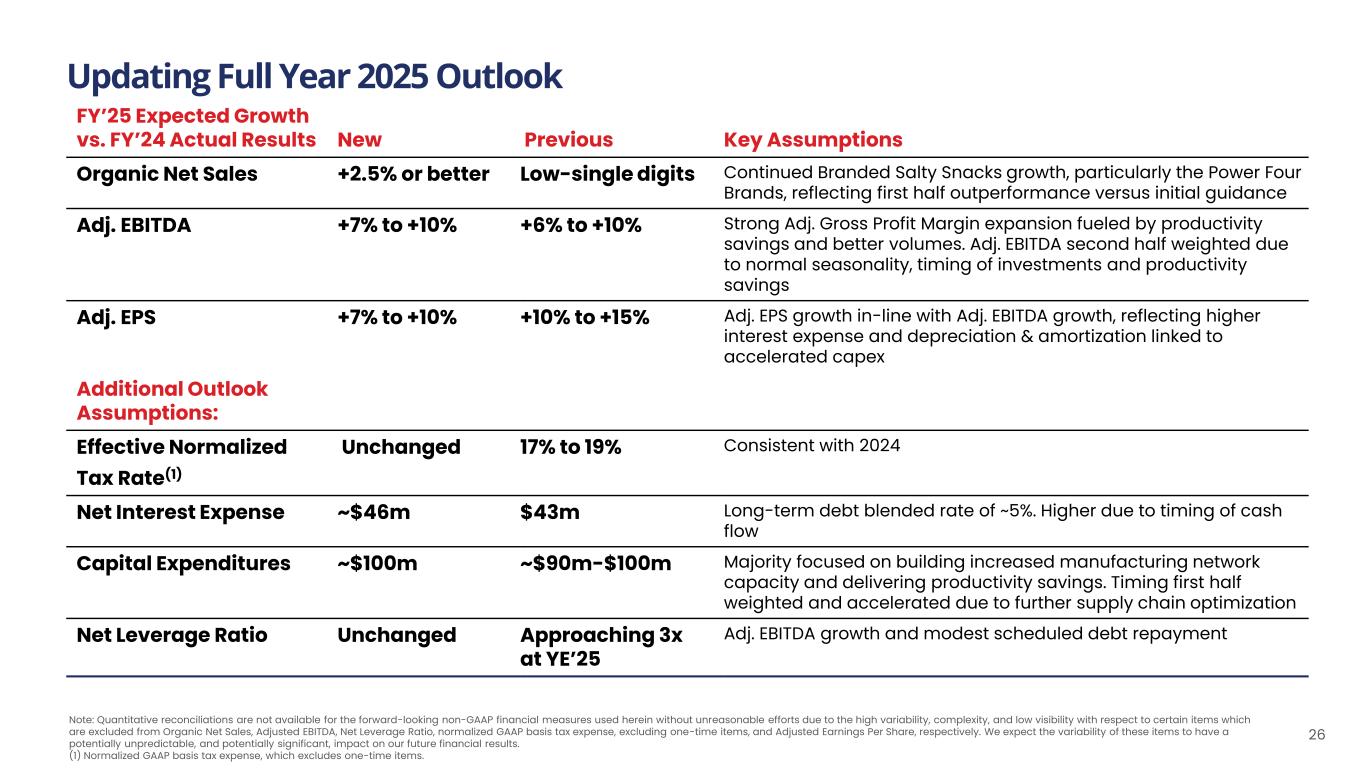
The Company is updating its 2025 fiscal year outlook to reflect stronger top-line trends and higher Adjusted EBITDA. The company is lowering expected Adjusted EPS growth due to higher capital expenditures, depreciation and amortization, and interest expense. The Company now expects:
•Organic Net Sales growth of 2.5% or better, compared to the prior expectation of low-single digits. We expect Organic Net Sales growth will be led by Branded Salty Snacks growth, particularly the Power Four Brands, and less decline in Non-Branded & Non-Salty Snacks;
•Adjusted EBITDA growth of 7% to 10%, compared to the prior expectation of 6% to 10%. The Company expects Adjusted EBITDA Margin expansion of approximately 100bps, which is consistent with the Company’s previously provided guidance. We expect Adjusted EBITDA Margin expansion will be led by Adjusted Gross Profit Margin expansion fueled by strong productivity cost savings and improved product mix; and
•Adjusted Earnings Per Share growth of 7% to 10%, compared to the prior expectation of 10% to 15%, due to higher interest expense and depreciation and amortization linked to accelerated capital expenditures related to the Company’s network optimization and facility consolidation efforts.
Key assumptions for the Company’s fiscal 2025 outlook include:
•An effective tax rate (normalized GAAP basis tax expense, which excludes one-time items) in the range of 17% to 19%, consistent with the Company’s previously provided expectation;
•Interest Expense of approximately $46 million, compared to the prior expectation of $43 million;
•Capital Expenditures are now expected to be approximately $100 million, the high end of the previously provided range of $90 to $100 million, with the majority focused on building increased supply chain network capabilities and delivering accelerated productivity savings; and
•Net Leverage Ratio approaching 3x at year-end fiscal 2025.
Quantitative reconciliations are not available for the forward-looking non-GAAP financial measures used herein without unreasonable efforts due to the high variability, complexity, and low visibility with respect to certain items which are excluded from Organic Net Sales, Adjusted EBITDA, Net Leverage Ratio, normalized GAAP basis tax expense, excluding one-time items, and Adjusted Earnings Per Share, respectively. We expect the variability of these items to have a potentially unpredictable, and potentially significant, impact on our future financial results.
Conference Call and Webcast Presentation
The Company has also posted a pre-recorded management discussion of its second quarter results to its website at https://investors.utzsnacks.com. In addition, the Company will host a live question and answer session with analysts at 9:30 a.m. Eastern Time today. Please visit the “Events & Presentations” section of Utz’s Investor Relations website at https://investors.utzsnacks.com to access the live listen-only webcast. Participants can also dial in over the phone by calling 1-888-596-4144. The Event Plus passcode is 3860587. The Company has also posted presentation slides and additional supplemental financial information, which are available now on Utz’s Investor Relations website.
About Utz Brands, Inc.
Utz Brands, Inc. (NYSE: UTZ) manufactures a diverse portfolio of savory snacks through popular brands, including Utz®, On The Border® Chips & Dips, Zapp’s®, and Boulder Canyon®, among others.
After over a century with a strong family heritage, Utz continues to have a passion for exciting and delighting consumers with delicious snack foods made from top-quality ingredients. Utz's products are distributed nationally through grocery, mass merchandisers, club, convenience, drug, and other channels. Based in Hanover, Pennsylvania, Utz has multiple manufacturing facilities located across the U.S. to serve our growing customer base. For more information, please visit the Company’s website or call 1‐800‐FOR‐SNAX.
Investors and others should note that Utz announces material financial information to its investors using its Investor Relations website, U.S. Securities and Exchange Commission (the “Commission”) filings, press releases, public conference calls, and webcasts. Utz uses these channels, as well as social media, to communicate with our stockholders and the public about the Company, the Company’s products, and other Company information. It is possible that the information that Utz posts on social media could be deemed to be material information. Therefore, Utz encourages investors, the media, and others interested in the Company to review the information posted on the social media channels listed on Utz’s Investor Relations website.
Investor Contact
Trevor Martin
Utz Brands, Inc.
Media Contact
Kevin Brick
Utz Brands, Inc.
Forward-Looking Statements
This press release includes certain statements made herein that are not historical facts but are “forward-looking statements” within the meaning of the “safe harbor” provisions of the Private Securities Litigation Reform Act of 1995, as amended. The forward-looking statements generally are accompanied by or include, without limitation, statements such as “may,” “can,” “should,” “will,” “estimate,” “plan,” “project,” "forecast,” "intend,” "expect,” “anticipate,” “believe,” “seek,” “target” “goal”, “on track””. These forward-looking statements include future plans for the Company, including outlook for fiscal 2025, plans related to the transformation of the Company’s supply chain, the Company’s product mix, the Company’s expectations regarding its level of indebtedness and associated interest expense impacts;
the estimated or anticipated future results and benefits of the Company’s future plans and operations; the Company’s cost savings plans and the Company’s logistics optimization efforts; the estimated or anticipated future results and benefits of the Company’s plans and operations; the effects of tariffs, inflation or supply chain disruptions on the Company or its business; the benefits of the Company’s productivity initiatives; the effects of the Company’s marketing and innovation initiatives; the Company’s future capital structure; future opportunities for the Company’s growth; statements regarding the Company’s projected balance sheet and liabilities, including net leverage; and other statements that are not historical facts.
These statements are based on the current expectations of the Company’s management and are not predictions of actual performance. These statements are subject to a number of risks and uncertainties and the Company’s business and actual results may differ materially. Some factors that could cause actual results to differ include, without limitation: our operation in an industry with high levels of competition and consolidation; our reliance on key customers and ability to obtain favorable contractual terms and protections with customers; changes in demand for our products driven by changes in consumer preferences and tastes or our ability to innovate or market our products effectively; changes in consumers’ loyalty to our brands due to factors beyond our control; impacts on our reputation caused by concerns relating to the quality and safety of our products, ingredients, packaging, or processing techniques; the potential that our products might need to be recalled if they become adulterated or are mislabeled; the loss of retail shelf space and disruption to sales of food products due to changes in retail distribution arrangements; our reliance on third parties to effectively operate both our direct-to-warehouse delivery system and our direct-store-delivery network system; the evolution of e-commerce retailers and sales channels; disruption to our manufacturing operations, supply chain, or distribution channels; the effects of inflation, including rising labor costs; shortages of raw materials, energy, water, and other supplies; changes in the legal and regulatory environments in which we operate, including with respect to tax legislation such as the One Big Beautiful Bill Act; potential liabilities and costs from litigation, claims, legal or regulatory proceedings, inquiries, or investigations into our business; potential adverse effects or unintended consequences related to the implementation of our growth strategy; our ability to successfully identify and execute acquisitions or dispositions and to manage integration or carve out issues following such transactions; the geographic concentration of our markets; our ability to attract and retain highly skilled personnel (including risks associated with our recently announced executive leadership transition); impairment in the carrying value of goodwill or other intangible assets; our ability to protect our intellectual property rights; disruptions, failures, or security breaches of our information technology infrastructure; climate change or legal, regulatory or market measures to address climate change; our exposure to liabilities, claims or new laws or regulations with respect to environmental matters; the increasing focus and opposing views, legislation and expectations with respect to ESG initiatives; restrictions on our operations imposed by covenants in our debt instruments; our exposure to changes in interest rates; adverse impacts from disruptions in the worldwide financial markets, including on our ability to obtain new credit; our exposure to any new or increased income or product taxes; pandemics, epidemics or other disease outbreaks; our exposure to changes to trade policies and tariff and import/export regulations by the United States and other jurisdictions; potential volatility in our Class A Common Stock caused by resales thereof; our dependence on distributions made by our subsidiaries; our payment obligations pursuant to a tax receivable agreement, which in certain cases may exceed the tax benefits we realize or be accelerated; provisions of Delaware law and our governing documents and other agreements that could limit the ability of stockholders to take certain actions or delay or discourage takeover attempts that stockholders may consider favorable; our exclusive forum provisions in our governing documents; the influence of certain significant stockholders and members of Utz Brands Holdings, LLC, whose interests may differ from those of our other stockholders; and the effects of our private placement warrants on the market price of our Class A Common Stock and our net income; and other risks and uncertainties set forth in Part I, Item 1A “Risk Factors” in our Annual Report on Form 10-K filed with the Commission for the fiscal year ended December 29, 2024 and in other reports we file with the U.S. Securities and Exchange Commission from time to time.
Forward-looking statements provide the Company’s expectations, plans or forecasts of future events and views as of the date of this communication. These forward-looking statements should not be relied upon as representing the Company’s assessments as of any date subsequent to the date of this communication. The Company cautions investors not to place undue reliance upon any forward-looking statements, which speak only as of the date made. The Company does not undertake or accept any obligation or undertaking to release publicly any updates or revisions to any forward-looking
statements to reflect any change in its expectations or any change in events, conditions, or circumstances on which any such statement is based, except as otherwise required by law.
Non-GAAP Financial Measures:
Utz uses non-GAAP financial information and believes it is useful to investors as it provides additional information to facilitate comparisons of historical operating results and identify trends in our underlying operating results, and it provides additional insight and transparency on how we evaluate the business. We use non-GAAP financial measures to budget, make operating and strategic decisions, and evaluate our performance. These non-GAAP financial measures do not represent financial performance in accordance with generally accepted accounted principles in the United States (“GAAP”) and may exclude items that are significant to understanding and assessing financial results. Therefore, these measures should not be considered in isolation or as an alternative to net income, cash flows from operations, earnings per share or other measures of profitability, liquidity, or performance under GAAP. You should be aware that the presentation of these measures may not be comparable to similarly titled measures used by other companies.
Management believes that non-GAAP financial measures should be considered as supplements to the GAAP measures reported, should not be considered replacements for, or superior to, the GAAP measures, and may not be comparable to similarly named measures used by other companies. The Company’s calculation of the non-GAAP financial measures may differ from methods used by other companies. We believe that these non-GAAP financial measures provide useful information to investors regarding certain financial and business trends relating to the financial condition and results of operations of the Company to date when considered with both the GAAP results and the reconciliations to the most comparable GAAP measures, and that the presentation of non-GAAP financial measures is useful to investors in the evaluation of our operating performance compared to other companies in the Salty Snack industry, as similar measures are commonly used by the companies in this industry. These non-GAAP financial measures are subject to inherent limitations as they reflect the exercise of management judgment about which items of expense and income are excluded or included in determining these non-GAAP financial measures. The non-GAAP financial measures are not recognized in accordance with GAAP and should not be viewed as an alternative to GAAP measures. As new events or circumstances arise, these definitions could change. When the definitions change, we will provide the updated definitions and present the related non-GAAP historical results on a comparable basis.
Utz uses the following non-GAAP financial measures in its financial communications, and in the future could use others:
•Organic Net Sales
•Adjusted Gross Profit
•Adjusted Gross Profit as % of Net Sales (Adjusted Gross Profit Margin)
•Adjusted Selling, Distribution, and Administrative Expense
•Adjusted Selling, Distribution, and Administrative Expense as % of Net Sales (Adjusted Selling, Distribution, and Administrative Expense Margin)
•Adjusted Net Income
•Adjusted Earnings Per Share
•Adjusted Earnings Before Taxes
•EBITDA
•Adjusted EBITDA
•Adjusted EBITDA as % of Net Sales (Adjusted EBITDA Margin)
•Normalized Adjusted EBITDA
•Effective Normalized Tax Rate
•Net Leverage Ratio
•Adjusted COGS
Organic Net Sales is defined as Net Sales excluding the impacts of acquisitions, divestitures and independent operator (“IO”) route conversions that took place after 1Q’2024.
Adjusted Gross Profit represents Gross Profit excluding Depreciation and Amortization expense, a non-cash item. In addition, Adjusted Gross Profit excludes the impact of costs that fall within the categories of non-cash adjustments and/or other cash adjustment items such as those related to stock-based compensation, hedging and purchase commitments adjustments, asset impairments, acquisition and integration costs, business transformation initiatives, and financing-related costs. Adjusted Gross Profit is one of the key performance indicators that our management uses to evaluate operating performance. We also report Adjusted Gross Profit as a percentage of Net Sales as an additional measure for investors to evaluate our Adjusted Gross Profit Margin.
Adjusted Selling, Distribution, and Administrative Expense is defined as all Selling, Distribution, and Administrative expense excluding Depreciation and Amortization expense, a non-cash item. In addition, Adjusted Selling, Distribution, and Administrative Expense excludes the impact of costs that fall within the categories of non-cash adjustments and/or other cash adjustment items such as those related to stock-based compensation, hedging and purchase commitments adjustments, asset impairments, acquisition and integration costs, business transformation initiatives, and financing-related costs. We also report Adjusted Selling, Distribution, and Administrative Expense as a percentage of Net Sales as an additional measure for investors to evaluate our Adjusted Selling, Distribution, and Administrative Margin.
Adjusted Net Income is defined as Net Income excluding Depreciation and Amortization expense, a non-cash item, related to fair value adjustments on property, plant, and equipment, and definite-lived intangibles relating to business combinations recorded in prior periods. In addition, Adjusted Net Income excludes deferred financing fees, interest income, and expense relating to IO loans and certain non-cash adjustments and/or other cash adjustment items such as those related to stock-based compensation, hedging, and purchase commitments adjustments, asset impairments, acquisition and integration costs, business transformation initiatives, remeasurement of warrant liabilities and financing-related costs. Lastly, Adjusted Net Income normalizes the income tax provision to account for the above-mentioned adjustments.
Adjusted Earnings Before Taxes is defined as Adjusted Net Income before normalized GAAP basis tax expense.
Adjusted Earnings Per Share is defined as Adjusted Net Income divided by the weighted average shares outstanding for each period on a fully diluted basis, assuming the private placement warrants are net settled and the shares of Class V Common Stock of the Company are converted to Class A Common Stock.
EBITDA is defined as Net Income Before Interest, Income Taxes, and Depreciation and Amortization.
Adjusted EBITDA is defined as EBITDA further adjusted to exclude certain non-cash adjustments and/or other cash adjustment items, such as stock-based compensation, hedging and purchase commitments adjustments, asset impairments, acquisition and integration costs, business transformation initiatives, and financing-related costs. Adjusted EBITDA is one of the key performance indicators we use in evaluating our operating performance and in making financial, operating, and planning decisions. We believe Adjusted EBITDA is useful to the users of this release because the financial information contained in the release can be used in the evaluation of Utz’s operating performance compared to other companies in the Salty Snack industry, as similar measures are commonly used by companies in this industry. In this release, we also provide Adjusted EBITDA as a percentage of Net Sales as an additional measure for readers to evaluate our Adjusted EBITDA Margin.
Normalized Adjusted EBITDA is defined as Adjusted EBITDA after giving effect to pre-acquisition Adjusted EBITDA for certain acquisitions and dispositions from time to time.
Effective Normalized Tax Rate is defined as normalized GAAP basis tax expense, which excludes one-time items, divided by Adjusted Earnings before Taxes.
Net Leverage Ratio is defined as trailing twelve month Normalized Adjusted EBITDA divided by Net Debt. Net Debt is defined as Gross Debt less Cash and Cash Equivalents.
Other Defined Terms:
Branded Salty Snacks is defined as Power Four Brands and Other Brands. Power Four Brands consist of the Utz® brand, On The Border®, Zapp’s®, and Boulder Canyon®. Other Brands include Golden Flake®, TORTIYAHS!®, Hawaiian®, Bachman®, Tim’s Cascade®, Dirty Potato Chips®, TGI Fridays® and Vitner's®.
Non-Branded & Non-Salty Snacks is defined as partner brands, private label, co-manufacturing for which we are the manufacturer, Utz branded non-salty snacks such as On The Border® Dips and Salsa, and sales not attributable to specific brands.
Utz Brands, Inc.
CONSOLIDATED STATEMENTS OF OPERATIONS AND COMPREHENSIVE INCOME
For the thirteen weeks ended June 29, 2025 and June 30, 2024
(In millions, except share information)
(Unaudited)
| Thirteen weeks ended June 29, 2025 | Thirteen weeks ended June 30, 2024 | ||||||||||
| Net sales | $ | 366.7 | $ | 356.2 | |||||||
| Cost of goods sold | 239.9 | 231.5 | |||||||||
| Gross profit | 126.8 | 124.7 | |||||||||
| Selling, distribution, and administrative expenses | |||||||||||
| Selling and distribution | 85.8 | 73.8 | |||||||||
| Administrative | 33.7 | 30.8 | |||||||||
| Total selling, distribution, and administrative expenses | 119.5 | 104.6 | |||||||||
| (Loss) gain on sale of assets, net | (0.9) | 2.4 | |||||||||
| Income from operations | 6.4 | 22.5 | |||||||||
| Other income, net | |||||||||||
| Interest expense | (11.4) | (10.2) | |||||||||
| Loss on debt extinguishment | — | (1.3) | |||||||||
| Other (loss) income | (0.6) | 0.2 | |||||||||
| Gain on remeasurement of warrant liability | 12.5 | 12.9 | |||||||||
| Other income, net | 0.5 | 1.6 | |||||||||
| Income before taxes | 6.9 | 24.1 | |||||||||
| Income tax benefit | (3.2) | (1.3) | |||||||||
| Net income | 10.1 | 25.4 | |||||||||
| Net loss (income) attributable to noncontrolling interest | 0.4 | (5.6) | |||||||||
| Net income attributable to controlling interest | $ | 10.5 | $ | 19.8 | |||||||
Income per Class A Common stock: (in dollars) | |||||||||||
| Basic | $ | 0.12 | $ | 0.24 | |||||||
| Diluted | $ | 0.12 | $ | 0.23 | |||||||
| Weighted-average shares of Class A Common stock outstanding | |||||||||||
| Basic | 86,118,292 | 81,457,014 | |||||||||
| Diluted | 87,679,440 | 84,954,412 | |||||||||
| Net income | $ | 10.1 | $ | 25.4 | |||||||
| Other comprehensive income: | |||||||||||
| Change in fair value of interest rate swap | (3.8) | (2.2) | |||||||||
| Comprehensive income | 6.3 | 23.2 | |||||||||
| Net comprehensive loss (income) attributable to noncontrolling interest | 1.9 | (4.6) | |||||||||
| Net comprehensive income attributable to controlling interest | $ | 8.2 | $ | 18.6 | |||||||
Utz Brands, Inc.
CONSOLIDATED STATEMENTS OF OPERATIONS AND COMPREHENSIVE INCOME
For the twenty-six weeks ended June 29, 2025 and June 30, 2024
(In millions, except share information)
(Unaudited)
| Twenty-six weeks ended June 29, 2025 | Twenty-six weeks ended June 30, 2024 | ||||||||||
| Net sales | $ | 718.8 | $ | 702.7 | |||||||
| Cost of goods sold | 473.8 | 458.4 | |||||||||
| Gross profit | 245.0 | 244.3 | |||||||||
| Selling, distribution, and administrative expenses | |||||||||||
| Selling and distribution | 163.1 | 147.4 | |||||||||
| Administrative | 69.6 | 66.6 | |||||||||
| Total selling, distribution, and administrative expenses | 232.7 | 214.0 | |||||||||
| (Loss) gain on sale of assets, net | (0.2) | 1.9 | |||||||||
| Income from operations | 12.1 | 32.2 | |||||||||
| Other (loss) income, net | |||||||||||
| Gain on sale of business | — | 44.0 | |||||||||
| Interest expense | (22.9) | (24.0) | |||||||||
| Loss on debt extinguishment | (0.5) | (1.3) | |||||||||
| Other (loss) income | (0.2) | 1.0 | |||||||||
| Gain on remeasurement of warrant liability | 23.5 | 1.1 | |||||||||
| Other (loss) income, net | (0.1) | 20.8 | |||||||||
| Income before taxes | 12.0 | 53.0 | |||||||||
| Income tax (benefit) expense | (3.8) | 25.2 | |||||||||
| Net income | 15.8 | 27.8 | |||||||||
| Net loss (income) attributable to noncontrolling interest | 2.2 | (12.0) | |||||||||
| Net income attributable to controlling interest | $ | 18.0 | $ | 15.8 | |||||||
Income per Class A Common stock: (in dollars) | |||||||||||
| Basic | $ | 0.21 | $ | 0.19 | |||||||
| Diluted | $ | 0.21 | $ | 0.19 | |||||||
| Weighted-average shares of Class A Common stock outstanding | |||||||||||
| Basic | 85,919,842 | 81,423,240 | |||||||||
| Diluted | 87,604,543 | 84,762,662 | |||||||||
| Net income | $ | 15.8 | $ | 27.8 | |||||||
| Other comprehensive income: | |||||||||||
| Change in fair value of interest rate swap | (10.2) | 2.5 | |||||||||
| Comprehensive income | 5.6 | 30.3 | |||||||||
| Net comprehensive loss (income) attributable to noncontrolling interest | 6.2 | (13.0) | |||||||||
| Net comprehensive income attributable to controlling interest | $ | 11.8 | $ | 17.3 | |||||||
Utz Brands, Inc.
CONSOLIDATED BALANCE SHEETS
June 29, 2025 and December 29, 2024
(In millions, except per share information)
| As of June 29, 2025 | As of December 29, 2024 | ||||||||||
| (Unaudited) | |||||||||||
| ASSETS | |||||||||||
| Current Assets | |||||||||||
| Cash and cash equivalents | $ | 54.6 | $ | 56.1 | |||||||
| Accounts receivable, less allowance of $3.6 and $3.3, respectively | 161.3 | 119.9 | |||||||||
| Inventories | 125.5 | 101.4 | |||||||||
| Prepaid expenses and other assets | 44.0 | 35.3 | |||||||||
| Current portion of notes receivable | 5.1 | 4.6 | |||||||||
| Total current assets | 390.5 | 317.3 | |||||||||
| Non-current Assets | |||||||||||
| Property, plant and equipment, net | 389.7 | 345.2 | |||||||||
| Goodwill | 870.7 | 870.7 | |||||||||
| Intangible assets, net | 983.0 | 996.5 | |||||||||
| Non-current portion of notes receivable | 11.5 | 9.2 | |||||||||
| Other assets | 191.9 | 189.5 | |||||||||
| Total non-current assets | 2,446.8 | 2,411.1 | |||||||||
| Total assets | $ | 2,837.3 | $ | 2,728.4 | |||||||
| LIABILITIES AND EQUITY | |||||||||||
| Current Liabilities | |||||||||||
| Current portion of term debt | $ | 23.2 | $ | 16.1 | |||||||
| Current portion of other notes payable | 7.0 | 6.9 | |||||||||
| Accounts payable | 188.5 | 151.0 | |||||||||
| Accrued expenses and other | 75.1 | 78.3 | |||||||||
| Current portion of warrant liability | 9.5 | 33.0 | |||||||||
| Total current liabilities | 303.3 | 285.3 | |||||||||
| Non-current portion of term debt and revolving credit facility | 842.7 | 752.5 | |||||||||
| Non-current portion of other notes payable | 16.8 | 15.0 | |||||||||
| Non-current accrued expenses and other | 174.0 | 164.2 | |||||||||
| Deferred tax liability | 122.6 | 123.7 | |||||||||
| Total non-current liabilities | 1,156.1 | 1,055.4 | |||||||||
| Total liabilities | 1,459.4 | 1,340.7 | |||||||||
| Commitments and Contingencies | |||||||||||
| Equity | |||||||||||
| Shares of Class A Common Stock, $0.0001 par value; 1,000,000,000 shares authorized; 86,145,254 and 83,537,542 shares issued and outstanding as of June 29, 2025 and December 29, 2024, respectively | — | — | |||||||||
| Shares of Class V Common Stock, $0.0001 par value; 61,249,000 shares authorized; 55,349,000 and 57,349,000 shares issued and outstanding as of June 29, 2025 and December 29, 2024, respectively | — | — | |||||||||
| Additional paid-in capital | 1,017.2 | 988.5 | |||||||||
| Accumulated deficit | (298.4) | (304.7) | |||||||||
| Accumulated other comprehensive income | 12.4 | 18.6 | |||||||||
| Total stockholders' equity | 731.2 | 702.4 | |||||||||
| Noncontrolling interest | 646.7 | 685.3 | |||||||||
| Total equity | 1,377.9 | 1,387.7 | |||||||||
| Total liabilities and equity | $ | 2,837.3 | $ | 2,728.4 | |||||||
Utz Brands, Inc.
CONSOLIDATED STATEMENTS OF CASH FLOWS
For the thirteen weeks ended June 29, 2025 and June 30, 2024
(In millions)
(Unaudited)
| Twenty-six weeks ended June 29, 2025 | Twenty-six weeks ended June 30, 2024 | ||||||||||
| Cash flows from operating activities | |||||||||||
| Net income | $ | 15.8 | $ | 27.8 | |||||||
| Adjustments to reconcile net income to net cash used in operating activities: | |||||||||||
| Impairment and other charges | 0.6 | — | |||||||||
| Depreciation and amortization | 40.0 | 35.9 | |||||||||
| Gain on sale of business | — | (44.0) | |||||||||
| Gain on remeasurement of warrant liability | (23.5) | (1.1) | |||||||||
| Loss (gain) on sale of assets | 0.2 | (1.9) | |||||||||
| Loss on debt extinguishment | 0.5 | 1.3 | |||||||||
| Share-based compensation | 7.0 | 9.2 | |||||||||
| Deferred taxes | (1.1) | 6.4 | |||||||||
| Deferred financing costs | 0.7 | 2.5 | |||||||||
| Changes in assets and liabilities: | |||||||||||
| Accounts receivable, net | (41.4) | (9.6) | |||||||||
| Inventories | (24.2) | (4.0) | |||||||||
| Prepaid expenses and other assets | (17.5) | (15.1) | |||||||||
| Accounts payable and accrued expenses and other | 39.0 | (7.6) | |||||||||
| Net cash used in operating activities | (3.9) | (0.2) | |||||||||
| Cash flows from investing activities | |||||||||||
| Purchases of property and equipment | (65.7) | (37.8) | |||||||||
| Purchases of intangibles | — | (9.2) | |||||||||
| Proceeds from sale of property and equipment | 0.8 | 24.1 | |||||||||
| Proceeds from sale of business | — | 167.5 | |||||||||
| Proceeds from sale of routes | 11.7 | 13.7 | |||||||||
| Proceeds from the sale of IO notes | 3.9 | 1.5 | |||||||||
| Notes receivable | (22.0) | (18.8) | |||||||||
| Net cash (used in) provided by investing activities | (71.3) | 141.0 | |||||||||
| Cash flows from financing activities | |||||||||||
| Borrowings on line of credit | 135.0 | 92.0 | |||||||||
| Repayments on line of credit | (74.5) | (47.2) | |||||||||
| Borrowings on term debt and notes payable | 50.8 | 16.6 | |||||||||
| Repayments on term debt and notes payable | (13.6) | (166.6) | |||||||||
| Payment of debt issuance cost | (1.7) | (0.7) | |||||||||
| Payments of tax withholding requirements for employee stock awards | (2.2) | (1.4) | |||||||||
| Dividends paid | (11.6) | (9.4) | |||||||||
| Distribution to noncontrolling interest | (8.5) | (9.5) | |||||||||
| Net cash provided by (used in) financing activities | 73.7 | (126.2) | |||||||||
| Net (decrease) increase in cash and cash equivalents | (1.5) | 14.6 | |||||||||
| Cash and cash equivalents at beginning of period | 56.1 | 52.0 | |||||||||
| Cash and cash equivalents at end of period | $ | 54.6 | $ | 66.6 | |||||||
Reconciliation of Non-GAAP Financial Measures to Reported Financial Measures
(Amounts may not sum due to rounding)
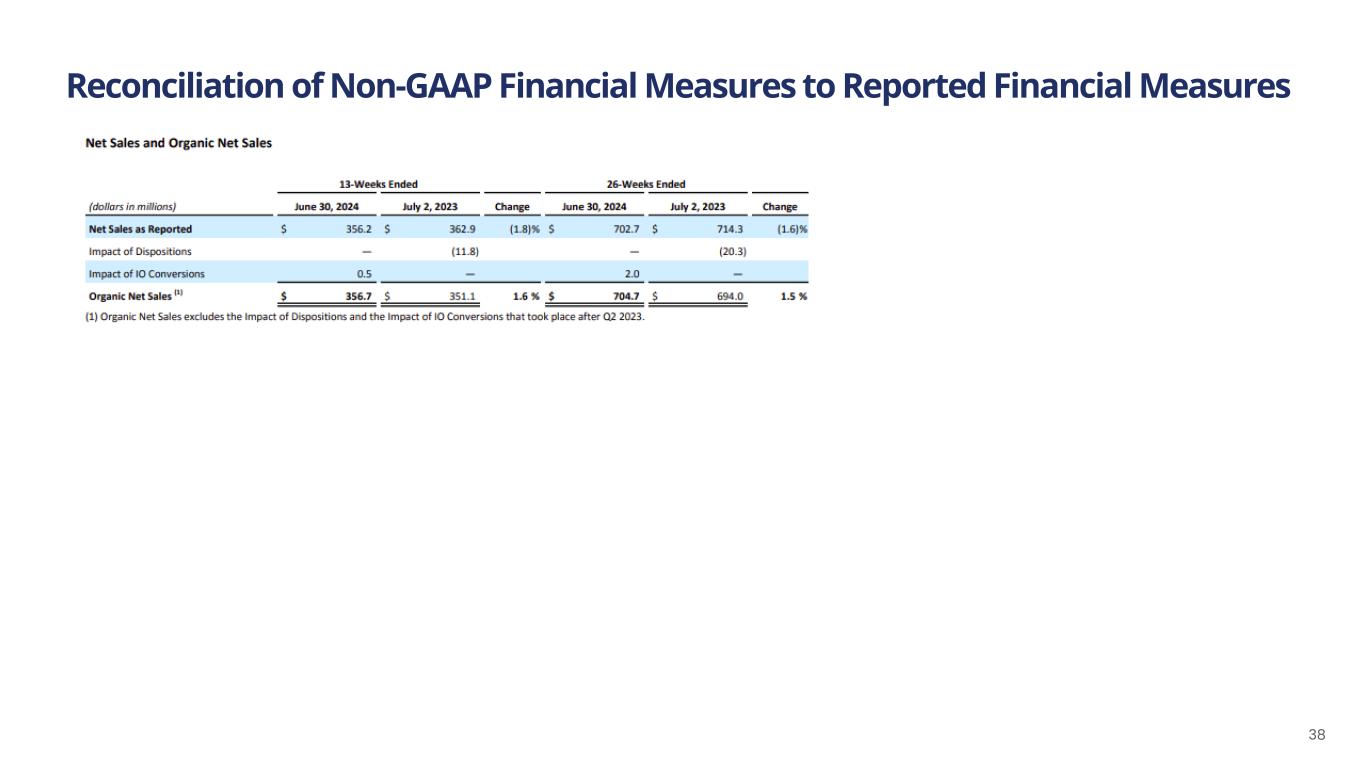
Net Sales and Organic Net Sales
| 13-Weeks Ended | 26-Weeks Ended | |||||||||||||||||||||||||||||||||||||
| (dollars in millions) | June 29, 2025 | June 30, 2024 | Change | June 29, 2025 | June 30, 2024 | Change | ||||||||||||||||||||||||||||||||
| Net Sales as Reported | $ | 366.7 | $ | 356.2 | 2.9 | % | $ | 718.8 | $ | 702.7 | 2.3 | % | ||||||||||||||||||||||||||
| Impact of Dispositions | — | — | — | (4.3) | ||||||||||||||||||||||||||||||||||
Organic Net Sales (1) | $ | 366.7 | $ | 356.2 | 2.9 | % | $ | 718.8 | $ | 698.4 | 2.9 | % | ||||||||||||||||||||||||||
(1) Organic Net Sales excludes the Impact of Dispositions.
Net Sales Growth Drivers
| 13-Weeks Ended June 29, 2025 | 26-Weeks Ended June 29, 2025 | |||||||||||||||||||||||||||||||||||||
| (% change in prior year net sales) | Branded Salty Snacks (1) | Non-Branded & Non-Salty Snacks (2) | Total | Branded Salty Snacks (1) | Non-Branded & Non-Salty Snacks (2) | Total | ||||||||||||||||||||||||||||||||
| Net Sales as Reported | $ | 322.0 | $ | 44.7 | $ | 366.7 | $ | 627.9 | $ | 90.9 | $ | 718.8 | ||||||||||||||||||||||||||
| Net Sales as Reported Growth Versus Prior Year | 5.4 | % | (11.8) | % | 2.9 | % | 5.2 | % | (9.9) | % | 2.3 | % | ||||||||||||||||||||||||||
| Volume/mix | 6.9 | % | (13.4) | % | 3.9 | % | 7.6 | % | (9.8) | % | 5.1 | % | ||||||||||||||||||||||||||
| Pricing | (1.5) | 1.6 | (1.0) | (2.4) | (0.5) | (2.2) | ||||||||||||||||||||||||||||||||
| Organic Net Sales Growth Versus Prior Year | 5.4 | % | (11.8) | % | 2.9 | % | 5.2 | % | (10.3) | % | 2.9 | % | ||||||||||||||||||||||||||
| Divestiture | — | — | — | — | (3.7) | (0.6) | ||||||||||||||||||||||||||||||||
| Net Sales as Reported Growth Versus Prior Year | 5.4 | % | (11.8) | % | 2.9 | % | 5.2 | % | (14.0) | % | 2.3 | % | ||||||||||||||||||||||||||
(1) Branded Salty Snacks sales excluding IO unreported sales.
(2) Non-Branded & Non-Salty Snacks including IO unreported sales.
Gross Profit and Adjusted Gross Profit
| 13-Weeks Ended | 26-Weeks Ended | |||||||||||||||||||||||||
| (dollars in millions) | June 29, 2025 | June 30, 2024 | June 29, 2025 | June 30, 2024 | ||||||||||||||||||||||
| Gross Profit | $ | 126.8 | $ | 124.7 | $ | 245.0 | $ | 244.3 | ||||||||||||||||||
| Gross Profit as a % of Net Sales | 34.6 | % | 35.0 | % | 34.1 | % | 34.8 | % | ||||||||||||||||||
| Depreciation and Amortization | 9.4 | 6.7 | 17.0 | 13.9 | ||||||||||||||||||||||
Non-Cash and Other Cash Adjustments (1) | 9.9 | 2.6 | 18.6 | 4.6 | ||||||||||||||||||||||
| Adjusted Gross Profit | $ | 146.1 | $ | 134.0 | $ | 280.6 | $ | 262.8 | ||||||||||||||||||
| Adjusted Gross Profit as a % of Net Sales | 39.8 | % | 37.6 | % | 39.0 | % | 37.4 | % | ||||||||||||||||||
(1) Non-cash and other cash adjustments includes non-cash costs related to incentive programs, asset impairments and write-offs, purchase commitments, other non-cash items, acquisition, divestiture, and integration, business transformation initiatives, and financing-related costs.
Adjusted Selling, Distribution, and Administrative Expense
| 13-Weeks Ended | 26-Weeks Ended | |||||||||||||||||||||||||
| (dollars in millions) | June 29, 2025 | June 30, 2024 | June 29, 2025 | June 30, 2024 | ||||||||||||||||||||||
| Selling, Distribution, and Administrative Expense | $ | 119.5 | $ | 104.6 | $ | 232.7 | $ | 214.0 | ||||||||||||||||||
| Less: | ||||||||||||||||||||||||||
| Depreciation and Amortization in SD&A Expense | 11.9 | 10.9 | 23.0 | 22.0 | ||||||||||||||||||||||
| Non-Cash and Other Cash Adjustments (1) | 10.3 | 9.2 | 23.0 | 22.1 | ||||||||||||||||||||||
| Adjusted Selling, Distribution, and Administrative Expense | $ | 97.3 | $ | 84.5 | $ | 186.7 | $ | 169.9 | ||||||||||||||||||
| Adjusted SD&A Expense as a % of Net Sales | 26.5 | % | 23.7 | % | 26.0 | % | 24.2 | % | ||||||||||||||||||
(1) Non-cash and other cash adjustments includes non-cash costs related to incentive programs, asset impairments and write-offs, purchase commitments, other non-cash items, acquisition, divestiture, and integration, business transformation initiatives, and financing-related costs.
Adjusted Net Income
| 13-Weeks Ended | 26-Weeks Ended | |||||||||||||||||||||||||||||||||||||
| (dollars in millions, except per share data) | June 29, 2025 | June 30, 2024 | % Change | June 29, 2025 | June 30, 2024 | % Change | ||||||||||||||||||||||||||||||||
| Net Income | $ | 10.1 | $ | 25.4 | (60.2) | % | $ | 15.8 | $ | 27.8 | (43.2) | % | ||||||||||||||||||||||||||
| Income Tax (Benefit) Expense | (3.2) | (1.3) | (3.8) | 25.2 | ||||||||||||||||||||||||||||||||||
| Income Before Taxes | 6.9 | 24.1 | 12.0 | 53.0 | ||||||||||||||||||||||||||||||||||
| Deferred Financing Fees | 0.4 | 0.7 | 0.7 | 2.5 | ||||||||||||||||||||||||||||||||||
| Acquisition Step-Up Depreciation and Amortization | 11.3 | 10.8 | 22.1 | 22.3 | ||||||||||||||||||||||||||||||||||
| Certain Non-Cash Adjustments | 5.7 | 4.9 | 12.1 | 8.9 | ||||||||||||||||||||||||||||||||||
| Acquisitions, Divestitures and Investments | 9.6 | 1.1 | 17.0 | (37.3) | ||||||||||||||||||||||||||||||||||
| Business Transformation Initiatives | 7.1 | 4.5 | 14.5 | 10.3 | ||||||||||||||||||||||||||||||||||
| Financing-Related Costs | — | 0.3 | 0.8 | 0.3 | ||||||||||||||||||||||||||||||||||
| Gain on Remeasurement of Warrant Liability | (12.5) | (12.9) | (23.5) | (1.1) | ||||||||||||||||||||||||||||||||||
Other Non-Cash and/or Cash Adjustments (1) | 21.6 | 9.4 | 43.7 | 5.9 | ||||||||||||||||||||||||||||||||||
| Adjusted Earnings before Taxes | 28.5 | 33.5 | 55.7 | 58.9 | ||||||||||||||||||||||||||||||||||
| Taxes on Earnings as Reported | 3.2 | 1.3 | 3.8 | (25.2) | ||||||||||||||||||||||||||||||||||
Income Tax Adjustments(2) | (8.1) | (7.3) | (5.5) | 14.6 | ||||||||||||||||||||||||||||||||||
| Adjusted Taxes on Earnings | (4.9) | (6.0) | (9.7) | (10.6) | ||||||||||||||||||||||||||||||||||
| Adjusted Net Income | $ | 23.6 | $ | 27.5 | (14.2) | % | $ | 46.0 | $ | 48.3 | (4.8) | % | ||||||||||||||||||||||||||
| Average Weighted Basic Shares Outstanding on an As-Converted Basis | 141.5 | 140.8 | 141.4 | 140.8 | ||||||||||||||||||||||||||||||||||
| Fully Diluted Shares on an As-Converted Basis | 143.0 | 144.3 | 143.1 | 144.1 | ||||||||||||||||||||||||||||||||||
| Adjusted Earnings Per Share | $ | 0.17 | $ | 0.19 | (10.5) | % | $ | 0.32 | $ | 0.34 | (5.9) | % | ||||||||||||||||||||||||||
(1) Non-cash and other cash adjustments includes non-cash costs related to incentive programs, asset impairments and write-offs, purchase commitments, other non-cash items, acquisitions, divestitures, and investments, business transformation initiatives, and financing-related costs.
(2) Income Tax Adjustment calculated as Income before taxes plus (i) Acquisition, Step-Up Depreciation and Amortization and (ii) Other non-cash and/or cash adjustments, multiplied by a normalized GAAP effective tax rate, minus the actual tax provision recorded in the Consolidated Statement of Operations and Comprehensive Income (Loss). The normalized GAAP effective tax rate excludes one-time items such as the impact of tax rate changes on deferred taxes and changes in valuation allowances.
Depreciation & Amortization
| 13-Weeks Ended | 26-Weeks Ended | |||||||||||||||||||||||||
| (dollars in millions) | June 29, 2025 | June 30, 2024 | June 29, 2025 | June 30, 2024 | ||||||||||||||||||||||
| Core D&A - Non-Acquisition-related included in Gross Profit | $ | 6.8 | $ | 4.6 | $ | 12.3 | $ | 9.2 | ||||||||||||||||||
| Step-Up D&A - Transaction-related included in Gross Profit | 2.6 | 2.1 | 4.7 | 4.7 | ||||||||||||||||||||||
| Depreciation & Amortization - included in Gross Profit | 9.4 | 6.7 | 17.0 | 13.9 | ||||||||||||||||||||||
| Core D&A - Non-Acquisition-related included in SD&A Expense | $ | 3.2 | 2.2 | $ | 5.6 | 4.4 | ||||||||||||||||||||
| Step-Up D&A - Transaction-related included in SD&A Expense | 8.7 | 8.7 | 17.4 | 17.6 | ||||||||||||||||||||||
| Depreciation & Amortization - included in SD&A Expense | 11.9 | 10.9 | 23.0 | 22.0 | ||||||||||||||||||||||
| Depreciation & Amortization - Total | $ | 21.3 | $ | 17.6 | $ | 40.0 | $ | 35.9 | ||||||||||||||||||
| Core Depreciation and Amortization | $ | 10.0 | $ | 6.8 | $ | 17.9 | $ | 13.6 | ||||||||||||||||||
| Step-Up Depreciation and Amortization | $ | 11.3 | 10.8 | $ | 22.1 | 22.3 | ||||||||||||||||||||
| Total Depreciation and Amortization | $ | 21.3 | $ | 17.6 | $ | 40.0 | $ | 35.9 | ||||||||||||||||||
EBITDA and Adjusted EBITDA
| 13-Weeks Ended | 26-Weeks Ended | |||||||||||||||||||||||||||||||||||||
| (dollars in millions) | June 29, 2025 | June 30, 2024 | % Change | June 29, 2025 | June 30, 2024 | % Change | ||||||||||||||||||||||||||||||||
| Net Income | $ | 10.1 | $ | 25.4 | (60.2) | % | $ | 15.8 | $ | 27.8 | (43.2) | % | ||||||||||||||||||||||||||
| Plus non-GAAP adjustments: | ||||||||||||||||||||||||||||||||||||||
| Income Tax (Benefit) Expense | (3.2) | (1.3) | (3.8) | 25.2 | ||||||||||||||||||||||||||||||||||
| Depreciation and Amortization | 21.3 | 17.6 | 40.0 | 35.9 | ||||||||||||||||||||||||||||||||||
| Interest Expense, Net | 11.4 | 10.2 | 22.9 | 24.0 | ||||||||||||||||||||||||||||||||||
Interest Income (IO loans)(1) | (0.5) | (0.1) | (1.0) | (0.9) | ||||||||||||||||||||||||||||||||||
| EBITDA | 39.1 | 51.8 | (24.5) | % | 73.9 | 112.0 | (34.0) | % | ||||||||||||||||||||||||||||||
Certain Non-Cash Adjustments(2) | 5.4 | 4.9 | 11.1 | 8.9 | ||||||||||||||||||||||||||||||||||
Acquisitions, Divestitures and Investments(3) | 9.6 | 1.1 | 17.0 | (37.3) | ||||||||||||||||||||||||||||||||||
Business Transformation Initiatives(4) | 7.1 | 4.5 | 14.5 | 10.3 | ||||||||||||||||||||||||||||||||||
Financing-Related Costs(5) | — | 0.3 | 0.8 | 0.3 | ||||||||||||||||||||||||||||||||||
Gain on Remeasurement of Warrant Liability(6) | (12.5) | (12.9) | (23.5) | (1.1) | ||||||||||||||||||||||||||||||||||
| Adjusted EBITDA | $ | 48.7 | $ | 49.7 | (2.0) | % | $ | 93.8 | $ | 93.1 | 0.8 | % | ||||||||||||||||||||||||||
| Net income as a % of Net Sales | 2.8 | % | 7.1 | % | (430) | bps | 2.2 | % | 4.0 | % | (180) | bps | ||||||||||||||||||||||||||
| Adjusted EBITDA as a % of Net Sales | 13.3 | % | 14.0 | % | (70) | bps | 13.0 | % | 13.2 | % | (20) | bps | ||||||||||||||||||||||||||
(1)Interest Income (IO loans) refers to interest income that we earn from IO notes receivable that has resulted from our initiatives to transition from RSP distribution to IO distribution ("Business Transformation Initiatives"). There is a notes payable recorded that mirrors most of the IO notes receivable, and the interest expense associated with the notes payable is part of the Interest Expense, Net adjustment.
(2)Certain Non-Cash Adjustments are comprised primarily of the following:
Incentive programs – The Company incurred $2.7 million and $4.5 million of share-based compensation expense for awards to employees and directors, and compensation expense associated with the Omnibus Equity Incentive Plan (the "OEIP") for the thirteen weeks ended June 29, 2025 and June 30, 2024, respectively. The Company incurred $6.2 million and $8.4 million of share-based compensation expense for awards to employees and directors, and compensation expense associated with the OEIP for the twenty-six weeks ended June 29, 2025 and June 30, 2024, respectively.
Loss on impairment - The Company recorded an impairment charge of $.0.6 million during the thirteen weeks ended June 29, 2025.
Purchase commitments and other adjustments – We have purchase commitments for specific quantities at fixed prices for certain of our products’ key ingredients. To facilitate comparisons of our underlying operating results, this adjustment was made to remove the volatility of purchase commitment related unrealized gains and losses. The adjustment related to purchase commitments and other adjustments, including cloud computing amortization, was expense of $2.1 million and $0.4 million for the thirteen weeks ended June 29, 2025 and June 30, 2024, respectively. The adjustment
related to purchase commitments and other adjustments, including cloud computing amortization, was expense of $4.3 million and $0.5 million for the twenty-six weeks ended June 29, 2025 and June 30, 2024, respectively.
(3)Acquisitions, Divestitures and Investments – This is comprised of consulting, transaction services, and legal fees incurred for acquisitions and certain potential acquisitions, in addition to expenses associated with integrating recent acquisitions. Such expenses were $8.6 million and $1.1 million for the thirteen weeks ended June 29, 2025 and June 30, 2024, respectively; and $16.0 million and $6.7 million for the twenty-six weeks ended June 29, 2025 and June 30, 2024, respectively. Also included in the thirteen weeks ended June 29, 2025 was expense of $1.0 million related to the change in the liability association with a Tax Receivable Agreement. Also included for the twenty-six weeks ended June 30, 2024 was a gain of $44.0 million related to the Good Health and R.W. Garcia Sale.
(4)Business Transformation Initiatives – This adjustment is related to consultancy, professional and legal fees incurred for specific initiatives and structural changes to the business that do not reflect the cost of normal business operations. In addition, gains and losses realized from the sale of distribution rights to IOs and the subsequent disposal of trucks, severance costs associated with the elimination of RSP positions, and enterprise resource planning system transition costs fall into this category. The Company incurred such costs of $7.1 million and $4.5 million for the thirteen weeks ended June 29, 2025 and June 30, 2024, respectively; and $14.5 million and $10.3 million for the twenty-six weeks ended June 29, 2025 and June 30, 2024, respectively.
(5)Financing-Related Costs – These costs include adjustments for various items related to raising debt and equity capital or debt extinguishment costs.
(6)Gains on Remeasurement of Warrant Liability - These liabilities are not expected to be settled in cash, and when exercised would result in a cash inflow to the Company with the warrants converting to Class A Common Stock with the liability being extinguished and the fair value of the warrants at the time of exercise being recorded as an increase to equity.
Normalized Adjusted EBITDA
| FY 2024 | FY 2025 | |||||||||||||||||||||||||||||||||||||||||||||||||
| (dollars in millions) | Q1 | Q2 | Q3 | Q4 | FY 2024 | Q1 | Q2 | TTM | ||||||||||||||||||||||||||||||||||||||||||
| Adjusted EBITDA | $ | 43.4 | $ | 49.7 | $ | 54.0 | $ | 53.1 | $ | 200.2 | $ | 45.1 | $ | 48.7 | $ | 200.9 | ||||||||||||||||||||||||||||||||||
| Pre-Acquisition Adjusted EBITDA | — | — | — | — | — | — | — | — | ||||||||||||||||||||||||||||||||||||||||||
| Normalized Adjusted EBITDA | $ | 43.4 | $ | 49.7 | $ | 54.0 | $ | 53.1 | $ | 200.2 | $ | 45.1 | $ | 48.7 | $ | 200.9 | ||||||||||||||||||||||||||||||||||
Net Debt and Leverage Ratio
| (dollars in millions) | As of June 29, 2025 | |||||||
| Term Loan | $ | 630.3 | ||||||
| Real Estate Loan | 58.4 | |||||||
| ABL Facility | 60.7 | |||||||
Equipment Loans and Finance Leases(1) | 131.5 | |||||||
Gross Debt(2) | 880.9 | |||||||
| Cash and Cash Equivalents | 54.6 | |||||||
| Total Net Debt | $ | 826.3 | ||||||
| Last 52-Weeks Normalized Adjusted EBITDA | $ | 200.9 | ||||||
Net Leverage Ratio(3) | 4.1x | |||||||
(1) Equipment loans and finance leases include leases accounted for as finance leases under US GAAP and loans for equipment.
(2) Includes Term Loan B, ABL Facility, Equipment Loans, and Finance Leases. Excludes amounts related to guarantees on IO loans which are collateralized by routes. The Company has the ability to recover substantially all of the outstanding IO loan value in the event of a default scenario, which historically has been uncommon.
(3) Based on trailing twelve month Normalized Adjusted EBITDA of $200.9 million.