EXHIBIT 99.1

VEECO REPORTS FIRST QUARTER 2026 FINANCIAL RESULTS
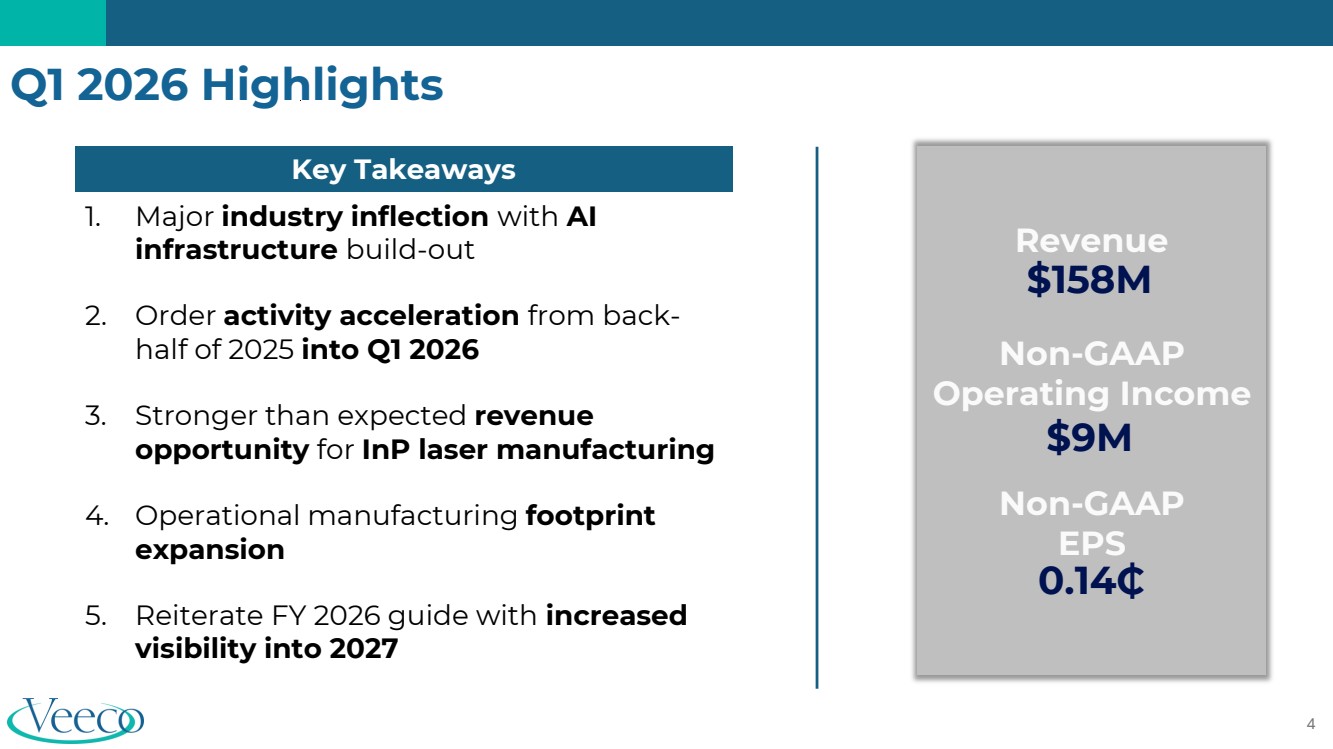
First Quarter 2026 Highlights:
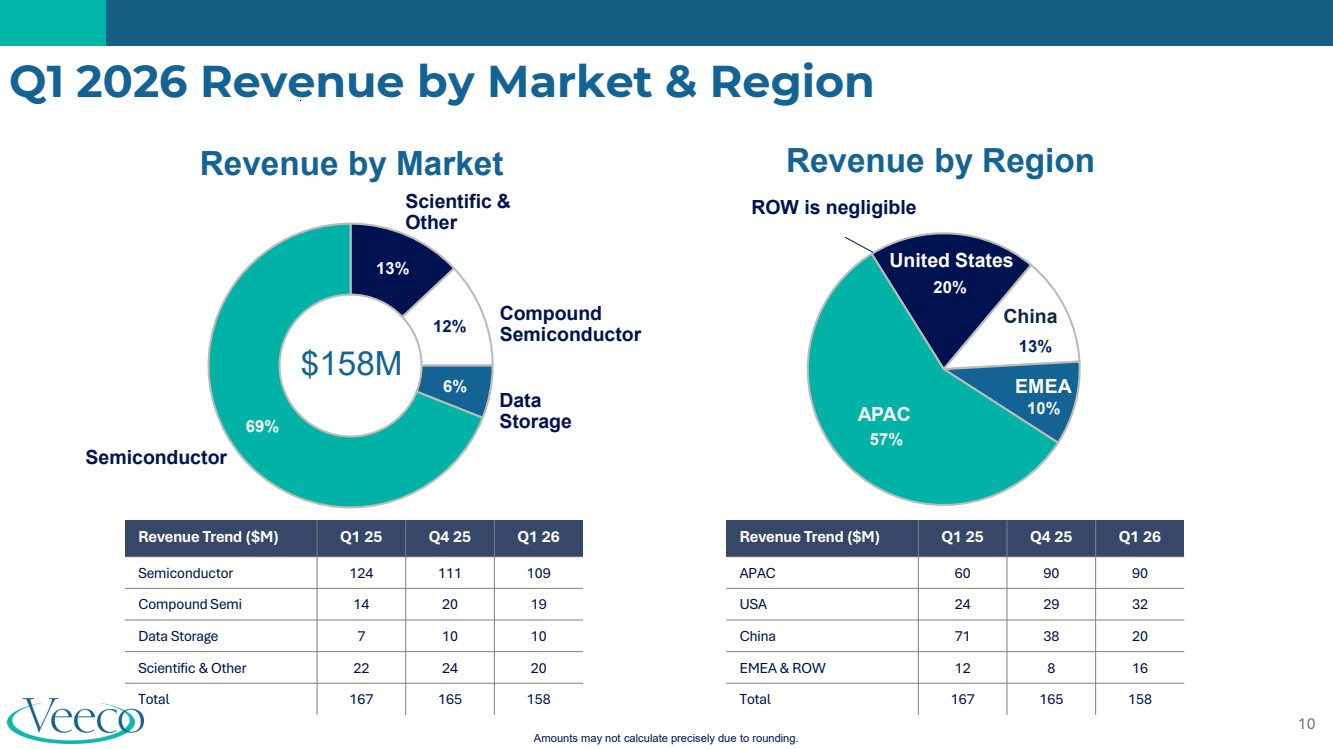
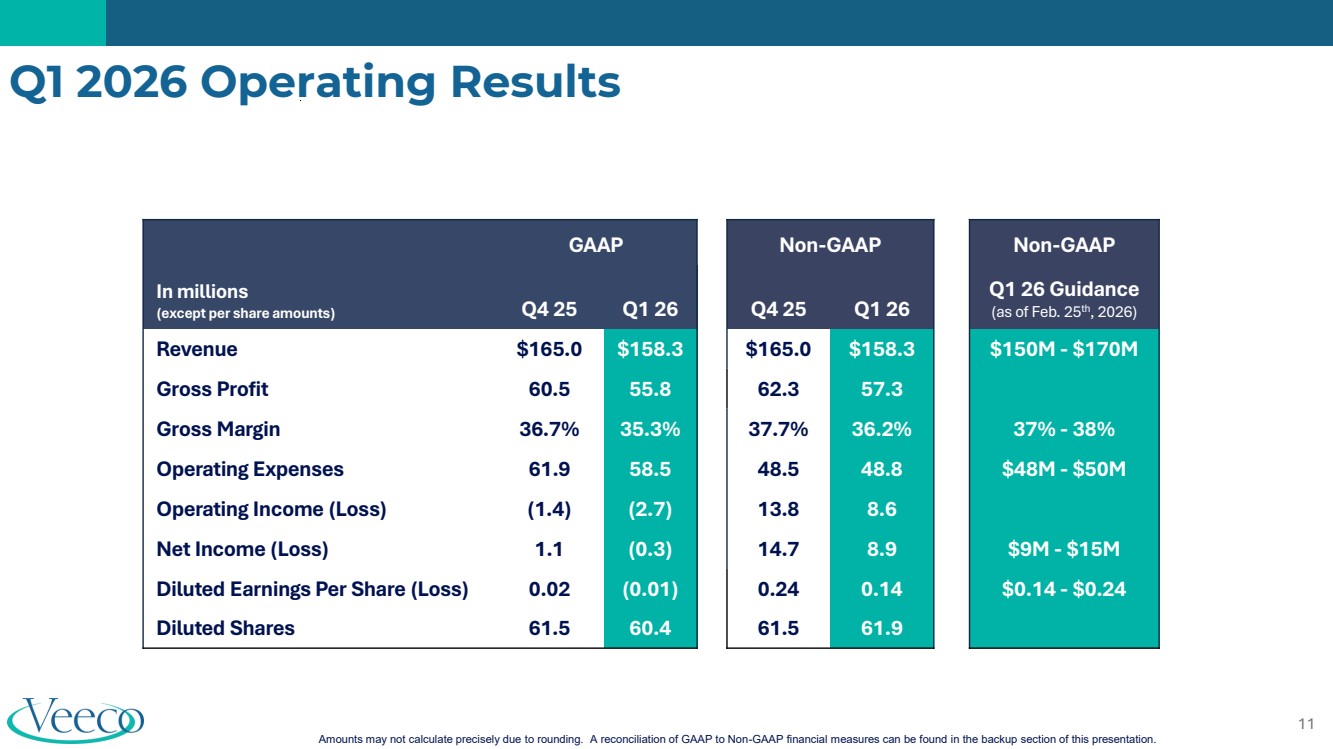
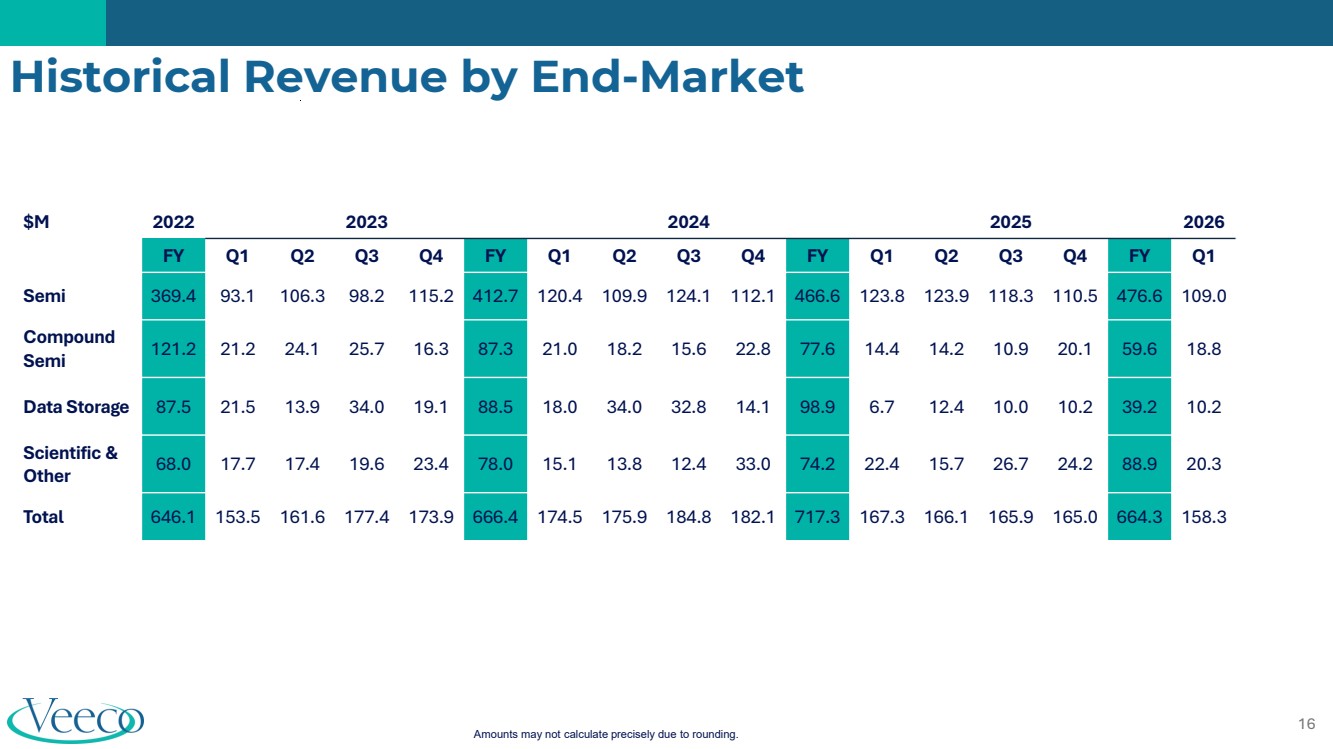
| ● | Revenue of $158.3 million, compared with $167.3 million in the same period last year |
| ● | GAAP net loss of $(0.3) million, or $(0.01) loss per diluted share, compared with net income of $11.9 million, or $0.20 earnings per diluted share in the same period last year |
| ● | Non-GAAP net income of $8.9 million, or $0.14 per diluted share, compared with $22.2 million, or $0.37 per diluted share in the same period last year |
Plainview, N.Y., May 5, 2026 -- Veeco Instruments Inc. (Nasdaq: VECO) today announced financial results for its first quarter ended March 31, 2026. Results are reported in accordance with U.S. generally accepted accounting principles (“GAAP”) and are also reported adjusting for certain items (“Non-GAAP”). A reconciliation between GAAP and Non-GAAP operating results is provided at the end of this press release.
U.S. Dollars in millions, except per share data |
GAAP Results |
| Q1 '26 | | Q1 '25 | ||
Revenue | | $ | 158.3 | | $ | 167.3 |
Net income (loss) | | $ | (0.3) | | $ | 11.9 |
Diluted earnings (loss) per share | | $ | (0.01) | | $ | 0.20 |
Non-GAAP Results |
| Q1 '26 | | Q1 '25 | ||
Operating income | | $ | 8.6 | | $ | 24.3 |
Net income | | $ | 8.9 | | $ | 22.2 |
Diluted earnings per share | | $ | 0.14 | | $ | 0.37 |
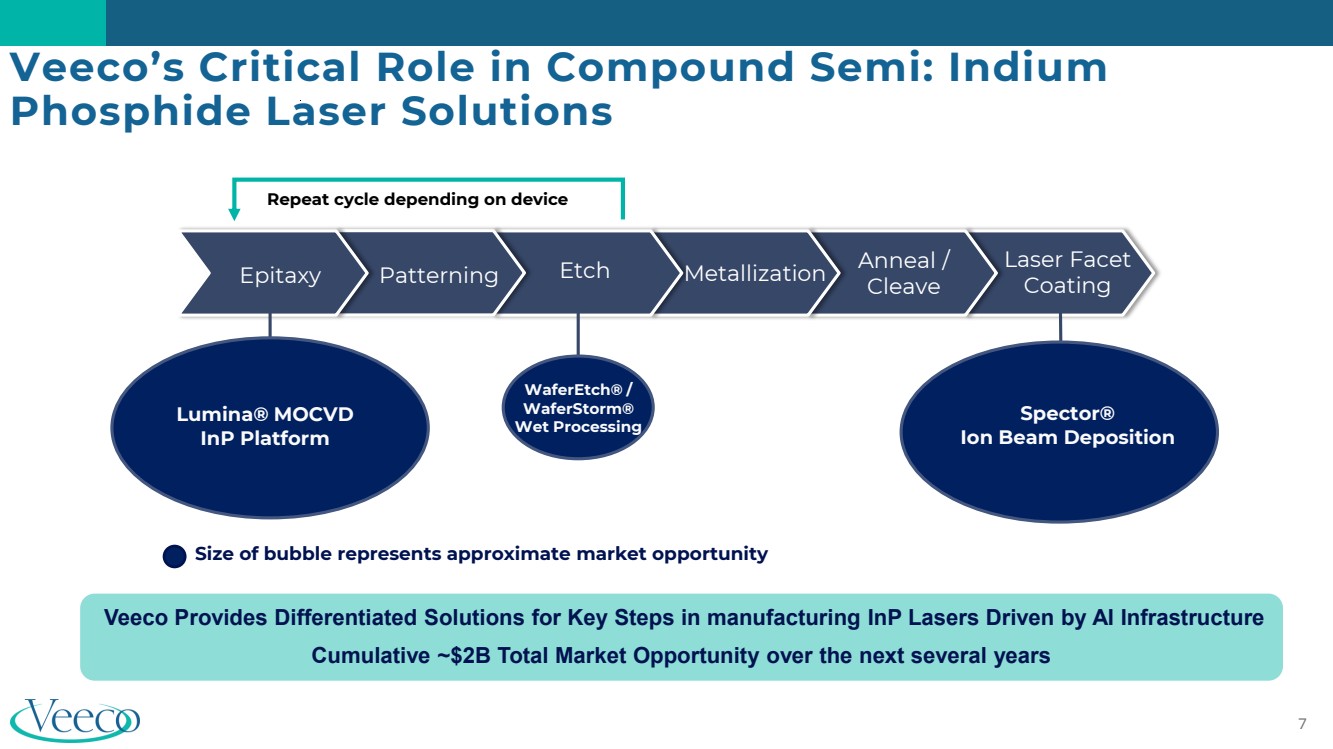
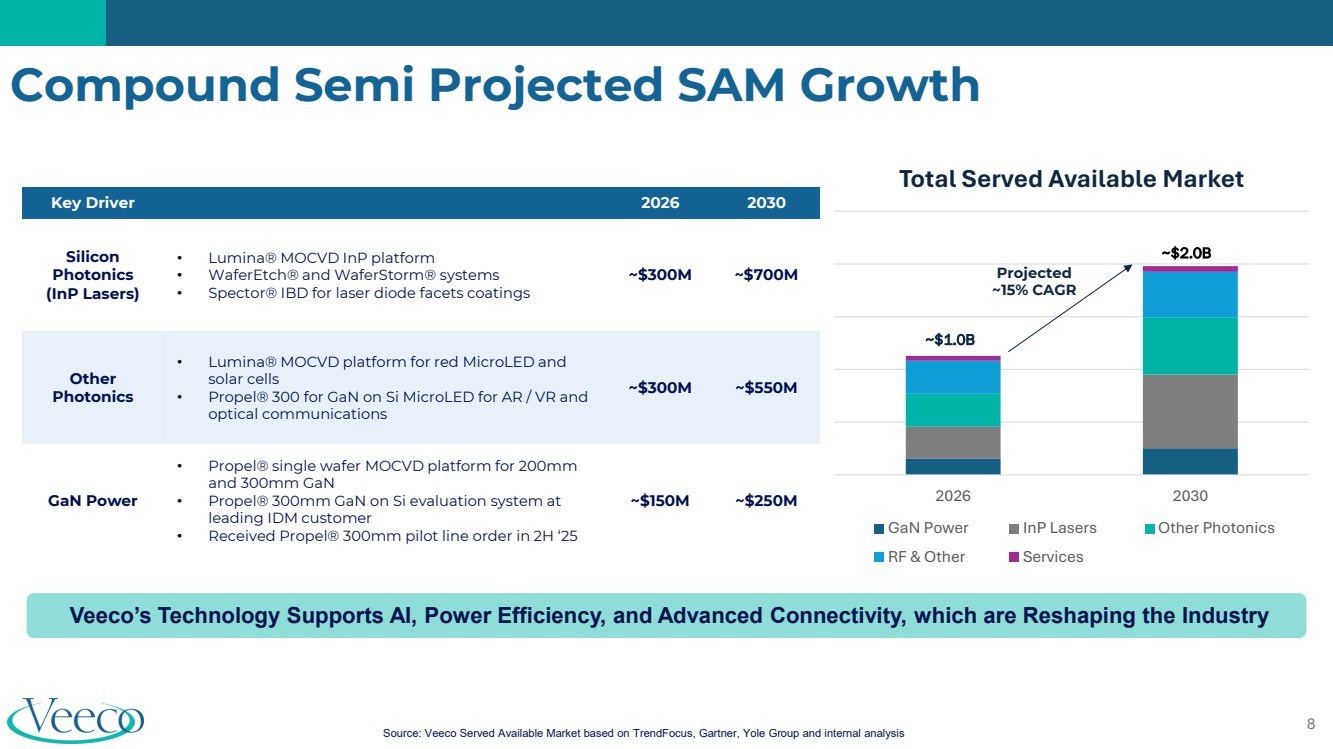
“Veeco executed well in the first quarter as the industry enters a transformational period driven by rapid expansion of AI data centers and high-performance computing,” said Bill Miller, Ph.D., Veeco’s Chief Executive Officer. “This inflection is driving significant order activity across our portfolio, with particularly strong momentum in silicon photonics as customers scale optical connectivity and power-efficient technologies. Veeco’s differentiated process equipment is increasingly critical to this landscape, positioning us well for sustained, multi-year revenue growth.”
1
Guidance and Outlook
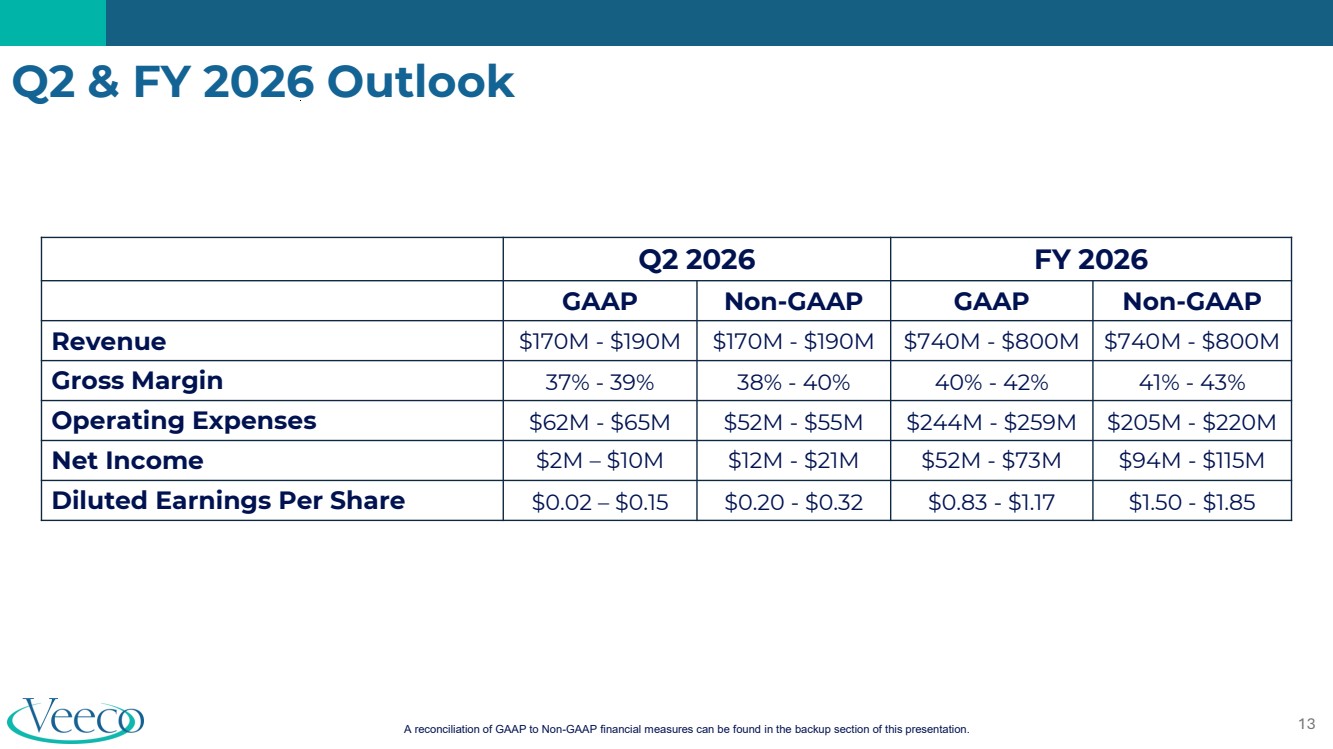
The following guidance is provided for Veeco’s second quarter 2026:
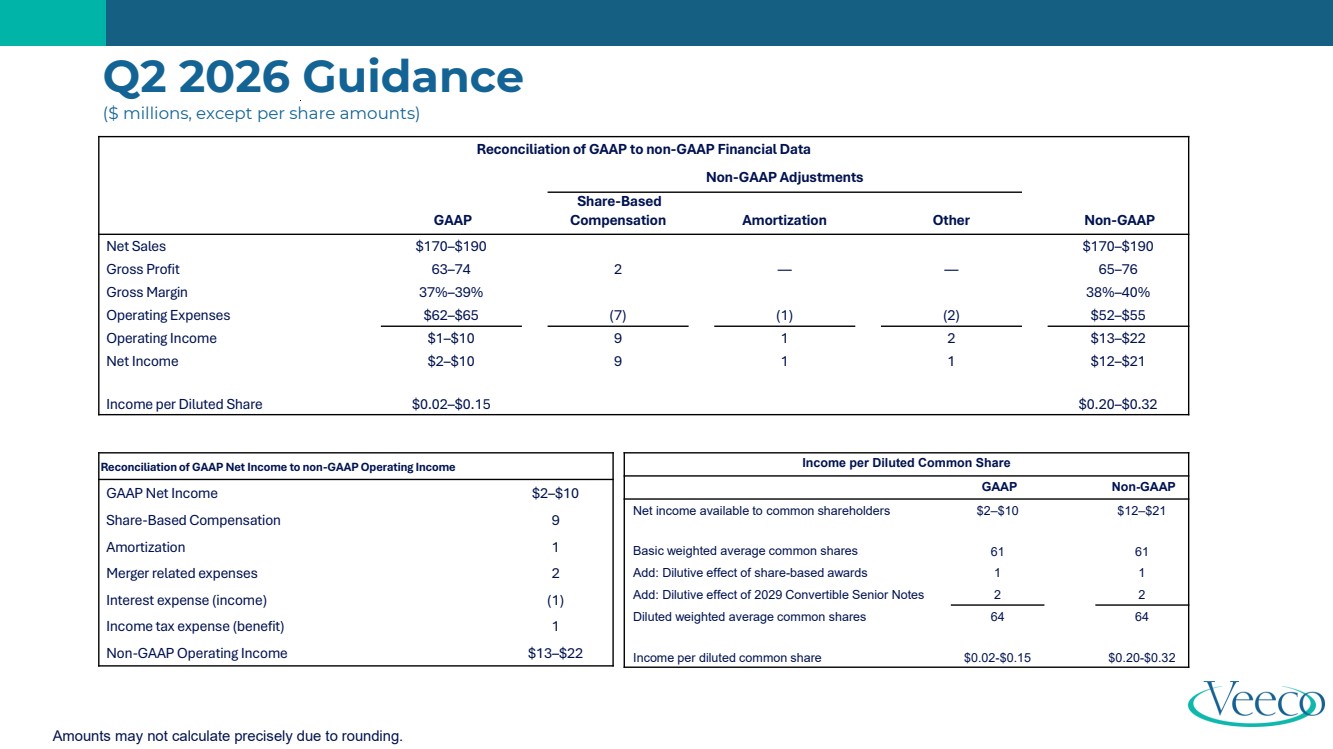
| ● | Revenue is expected in the range of $170 million to $190 million |
| ● | GAAP diluted earnings per share are expected in the range of $0.02 to $0.15 |
| ● | Non-GAAP diluted earnings per share are expected in the range of $0.20 to $0.32 |
The following guidance for Veeco’s fiscal year 2026 was previously provided and remains unchanged:
| ● | Revenue is expected in the range of $740 million to $800 million |
| ● | GAAP diluted earnings per share are expected in the range of $0.83 to $1.17 |
| ● | Non-GAAP diluted earnings per share are expected in the range of $1.50 to $1.85 |
Conference Call Information
A conference call reviewing these results has been scheduled for today, May 5, 2026 starting at 5:00pm ET. To join the call, dial 1-877-407-8029 (toll-free) or 1-201-689-8029. Participants may also access a live webcast of the call by visiting the investor relations section of Veeco's website at ir.veeco.com. A replay of the webcast will be made available on the Veeco website that evening. We will post an accompanying slide presentation to our website prior to the beginning of the call.
About Veeco
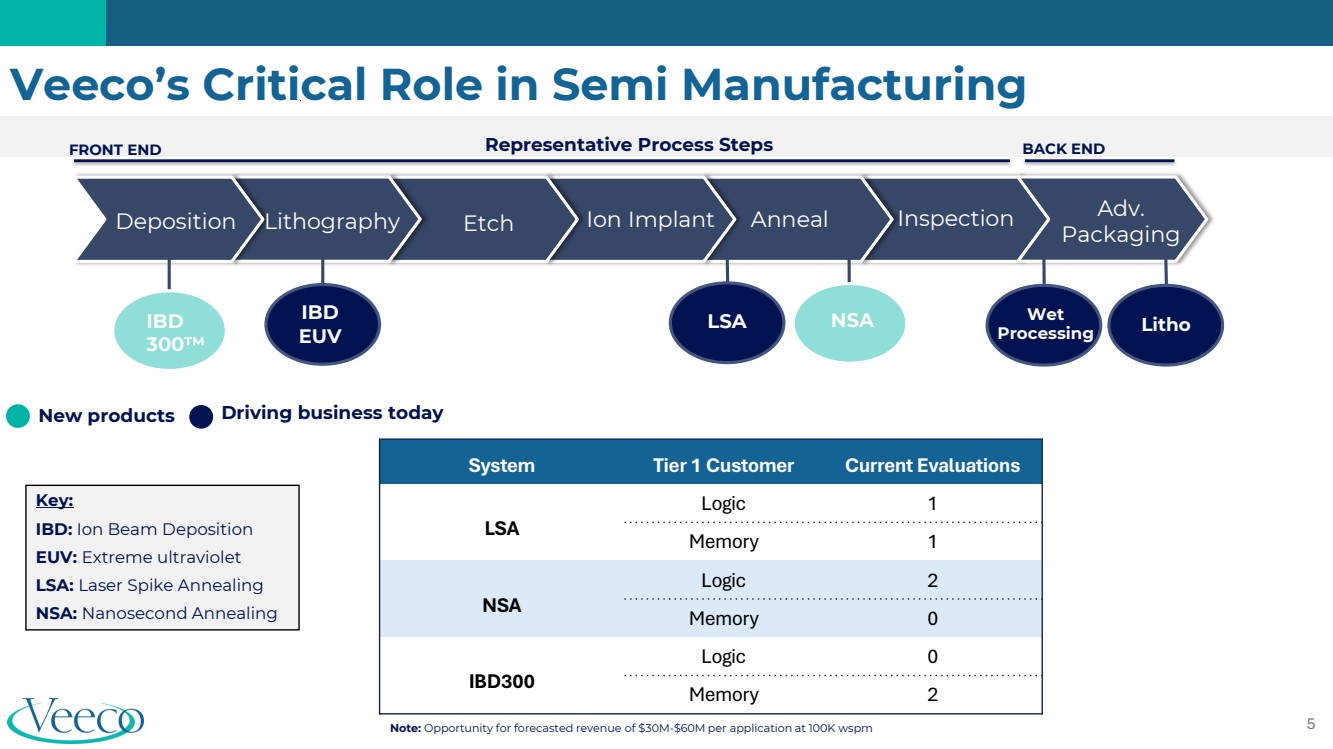
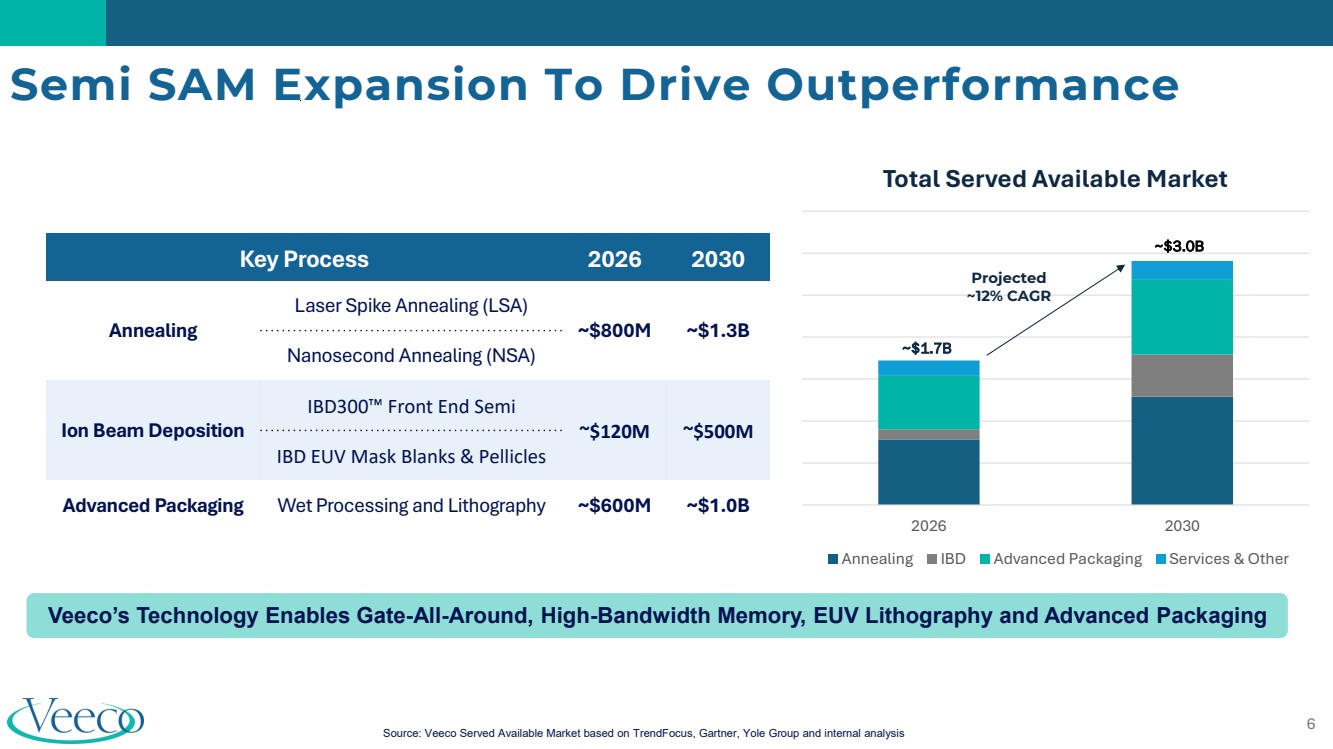
Veeco (NASDAQ: VECO) is an innovative manufacturer of semiconductor process equipment. Our laser annealing, ion beam, metal organic chemical vapor deposition (MOCVD), single wafer etch & clean and lithography technologies play an integral role in the fabrication and packaging of advanced semiconductor devices. With equipment designed to optimize performance, yield and cost of ownership, Veeco holds leading technology positions in the markets we serve. To learn more about Veeco’s systems and service offerings, visit www.veeco.com.
No Offer or Solicitation
This communication is not intended to and shall not constitute an offer to purchase or the solicitation of an offer to buy or sell any securities, nor shall there be any sale of securities in any jurisdiction in which such offer, solicitation or sale would be unlawful prior to registration or qualification under the securities laws of any such jurisdiction. No offer of securities shall be made, except by means of a prospectus meeting the requirements of Section 10 of the Securities Act of 1933, as amended.
Forward-looking Statements
This press release contains “forward-looking statements”, within the meaning of the safe harbor provisions of the U.S. Private Securities Litigation Reform Act of 1995, as amended, that are based on management’s expectations, estimates, projections and assumptions. Words such as “expects,” “anticipates,” “plans,” “believes,” “scheduled,” “estimates” and variations of these words and similar expressions are intended to identify forward-looking statements. Forward-looking statements include, but are not limited to, those regarding anticipated growth and trends in our businesses and markets, including trends related to artificial intelligence and high-performance computing, industry outlooks and demand drivers, statements regarding the pending merger with Axcelis, the timing of shipments, deliveries and revenue recognition, statements regarding shipments currently being held by U.S. Customs, our investment and growth strategies, our development of new products and technologies, our business outlook for current and future periods, our ongoing transformation initiative and the effects thereof on our operations and financial results, the timing, completion and expected benefits of the proposed transaction and other statements that are not historical facts. These statements and their underlying assumptions are subject to risks and uncertainties and are not guarantees of future performance. Factors that could cause actual results to differ materially from those expressed or implied by such statements include, without limitation: the level of demand for our products; global economic and industry conditions; global trade issues, including the effects of foreign and domestic tariffs and the ongoing trade disputes between the U.S. and China, and changes in trade and export license policies; our dependency on third-party suppliers and outsourcing partners; the timing of customer orders; our ability to develop, deliver and support new products and technologies; our ability to expand our current markets, increase market share and develop new markets; the concentrated nature of our customer base; cybersecurity attacks and our ability to safeguard sensitive information and protect our intellectual property rights in key technologies; the effects of regional or global health epidemics; delays in or failure to complete the proposed transaction, whether due to an inability by either party to satisfy one or more conditions to closing, including an inability to obtain regulatory approval in China, the occurrence of events or changes in circumstances that give rise to the termination of the applicable merger agreement by either party, or otherwise; risks related to the pendency of the proposed transaction and its effect on our business, financial condition, results of operations, cash flows and stock price; our ability to achieve the objectives of operational and strategic initiatives and attract, motivate and retain key employees, including as a result of the proposed transaction; diversion of management time and attention from ordinary course business operations to the proposed transaction and other potential disruptions to our business relating thereto; the variability of
2
results among products and end-markets, and our ability to accurately forecast future results, market conditions, and customer requirements; the impact of our indebtedness, including our convertible senior notes and our capped call transactions; and other risks and uncertainties described in our SEC filings on Forms 10-K, 10-Q and 8-K, and from time-to-time in our other SEC reports. All forward-looking statements speak only to management’s expectations, estimates, projections and assumptions as of the date of this press release. The Company does not undertake any obligation to update or publicly revise any forward-looking statements to reflect events, circumstances or changes in expectations after the date of this press release.
-financial tables attached-
Veeco Contacts:
Investor Relations: Alex Delacroix (516) 528-1020[email protected]
Media: Brenden Wright (410) 984-2610[email protected]
3
Veeco Instruments Inc. and Subsidiaries
Condensed Consolidated Statements of Operations
(in thousands, except per share amounts)
(unaudited)
| | Three months ended March 31, |
| ||||
| | 2026 | | 2025 |
| ||
Net sales |
| $ | 158,341 |
| $ | 167,292 | |
Cost of sales | |
| 102,513 | |
| 98,825 | |
Gross profit | |
| 55,828 | |
| 68,467 | |
Operating expenses, net: | | | | | | | |
Research and development | |
| 29,875 | |
| 28,514 | |
Selling, general, and administrative | |
| 26,016 | |
| 25,028 | |
Amortization of intangible assets | |
| 705 | |
| 821 | |
Merger costs | |
| 2,012 | |
| — | |
Other operating expense (income), net | |
| (122) | |
| (44) | |
Total operating expenses, net | |
| 58,486 | |
| 54,319 | |
Operating income (loss) | |
| (2,658) | |
| 14,148 | |
Interest income (expense), net | |
| 1,175 | |
| 836 | |
Income (loss) before income taxes | |
| (1,483) | |
| 14,984 | |
Income tax expense (benefit) | |
| (1,159) | |
| 3,037 | |
Net income (loss) |
| $ | (324) |
| $ | 11,947 | |
| | | | | | | |
Income per common share: | | | | | | | |
Basic |
| $ | (0.01) |
| $ | 0.21 | |
Diluted |
| $ | (0.01) |
| $ | 0.20 | |
| | | | | | | |
Weighted average number of shares: | | | | | | | |
Basic | |
| 60,414 | |
| 57,753 | |
Diluted | |
| 60,414 | |
| 60,234 | |
4
Veeco Instruments Inc. and Subsidiaries
Condensed Consolidated Balance Sheets
(in thousands)
| | March 31, | | December 31, | ||
| | 2026 | | 2025 | ||
| | (unaudited) | | | | |
Assets | | | | | | |
Current assets: | | | | | | |
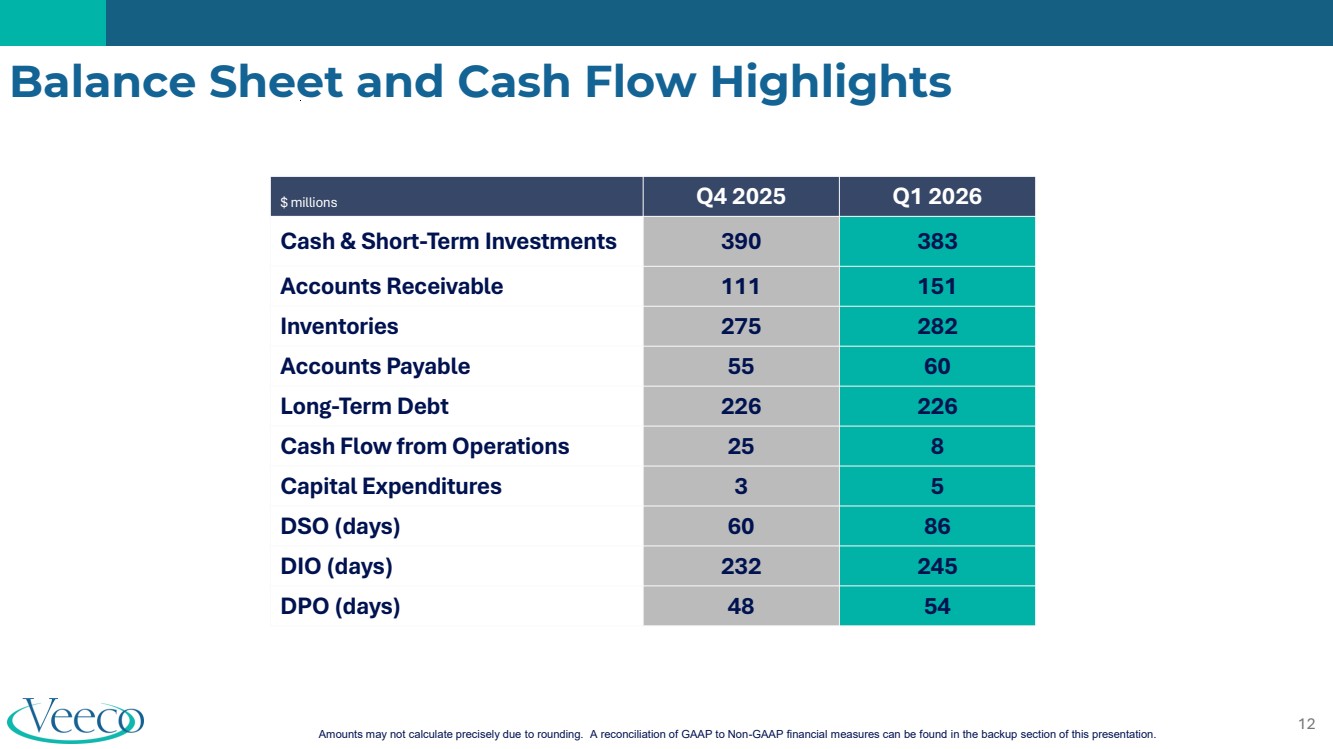
Cash and cash equivalents | | $ | 179,535 | | $ | 163,466 |
Short-term investments | |
| 203,796 | |
| 226,763 |
Accounts receivable, net | |
| 150,521 | |
| 110,685 |
Contract assets | |
| 21,723 | |
| 34,838 |
Inventories | |
| 282,231 | |
| 275,298 |
Prepaid expenses and other current assets | |
| 35,613 | |
| 34,286 |
Total current assets | |
| 873,419 | |
| 845,336 |
Property, plant and equipment, net | |
| 107,817 | |
| 108,646 |
Operating lease right-of-use assets | | | 24,084 | |
| 24,606 |
Intangible assets, net | |
| 4,991 | |
| 5,696 |
Goodwill | |
| 214,964 | |
| 214,964 |
Deferred income taxes | |
| 124,141 | |
| 122,935 |
Other assets | |
| 3,553 | |
| 3,612 |
Total assets | | $ | 1,352,969 | | $ | 1,325,795 |
| | | | | | |
Liabilities and stockholders’ equity | | | | | | |
Current liabilities: | | | | | | |
Accounts payable | | $ | 60,153 | | $ | 55,345 |
Accrued expenses and other current liabilities | |
| 52,038 | |
| 45,503 |
Contract liabilities | |
| 92,731 | |
| 74,161 |
Income taxes payable | |
| 1,763 | |
| 3,048 |
Total current liabilities | |
| 206,685 | |
| 178,057 |
Deferred income taxes | |
| 513 | |
| 532 |
Long-term debt | |
| 226,253 | |
| 226,009 |
Long-term operating lease liabilities | | | 31,140 | |
| 31,837 |
Other liabilities | |
| 4,716 | |
| 3,852 |
Total liabilities | |
| 469,307 | |
| 440,287 |
| | | | | | |
Total stockholders’ equity | |
| 883,662 | |
| 885,508 |
Total liabilities and stockholders’ equity | | $ | 1,352,969 | | $ | 1,325,795 |
Note on Reconciliation Tables
The below tables include financial measures adjusted for the impact of certain items; these financial measures are therefore not calculated in accordance with GAAP. These Non-GAAP financial measures exclude items such as: share-based compensation expense; charges relating to restructuring initiatives; non-cash asset impairments; certain other non-operating gains and losses; and acquisition-related items such as transaction costs, non-cash amortization of acquired intangible assets, and certain integration costs.
These Non-GAAP financial measures may be different from Non-GAAP financial measures used by other companies. Non-GAAP financial measures should not be considered a substitute for, or superior to, measures of financial performance prepared in accordance with GAAP. By excluding these items, Non-GAAP financial measures are intended to facilitate meaningful comparisons to historical operating results, competitors’ operating results, and estimates made by securities analysts. Management is evaluated on key performance metrics including Non-GAAP Operating income (loss), which is used to determine management incentive compensation as well as to forecast future periods. These Non-GAAP financial measures may be useful to investors in allowing for greater transparency of supplemental information used by management in its financial and operational decision-making. In addition, similar Non-GAAP financial measures have historically been reported to investors; the inclusion of comparable numbers provides consistency in financial reporting. Investors are encouraged to review the reconciliation of the Non-GAAP financial measures used in this news release to their most directly comparable GAAP financial measures.
5
Reconciliation of GAAP to Non-GAAP Financial Data (Q1 2026)
(in thousands)
(unaudited)
| | | | | Non-GAAP Adjustments | | | |
| ||||
| | | | | Share-Based | | | | | | | |
|
Three months ended March 31, 2026 | | GAAP | | Compensation | | Amortization | | Other | | Non-GAAP |
| ||
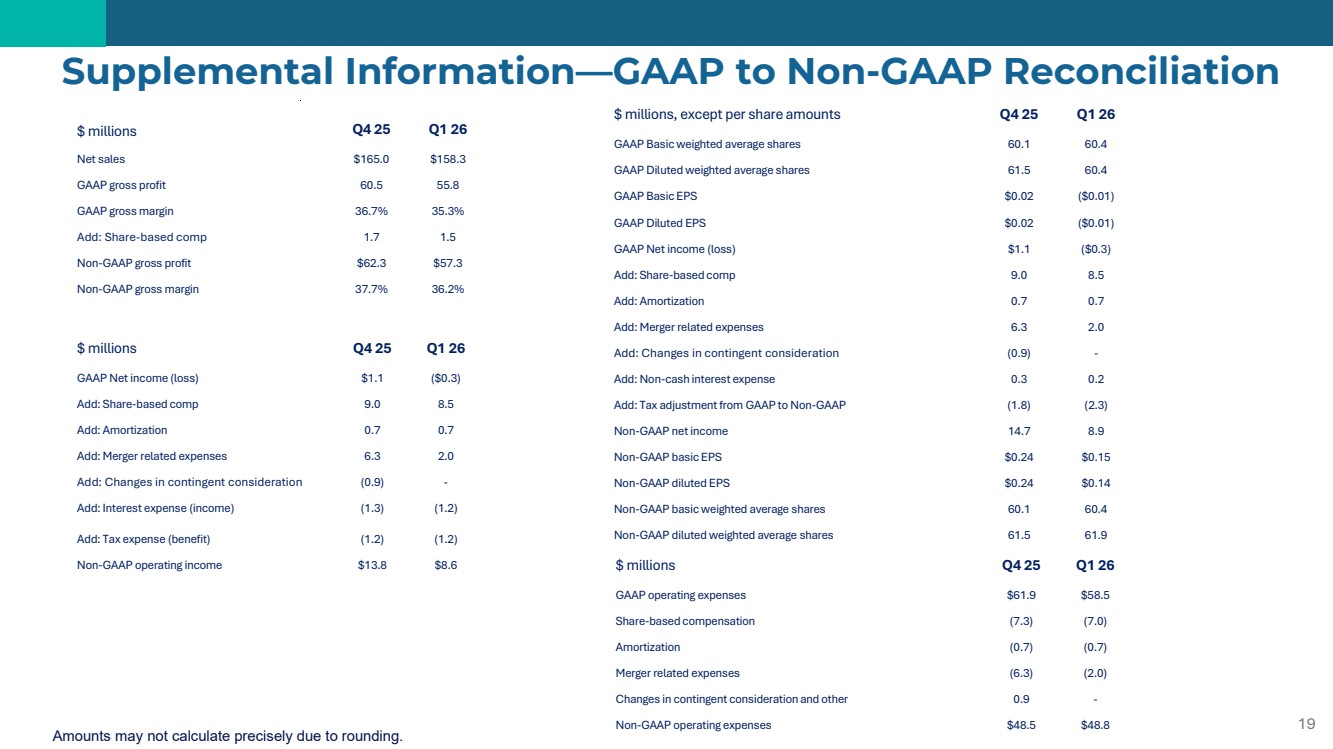
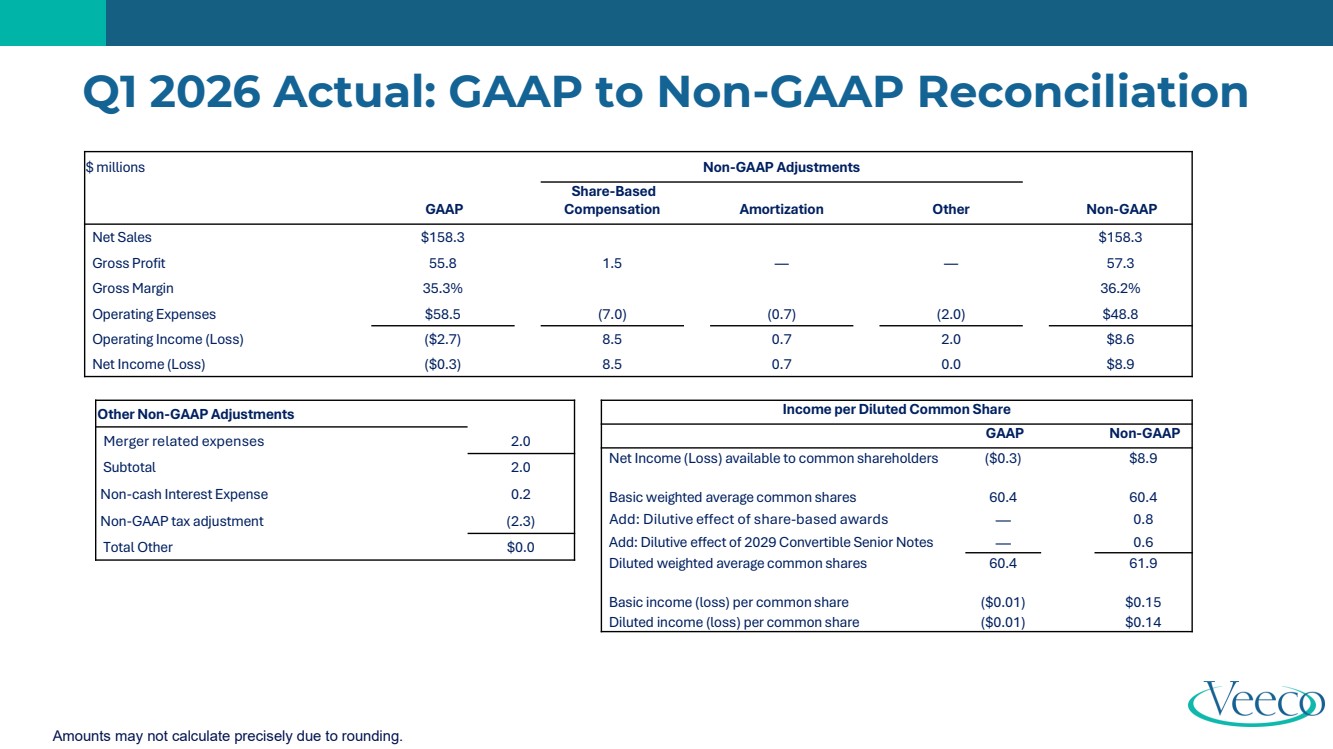
Net sales | | $ | 158,341 | | | | | | | | $ | 158,341 |
|
Gross profit |
| | 55,828 |
| 1,511 | | |
| |
| | 57,339 | |
Gross margin |
| | 35.3 | % | | | | | |
| | 36.2 | % |
Operating expenses |
| | 58,486 |
| (7,000) | | (705) | | (2,012) | | | 48,769 | |
Operating income (loss) |
| | (2,658) |
| 8,511 | | 705 |
| 2,012 | ^ | | 8,570 | |
Net income (loss) |
| | (324) |
| 8,511 |
| 705 |
| (16) | ^ | | 8,876 | |
^ | - See table below for additional details. |
Other Non-GAAP Adjustments (Q1 2026)
(in thousands)
(unaudited)
Three months ended March 31, 2026 | | |
Merger related expenses | $ | 2,012 |
Subtotal | | 2,012 |
Non-cash interest expense |
| 244 |
Non-GAAP tax adjustment * |
| (2,272) |
Total Other | $ | (16) |
* | - The ‘with or without’ method is utilized to determine the income tax effect of all Non-GAAP adjustments. |
Net Income per Common Share (Q1 2026)
(in thousands, except per share amounts)
(unaudited)
| | Three months ended March 31, 2026 | ||||
| | GAAP | | Non-GAAP | ||
Numerator: | | | | | | |
Net income (loss) available to common shareholders | | $ | (324) | | $ | 8,876 |
| | | | | | |
Denominator: | | | | | | |
Basic weighted average shares outstanding | | | 60,414 | | | 60,414 |
Effect of potentially dilutive share-based awards | | | — | | | 808 |
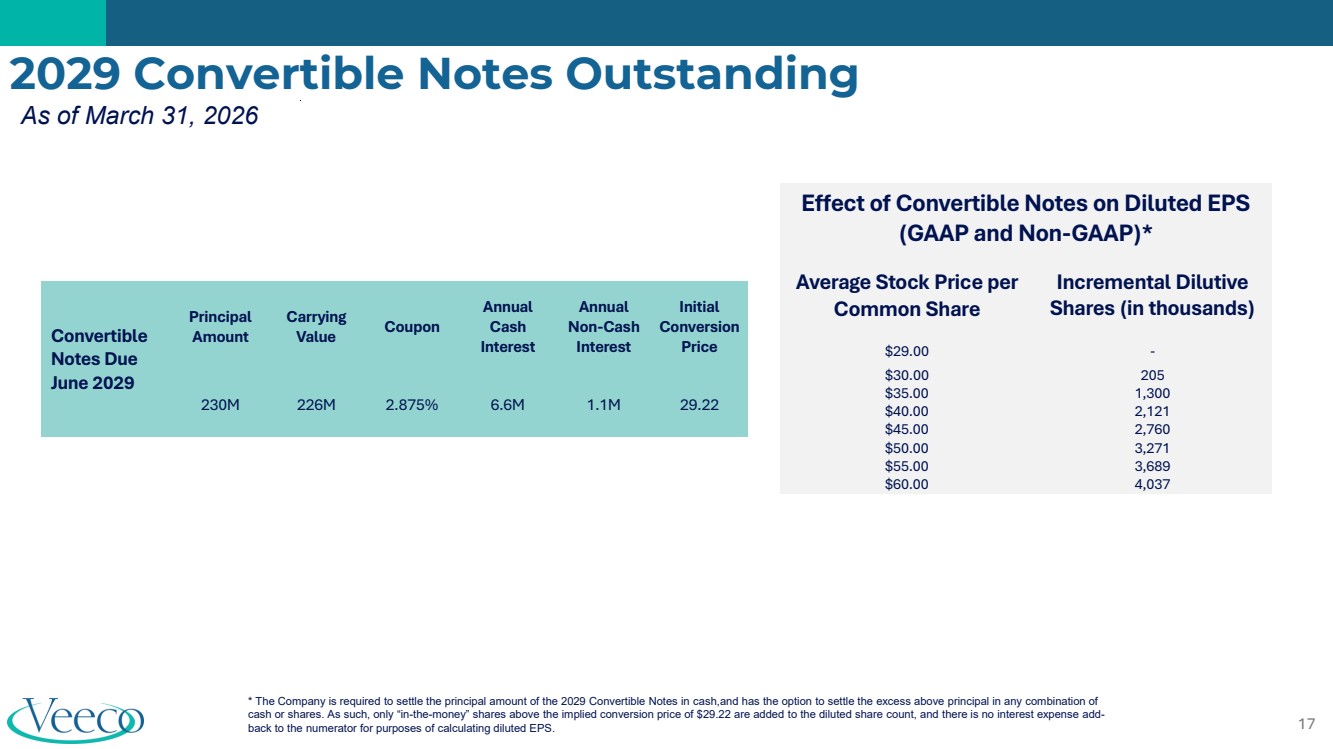
Dilutive effect of 2029 Convertible Senior Notes | |
| — |
|
| 642 |
Diluted weighted average shares outstanding | | | 60,414 | | | 61,864 |
| | | | | | |
Net income (loss) per common share: | | | | | | |
Basic | | $ | (0.01) | | $ | 0.15 |
Diluted | | $ | (0.01) | | $ | 0.14 |
6
Reconciliation of GAAP to Non-GAAP Financial Data (Q1 2025)
(in thousands)
(unaudited)
| | | | | Non-GAAP Adjustments | |
| | | ||||
| | | | | Share-based | | | | | | | | |
Three months ended March 31, 2025 | | | GAAP | | Compensation | | Amortization | | Other | | Non-GAAP | | |
Net sales | | $ | 167,292 | | | | | | | | $ | 167,292 | |
Gross profit | |
| 68,467 |
| 1,343 | | |
| | |
| 69,810 | |
Gross margin | |
| 40.9 | % | | | | | | | | 41.7 | % |
Operating expenses | |
| 54,319 |
| (7,865) | | (821) | | (99) | | | 45,534 | |
Operating income | |
| 14,148 |
| 9,208 | | 821 |
| 99 | ^ | | 24,276 | |
Net income | |
| 11,947 |
| 9,208 |
| 821 |
| 231 | ^ | | 22,207 | |
^ | - See table below for additional details. |
Other Non-GAAP Adjustments (Q1 2025)
(in thousands)
(unaudited)
Three months ended March 31, 2025 | | |
Other | $ | 99 |
Subtotal | | 99 |
Non-cash interest expense |
| 257 |
Non-GAAP tax adjustment * |
| (125) |
Total Other | $ | 231 |
* | - The ‘with or without’ method is utilized to determine the income tax effect of all Non-GAAP adjustments. |
Net Income per Common Share (Q1 2025)
(in thousands, except per share amounts)
(unaudited)
| | Three months ended March 31, 2025 | ||||
| | GAAP | | Non-GAAP | ||
Numerator: | | | | | | |
Net income | | $ | 11,947 | | $ | 22,207 |
Interest expense associated with 2025 and 2027 Convertible Senior Notes | |
| 253 |
|
| 273 |
Net income available to common shareholders | | $ | 12,200 | | $ | 22,480 |
| | | | | | |
Denominator: | | | | | | |
Basic weighted average shares outstanding | | | 57,753 | | | 57,753 |
Effect of potentially dilutive share-based awards | | | 693 | | | 693 |
Dilutive effect of 2025 Convertible Senior Notes | | | — | | | 174 |
Dilutive effect of 2027 Convertible Senior Notes (1) | |
| 1,788 |
|
| 1,354 |
Diluted weighted average shares outstanding | | | 60,234 | | | 59,974 |
| | | | | | |
Net income per common share: | | | | | | |
Basic | | $ | 0.21 | | $ | 0.38 |
Diluted | | $ | 0.20 | | $ | 0.37 |
| (1) | - The non-GAAP incremental dilutive shares includes the impact of the Company’s capped call transaction issued concurrently with our 2027 Notes, and as such, an effective conversion price of $18.46 is used when determining incremental shares to add to the dilutive share count. The GAAP incremental dilutive shares does not include the impact of the Company’s capped call transaction, and as such, an effective conversion price of $13.98 is used when determining incremental shares to add to the dilutive share count. |
7
Reconciliation of GAAP Net Income to Non-GAAP Operating Income (Q1 2026 and 2025)
(in thousands)
(unaudited)
| | Three months ended | | Three months ended | ||
| | March 31, 2026 | | March 31, 2025 | ||
GAAP Net income (loss) | | $ | (324) | | $ | 11,947 |
Share-based compensation | |
| 8,511 | |
| 9,208 |
Amortization | |
| 705 | |
| 821 |
Merger related expenses | |
| 2,012 | |
| — |
Interest (income) expense, net | |
| (1,175) | |
| (836) |
Other | | | — | | | 99 |
Income tax expense (benefit) | |
| (1,159) | |
| 3,037 |
Non-GAAP Operating income | | $ | 8,570 | | $ | 24,276 |
Reconciliation of GAAP to Non-GAAP Financial Data (Q2 2026)
(in millions, except per share amounts)
(unaudited)
| | | | | | | | | | Non-GAAP Adjustments | | | | | | | | |
| ||||
Guidance for the three months ending | | | | | | | | | | Share-based | | | | | | | | | | | | |
|
June 30, 2026 | | GAAP | | Compensation | | Amortization | | Other | | Non-GAAP |
| ||||||||||||
Net sales | | $ | 170 | | - | | $ | 190 | | | | | | | | $ | 170 | | - | | $ | 190 | |
Gross profit | |
| 63 |
| - | |
| 74 |
| 2 |
| — |
| — | |
| 65 |
| - | |
| 76 | |
Gross margin | |
| 37% | | - | |
| 39% | | |
| |
| | |
| 38% | | - | |
| 40% | |
Operating expenses | | | 62 |
| - | |
| 65 | | (7) | | (1) | | (2) | | | 52 |
| - | |
| 55 | |
Operating income | | | 1 | | - | | | 10 | | 9 | | 1 | | 2 | | | 13 | | - | | | 22 | |
Net income | | $ | 2 |
| - | | $ | 10 |
| 9 |
| 1 | | 1 | | $ | 12 |
| - | | $ | 21 | |
| | | | | | | | | | | | | | | | | | | | | | | |
Income per diluted common share | | $ | 0.02 |
| - | | $ | 0.15 |
| |
| |
| | | $ | 0.20 |
| - | | $ | 0.32 | |
Income per Diluted Common Share (Q2 2026)
(in millions, except per share amounts)
(unaudited)
Guidance for the three months ending June 30, 2026 | | GAAP | | Non-GAAP | ||||||||||||
Numerator: | | | | | | | | | | | | | | | | |
Net income available to common shareholders | | $ | 2 | | - | | $ | 10 | | $ | 12 | | - | | $ | 21 |
| | | | | | | | | | | | | | | | |
Denominator: | | | | | | | | | | | | | | | | |
Basic weighted average shares outstanding | | | 61 | | - | | | 61 | | | 61 | | - | | | 61 |
Effect of potentially dilutive share-based awards | | | 1 |
| - | | | 1 | | | 1 |
| - | | | 1 |
Dilutive effect of 2029 Convertible Senior Notes | |
| 2 | | - | |
| 2 |
|
| 2 | | - | |
| 2 |
Diluted weighted average shares outstanding | | | 64 | | - | | | 64 | | | 64 | | - | | | 64 |
| | | | | | | | | | | | | | | | |
Net income per common share: | | | | | | | | | | | | | | | | |
Income per diluted common share | | $ | 0.02 | | - | | $ | 0.15 | | $ | 0.20 | | - | | $ | 0.32 |
8
Reconciliation of GAAP Net Income to Non-GAAP Operating Income (Q2 2026)
(in millions)
(unaudited)
Guidance for the three months ending June 30, 2026 | | | | | | | | |
GAAP Net income | | $ | 2 |
| - | | $ | 10 |
Share-based compensation | |
| 9 |
| - | |
| 9 |
Amortization | |
| 1 |
| - | |
| 1 |
Merger related expense | | | 2 | | - | | | 2 |
Interest expense (income) | | | (1) | | - | | | (1) |
Income tax expense | | | 1 | | - | | | 1 |
Non-GAAP Operating income | | $ | 13 |
| - | | $ | 22 |
Note: Amounts may not calculate precisely due to rounding.
Reconciliation of GAAP to Non-GAAP Financial Data (FY 2026)
(in millions, except per share amounts)
(unaudited)
| | | | | | | | | | Non-GAAP Adjustments | | | | | | | | | ||||
Guidance for the year ending | | | | | | | | | | Share-based | | | | | | | | | | | | |
December 31, 2026 | | GAAP | | Compensation | | Amortization | | Other | | Non-GAAP | ||||||||||||
Net sales | | $ | 740 | | - | | $ | 800 | | | | | | | | $ | 740 | | - | | $ | 800 |
Gross profit | |
| 298 |
| - | |
| 338 |
| 8 |
| — |
| — | |
| 306 |
| - | |
| 346 |
Gross margin | |
| 40% | | - | |
| 42% | | |
| |
| | |
| 41% | | - | |
| 43% |
Operating expenses | | | 244 |
| - | |
| 259 | | (31) | | (2) | | (6) | | | 205 |
| - | |
| 220 |
Operating income | | | 54 | | - | | | 79 | | 39 | | 2 | | 6 | | | 101 | | - | | | 126 |
Net income | | $ | 52 |
| - | | $ | 73 |
| 39 |
| 2 | | 1 | | $ | 94 |
| - | | $ | 115 |
| | | | | | | | | | | | | | | | | | | | | | |
Income per diluted common share | | $ | 0.83 |
| - | | $ | 1.17 |
| |
| |
| | | $ | 1.50 |
| - | | $ | 1.85 |
Income per Diluted Common Share (FY 2026)
(in millions, except per share amounts)
(unaudited)
Guidance for the year ending December 31, 2026 | | GAAP | | Non-GAAP | ||||||||||||
Numerator: | | | | | | | | | | | | | | | | |
Net income available to common shareholders | | $ | 52 | | - | | $ | 73 | | $ | 94 | | - | | $ | 115 |
| | | | | | | | | | | | | | | | |
Denominator: | | | | | | | | | | | | | | | | |
Basic weighted average shares outstanding | | | 61 | | - | | | 61 | | | 61 | | - | | | 61 |
Effect of potentially dilutive share-based awards | | | 1 |
| - | | | 1 | | | 1 |
| - | | | 1 |
Dilutive effect of 2029 Convertible Senior Notes | |
| 1 | | - | |
| 1 |
|
| 1 | | - | |
| 1 |
Diluted weighted average shares outstanding | | | 63 | | - | | | 63 | | | 63 | | - | | | 63 |
| | | | | | | | | | | | | | | | |
Net income per common share: | | | | | | | | | | | | | | | | |
Income per diluted common share | | $ | 0.83 | | - | | $ | 1.17 | | $ | 1.50 | | - | | $ | 1.85 |
9
Reconciliation of GAAP Net Income to Non-GAAP Operating Income (FY 2026)
(in millions)
(unaudited)
Guidance for the year ending December 31, 2026 | | | | | | | | |
GAAP Net income | | $ | 52 |
| - | | $ | 73 |
Share-based compensation | |
| 39 |
| - | |
| 39 |
Amortization | |
| 2 |
| - | |
| 2 |
Merger related expense | | | 6 | | - | | | 6 |
Interest expense (income) | | | (4) | | - | | | (4) |
Income tax expense | | | 7 | | - | | | 10 |
Non-GAAP Operating income | | $ | 101 |
| - | | $ | 126 |
10