Velo3D Announces First Quarter 2025 Financial Results
•Backlog of $18 million as of March 31, 2025
•Reaffirms expectation for 2025 annual revenue growth of more than 30%
•Reaffirms expectation to be EBITDA positive in the first half of 2026
FREMONT, Calif., May 13, 2025- Velo3D, Inc. (OTCQX: VLDX), a leader in additive manufacturing (AM) technology known for transforming aerospace and defense supply chains through world-class metal AM, today announced financial results for its first quarter ended March 31, 2025.
Recent Business Developments
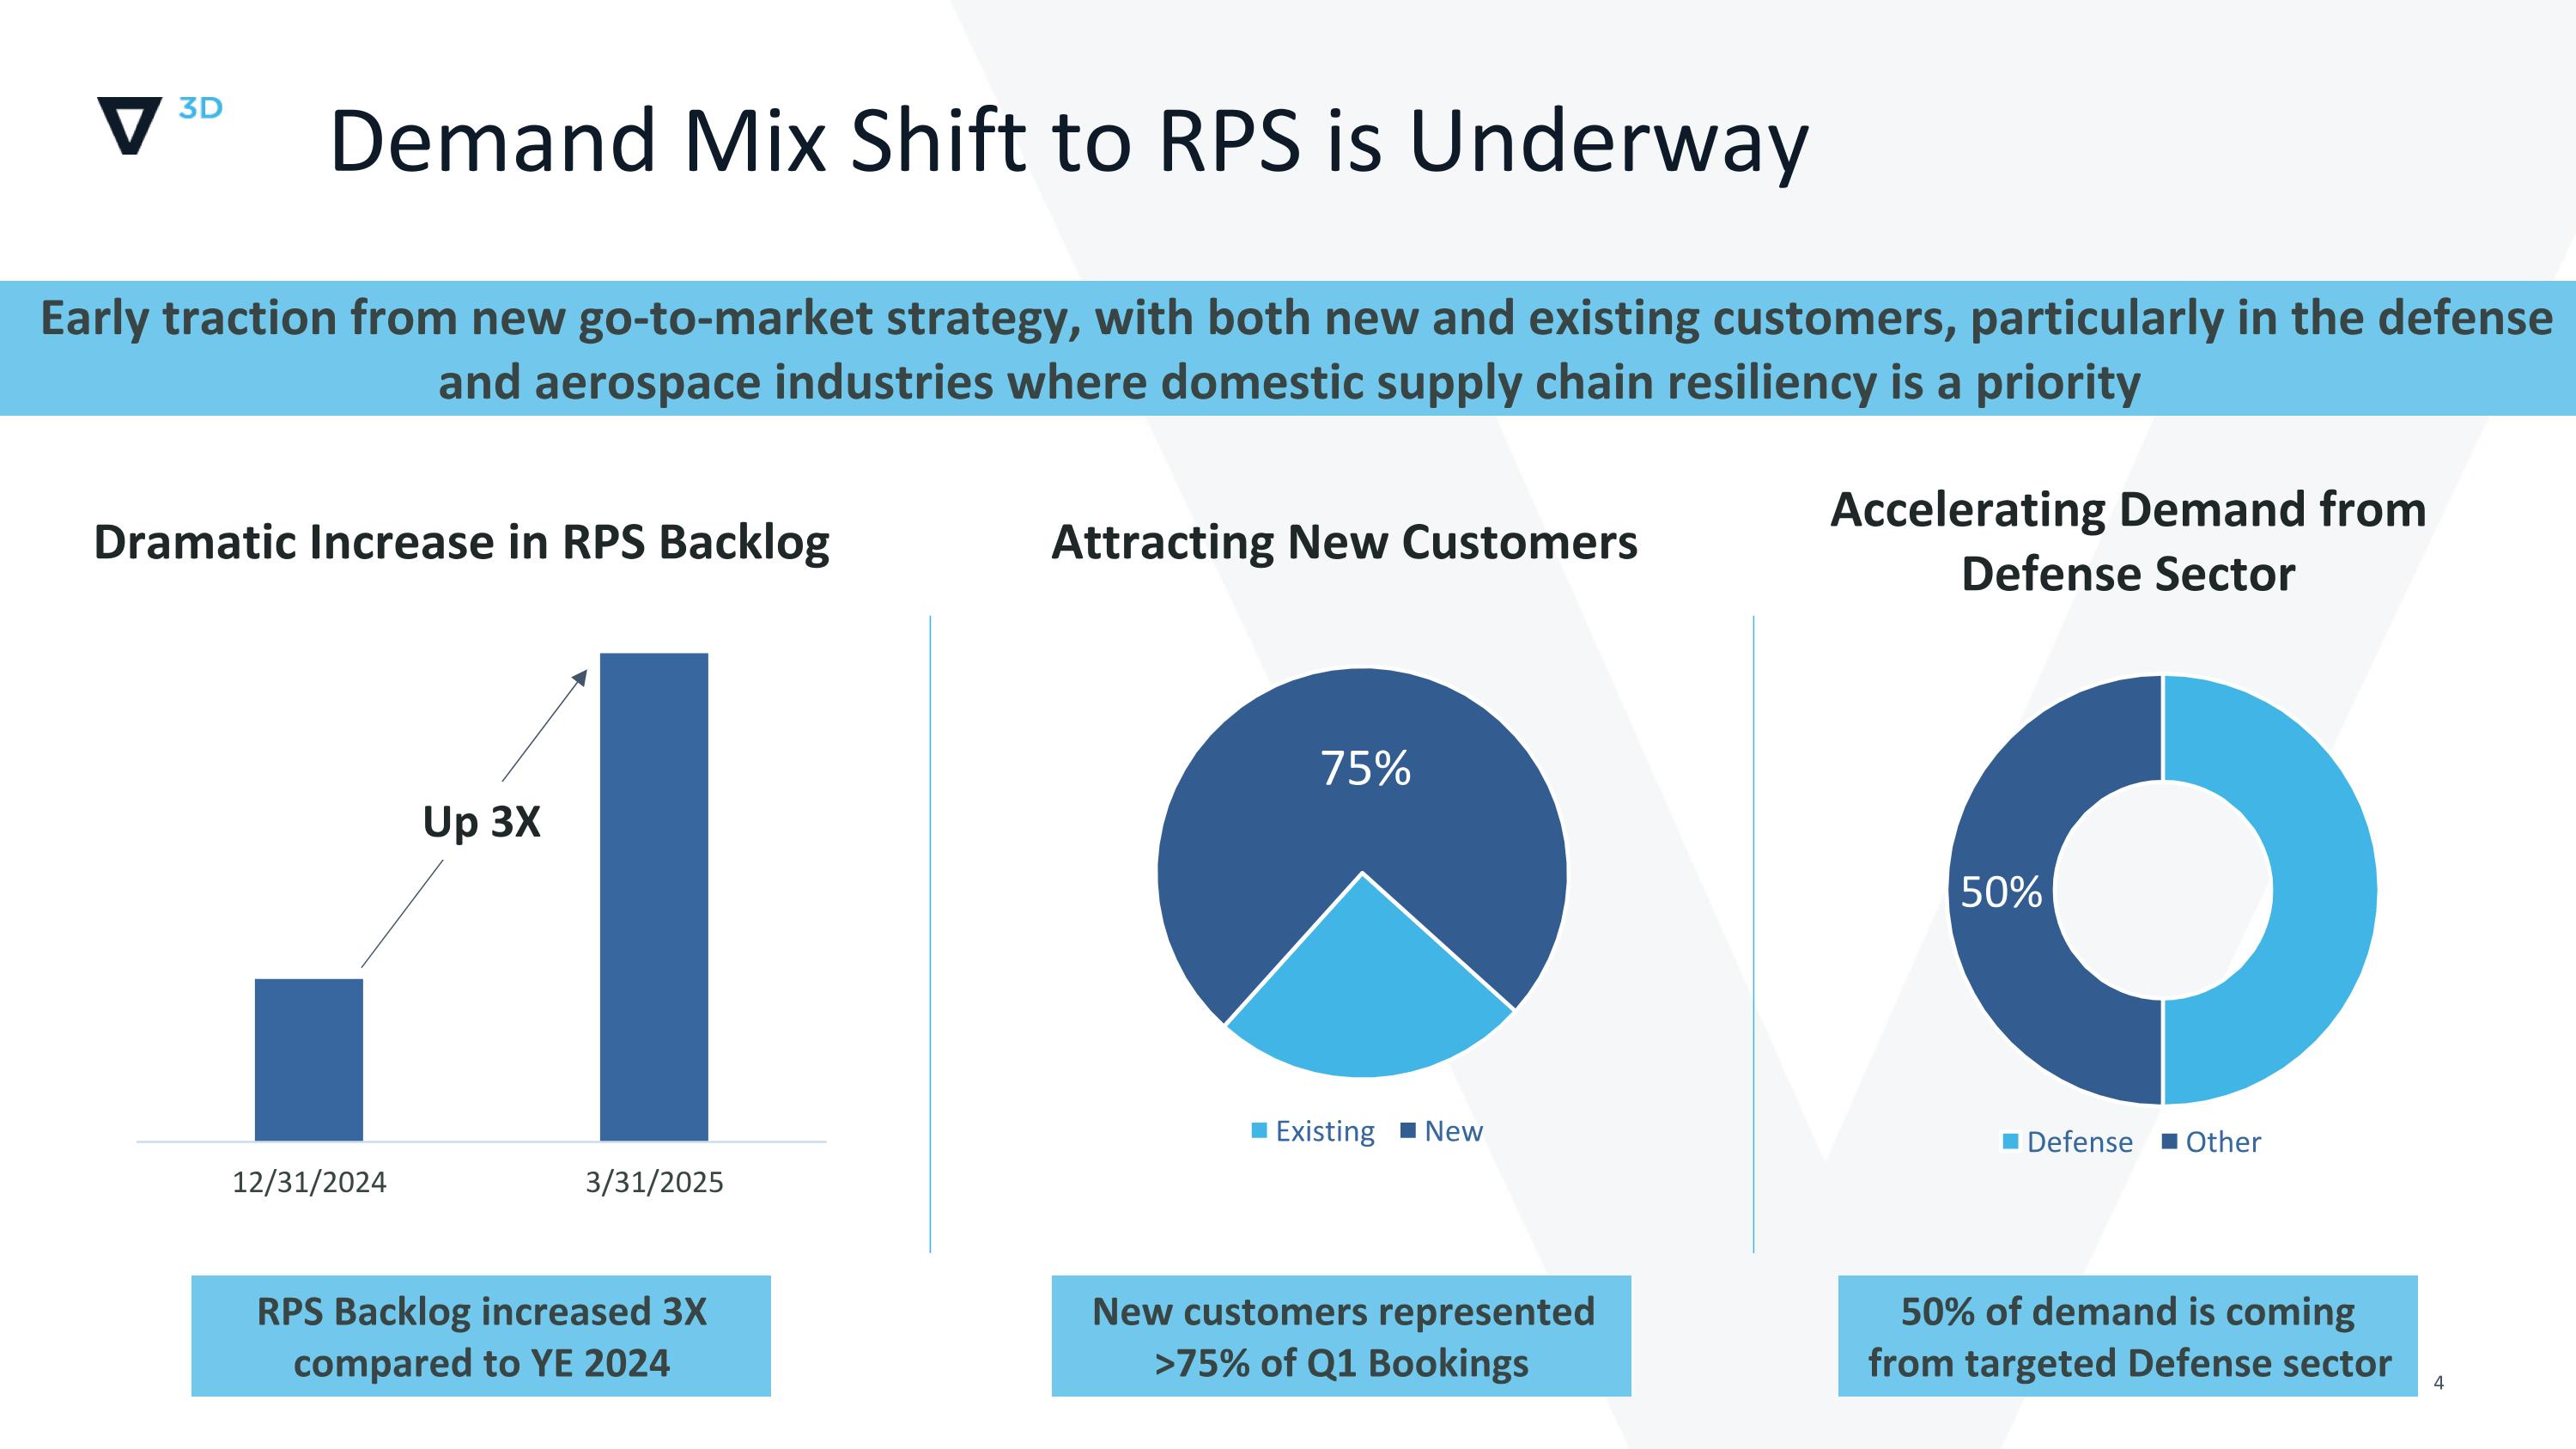
•Demand mix shift to Rapid Production Services (RPS) underway
•RPS backlog increased 3x as compared to year-end 2024
•New customers represented more than 75% of 1Q’25 bookings
•50% demand from defense sector
•Signed a five-year, $15 million master services agreement (MSA) with Momentus, Inc.to leverage to RPS Offering
•Signed a five-year exclusive supply agreement with Amaero Advanced Materials & Manufacturing, Inc. (“Amaero”) advancing efforts to re-shore advanced manufacturing and accelerate the adoption of additive manufacturing
•Received an order for a fourth Sapphire XC printer from Mears Machine Corporation to support the continued development of aerospace and industrial-related programs
•Announced an agreement with Ohio Ordinance Works, Inc. to provide RPS as part of its 3D Printed Military Weapons Development initiative.
•Appointed retired U.S. Army Green Beret, Brice Cooper, as Vice President of Defense and Government Relations
•Appointed retired Navy Rear Admiral Jason Lloyd and Kenneth Thieneman to Board of Directors
•Upgraded to OTCQX® Best Market from the Pink® market
“Momentum is building across our business as we implement a number of strategic initiatives that we believe position Velo3D for sustainable, long-term growth and a return to profitability,” said Arun Jeldi, CEO of Velo3D. “We are seeing early results from our new go-to-market strategy, which is gaining significant traction with both new and existing customers, particularly in the defense and aerospace industries where domestic supply chain resiliency is a priority.”
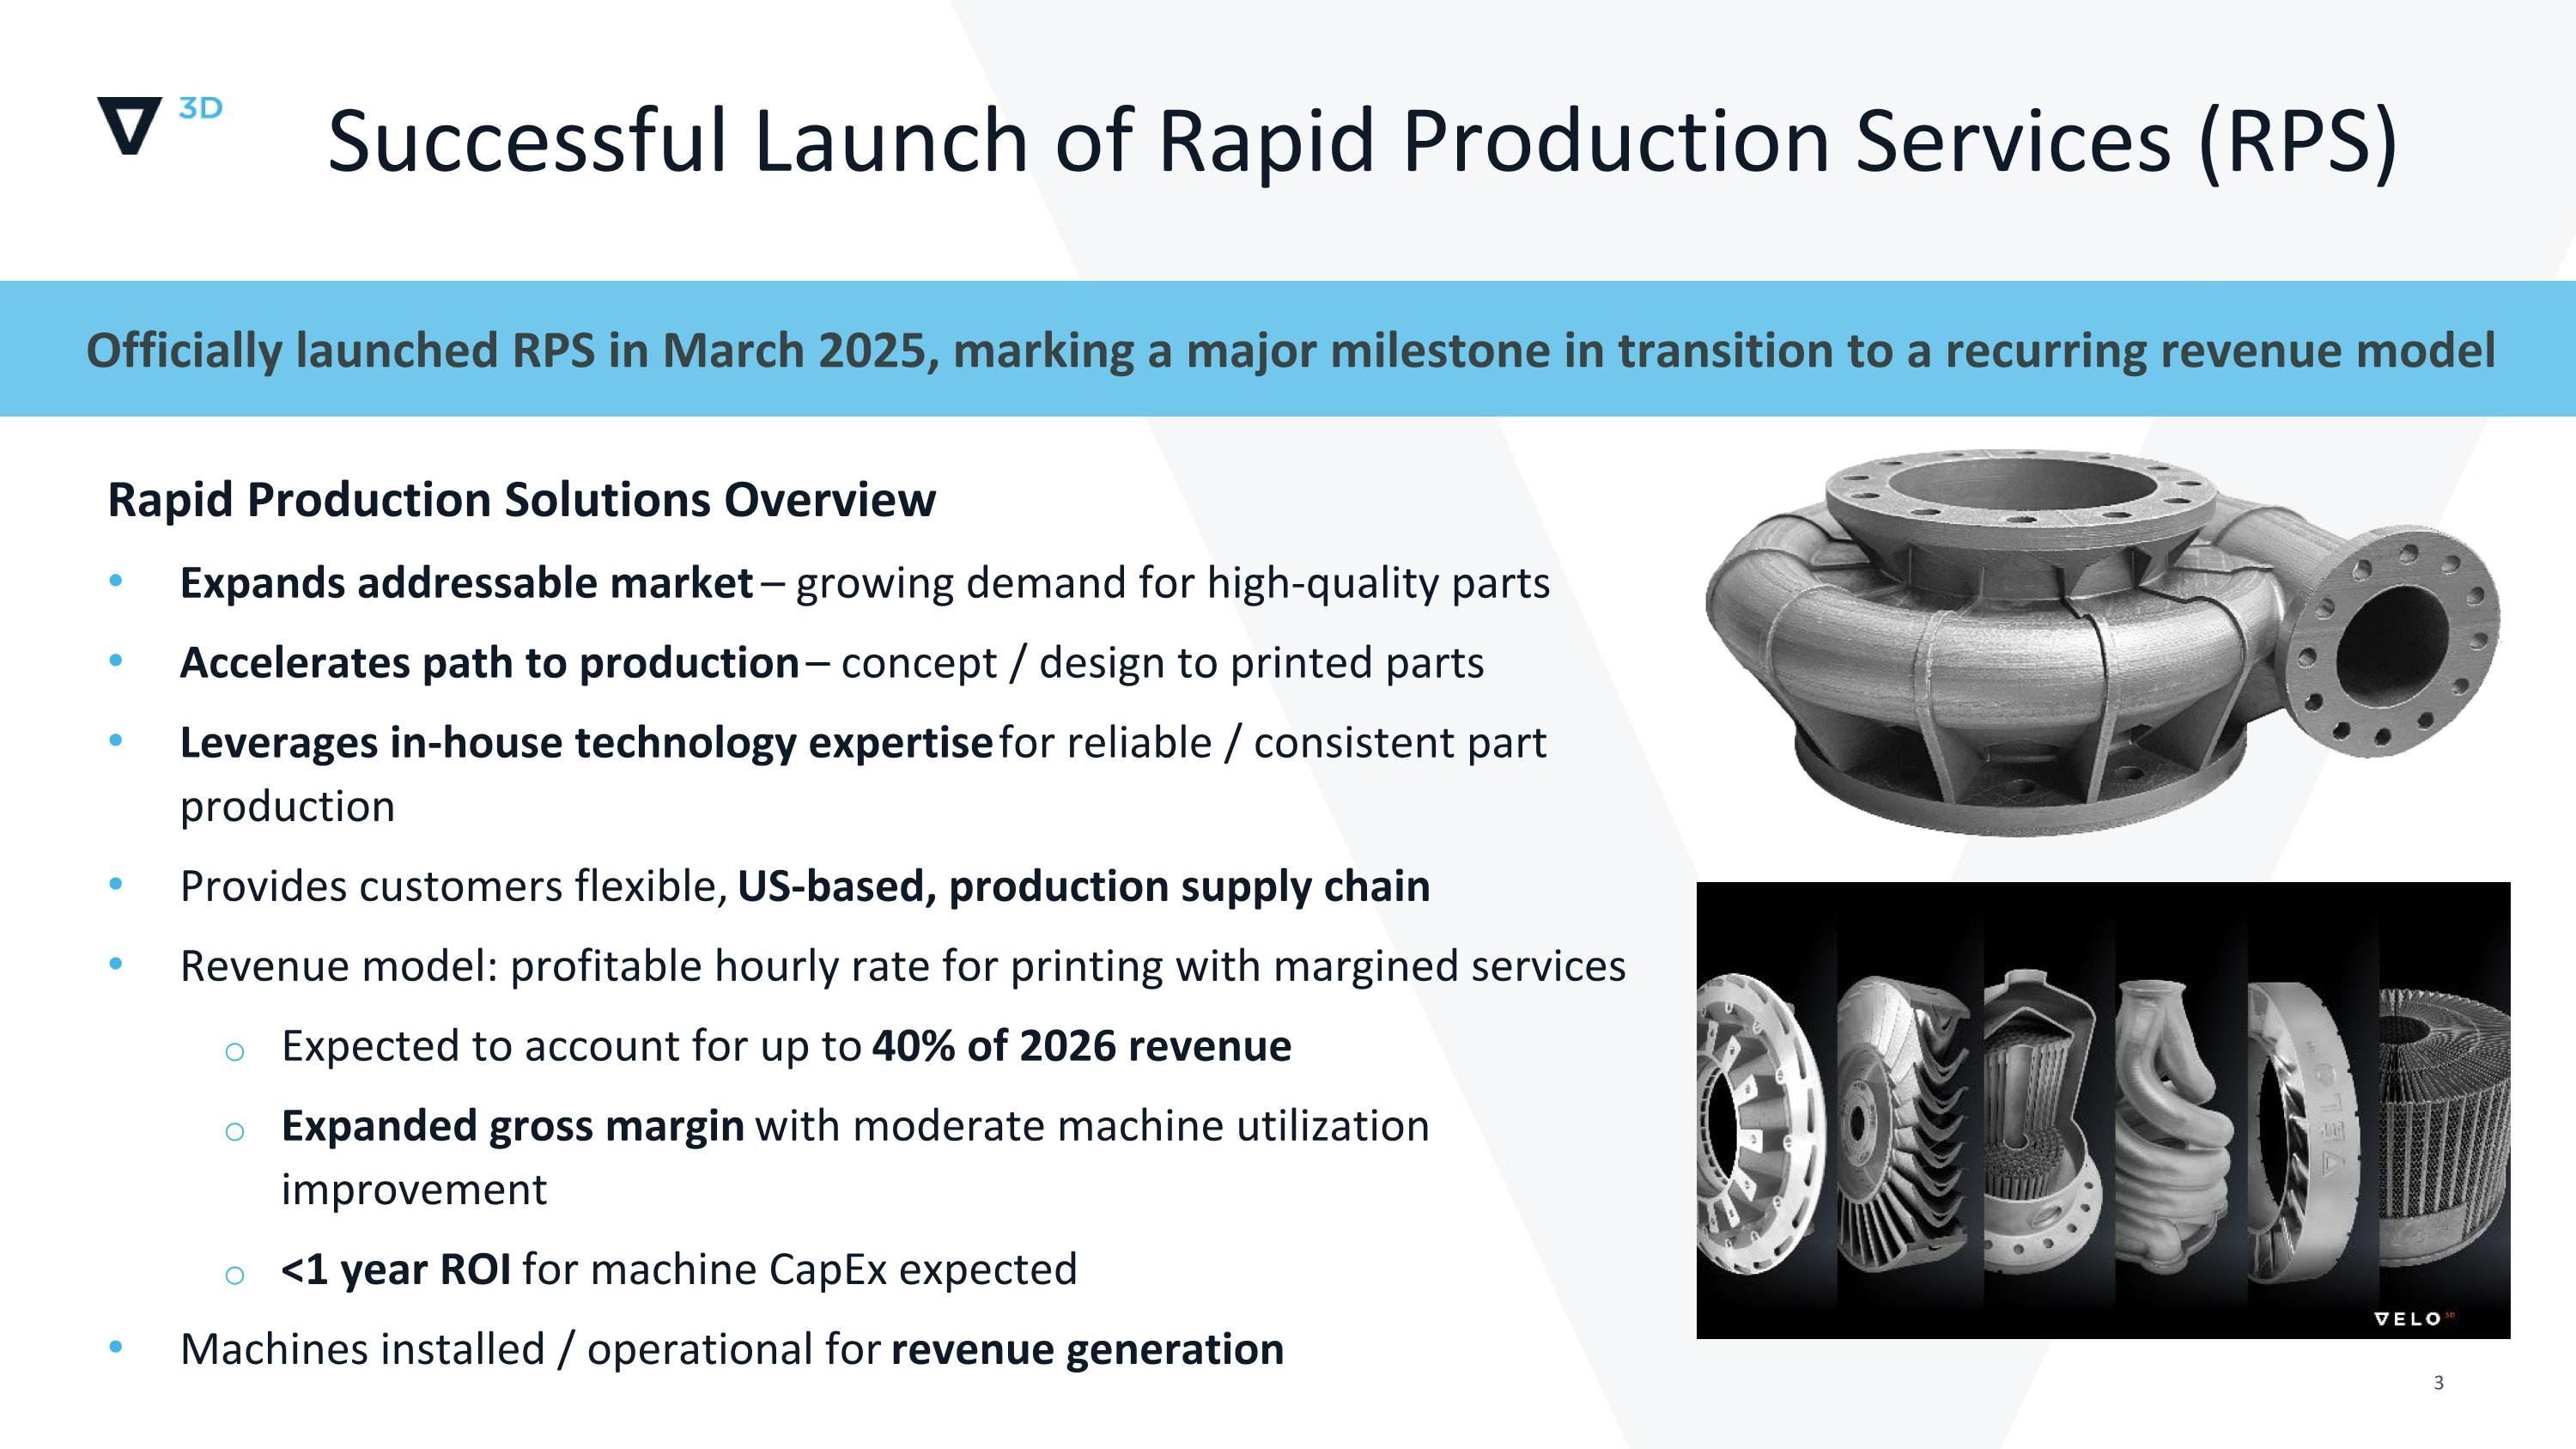
Jeldi, continued, “A $15 million, five-year MSA with Momentus, along with our exclusive supply agreement with Amaero, further validates our RPS offering and underscores our expanding role in reshoring critical manufacturing capabilities in the U.S. RPS is designed to address the growing demand for scalable, high-quality parts by providing a seamless path from design to production. It reduces design cycles, accelerates production qualification and ensures consistent output through a U.S.-based supply chain. Awareness and interest are
accelerating among top-tier companies in defense, aerospace and technology, and we believe RPS could account for up to 40% of our revenue by 2026.”
Jeldi continued, “We further strengthened our leadership team with the appointment of retired U.S. Army Green Beret Brice Cooper as Vice President of Defense and Government Relations and welcomed Rear Admiral Jason Lloyd and Kenneth Thieneman to our Board of Directors. Their deep industry and defense expertise will be instrumental as we expand our presence in key strategic markets.”
Jeldi, concluded, “With a number of initiatives in motion, we believe we are in a strong position to execute our strategy and reclaim our leadership in additive manufacturing. We are already seeing measurable improvements in performance and expect sequential quarterly progress throughout 2025.”
|
|
|
($ in Millions, except percentages and per-share data) |
1st Quarter 2025 |
1st Quarter 2024 |
GAAP revenue |
$9.3 |
$9.8 |
GAAP gross margin |
7.5 % |
(28.8)% |
GAAP net loss1 |
($25.4) |
($28.3) |
GAAP net loss per share - basic and diluted |
($0.13) |
($3.81) |
|
|
|
Non-GAAP net loss2 |
($8.9) |
($20.2) |
Non-GAAP net loss per share - basic and diluted2 |
($0.04) |
($2.71) |
1.Information about Velo3D’s use of non-GAAP information, including a reconciliation to U.S. GAAP, is provided at the end of this release under “Non-GAAP Financial Information”. The non-GAAP financial measures presented in this release should not be considered as the sole measure of the company’s performance and should not be considered in isolation from, or as a substitute for, comparable financial measures calculated in accordance with generally accepted accounting principles accepted in the United States.
2.Non-GAAP net loss and non-GAAP net loss per diluted share exclude stock-based compensation expense, gain on exchange of debt for common stock, fair value adjustments for the Company’s warrants, contingent earnout and debt derivative and loss on extinguishment of debt.
Summary of First Quarter 2025 Results
Revenue was $9.3 million. System revenue decreased compared to the first quarter of 2024, driven by a modest decrease in the number of printer sales, consistent with our strategy of maintaining Average Selling Price (ASP) by targeting high-value customers. While system sales are expected to remain the primary driver of revenue in 2025, the company anticipates that, under its new go-to-market strategy, its RPS parts production business will contribute an increasing share of revenue beginning in the second half of the year.
Gross margin for the first quarter was 7.5% compared to negative 28.8% in the first quarter of 2024. The improvement is a result of continued Build of Materials (BOM) cost reduction as well as manufacturing process optimization. The company expects gross margin to improve throughout 2025 as a result of operational efficiencies and an anticipated ramp-up of its Rapid Production Solutions business.
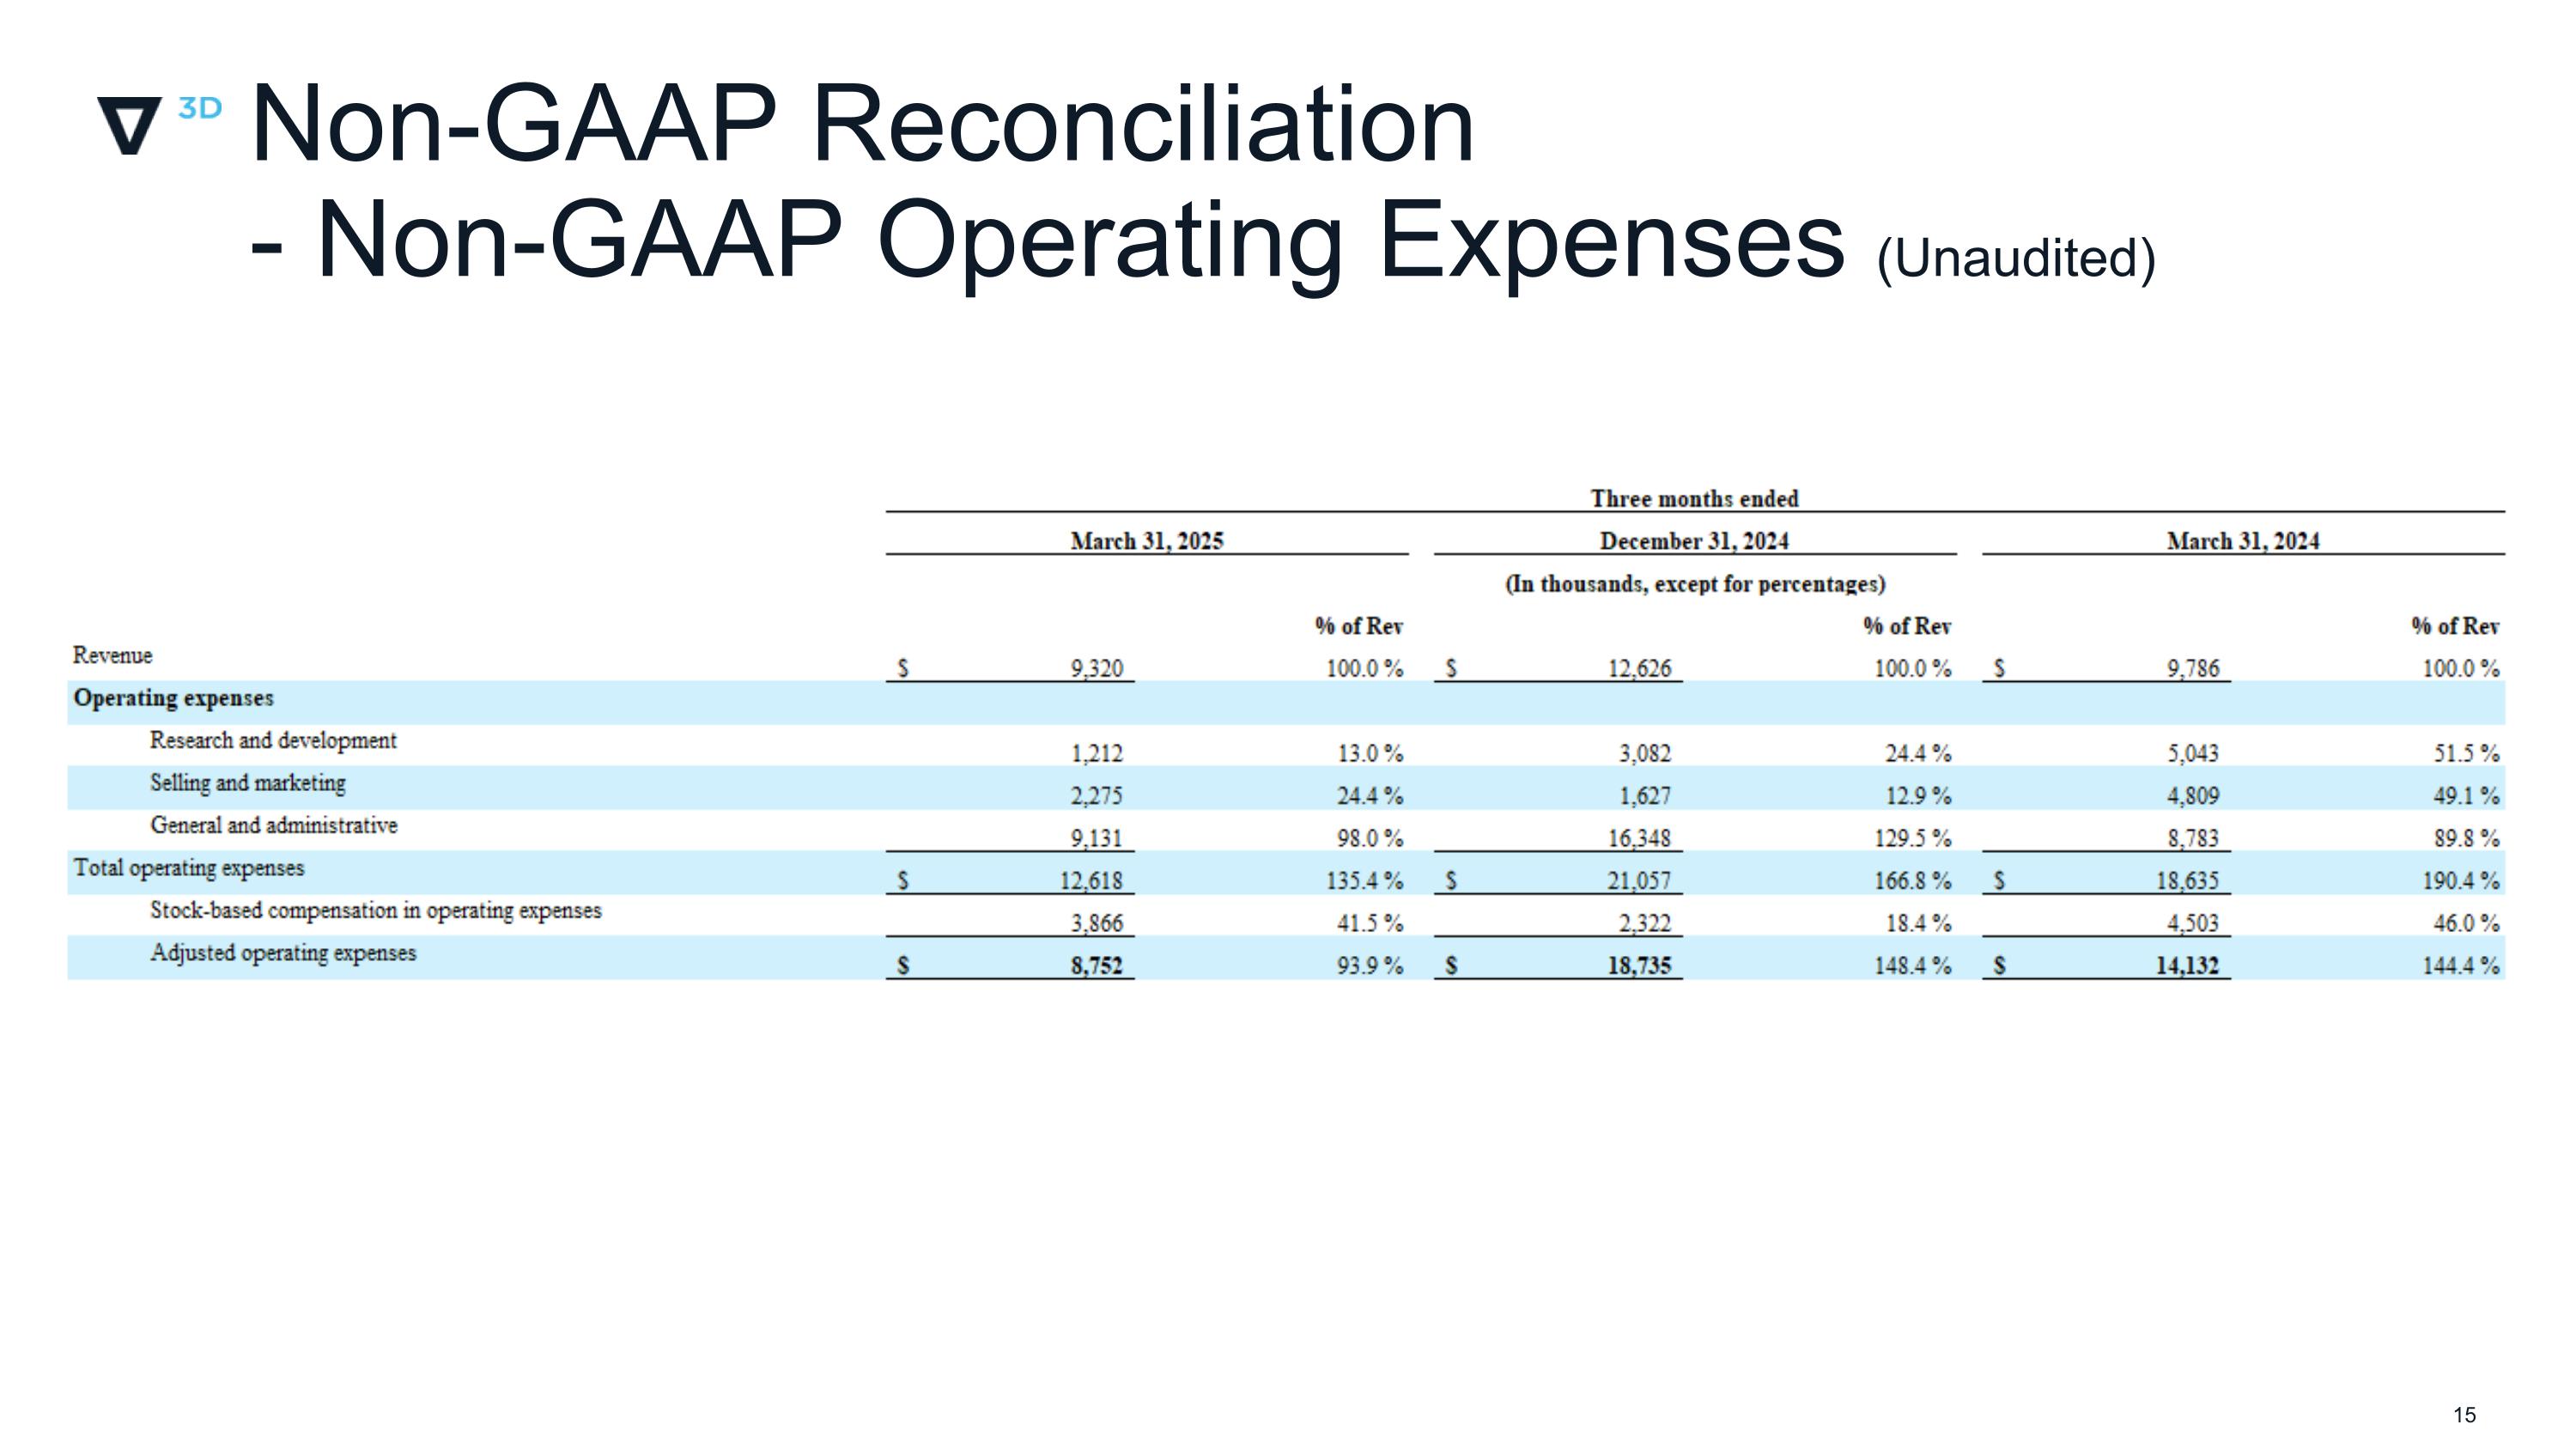
Operating expenses for the first quarter were $12.6 million compared to $18.6 million in the first quarter of 2024. Non-GAAP operating expenses, which excludes stock-based compensation expense of $3.9 million, were $8.8 million, down from $14.1 million in the first quarter of 2024.
GAAP net loss for the first quarter was $25.4 million compared to a loss of $28.3 million in the first quarter of 2024.
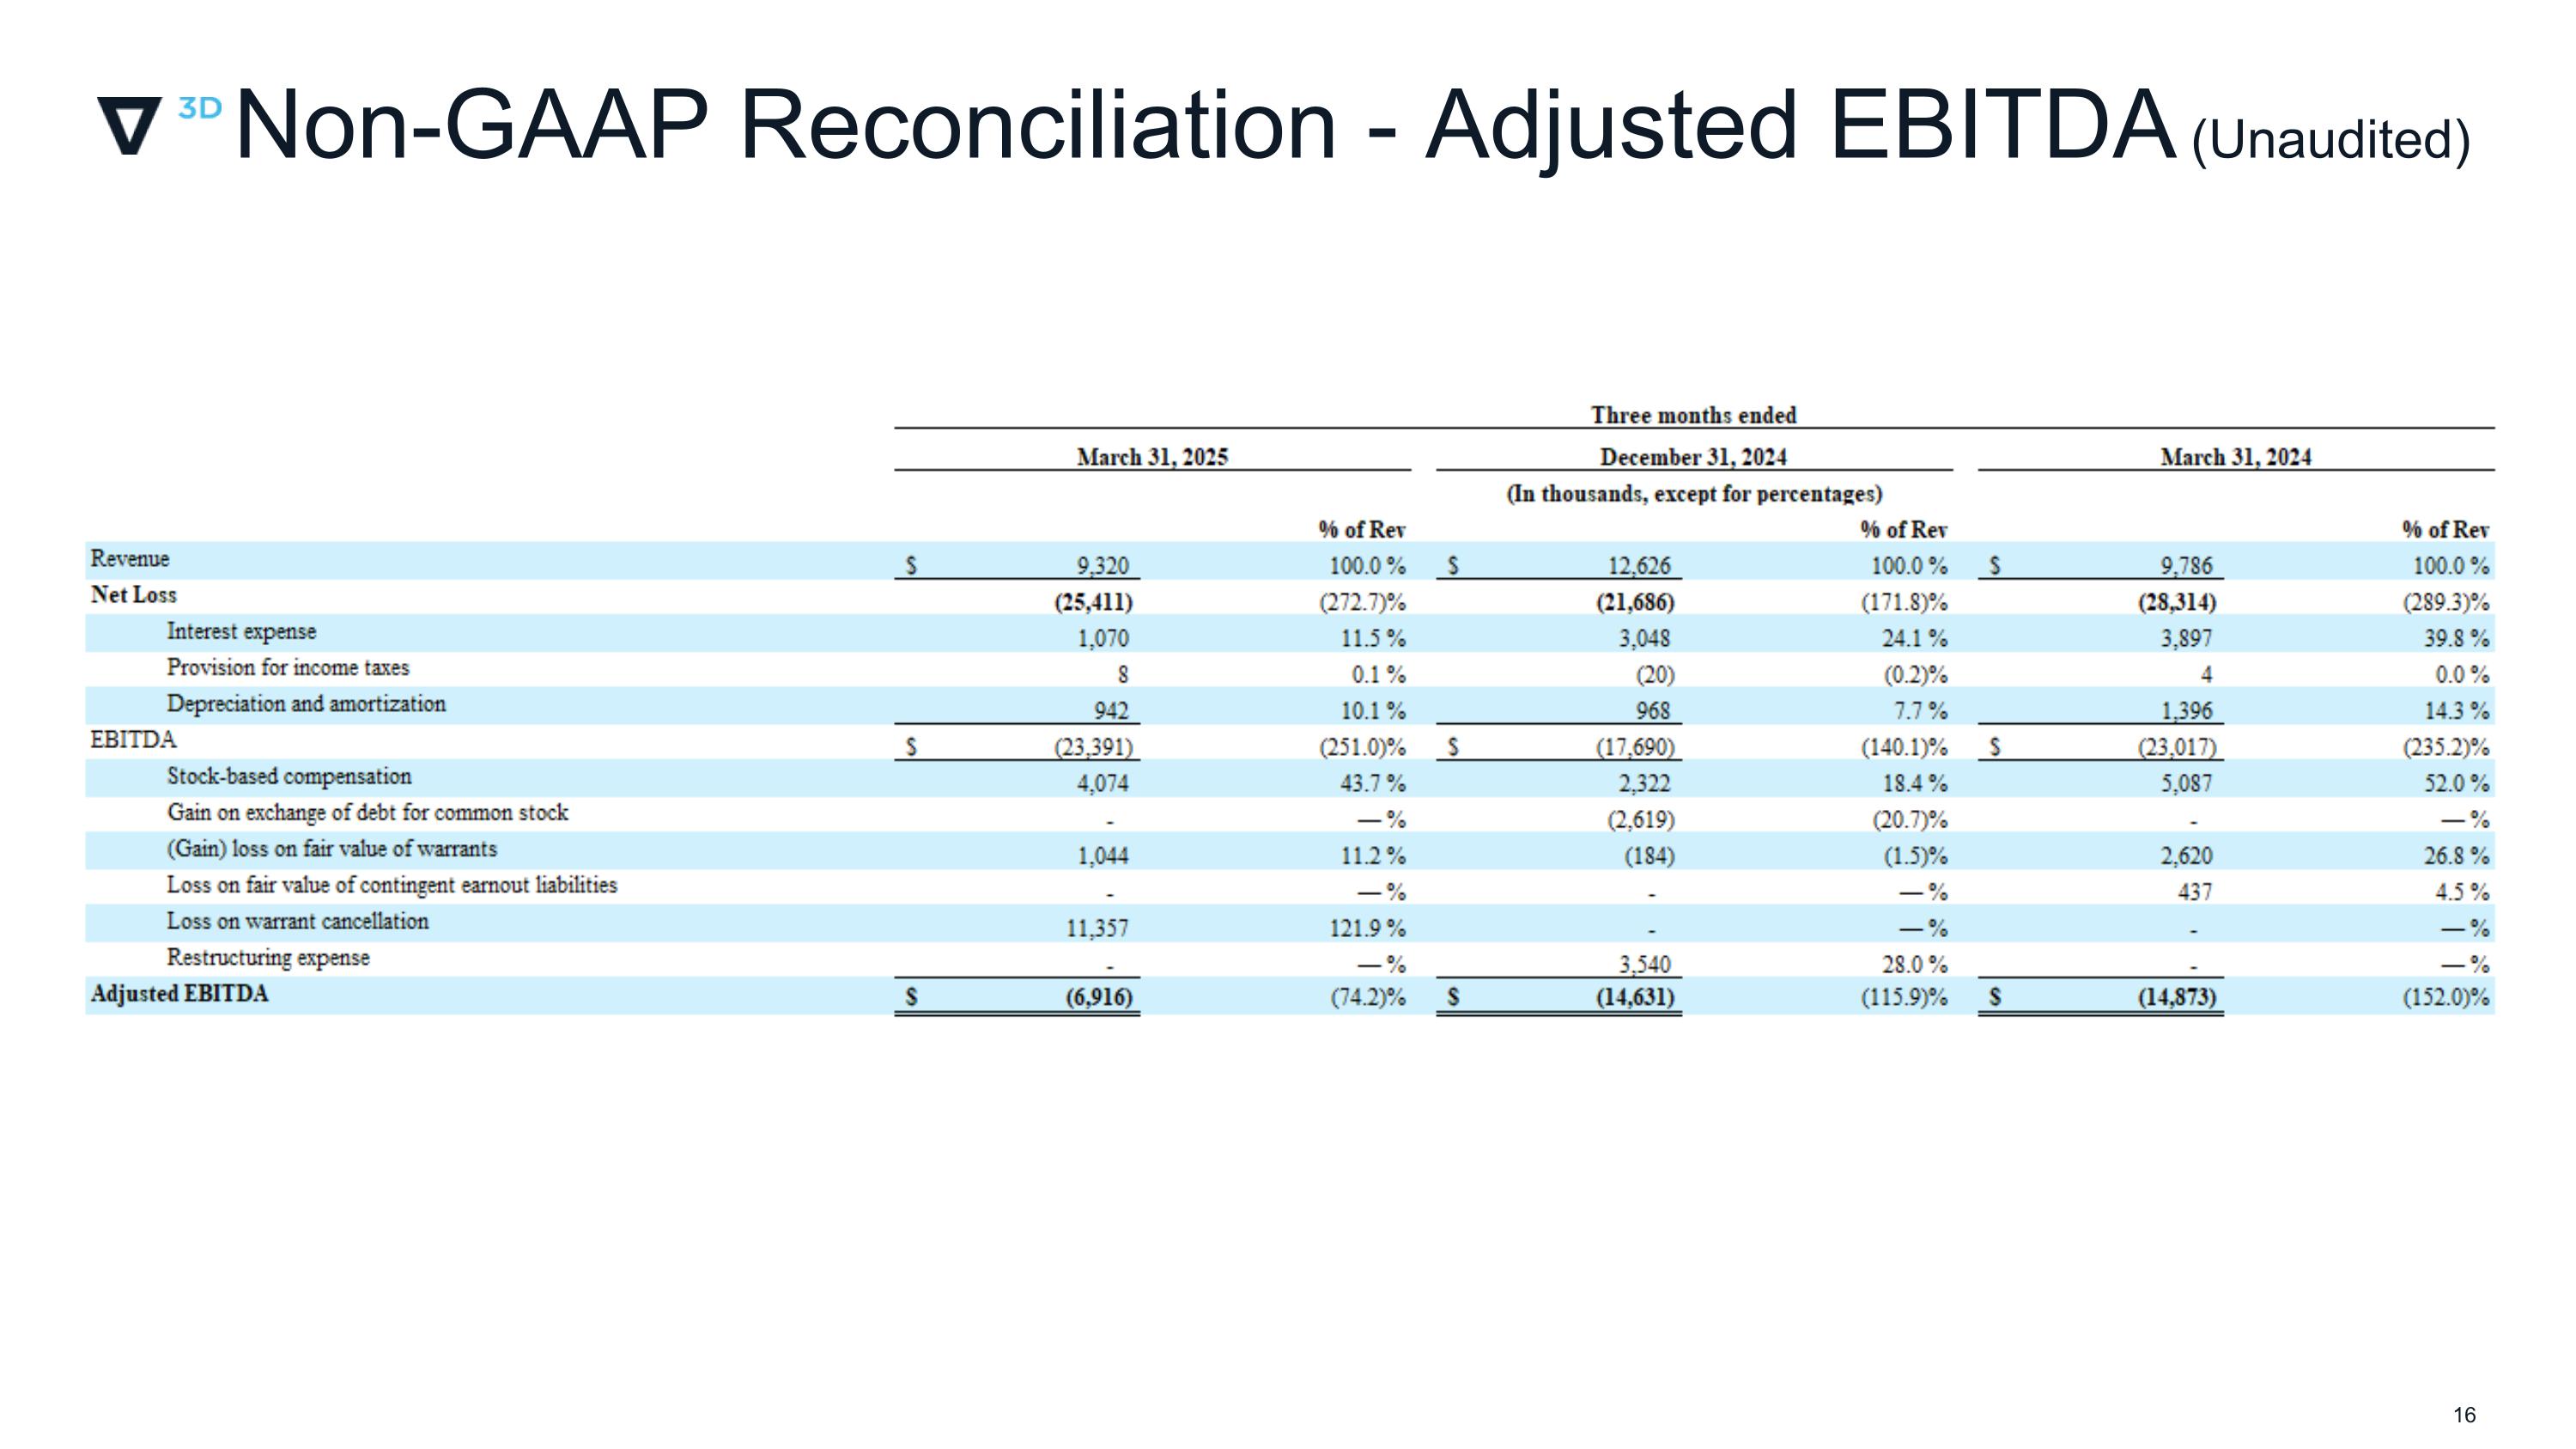
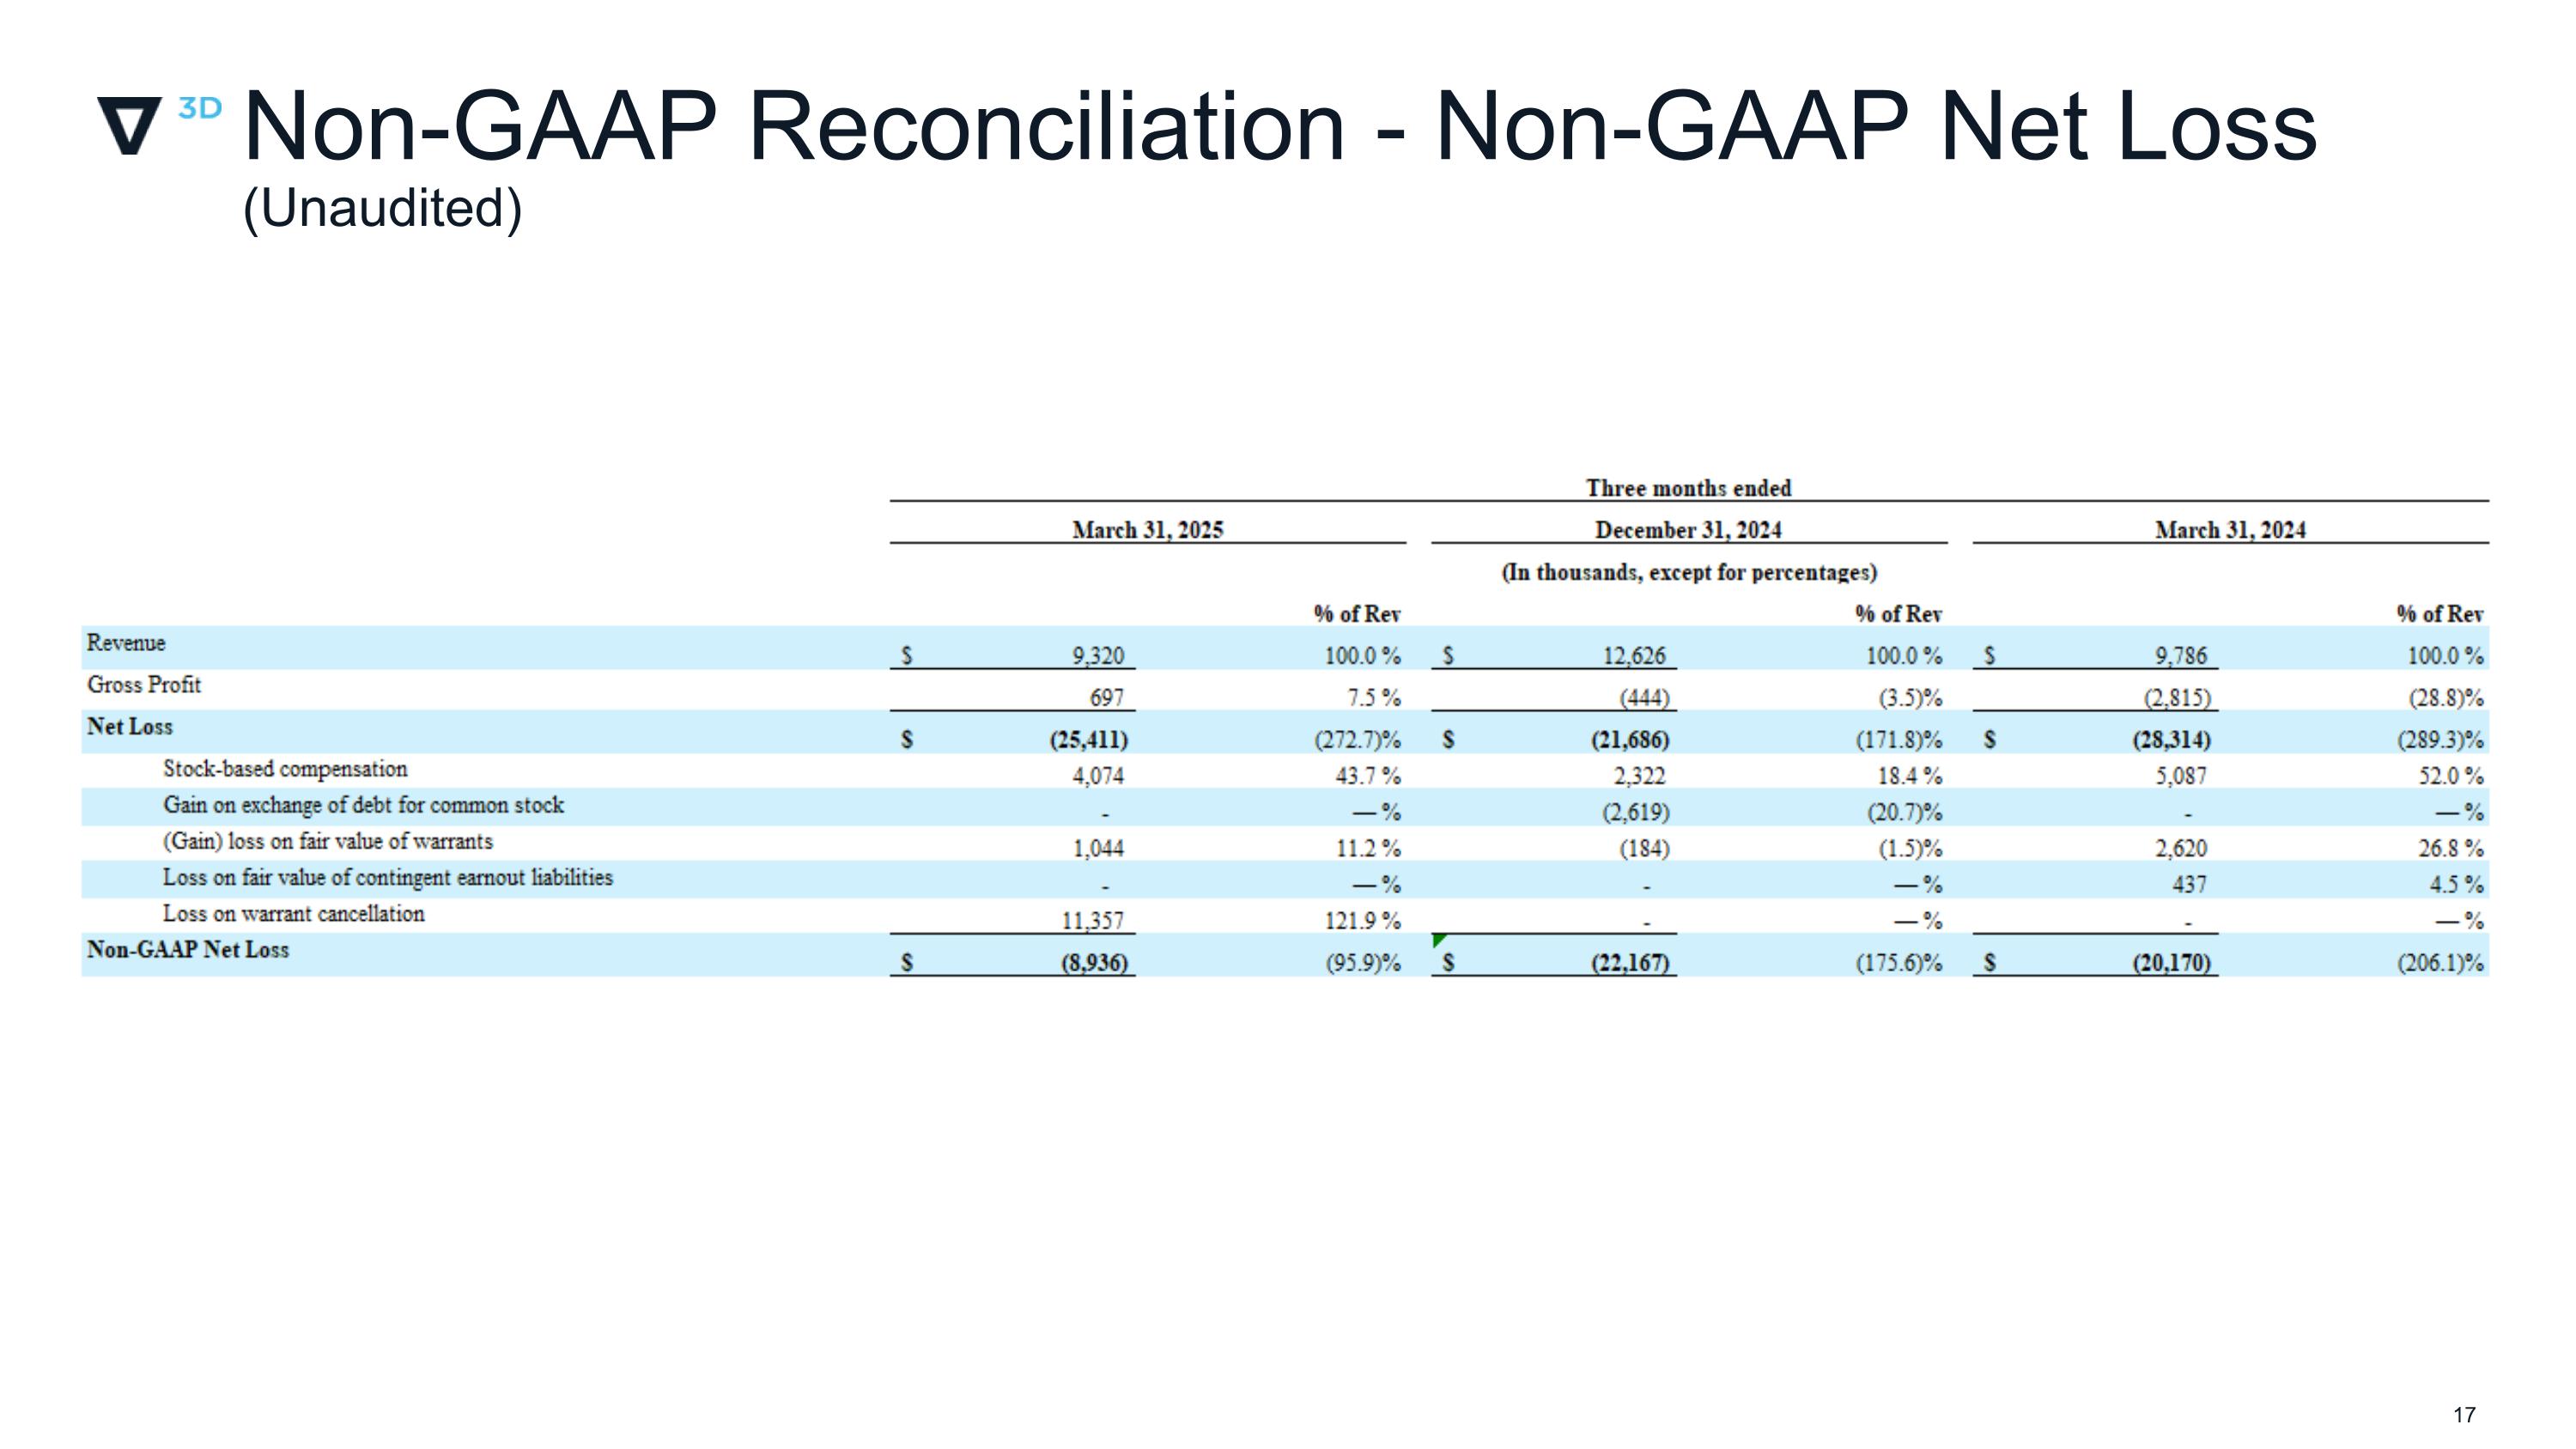
Non-GAAP net loss was $8.9 million in the three months ended March 31, 2025, which excludes the non-cash loss from the warrant cancellation transaction that eliminated significant future liabilities. Adjusted EBITDA for the quarter was negative $6.9 million. For more information regarding the company’s non-GAAP financial measures, see “Non-GAAP Financial Information” below.
As of March 31, 2025, the Company had $3.9 million of cash and cash equivalents, compared to $1.2 million as of December 31, 2024.
Guidance
Management expects the following for the full year 2025:
▪Revenue in the range of $50 million to $60 million.
▪Sequential improvement in gross margin
oGreater than 30% gross margin in fourth quarter of 2025
▪Non-GAAP operating expenses in the range of $40 million to $50 million
▪CapEx in the range of $15 million to $20 million
▪EBITDA positive in the first half of 2026
Conference Call
The company will host a conference call for investors this afternoon to discuss its first quarter 2025 financial results at 5 p.m. Eastern time / 2 p.m. Pacific time on May 13, 2025. The call will be webcast and can be accessed from the Events page of the Investor Relations section of Velo3D’s website at ir.velo3d.com.
About Velo3D:
Velo3D is a metal 3D printing technology company. 3D printing—also known as additive manufacturing (AM)—has a unique ability to improve the way high-value metal parts are built. However, legacy metal AM has been greatly limited in its capabilities since its invention almost 30 years ago. This has prevented the technology from being used to create the most valuable and impactful parts, restricting its use to specific niches where the limitations were acceptable.
Velo3D has overcome these limitations so engineers can design and print the parts they want. The company’s solution unlocks a wide breadth of design freedom and enables customers in space exploration, aviation, power generation, energy, and semiconductor to innovate the future in their respective industries. Using Velo3D, these customers can now build mission-critical metal parts that were previously impossible to manufacture. The fully integrated solution includes the Flow print preparation software, the Sapphire family of printers, and the Assure quality control system—all of which are powered by Velo3D’s Intelligent Fusion manufacturing process. The company delivered its first Sapphire system in 2018 and has been a strategic partner to innovators such as SpaceX, Honeywell, Honda, Chromalloy, and Lam Research. Velo3D has been named as one of Fast Company’s Most Innovative Companies for 2024. For more information, please visit Velo3D.com, or follow the company on LinkedIn or Twitter.
VELO, VELO3D, SAPPHIRE and INTELLIGENT FUSION, are registered trademarks of Velo3D, Inc.; and WITHOUT COMPROMISE, FLOW and ASSURE are trademarks of Velo3D, Inc. All Rights Reserved © Velo3D, Inc.
###

Investor Relations:
Velo3D
Bob Okunski, VP Investor Relations
[email protected]
Media Contact:
Velo3D
Michelle Sidwell, Chief Revenue Officer
[email protected]
Amounts herein pertaining to the company’s first quarter ended March 31, 2025 results represent a preliminary estimate as of the date of this earnings release and may be revised upon filing of our Quarterly Report on Form 10-Q with the Securities and Exchange Commission (the “SEC”). Additional information on our results of operations for the three months ended March 31, 2025 will be provided upon the filing our Quarterly Report 10-Q with the SEC.
Forward-Looking Statements:
This press release includes “forward-looking statements” within the meaning of the “safe harbor” provisions of the Private Securities Litigation Reform Act of 1996. The company’s actual results may differ from its expectations, estimates and projections and consequently, you should not rely on these forward-looking statements as predictions of future events. Words such as “expect”, “estimate”, “project”, “budget”, “forecast”, “anticipate”, “intend”, “plan”, “may”, “will”, “could”, “should”, “believes”, “predicts”, “potential”, “continue”, and similar expressions are intended to identify such forward-looking statements. These forward-looking statements include, without limitation, the company's guidance for fiscal years 2025 and 2026 (including the company’s estimates for revenue and gross margin), the company’s expectations regarding its ability to achieve profitability in the first half of 2026, the company’s expectations about future demand, the company's strategic realignment and initiatives, the company’s expectations regarding its liquidity and capital requirements, the company’s expectations regarding its potential cost savings, the company’s expectations about its market strategy and financial and operational position, and the company’s other expectations, beliefs, intentions or strategies for the future. These forward-looking statements involve significant risks and uncertainties that could cause the actual results to differ materially from the expected results. You should carefully consider the risks and uncertainties described in the “Risk Factors” section of the company’s Annual Report on Form 10-K for the fiscal year ended December 31, 2024 (the “FY 2024 10-K”) and the other documents filed by the company from time to time with the SEC. These filings identify and address other important risks and uncertainties that could cause actual events and results to differ materially from those contained in the forward-looking statements. Most of these factors are outside the company’s control and are difficult to predict. Factors that may cause such differences include, but are not limited to: (1) the inability of the company to execute its business plan, which may be affected by, among other things, competition, the company’s liquidity position//lack of available cash, the ability of the company to grow and manage growth profitably, maintain relationships with customers and suppliers and retain its key employees; (2) the company’s ability to continue as a going concern; (3) the company’s ability to service and comply with its indebtedness; (4) the company’s ability to raise additional capital in the near-term; (5) the possibility that the company may be adversely affected by other economic, business, and/or competitive factors; (6) changes in the applicable laws and regulations, and (7) other risks and uncertainties described in the FY 2024 10-K, including those under “Risk Factors” therein, and in the company’s other filings with the SEC. The company cautions that the foregoing list of factors is not exclusive and not to place undue reliance upon any forward-looking statements, including projections, which speak only
as of the date made. The company does not undertake or accept any obligation to release publicly any updates or revisions to any forward-looking statements to reflect any change in its expectations or any change in events, conditions or circumstances on which any such statement is based.
Non-GAAP Financial Information
The information in the table below sets forth the non-GAAP financial measures that the company uses in this release. We believe these non-GAAP financial performance and liquidity measures are helpful in identifying trends in our day-to-day performance because the items excluded have little or no significance on our day-to-day operations. These measures provide an assessment of core expenses and afford management the ability to make decisions which are expected to facilitate meeting current financial goals as well as achieve optimal financial performance.
Each of our non-GAAP measures have limitations as analytical tools. Because of these limitations, “Non-GAAP Net Loss”, “EBITDA”, “Adjusted EBITDA” and “Non-GAAP Operating Expenses”, should not be considered in isolation or as a substitute for performance measures calculated in accordance with GAAP. The company compensates for these limitations by relying primarily on its GAAP results and using Non-GAAP Net Loss, EBITDA, Adjusted EBITDA, and Non-GAAP Operating Expenses on a supplemental basis. You should review the reconciliation of the non-GAAP financial measures below and not rely on any single financial measure to evaluate the company's business.
The following tables reconcile Net income (loss) to Non-GAAP Net Loss, EBITDA, and Adjusted EBITDA and Total Operating Expenses to Non-GAAP Operating Expenses during the periods below:
Velo3D, Inc.
NON-GAAP Net Loss Reconciliation
(Unaudited)
|
|
|
|
|
|
|
|
|
|
|
|
|
|
|
|
|
|
|
|
|
|
|
|
|
|
|
Three months ended |
|
|
|
March 31, 2025 |
|
|
December 31, 2024 |
|
|
March 31, 2024 |
|
|
|
(In thousands, except for percentages) |
|
|
|
% of Rev |
|
|
% of Rev |
|
|
% of Rev |
|
Revenue |
|
$ |
9,320 |
|
|
|
100.0 |
% |
|
$ |
12,626 |
|
|
|
100.0 |
% |
|
$ |
9,786 |
|
|
|
100.0 |
% |
Gross Profit |
|
|
697 |
|
|
|
7.5 |
% |
|
|
(444 |
) |
|
|
(3.5 |
)% |
|
|
(2,815 |
) |
|
|
(28.8 |
)% |
Net Loss |
|
$ |
(25,411 |
) |
|
|
(272.7 |
)% |
|
$ |
(21,686 |
) |
|
|
(171.8 |
)% |
|
$ |
(28,314 |
) |
|
|
(289.3 |
)% |
Stock-based compensation |
|
|
4,074 |
|
|
|
43.7 |
% |
|
|
2,322 |
|
|
|
18.4 |
% |
|
|
5,087 |
|
|
|
52.0 |
% |
Gain on exchange of debt for common stock |
|
|
- |
|
|
|
— |
% |
|
|
(2,619 |
) |
|
|
(20.7 |
)% |
|
|
- |
|
|
|
— |
% |
(Gain) loss on fair value of warrants |
|
|
1,044 |
|
|
|
11.2 |
% |
|
|
(184 |
) |
|
|
(1.5 |
)% |
|
|
2,620 |
|
|
|
26.8 |
% |
Loss on fair value of contingent earnout liabilities |
|
|
- |
|
|
|
— |
% |
|
|
- |
|
|
|
— |
% |
|
|
437 |
|
|
|
4.5 |
% |
Loss on warrant cancellation |
|
|
11,357 |
|
|
|
121.9 |
% |
|
|
- |
|
|
|
— |
% |
|
|
- |
|
|
|
— |
% |
Non-GAAP Net Loss |
|
$ |
(8,936 |
) |
|
|
(95.9 |
)% |
|
$ |
(22,167 |
) |
|
|
(175.6 |
)% |
|
$ |
(20,170 |
) |
|
|
(206.1 |
)% |
Velo3D, Inc.
NON-GAAP Adjusted EBITDA Reconciliation
(Unaudited)
|
|
|
|
|
|
|
|
|
|
|
|
|
|
|
|
|
|
|
|
|
|
|
|
|
|
|
Three months ended |
|
|
|
March 31, 2025 |
|
|
December 31, 2024 |
|
|
March 31, 2024 |
|
|
|
(In thousands, except for percentages) |
|
|
|
% of Rev |
|
|
% of Rev |
|
|
% of Rev |
|
Revenue |
|
$ |
9,320 |
|
|
|
100.0 |
% |
|
$ |
12,626 |
|
|
|
100.0 |
% |
|
$ |
9,786 |
|
|
|
100.0 |
% |
Net Loss |
|
|
(25,411 |
) |
|
|
(272.7 |
)% |
|
|
(21,686 |
) |
|
|
(171.8 |
)% |
|
|
(28,314 |
) |
|
|
(289.3 |
)% |
Interest expense |
|
|
1,070 |
|
|
|
11.5 |
% |
|
|
3,048 |
|
|
|
24.1 |
% |
|
|
3,897 |
|
|
|
39.8 |
% |
Provision for income taxes |
|
|
8 |
|
|
|
0.1 |
% |
|
|
(20 |
) |
|
|
(0.2 |
)% |
|
|
4 |
|
|
|
0.0 |
% |
Depreciation and amortization |
|
|
942 |
|
|
|
10.1 |
% |
|
|
968 |
|
|
|
7.7 |
% |
|
|
1,396 |
|
|
|
14.3 |
% |
EBITDA |
|
$ |
(23,391 |
) |
|
|
(251.0 |
)% |
|
$ |
(17,690 |
) |
|
|
(140.1 |
)% |
|
$ |
(23,017 |
) |
|
|
(235.2 |
)% |
Stock-based compensation |
|
|
4,074 |
|
|
|
43.7 |
% |
|
|
2,322 |
|
|
|
18.4 |
% |
|
|
5,087 |
|
|
|
52.0 |
% |
Gain on exchange of debt for common stock |
|
|
- |
|
|
|
— |
% |
|
|
(2,619 |
) |
|
|
(20.7 |
)% |
|
|
- |
|
|
|
— |
% |
(Gain) loss on fair value of warrants |
|
|
1,044 |
|
|
|
11.2 |
% |
|
|
(184 |
) |
|
|
(1.5 |
)% |
|
|
2,620 |
|
|
|
26.8 |
% |
Loss on fair value of contingent earnout liabilities |
|
|
- |
|
|
|
— |
% |
|
|
- |
|
|
|
— |
% |
|
|
437 |
|
|
|
4.5 |
% |
Loss on warrant cancellation |
|
|
11,357 |
|
|
|
121.9 |
% |
|
|
- |
|
|
|
— |
% |
|
|
- |
|
|
|
— |
% |
Restructuring expense |
|
|
- |
|
|
|
— |
% |
|
|
3,540 |
|
|
|
28.0 |
% |
|
|
- |
|
|
|
— |
% |
Adjusted EBITDA |
|
$ |
(6,916 |
) |
|
|
(74.2 |
)% |
|
$ |
(14,631 |
) |
|
|
(115.9 |
)% |
|
$ |
(14,873 |
) |
|
|
(152.0 |
)% |
Velo3D, Inc.
NON-GAAP Adjusted Operating Expenses Reconciliation
(Unaudited)
|
|
|
|
|
|
|
|
|
|
|
|
|
|
|
|
|
|
|
|
|
|
|
|
|
|
|
Three months ended |
|
|
|
March 31, 2025 |
|
|
December 31, 2024 |
|
|
March 31, 2024 |
|
|
|
(In thousands, except for percentages) |
|
|
|
% of Rev |
|
|
% of Rev |
|
|
% of Rev |
|
Revenue |
|
$ |
9,320 |
|
|
|
100.0 |
% |
|
$ |
12,626 |
|
|
|
100.0 |
% |
|
$ |
9,786 |
|
|
|
100.0 |
% |
Operating expenses |
|
|
|
|
|
|
|
|
|
|
|
|
|
|
|
|
|
|
Research and development |
|
|
1,212 |
|
|
|
13.0 |
% |
|
|
3,082 |
|
|
|
24.4 |
% |
|
|
5,043 |
|
|
|
51.5 |
% |
Selling and marketing |
|
|
2,275 |
|
|
|
24.4 |
% |
|
|
1,627 |
|
|
|
12.9 |
% |
|
|
4,809 |
|
|
|
49.1 |
% |
General and administrative |
|
|
9,131 |
|
|
|
98.0 |
% |
|
|
16,348 |
|
|
|
129.5 |
% |
|
|
8,783 |
|
|
|
89.8 |
% |
Total operating expenses |
|
$ |
12,618 |
|
|
|
135.4 |
% |
|
$ |
21,057 |
|
|
|
166.8 |
% |
|
$ |
18,635 |
|
|
|
190.4 |
% |
Stock-based compensation in operating expenses |
|
|
3,866 |
|
|
|
41.5 |
% |
|
|
2,322 |
|
|
|
18.4 |
% |
|
|
4,503 |
|
|
|
46.0 |
% |
Adjusted operating expenses |
|
$ |
8,752 |
|
|
|
93.9 |
% |
|
$ |
18,735 |
|
|
|
148.4 |
% |
|
$ |
14,132 |
|
|
|
144.4 |
% |
Velo3D, Inc.
CONDENSED CONSOLIDATED STATEMENTS OF OPERATIONS
(Unaudited)
(In thousands, except share and per share data)
|
|
|
|
|
|
|
|
|
|
|
Three Months Ended March 31, |
|
|
|
2025 |
|
|
2024 |
|
Revenue |
|
|
|
|
|
|
3D Printer |
|
$ |
7,523 |
|
|
$ |
7,660 |
|
Recurring payment |
|
|
— |
|
|
|
470 |
|
Support services |
|
|
1,790 |
|
|
|
1,656 |
|
Other |
|
|
7 |
|
|
|
— |
|
Total Revenue |
|
|
9,320 |
|
|
|
9,786 |
|
Cost of revenue |
|
|
|
|
|
|
3D Printer |
|
|
7,540 |
|
|
|
9,394 |
|
Recurring payment |
|
|
12 |
|
|
|
315 |
|
Support services |
|
|
1,071 |
|
|
|
2,892 |
|
Total cost of revenue |
|
|
8,623 |
|
|
|
12,601 |
|
Gross loss |
|
|
697 |
|
|
|
(2,815 |
) |
Operating expenses |
|
|
|
|
|
|
Research and development |
|
|
1,212 |
|
|
|
5,043 |
|
Selling and marketing |
|
|
2,275 |
|
|
|
4,809 |
|
General and administrative |
|
|
9,131 |
|
|
|
8,783 |
|
Total operating expenses |
|
|
12,618 |
|
|
|
18,635 |
|
Loss from operations |
|
|
(11,921 |
) |
|
|
(21,450 |
) |
Interest expense |
|
|
(1,070 |
) |
|
|
(3,897 |
) |
Loss on fair value of warrants |
|
|
(1,044 |
) |
|
|
(2,620 |
) |
Loss on fair value of contingent earnout liabilities |
|
|
— |
|
|
|
(437 |
) |
Loss on warrant cancellation |
|
|
(11,357 |
) |
|
|
— |
|
Other income (expense), net |
|
|
(11 |
) |
|
|
94 |
|
Loss before provision for income taxes |
|
|
(25,403 |
) |
|
|
(28,310 |
) |
Provision for income taxes |
|
|
(8 |
) |
|
|
(4 |
) |
Net loss |
|
$ |
(25,411 |
) |
|
$ |
(28,314 |
) |
|
|
|
|
|
|
|
Net loss per share: |
|
|
|
|
|
|
Basic |
|
$ |
(0.13 |
) |
|
$ |
(3.81 |
) |
Diluted |
|
$ |
(0.13 |
) |
|
$ |
(3.81 |
) |
Velo3D, Inc.
CONDENSED CONSOLIDATED BALANCE SHEETS
(Unaudited)
(In thousands, except share and per share data)
|
|
|
|
|
|
|
|
|
|
|
March 31, |
|
|
December 31, |
|
|
|
2025 |
|
|
2024 |
|
Assets |
|
|
|
|
|
|
Current assets: |
|
|
|
|
|
|
Cash and cash equivalents |
|
$ |
3,870 |
|
|
$ |
1,212 |
|
Accounts receivable, net |
|
|
4,569 |
|
|
|
3,723 |
|
Inventories, net |
|
|
46,133 |
|
|
|
49,953 |
|
Contract assets |
|
|
1,295 |
|
|
|
500 |
|
Prepaid expenses and other current assets |
|
|
5,907 |
|
|
|
2,336 |
|
Total current assets |
|
|
61,774 |
|
|
|
57,724 |
|
Property and equipment, net |
|
|
13,691 |
|
|
|
14,270 |
|
Equipment on lease, net |
|
|
3,673 |
|
|
|
3,673 |
|
Other assets |
|
|
12,261 |
|
|
|
13,513 |
|
Total assets |
|
$ |
91,399 |
|
|
$ |
89,180 |
|
Liabilities and Stockholders’ Equity |
|
|
|
|
|
|
Current liabilities: |
|
|
|
|
|
|
Accounts payable |
|
$ |
16,365 |
|
|
$ |
18,538 |
|
Accrued expenses and other current liabilities |
|
|
3,762 |
|
|
|
3,511 |
|
Debt – current portion |
|
|
16,152 |
|
|
|
5,666 |
|
Contract liabilities |
|
|
7,614 |
|
|
|
10,285 |
|
Total current liabilities |
|
|
43,893 |
|
|
|
38,000 |
|
Long-term debt – less current portion |
|
|
5,506 |
|
|
|
— |
|
Contingent earnout liabilities |
|
|
11 |
|
|
|
11 |
|
Warrant liabilities |
|
|
13 |
|
|
|
2,167 |
|
Other noncurrent liabilities |
|
|
9,094 |
|
|
|
9,338 |
|
Total liabilities |
|
|
58,517 |
|
|
|
49,516 |
|
Commitments and contingencies (Note 13) |
|
|
|
|
|
|
Stockholders’ equity: |
|
|
|
|
|
|
Common stock, $0.00001 par value - 500,000,000 shares authorized at March 31, 2025 and December 31, 2024, 210,232,762 and 194,909,430 shares issued and outstanding as of March 31, 2025 and December 31, 2024, respectively |
|
|
4 |
|
|
|
4 |
|
Additional paid-in capital |
|
|
488,623 |
|
|
|
469,994 |
|
Accumulated other comprehensive loss |
|
|
— |
|
|
|
— |
|
Accumulated deficit |
|
|
(455,745 |
) |
|
|
(430,334 |
) |
Total stockholders’ equity |
|
|
32,882 |
|
|
|
39,664 |
|
Total liabilities and stockholders’ equity |
|
$ |
91,399 |
|
|
$ |
89,180 |
|
Velo3D, Inc.
CONDENSED CONSOLIDATED STATEMENTS OF CASH FLOWS
(Unaudited)
(In thousands)
|
|
|
|
|
|
|
|
|
|
|
Three Months Ended March 31, |
|
|
|
2025 |
|
|
2024 |
|
Cash flows from operating activities |
|
|
|
|
|
|
Net loss |
|
$ |
(25,411 |
) |
|
$ |
(28,314 |
) |
Adjustments to reconcile net loss to net cash used in operating activities |
|
|
|
|
|
|
Depreciation and amortization |
|
|
942 |
|
|
|
1,396 |
|
Amortization of debt discount and deferred financing costs |
|
|
992 |
|
|
|
3,171 |
|
Stock-based compensation |
|
|
4,074 |
|
|
|
5,087 |
|
Loss on fair value of warrants |
|
|
1,044 |
|
|
|
2,620 |
|
Loss on fair value of contingent earnout liabilities |
|
|
— |
|
|
|
437 |
|
Loss on warrant cancellation |
|
|
11,357 |
|
|
|
— |
|
Changes in assets and liabilities |
|
|
|
|
|
|
Accounts receivable |
|
|
(846 |
) |
|
|
(2,070 |
) |
Inventories |
|
|
1,989 |
|
|
|
2,645 |
|
Contract assets |
|
|
(795 |
) |
|
|
(2,118 |
) |
Prepaid expenses and other current assets |
|
|
(3,407 |
) |
|
|
1,078 |
|
Other assets |
|
|
1,224 |
|
|
|
396 |
|
Accounts payable |
|
|
(860 |
) |
|
|
(4,199 |
) |
Accrued expenses and other liabilities |
|
|
251 |
|
|
|
(218 |
) |
Contract liabilities |
|
|
(2,671 |
) |
|
|
(416 |
) |
Other noncurrent liabilities |
|
|
(232 |
) |
|
|
(18 |
) |
Net cash used in operating activities |
|
|
(12,349 |
) |
|
|
(20,523 |
) |
Cash flows from investing activities |
|
|
|
|
|
|
Purchase of property and equipment |
|
|
— |
|
|
|
(6 |
) |
Production of equipment for lease to customers |
|
|
— |
|
|
|
(1 |
) |
Proceeds from maturity of available-for-sale investments |
|
|
— |
|
|
|
3,500 |
|
Net cash provided by investing activities |
|
|
— |
|
|
|
3,493 |
|
Cash flows from financing activities |
|
|
|
|
|
|
Proceeds from secured convertible notes |
|
|
15,000 |
|
|
|
— |
|
Issuance of common stock upon exercise of stock options |
|
|
— |
|
|
|
285 |
|
Net cash provided by financing activities |
|
|
15,000 |
|
|
|
285 |
|
Effect of exchange rate changes on cash and cash equivalents |
|
|
7 |
|
|
|
5 |
|
Net change in cash and cash equivalents |
|
|
2,658 |
|
|
|
(16,740 |
) |
Cash and cash equivalents and restricted cash at beginning of period |
|
|
1,840 |
|
|
|
25,294 |
|
Cash and cash equivalents and restricted cash at end of period |
|
$ |
4,498 |
|
|
$ |
8,554 |
|
The following table provides a reconciliation of cash, cash equivalents, and restricted cash reported within the condensed consolidated balance sheets to the total of such amounts shown on the condensed consolidated statements of cash flows:
|
|
|
|
|
|
|
|
|
|
|
March 31, |
|
|
|
2025 |
|
|
2024 |
|
Cash and cash equivalents |
|
$ |
3,870 |
|
|
$ |
7,754 |
|
Restricted cash (Other assets) |
|
|
628 |
|
|
|
800 |
|
Total cash and cash equivalents and restricted cash |
|
$ |
4,498 |
|
|
$ |
8,554 |
|
First Quarter 2025 Supplementary Slides May 13, 2025 New
Confidential & Proprietary | Disclaimer Forward Looking Statement This presentation includes “forward-looking statements” within the meaning of the “safe harbor” provisions of the Private Securities Litigation Reform Act of 1996. The company’s actual results may differ from its expectations, estimates and projections and consequently, you should not rely on these forward-looking statements as predictions of future events. Words such as “expect”, “estimate”, “project”, “budget”, “forecast”, “anticipate”, “intend”, “plan”, “may”, “will”, “could”, “should”, “believes”, “predicts”, “potential”, “continue”, and similar expressions are intended to identify such forward-looking statements. These forward-looking statements include, without limitation, the company’s guidance for fiscal years 2025 and 2026 (including the company’s estimates for revenue and gross margin), the company's expectations regarding its ability to achieve profitability in the first half of 2026, the company’s expectations about future demand, the company's strategic realignment and initiatives, the company’s expectations regarding its liquidity and capital requirements, the company’s expectations regarding its potential cost savings, the company’s expectation about its market strategy and financial and operational position, and the company’s other expectations, hopes, beliefs, intentions or strategies for the future. These forward-looking statements involve significant risks and uncertainties that could cause the actual results to differ materially from the expected results. You should carefully consider the risks and uncertainties described in the “Risk Factors” section of the company’s Annual Report on Form 10-K for the fiscal year ended December 31, 2024 (the “FY 2024 10-K”) and the other documents filed by the company from time to time with the SEC. These filings identify and address other important risks and uncertainties that could cause actual events and results to differ materially from those contained in the forward-looking statements. Most of these factors are outside the company’s control and are difficult to predict. Factors that may cause such differences include, but are not limited to: (1) the inability of the company to execute its business plan, which may be affected by, among other things, competition, the ability of the company to grow and manage growth profitably, maintain relationships with customers and suppliers and retain its key employees; (2) the company’s ability to continue as a going concern; (3) the company’s ability to service and comply with its indebtedness; (4) the company’s ability to raise additional capital in the near-term; (5) the possibility that the company may be adversely affected by other economic, business, and/or competitive factors; (6) changes in the applicable laws and regulations, and (7) other risks and uncertainties indicated from time to time described in the FY 2024 10-K, including those under “Risk Factors” therein, and in the company’s other filings with the SEC. The company cautions that the foregoing list of factors is not exclusive and not to place undue reliance upon any forward-looking statements, including projections, which speak only as of the date made. The company does not undertake or accept any obligation to release publicly any updates or revisions to any forward-looking statements to reflect any change in its expectations or any change in events, conditions or circumstances on which any such statement is based. * Additional information on the use of Non-GAAP financial information, industry and market data, and trademarks is included in the appendix of this presentation.
Successful Launch of Rapid Production Services (RPS) Rapid Production Solutions Overview Expands addressable market – growing demand for high-quality parts Accelerates path to production – concept / design to printed parts Leverages in-house technology expertise for reliable / consistent part production Provides customers flexible, US-based, production supply chain Revenue model: profitable hourly rate for printing with margined services Expected to account for up to 40% of 2026 revenue Expanded gross margin with moderate machine utilization improvement <1 year ROI for machine CapEx expected Machines installed / operational for revenue generation Officially launched RPS in March 2025, marking a major milestone in transition to a recurring revenue model
Early traction from new go-to-market strategy, with both new and existing customers, particularly in the defense and aerospace industries where domestic supply chain resiliency is a priority Demand Mix Shift to RPS is Underway Up 3X Dramatic Increase in RPS Backlog Attracting New Customers Accelerating Demand from Defense Sector RPS Backlog increased 3X compared to YE 2024 New customers represented >75% of Q1 Bookings 50% of demand is coming from targeted Defense sector
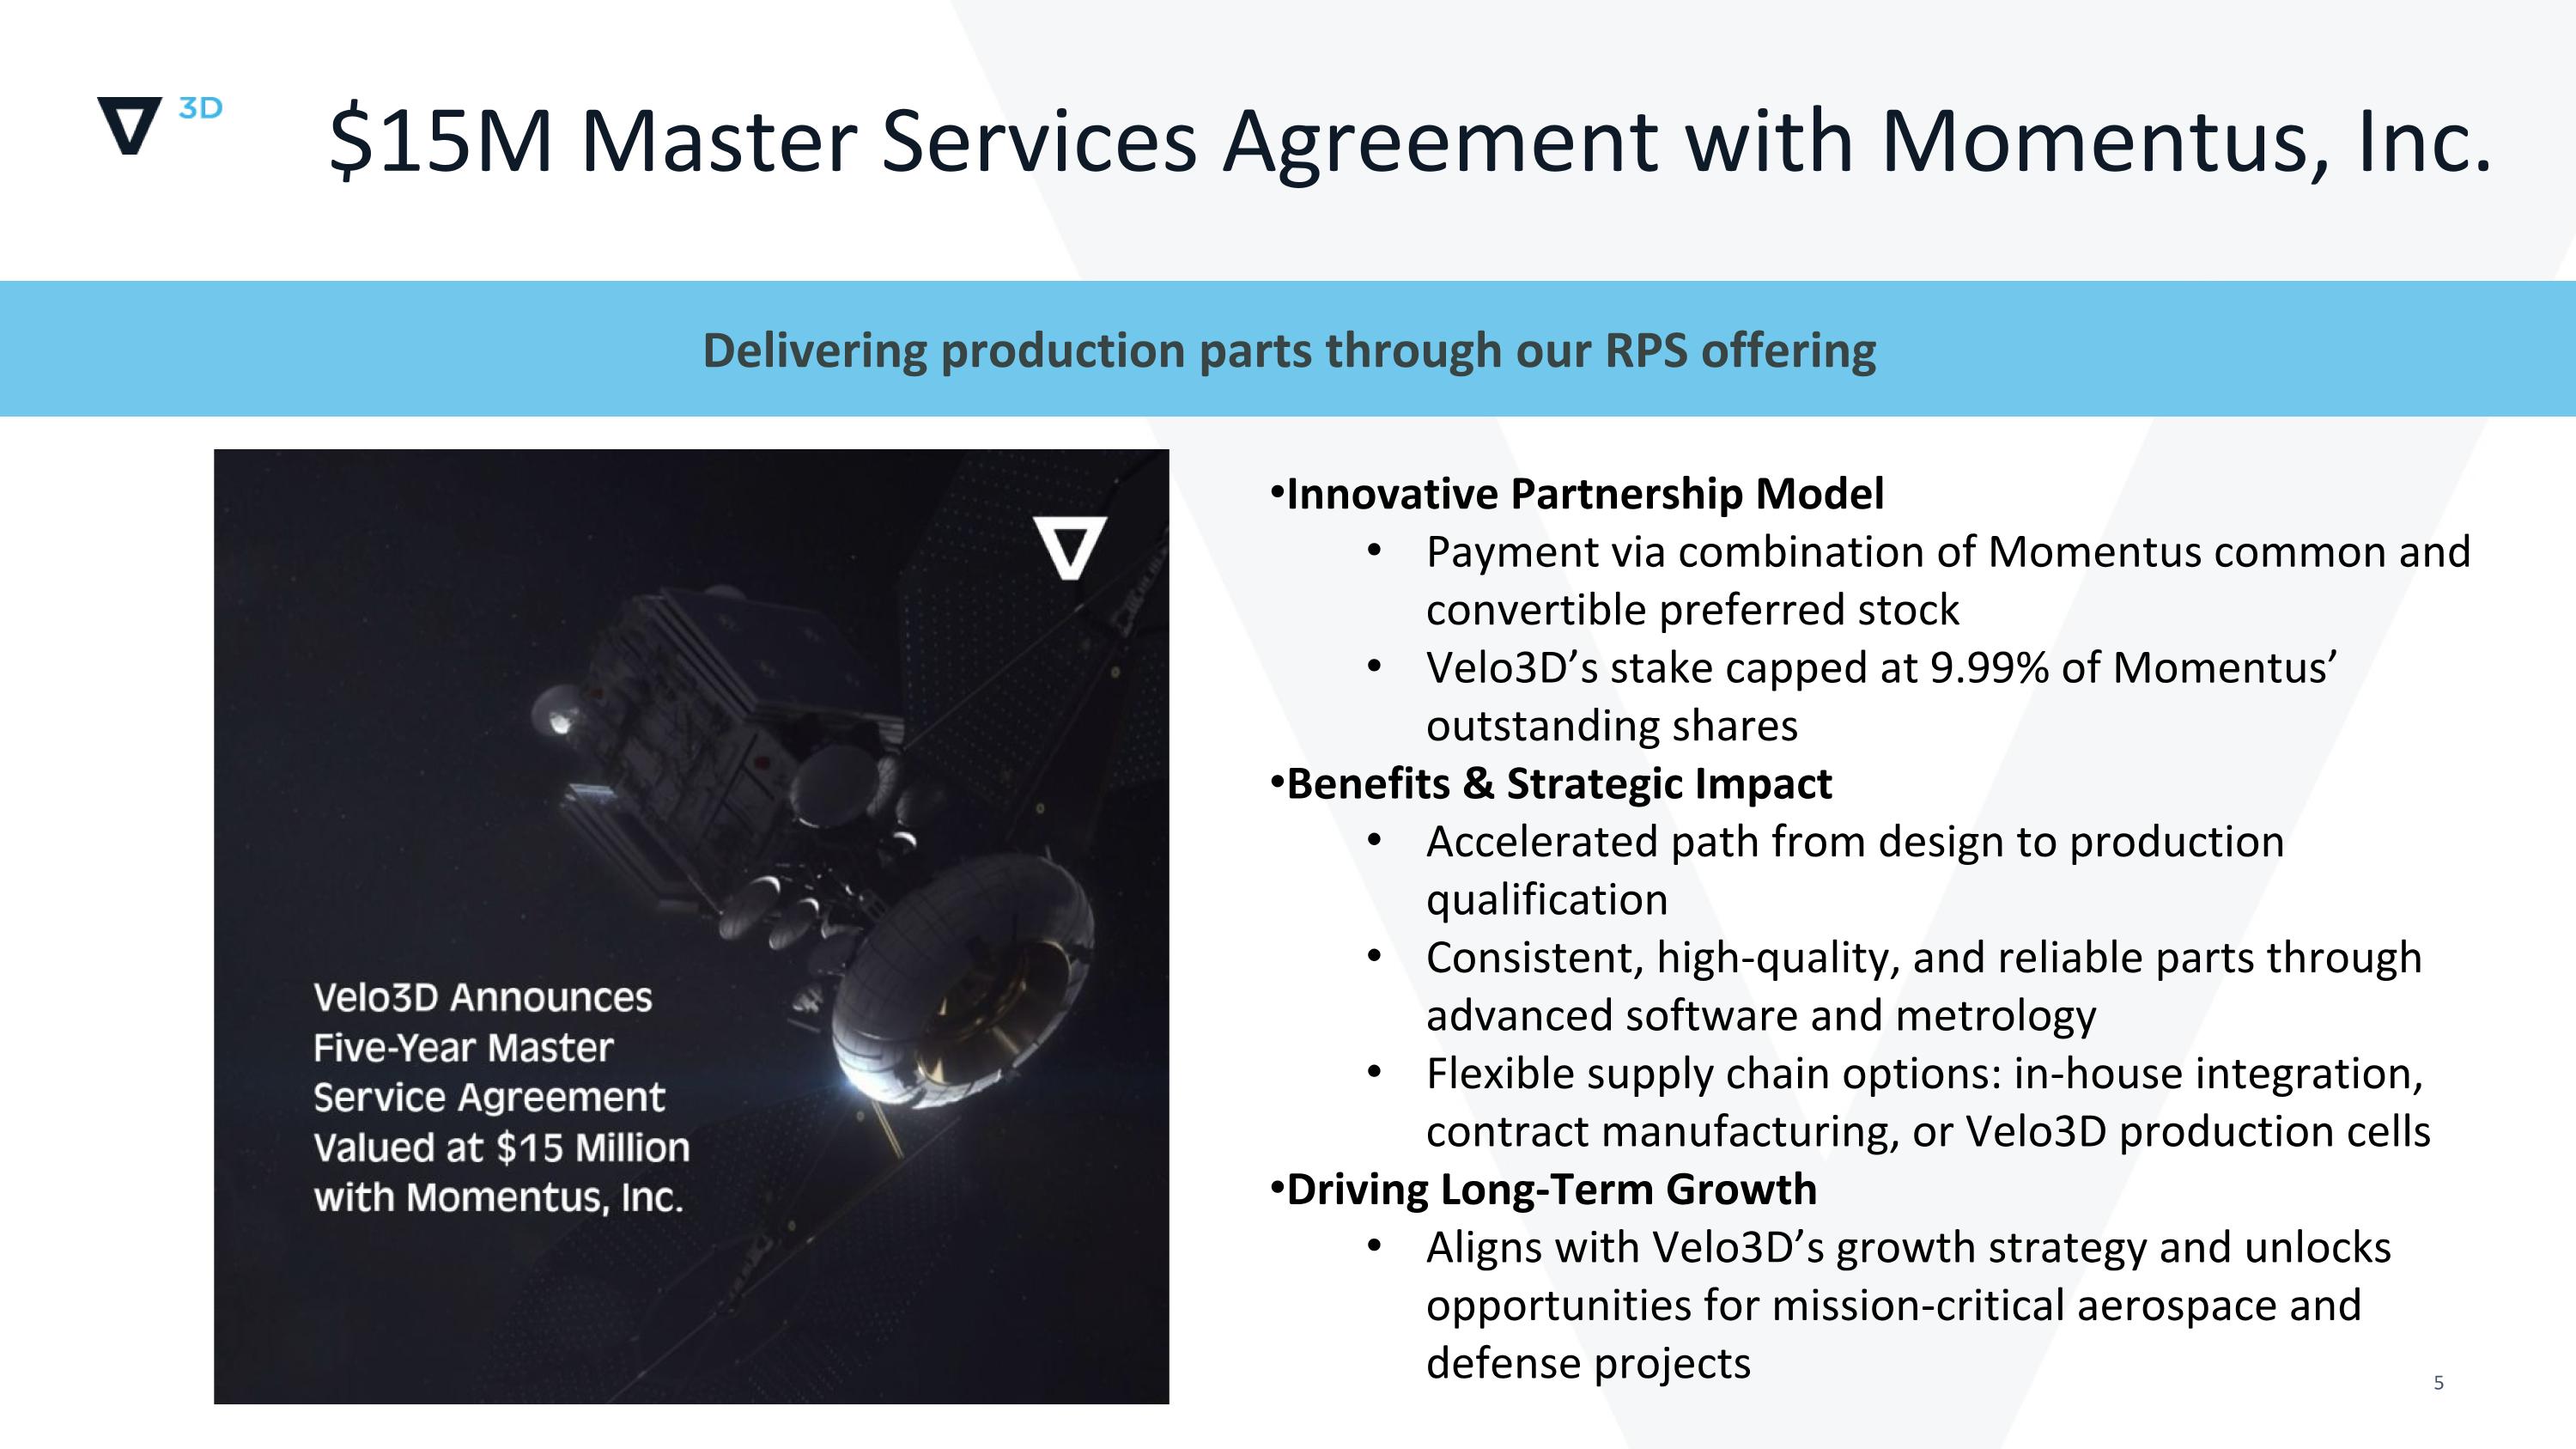
$15M Master Services Agreement with Momentus, Inc. Delivering production parts through our RPS offering Innovative Partnership Model Payment via combination of Momentus common and convertible preferred stock Velo3D’s stake capped at 9.99% of Momentus’ outstanding shares Benefits & Strategic Impact Accelerated path from design to production qualification Consistent, high-quality, and reliable parts through advanced software and metrology Flexible supply chain options: in-house integration, contract manufacturing, or Velo3D production cells Driving Long-Term Growth Aligns with Velo3D’s growth strategy and unlocks opportunities for mission-critical aerospace and defense projects
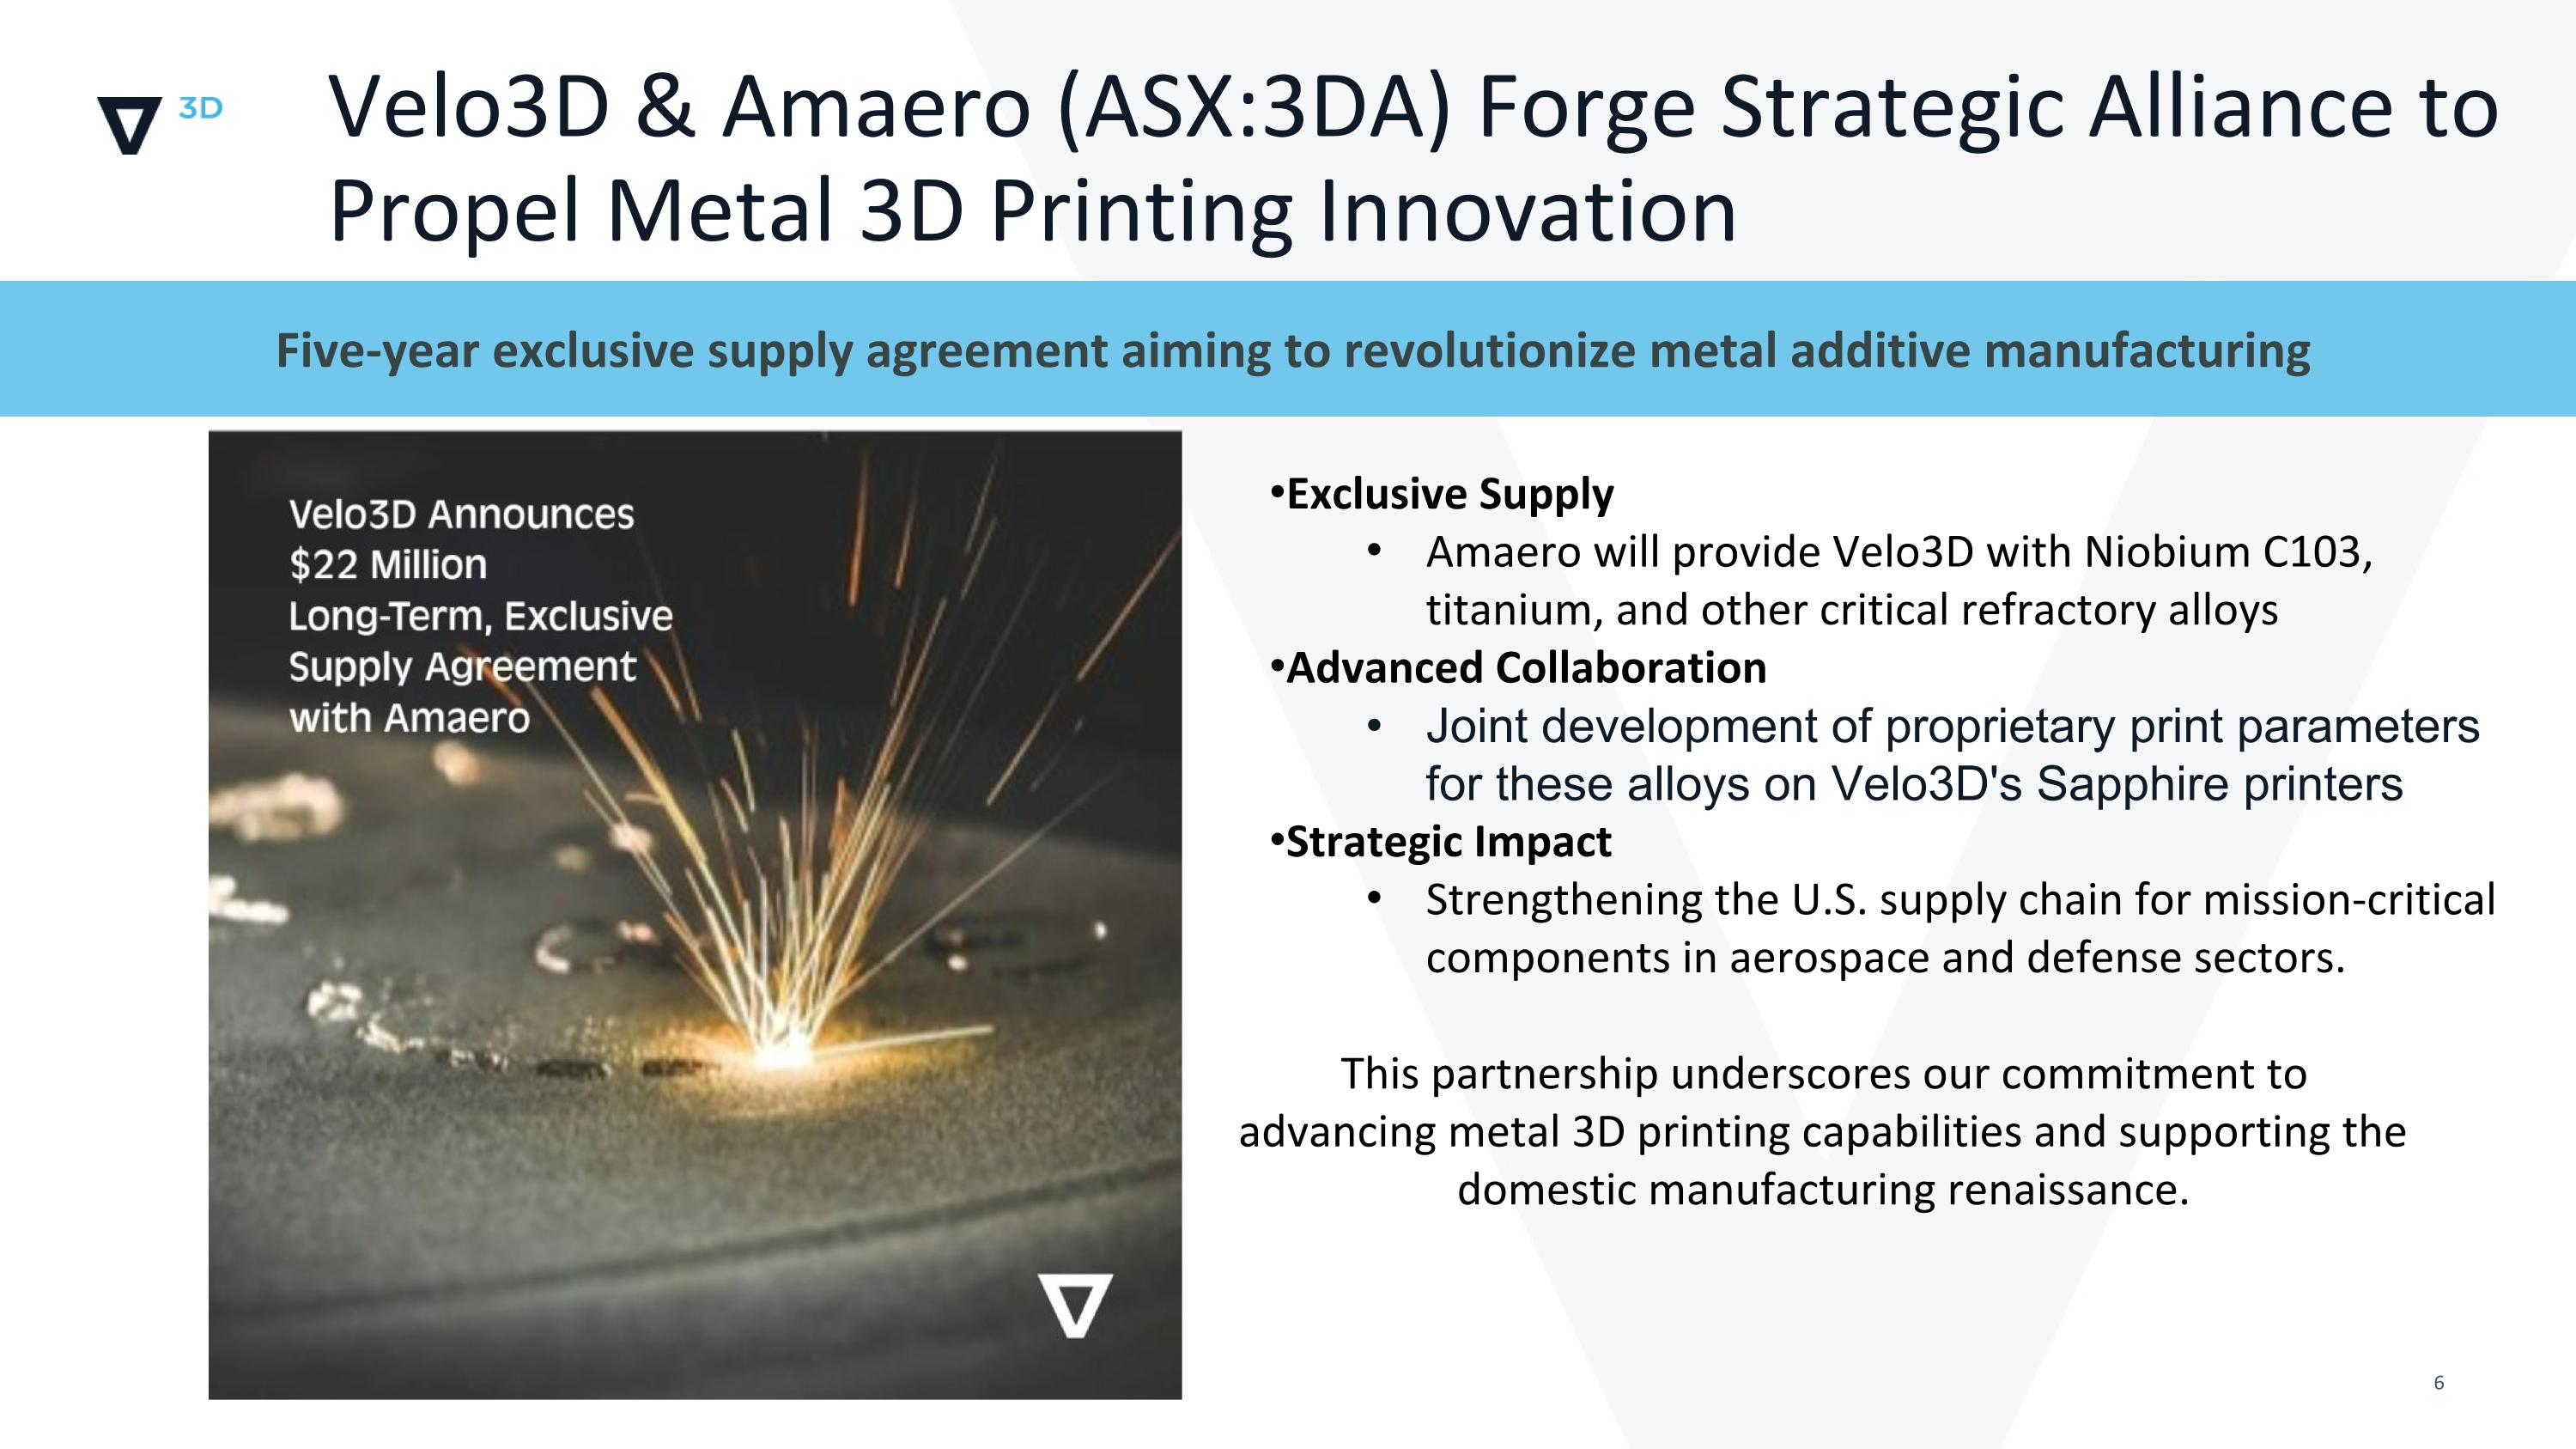
Velo3D & Amaero (ASX:3DA) Forge Strategic Alliance to Propel Metal 3D Printing Innovation Five-year exclusive supply agreement aiming to revolutionize metal additive manufacturing Exclusive Supply Amaero will provide Velo3D with Niobium C103, titanium, and other critical refractory alloys Advanced Collaboration Joint development of proprietary print parameters for these alloys on Velo3D's Sapphire printers Strategic Impact Strengthening the U.S. supply chain for mission-critical components in aerospace and defense sectors. This partnership underscores our commitment to advancing metal 3D printing capabilities and supporting the domestic manufacturing renaissance.
Velo3D Teams Up with Ohio Ordnance Works, Inc. for 3D Printed Military Weapons Velo3D to provide engineering and design services to optimize components in additive manufacturing Partnership Partnering with Ohio Ordnance Works to provide engineering, design, and analysis for their 3D Printed Military Weapons Development Project Goals Optimize weapon components for additive manufacturing, accelerating development and ensuring top-tier performance Scope Providing engineering, design and analysis expertise to help Ohio Ordnance Works optimize weapon components for additive manufacturing Impact of the Collaboration Partnership enables both companies to deliver high-performance, precision components to defense customers more quickly and efficiently
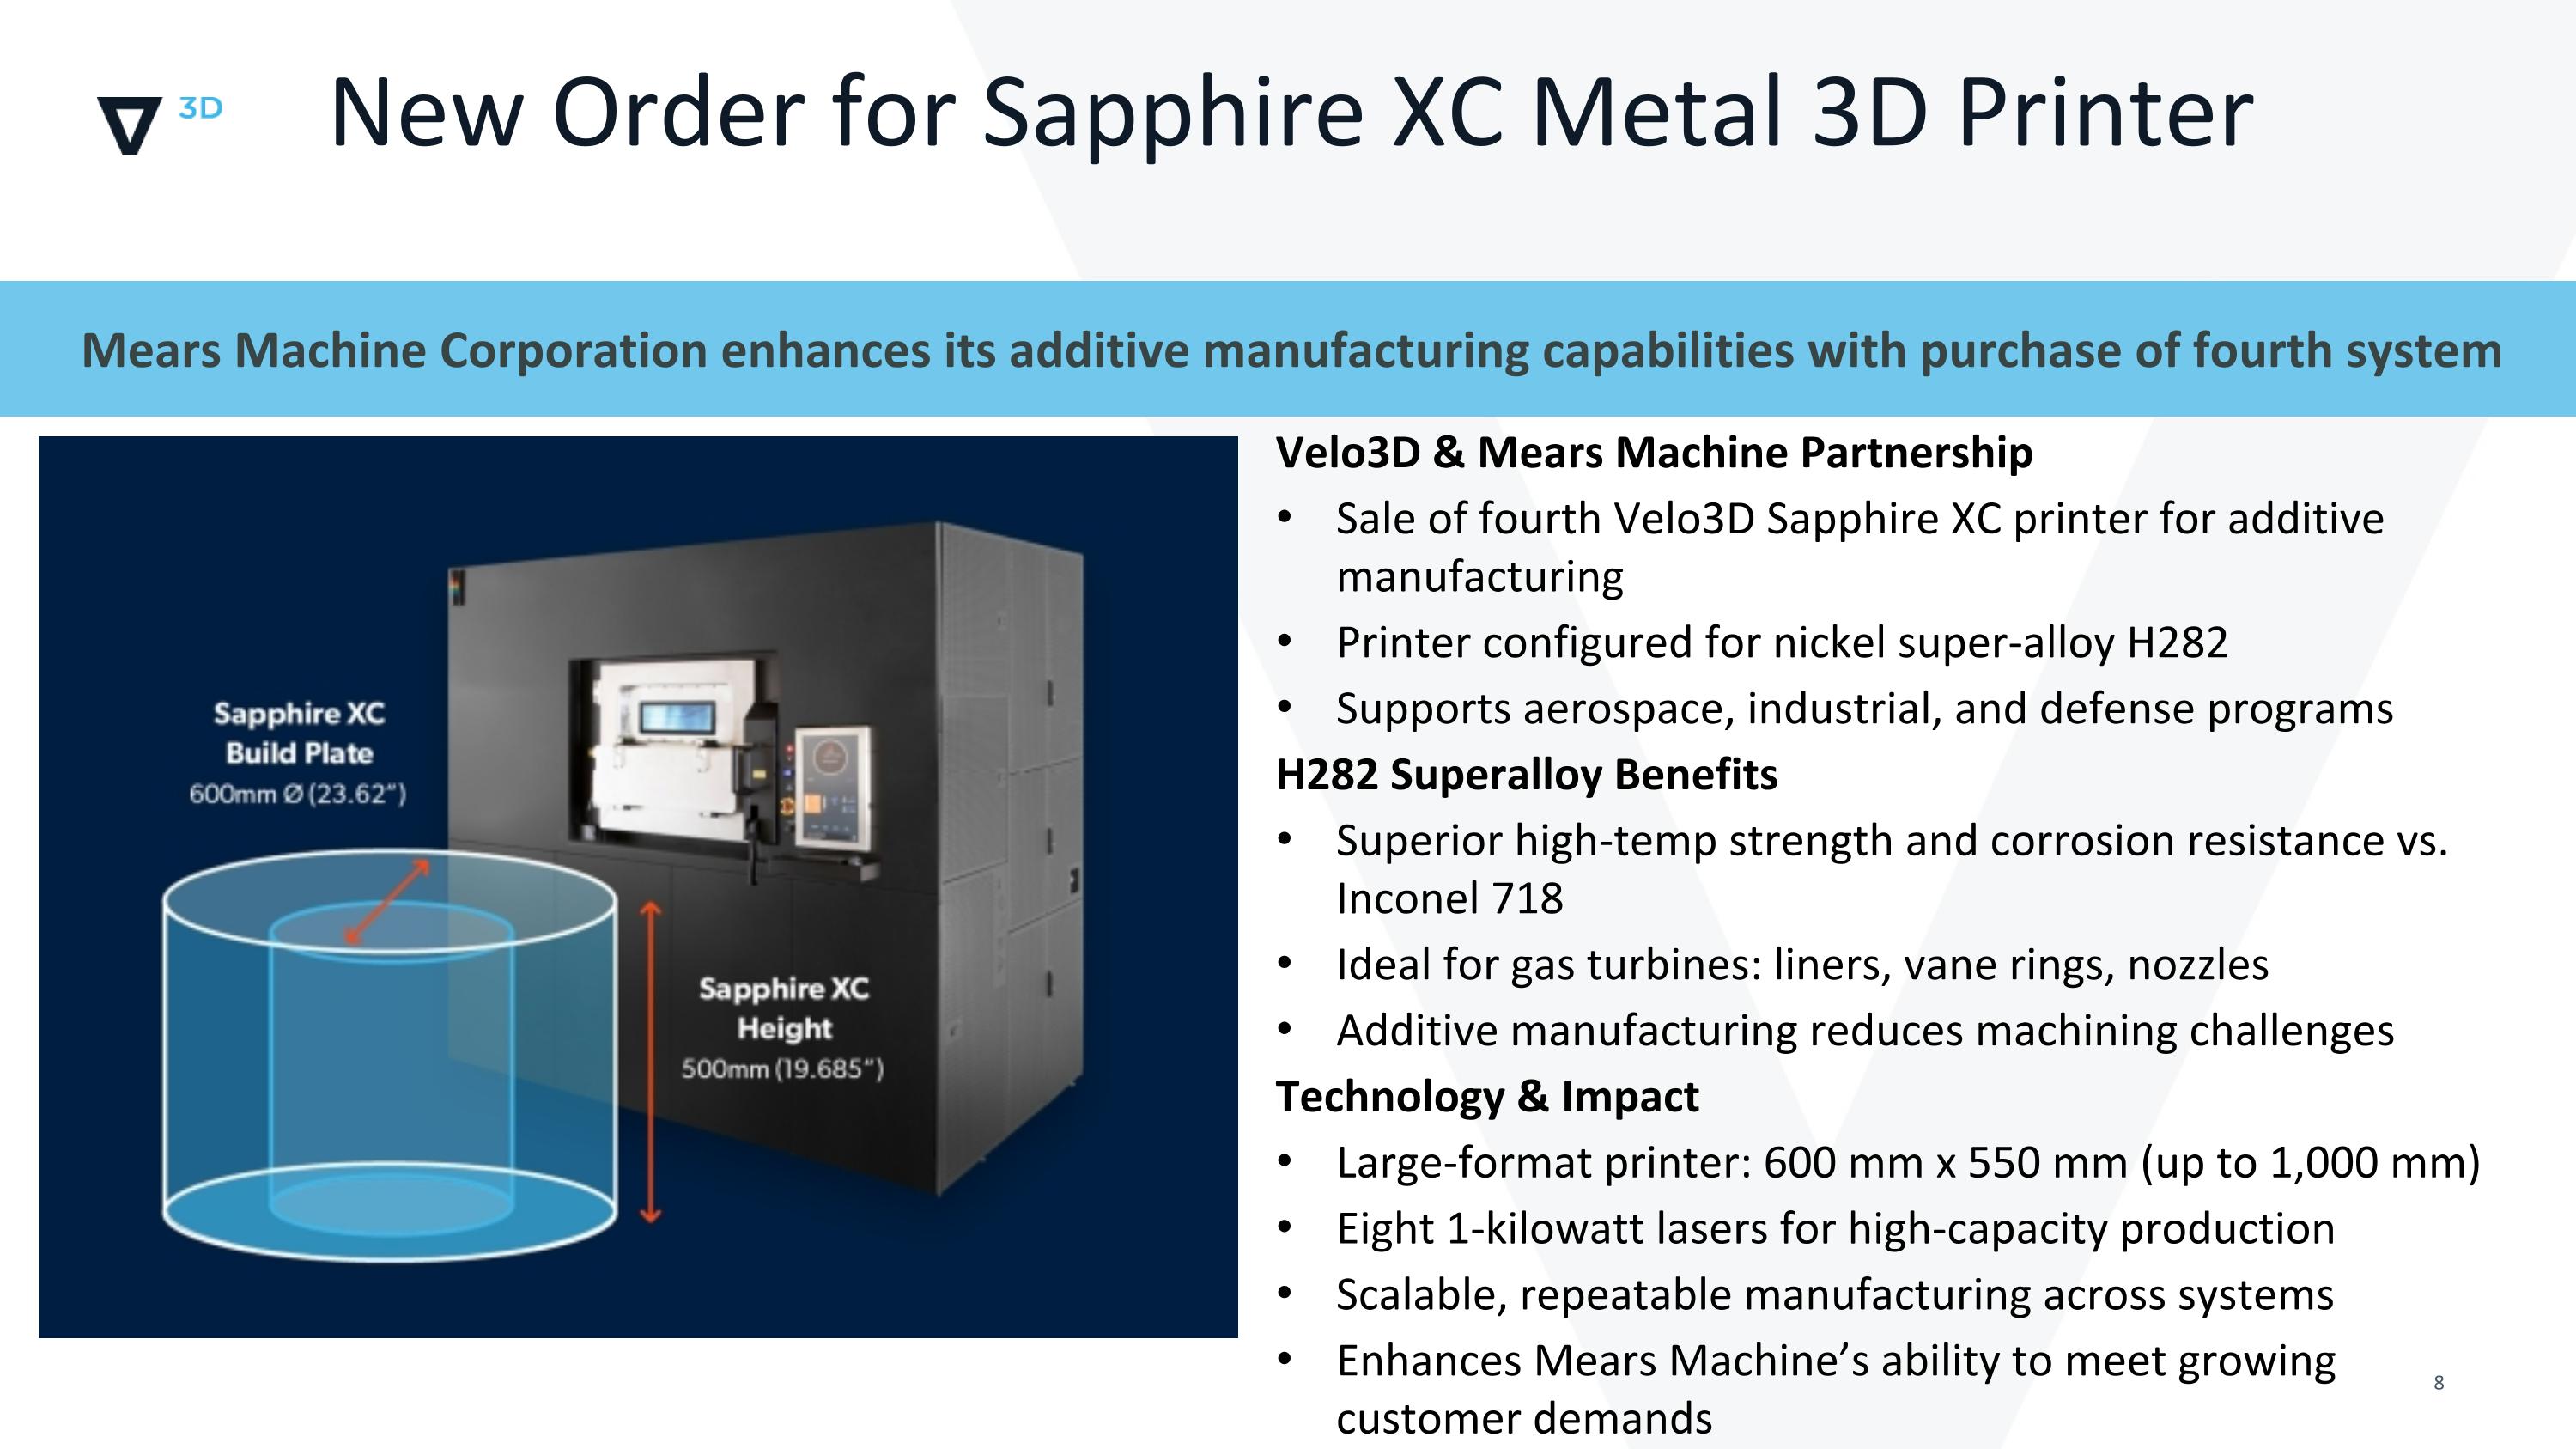
New Order for Sapphire XC Metal 3D Printer Mears Machine Corporation enhances its additive manufacturing capabilities with purchase of fourth system Velo3D & Mears Machine Partnership Sale of fourth Velo3D Sapphire XC printer for additive manufacturing Printer configured for nickel super-alloy H282 Supports aerospace, industrial, and defense programs H282 Superalloy Benefits Superior high-temp strength and corrosion resistance vs. Inconel 718 Ideal for gas turbines: liners, vane rings, nozzles Additive manufacturing reduces machining challenges Technology & Impact Large-format printer: 600 mm x 550 mm (up to 1,000 mm) Eight 1-kilowatt lasers for high-capacity production Scalable, repeatable manufacturing across systems Enhances Mears Machine’s ability to meet growing customer demands
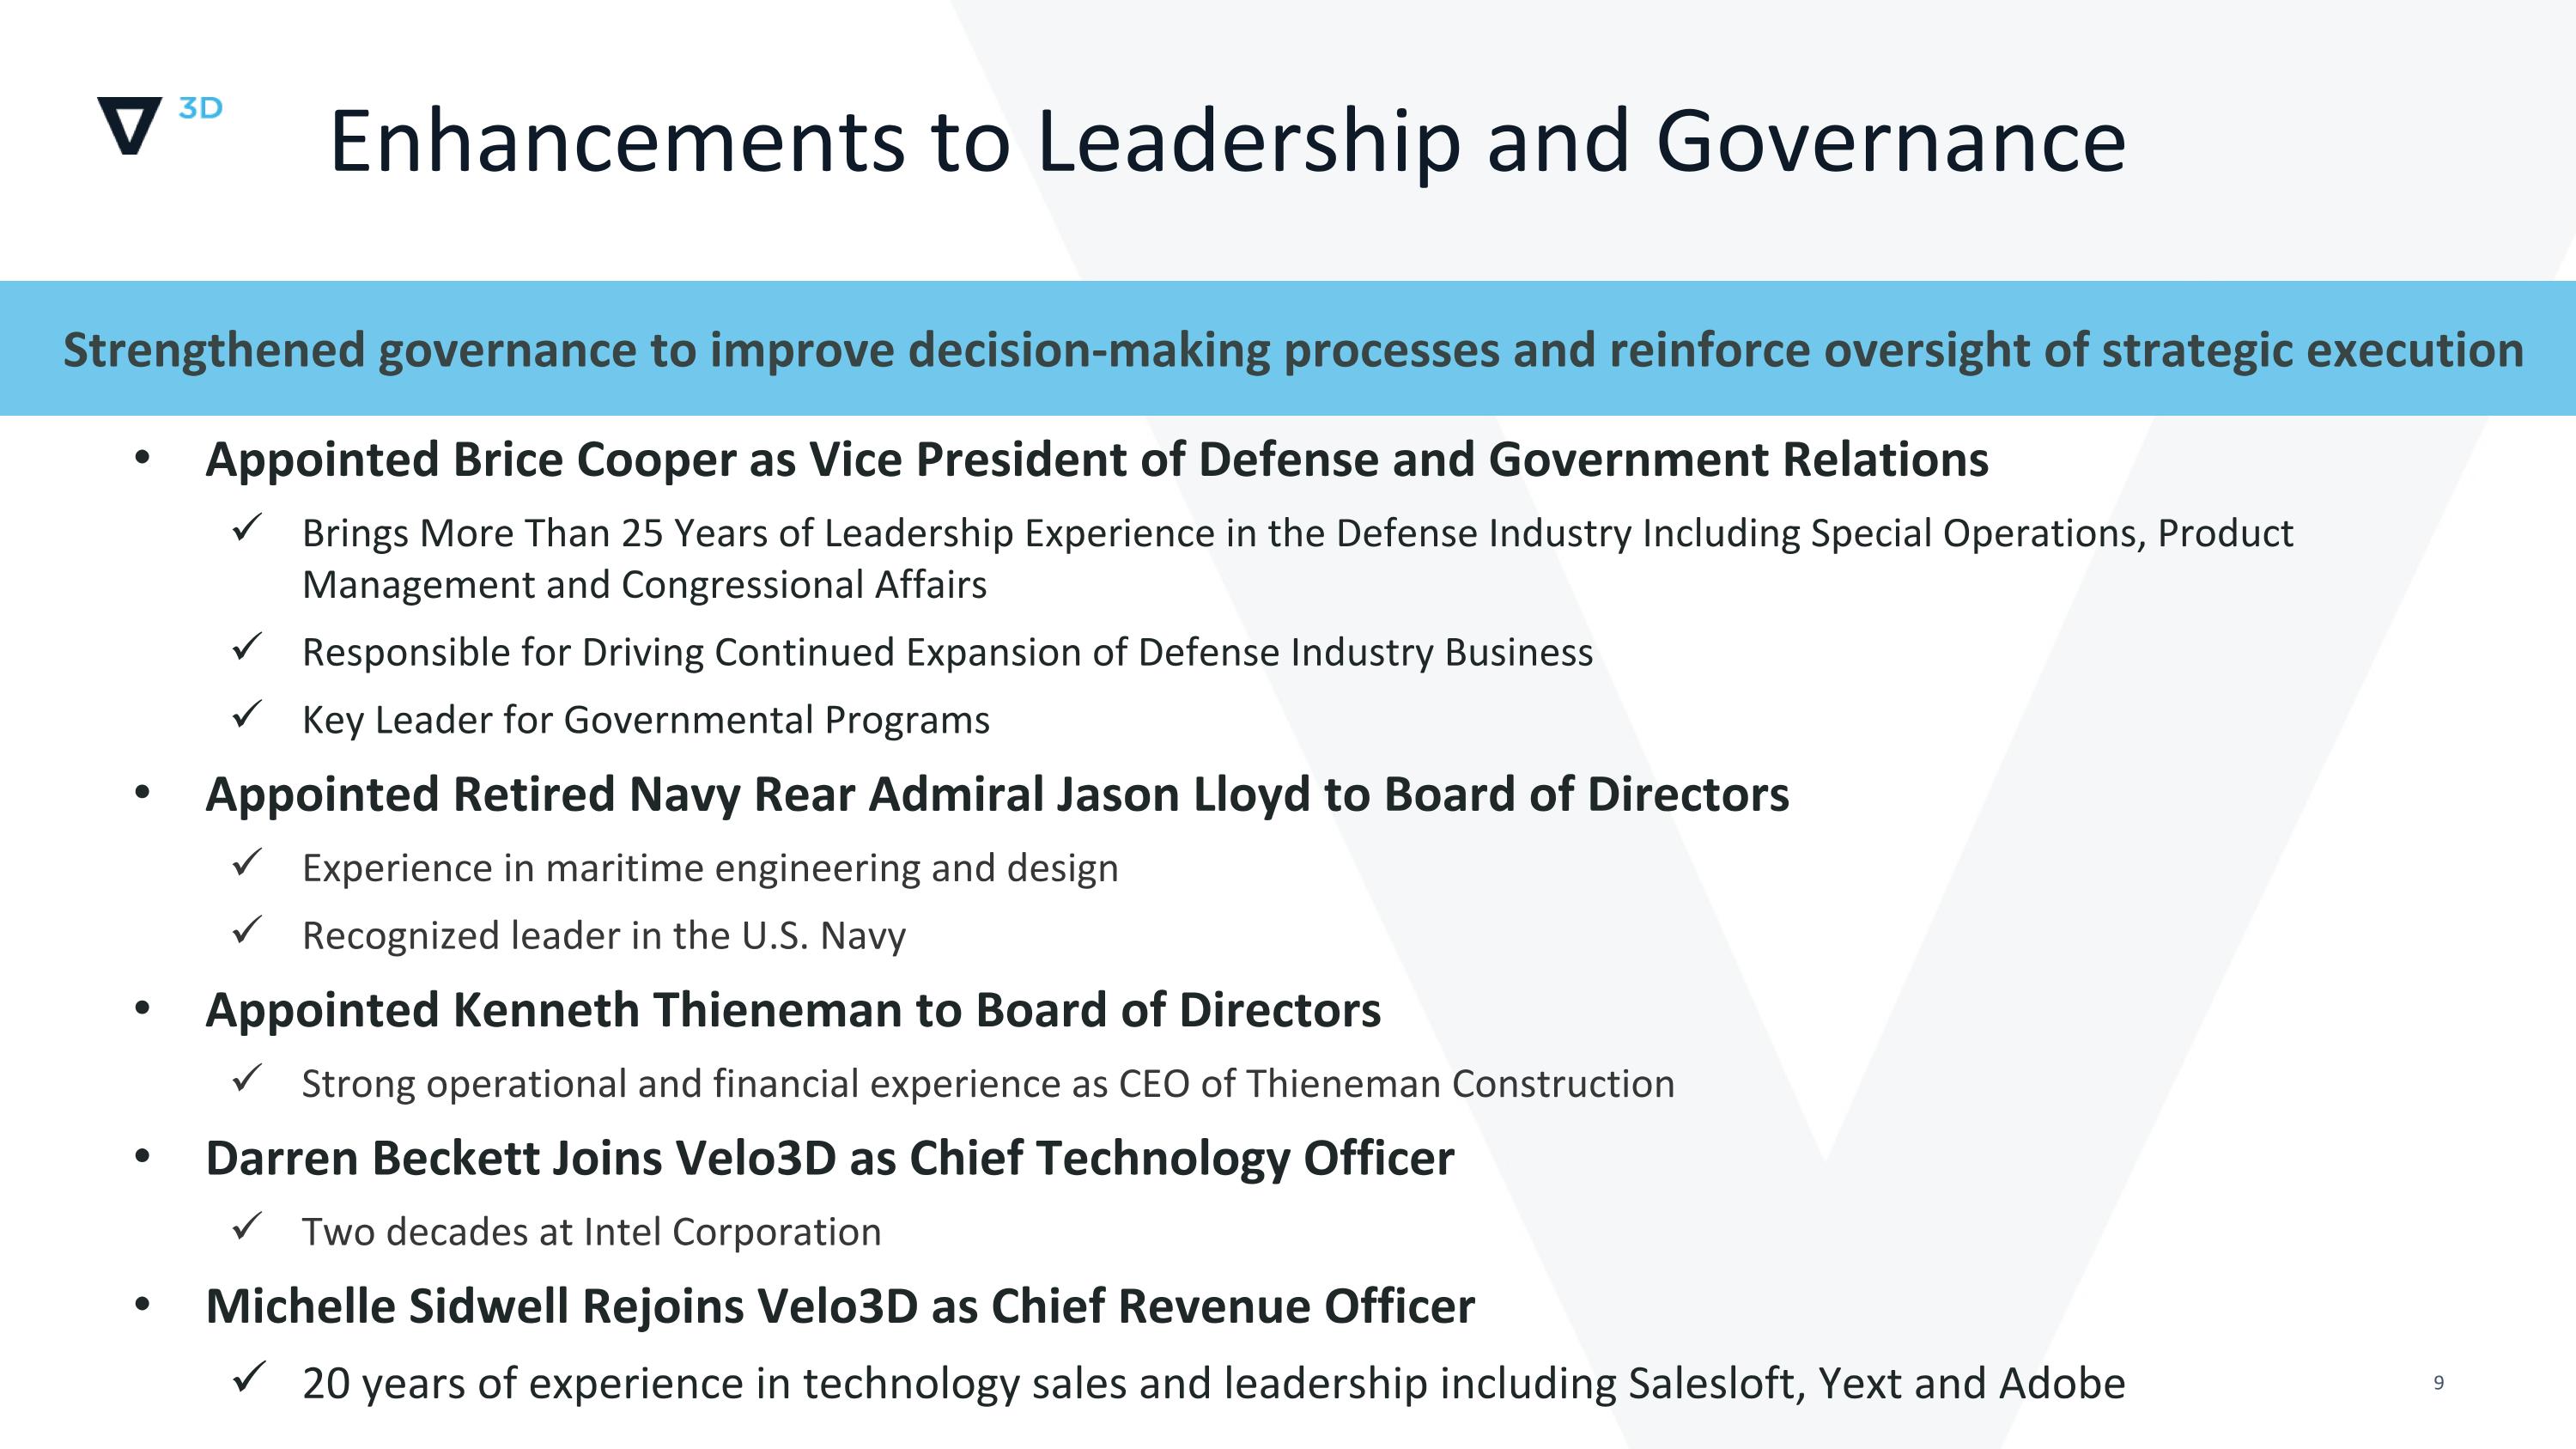
Strengthened governance to improve decision-making processes and reinforce oversight of strategic execution Enhancements to Leadership and Governance Appointed Brice Cooper as Vice President of Defense and Government Relations Brings More Than 25 Years of Leadership Experience in the Defense Industry Including Special Operations, Product Management and Congressional Affairs Responsible for Driving Continued Expansion of Defense Industry Business Key Leader for Governmental Programs Appointed Retired Navy Rear Admiral Jason Lloyd to Board of Directors Experience in maritime engineering and design Recognized leader in the U.S. Navy Appointed Kenneth Thieneman to Board of Directors Strong operational and financial experience as CEO of Thieneman Construction Darren Beckett Joins Velo3D as Chief Technology Officer Two decades at Intel Corporation Michelle Sidwell Rejoins Velo3D as Chief Revenue Officer 20 years of experience in technology sales and leadership including Salesloft, Yext and Adobe

Confidential & Proprietary | Financials Overview New
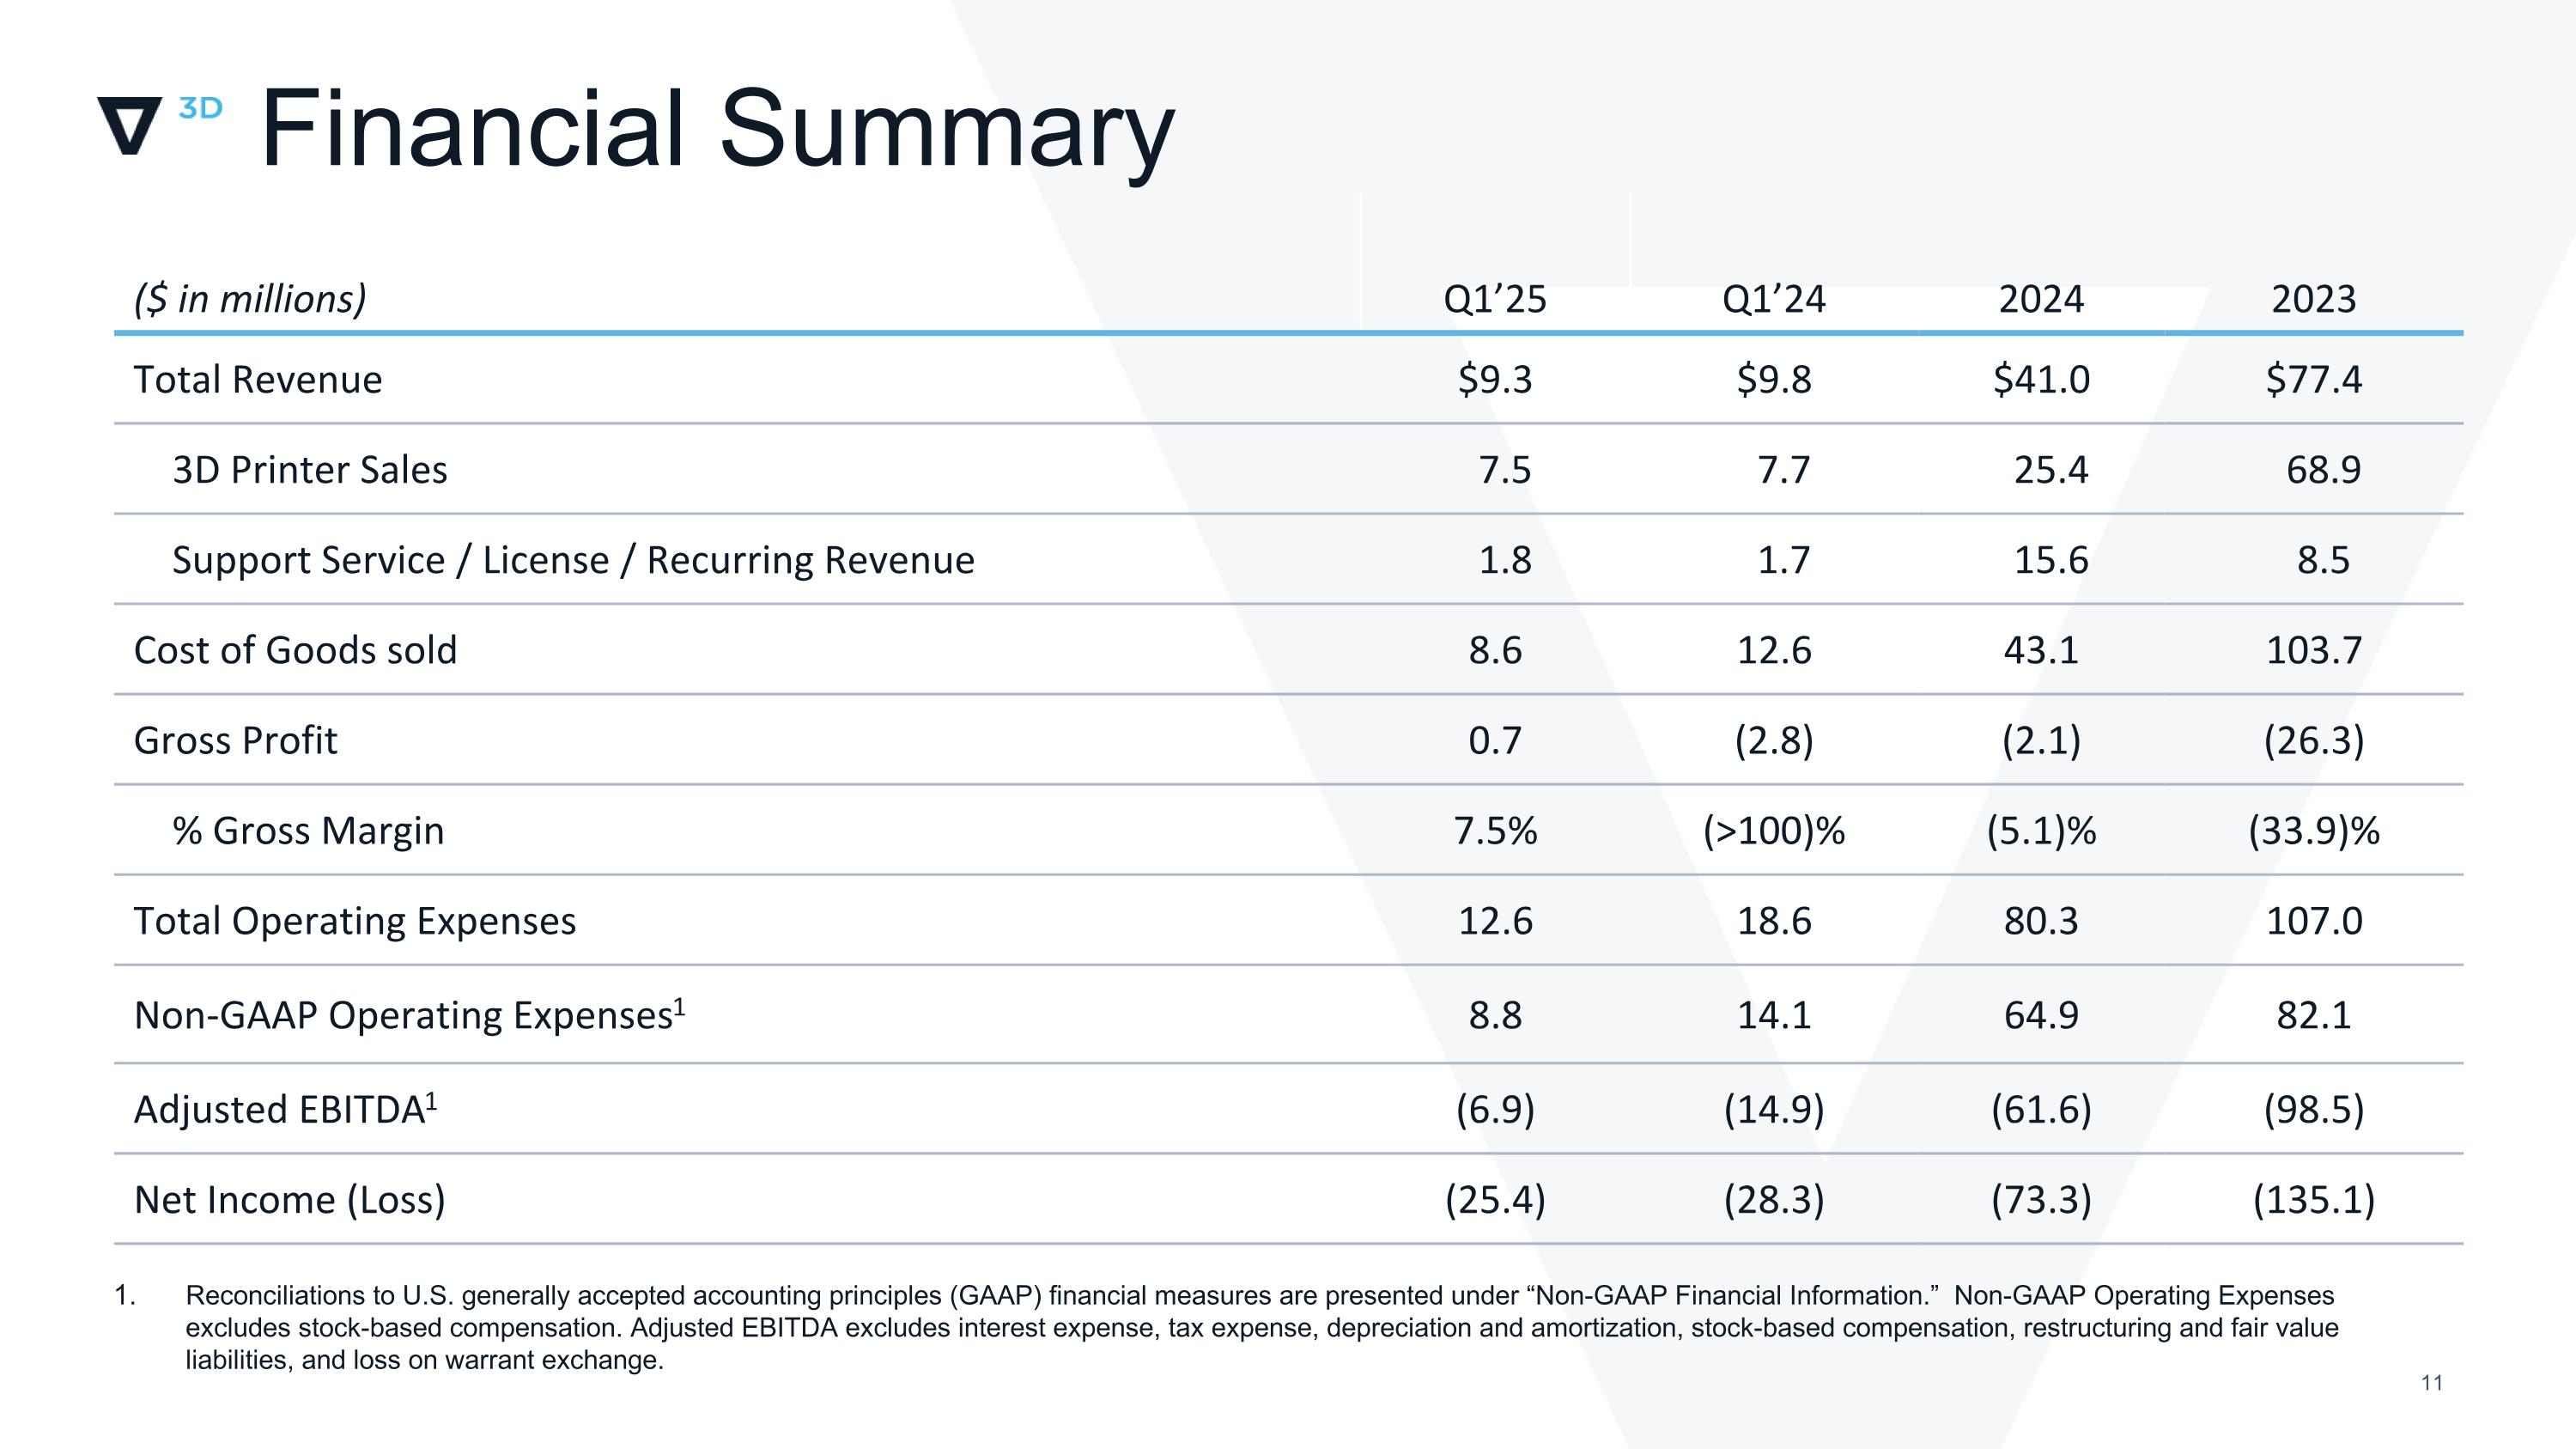
Financial Summary Reconciliations to U.S. generally accepted accounting principles (GAAP) financial measures are presented under “Non-GAAP Financial Information.” Non-GAAP Operating Expenses excludes stock-based compensation. Adjusted EBITDA excludes interest expense, tax expense, depreciation and amortization, stock-based compensation, restructuring and fair value liabilities, and loss on warrant exchange. ($ in millions) Q1’25 Q1’24 2024 2023 Total Revenue $9.3 $9.8 $41.0 $77.4 3D Printer Sales 7.5 7.7 25.4 68.9 Support Service / License / Recurring Revenue 1.8 1.7 15.6 8.5 Cost of Goods sold 8.6 12.6 43.1 103.7 Gross Profit 0.7 (2.8) (2.1) (26.3) % Gross Margin 7.5% (>100)% (5.1)% (33.9)% Total Operating Expenses 12.6 18.6 80.3 107.0 Non-GAAP Operating Expenses1 8.8 14.1 64.9 82.1 Adjusted EBITDA1 (6.9) (14.9) (61.6) (98.5) Net Income (Loss) (25.4) (28.3) (73.3) (135.1)
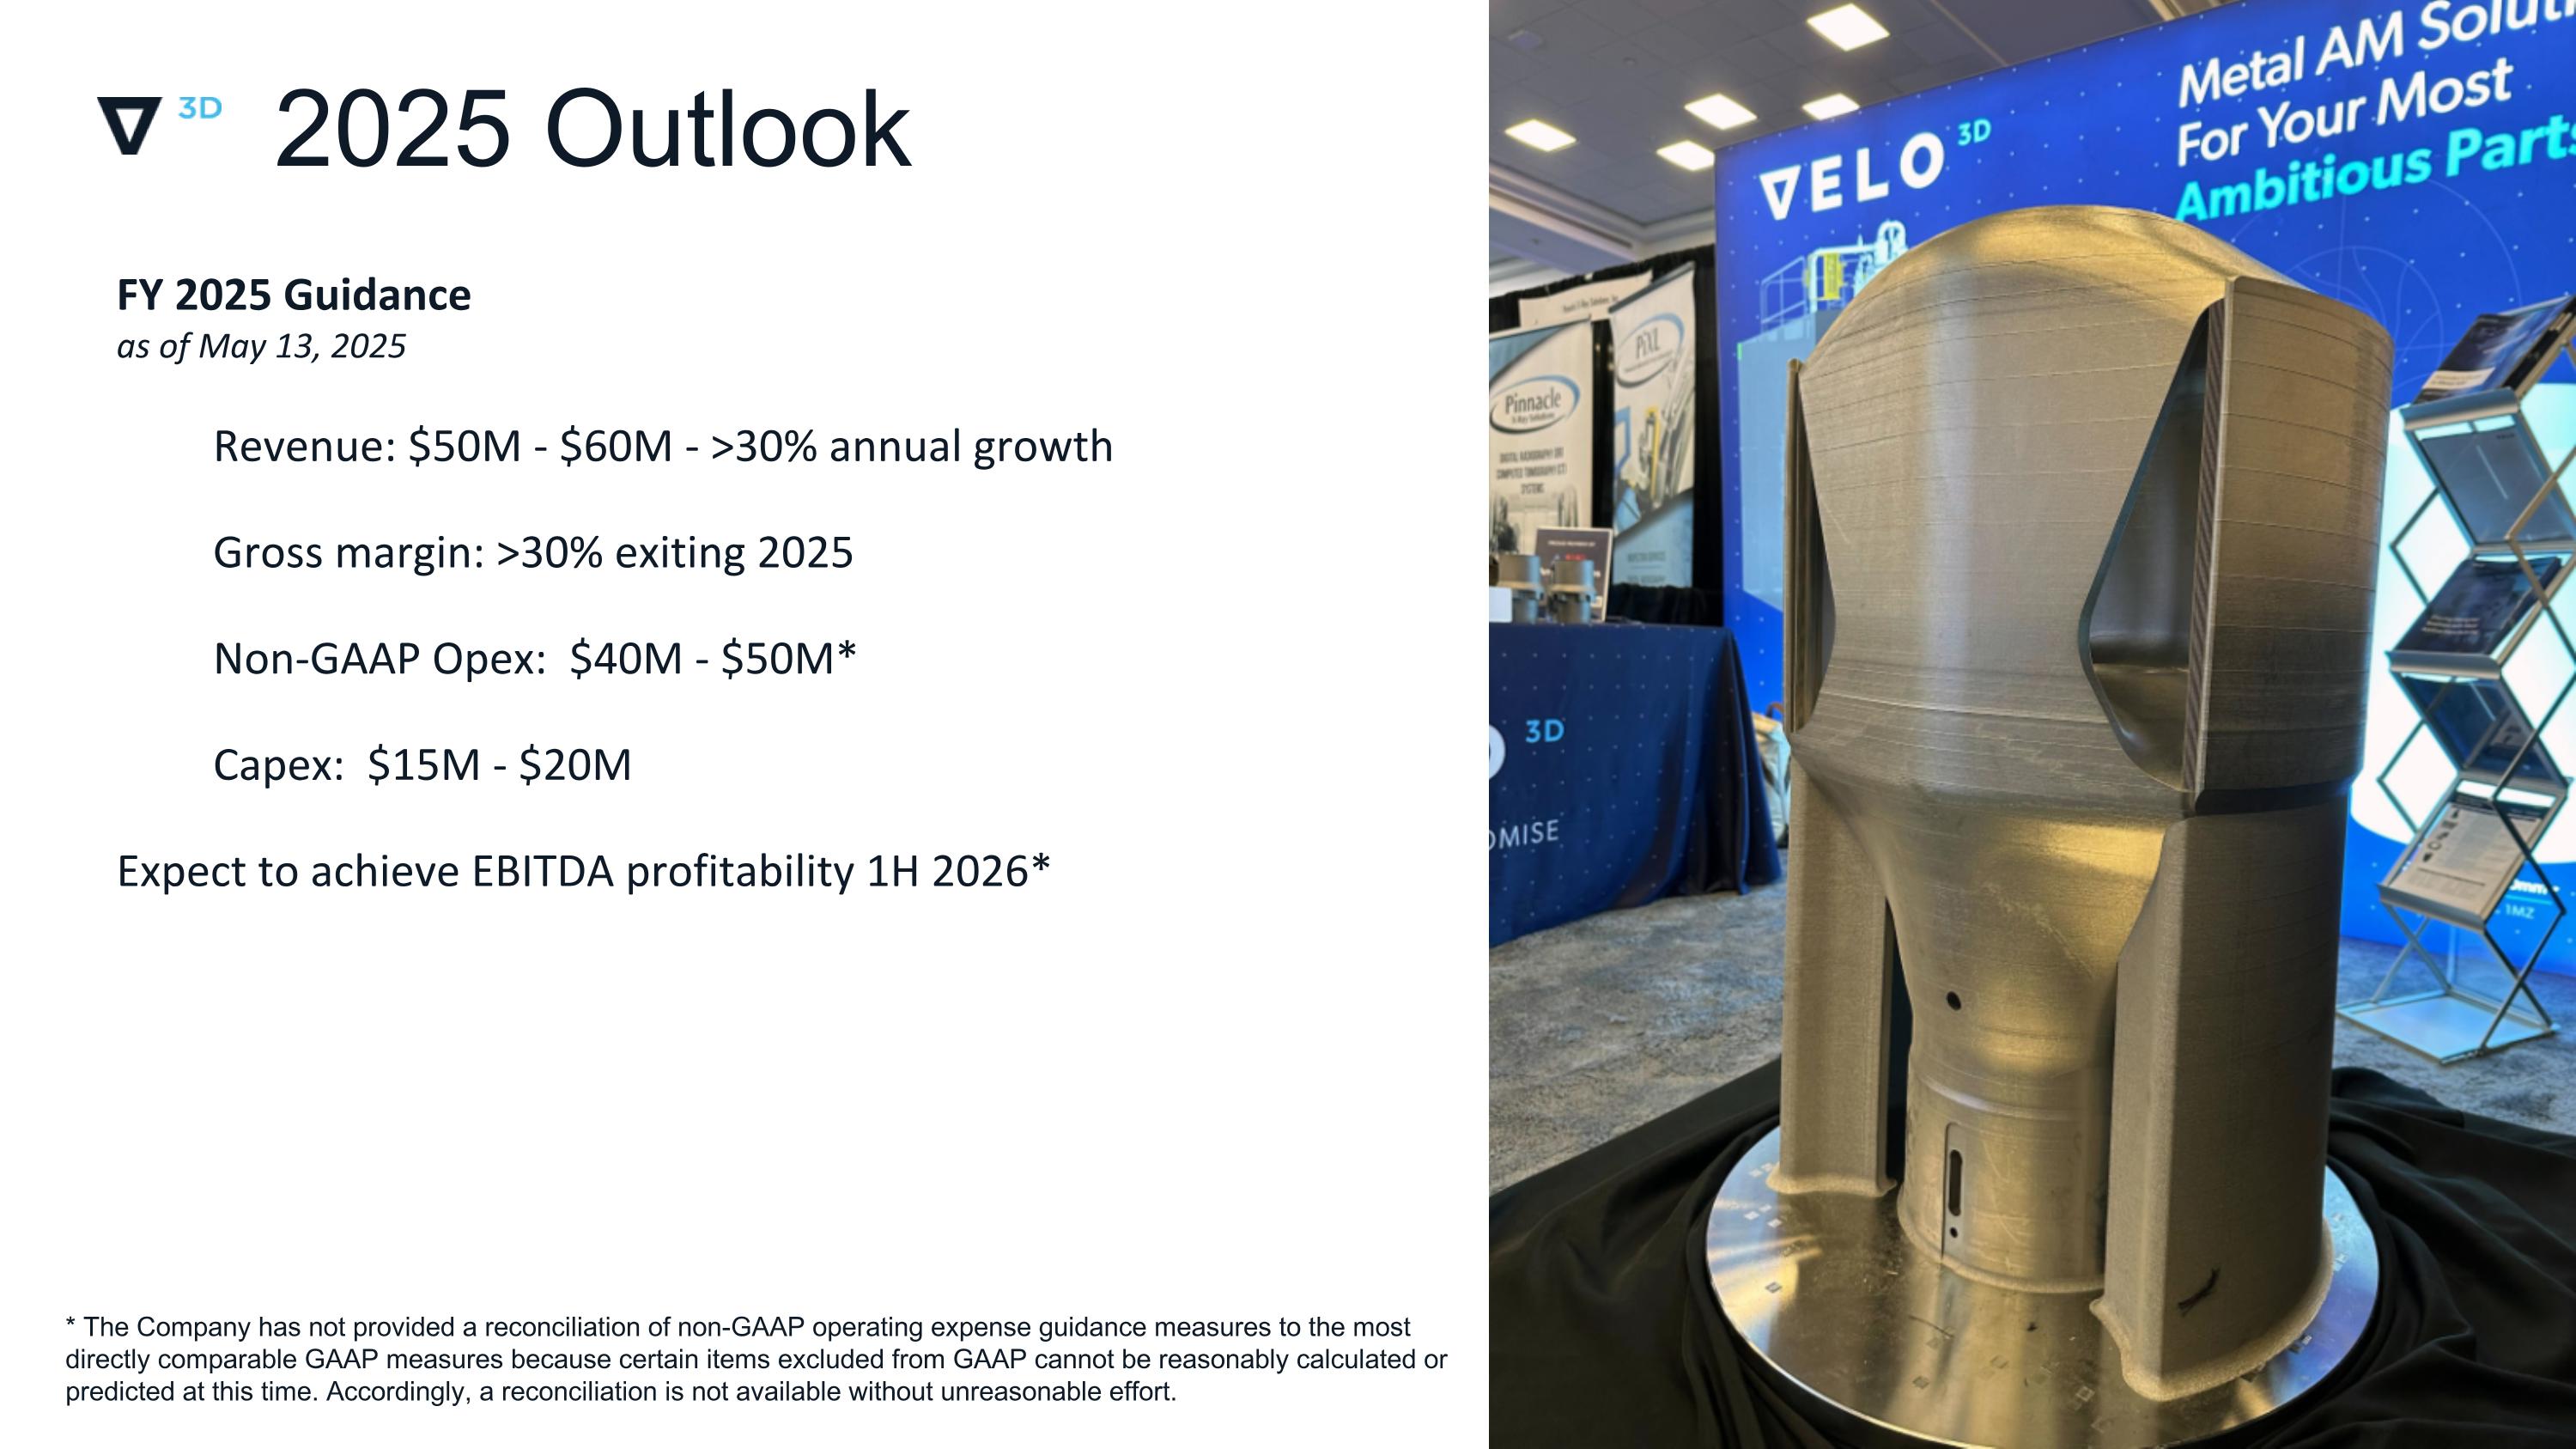
2023 Outlook * Q423 / FY 2023 gross margin ranges excludes impact from non-recurring charges 2025 Outlook FY 2025 Guidance as of May 13, 2025 Revenue: $50M - $60M - >30% annual growth Gross margin: >30% exiting 2025 Non-GAAP Opex: $40M - $50M* Capex: $15M - $20M Expect to achieve EBITDA profitability 1H 2026* * The Company has not provided a reconciliation of non-GAAP operating expense guidance measures to the most directly comparable GAAP measures because certain items excluded from GAAP cannot be reasonably calculated or predicted at this time. Accordingly, a reconciliation is not available without unreasonable effort.

Thank You!
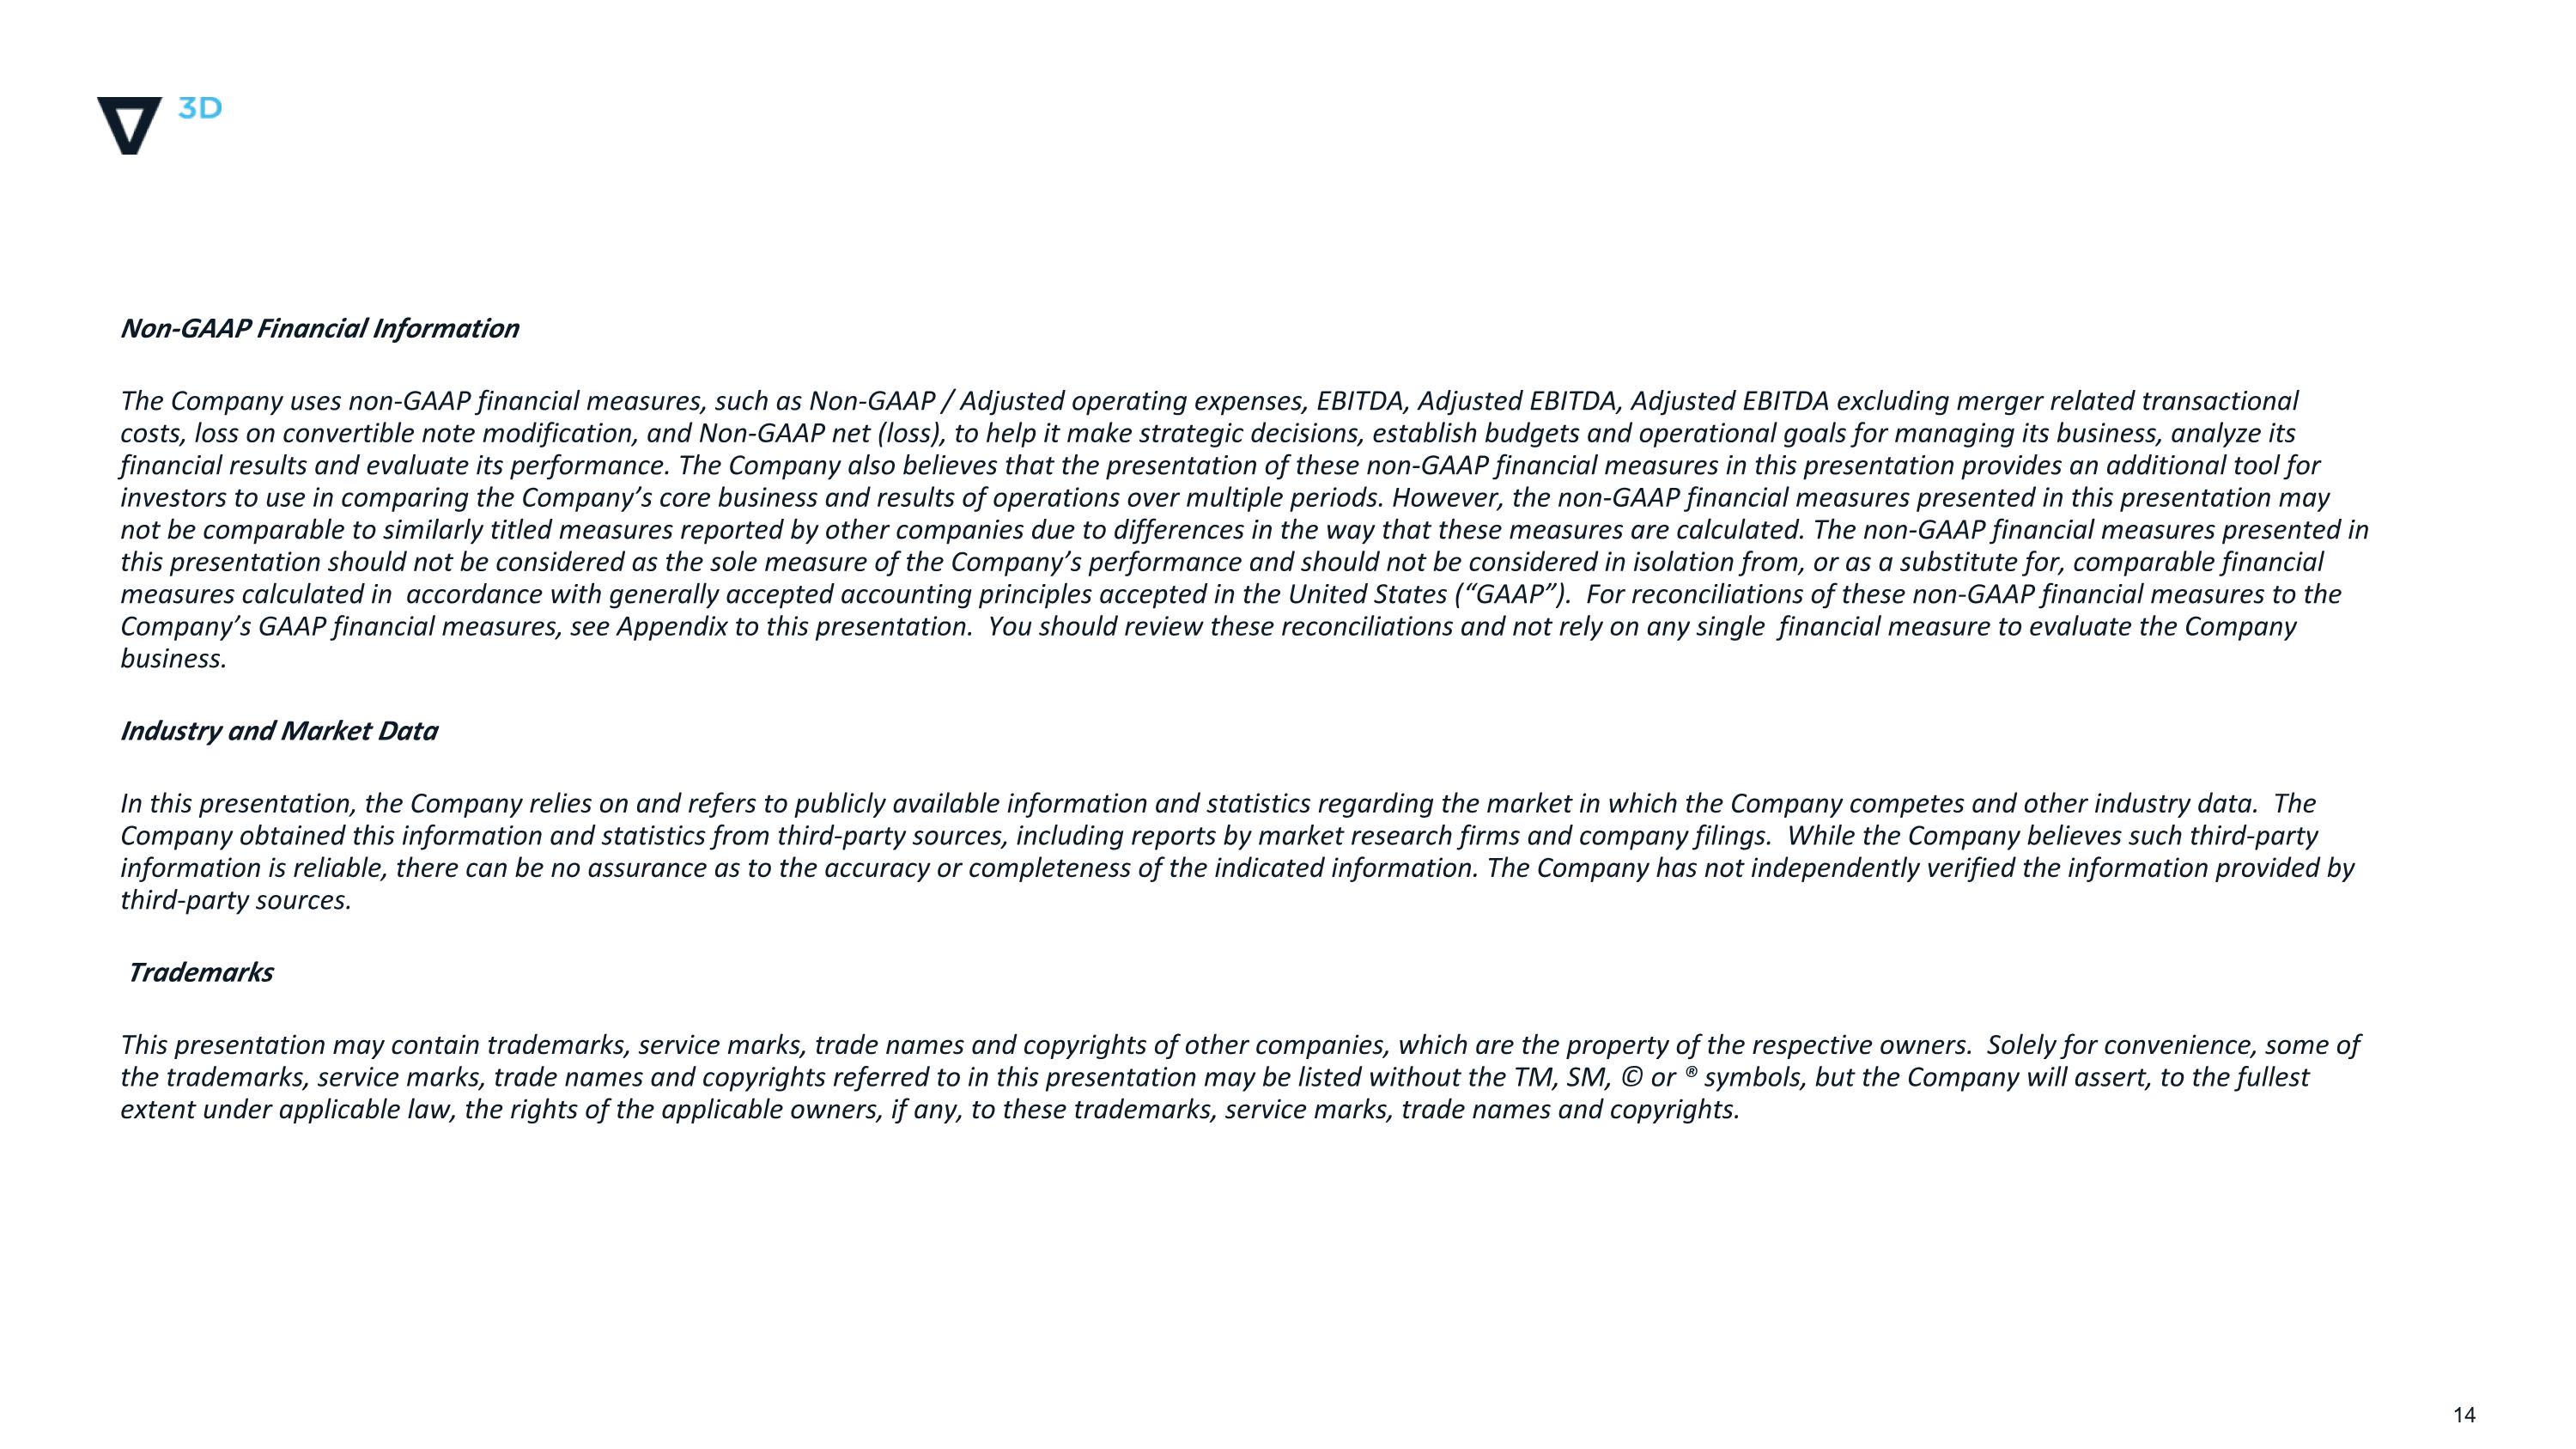
Disclaimer Non-GAAP Financial Information The Company uses non-GAAP financial measures, such as Non-GAAP / Adjusted operating expenses, EBITDA, Adjusted EBITDA, Adjusted EBITDA excluding merger related transactional costs, loss on convertible note modification, and Non-GAAP net (loss), to help it make strategic decisions, establish budgets and operational goals for managing its business, analyze its financial results and evaluate its performance. The Company also believes that the presentation of these non-GAAP financial measures in this presentation provides an additional tool for investors to use in comparing the Company’s core business and results of operations over multiple periods. However, the non-GAAP financial measures presented in this presentation may not be comparable to similarly titled measures reported by other companies due to differences in the way that these measures are calculated. The non-GAAP financial measures presented in this presentation should not be considered as the sole measure of the Company’s performance and should not be considered in isolation from, or as a substitute for, comparable financial measures calculated in accordance with generally accepted accounting principles accepted in the United States (“GAAP”). For reconciliations of these non-GAAP financial measures to the Company’s GAAP financial measures, see Appendix to this presentation. You should review these reconciliations and not rely on any single financial measure to evaluate the Company business. Industry and Market Data In this presentation, the Company relies on and refers to publicly available information and statistics regarding the market in which the Company competes and other industry data. The Company obtained this information and statistics from third-party sources, including reports by market research firms and company filings. While the Company believes such third-party information is reliable, there can be no assurance as to the accuracy or completeness of the indicated information. The Company has not independently verified the information provided by third-party sources. Trademarks This presentation may contain trademarks, service marks, trade names and copyrights of other companies, which are the property of the respective owners. Solely for convenience, some of the trademarks, service marks, trade names and copyrights referred to in this presentation may be listed without the TM, SM, © or ® symbols, but the Company will assert, to the fullest extent under applicable law, the rights of the applicable owners, if any, to these trademarks, service marks, trade names and copyrights.
Non-GAAP Reconciliation�- Non-GAAP Operating Expenses (Unaudited)
Non-GAAP Reconciliation - Adjusted EBITDA (Unaudited)
Non-GAAP Reconciliation - Non-GAAP Net Loss (Unaudited)