vmd-20250806
0001729149false00017291492025-08-062025-08-06

UNITED STATES SECURITIES AND EXCHANGE COMMISSION
WASHINGTON, D.C. 20549
FORM 8-K
CURRENT REPORT

Pursuant to Section 13 OR 15(d) of the Securities Exchange Act of 1934

Date of Report (Date of earliest event reported): August 6, 2025
 
Viemed Healthcare, Inc.
(Exact name of registrant as specified in its charter)
  
British Columbia, Canada
001-38973N/A
(State or other jurisdiction
of incorporation)
(Commission
File Number)
(I.R.S. Employer
Identification No.)
625 E. Kaliste Saloom Rd.
Lafayette, Louisiana
70508
(Address of principal executive offices)(Zip Code)
(337) 504-3802
(Registrant’s telephone number, including area code) 


(Former name or former address, if changed since last report)
 
Check the appropriate box below if the Form 8-K filing is intended to simultaneously satisfy the filing obligation of the registrant under any of the following provisions (see General Instruction A.2. below):
Written communications pursuant to Rule 425 under the Securities Act (17 CFR 230.425)
Soliciting material pursuant to Rule 14a-12 under the Exchange Act (17 CFR 240.14a-12)
Pre-commencement communications pursuant to Rule 14d-2(b) under the Exchange Act (17 CFR 240.14d-2(b))
Pre-commencement communications pursuant to Rule 13e-4(c) under the Exchange Act (17 CFR 240.13e-4(c))

Securities registered pursuant to Section 12(b) of the Act:
Title of each classTrading Symbol(s)Name of each exchange on which registered
Common shares, no par value
VMD
The Nasdaq Stock Market LLC

Indicate by check mark whether the registrant is an emerging growth company as defined in Rule 405 of the Securities Act of 1933 (17 CFR §230.405) or Rule 12b-2 of the Securities Exchange Act of 1934 (17 CFR §240.12b-2).
Emerging growth company

If an emerging growth company, indicate by check mark if the registrant has elected not to use the extended transition period for complying with any new or revised financial accounting standards provided pursuant to Section 13(a) of the Exchange Act.


Item 2.02.     Results of Operations and Financial Condition.

On August 6, 2025, Viemed Healthcare, Inc. (the "Company") issued a press release announcing its financial results for the three and six months ended June 30, 2025. The press release is attached hereto as Exhibit 99.1 and is incorporated herein by reference.

In addition, the Company issued a Financial Supplement with respect to its financial results for the three and six months ended June 30, 2025. The Financial Supplement is attached hereto as Exhibit 99.2 and is incorporated herein by reference.

In accordance with General Instruction B.2 of Form 8-K, the foregoing information, including Exhibits 99.1 and 99.2, shall not be deemed “filed” for the purposes of Section 18 of the Securities Exchange Act of 1934, as amended (the “Exchange Act”), or otherwise subject to the liabilities of that section, nor shall such information and Exhibits 99.1 and 99.2 be deemed incorporated by reference in any filing under the Securities Act of 1933, as amended, or the Exchange Act, except as shall be expressly set forth by specific reference in such a filing.

Item 9.01.    Financial Statements and Exhibits
(d)Exhibits
 
Exhibit
Number
Description
99.1    Press Release dated August 6, 2025.
99.2    Financial Supplement dated August 6, 2025.
104     Cover Page Interactive Data File, formatted in Inline XBRL and included as Exhibit 101


SIGNATURES
Pursuant to the requirements of the Securities Exchange Act of 1934, the registrant has duly caused this report to be signed on its behalf by the undersigned hereunto duly authorized.
Date: August 6, 2025
 
VIEMED HEALTHCARE, INC.
By:
/s/ Trae Fitzgerald
Trae Fitzgerald
Chief Financial Officer


VIEMED HEALTHCARE ANNOUNCES SECOND QUARTER 2025 FINANCIAL RESULTS

Lafayette, Louisiana (August 6, 2025) Viemed Healthcare, Inc. (the “Company” or “Viemed”) (NASDAQ:VMD), an in-home clinical care provider of post-acute respiratory healthcare equipment and services in the United States, announced today that it has reported its financial results for the three and six months ended June 30, 2025.

Operational highlights (all dollar amounts are USD; comparisons are to the period ended June 30, 2024 unless otherwise noted):

Net revenues for the quarter ended June 30, 2025 were $63.1 million, setting another Company record, representing an increase of $8.1 million, or 14.7%, over net revenues reported for the comparable quarter ended June 30, 2024.

Net income attributable to Viemed for the quarter ended June 30, 2025 totaled $3.2 million, or $0.08 per diluted share, an increase of 115.1% over net income attributable to Viemed of $1.5 million, or $0.04 per diluted share, for the quarter ended June 30, 2024.

Adjusted EBITDA for the quarter ended June 30, 2025 totaled $14.3 million, an 11.5% increase as compared to the quarter ended June 30, 2024. A reconciliation of reported non-GAAP financial measures to their most directly comparable U.S. GAAP financial measures can be found in the tables accompanying this press release.

During the second quarter of 2025, the Company repurchased and cancelled 270,061 common shares under its share repurchase program at a cost of $1.8 million, representing an average buyback price of $6.79 per share.

The Company increased its ventilator patient count to 12,152 as of June 30, 2025, an increase of 11.4% over June 30, 2024, and a 2.9% sequential increase from March 31, 2025.

The Company increased its PAP therapy patient count to 26,260 as of June 30, 2025, an increase of 51.4% over June 30, 2024, and a 14.7% sequential increase from March 31, 2025. The Company's sleep resupply patient count was 25,246 as of June 30, 2025, an increase of 25.1% over June 30, 2024, and a 10.0% sequential increase from March 31, 2025.

As of June 30, 2025, the Company maintains a strong cash balance of $20.0 million and an overall working capital balance of $18.0 million. Long term debt as of June 30, 2025 amounted to $3.5 million and the Company has $55 million available under existing credit facilities.

On July 1, 2025, Viemed closed on the previously announced acquisition of Lehan’s Medical Equipment (“Lehan”) for a base purchase price of $26 million, subject to customary adjustments, plus estimated contingent payments of $2.2 million. Financial results for Lehan will be included in the Company’s results beginning with the third quarter of 2025.


Updated Full Year 2025 Guidance (all dollar amounts are USD):

Net revenue for the year ending December 31, 2025 is expected to be in the range of $271 million to $277 million, increased from the prior range of $256 million to $265 million. The increase in the range is primarily related to the inclusion of Lehan’s anticipated results for the second half of 2025.

Adjusted EBITDA for the year ending December 31, 2025 is expected to be in the range of $59 million to $62 million, increased from the prior range of $55 million to $58 million. The increase in the range is primarily related to the inclusion of Lehan’s anticipated results for the second half of 2025. See “Forward-Looking Statements” below for further information on this non-GAAP financial guidance.


Casey Hoyt, Viemed’s CEO, noted, “Viemed’s focus as a company is on improving the quality of life for patients with compassionate care in the home. We are at the forefront of delivering greater patient satisfaction with better outcomes at a lower total cost of care, including in complex respiratory care and now women’s health driven by our acquisition of Lehan’s. During the past two years, we have significantly increased the patient populations we can address and invested in a technology-enabled clinical approach that extends the capabilities and impact of our certified Respiratory Therapists. Our model of care is rare in the industry, and we believe it will continue to serve us well in today’s rapidly evolving regulatory environment.

“The solid execution of our vent and sleep businesses – together with continued leveraging of expenses – produced second quarter results that met our expectations and kept us on track for our organic growth targets in 2025. The addition of Lehan’s enabled us to increase our full year revenue and Adjusted EBITDA guidance, and the early progress from our integration plans reinforces the confidence we have in accelerating their growth. The strong operating cash flow during the quarter continues to contribute to our rock-solid balance sheet. We have successfully deployed that capital into share repurchases and have remained active to date with that program in the third quarter.”

Conference Call Details

The Company will host a conference call to discuss second quarter results on Thursday, August 7, 2025, at 11:00 a.m. EDT.

Interested parties may participate in the call by dialing:

877-407-6176 (US Toll-Free)
+1 201-689-8451 (International)

Live Audio Webcast: https://event.choruscall.com/mediaframe/webcast.html?webcastid=4jnXGdPH

Following the conclusion of the call, an audio recording and transcript of the call can be accessed on the Company's website.

ABOUT VIEMED HEALTHCARE, INC.

Viemed is an in-home clinical care provider of post-acute respiratory healthcare equipment and services in the United States, including non-invasive ventilators (NIV), sleep therapy, staffing, and other complementary products and services. Viemed focuses on efficient and effective in-home treatment with clinical practitioners providing therapy, education and counseling to patients in their homes using high-touch and high-tech services. Visit our website at www.viemed.com.

For further information, please contact:

Investor Relations
[email protected]

SCR Partners, LLC
Tripp Sullivan or Lisa Kampf

Viemed Healthcare, Inc.
Trae Fitzgerald
Chief Financial Officer


Forward-Looking Statements

Certain statements contained in this press release may constitute “forward-looking statements” within the meaning of the U.S. Private Securities Litigation Reform Act of 1995 or “forward-looking information” as such term is defined in applicable Canadian securities legislation (collectively, “forward-looking statements”). Often, but not always, forward-looking statements can be identified by the use of words such as “plans”, “expects”, “is expected”, “budget”, “potential”, “scheduled”, “estimates”, “forecasts”, “intends”, “anticipates”, “believes”, “projects”, or the negatives thereof or variations of such words and phrases or statements that certain actions, events or results “will”, “should”, “may”, “could”, “would”, “might” or “will be taken”, “occur” or “be achieved” or the negative of these terms or comparable terminology. All statements other than statements of historical fact, including those that express, or involve discussions as to, expectations, beliefs, plans, objectives, assumptions or future events or performance, including the Company's net revenue and Adjusted EBITDA guidance for 2025, and the anticipated synergies and other benefits of the acquisition of Lehan's Medical Equipment, are not historical facts and may be forward-looking statements and may involve estimates, assumptions and uncertainties that could cause actual results or outcomes to differ materially from those expressed in the forward-looking statements. Such statements reflect the Company's current views and intentions with respect to future events, and current information available to the Company, and are subject to certain risks, uncertainties and assumptions. Many factors could cause the actual results, performance or achievements that may be expressed or implied by such forward-looking statements to vary from those described herein should one or more of these risks or uncertainties materialize. These factors include, without limitation: the general business, market and economic conditions in the regions in which the we operate; significant capital requirements and operating risks that we may be subject to; our ability to implement business strategies and pursue business opportunities; volatility in the market price of our common shares; the state of the capital markets; the availability of funds and resources to pursue operations; inflation; reductions in reimbursement rates and audits of reimbursement claims by various governmental and private payor entities; dependence on few payors; possible new drug discoveries; dependence on key suppliers; granting of permits and licenses in a highly regulated business; competition; disruptions in or attacks (including cyber-attacks) on our information technology, internet, network access or other voice or data communications systems or services; the evolution of various types of fraud or other criminal behavior to which we are exposed; difficulty integrating newly acquired businesses; the impact of new and changes to, or application of, current laws and regulations; the overall difficult litigation and regulatory environment; increased competition; increased funding costs and market volatility due to market illiquidity and competition for funding; critical accounting estimates and changes to accounting standards, policies, and methods used by us; and the occurrence of natural and unnatural catastrophic events or health epidemics or concerns, and claims resulting from such events or concerns, as well as other general economic, market and business conditions; and other factors beyond our control; as well as those risk factors discussed or referred to in the Company’s disclosure documents filed with the U.S. Securities and Exchange Commission (the “SEC”) available on the SEC’s website at www.sec.gov, including the Company’s most recent Annual Report on Form 10-K and Quarterly Report on Form 10-Q, and with the securities regulatory authorities in certain provinces of Canada available at www.sedar.com. Should any factor affect the Company in an unexpected manner, or should assumptions underlying the forward-looking statements prove incorrect, the actual results or events may differ materially from the results or events predicted. Any such forward-looking statements are expressly qualified in their entirety by this cautionary statement. Moreover, the Company does not assume responsibility for the accuracy or completeness of such forward-looking statements. The forward-looking statements included in this press release are made as of the date of this press release and the Company undertakes no obligation to publicly update or revise any forward-looking statements, other than as required by applicable law.

This press release contains non-GAAP financial guidance. There is no reliable or reasonably estimable comparable GAAP measure for the Company’s non-GAAP financial guidance because the Company is not able to reliably predict the impact of certain items that typically have one or more of the following characteristics: highly variable, difficult to project, unusual in nature, significant to the results of a particular period or not indicative of future operating results. Similar charges or gains were recognized in prior periods and will likely reoccur in future periods. As a result, reconciliation of the non-GAAP financial guidance to the most directly comparable GAAP measure is not available without unreasonable effort. In addition, the Company believes such a reconciliation would imply a degree of precision and certainty that could be confusing to investors. The variability of the specified items may have a significant and unpredictable impact on the Company’s future GAAP results.

The Company’s financial guidance in this press release excludes the impact of potential future strategic acquisitions and any items that have not yet been identified or quantified. This guidance is subject to risks and uncertainties inherent in all forward-looking statements, as outlined above.


VIEMED HEALTHCARE, INC.
CONDENSED CONSOLIDATED BALANCE SHEETS
(Expressed in thousands of U.S. Dollars, except share amounts)
(Unaudited)
At
June 30, 2025
At
December 31, 2024
ASSETS
Current assets
Cash and cash equivalents$20,016 $17,540 
Accounts receivable, net26,549 24,911 
Inventory4,324 4,320 
Prepaid expenses and other assets4,402 6,109 
Total current assets$55,291 $52,880 
Long-term assets
Property and equipment, net79,735 76,279 
Finance lease right-of-use assets13 50 
Operating lease right-of-use assets2,639 2,831 
Equity investments2,794 2,794 
Deferred tax asset10,359 8,398 
Identifiable intangibles, net783 848 
Goodwill32,989 32,989 
Total long-term assets$129,312 $124,189 
TOTAL ASSETS$184,603 $177,069 
LIABILITIES
Current liabilities
Trade payables$8,253 $5,322 
Deferred revenue7,193 6,694 
Income taxes payable1,450 3,883 
Accrued liabilities18,644 20,157 
Finance lease liabilities, current portion15 50 
Operating lease liabilities, current portion 895 811 
Current portion of long-term debt820 409 
Total current liabilities$37,270 $37,326 
Long-term liabilities
Accrued liabilities549 846 
Operating lease liabilities, less current portion1,695 2,007 
Long-term debt3,465 3,589 
Total long-term liabilities$5,709 $6,442 
TOTAL LIABILITIES$42,979 $43,768 
Commitments and Contingencies— — 
SHAREHOLDERS' EQUITY
Common stock - No par value: unlimited authorized; 39,605,005 and 39,132,897 issued and outstanding as of June 30, 2025 and December 31, 2024, respectively
27,787 23,365 
Additional paid-in capital18,102 18,337 
Retained earnings93,842 89,691 
TOTAL VIEMED HEALTHCARE, INC.'S SHAREHOLDERS' EQUITY$139,731 $131,393 
Noncontrolling interest in subsidiary
1,893 1,908 
TOTAL SHAREHOLDERS' EQUITY 141,624 133,301 
TOTAL LIABILITIES AND SHAREHOLDERS' EQUITY$184,603 $177,069 


VIEMED HEALTHCARE, INC.
CONDENSED CONSOLIDATED STATEMENTS OF INCOME
(Expressed in thousands of U.S. Dollars, except outstanding shares and per share amounts)
(Unaudited)
Three Months Ended June 30,Six Months Ended June 30,
2025202420252024
Revenue$63,056 $54,965 $122,185 $105,558 
Cost of revenue26,325 22,073 52,175 42,864 
Gross profit$36,731 $32,892 $70,010 $62,694 
Operating expenses
Selling, general and administrative28,803 26,503 57,228 51,317 
Research and development847 758 1,644 1,508 
Stock-based compensation2,341 1,620 4,652 3,052 
Depreciation and amortization
353 377 701 792 
Gain on disposal of property and equipment
(636)(545)(3,004)(332)
     Other expense (income), net
(72)563 (147)537 
Income from operations$5,095 $3,616 $8,936 $5,820 
Non-operating income and expenses
Loss on investments
— (1,117)— (1,050)
Interest expense, net
(132)(254)(311)(404)
Net income before taxes4,963 2,245 8,625 4,366 
Provision for income taxes1,713 768 2,665 1,286 
Net income$3,250 $1,477 $5,960 $3,080 
Net income attributable to noncontrolling interest
93 178 
Net income attributable to Viemed Healthcare, Inc.
$3,157 $1,468 $5,782 $3,071 
Net income per share
Basic$0.08 $0.04 $0.15 $0.08 
Diluted$0.08 $0.04 $0.14 $0.08 
Weighted average number of common shares outstanding:
Basic 39,515,247 38,822,980 39,471,244 38,558,479 
Diluted41,083,760 40,553,449 41,393,523 40,313,042 


VIEMED HEALTHCARE, INC.
CONDENSED CONSOLIDATED STATEMENTS OF CASH FLOWS
(Expressed in thousands of U.S. Dollars)
(Unaudited)
Six Months Ended June 30,
20252024
Cash flows from operating activities
Net income$5,960 $3,080 
Adjustments for:
Depreciation and amortization
13,504 12,594 
Stock-based compensation expense4,652 3,052 
Distributions of earnings received from equity method investments— 147 
Income from equity method investments— (261)
Loss from debt investment
— 1,219 
Gain on disposal of property and equipment
(3,004)(332)
Amortization of deferred financing costs
64 85 
Deferred income tax benefit
(1,961)— 
Changes in working capital:
Accounts receivable, net(1,638)(8,225)
Inventory(4)470 
Prepaid expenses and other assets(150)1,523 
Trade payables1,598 1,114 
Deferred revenue499 394 
Accrued liabilities(1,979)(904)
Income tax payable/receivable(2,433)(2,599)
Net cash provided by operating activities$15,108 $11,357 
Cash flows from investing activities
Purchase of property and equipment(23,612)(14,940)
Cash paid for acquisitions, net of cash acquired
— (2,999)
Proceeds from sale of property and equipment13,355 1,407 
Net cash used in investing activities$(10,257)$(16,532)
Cash flows from financing activities
Proceeds from exercise of options1,368 325 
Principal payments on term notes(220)(810)
Proceeds from revolving credit facilities— 3,000 
Payments for debt issuance costs
— (151)
Shares redeemed to pay income tax(1,631)(972)
Shares repurchased under the share repurchase program
(1,664)— 
Repayments of finance lease liabilities
(35)(249)
Distributions to non-controlling interest
(193)— 
Net cash provided by (used in) financing activities
$(2,375)$1,143 
Net increase (decrease) in cash and cash equivalents
2,476 (4,032)
Cash and cash equivalents at beginning of year17,540 12,839 
Cash and cash equivalents at end of period$20,016 $8,807 
Supplemental disclosures of cash flow information
Cash paid during the period for interest$212 $515 
Cash paid during the period for income taxes, net of refunds
$7,059 $3,841 
Supplemental disclosures of non-cash transactions
Equipment and other fixed asset purchases payable at end of period
$3,955 $2,725 
Equipment sales receivable at end of period
$986 $2,187 
Repurchases of shares not yet settled
$169 $— 


Non-GAAP Financial Measures

This press release refers to “Adjusted EBITDA”, which is a financial measure that is not prepared in accordance with generally accepted accounting principles in the United States ("GAAP"). Adjusted EBITDA should be considered in addition to, not as a substitute for, or superior to, financial measures calculated in accordance with U.S. GAAP. Management believes Adjusted EBITDA provides helpful information with respect to the Company’s operating performance as viewed by management, including a view of the Company’s business that is not dependent on the impact of the Company’s capitalization structure and items that are not part of the Company’s day-to-day operations. Management uses Adjusted EBITDA (i) to compare the Company’s operating performance on a consistent basis, (ii) to calculate incentive compensation for the Company’s employees, (iii) for planning purposes, including the preparation of the Company’s internal annual operating budget, and (iv) to evaluate the performance and effectiveness of the Company’s operational strategies. Accordingly, management believes that Adjusted EBITDA provides useful information in understanding and evaluating the Company’s operating performance in the same manner as management. Adjusted EBITDA is not a measurement of the Company’s financial performance under U.S. GAAP and should not be considered as an alternative to revenue or net income, as applicable, or any other performance measures derived in accordance with U.S. GAAP. Adjusted EBITDA has limitations as an analytical tool and you should not consider it in isolation or as a substitute for analysis of the Company’s operating results as reported under U.S. GAAP. Adjusted EBITDA does not reflect the impact of certain cash charges resulting from matters the Company considers not to be indicative of ongoing operations; and other companies in the Company’s industry may calculate Adjusted EBITDA differently than we do, limiting its usefulness as a comparative measure. In calculating Adjusted EBITDA, certain items (mostly non-cash) are excluded from net income attributable to Viemed Healthcare, Inc., including depreciation and amortization of capitalized assets, net interest expense, stock based compensation, transaction costs, impairment of assets, and taxes.

The following table is a reconciliation of net income attributable to Viemed Healthcare, Inc., the most directly comparable U.S. GAAP measure, to Adjusted EBITDA, on a historical basis for the periods indicated:

VIEMED HEALTHCARE, INC.
Reconciliation of Net Income to Non-GAAP Adjusted EBITDA
(Expressed in thousands of U.S. Dollars)
(Unaudited)
For the quarter endedJune 30, 2025March 31, 2025December 31, 2024September 30, 2024June 30, 2024March 31, 2024December 31, 2023September 30, 2023
Net income attributable to Viemed Healthcare, Inc.
$3,157 $2,625 $4,316 $3,878 $1,468 $1,603 $3,477 $2,919 
Add back:
Depreciation & amortization
6,891 6,613 6,366 6,408 6,309 6,285 5,918 5,975 
Interest expense, net
132 179 147 225 254 150 256 237 
Stock-based compensation(a)
2,341 2,311 1,521 1,712 1,620 1,432 1,534 1,453 
Transaction costs(b)
53 85 11 12 221 110 61 177 
Impairment of assets(c)
— — — 125 2,173 — — — 
Income tax expense1,713 952 1,881 1,594 768 518 1,599 1,320 
Adjusted EBITDA$14,287 $12,765 $14,242 $13,954 $12,813 $10,098 $12,845 $12,081 

(a) Represents non-cash, equity-based compensation expense associated with option and RSU awards.
(b) Represents transaction costs and expenses related to acquisition and integration efforts associated with recently announced or completed acquisitions.
(c) Represents impairments of the fair value of investment and litigation-related assets.


VIEMED HEALTHCARE, INC.
Key Financial and Operational Information
(Expressed in thousands of U.S. Dollars, except vent patients)
(Unaudited)
For the quarter endedJune 30,
2025
March 31, 2025December 31, 2024September 30, 2024June 30, 2024March 31, 2024December 31, 2023September 30, 2023
Financial Information:
Revenue$63,056 $59,129 $60,695 $58,004 $54,965 $50,593 $50,739 $49,402 
Gross Profit$36,731 $33,279 $36,138 $34,371 $32,892 $29,802 $32,111 $30,562 
Gross Profit %58 %56 %60 %59 %60 %59 %63 %62 %
Net Income attributable to Viemed Healthcare, Inc.
$3,157 $2,625 $4,316 $3,878 $1,468 $1,603 $3,477 $2,919 
Cash and Cash Equivalents (As of)
$20,016 $10,160 $17,540 $11,347 $8,807 $7,309 $12,839 $10,078 
Total Assets (As of)$184,603 $178,079 $177,069 $169,526 $163,947 $154,875 $154,895 $149,400 
Adjusted EBITDA(1)
$14,287 $12,765 $14,242 $13,954 $12,813 $10,098 $12,845 $12,081 
Operational Information:
Vent Patients(2)
12,15211,80911,79511,37410,90510,45010,32710,244
PAP Therapy Patients(3)
26,26022,89921,33819,47817,34915,72614,90014,788
Sleep Resupply Patients(4)
25,24622,94124,47822,14320,18518,90418,90218,544
(1) Refer to "Non-GAAP Financial Measures" section above for definition of Adjusted EBITDA.
(2) Vent Patients represents the number of active ventilator patients on recurring billing service at the end of each calendar quarter.
(3) PAP Therapy Patients represents the number of distinct patients billed for PAP therapy services during each calendar quarter.
(4) Sleep Resupply Patients represents the number of distinct patients who received supplies through our sleep resupply program during each calendar quarter.


Financial Supplement NASDAQ: VMD Leading th e Healthcare Industry in Home Respiratory Care August 6, 2025 1 Second Quarter 2025

 
Disclaimers Forward Looking Statements Certain statements contained in this Financial Supplement may constitute “forward-looking statements” within the meaning of the U.S. Private Securities Litigation Reform Act of 1995 or “forward-looking information” as such term is defined in applicable Canadian securities legislation (collectively, “forward-looking statements”). Often, but not always, forward-looking statements can be identified by the use of words such as “plans”, “expects”, “is expected”, “budget”, “potential”, “scheduled”, “estimates”, “forecasts”, “intends”, “anticipates”, “believes”, “projects”, or the negatives thereof or variations of such words and phrases or statements that certain actions, events or results “will”, “should”, “may”, “could”, “would”, “might” or “will be taken”, “occur” or “be achieved” or the negative of these terms or comparable terminology. All statements other than statements of historical fact, including those that express, or involve discussions as to, expectations, beliefs, plans, objectives, assumptions or future events or performance, including the Company's net revenue and Adjusted EBITDA guidance for 2025, and the anticipated benefits of the acquisition of Lehan’s Medical Equipment, including its expected contribution to the Company’s financial performance in the second half of 2025, are not historical facts and may be forward-looking statements and may involve estimates, assumptions and uncertainties that could cause actual results or outcomes to differ materially from those expressed in the forward-looking statements. Such statements reflect the Company's current views and intentions with respect to future events, and current information available to the Company, and are subject to certain risks, uncertainties and assumptions. Many factors could cause the actual results, performance or achievements that may be expressed or implied by such forward-looking statements to vary from those described herein should one or more of these risks or uncertainties materialize. These factors include, without limitation: the general business, market and economic conditions in the regions in which the we operate; significant capital requirements and operating risks that we may be subject to; our ability to implement business strategies and pursue business opportunities; volatility in the market price of our common shares; the state of the capital markets; the availability of funds and resources to pursue operations; inflation; reductions in reimbursement rates and audits of reimbursement claims by various governmental and private payor entities; dependence on few payors; possible new drug discoveries; dependence on key suppliers; granting of permits and licenses in a highly regulated business; competition; disruptions in or attacks (including cyber-attacks) on our information technology, internet, network access or other voice or data communications systems or services; the evolution of various types of fraud or other criminal behavior to which we are exposed; difficulty integrating newly acquired businesses; the impact of new and changes to, or application of, current laws and regulations; the overall difficult litigation and regulatory environment; increased competition; increased funding costs and market volatility due to market illiquidity and competition for funding; critical accounting estimates and changes to accounting standards, policies, and methods used by us; and the occurrence of natural and unnatural catastrophic events or health epidemics or concerns, and claims resulting from such events or concerns, as well as other general economic, market and business conditions; and other factors beyond our control; as well as those risk factors discussed or referred to in the Company’s disclosure documents filed with the U.S. Securities and Exchange Commission (the “SEC”) available on the SEC’s website at www.sec.gov, including the Company’s most recent Annual Report on Form 10-K and Quarterly Report on Form 10-Q, and with the securities regulatory authorities in certain provinces of Canada available at www.sedar.com. Should any factor affect the Company in an unexpected manner, or should assumptions underlying the forward-looking statements prove incorrect, the actual results or events may differ materially from the results or events predicted. Any such forward-looking statements are expressly qualified in their entirety by this cautionary statement. Moreover, the Company does not assume responsibility for the accuracy or completeness of such forward-looking statements. The forward-looking statements included in this Financial Supplement are made as of the date of this Financial Supplement and the Company undertakes no obligation to publicly update or revise any forward-looking statements, other than as required by applicable law. This Financial Supplement contains non-GAAP financial guidance. There is no reliable or reasonably estimable comparable GAAP measure for the Company’s non-GAAP financial guidance because the Company is not able to reliably predict the impact of certain items that typically have one or more of the following characteristics: highly variable, difficult to project, unusual in nature, significant to the results of a particular period or not indicative of future operating results. Similar charges or gains were recognized in prior periods and will likely reoccur in future periods. As a result, reconciliation of the non-GAAP financial guidance to the most directly comparable GAAP measure is not available without unreasonable effort. In addition, the Company believes such a reconciliation would imply a degree of precision and certainty that could be confusing to investors. The variability of the specified items may have a significant and unpredictable impact on the Company’s future GAAP results. Non-GAAP and Other Financial Information This Financial Supplement refers to “Adjusted EBITDA”, which is a financial measure that is not prepared in accordance with generally accepted accounting principles in the United States ("GAAP"). Adjusted EBITDA should be considered in addition to, not as a substitute for, or superior to, financial measures calculated in accordance with U.S. GAAP. Management believes Adjusted EBITDA provides helpful information with respect to the Company’s operating performance as viewed by management, including a view of the Company’s business that is not dependent on the impact of the Company’s capitalization structure and items that are not part of the Company’s day-to-day operations. Management uses Adjusted EBITDA (i) to compare the Company’s operating performance on a consistent basis, (ii) to calculate incentive compensation for the Company’s employees, (iii) for planning purposes, including the preparation of the Company’s internal annual operating budget, and (iv) to evaluate the performance and effectiveness of the Company’s operational strategies. Accordingly, management believes that Adjusted EBITDA provides useful information in understanding and evaluating the Company’s operating performance in the same manner as management. Adjusted EBITDA is not a measurement of the Company’s financial performance under U.S. GAAP and should not be considered as an alternative to revenue or net income, as applicable, or any other performance measures derived in accordance with U.S. GAAP. Adjusted EBITDA has limitations as an analytical tool and you should not consider it in isolation or as a substitute for analysis of the Company’s operating results as reported under U.S. GAAP. Adjusted EBITDA does not reflect the impact of certain cash charges resulting from matters the Company considers not to be indicative of ongoing operations; and other companies in the Company’s industry may calculate Adjusted EBITDA differently than we do, limiting its usefulness as a comparative measure. In calculating Adjusted EBITDA, certain items (mostly non-cash) are excluded from net income including depreciation and amortization of capitalized assets, net interest expense, stock based compensation, transaction costs, impairment of assets, and taxes. A reconciliation between GAAP and non-GAAP financial information is provided below. 2 VieMed Healthcare Inc. I Supplemental Presentation
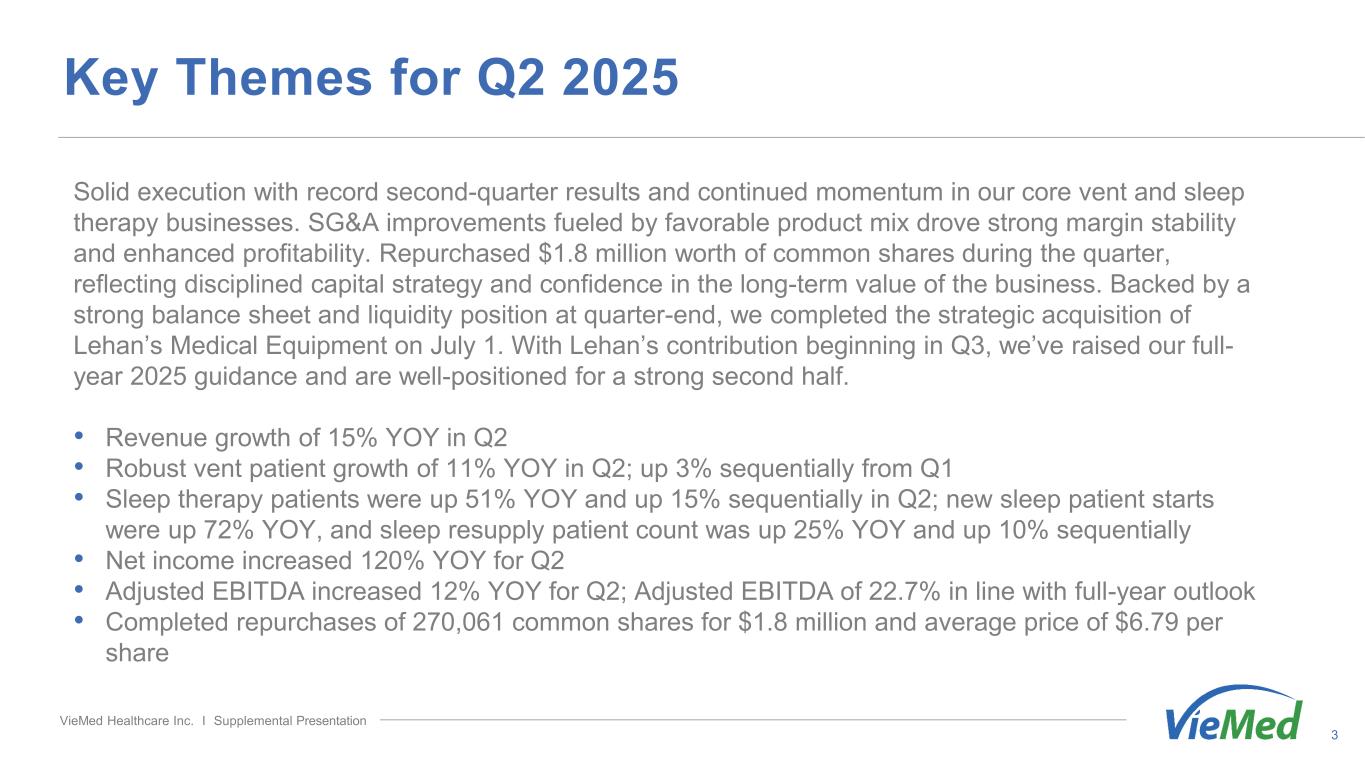

 
Key Themes for Q2 2025 3 Solid execution with record second-quarter results and continued momentum in our core vent and sleep therapy businesses. SG&A improvements fueled by favorable product mix drove strong margin stability and enhanced profitability. Repurchased $1.8 million worth of common shares during the quarter, reflecting disciplined capital strategy and confidence in the long-term value of the business. Backed by a strong balance sheet and liquidity position at quarter-end, we completed the strategic acquisition of Lehan’s Medical Equipment on July 1. With Lehan’s contribution beginning in Q3, we’ve raised our full- year 2025 guidance and are well-positioned for a strong second half. • Revenue growth of 15% YOY in Q2 • Robust vent patient growth of 11% YOY in Q2; up 3% sequentially from Q1 • Sleep therapy patients were up 51% YOY and up 15% sequentially in Q2; new sleep patient starts were up 72% YOY, and sleep resupply patient count was up 25% YOY and up 10% sequentially • Net income increased 120% YOY for Q2 • Adjusted EBITDA increased 12% YOY for Q2; Adjusted EBITDA of 22.7% in line with full-year outlook • Completed repurchases of 270,061 common shares for $1.8 million and average price of $6.79 per share VieMed Healthcare Inc. I Supplemental Presentation
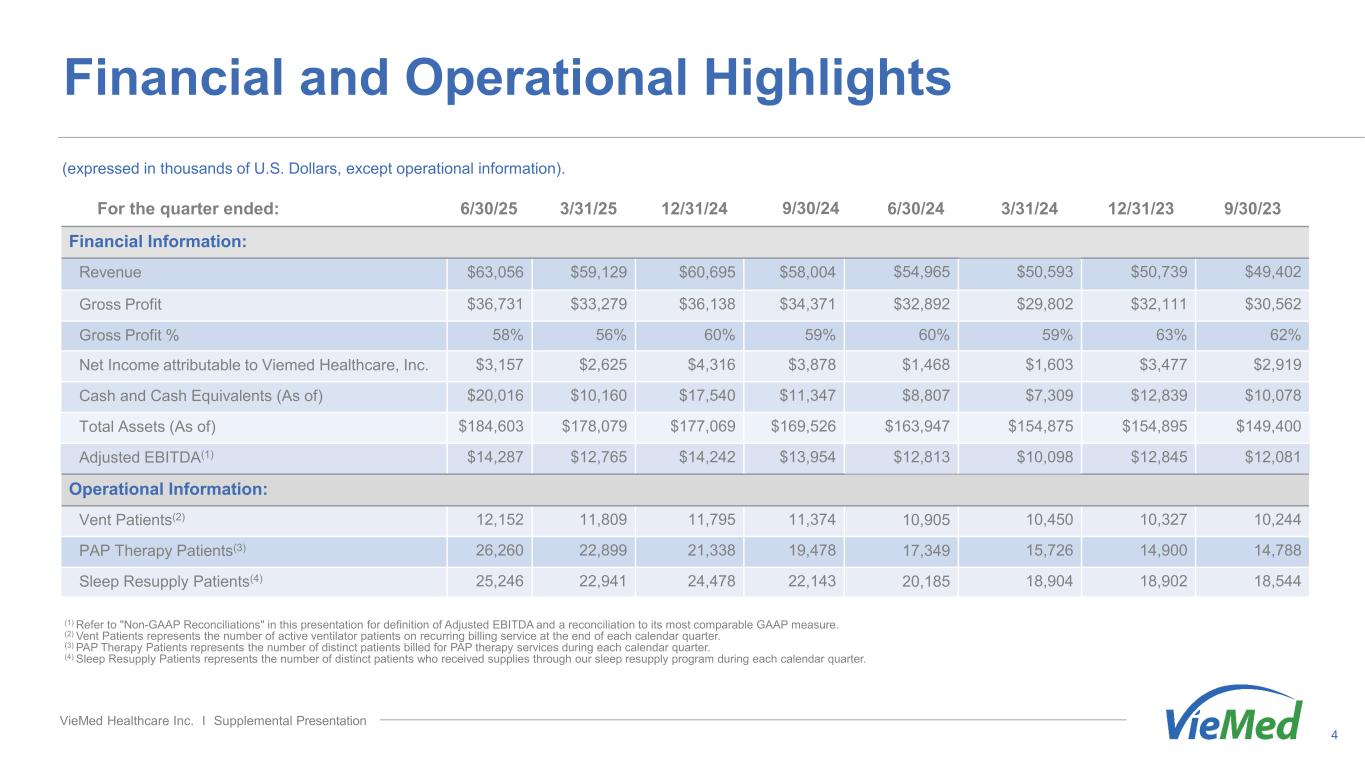

 
Financial and Operational Highlights 4 (expressed in thousands of U.S. Dollars, except operational information). (1) Refer to "Non-GAAP Reconciliations" in this presentation for definition of Adjusted EBITDA and a reconciliation to its most comparable GAAP measure. (2) Vent Patients represents the number of active ventilator patients on recurring billing service at the end of each calendar quarter. (3) PAP Therapy Patients represents the number of distinct patients billed for PAP therapy services during each calendar quarter. (4) Sleep Resupply Patients represents the number of distinct patients who received supplies through our sleep resupply program during each calendar quarter. For the quarter ended: 6/30/25 3/31/25 12/31/24 9/30/24 6/30/24 3/31/24 12/31/23 9/30/23 Financial Information: Revenue $63,056 $59,129 $60,695 $58,004 $54,965 $50,593 $50,739 $49,402 Gross Profit $36,731 $33,279 $36,138 $34,371 $32,892 $29,802 $32,111 $30,562 Gross Profit % 58% 56% 60% 59% 60% 59% 63% 62% Net Income attributable to Viemed Healthcare, Inc. $3,157 $2,625 $4,316 $3,878 $1,468 $1,603 $3,477 $2,919 Cash and Cash Equivalents (As of) $20,016 $10,160 $17,540 $11,347 $8,807 $7,309 $12,839 $10,078 Total Assets (As of) $184,603 $178,079 $177,069 $169,526 $163,947 $154,875 $154,895 $149,400 Adjusted EBITDA(1) $14,287 $12,765 $14,242 $13,954 $12,813 $10,098 $12,845 $12,081 Operational Information: Vent Patients(2) 12,152 11,809 11,795 11,374 10,905 10,450 10,327 10,244 PAP Therapy Patients(3) 26,260 22,899 21,338 19,478 17,349 15,726 14,900 14,788 Sleep Resupply Patients(4) 25,246 22,941 24,478 22,143 20,185 18,904 18,902 18,544 VieMed Healthcare Inc. I Supplemental Presentation
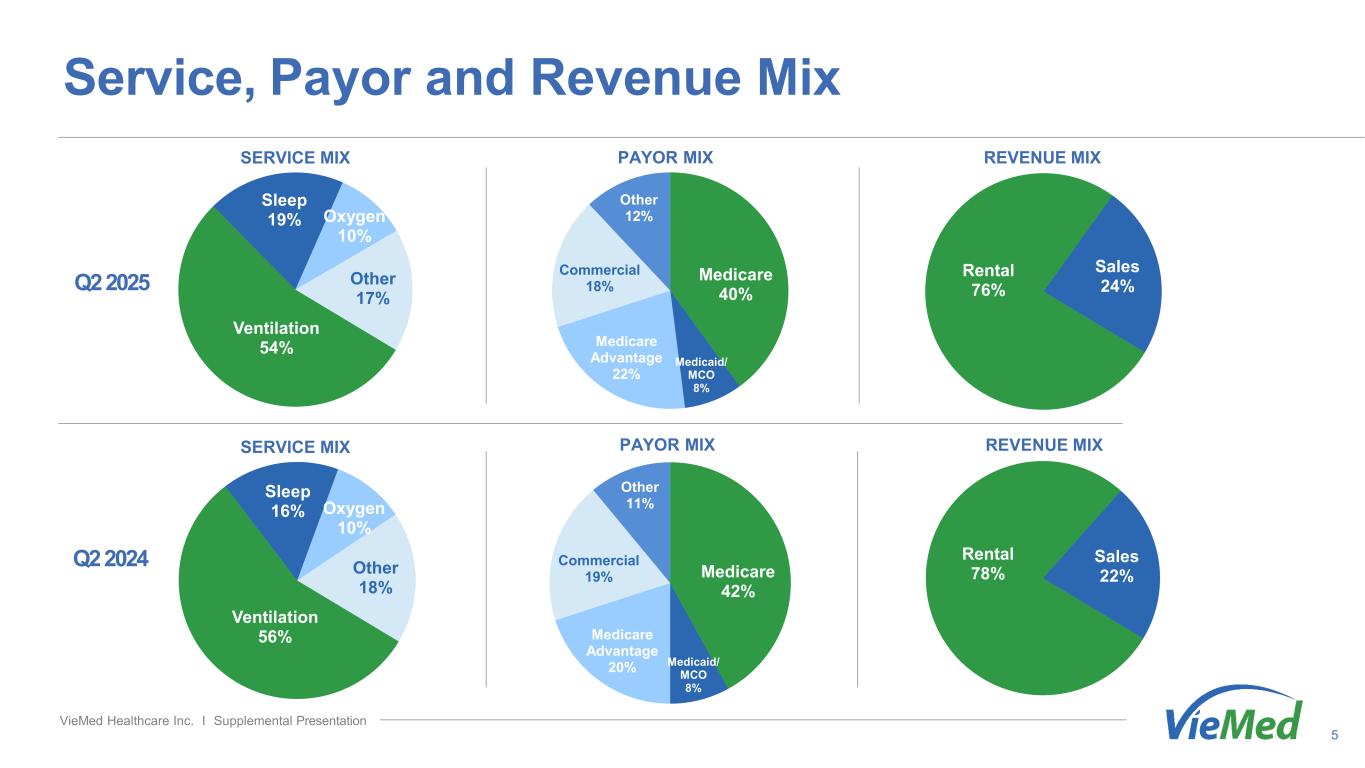

 
Medicare 40% Medicaid/ MCO 8% Medicare Advantage 22% Commercial 18% Other 12% Ventilation 54% Sleep 19% Oxygen 10% Other 17% Q2 2025 Rental 76% Sales 24% Medicare 42% Medicaid/ MCO 8% Medicare Advantage 20% Commercial 19% Other 11% Ventilation 56% Sleep 16% Oxygen 10% Other 18% Q2 2024 Service, Payor and Revenue Mix 5 SERVICE MIX PAYOR MIX REVENUE MIX VieMed Healthcare Inc. I Supplemental Presentation SERVICE MIX PAYOR MIX Rental 78% Sales 22% REVENUE MIX
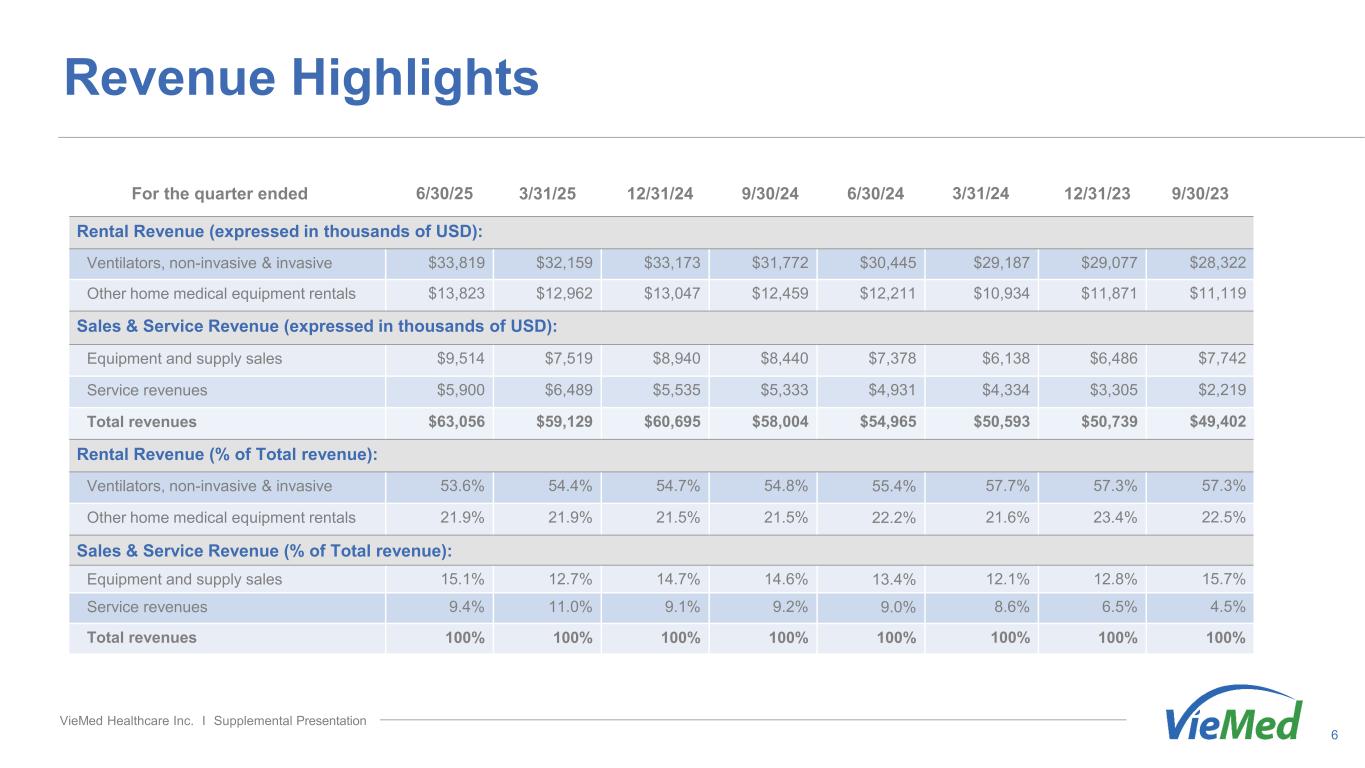

 
Revenue Highlights 6 For the quarter ended 6/30/25 3/31/25 12/31/24 9/30/24 6/30/24 3/31/24 12/31/23 9/30/23 Rental Revenue (expressed in thousands of USD): Ventilators, non-invasive & invasive $33,819 $32,159 $33,173 $31,772 $30,445 $29,187 $29,077 $28,322 Other home medical equipment rentals $13,823 $12,962 $13,047 $12,459 $12,211 $10,934 $11,871 $11,119 Sales & Service Revenue (expressed in thousands of USD): Equipment and supply sales $9,514 $7,519 $8,940 $8,440 $7,378 $6,138 $6,486 $7,742 Service revenues $5,900 $6,489 $5,535 $5,333 $4,931 $4,334 $3,305 $2,219 Total revenues $63,056 $59,129 $60,695 $58,004 $54,965 $50,593 $50,739 $49,402 Rental Revenue (% of Total revenue): Ventilators, non-invasive & invasive 53.6% 54.4% 54.7% 54.8% 55.4% 57.7% 57.3% 57.3% Other home medical equipment rentals 21.9% 21.9% 21.5% 21.5% 22.2% 21.6% 23.4% 22.5% Sales & Service Revenue (% of Total revenue): Equipment and supply sales 15.1% 12.7% 14.7% 14.6% 13.4% 12.1% 12.8% 15.7% Service revenues 9.4% 11.0% 9.1% 9.2% 9.0% 8.6% 6.5% 4.5% Total revenues 100% 100% 100% 100% 100% 100% 100% 100% VieMed Healthcare Inc. I Supplemental Presentation
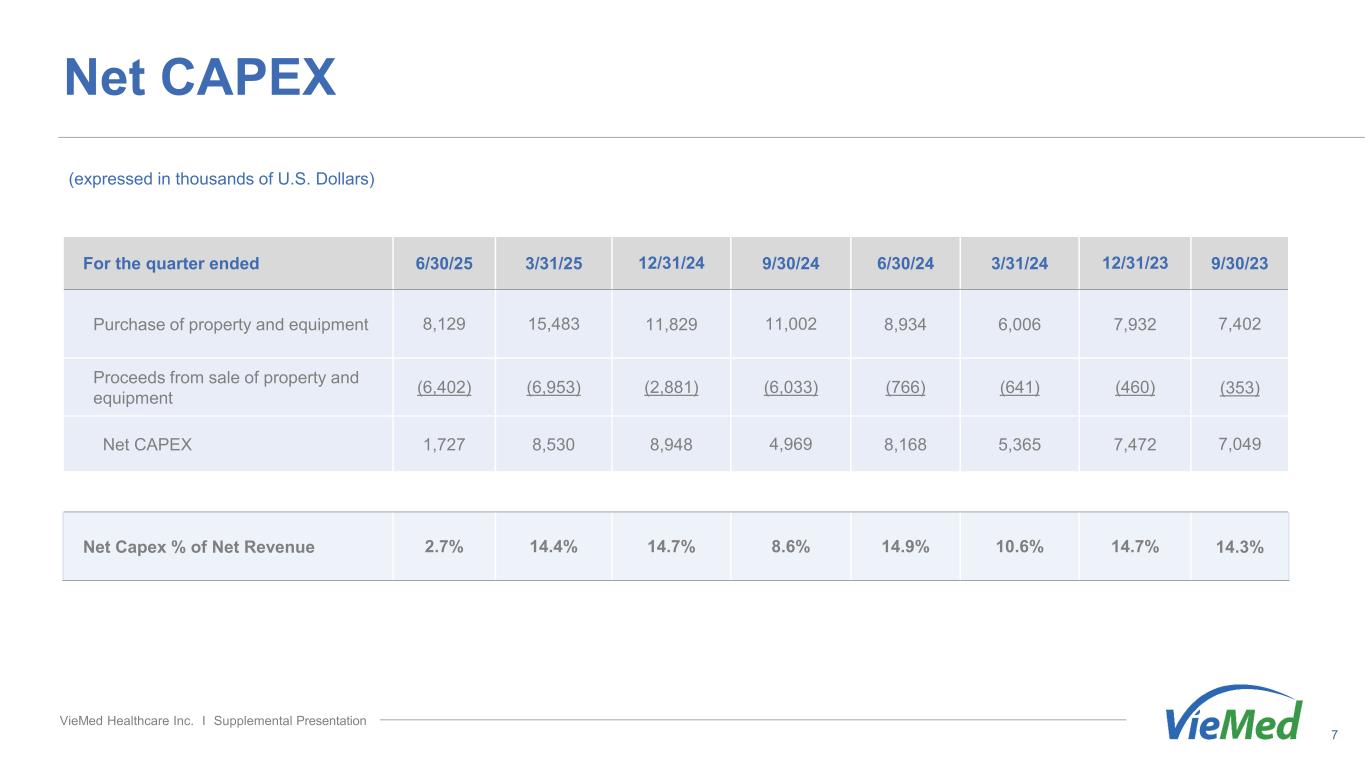

 
Net CAPEX 7 For the quarter ended 6/30/25 3/31/25 12/31/24 9/30/24 6/30/24 3/31/24 12/31/23 9/30/23 Purchase of property and equipment 8,129 15,483 11,829 11,002 8,934 6,006 7,932 7,402 Proceeds from sale of property and equipment (6,402) (6,953) (2,881) (6,033) (766) (641) (460) (353) Net CAPEX 1,727 8,530 8,948 4,969 8,168 5,365 7,472 7,049 Net Capex % of Net Revenue 2.7% 14.4% 14.7% 8.6% 14.9% 10.6% 14.7% 14.3% VieMed Healthcare Inc. I Supplemental Presentation (expressed in thousands of U.S. Dollars)
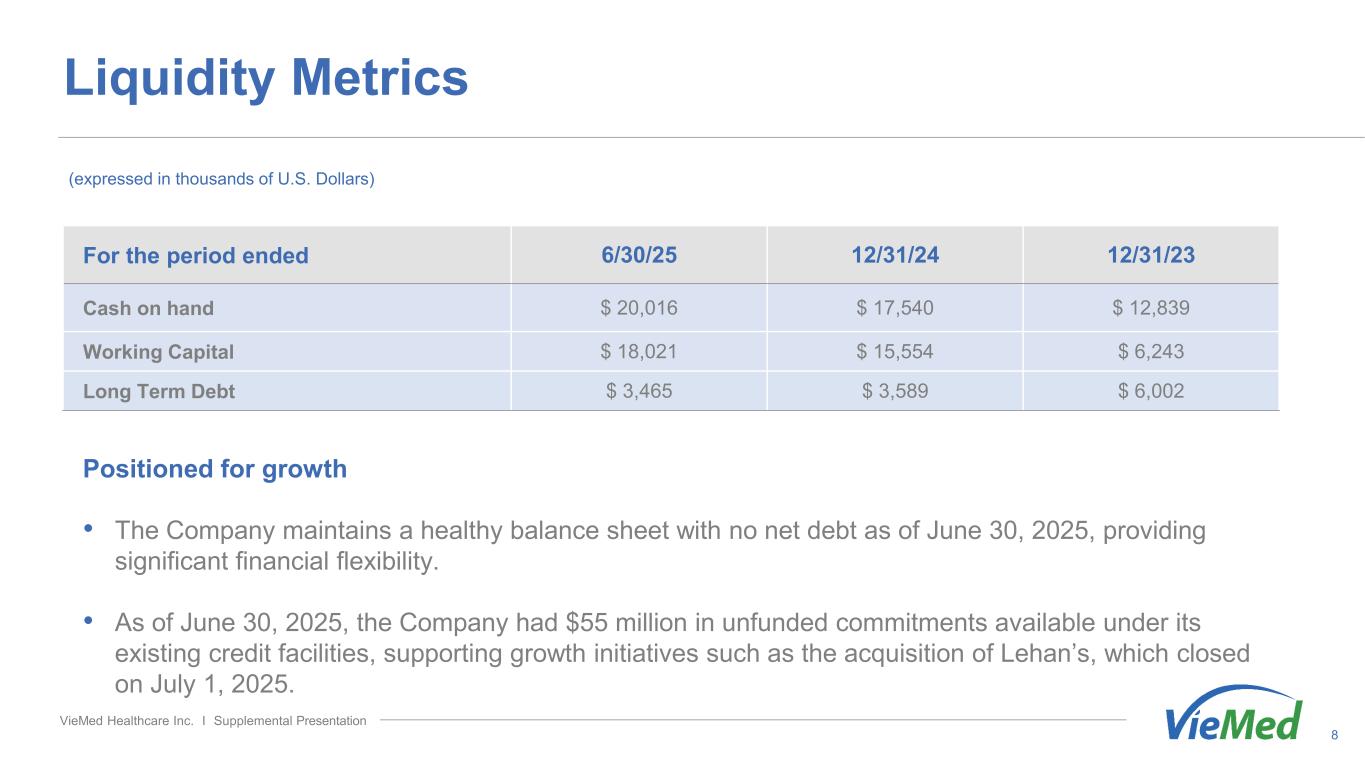

 
Liquidity Metrics 8 Positioned for growth • The Company maintains a healthy balance sheet with no net debt as of June 30, 2025, providing significant financial flexibility. • As of June 30, 2025, the Company had $55 million in unfunded commitments available under its existing credit facilities, supporting growth initiatives such as the acquisition of Lehan’s, which closed on July 1, 2025. For the period ended 6/30/25 12/31/24 12/31/23 Cash on hand $ 20,016 $ 17,540 $ 12,839 Working Capital $ 18,021 $ 15,554 $ 6,243 Long Term Debt $ 3,465 $ 3,589 $ 6,002 VieMed Healthcare Inc. I Supplemental Presentation (expressed in thousands of U.S. Dollars)
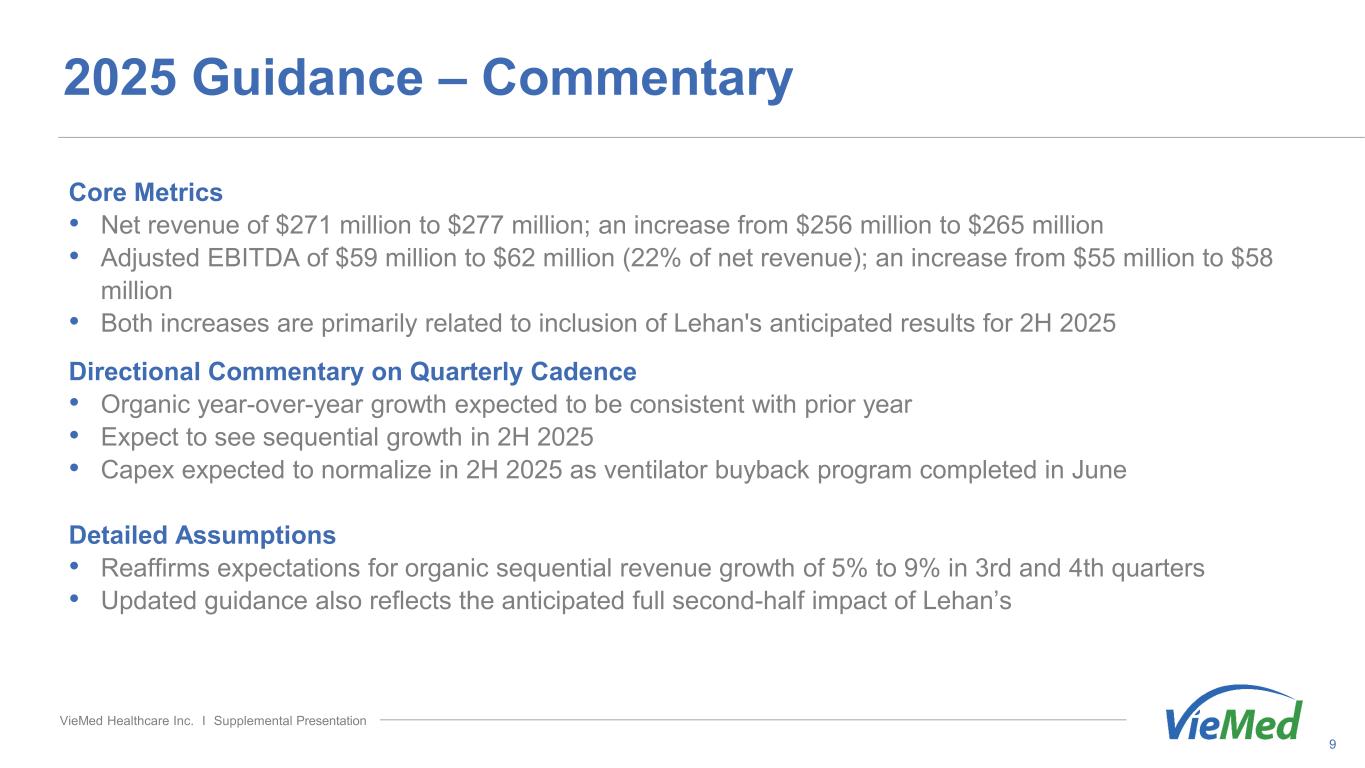

 
2025 Guidance – Commentary 9 Core Metrics • Net revenue of $271 million to $277 million; an increase from $256 million to $265 million • Adjusted EBITDA of $59 million to $62 million (22% of net revenue); an increase from $55 million to $58 million • Both increases are primarily related to inclusion of Lehan's anticipated results for 2H 2025 Directional Commentary on Quarterly Cadence • Organic year-over-year growth expected to be consistent with prior year • Expect to see sequential growth in 2H 2025 • Capex expected to normalize in 2H 2025 as ventilator buyback program completed in June Detailed Assumptions • Reaffirms expectations for organic sequential revenue growth of 5% to 9% in 3rd and 4th quarters • Updated guidance also reflects the anticipated full second-half impact of Lehan’s VieMed Healthcare Inc. I Supplemental Presentation
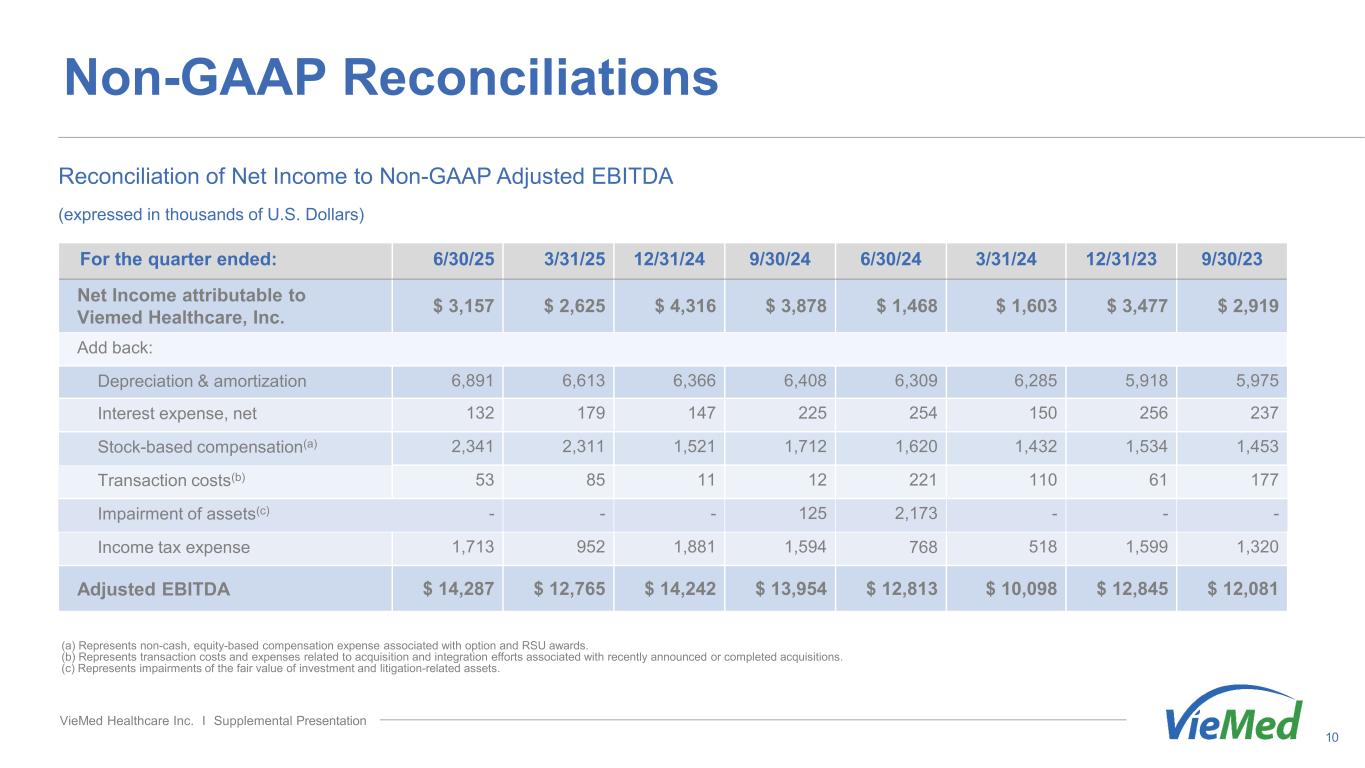

 
Non-GAAP Reconciliations 10 (a) Represents non-cash, equity-based compensation expense associated with option and RSU awards. (b) Represents transaction costs and expenses related to acquisition and integration efforts associated with recently announced or completed acquisitions. (c) Represents impairments of the fair value of investment and litigation-related assets. Reconciliation of Net Income to Non-GAAP Adjusted EBITDA For the quarter ended: 6/30/25 3/31/25 12/31/24 9/30/24 6/30/24 3/31/24 12/31/23 9/30/23 Net Income attributable to Viemed Healthcare, Inc. $ 3,157 $ 2,625 $ 4,316 $ 3,878 $ 1,468 $ 1,603 $ 3,477 $ 2,919 Add back: Depreciation & amortization 6,891 6,613 6,366 6,408 6,309 6,285 5,918 5,975 Interest expense, net 132 179 147 225 254 150 256 237 Stock-based compensation(a) 2,341 2,311 1,521 1,712 1,620 1,432 1,534 1,453 Transaction costs(b) 53 85 11 12 221 110 61 177 Impairment of assets(c) - - - 125 2,173 - - - Income tax expense 1,713 952 1,881 1,594 768 518 1,599 1,320 Adjusted EBITDA $ 14,287 $ 12,765 $ 14,242 $ 13,954 $ 12,813 $ 10,098 $ 12,845 $ 12,081 VieMed Healthcare Inc. I Supplemental Presentation (expressed in thousands of U.S. Dollars)