Exhibit 99.1

VSE Corporation Announces Fourth Quarter and Full Year 2022 Results
ALEXANDRIA, Va., March 8, 2023 - VSE Corporation (NASDAQ: VSEC; “VSE”, or the “Company”), a leading provider of aftermarket distribution and maintenance, repair and overhaul ("MRO") services for land, sea and air transportation assets for government and commercial markets, today announced results for the fourth quarter and full year 2022.
FOURTH QUARTER 2022 RESULTS
(As compared to the Fourth Quarter 2021)
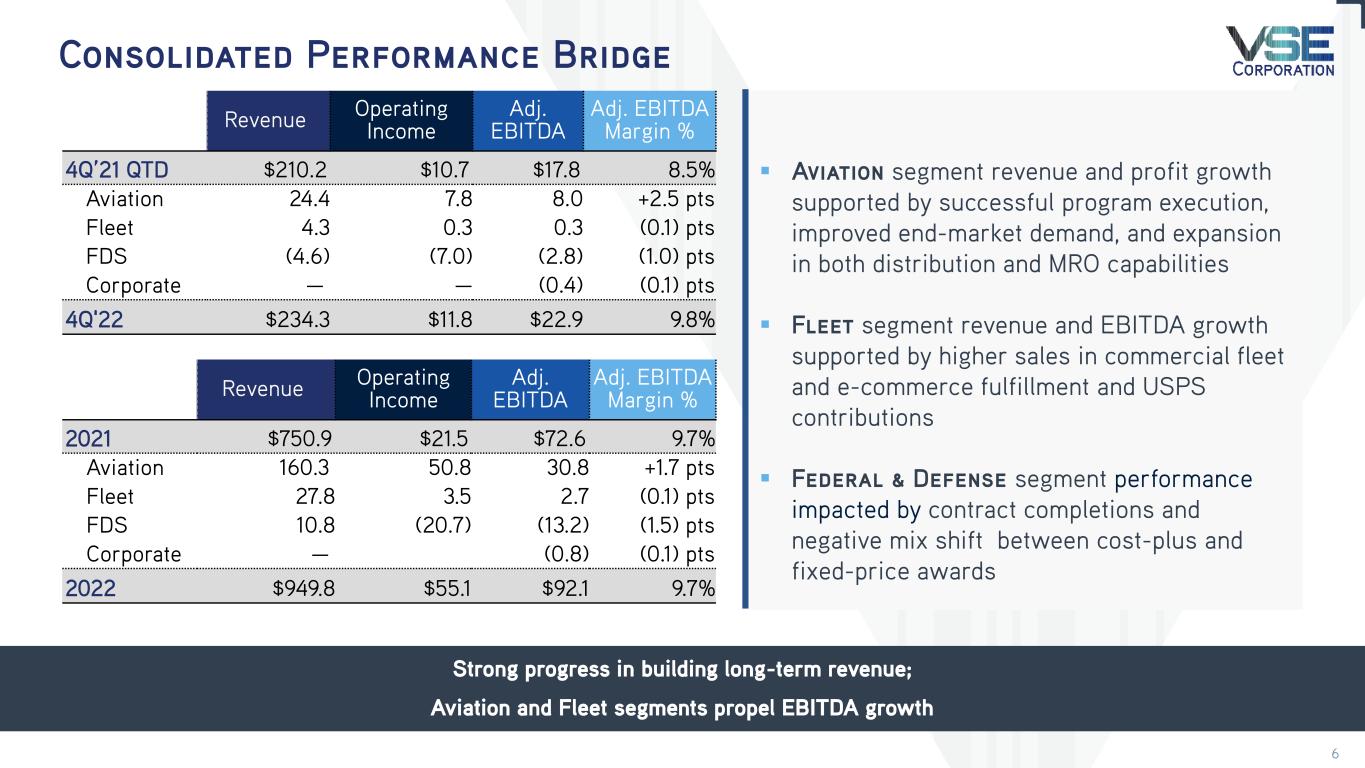
▪Total Revenues of $234.3 million increased 11%
▪GAAP Net Income of $4.8 million decreased 22%
▪GAAP EPS (Diluted) of $0.38 decreased 22%
▪Adjusted EPS(1) (Diluted) of $0.68 increased 28%
▪Adjusted EBITDA(1) of $22.9 million increased 29%
FULL-YEAR 2022 RESULTS
(As compared to the Full-Year 2021)
▪Total Revenues of $949.8 million increased 26%
▪GAAP Net Income of $28.1 million increased 252%
▪GAAP EPS (Diluted) of $2.19 increased 248%
▪Adjusted EPS(1) (Diluted) of $2.91 increased 32%
▪Adjusted EBITDA(1) of $92.1 million increased 27%
(1) Non-GAAP measure, see additional information at the end of this release regarding non-GAAP financial measures
MANAGEMENT COMMENTARY
"We completed a defining year in our company's history by delivering strong fourth quarter and full year results as we advanced our business transformation strategies, culminating in significant year-over-year growth, robust new business wins, and record full year revenue in our Aviation and Fleet segments,” stated John Cuomo, President and CEO of VSE Corporation. “These successful fourth quarter results were underpinned by continued program execution excellence and commercial market momentum.”
“In the fourth quarter, our Aviation segment revenue grew by nearly 30% versus the prior-year period, with segment margin reaching 2019 levels, driven by an increased mix of higher-margin repair revenue,” continued Cuomo. “Both our Aviation distribution and MRO businesses are now performing above pre-pandemic levels, with Aviation representing nearly 70% of total fourth quarter profit for VSE.”
“Our Aviation segment completed the acquisition of Precision Fuel Components in February 2023,” continued Cuomo. “This transaction expands our MRO capabilities within the B&GA and rotorcraft markets, supporting our value proposition to provide VSE Aviation customers access to differentiating, full-service, on-demand repair and distribution solutions. We will remain an opportunistic acquirer of complementary, accretive Aviation assets that enhance our capabilities within high-value, underserved portions of the market.”
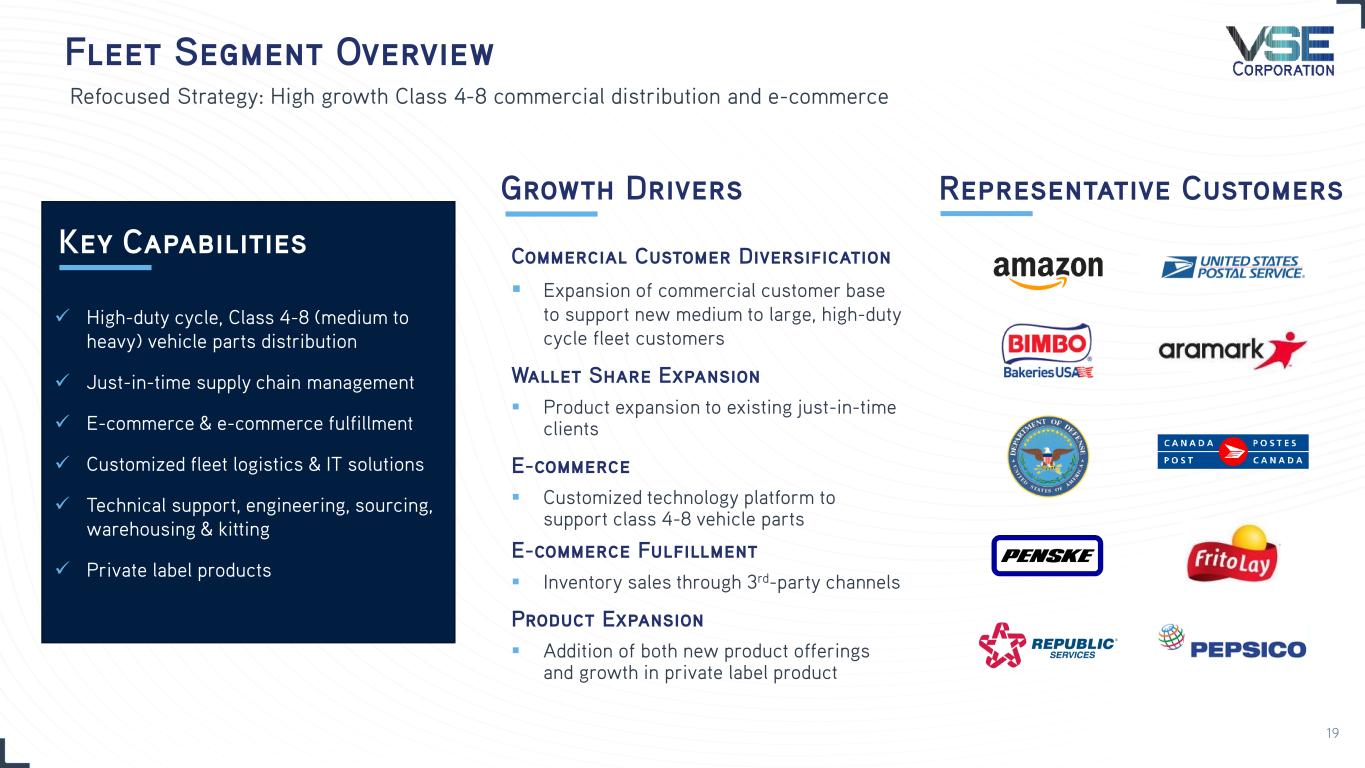
“Our Fleet segment reported commercial revenue growth of approximately 20% in the fourth quarter, with commercial fleet revenue representing nearly 40% of total segment revenue in the period,” continued Cuomo. “In January 2023, we announced the opening of a new distribution and e-commerce fulfillment center in the greater Memphis, Tennessee area. This 450,000 square-foot distribution center more than doubles the existing warehouse
footprint of VSE’s Fleet segment, providing our Wheeler Fleet Solutions subsidiary the capacity required to meet the growing demand for our aftermarket products across e-commerce fulfillment and commercial fleet customers. We anticipate this distribution center will contribute approximately $50 million in new, incremental sales to our Fleet segment in 2023.”
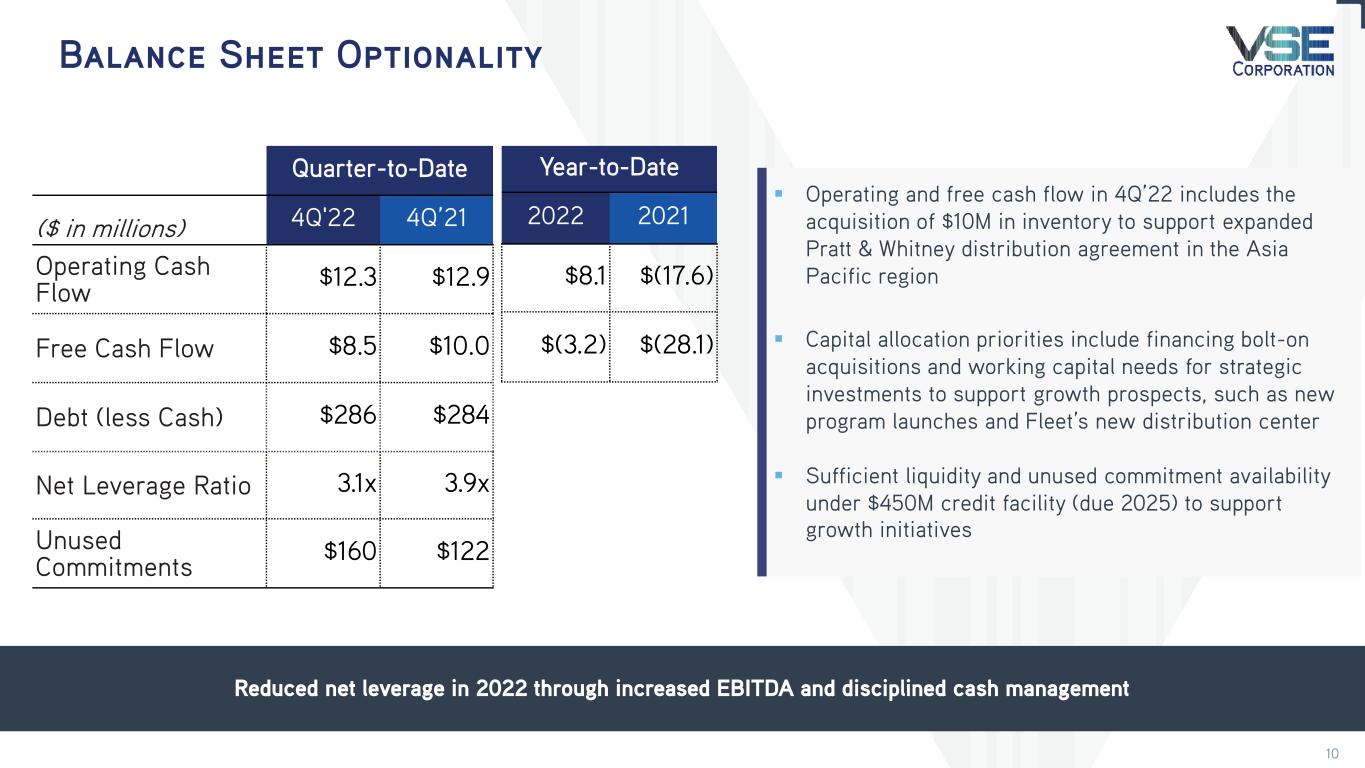
"We remain well positioned to grow, and in 2022, we reduced our net leverage ratio by nearly a full turn driven by stronger earnings led by Aviation and Fleet. Interest expense increased in the fourth quarter due to a higher Federal Funds Rate and the timing of cash flow in the quarter," stated Stephen Griffin, CFO of VSE Corporation. "We utilized our strong operating and free cash flow to drive reduction in our debt in the fourth quarter, while strategically investing over $10 million in inventory for new distribution programs set to launch in 2023. We remain focused on disciplined capital allocation, while seeking to invest in accretive, value-enhancing growth opportunities."
STRATEGIC UPDATE
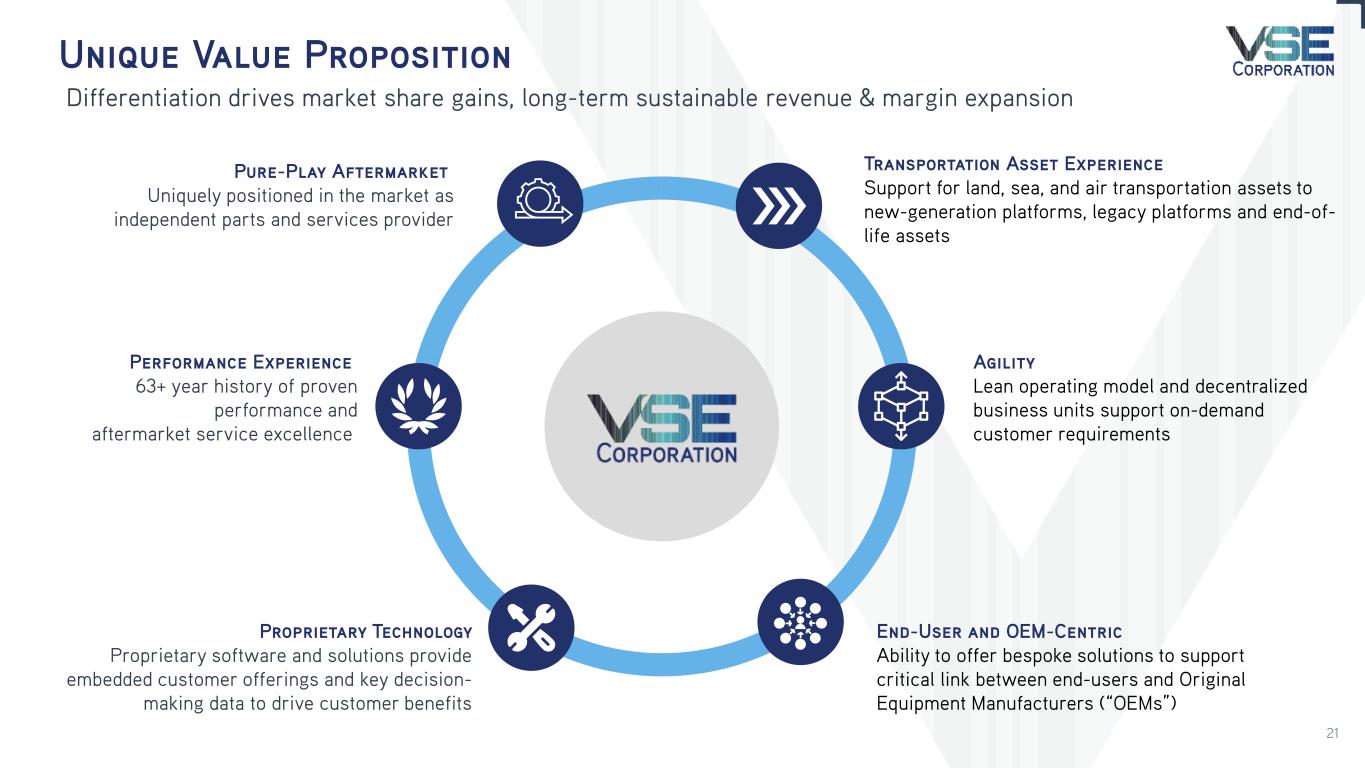
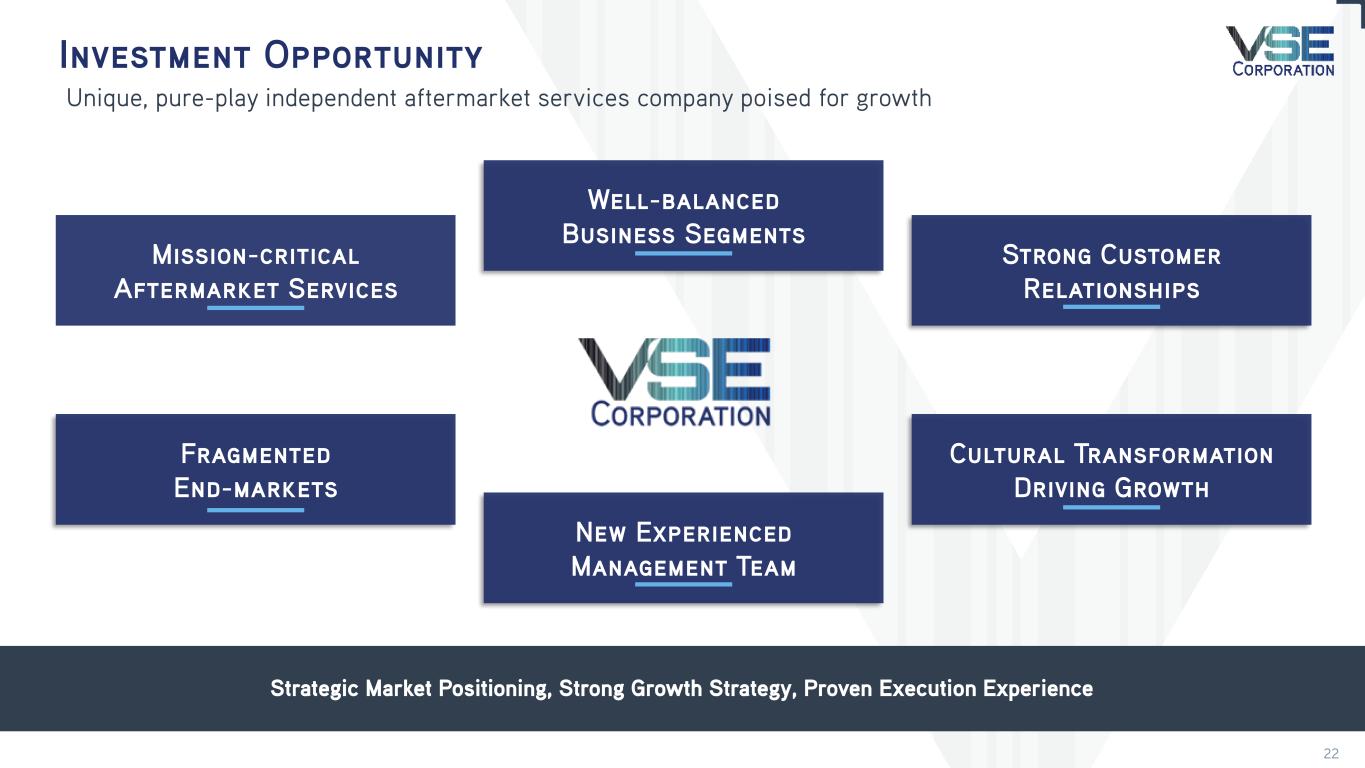
In 2022, VSE continued to successfully execute on its multi-year business transformation plan of establishing a leading aftermarket parts distribution and MRO services platform in high-growth, fragmented market segments.
New Business and Long-Term, Sustainable Revenue Channels
On February 1, 2023, the Aviation segment acquired Precision Fuel Components, a leading provider of MRO services for engine accessory and fuel systems supporting the business and general aviation (“B&GA”) market. This transaction expands VSE Aviation’s MRO capabilities in B&GA and rotorcraft markets, while positioning the Company to capitalize on higher-margin technical service opportunities.
In January 2023, the Fleet segment opened a new, state-of-the-art e-commerce fulfillment and distribution center in the Memphis, Tennessee area to expand capacity and support faster, same-day order-to-delivery times; to allow for additional shipping carrier options; and to continue the highest level of service for commercial aftermarket parts distribution. The new facility is expected to contribute approximately $50 million in incremental commercial sales to the Fleet segment in 2023.
The Federal & Defense segment is actively investing in business development to ensure sustainable long-term growth. In 2022, business development resources increased five times over 2021, with a focus on core capability competencies and new customer channels. This deliberate, strategic approach resulted in a 60% expansion in the pipeline for new business opportunities. As of December 31, 2022, the segment submitted bids totaling $1.5 billion, now currently awaiting award.
Growing Profit
Aviation operating income and adjusted EBITDA grew to $12.3 million and $15.8 million in the fourth quarter, an increase of 173% and 102%, respectively, versus the prior-year period. The strong execution of new programs, as well as market recovery and growth within MRO activities, propelled the business and resulted in a year-over-year margin expansion of +500bps, driving positive outcomes for the quarter.
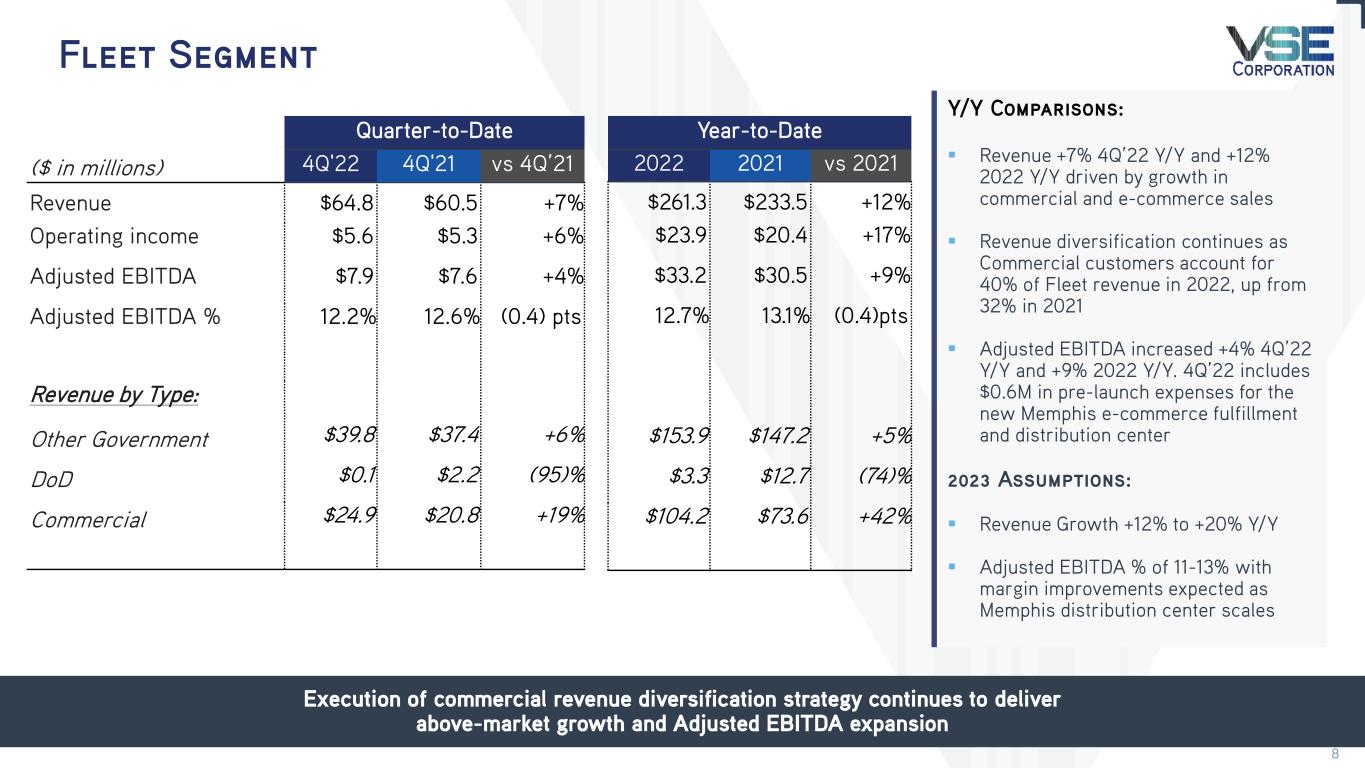
Fleet operating income and adjusted EBITDA grew to $5.6 million and $7.9 million in the fourth quarter, an increase of 6% and 4% versus the prior-year period, respectively. The increase is driven by a successful commercial expansion strategy and stable revenue from the USPS. Growing adjusted EBITDA remains a key priority for this segment. The margin compression in the fourth quarter was primarily driven by $0.6 million in anticipated pre-launch expenses for the new Memphis-area distribution center.
Optimizing Legacy Programs
During the fourth quarter, the Aviation segment commenced inventory purchases for a previously announced expansion into the Asia Pacific region supporting its existing Pratt & Whitney Canada distribution agreement. As part of the expanded agreement, VSE Aviation will provide engine spare parts and exchange support for accessories to B&GA engine customers, operators, and maintenance providers in the Asia Pacific region.
Fleet segment revenue from USPS increased to $39.8 million, up 6% in the fourth quarter versus the prior-year period. As the provider of maintenance services for all vehicle types in the 230,000+ USPS fleet, the Fleet segment continues to fulfill its critical role as a key partner in USPS operations, supporting the complexity of its supply chain and providing parts solutions for older long-lived vehicles (LLV), commercial off-the-shelf vehicles (COTS), and next-generation delivery vehicles (NGDV).
In March 2023, the Federal & Defense segment received a 6-month contract extension to its Naval Sea Systems Command (NAVSEA) program. The contract extension allows the segment to continue providing Foreign Military Sales (FMS) and Follow-on Technical Support (FOTS) services to NAVSEA, which has a funded backlog greater than $125 million.
SEGMENT RESULTS
Aviation segment revenue increased 29% year-over-year to a record $107.2 million in the fourth quarter 2022. The year-over-year revenue growth was attributable to share gains within the B&GA market and continued commercial aftermarket recovery, supported by global air traffic recovery. Aviation distribution and repair revenue increased 22% and 53% respectively in the fourth quarter versus the prior-year period. The Aviation segment reported operating income of $12.3 million in the fourth quarter, compared to $4.5 million in the same period of 2021. Segment adjusted EBITDA increased by 102% in the fourth quarter to $15.8 million, versus $7.8 million in the prior-year period. Adjusted EBITDA margins were 14.7%, an increase of 528 basis points versus the prior year period, driven by the execution of new program awards and strong MRO results.
Fleet segment revenue increased 7% year-over-year to $64.8 million in the fourth quarter of 2022. Revenues from commercial customers increased 19% on a year-over-year basis, driven by growth in commercial fleet demand and e-commerce fulfillment sales. Commercial revenue represented approximately 40% of total Fleet segment revenue in the period for the fourth consecutive quarter. The Fleet segment reported operating income of $5.6 million in the fourth quarter, compared to $5.3 million in the same period of 2021. Segment adjusted EBITDA increased 4% year-over-year to $7.9 million, while adjusted EBITDA margin was 12.2%, a decline of 41 basis points versus the prior-year period, primarily driven by planned $0.6 million in pre-launch expenses for the new e-commerce fulfillment and distribution center in the Memphis area.
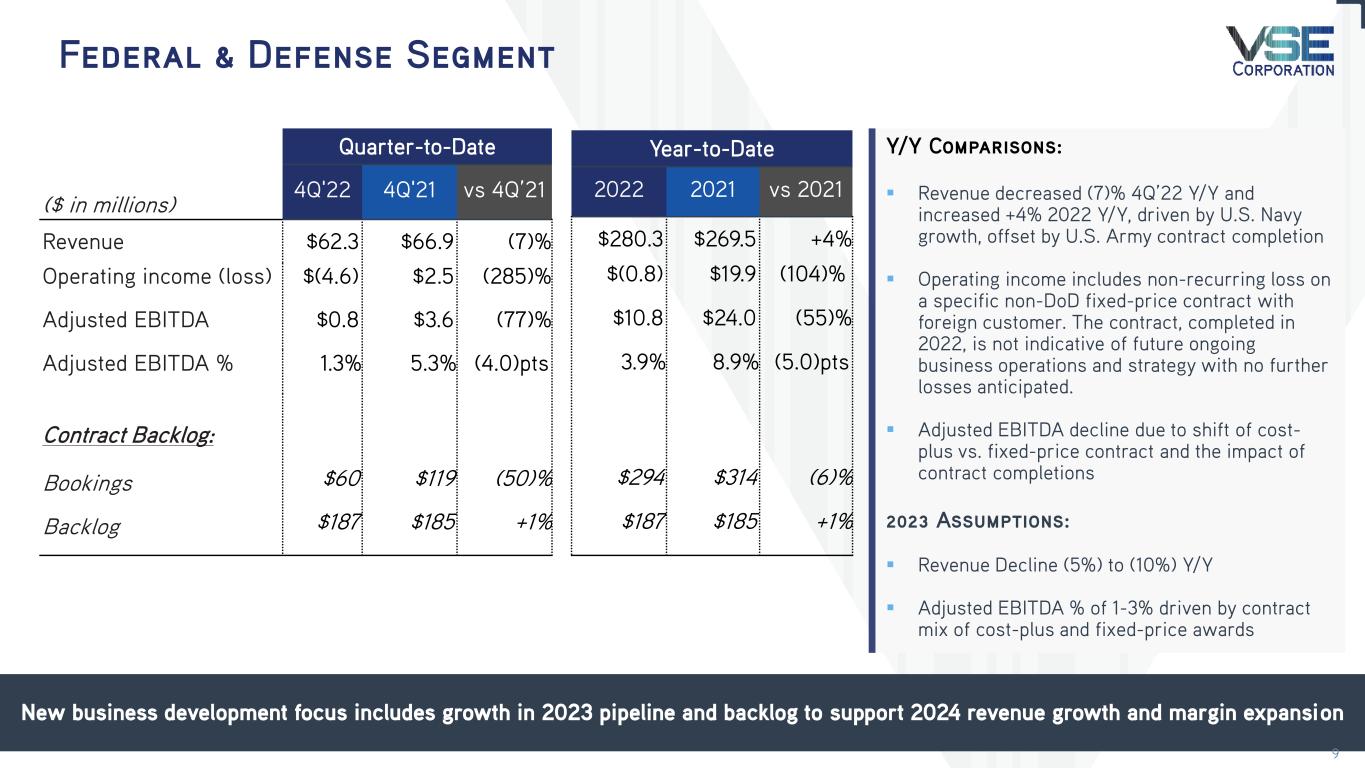
Federal & Defense segment revenue decreased 7% year-over-year to $62.3 million in the fourth quarter 2022, driven by decline in U.S. Army work due to program completions, partially offset by increases in a Foreign Military Sales (FMS) program with the U.S. Navy. The Federal & Defense segment reported an operating loss of $4.6 million in the fourth quarter 2022, primarily due to a contract loss recognized in the current quarter. The loss is related to a specific fixed-price, non-DoD contract with a foreign customer that is not considered indicative of ongoing business operations and strategy. We expect no further loss related to this contract, which was completed in 2022. Segment adjusted EBITDA declined 77% year-over-year to $0.8 million in the period, given a higher mix of cost-plus contracts and program completion expenses. Funded backlog increased 1% year-to-date to $187 million, while bookings decreased 6% on a year-to-date basis.
FINANCIAL RESOURCES AND LIQUIDITY
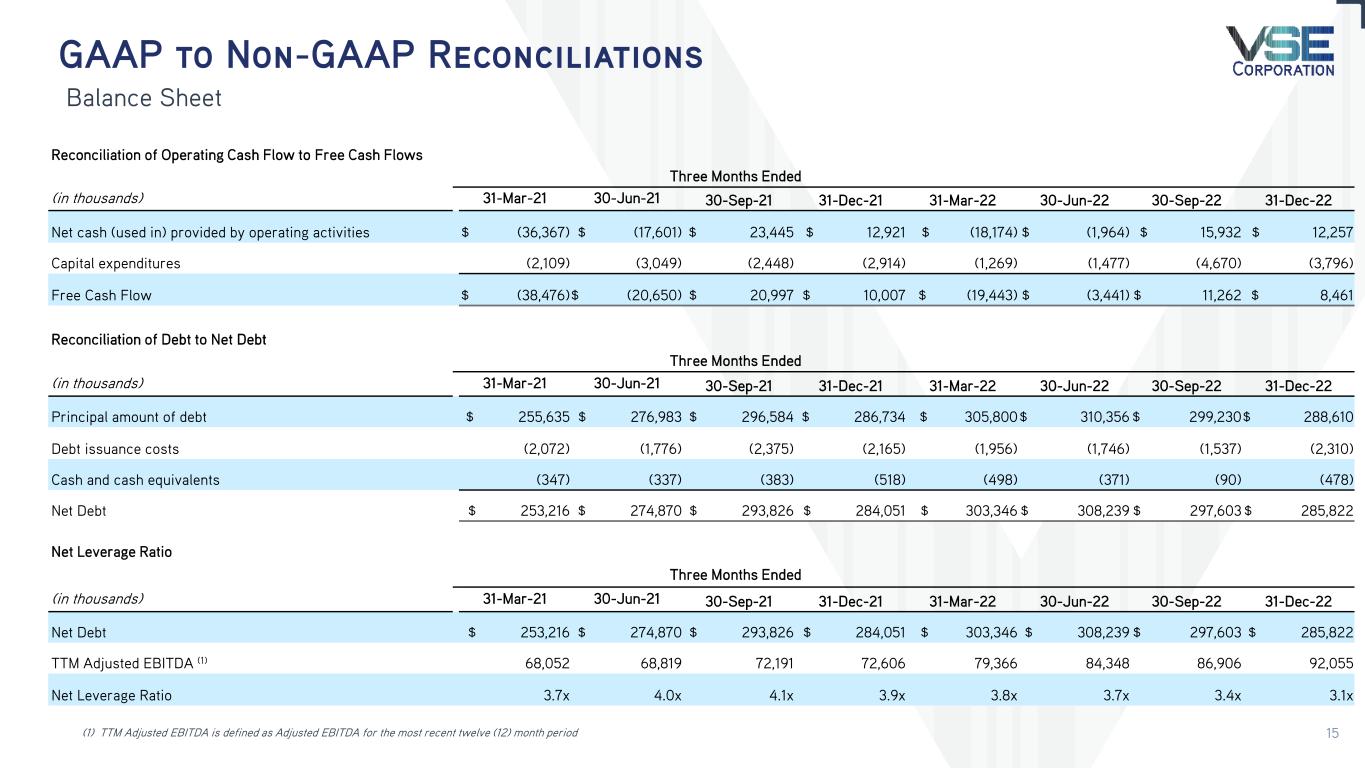
As of December 31, 2022, the Company had $160 million in cash and unused commitment availability under its $350 million revolving credit facility maturing in 2025. As of December 31, 2022, VSE had total net debt outstanding of $286 million and $92 million of trailing-twelve months Adjusted EBITDA.
FOURTH QUARTER AND FULL YEAR RESULTS
| (in thousands, except per share data) | ||||||||||||||||||||||||||||||||||||||
| Three months ended December 31, | For the years ended December 31, | |||||||||||||||||||||||||||||||||||||
| 2022 | 2021 | % Change | 2022 | 2021 | % Change | |||||||||||||||||||||||||||||||||
| Revenues | $ | 234,323 | $ | 210,178 | 11.5 | % | $ | 949,762 | $ | 750,853 | 26.5 | % | ||||||||||||||||||||||||||
| Operating income | $ | 11,794 | $ | 10,739 | 9.8 | % | $ | 55,131 | $ | 21,520 | 156.2 | % | ||||||||||||||||||||||||||
| Net income (loss) | $ | 4,848 | $ | 6,200 | (21.8) | % | $ | 28,059 | $ | 7,966 | 252.2 | % | ||||||||||||||||||||||||||
| EPS (Diluted) | $ | 0.38 | $ | 0.49 | (22.4) | % | $ | 2.19 | $ | 0.63 | 247.6 | % | ||||||||||||||||||||||||||
SEGMENT RESULTS
The following is a summary of revenues and operating income (loss) for the three and twelve months ended December 31, 2022 and December 31, 2021:
| Three months ended December 31, | For the years ended December 31, | |||||||||||||||||||||||||||||||||||||
| (in thousands) | 2022 | 2021 | % Change | 2022 | 2021 | % Change | ||||||||||||||||||||||||||||||||
| Revenues: | ||||||||||||||||||||||||||||||||||||||
| Aviation | $ | 107,178 | $ | 82,842 | 29.4 | % | $ | 408,112 | $ | 247,852 | 64.7 | % | ||||||||||||||||||||||||||
| Fleet | 64,810 | 60,460 | 7.2 | % | 261,336 | 233,532 | 2.9 | % | ||||||||||||||||||||||||||||||
| Federal and Defense | 62,335 | 66,876 | (6.8) | % | 280,314 | 269,469 | 4.0 | % | ||||||||||||||||||||||||||||||
| Total revenues | $ | 234,323 | $ | 210,178 | 11.5 | % | $ | 949,762 | $ | 750,853 | 26.5 | % | ||||||||||||||||||||||||||
Operating income (loss): | ||||||||||||||||||||||||||||||||||||||
| Aviation | $ | 12,327 | $ | 4,512 | 173.2 | % | $ | 36,416 | $ | (14,373) | (353.4) | % | ||||||||||||||||||||||||||
| Fleet | 5,625 | 5,298 | 6.2 | % | 23,911 | 20,426 | 17.1 | % | ||||||||||||||||||||||||||||||
| Federal and Defense | (4,608) | 2,487 | (285.3) | % | (805) | 19,897 | (104.0) | % | ||||||||||||||||||||||||||||||
| Corporate/unallocated expenses | (1,550) | (1,558) | (0.5) | % | (4,391) | (4,430) | (0.9) | % | ||||||||||||||||||||||||||||||
| Operating income | $ | 11,794 | $ | 10,739 | 9.8 | % | $ | 55,131 | $ | 21,520 | 156.2 | % | ||||||||||||||||||||||||||
The Company reported total capital expenditures in the fourth quarter and full year 2022 of $3.8 million and $11.2 million, respectively.
NON-GAAP MEASURES
In addition to the financial measures prepared in accordance with generally accepted accounting principles (GAAP), this earnings release also contains non-GAAP financial measures. These measures provide useful information to investors, and a reconciliation of these measures to the most directly comparable GAAP measures and other information relating to these non-GAAP measures is included in the supplemental schedules attached.
NON-GAAP FINANCIAL INFORMATION
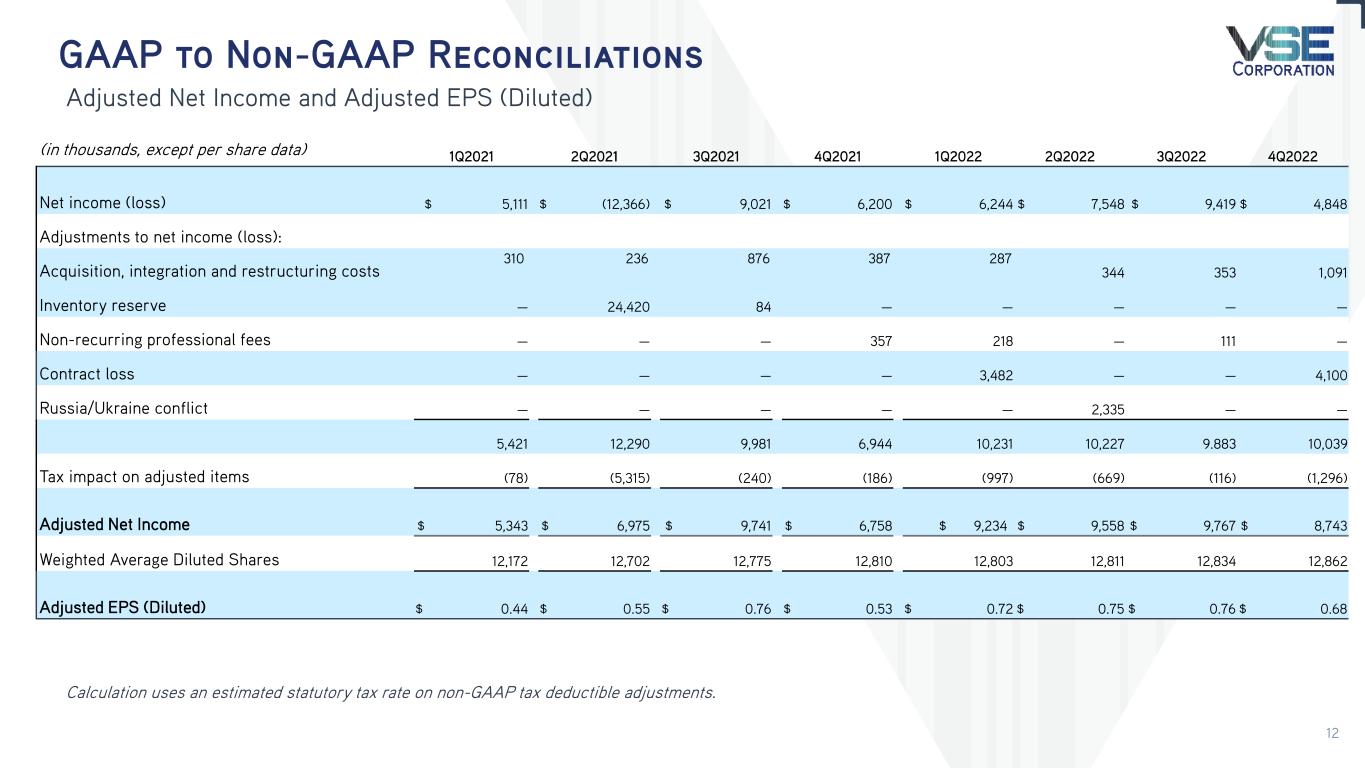
Reconciliation of Adjusted Net Income and Adjusted EPS to Net Income
| Three months ended December 31, | For the years ended December 31, | ||||||||||||||||||||||||||||||||||||||||
| (in thousands) | 2022 | 2021 | % Change | 2022 | 2021 | % Change | |||||||||||||||||||||||||||||||||||
| Net income | $ | 4,848 | $ | 6,200 | (21.8) | % | $ | 28,059 | $ | 7,966 | 252.2 | % | |||||||||||||||||||||||||||||
| Adjustments to net income: | |||||||||||||||||||||||||||||||||||||||||
| Acquisition and restructuring costs | 1,091 | 387 | 181.9 | % | 2,076 | 1,809 | 14.8 | % | |||||||||||||||||||||||||||||||||
| Inventory reserve | — | — | — | % | — | 24,420 | (100.0) | % | |||||||||||||||||||||||||||||||||
| Non-recurring professional fees | — | 357 | (100.0) | % | 329 | 357 | (7.8) | % | |||||||||||||||||||||||||||||||||
Contract loss (1) | 4,100 | — | — | % | 7,582 | — | — | % | |||||||||||||||||||||||||||||||||
Russia/Ukraine conflict (2) | — | — | — | % | 2,335 | — | — | % | |||||||||||||||||||||||||||||||||
| 10,039 | 6,944 | 44.6 | % | 40,381 | 34,552 | 16.9 | % | ||||||||||||||||||||||||||||||||||
| Tax impact of adjusted items | (1,296) | (186) | 596.8 | % | (3,077) | (6,639) | (53.7) | % | |||||||||||||||||||||||||||||||||
| Adjusted net income | $ | 8,743 | $ | 6,758 | 29.4 | % | $ | 37,304 | $ | 27,913 | 33.6 | % | |||||||||||||||||||||||||||||
| Weighted average dilutive shares | 12,862 | 12,810 | 0.4 | % | 12,828 | 12,633 | 1.5 | % | |||||||||||||||||||||||||||||||||
| Adjusted EPS (Diluted) | $ | 0.68 | $ | 0.53 | 28.3 | % | $ | 2.91 | $ | 2.21 | 31.7 | % | |||||||||||||||||||||||||||||
(1) Contract loss related to a specific fixed-price, non-DoD contract with a foreign customer is not considered indicative of ongoing business operations and strategy. | |||||||||||||||||||||||||||||||||||||||||
(2) Adjustment represents a non-cash charge recorded to reduce the carrying amount of accounts receivable and inventory related to the Russia/Ukraine military conflict. | |||||||||||||||||||||||||||||||||||||||||
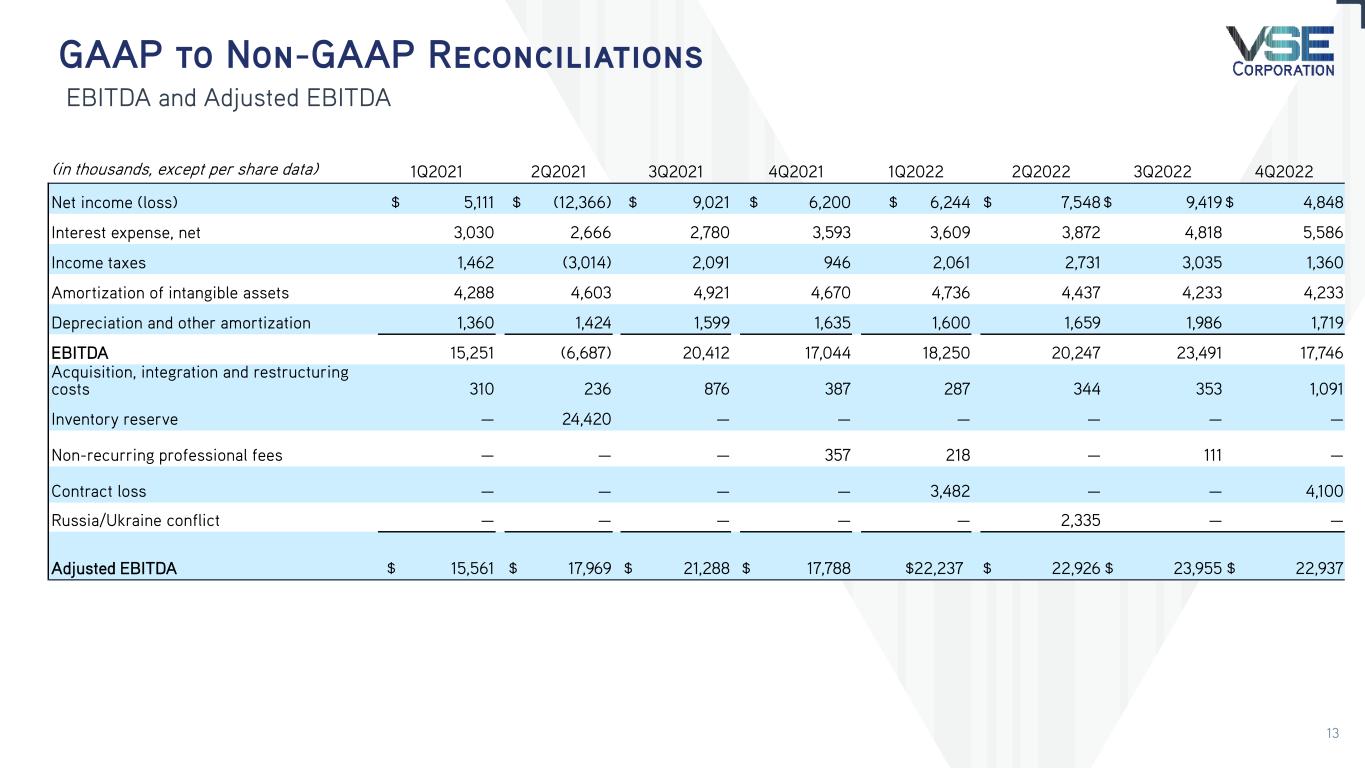
Reconciliation of Consolidated EBITDA and Adjusted EBITDA to Net Income
| Three months ended December 31, | For the years ended December 31, | ||||||||||||||||||||||||||||||||||||||||
| (in thousands) | 2022 | 2021 | % Change | 2022 | 2021 | % Change | |||||||||||||||||||||||||||||||||||
| Net income | $ | 4,848 | $ | 6,200 | (21.8) | % | $ | 28,059 | $ | 7,966 | 252.2 | % | |||||||||||||||||||||||||||||
| Interest expense | 5,586 | 3,593 | 55.5 | % | 17,885 | 12,069 | 48.2 | % | |||||||||||||||||||||||||||||||||
| Income taxes | 1,360 | 946 | 43.8 | % | 9,187 | 1,485 | 518.7 | % | |||||||||||||||||||||||||||||||||
| Amortization of intangible assets | 4,233 | 4,670 | (9.4) | % | 17,639 | 18,482 | (4.6) | % | |||||||||||||||||||||||||||||||||
| Depreciation and other amortization | 1,719 | 1,635 | 5.1 | % | 6,963 | 6,018 | 15.7 | % | |||||||||||||||||||||||||||||||||
| EBITDA | 17,746 | 17,044 | 4.1 | % | 79,733 | 46,020 | 73.3 | % | |||||||||||||||||||||||||||||||||
| Acquisition and restructuring costs | 1,091 | 387 | 181.9 | % | 2,076 | 1,809 | 14.8 | % | |||||||||||||||||||||||||||||||||
| Inventory reserve | — | — | — | % | — | 24,420 | (100.0) | % | |||||||||||||||||||||||||||||||||
| Non-recurring professional fees | — | 357 | (100.0) | % | 329 | 357 | (7.8) | % | |||||||||||||||||||||||||||||||||
Contract loss (1) | 4,100 | — | — | % | 7,582 | — | — | % | |||||||||||||||||||||||||||||||||
Russia/Ukraine conflict (2) | — | — | — | % | 2,335 | — | — | % | |||||||||||||||||||||||||||||||||
| Adjusted EBITDA | $ | 22,937 | $ | 17,788 | 28.9 | % | $ | 92,055 | $ | 72,606 | 26.8 | % | |||||||||||||||||||||||||||||
(1) Contract loss related to a specific fixed-price, non-DoD contract with a foreign customer is not considered indicative of ongoing business operations and strategy. | |||||||||||||||||||||||||||||||||||||||||
(2) Adjustment represents a non-cash charge recorded to reduce the carrying amount of accounts receivable and inventory related to the Russia/Ukraine military conflict. | |||||||||||||||||||||||||||||||||||||||||
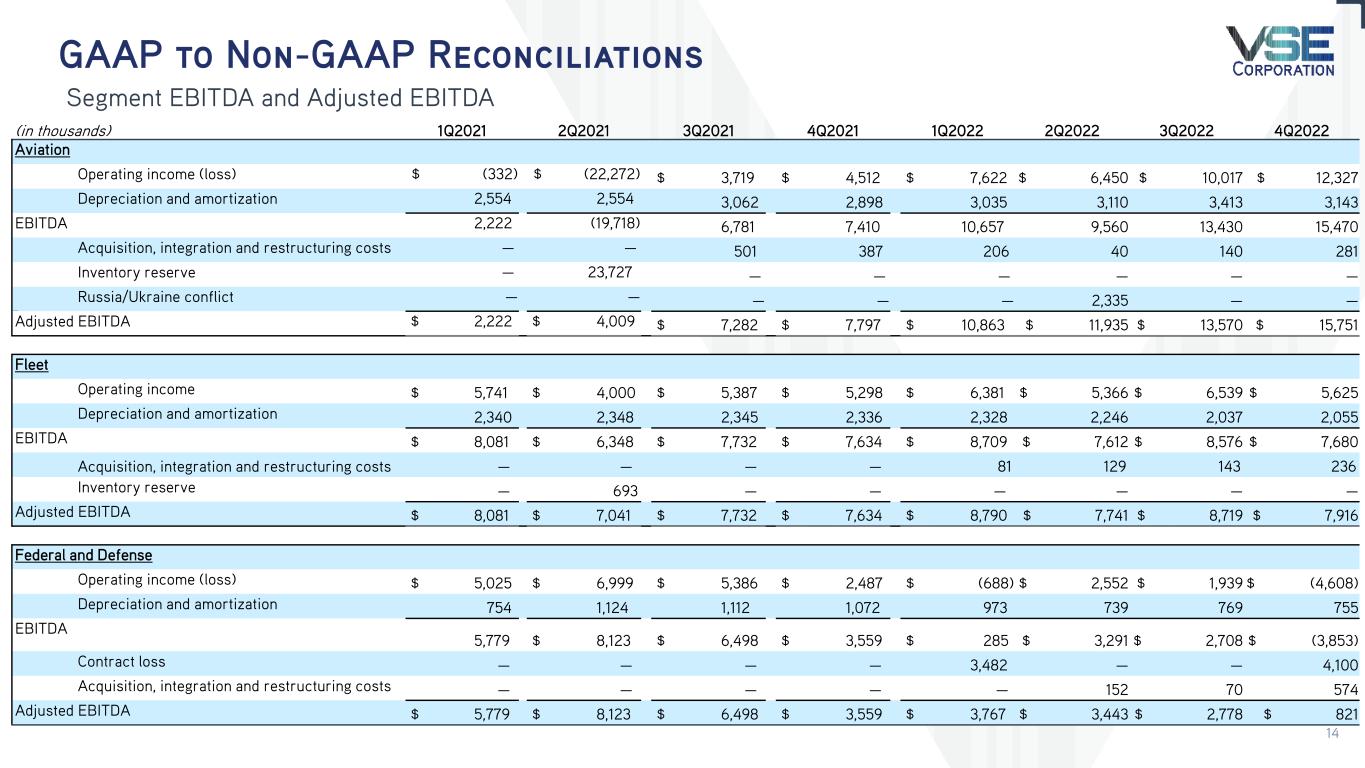
Reconciliation of Segment EBITDA and Adjusted EBITDA to Operating Income (Loss)
| Three months ended December 31, | For the years ended December 31, | ||||||||||||||||||||||||||||||||||||||||
| (in thousands) | 2022 | 2021 | % Change | 2022 | 2021 | % Change | |||||||||||||||||||||||||||||||||||
| Aviation | |||||||||||||||||||||||||||||||||||||||||
| Operating income (loss) | $ | 12,327 | $ | 4,512 | 173.2 | % | $ | 36,416 | $ | (14,373) | (353.4) | % | |||||||||||||||||||||||||||||
| Depreciation and amortization | 3,143 | 2,898 | 8.5 | % | 12,701 | 11,068 | 14.8 | % | |||||||||||||||||||||||||||||||||
| EBITDA | 15,470 | 7,410 | 108.8 | % | 49,117 | (3,305) | 53.4 | % | |||||||||||||||||||||||||||||||||
| Acquisition and restructuring costs | 281 | 387 | (27.4) | % | 668 | 888 | (24.8) | % | |||||||||||||||||||||||||||||||||
| Inventory reserve | — | — | — | % | — | 23,727 | (100.0) | % | |||||||||||||||||||||||||||||||||
Russia/Ukraine conflict (2) | — | — | — | % | 2,335 | — | — | % | |||||||||||||||||||||||||||||||||
| Adjusted EBITDA | $ | 15,751 | $ | 7,797 | 102.0 | % | $ | 52,120 | $ | 21,310 | 144.6 | % | |||||||||||||||||||||||||||||
| Fleet | |||||||||||||||||||||||||||||||||||||||||
| Operating income | $ | 5,625 | $ | 5,298 | 6.2 | % | $ | 23,911 | $ | 20,426 | 17.1 | % | |||||||||||||||||||||||||||||
| Depreciation and amortization | 2,055 | 2,336 | (12.0) | % | 8,666 | 9,369 | (7.5) | % | |||||||||||||||||||||||||||||||||
| EBITDA | 7,680 | 7,634 | 0.6 | % | 32,577 | 29,795 | 9.3 | % | |||||||||||||||||||||||||||||||||
| Acquisition and restructuring costs | 236 | — | — | % | 590 | — | — | % | |||||||||||||||||||||||||||||||||
| Inventory reserve | — | — | — | % | — | 693 | (100.0) | % | |||||||||||||||||||||||||||||||||
| Adjusted EBITDA | $ | 7,916 | $ | 7,634 | 3.7 | % | $ | 33,167 | $ | 30,488 | 8.8 | % | |||||||||||||||||||||||||||||
| Federal and Defense | |||||||||||||||||||||||||||||||||||||||||
| Operating (loss) income | $ | (4,608) | $ | 2,487 | (285.3) | % | $ | (805) | $ | 19,897 | (104.0) | % | |||||||||||||||||||||||||||||
| Depreciation and amortization | 755 | 1,072 | (29.6) | % | 3,235 | 4,063 | (20.4) | % | |||||||||||||||||||||||||||||||||
| EBITDA | (3,853) | 3,559 | (208.3) | % | 2,430 | 23,960 | (89.9) | % | |||||||||||||||||||||||||||||||||
Contract loss (1) | 4,100 | — | — | % | 7,582 | — | — | % | |||||||||||||||||||||||||||||||||
| Acquisition and restructuring costs | 574 | — | — | % | 796 | — | — | % | |||||||||||||||||||||||||||||||||
| Adjusted EBITDA | $ | 821 | $ | 3,559 | (76.9) | % | $ | 10,808 | $ | 23,960 | (54.9) | % | |||||||||||||||||||||||||||||
(1) Contract loss related to a specific fixed-price, non-DoD contract with a foreign customer is not considered indicative of ongoing business operations and strategy. | |||||||||||||||||||||||||||||||||||||||||
(2) Adjustment represents a non-cash charge recorded to reduce the carrying amount of accounts receivable and inventory related to the Russia/Ukraine military conflict. | |||||||||||||||||||||||||||||||||||||||||
| Three months ended December 31, | For the years ended December 31, | |||||||||||||||||||||||||||||||||||||
| (in thousands) | 2022 | 2021 | % Change | 2022 | 2021 | % Change | ||||||||||||||||||||||||||||||||
| Adjusted EBITDA Summary | ||||||||||||||||||||||||||||||||||||||
| Aviation | $ | 15,751 | $ | 7,797 | 102.0 | % | $ | 52,120 | $ | 21,310 | 144.6 | % | ||||||||||||||||||||||||||
| Fleet | 7,916 | 7,634 | 3.7 | % | 33,167 | 30,488 | 8.8 | % | ||||||||||||||||||||||||||||||
| Federal and Defense | 821 | 3,559 | (76.9) | % | 10,808 | 23,960 | (54.9) | % | ||||||||||||||||||||||||||||||
Adjusted Corporate expenses (1) | (1,551) | (1,202) | 29.0 | % | (4,040) | (3,152) | 28.2 | % | ||||||||||||||||||||||||||||||
| Adjusted EBITDA | $ | 22,937 | $ | 17,788 | 28.9 | % | $ | 92,055 | $ | 72,606 | 26.8 | % | ||||||||||||||||||||||||||
(1) Includes certain adjustments not directly attributable to any of our segments. | ||||||||||||||||||||||||||||||||||||||
Reconciliation of Operating Cash to Free Cash Flow
| Three months ended December 31, | For the years ended December 31, | |||||||||||||||||||||||||
| (in thousands) | 2022 | 2021 | 2022 | 2021 | ||||||||||||||||||||||
| Net cash provided by (used in) operating activities | $ | 12,257 | $ | 12,921 | $ | 8,051 | $ | (17,602) | ||||||||||||||||||
| Capital expenditures | (3,796) | (2,914) | (11,212) | (10,520) | ||||||||||||||||||||||
| Free cash flow | $ | 8,461 | $ | 10,007 | $ | (3,161) | $ | (28,122) | ||||||||||||||||||
Reconciliation of Debt to Net Debt
| For the years ended December 31, | ||||||||||||||
| (in thousands) | 2022 | 2021 | ||||||||||||
| Principal amount of debt | $ | 288,610 | $ | 286,734 | ||||||||||
| Debt issuance costs | (2,310) | (2,165) | ||||||||||||
| Cash and cash equivalents | (478) | (518) | ||||||||||||
| Net debt | $ | 285,822 | $ | 284,051 | ||||||||||
The non-GAAP Financial Information set forth in this document is not calculated in accordance with GAAP under SEC Regulation G. We consider Adjusted Net Income, Adjusted EPS (Diluted), EBITDA, Adjusted EBITDA, net debt and free cash flow as non-GAAP financial measures and important indicators of performance and useful metrics for management and investors to evaluate our business' ongoing operating performance on a consistent basis across reporting periods. These non-GAAP financial measures, however, should not be considered in isolation or as a substitute for performance measures prepared in accordance with GAAP. Adjusted Net Income represents Net Income adjusted for acquisition-related costs including any earn-out adjustments, loss on sale of a business entity and certain assets, gain on sale of property, other discrete items, and related tax impact. Adjusted EPS (Diluted) is computed by dividing net income, adjusted for the discrete items as identified above and the related tax impacts, by the diluted weighted average number of common shares outstanding. EBITDA represents net income before interest expense, income taxes, amortization of intangible assets and depreciation and other amortization. Adjusted EBITDA represents EBITDA (as defined above) adjusted for discrete items as identified above. Net debt is defined as total debt less cash and cash equivalents. Free cash flow represents operating cash flow less capital expenditures.
CONFERENCE CALL
A conference call will be held Thursday, March 9, 2023 at 8:30 A.M. EST to review the Company’s financial results, discuss recent events and conduct a question-and-answer session.
A webcast of the conference call and accompanying presentation materials will be available in the Investor Relations section of VSE’s website at https://ir.vsecorp.com. To listen to the live broadcast, go to the site at least 15 minutes prior to the scheduled start time to register, download and install any necessary audio software.
To participate in the live teleconference:
Domestic Live: | (877) 407-0789 | ||||
International Live: | (201) 689-8562 | ||||
| Audio Webcast: | https://viavid.webcasts.com/starthere.jsp?ei=1595094&tp_key=8f7e49ac4b | ||||
To listen to a replay of the teleconference through March 23, 2023:
Domestic Replay: | (844) 512-2921 | ||||
International Replay: | (412) 317-6671 | ||||
Replay PIN Number: | 13735917 | ||||
ABOUT VSE CORPORATION
VSE is a leading provider of aftermarket distribution and repair services for land, sea and air transportation assets for government and commercial markets. Core services include MRO services, parts distribution, supply chain management and logistics, engineering support, and consulting and training services for global commercial, federal, military and defense customers. VSE also provides information technology and energy consulting services. For additional information regarding VSE’s services and products, visit www.vsecorp.com.
Please refer to the Form 10-K that will be filed with the Securities and Exchange Commission (SEC) on or about March 9, 2023 for more details on our fourth quarter and full year 2022 results. VSE encourages investors and others to review the detailed reporting and disclosures contained in VSE’s public filings for additional discussion about the status of customer programs and contract awards, risks, revenue sources and funding, dependence on material customers, and management’s discussion of short- and long-term business challenges and opportunities.
FORWARD-LOOKING STATEMENTS
This document contains certain forward-looking statements. These forward-looking statements, which are included in accordance with the safe harbor provisions of the Private Securities Litigation Reform Act of 1995, may involve known and unknown risks, uncertainties and other factors that may cause VSE’s actual results and performance in future periods to be materially different from any future results or performance suggested by the forward-looking statements in this document. Although we believe the expectations reflected in such forward-looking statements are based upon reasonable assumptions, we can give no assurance that actual results will not differ materially from these expectations. “Forward-looking” statements, as such term is defined by the SEC in its rules, regulations and releases, represent our expectations or beliefs, including, but not limited to, statements concerning our operations, economic performance, financial condition, the impact of widespread health developments, such as the ongoing COVID-19 outbreak, the health and economic impact thereof, and the governmental, including federal contractor vaccine mandates, commercial, consumer and other responses thereto, growth and acquisition strategies, investments and future operational plans. Without limiting the generality of the foregoing, words such as “may,” “will,” “expect,” “believe,” “anticipate,” “intend,” “forecast,” “seek,” “plan,” “predict,” “project,” “could,” “estimate,” “might,” “continue,” “seeking” or the negative or other variations thereof or comparable terminology are intended to identify forward-looking statements. These statements, by their nature, involve substantial risks and uncertainties,
certain of which are beyond our control, and actual results may differ materially depending on a variety of important factors, including, but not limited to, the uncertainty surrounding the ongoing COVID-19 outbreak and the impacts thereof, risks related to our work on large government programs, our ability to successfully integrate recently acquired businesses, risk related to the performance of the aviation aftermarket, global economic and political conditions, prolonged periods of inflation and our ability to mitigate the impact thereof, our dependence on third-party package delivery companies, risks related to technology security and cyber-attack, risks related to our outstanding indebtedness, and the other factors identified in our reports filed or expected to be filed with the SEC including our Annual Report on Form 10-K for the year ended December 31, 2022. All forward-looking statements made herein are qualified by these cautionary statements and risk factors and there can be no assurance that the actual results, events or developments referenced herein will occur or be realized. Readers are cautioned not to place undue reliance on these forward-looking-statements, which reflect management's analysis only as of the date hereof. We undertake no obligation to update or revise forward-looking statements to reflect changed assumptions, the occurrence of unanticipated events or changes to future operating results.
INVESTOR CONTACT
Noel Ryan, IRC
(720) 778-2415