VSE Corporation Announces Third Quarter 2022 Results
ALEXANDRIA, Va., October 26, 2022 - VSE Corporation (NASDAQ: VSEC, "VSE", or the "Company"), a leading provider of aftermarket distribution and maintenance, repair and overhaul ("MRO") services for land, sea and air transportation assets for government and commercial markets, today announced results for the third quarter 2022.
THIRD QUARTER 2022 RESULTS
(As compared to the Third Quarter 2021)
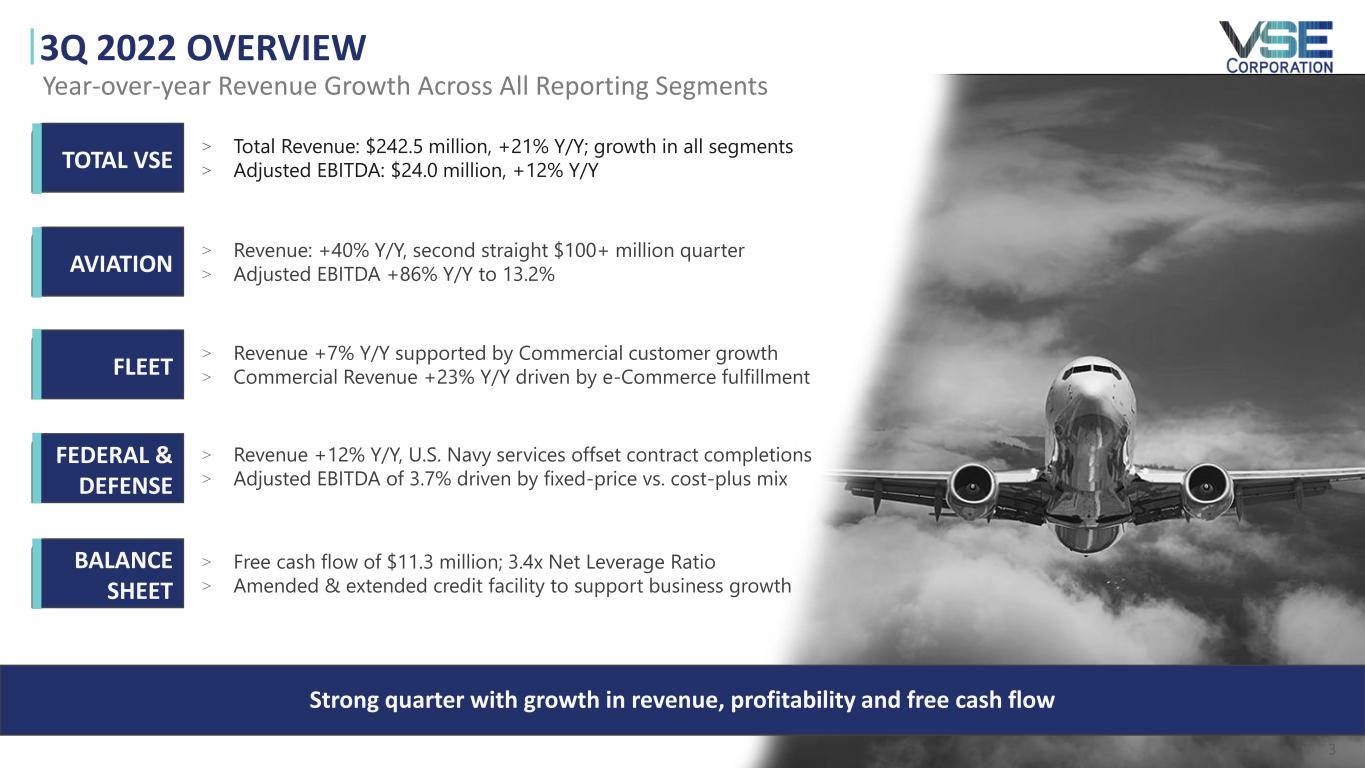
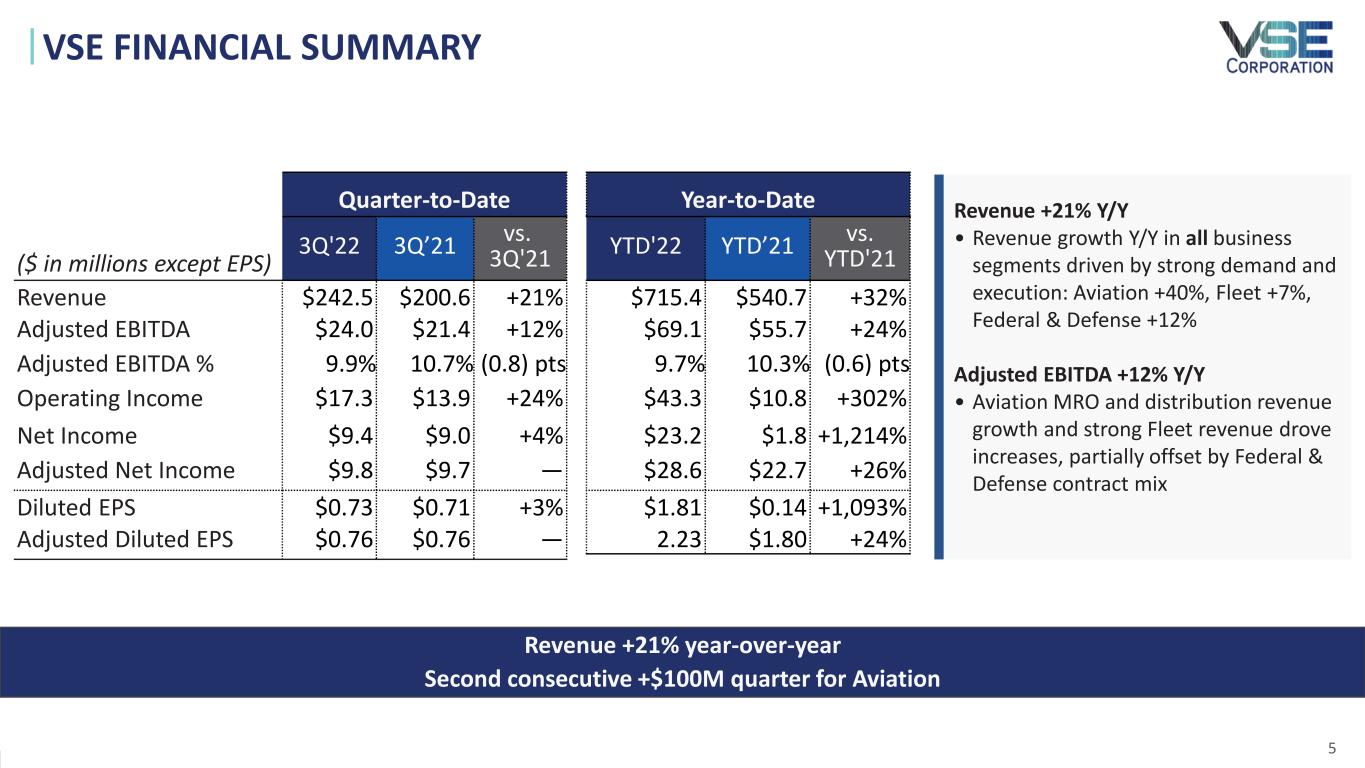
▪Total Revenues of $242.5 million increased 21%
▪GAAP Net Income of $9.4 million decreased 4%
▪GAAP EPS (Diluted) of $0.73 decreased 3%
▪Adjusted EBITDA of $24.0 million increased 12%
▪Adjusted Net Income of $9.8 million remained flat
▪Adjusted EPS (Diluted) of $0.76 remained flat
MANAGEMENT COMMENTARY
“VSE delivered a strong quarter with growth in revenue, profitability and free cash flow; as our teams continue to successfully execute our long-term business transformation strategy,” stated John Cuomo, President and CEO of VSE Corporation. “All three business segments reported year-over-year revenue growth, with the Aviation and Fleet segments recording their highest year-to-date revenue in company history,” continued Cuomo.
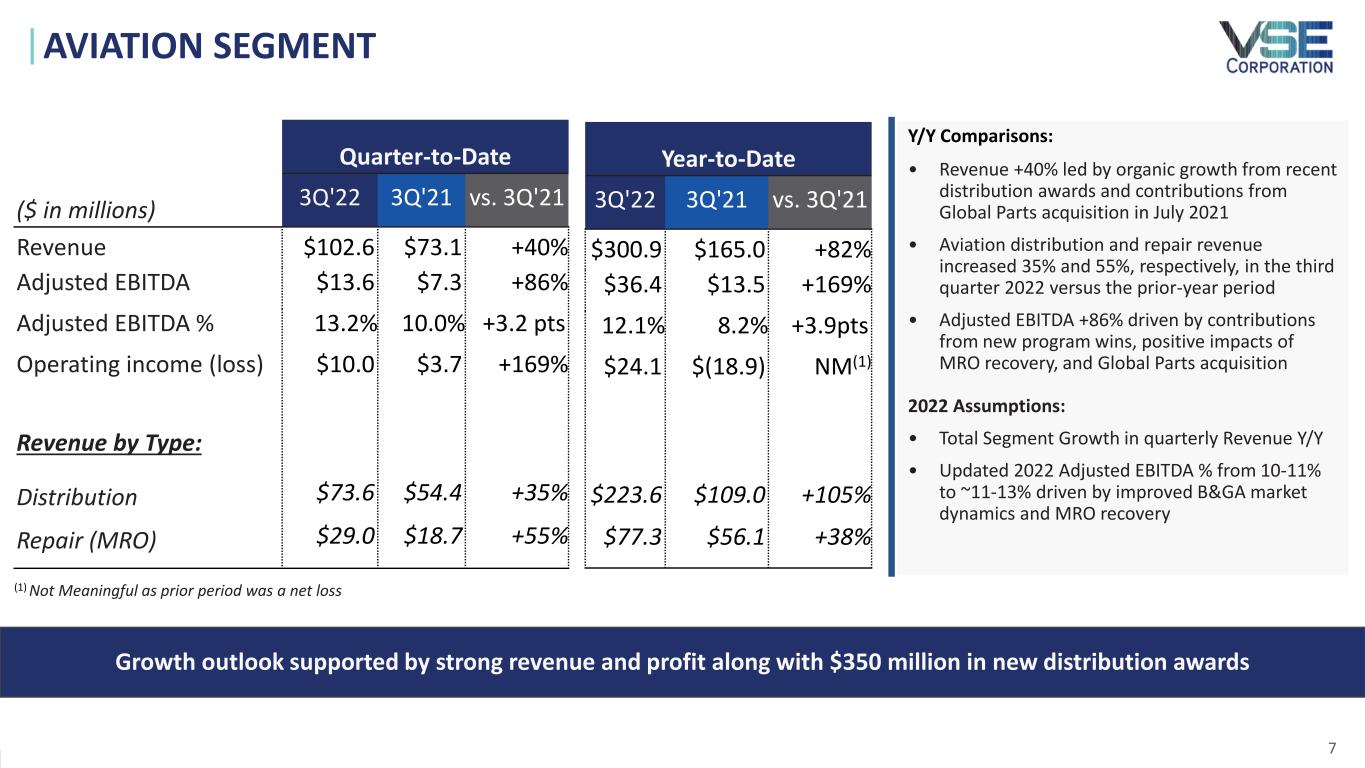
“Our Aviation segment reported revenue increases of 40% and an adjusted EBITDA increase of 86% or 326 basis points in the third quarter. Strong margins drove the quarter, along with revenue increases supported by growth in both MRO and distribution across all customer market segments. In addition to a strong quarter of financial results and program execution, we announced significant new business that expands our geographic presence and leverage our proven distribution and product line management capabilities. These include four new exclusive distribution agreements valued at approximately $350 million,” continued Cuomo.
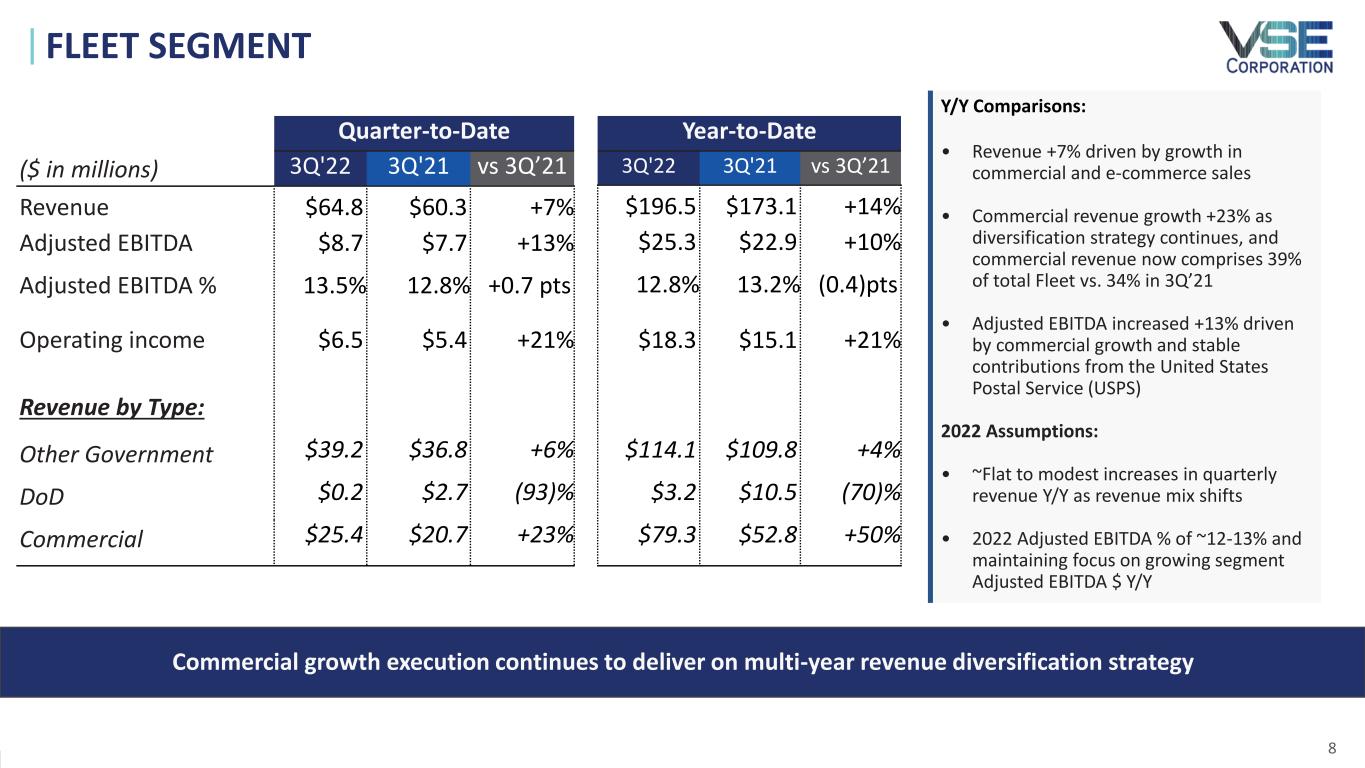
“In the Fleet segment, commercial revenue increased by 23% on a year-over-year basis, representing approximately 40% of total Fleet segment revenue for the third consecutive quarter. To meet growing commercial demand and drive our revenue diversification strategy, we announced a new distribution facility outside of Memphis, Tennessee which will be dedicated to supporting commercial and e-commerce fulfillment customers,” continued Cuomo.
“Through the first nine months of 2022, we’ve won significant new business, accelerated our long-term business transformation strategy, and generated strong year-over-year organic growth in revenue, net income, and EBITDA. I’m proud of the VSE team, the strong customer and supplier focused implementation of new programs, and the many recent new business awards,” concluded Cuomo.
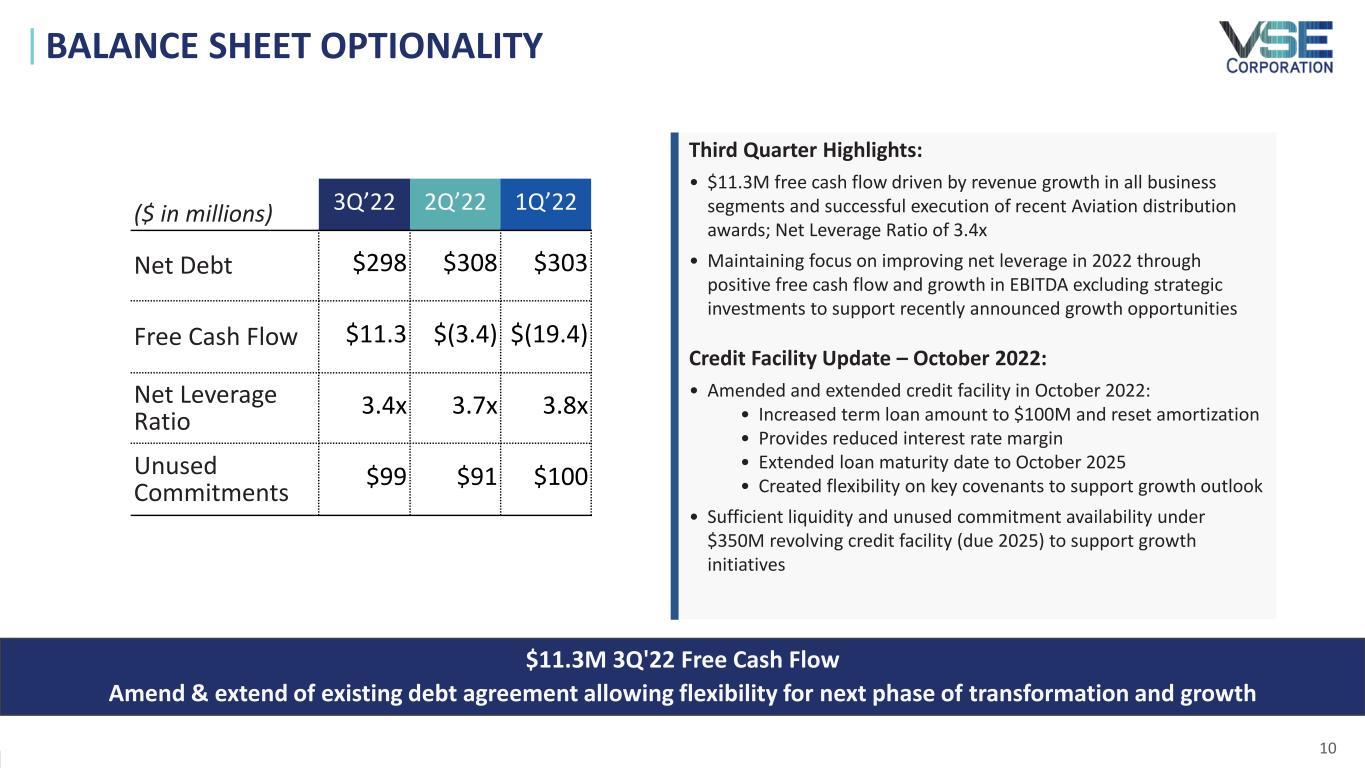
“Disciplined balance sheet management remains a key area of focus for our team,” stated Stephen Griffin, CFO of VSE Corporation. “VSE generated strong free cash flow of $11.3 million in the third quarter, in line with our previously communicated expectations. In October, we amended the existing loan agreement with our commercial banking syndicate and extended the term to 2025. This amendment supports the flexibility to grow revenue through organic and inorganic investments, including the recent new business announcements. We expect strong cash flow to continue following these new investments, which will further our goal of driving sustainable, long-term revenue.”
STRATEGIC UPDATE
During the third quarter, VSE continued to effectively execute its business transformation roadmap, with a focus on developing a leading aftermarket parts distribution and MRO services platform that addresses underserved, high-growth market segments. This value creation strategy is driven by a focus on new business and sustainable recurring revenue channels, growth in adjusted EBITDA, and optimization of legacy programs.
New Business and Long-Term, Sustainable Revenue Channels:
•In October 2022, the Aviation segment announced an expansion of the existing Pratt & Whitney Canada distribution agreement to now include the Asia Pacific region. Under the terms of this new expanded agreement, VSE Aviation will provide engine spare parts and engine accessory exchange support to Business & General Aviation (B&GA) engine operators, customers, and maintenance providers throughout the Asia Pacific region. This 15-year agreement expands the Company’s international reach and builds upon the success of recent program execution excellence.
•During the quarter, the Aviation segment secured a new 2-year agreement to distribute over 200,000 spare parts supporting Embraer business jets, including Phenom, Praetor, Legacy, and Lineage airframes. This new agreement builds on the VSE brand of supporting airframe OEMs with aftermarket support for both in-production and late-in-life stages in the B&GA market.
•The Fleet segment revenue diversification strategy continued to progress in the quarter with commercial revenue growth of 23% year-over-year. Year-to-date commercial revenue represented 39% of total segment revenue.
•To support continued e-commerce and e-commerce fulfillment growth, the Fleet segment announced plans to open a new distribution warehouse and e-commerce fulfillment center of excellence in the greater Memphis, Tennessee area. This new, state-of-the-art, 425,000 square foot facility will double the company’s existing warehouse footprint. The facility is scheduled to begin servicing customers in the first quarter of 2023, with on-hand stock of more than 175,000 SKUs once fully operational.
•The Federal & Defense segment secured $5 million in new bookings with the new VSE Distribution and Logistics capability and delivered a book to bill of 2.6x in the third quarter 2022. This new capability and revenue opportunity remains a growth channel for the segment.
Growing Adjusted EBITDA:
•Aviation segment adjusted EBITDA grew to $13.6 million in the third quarter, an increase of 86% versus the prior-year period, with segment EBITDA margin expansion of +326 bps year-over-year. The successful implementation of recently awarded distribution programs and increased MRO activity drove profitability improvements.
•Fleet segment adjusted EBITDA grew to $8.7 million, up 13% year-over-year. Steady contributions from USPS revenue combined with strong commercial growth contributed to adjusted EBITDA growth. Growing total segment adjusted EBITDA remains a critical component of Fleet segment strategy.
Optimizing Legacy Programs:
•The Aviation segment secured multiple multi-year contract renewals supporting sustained revenue while expanding VSE's scope and improving cross-selling opportunities. In October 2022, VSE Aviation entered into two exclusive distribution agreements with an established OEM partner to distribute inertial reference systems globally and fuselage mounted antenna (FMA) systems in Europe, Middle East, Africa and India (EMEAI). The expanded agreements will generate revenue opportunities as both new and existing business jet customers leverage the full breadth of the Company’s combined distribution and repair capabilities.
•Fleet segment USPS revenue grew to $39.1 million, up 7% in the third quarter versus the prior-year period. For the past 33 years, the Fleet segment has been, and continues to be, an essential part of USPS maintenance operations in support of its complex supply chain, servicing all vehicle types in the 230,000+ unit USPS fleet.
•Federal & Defense segment revenue increased in the quarter supported by the Naval Sea Systems Command (NAVSEA) program, which increased 82% year-over-year in the third quarter, primarily resulting from Foreign Military Sales (FMS) support. Activity on our FMS Program increased over the past year, driven by work to transfer a naval frigate to Bahrain. Additionally, in August 2022, the Federal & Defense segment was awarded an $86 million ceiling addition to the existing NAVSEA bridge contract in support of FMS requirements for the Egyptian Navy, supporting follow on technical services through 2024.
SEGMENT RESULTS
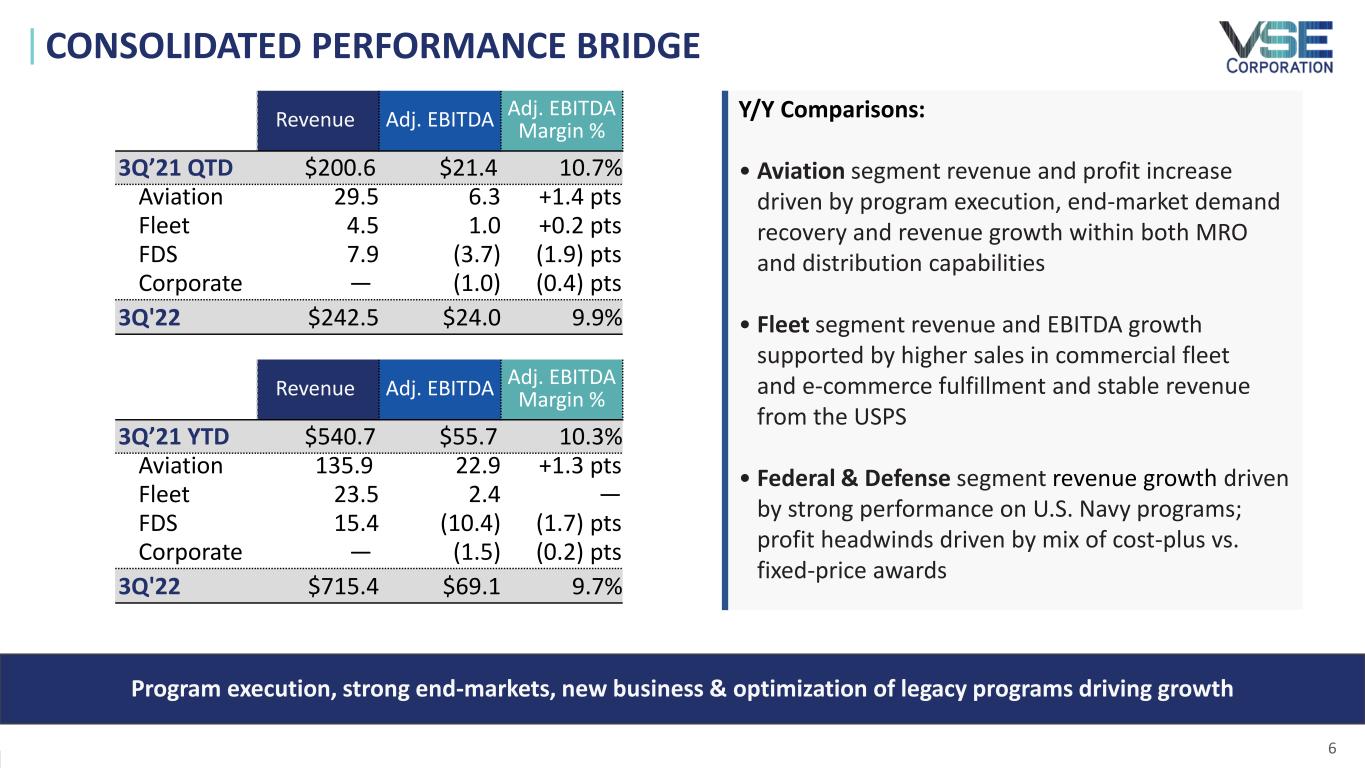
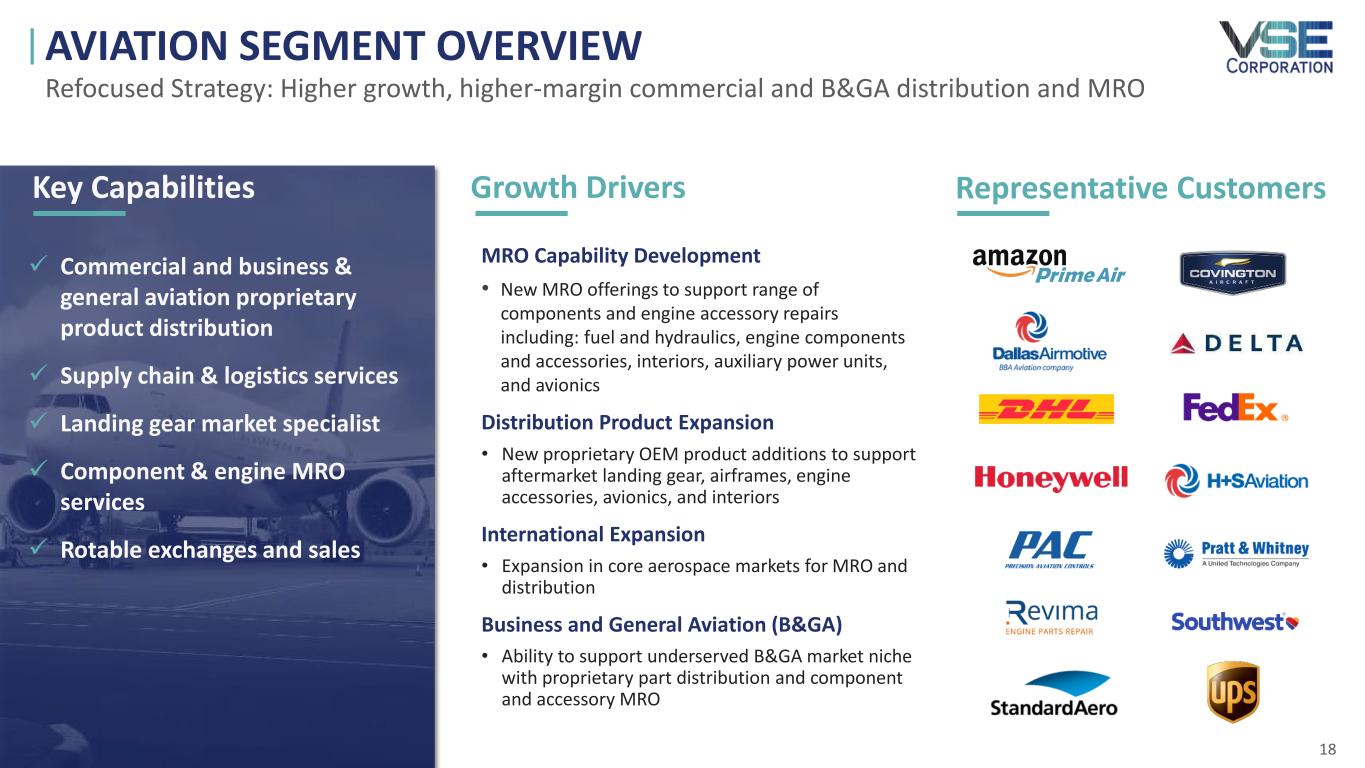
Aviation segment revenue increased 40% year-over-year to a record $102.6 million in the third quarter 2022. The year-over-year revenue improvement was attributable to share gains within the B&GA market and continued commercial aftermarket recovery, aligned with global revenue passenger kilometers. Aviation distribution and repair revenue increased 35% and 55%, respectively, in the third quarter versus the prior-year period. The Aviation segment reported operating income of $10.0 million in the third quarter, compared to $3.7 million in the same period of 2021. Segment adjusted EBITDA increased by 86% in the third quarter to $13.6 million, versus $7.3 million in the prior-year period. Adjusted EBITDA margins were 13.2%, an increase of 326 basis points versus the prior-year period, driven by execution of new program awards and continued end-market recovery.
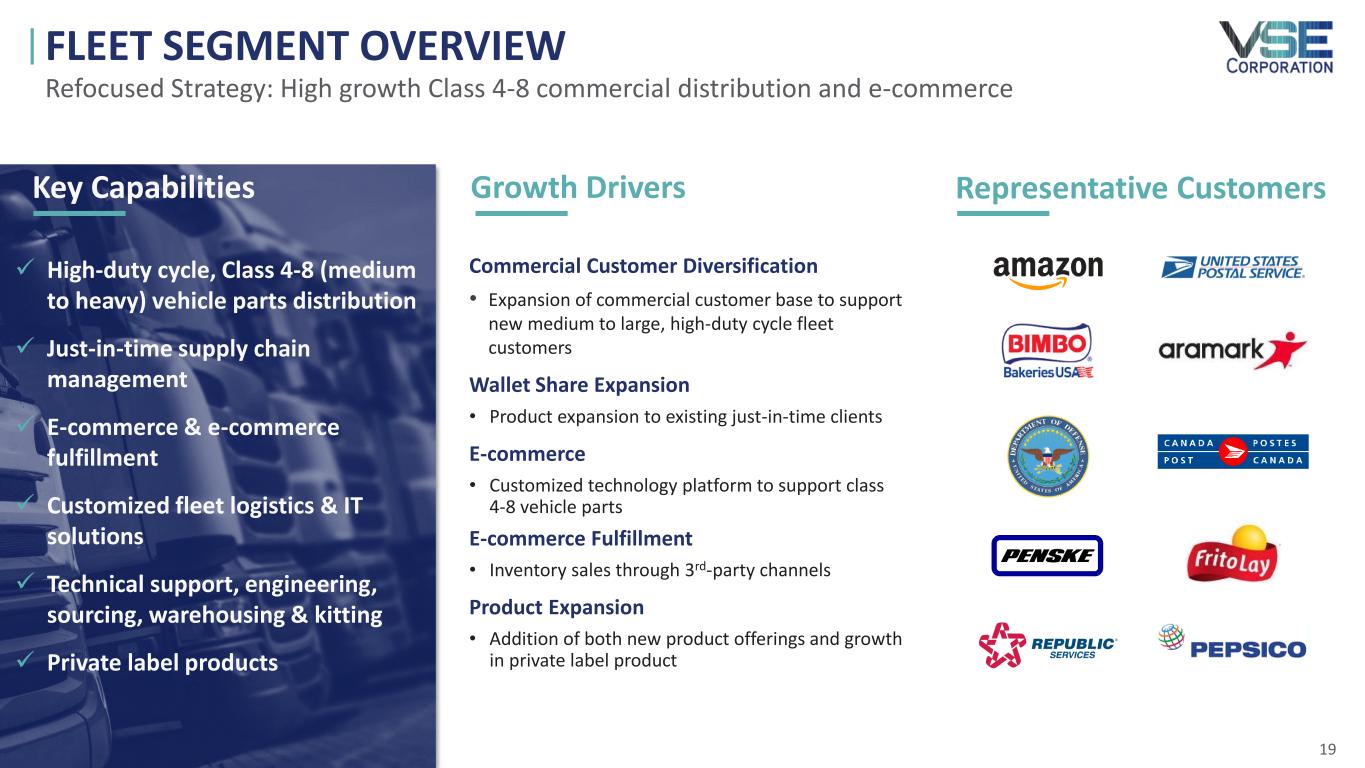
Fleet segment revenue increased 7% year-over-year to $64.8 million in the third quarter 2022. Revenues from commercial customers increased 23% on a year-over-year basis, driven by growth in commercial fleet demand and e-commerce fulfillment sales. Commercial revenue represented more than 39% of total Fleet segment revenue in the period for the third consecutive quarter. Segment adjusted EBITDA increased 13% year-over-year to $8.7 million, while adjusted EBITDA margin was 13.5%, an increase of 64 basis points versus the prior-year period.
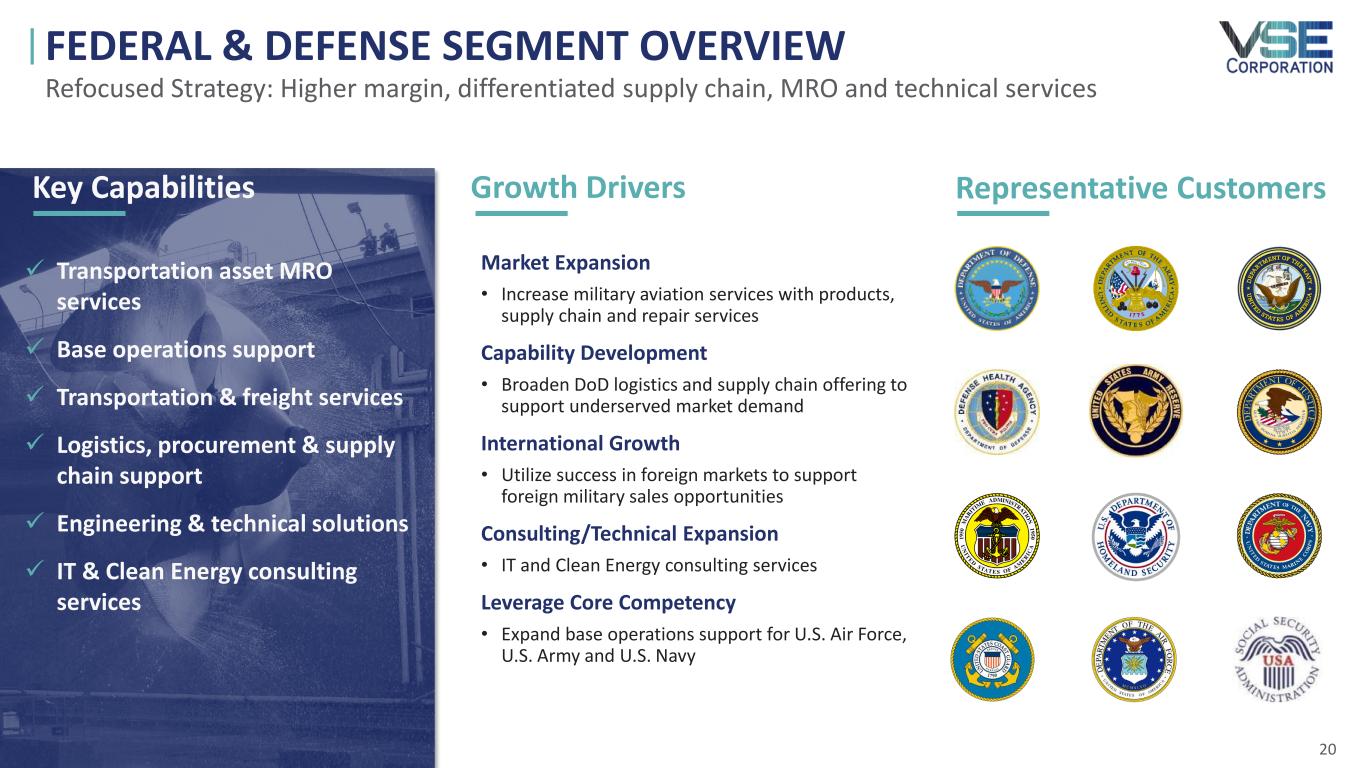
Federal & Defense segment revenue increased 12% year-over-year to $75.1 million in the third quarter 2022, driven by growth in the Foreign Military Sales (FMS) program with the U.S. Navy along with a steady increase in Defense Logistics Agency (DLA) distribution services. The Federal & Defense segment reported operating income of $1.9 million in the third quarter 2022. Segment adjusted EBITDA declined 57% year-over-year to $2.8 million in the period, given a higher mix of cost-plus contracts. Funded backlog increased 8% year-to-date to $199 million, while bookings increased 7% on a year-to-date basis.
FINANCIAL RESOURCES AND LIQUIDITY
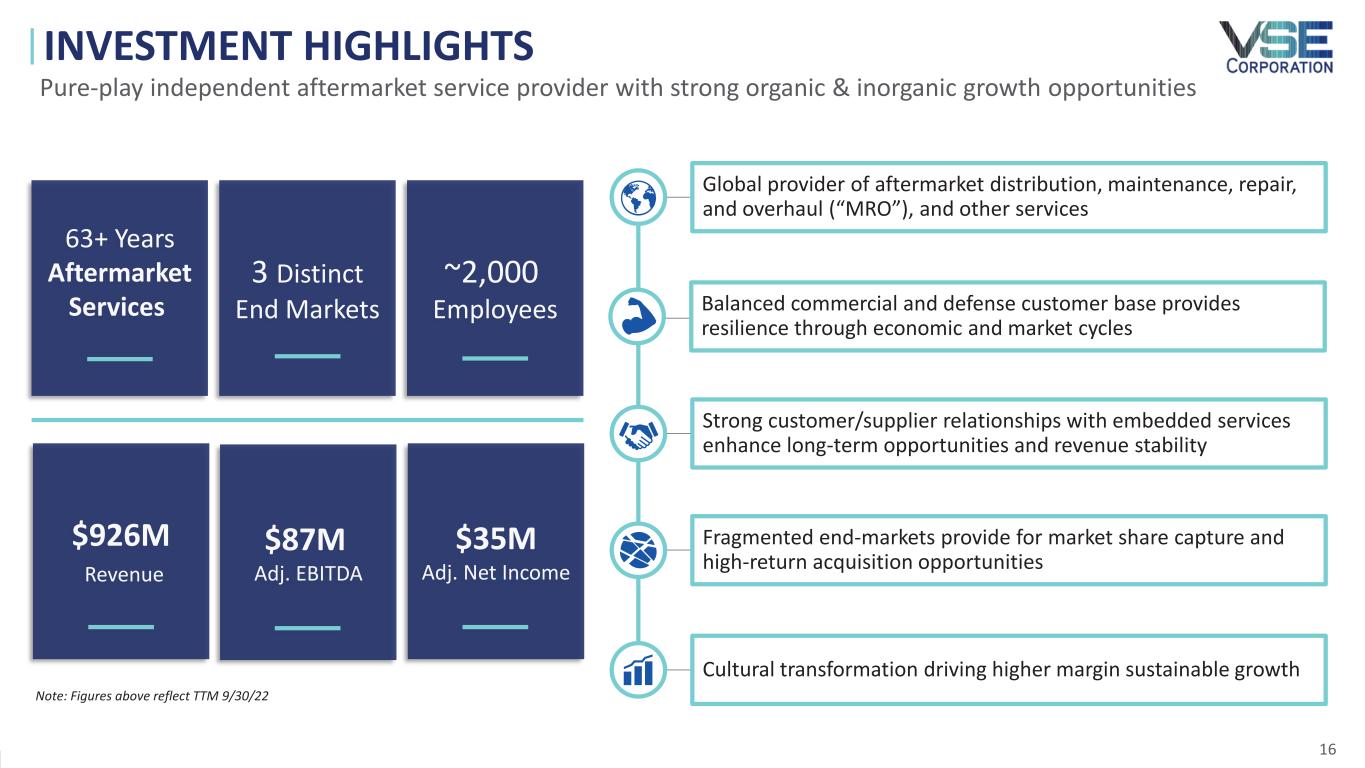
As of September 30, 2022, the Company had $99 million in cash and unused commitment availability under its $350 million revolving credit facility maturing in 2024. As of September 30, 2022, VSE had total net debt outstanding of $298 million and $86.9 million of trailing-twelve months adjusted EBITDA.
In October 2022, the Company entered into an amendment to its loan agreement which, among other things, extended the maturity dates with respect to the revolving credit facility and term loan facility to October 2025, transitioned its index to Secured Overnight Financing Rate (SOFR) term rates, and lowered the applicable base margins with modified Total Funded Debt to EBITDA Ratio requirements.
THIRD QUARTER RESULTS
| | | | | | | | | | | | | | | | | | | | | | | | | | | | | | | | | | | | | | | | | | | | |
| | | | | | | | | | | | | | | | | | |
| | | | Three months ended September 30, | | Nine months ended September 30, |
| (in thousands, except per share data) | | | | | | | | 2022 | | 2021 | | % Change | | 2022 | | 2021 | | % Change |
| Revenues | | | | | | | | $ | 242,487 | | | $ | 200,582 | | | 20.9 | % | | $ | 715,439 | | | $ | 540,675 | | | 32.3 | % |
| Operating income | | | | | | | | $ | 17,272 | | | $ | 13,892 | | | 24.3 | % | | $ | 43,337 | | | $ | 10,781 | | | 302.0 | % |
| Net income | | | | | | | | $ | 9,419 | | | $ | 9,021 | | | 4.4 | % | | $ | 23,211 | | | $ | 1,766 | | | 1,214.3 | % |
| EPS (Diluted) | | | | | | | | $ | 0.73 | | | $ | 0.71 | | | 2.8 | % | | $ | 1.81 | | | $ | 0.14 | | | 1,192.9 | % |
| | | | | | | | | | | | | | | | | | |
|
THIRD QUARTER SEGMENT RESULTS
The following is a summary of revenues and operating income (loss) for the three and nine months ended September 30, 2022 and September 30, 2021:
| | | | | | | | | | | | | | | | | | | | | | | | | | | | | | | | | | | | | | | | | | | | |
| | | | Three months ended September 30, | | Nine months ended September 30, |
| (in thousands) | | | | | | | | 2022 | | 2021 | | % Change | | 2022 | | 2021 | | % Change |
| Revenues: | | | | | | | | | | | | | | | | | | |
| Aviation | | | | | | | | $ | 102,625 | | | $ | 73,124 | | | 40.3 | % | | $ | 300,934 | | | $ | 165,010 | | | 82.4 | % |
| Fleet | | | | | | | | 64,754 | | | 60,268 | | | 7.4 | % | | 196,526 | | | 173,072 | | | 13.6 | % |
| Federal & Defense | | | | | | | | 75,108 | | | 67,190 | | | 11.8 | % | | 217,979 | | | 202,593 | | | 7.6 | % |
| Total revenues | | | | | | | | $ | 242,487 | | | $ | 200,582 | | | 20.9 | % | | $ | 715,439 | | | $ | 540,675 | | | 32.3 | % |
| | | | | | | | | | | | | | | | | | |
| Operating income (loss): | | | | | | | | | | | | | | | | | | |
| Aviation | | | | | | | | $ | 10,017 | | | $ | 3,719 | | | 169.3 | % | | $ | 24,089 | | | $ | (18,885) | | | NM(1) |
| Fleet | | | | | | | | 6,539 | | | 5,387 | | | 21.4 | % | | 18,286 | | | 15,128 | | | 20.9 | % |
| Federal & Defense | | | | | | | | 1,939 | | | 5,386 | | | (64.0) | % | | 3,803 | | | 17,410 | | | (78.2) | % |
| Corporate/unallocated expenses | | | | | | | | (1,223) | | | (600) | | | 103.8 | % | | (2,841) | | | (2,872) | | | (1.1) | % |
| Operating income | | | | | | | | $ | 17,272 | | | $ | 13,892 | | | 24.3 | % | | $ | 43,337 | | | $ | 10,781 | | | 302.0 | % |
| | | | | | | | | | | | | | | | | | |
(1) Not meaningful as prior period was a net loss |
The Company reported $4.7 million and $7.4 million of total capital expenditures for three and nine months ended September 30, 2022.
NON-GAAP MEASURES
In addition to the financial measures prepared in accordance with generally accepted accounting principles ("GAAP"), this earnings release also contains Non-GAAP financial measures. These measures provide useful information to investors, and a reconciliation of these measures to the most directly comparable GAAP measures and other information relating to these Non-GAAP measures is included in the supplemental schedules attached.
NON-GAAP FINANCIAL INFORMATION
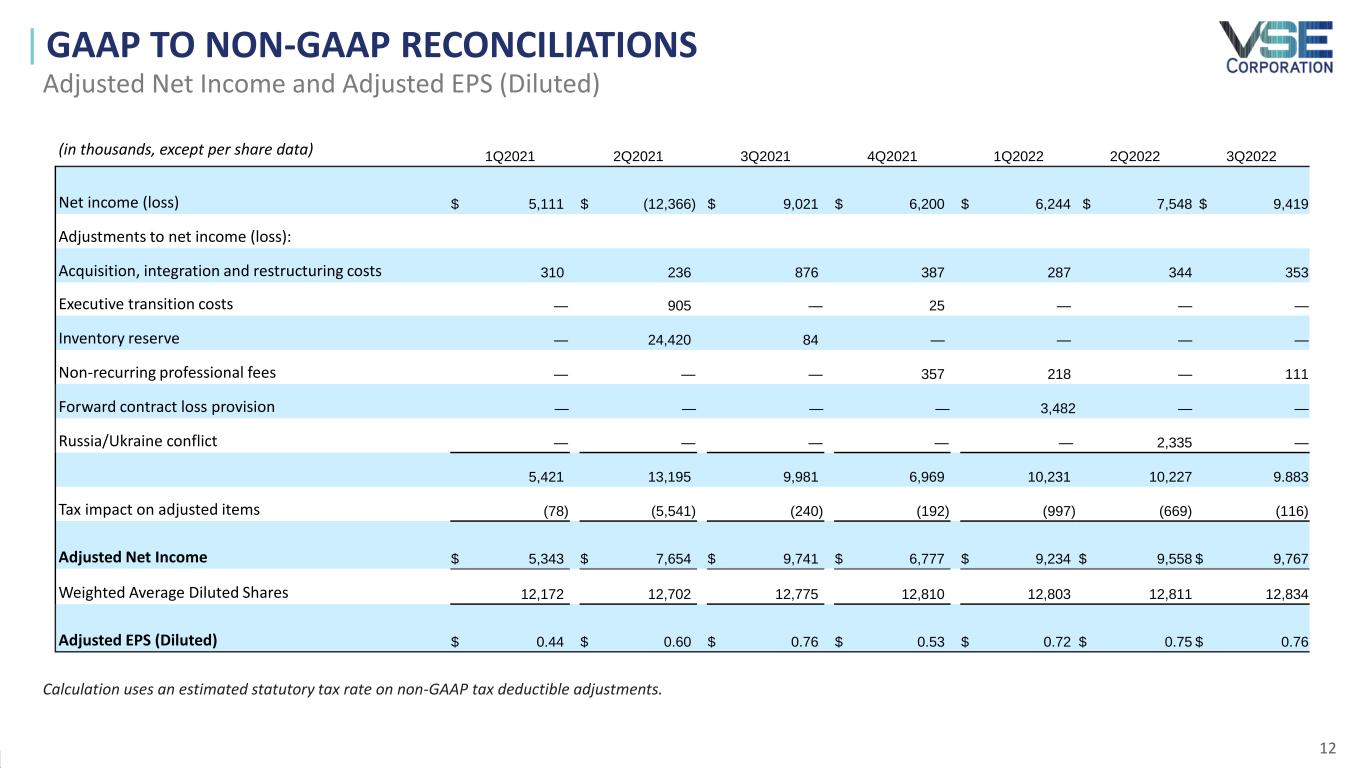
Reconciliation of Adjusted Net Income and Adjusted EPS to Net Income
| | | | | | | | | | | | | | | | | | | | | | | | | | | | | | | | | |
| | | Three months ended September 30, | | Nine months ended September 30, |
| (in thousands) | | 2022 | | 2021 | | | | 2022 | | 2021 | | |
| Net income | | $ | 9,419 | | | $ | 9,021 | | | | | $ | 23,211 | | | $ | 1,766 | | | |
| Adjustments to net income: | | | | | | | | | | | | |
| Acquisition, integration and restructuring costs | | 353 | | | 876 | | | | | 985 | | | 1,422 | | | |
| | | | | | | | | | | | | |
| Executive transition costs | | — | | | 84 | | | | | — | | | 905 | | | |
| Inventory reserve | | — | | | — | | | | | — | | | 24,420 | | | |
| Non-recurring professional fees | | 111 | | | — | | | | | 329 | | | — | | | |
| Forward contract loss provision | | — | | | — | | | | | 3,482 | | | — | | | |
| Russia/Ukraine conflict (1) | | — | | | — | | | | | 2,335 | | | — | | | |
| | 9,883 | | | 9,981 | | | | | 30,342 | | | 28,513 | | | |
| Tax impact of adjusted items | | (116) | | | (240) | | | | | (1,781) | | | (5,838) | | | |
| Adjusted net income | | $ | 9,767 | | | $ | 9,741 | | | | | $ | 28,561 | | | $ | 22,675 | | | |
| Weighted average dilutive shares | | 12,834 | | | 12,775 | | | | | 12,816 | | | 12,573 | | | |
| Adjusted EPS (Diluted) | | $ | 0.76 | | | $ | 0.76 | | | | | $ | 2.23 | | | $ | 1.80 | | | |
| | | | | | | | | | | | | |
(1) Adjustment represents a non-cash charge recorded to reduce the carrying amount of accounts receivable and inventory related to the Russia/Ukraine military conflict. |
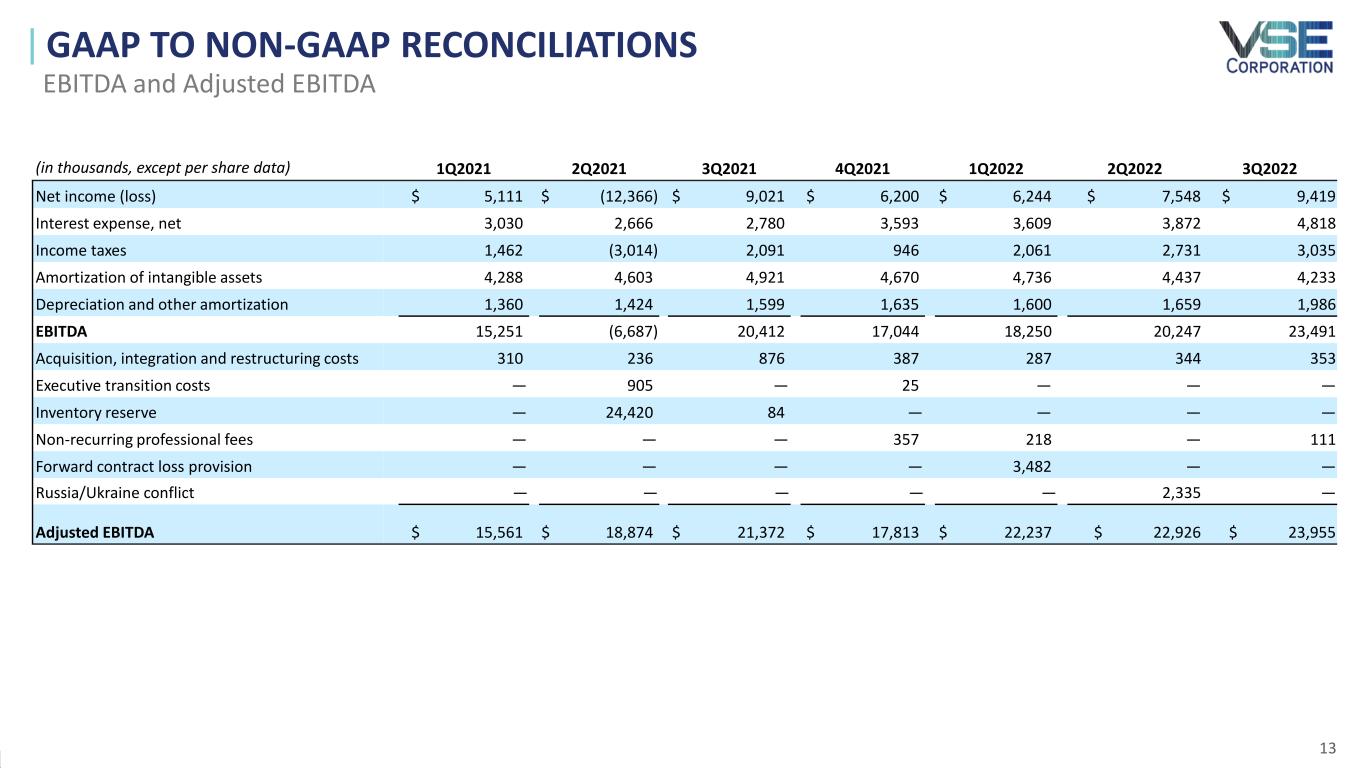
Reconciliation of Consolidated EBITDA and Adjusted EBITDA to Net Income | | | | | | | | | | | | | | | | | | | | | | | | | | | | | | | | | |
| | | Three months ended September 30, | | Nine months ended September 30, |
| (in thousands) | | 2022 | | 2021 | | | | 2022 | | 2021 | | |
| Net income | | $ | 9,419 | | | $ | 9,021 | | | | | $ | 23,211 | | | $ | 1,766 | | | |
| Interest expense | | 4,818 | | | 2,780 | | | | | 12,299 | | | 8,476 | | | |
| Income taxes | | 3,035 | | | 2,091 | | | | | 7,827 | | | 539 | | | |
| Amortization of intangible assets | | 4,233 | | | 4,921 | | | | | 13,406 | | | 13,812 | | | |
| Depreciation and other amortization | | 1,986 | | | 1,599 | | | | | 5,244 | | | 4,383 | | | |
| EBITDA | | 23,491 | | | 20,412 | | | | | 61,987 | | | 28,976 | | | |
| Acquisition, integration and restructuring costs | | 353 | | | 876 | | | | | 985 | | | 1,422 | | | |
| | | | | | | | | | | | | |
| Executive transition costs | | — | | | 84 | | | | | — | | | 905 | | | |
| Inventory reserve | | — | | | — | | | | | — | | | 24,420 | | | |
| Non-recurring professional fees | | 111 | | | — | | | | | 329 | | | — | | | |
| Forward contract loss provision | | — | | | — | | | | | 3,482 | | | — | | | |
| Russia/Ukraine conflict (1) | | — | | | — | | | | | 2,335 | | | — | | | |
| Adjusted EBITDA | | $ | 23,955 | | | $ | 21,372 | | | | | $ | 69,118 | | | $ | 55,723 | | | |
| | | | | | | | | | | | | |
(1) Adjustment represents a non-cash charge recorded to reduce the carrying amount of accounts receivable and inventory related to the Russia/Ukraine military conflict. |
| | | | | | | | | | | | | | | | | | | | | | | | | | | | | | | | | | | | | | | |
| Adjusted EBITDA Summary | | | | | | | | | | | | |
| Three months ended September 30, | | Nine months ended September 30, | |
| (in thousands) | 2022 | | 2021 | | % Change | | 2022 | | 2021 | | % Change | |
| Aviation | $ | 13,570 | | | $ | 7,282 | | | 86.3 | % | | $ | 36,369 | | | $ | 13,514 | | | 169.1 | % | |
| Fleet | 8,719 | | | 7,732 | | | 12.8 | % | | 25,251 | | | 22,854 | | | 10.5 | % | |
| Federal & Defense | 2,778 | | | 6,498 | | | (57.2) | % | | 9,987 | | | 20,401 | | | (51.0) | % | |
| Adjusted Corporate expenses (2) | (1,112) | | | (140) | | | 694.3 | % | | (2,489) | | | (1,046) | | | 138.0 | % | |
| Adjusted EBITDA | $ | 23,955 | | | $ | 21,372 | | | 12.1 | % | | $ | 69,118 | | | $ | 55,723 | | | 24.0 | % | |
| | | | | | | | | | | | | |
| | | | | | | | | | | | | |
| | | | | | | | | | | | | |
(2) Includes certain adjustments not directly attributable to any of our segments. | |
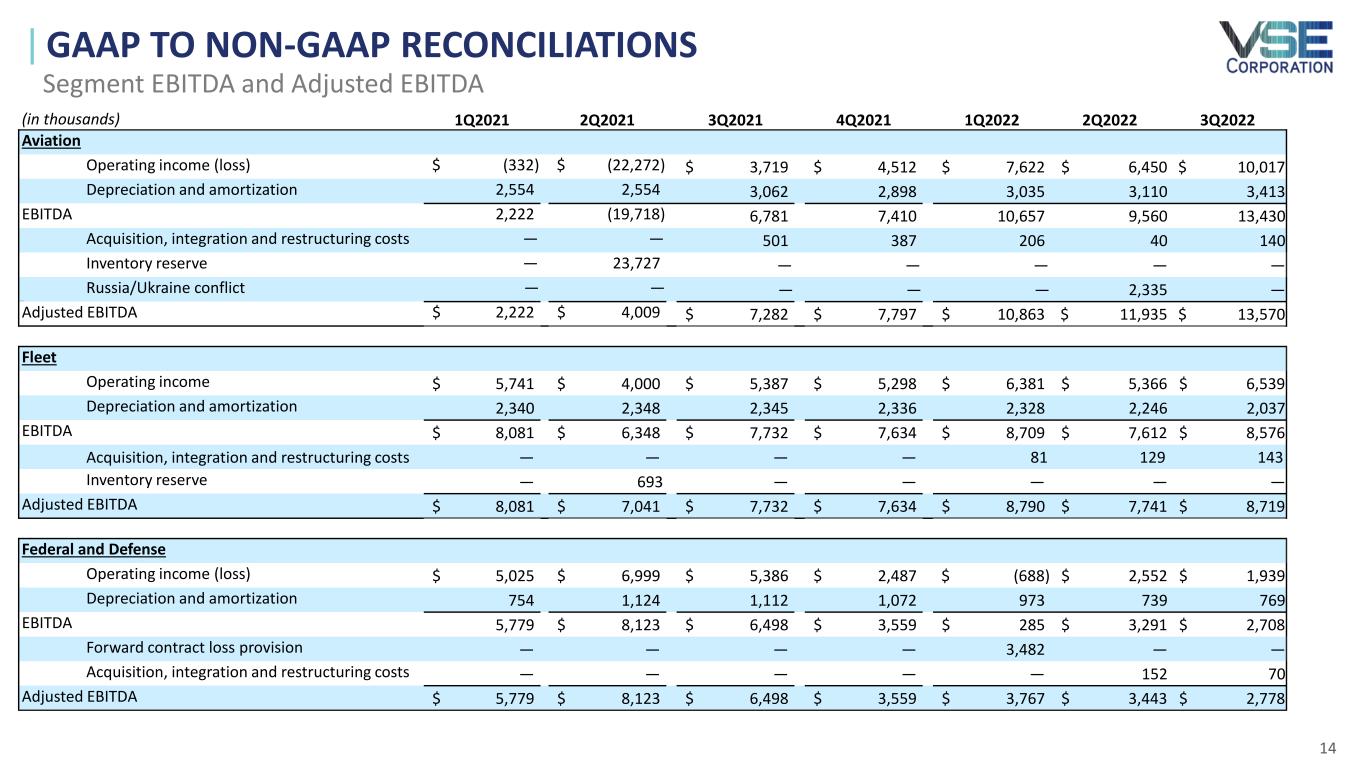
Reconciliation of Segment EBITDA and Adjusted EBITDA to Operating Income (Loss)
| | | | | | | | | | | | | | | | | | | | | | | | | | | | | | | | | | | | | | | |
| | | | | Three months ended September 30, | | Nine months ended September 30, |
| (in thousands) | | | | | | | | 2022 | | 2021 | | | | 2022 | | 2021 | | |
| Aviation | | | | | | | | | | | | | | | | | | |
| Operating income (loss) | | | | | | | | $ | 10,017 | | | $ | 3,719 | | | | | $ | 24,089 | | | $ | (18,885) | | | |
| Depreciation and amortization | | | | | | | | 3,413 | | | 3,062 | | | | | 9,558 | | | 8,171 | | | |
| EBITDA | | | | | | | | 13,430 | | | 6,781 | | | | | 33,647 | | | (10,714) | | | |
| Acquisition, integration and restructuring costs | | | | | | | | 140 | | | 501 | | | | | 387 | | | 501 | | | |
| | | | | | | | | | | | | | | | | | | |
| Inventory reserve | | | | | | | | — | | | — | | | | | — | | | 23,727 | | | |
| Russia/Ukraine conflict (1) | | | | | | | | — | | | — | | | | | 2,335 | | | — | | | |
| Adjusted EBITDA | | | | | | | | $ | 13,570 | | | $ | 7,282 | | | | | $ | 36,369 | | | $ | 13,514 | | | |
| | | | | | | | | | | | | | | | | | |
| Fleet | | | | | | | | | | | | | | | | | | |
| Operating income | | | | | | | | $ | 6,539 | | | $ | 5,387 | | | | | $ | 18,286 | | | $ | 15,128 | | | |
| Depreciation and amortization | | | | | | | | 2,037 | | | 2,345 | | | | | 6,611 | | | 7,033 | | | |
| EBITDA | | | | | | | | 8,576 | | | 7,732 | | | | | 24,897 | | | 22,161 | | | |
| Acquisition, integration and restructuring costs | | | | | | | | 143 | | | — | | | | | 354 | | | — | | | |
| Inventory reserve | | | | | | | | — | | | — | | | | | — | | | 693 | | | |
| Adjusted EBITDA | | | | | | | | $ | 8,719 | | | $ | 7,732 | | | | | $ | 25,251 | | | $ | 22,854 | | | |
| | | | | | | | | | | | | | | | | | | |
| Federal & Defense | | | | | | | | | | | | | | | | | | |
| Operating income | | | | | | | | $ | 1,939 | | | $ | 5,386 | | | | | $ | 3,803 | | | $ | 17,410 | | | |
| Depreciation and amortization | | | | | | | | 769 | | | 1,112 | | | | | 2,480 | | | 2,991 | | | |
| EBITDA | | | | | | | | $ | 2,708 | | | $ | 6,498 | | | | | $ | 6,283 | | | $ | 20,401 | | | |
| Forward contract loss provision | | | | | | | | — | | | — | | | | | 3,482 | | | — | | | |
| Acquisition, integration and restructuring costs | | | | | | | | 70 | | | — | | | | | 222 | | | — | | | |
| | | | | | | | | | | | | | | | | | | |
| Adjusted EBITDA | | | | | | | | $ | 2,778 | | | $ | 6,498 | | | | | $ | 9,987 | | | $ | 20,401 | | | |
| | | | | | | | | | | | | | | | | | | |
(1) Adjustment represents a non-cash charge recorded to reduce the carrying amount of accounts receivable and inventory related to the Russia/Ukraine military conflict. | | |
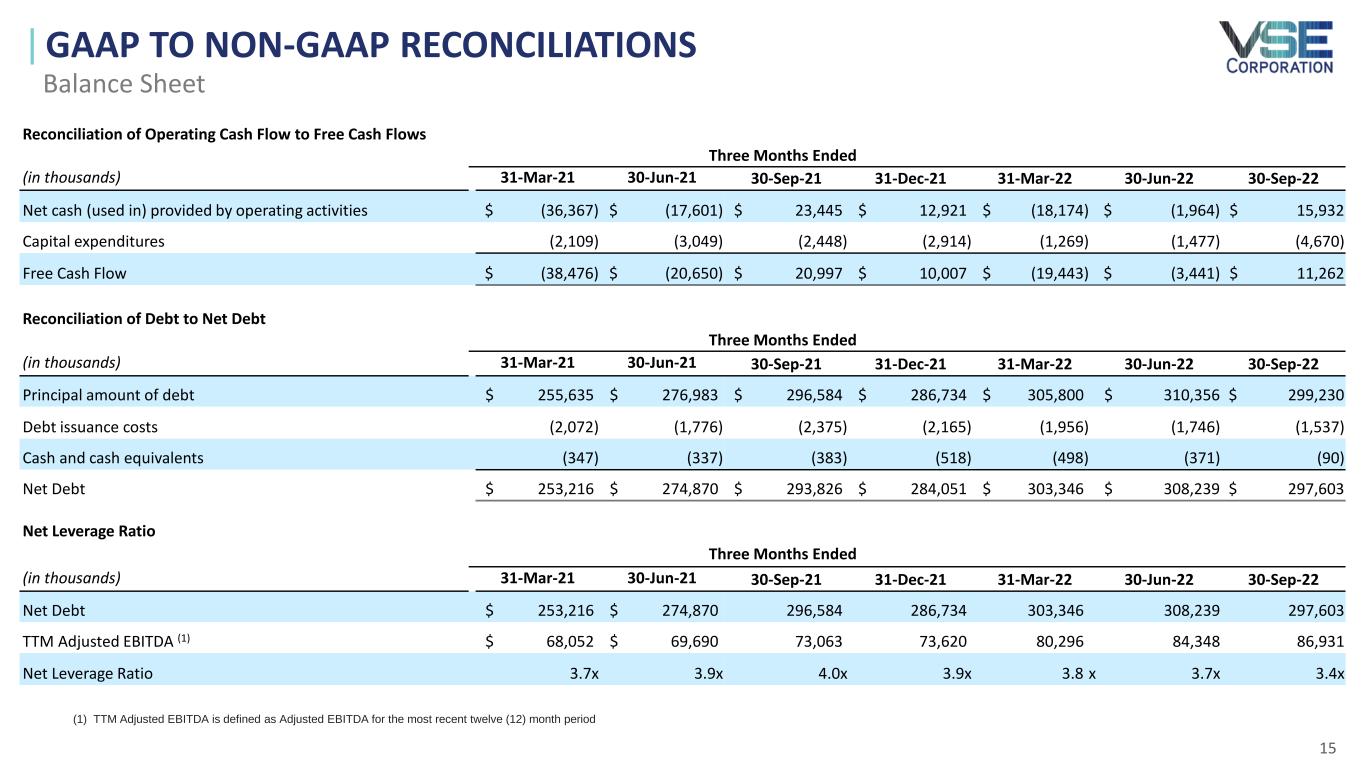
Reconciliation of Operating Cash to Free Cash Flow
| | | | | | | | | | | | | | | | | | | | | | | | | | |
| | Three months ended September 30, | | Nine months ended September 30, |
| (in thousands) | | 2022 | | 2021 | | 2022 | | 2021 |
| Net cash provided by (used in) operating activities | | $ | 15,932 | | | $ | 23,445 | | | $ | (4,206) | | | $ | (30,523) | |
| Capital expenditures | | (4,670) | | | (2,448) | | | (7,416) | | | (7,606) | |
| Free cash flow | | $ | 11,262 | | | $ | 20,997 | | | $ | (11,622) | | | $ | (38,129) | |
Reconciliation of Debt to Net Debt
| | | | | | | | | | | | | | |
| | September 30, | | December 31, |
| (in thousands) | | 2022 | | 2021 |
| Principal amount of debt | | $ | 299,230 | | | $ | 286,734 | |
| Debt issuance costs | | (1,537) | | | (2,165) | |
| Cash and cash equivalents | | (90) | | | (518) | |
| Net debt | | $ | 297,603 | | | $ | 284,051 | |
The non-GAAP Financial Information set forth in this document is not calculated in accordance with GAAP under SEC Regulation G. We consider Adjusted Net Income, Adjusted EPS (Diluted), EBITDA, Adjusted EBITDA, net debt and free cash flow as non-GAAP financial measures and important indicators of performance and useful metrics for management and investors to evaluate our business' ongoing operating performance on a consistent basis across reporting periods. These non-GAAP financial measures, however, should not be considered in isolation or as a substitute for performance measures prepared in accordance with GAAP. Adjusted Net Income represents Net Income adjusted for acquisition-related costs, forward contract loss provision and other discrete items, and related tax impact. Adjusted EPS (Diluted) is computed by dividing net income, adjusted for the discrete items as identified above and the related tax impacts, by the diluted weighted average number of common shares outstanding. EBITDA represents net income before interest expense, income taxes, amortization of intangible assets and depreciation and other amortization. Adjusted EBITDA represents EBITDA (as defined above) adjusted for the discrete items as identified above. Net debt is defined as total debt less cash and cash equivalents. Free cash flow represents operating cash flow less capital expenditures.
CONFERENCE CALL
A conference call will be held Thursday, October 27, 2022 at 8:30 A.M. EST to review the Company’s financial results, discuss recent events and conduct a question-and-answer session.
A webcast of the conference call and accompanying presentation materials will be available in the Investor Relations section of VSE’s website at https://ir.vsecorp.com. To listen to the live broadcast, go to the site at least 15 minutes prior to the scheduled start time in order to register, download and install any necessary audio software.
To participate in the live teleconference:
| | | | | |
Domestic Live: | (877) 407-0789 |
International Live: | (201) 689-8562 |
| Audio Webcast: | https://viavid.webcasts.com/starthere.jsp?ei=1574666&tp_key=728cde2732 |
To listen to a replay of the teleconference through November 10, 2022:
| | | | | |
Domestic Replay: | (844) 512-2921 |
International Replay: | (412) 317-6671 |
Replay PIN Number: | 13733403 |
ABOUT VSE CORPORATION
VSE is a leading provider of aftermarket distribution and repair services for land, sea and air transportation assets for government and commercial markets. Core services include MRO services, parts distribution, supply chain management and logistics, engineering support, and consulting and training services for global commercial, federal, military and defense customers. VSE also provides information technology and energy consulting services. For additional information regarding VSE’s services and products, visit www.vsecorp.com.
AVIATION
Distribution & MRO Services
VSE’s Aviation segment provides aftermarket MRO and distribution services to commercial, business and general aviation, cargo, military/defense and rotorcraft customers globally. Core services include parts distribution, component and engine accessory MRO services, rotable exchange and supply chain services.
FLEET
Distribution & Fleet Services
VSE's Fleet segment provides parts, inventory management, e-commerce fulfillment, logistics, supply chain support and other services to the commercial aftermarket medium- and heavy-duty truck market, the United States Postal Service (USPS), and the United States Department of Defense. Core services include parts distribution, sourcing, IT solutions, customized fleet logistics, warehousing, kitting, just-in-time supply chain management, alternative product sourcing, engineering and technical support.
FEDERAL & DEFENSE
Logistics & Sustainment Services
VSE's Federal & Defense segment provides aftermarket MRO and logistics services to improve operational readiness and extend the lifecycle of military vehicles, ships and aircraft for the U.S. Armed Forces, federal agencies and international defense customers. Core services include base operations support, procurement, supply chain management, vehicle, maritime and aircraft sustainment services, IT and data management services and energy consulting.
Please refer to the Form 10-Q that will be filed with the Securities and Exchange Commission (SEC) on or about October 27, 2022 for more details on our third quarter 2022 results. Also, refer to VSE’s Annual Report on Form 10-
K for the year ended December 31, 2021 for further information and analysis of VSE’s financial condition and results of operations. VSE encourages investors and others to review the detailed reporting and disclosures contained in VSE’s public filings for additional discussion about the status of customer programs and contract awards, risks, revenue sources and funding, dependence on material customers, and management’s discussion of short- and long-term business challenges and opportunities.
FORWARD LOOKING STATEMENTS
This document contains certain forward-looking statements. These forward-looking statements, which are included in accordance with the safe harbor provisions of the Private Securities Litigation Reform Act of 1995, may involve known and unknown risks, uncertainties and other factors that may cause VSE’s actual results and performance in future periods to be materially different from any future results or performance suggested by the forward-looking statements in this document. Although we believe the expectations reflected in such forward-looking statements are based upon reasonable assumptions, we can give no assurance that actual results will not differ materially from these expectations. “Forward-looking” statements, as such term is defined by the SEC in its rules, regulations and releases, represent our expectations or beliefs, including, but not limited to, statements concerning our operations, economic performance, financial condition, the impact of widespread health developments, the health and economic impact thereof, and the governmental, commercial, consumer and other responses thereto, growth and acquisition strategies, investments and future operational plans. Without limiting the generality of the foregoing, words such as “may,” “will,” “expect,” “believe,” “anticipate,” “intend,” “forecast,” “seek,” “plan,” “predict,” “project,” “could,” “estimate,” “might,” “continue,” “seeking” or the negative or other variations thereof or comparable terminology are intended to identify forward-looking statements. These statements, by their nature, involve substantial risks and uncertainties, certain of which are beyond our control, and actual results may differ materially depending on a variety of important factors, including, but not limited to, factors identified in our reports filed or expected to be filed with the SEC including our Annual Report on Form 10-K for the year ended December 31, 2021. All forward-looking statements made herein are qualified by these cautionary statements and risk factors and there can be no assurance that the actual results, events or developments referenced herein will occur or be realized. Readers are cautioned not to place undue reliance on these forward looking-statements, which reflect management's analysis only as of the date hereof. We undertake no obligation to update or revise forward-looking statements to reflect changed assumptions, the occurrence of unanticipated events or changes to future operating results.
INVESTOR CONTACT
Noel Ryan
(720) 778-2415
VSE Corporation and Subsidiaries
Unaudited Consolidated Balance Sheets
(in thousands except share and per share amounts)
| | | | | | | | | | | | | | |
| | September 30, | | December 31, |
| | 2022 | | 2021 |
| Assets | | | | |
| Current assets: | | | | |
| Cash and cash equivalents | | $ | 90 | | | $ | 518 | |
| Receivables (net of allowance of $3.4 million and $1.7 million, respectively) | | 91,093 | | | 76,587 | |
| Unbilled receivables | | 44,084 | | | 31,882 | |
| Inventories | | 349,917 | | | 322,702 | |
| Other current assets | | 28,154 | | | 32,304 | |
| Total current assets | | 513,338 | | | 463,993 | |
| | | | |
| Property and equipment (net of accumulated depreciation of $72 million and $66 million, respectively) | | 44,564 | | | 42,486 | |
| Intangible assets (net of accumulated amortization of $120 million and $135 million, respectively) | | 94,857 | | | 108,263 | |
| Goodwill | | 248,837 | | | 248,753 | |
| Operating lease right-of-use asset | | 23,950 | | | 27,327 | |
| Other assets | | 31,980 | | | 27,736 | |
| Total assets | | $ | 957,526 | | | $ | 918,558 | |
| | | | |
| Liabilities and Stockholders' equity | | | | |
| Current liabilities: | | | | |
| Current portion of long-term debt | | $ | 9,162 | | | $ | 14,162 | |
| Accounts payable | | 119,093 | | | 115,064 | |
| | | | |
| Accrued expenses and other current liabilities | | 50,791 | | | 49,465 | |
| Dividends payable | | 1,280 | | | 1,273 | |
| Total current liabilities | | 180,326 | | | 179,964 | |
| | | | |
| Long-term debt, less current portion | | 288,531 | | | 270,407 | |
| Deferred compensation | | 10,128 | | | 14,328 | |
| Long-term lease obligations under operating leases | | 22,947 | | | 27,168 | |
| | | | |
| Deferred tax liabilities | | 10,166 | | | 9,108 | |
| Other long-term liabilities | | — | | | 250 | |
| Total liabilities | | 512,098 | | | 501,225 | |
| | | | |
| Commitments and contingencies | | | | |
| | | | |
| Stockholders' equity: | | | | |
| Common stock, par value $0.05 per share, authorized 23,000,000 shares; issued and outstanding 12,799,678 and 12,726,659, respectively | | 640 | | | 636 | |
| Additional paid-in capital | | 91,706 | | | 88,515 | |
| Retained earnings | | 347,730 | | | 328,358 | |
| Accumulated other comprehensive income (loss) | | 5,352 | | | (176) | |
| Total stockholders' equity | | 445,428 | | | 417,333 | |
| Total liabilities and stockholders' equity | | $ | 957,526 | | | $ | 918,558 | |
VSE Corporation and Subsidiaries
Unaudited Consolidated Statements of Income
(in thousands except share and per share amounts)
| | | | | | | | | | | | | | | | | | | | | | | | | | |
| | | For the three months ended September 30, | | For the nine months ended September 30, |
| | | 2022 | | 2021 | | 2022 | | 2021 |
| Revenues: | | | | | | | | |
| Products | | $ | 138,216 | | | $ | 113,005 | | | $ | 419,023 | | | $ | 276,048 | |
| Services | | 104,271 | | | 87,577 | | | 296,416 | | | 264,627 | |
| Total revenues | | 242,487 | | | 200,582 | | | 715,439 | | | 540,675 | |
| | | | | | | | |
| Costs and operating expenses: | | | | | | | | |
| Products | | 123,348 | | | 101,044 | | | 376,781 | | | 273,081 | |
| Services | | 96,653 | | | 79,916 | | | 279,163 | | | 241,104 | |
| Selling, general and administrative expenses | | 981 | | | 809 | | | 2,752 | | | 1,897 | |
| Amortization of intangible assets | | 4,233 | | | 4,921 | | | 13,406 | | | 13,812 | |
| Total costs and operating expenses | | 225,215 | | | 186,690 | | | 672,102 | | | 529,894 | |
| | | | | | | | |
| Operating income | | 17,272 | | | 13,892 | | | 43,337 | | | 10,781 | |
| | | | | | | | |
| Interest expense, net | | 4,818 | | | 2,780 | | | 12,299 | | | 8,476 | |
| | | | | | | | |
| Income before income taxes | | 12,454 | | | 11,112 | | | 31,038 | | | 2,305 | |
| | | | | | | | |
| Provision for income taxes | | 3,035 | | | 2,091 | | | 7,827 | | | 539 | |
| | | | | | | | |
| Net income | | $ | 9,419 | | | $ | 9,021 | | | $ | 23,211 | | | $ | 1,766 | |
| | | | | | | | |
| Basic earnings per share | | $ | 0.74 | | | $ | 0.71 | | | $ | 1.82 | | | $ | 0.14 | |
| | | | | | | | |
| Basic weighted average shares outstanding | | 12,797,727 | | | 12,704,165 | | | 12,772,731 | | | 12,496,646 | |
| | | | | | | | |
| Diluted earnings per share | | $ | 0.73 | | | $ | 0.71 | | | $ | 1.81 | | | $ | 0.14 | |
| | | | | | | | |
| Diluted weighted average shares outstanding | | 12,834,084 | | | 12,774,636 | | | 12,816,319 | | | 12,573,076 | |
| | | | | | | | |
| Dividends declared per share | | $ | 0.10 | | | $ | 0.09 | | | $ | 0.30 | | | $ | 0.27 | |
VSE Corporation and Subsidiaries
Unaudited Consolidated Statements of Cash Flows
(in thousands)
| | | | | | | | | | | | | | |
| | For the nine months ended September 30, |
| | | 2022 | | 2021 |
| Cash flows from operating activities: | | | | |
| Net income | | $ | 23,211 | | | $ | 1,766 | |
| Adjustments to reconcile net income to net cash used in operating activities: | | | | |
| Depreciation and amortization | | 19,277 | | | 18,996 | |
| Deferred taxes | | (779) | | | (4,803) | |
| Stock-based compensation | | 3,597 | | | 2,968 | |
| Inventory valuation adjustment | | 1,094 | | | 24,420 | |
| Loss on sale of PPE | | — | | | (48) | |
| | | | |
| Changes in operating assets and liabilities, net of impact of acquisitions: | | | | |
| Receivables | | (14,506) | | | (9,321) | |
| Unbilled receivables | | (12,202) | | | (4,484) | |
| Inventories | | (28,309) | | | (66,518) | |
| Other current assets and noncurrent assets | | 6,189 | | | (18,912) | |
| Accounts payable and deferred compensation | | (171) | | | 17,955 | |
| Accrued expenses and other current and noncurrent liabilities | | (1,607) | | | 7,458 | |
| | | | |
| Net cash used in operating activities | | (4,206) | | | (30,523) | |
| | | | |
| Cash flows from investing activities: | | | | |
| Purchases of property and equipment | | (7,416) | | | (7,606) | |
| Proceeds from the sale of property and equipment | | — | | | 199 | |
| Proceeds from the payment on notes receivable | | 4,235 | | | 1,550 | |
| | | | |
| Earn-out obligation payments | | — | | | (750) | |
| Cash paid for acquisitions, net of cash acquired | | — | | | (53,232) | |
| | | | |
| Net cash used in investing activities | | (3,181) | | | (59,839) | |
| | | | |
| Cash flows from financing activities: | | | | |
| Borrowings on loan agreement | | 358,051 | | | 394,079 | |
| Repayments on loan agreement | | (345,554) | | | (350,956) | |
| Proceeds from issuance of common stock | | 486 | | | 52,017 | |
| Earn-out obligation payments | | (1,250) | | | (808) | |
| | | | |
| Payments of taxes for equity transactions | | (942) | | | (681) | |
| Dividends paid | | (3,832) | | | (3,284) | |
| | | | |
| Net cash provided by financing activities | | 6,959 | | | 90,367 | |
| | | | |
| Net (decrease) increase in cash and cash equivalents | | (428) | | | 5 | |
| Cash and cash equivalents at beginning of period | | 518 | | | 378 | |
| Cash and cash equivalents at end of period | | $ | 90 | | | $ | 383 | |