VSE Corporation Announces Second Quarter 2020 Results
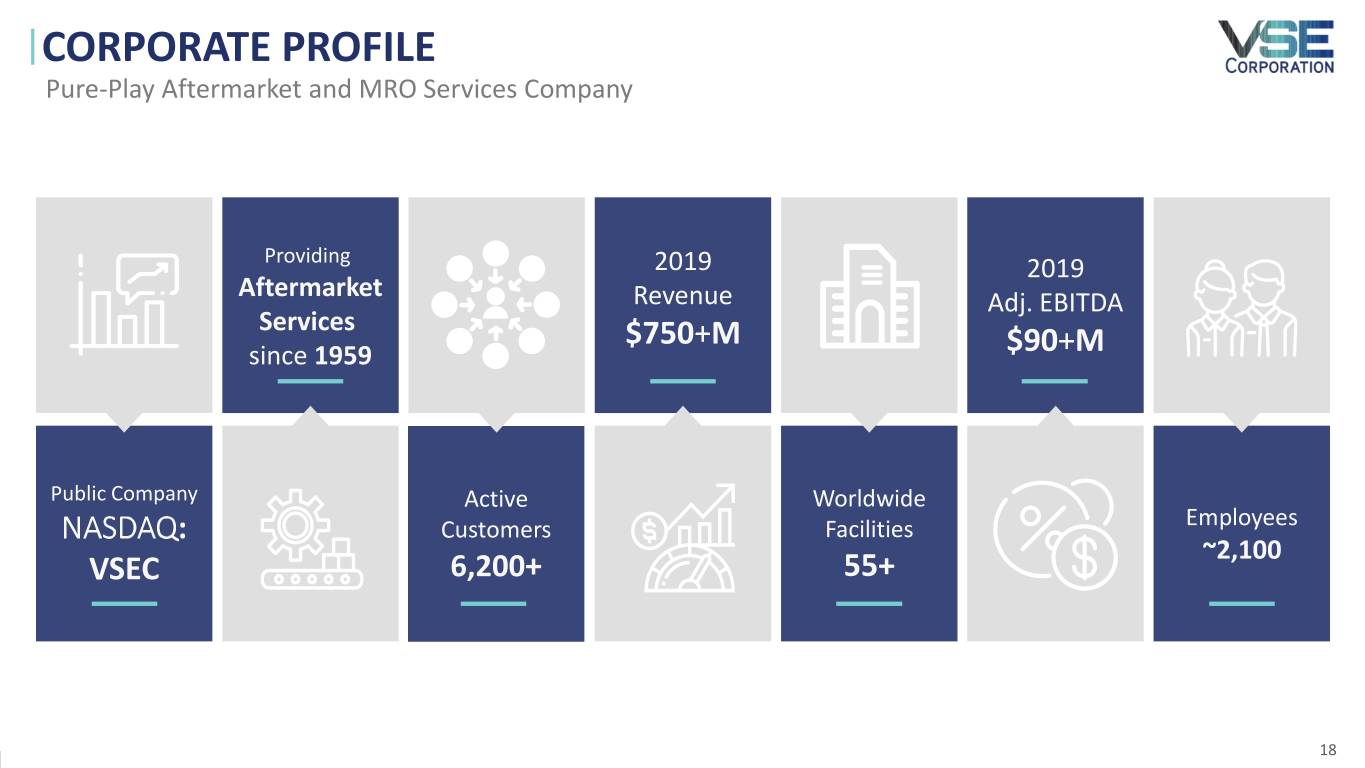
ALEXANDRIA, Va., July 29, 2020 - VSE Corporation (NASDAQ: VSEC, “VSE”, or the “Company”), a leading provider of aftermarket distribution and maintenance, repair and overhaul (MRO) services for land, sea and air transportation assets for government and commercial markets, today announced results for the second quarter 2020.
SECOND QUARTER 2020 SUMMARY RESULTS AS COMPARED TO THE SECOND QUARTER 2019
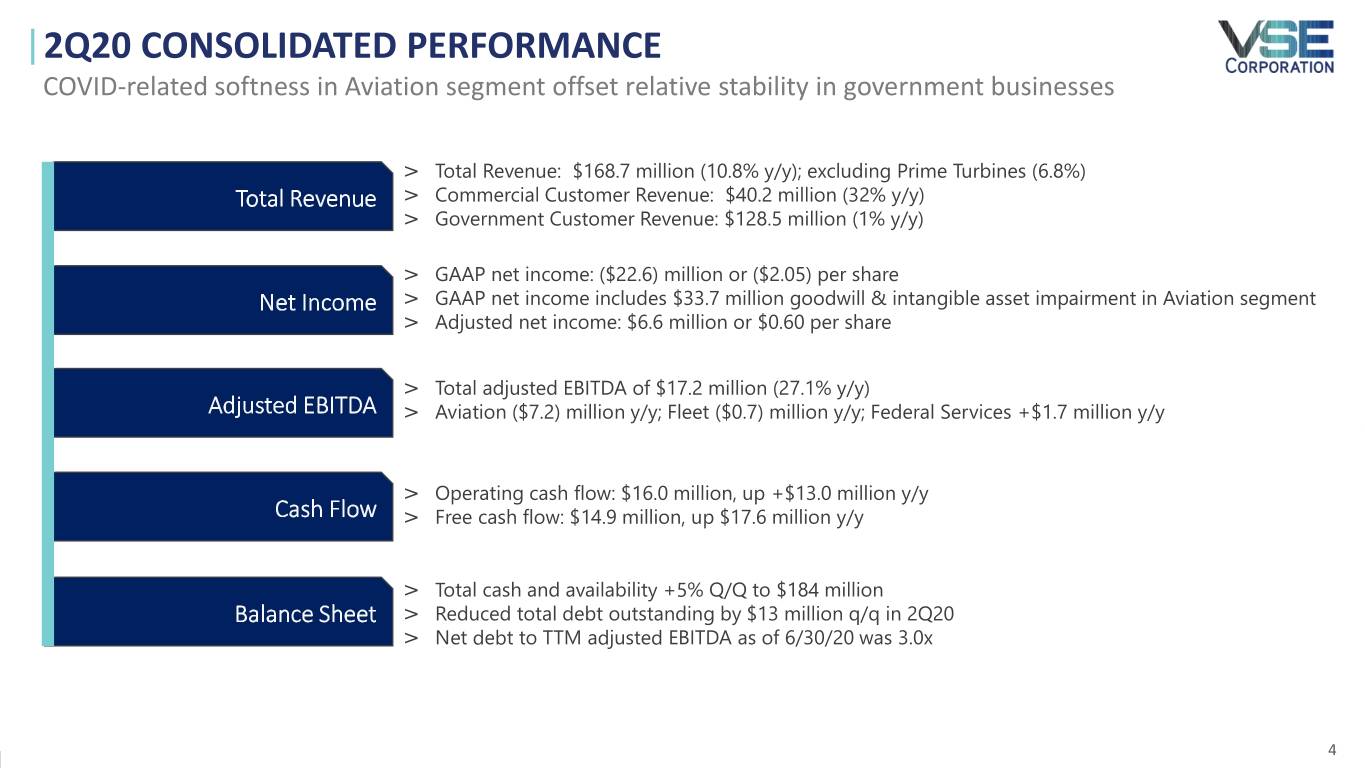
▪ | Total Revenues of $168.7 million decreased 10.8% |
• | Total Revenues, excluding the impact Prime Turbines divestiture, decreased 6.8% |
▪ | GAAP Net Loss of $22.6 million decreased $32.5 million due to a non-cash impairment charge |
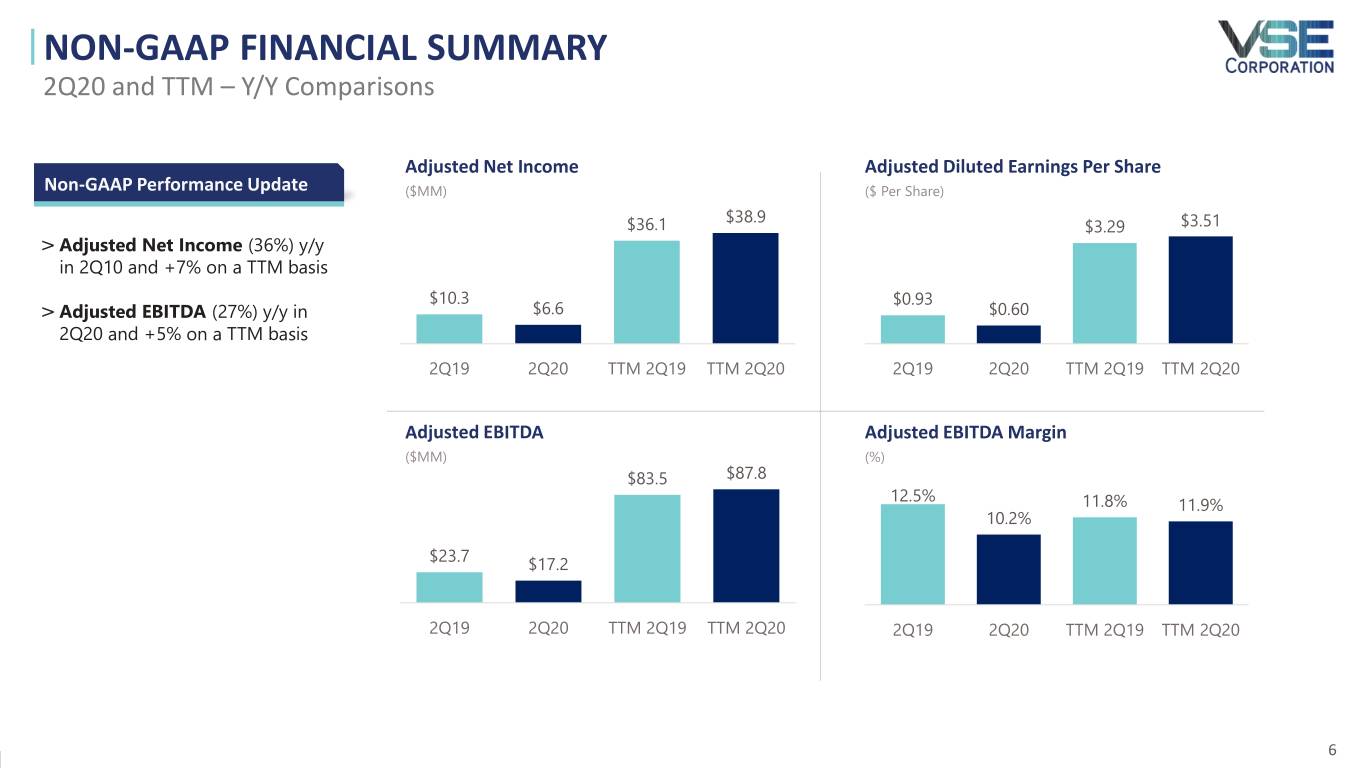
▪ | Adjusted Net Income of $6.6 million decreased 35.8% |
▪ | Total Adjusted EBITDA of $17.2 million decreased 27.1% |
▪ | GAAP EPS (Diluted) of $(2.05)/share decreased $2.94/share |
▪ | Adjusted EPS (Diluted) of $0.60/share decreased $0.33/share |
▪ | Operating Cash Flow of $16.0 million increased $13.0 million |
▪ | Free Cash Flow(1) of $14.9 million increased $17.6 million |
(1) Cash provided by operating activities less capital expenditures
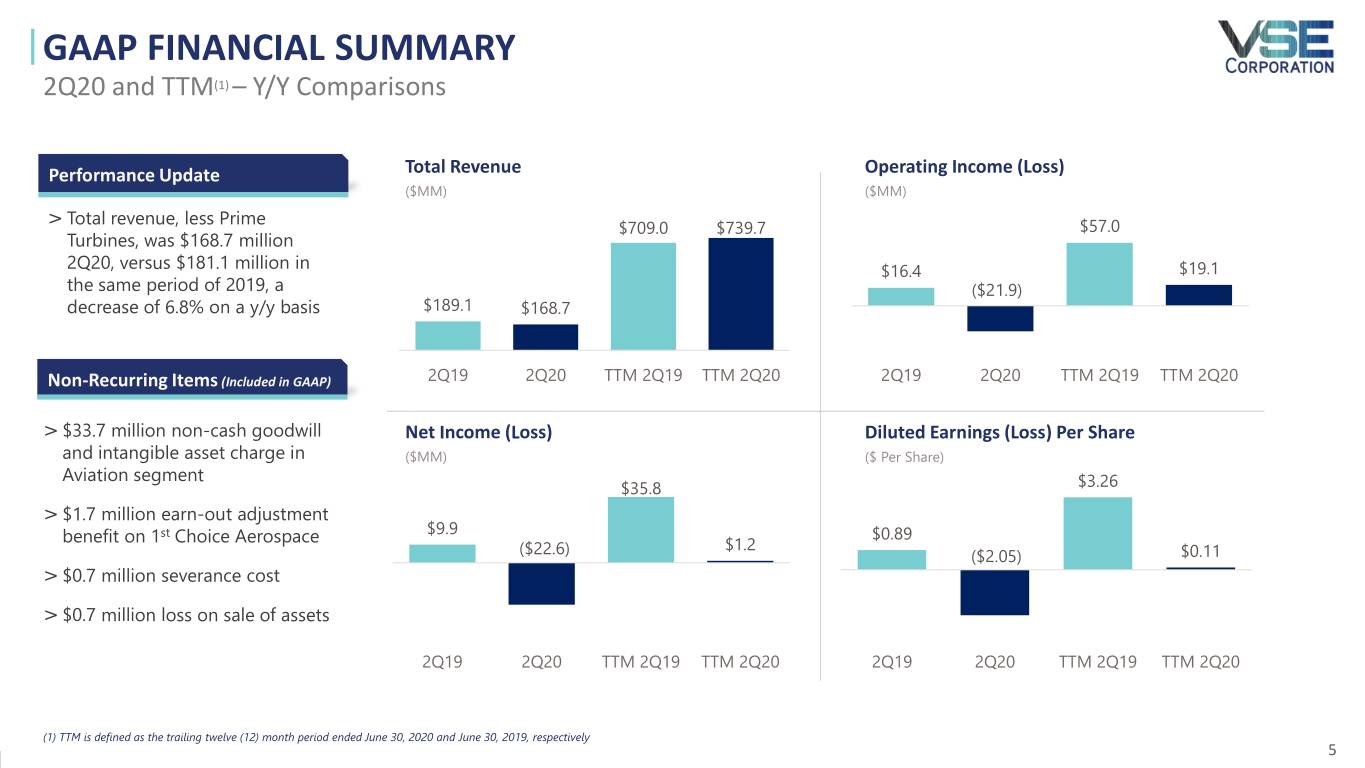
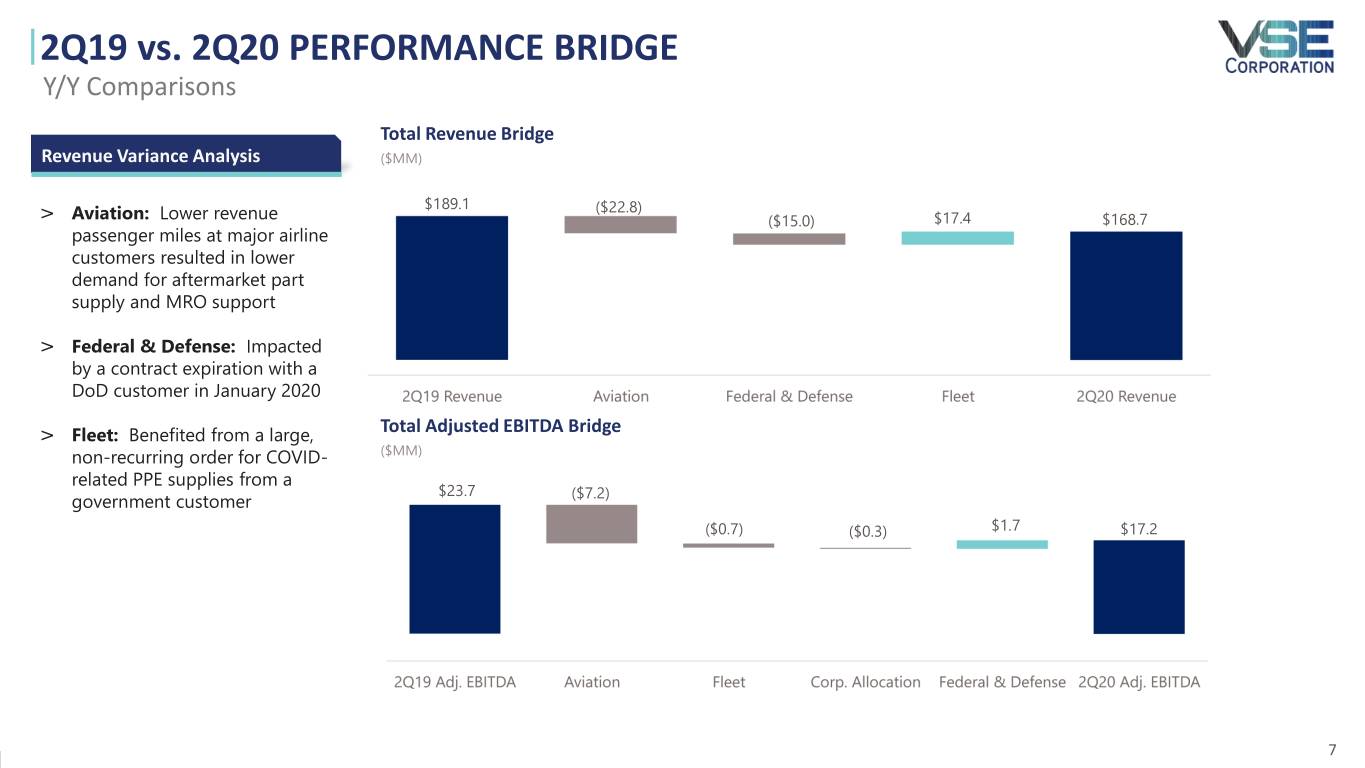
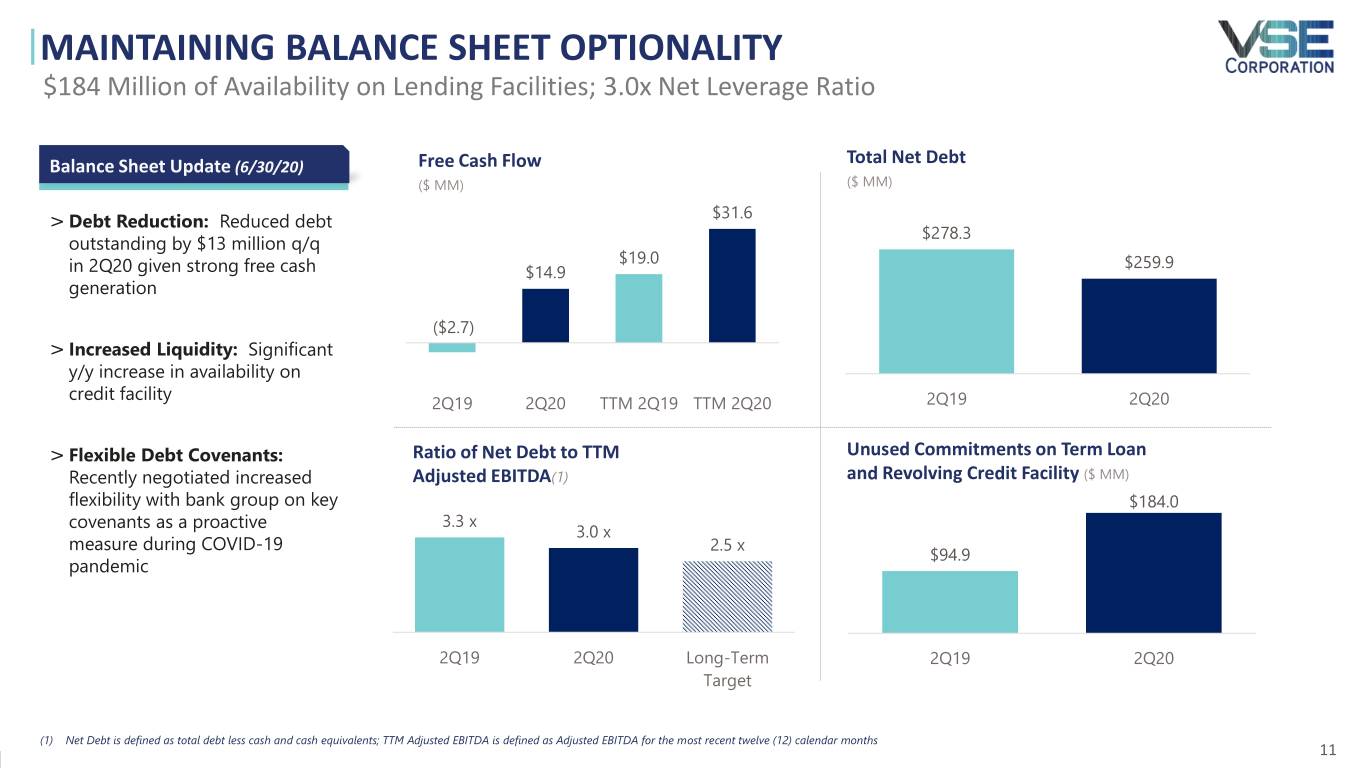
For the three months ended June 30, 2020, the Company reported total revenue of $168.7 million, versus $189.1 million for the same period ended 2019. Total revenue in the second quarter 2020, excluding contributions from Prime Turbines, an Aviation segment subsidiary sold in February 2020, was $168.7 million, versus $181.1 million in the same period of 2019. The Company reported adjusted net income of $6.6 million or $0.60 per adjusted diluted share, compared to $10.3 million or $0.93 per adjusted diluted share in the prior-year period. Adjusted EBITDA declined to $17.2 million in second quarter 2020, versus $23.7 million for the same period in 2019. The Company generated $14.9 million in free cash flow during the second quarter 2020, versus $(2.7) million in the prior-year period. VSE reduced total debt outstanding by $13.2 million during the second quarter 2020.
Aviation segment revenue, excluding Prime Turbines, declined 31% on a year-over-year basis in the second quarter 2020. Revenue passenger miles at major airline customers declined materially on a year-over-year basis due to the impact of the COVID-19 pandemic, resulting in lower demand for aftermarket supply and MRO services during the second quarter. Federal & Defense segment revenue declined 18.7% on a year-over-year basis primarily due to the completion of DoD program work in January 2020. Fleet segment revenue increased 32.4% on a year-over-year basis due primarily to a large, non-recurring order for COVID-19 related personal protective equipment (PPE) supplies from a government customer.
During the three months ended June 30, 2020, VSE recognized (1) a non-cash impairment charge of $30.9 million as the fair value of its Aviation reporting unit was below its carrying value due to the current decline in global aviation demand for aftermarket distribution and MRO services associated with the pandemic; and (2) a non-cash impairment charge of $2.8 million for intangible assets related to CT Aerospace assets. This resulted in a $33.7 million goodwill and intangible asset non-cash impairment charge for the three and six months ended June 30, 2020.
STRATEGY UPDATE
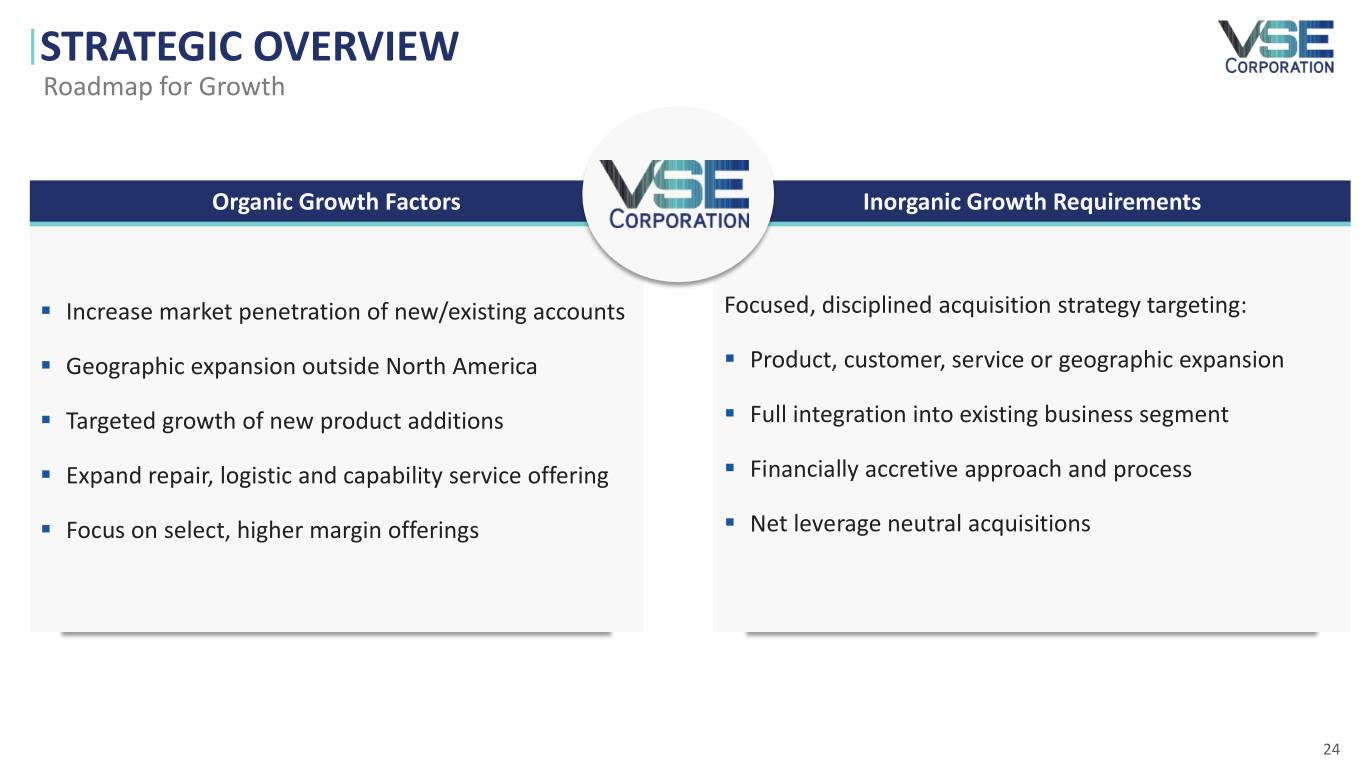
VSE continued to execute on a multi-year strategy during the second quarter that includes new business development initiatives across each of its aftermarket supply chain and MRO end-markets, the divestiture of non-core, lower-margin businesses, the integration of acquired assets, increased balance sheet discipline and targeted cost reductions to enhance the overall efficiency of the organization.
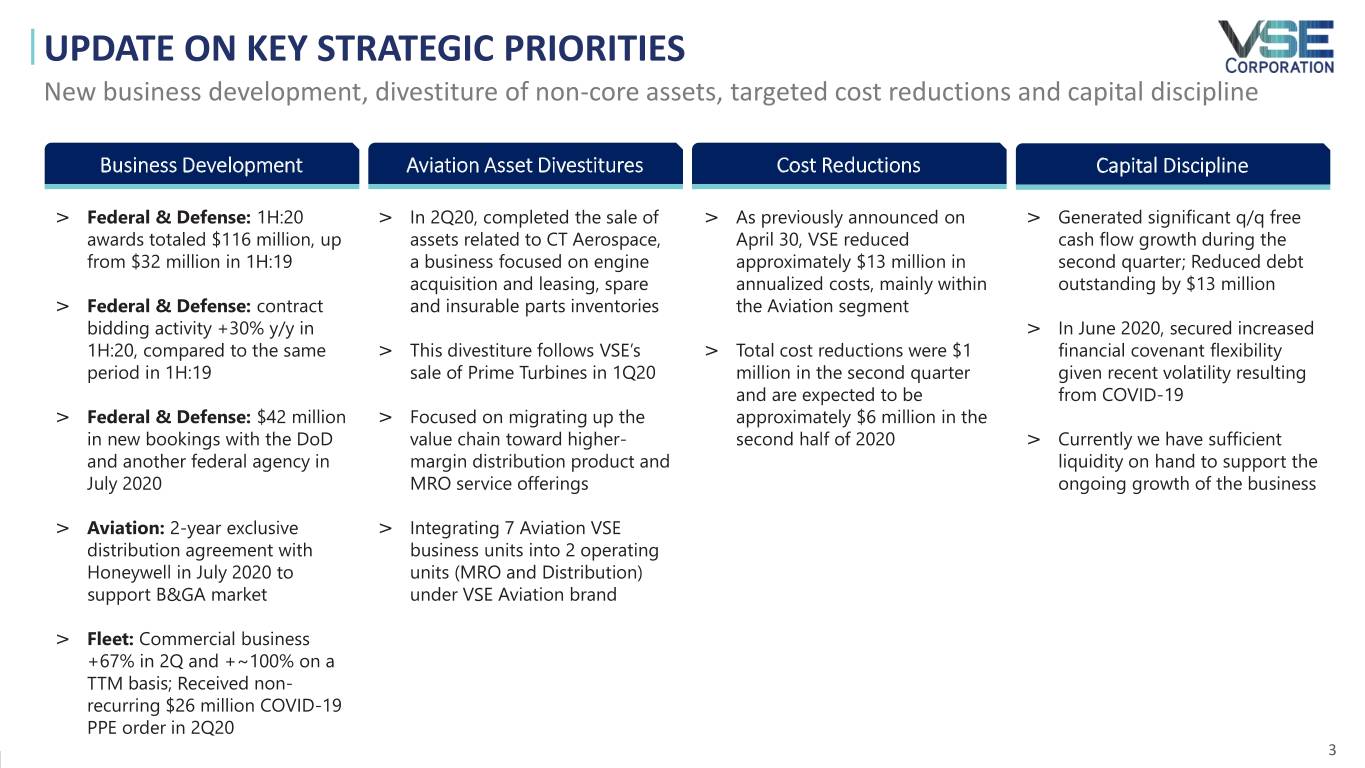
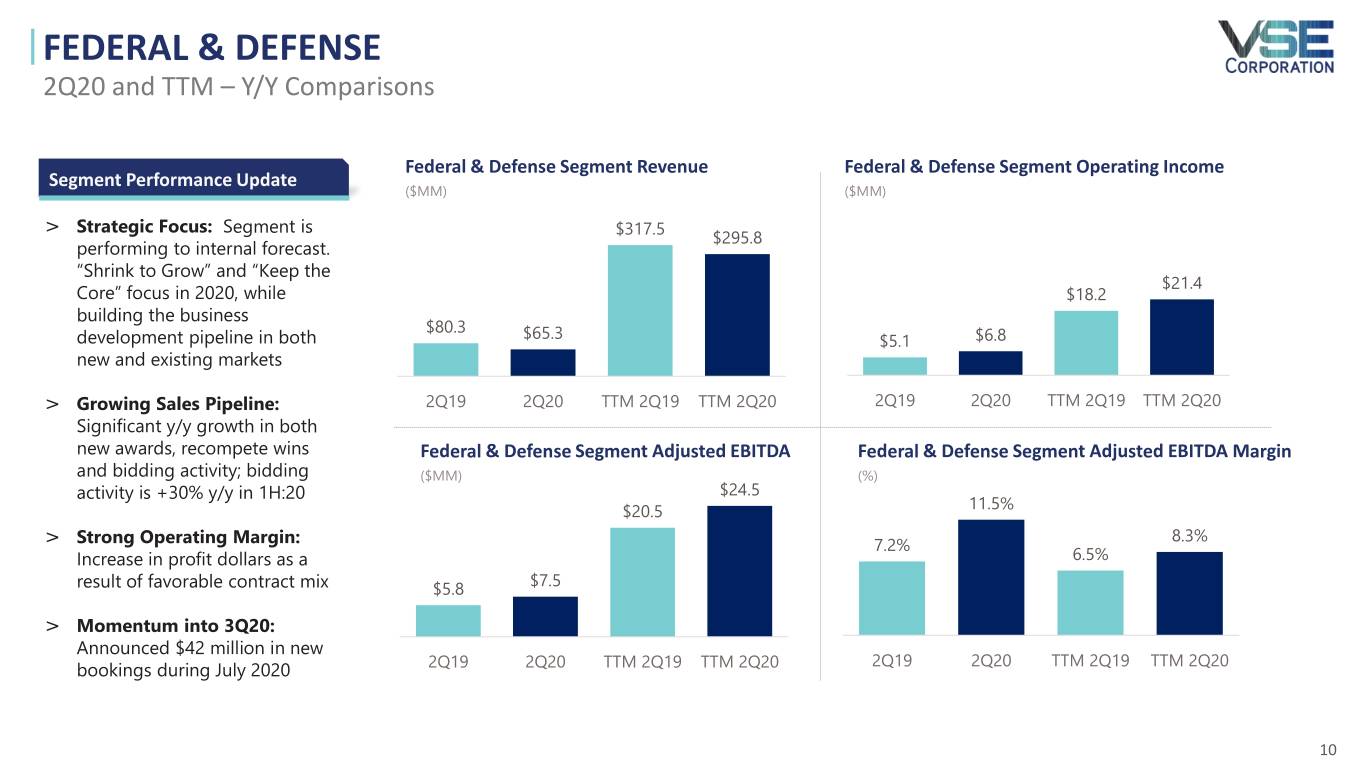
▪ | New business development. All business segments reported new business development successes during the second quarter. The Federal & Defense segment won both new contract awards and recompete awards. During the first half of 2020, Federal & Defense segment won more than $116 million in new customer awards, versus |
$32 million in the same period of 2019. For this segment, the total number of contract bids increased by more than 30% in the first half of 2020, when compared to the first half of 2019. The Fleet segment grew commercial sales by 67.5% in the second quarter. Also, during the quarter, the Aviation segment added new MRO capabilities and entered into new agreements to support distribution product line growth.
▪ | Divestiture of non-core assets. During the second quarter 2020, VSE completed the sale of assets related to CT Aerospace, a provider of engine acquisition and leasing, spare and insurable parts inventories. VSE sold the assets for the full book value of all inventory. In accordance with the Company’s recently disclosed strategic plan, the go-to-market focus of the Aviation segment will concentrate on higher growth component and engine accessory MRO and parts distribution to support the Commercial and Business and General Aviation markets. |
▪ | Balance sheet discipline. During the second quarter, VSE generated positive free cash flow that was used to continue to pay its quarterly cash dividend and reduce total debt outstanding. VSE also acted to reduce working capital requirements during the period, including an initiative to reduce inventory levels across the business. |
▪ | Targeted cost reductions. As previously announced in April 2020, VSE reduced approximately $13 million in annualized costs from the organization. These reductions were mainly focused on the Company’s Aviation segment as VSE took action to align its cost structure with the current demand environment. Total cost reduction impact in the second quarter was $1 million, and approximately $6 million is expected in the second half of 2020. |
MANAGEMENT COMMENTARY
“During the last twelve months, we positioned VSE to become a leaner, scalable, more profitable business with differentiated value propositions capable of achieving sustained growth,” stated John Cuomo, President and CEO of VSE Corporation. “While the COVID-19 pandemic presents a unique set of near-term challenges for our business, we quickly adapted to the current environment through a series of targeted divestitures, cost reductions and new business development initiatives. Our go-to-market strategy continues to gain traction, as evidenced by multiple new contract awards and successful recompetes announced in recent months. On a combined basis, we expect these collective actions will position us to generate positive adjusted net income and free cash flow for the full-year 2020.”
“We currently anticipate sequential (quarter-over-quarter) growth in Aviation segment revenue and earnings during the third quarter of 2020," continued Cuomo. "In recent quarters, we have taken decisive action to improve the efficiency of our Aviation segment. These actions include an ongoing program to integrate our business units, which will reduce our go-to-market Aviation entities from seven to two, thereby establishing market-leading business units that serve distribution and MRO customers. Additionally, this includes the exiting of three Aviation site locations, and the reduction of more than $13 million of annualized costs from the Company.”
“While the pace of recovery in our Aviation segment will be gradual and uncertain, we have created a strong foundation for growth as market conditions improve, including the continued expansion of MRO capabilities and distribution product offerings” stated Cuomo. “Before year-end 2020, we intend to name a new head of Aviation that will help to lead this business into its next phase of growth.”
“New business development remains our top management priority across each reporting segment,” continued Cuomo. “Bidding activity within our Federal & Defense segment increased on a year-over-year basis in the first half of 2020, resulting in multiple new wins and successful recompetes. During July 2020 alone, we announced more than $42 million in new bookings. In our Fleet segment, commercial revenue increased by 67.5% on a year-over-year basis. During the second quarter, we added new products and capabilities in our Aviation and Fleet segments, both of which will support revenue and earnings growth in the second half of 2020.”
“Cash and liquidity increased on both a sequential and year-over-year basis in the second quarter, while net debt declined to the lowest level in nearly two years,” continued Cuomo. “We are well capitalized to support the growth of our business, while maintaining a high level of balance sheet discipline. We remain focused on achieving increased capital efficiency through improved inventory and cash management, while balancing customer requirements to ensure the highest level of service on a global scale.”
SEGMENT RESULTS
AVIATION
Distribution & MRO Services
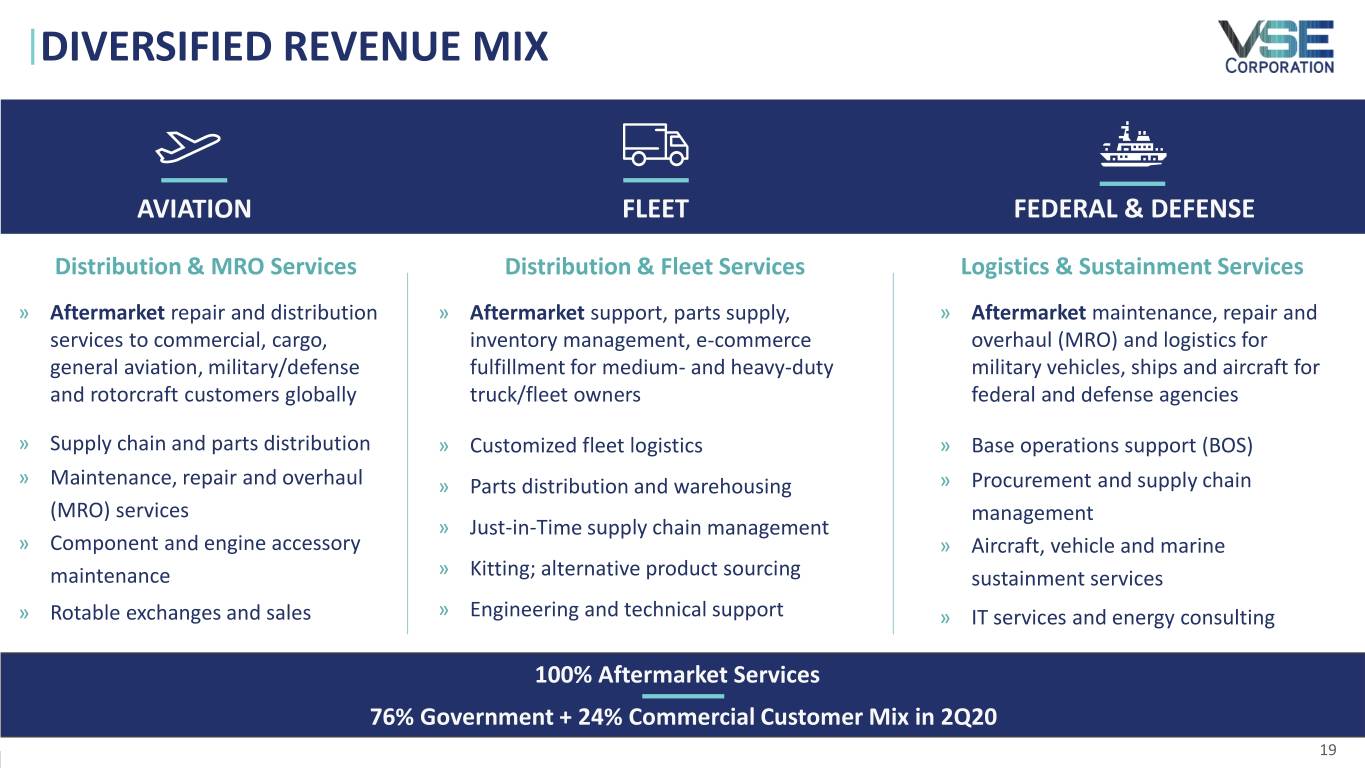
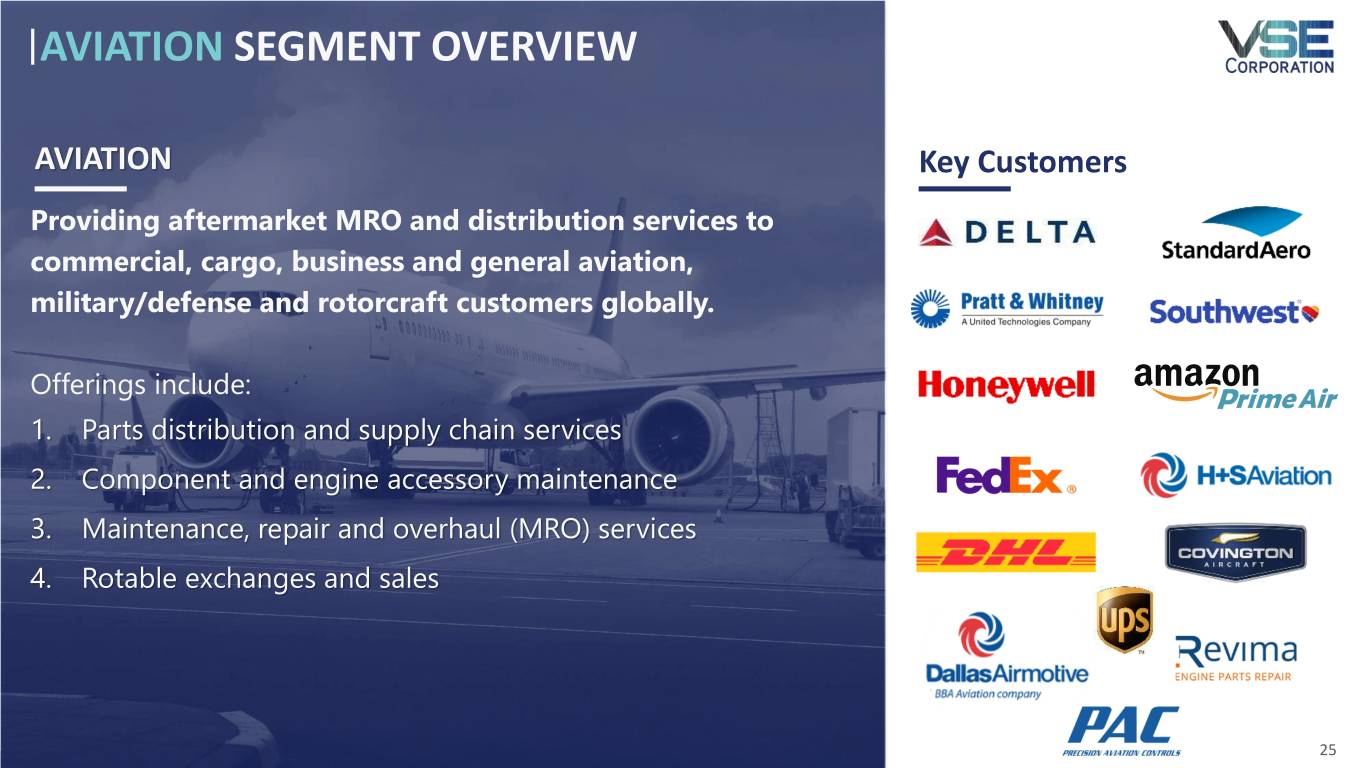
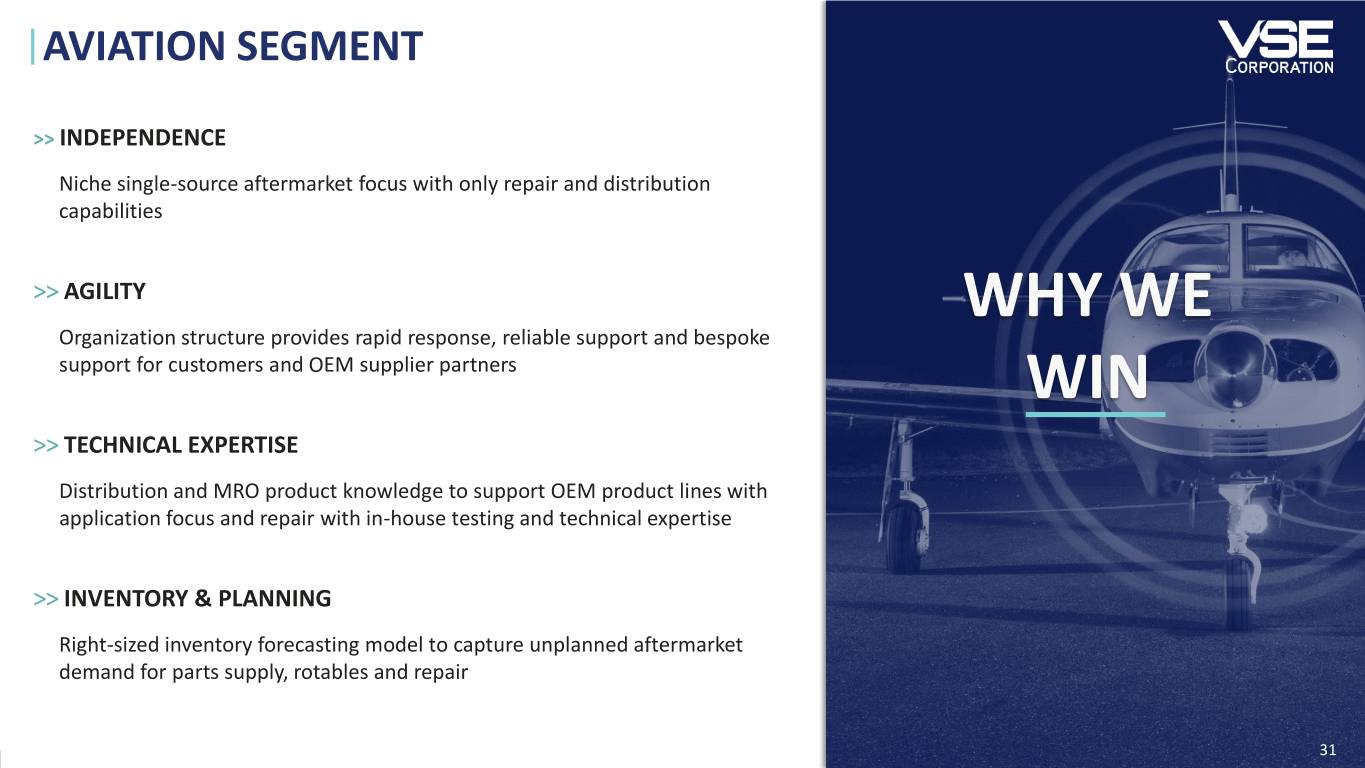
VSE’s Aviation segment provides aftermarket distribution and maintenance, repair and overhaul ("MRO") services
to commercial, cargo, business and general aviation, military/defense and rotorcraft customers globally. Core services include parts distribution, component and engine accessory MRO services, rotable exchange and supply chain services.
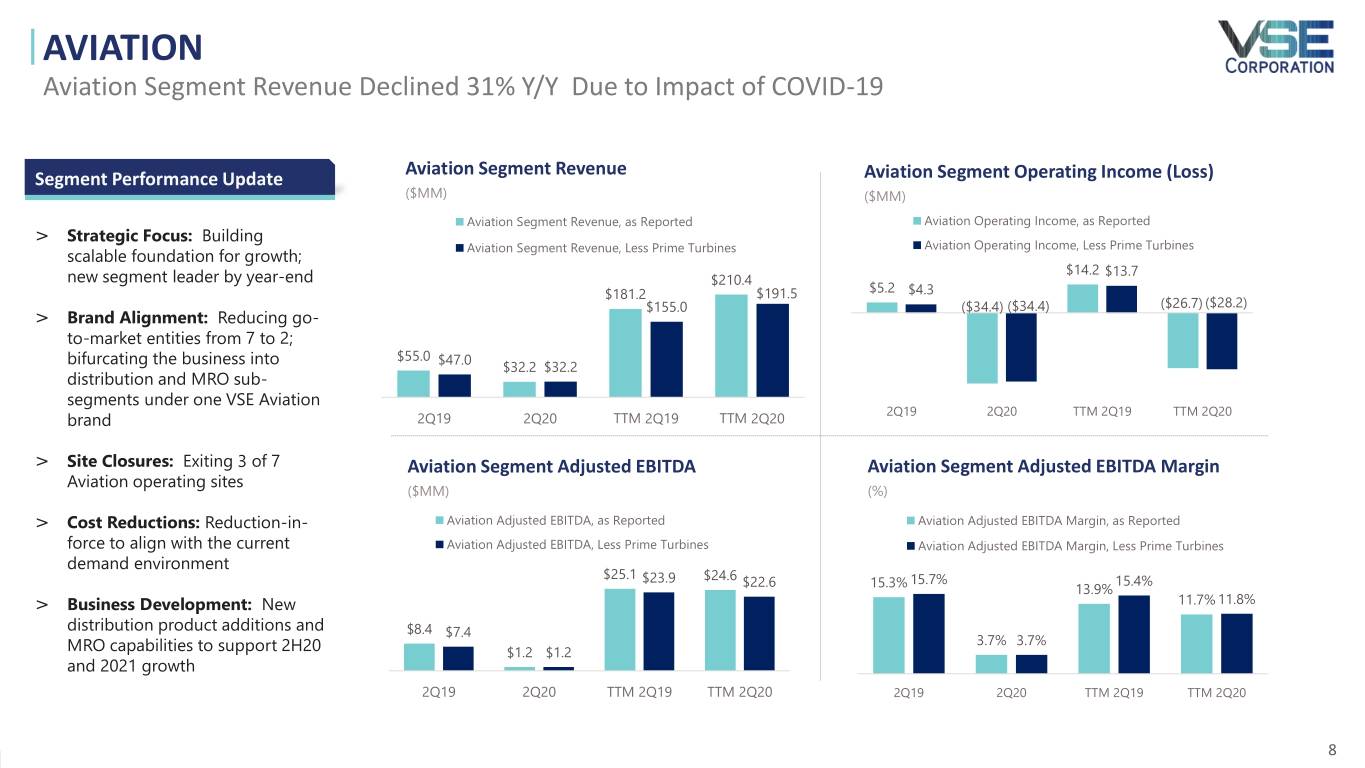
Aviation segment revenue, less contributions from Prime Turbines, decreased 31% year-over-year to $32.2 million in the second quarter 2020, versus $47.0 million in the same period in 2019. The year-over-year revenue decline was attributable to the adverse impact of the COVID-19 pandemic on commercial air traffic, resulting in lower customer activity. The Aviation segment recorded an operating loss of 34.4 million in the second quarter, versus operating income of $5.2 million in the prior-year period. The operating loss was due to a 33.7 million non-cash impairment charge and $0.7 million non-cash loss for the sale of CT Aerospace assets. Adjusted EBITDA decreased 86.0% to $1.2 million in the second quarter 2020.
FLEET
Distribution & Fleet Services
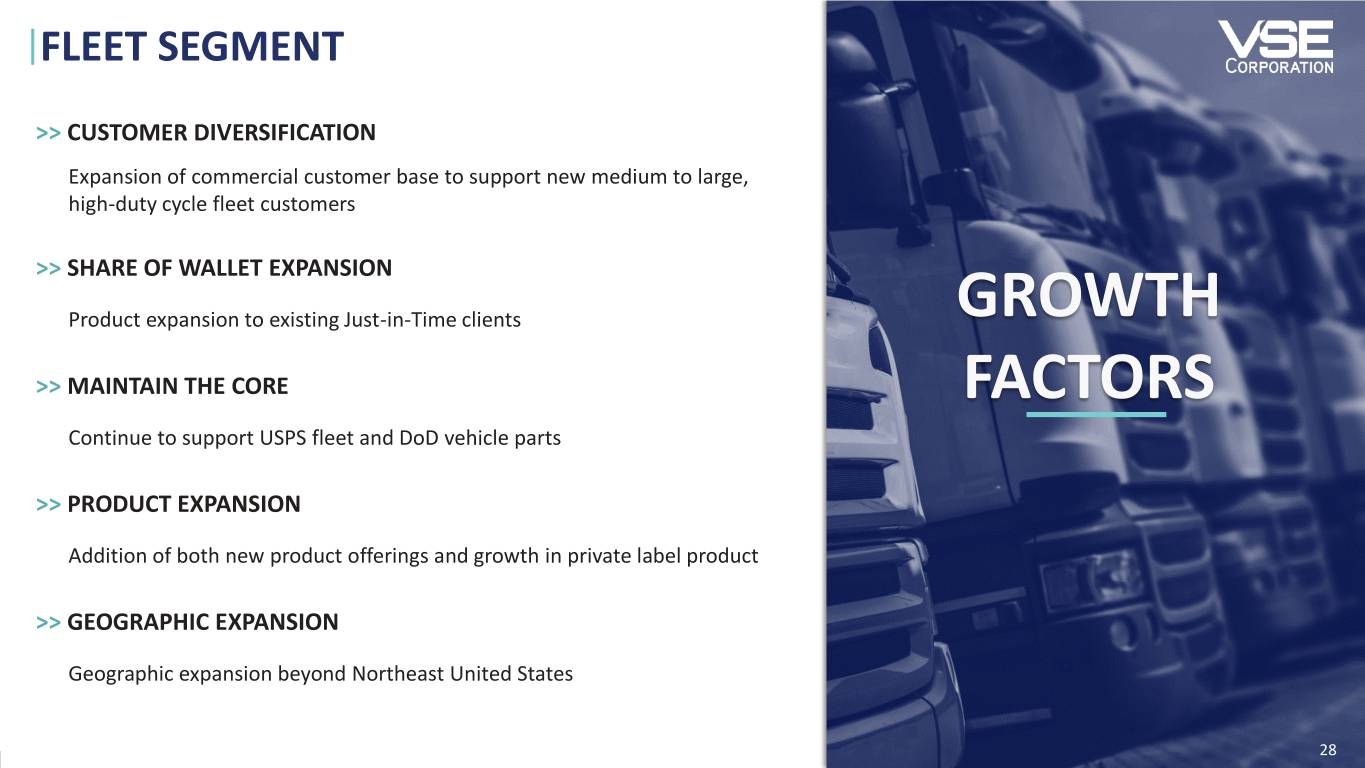
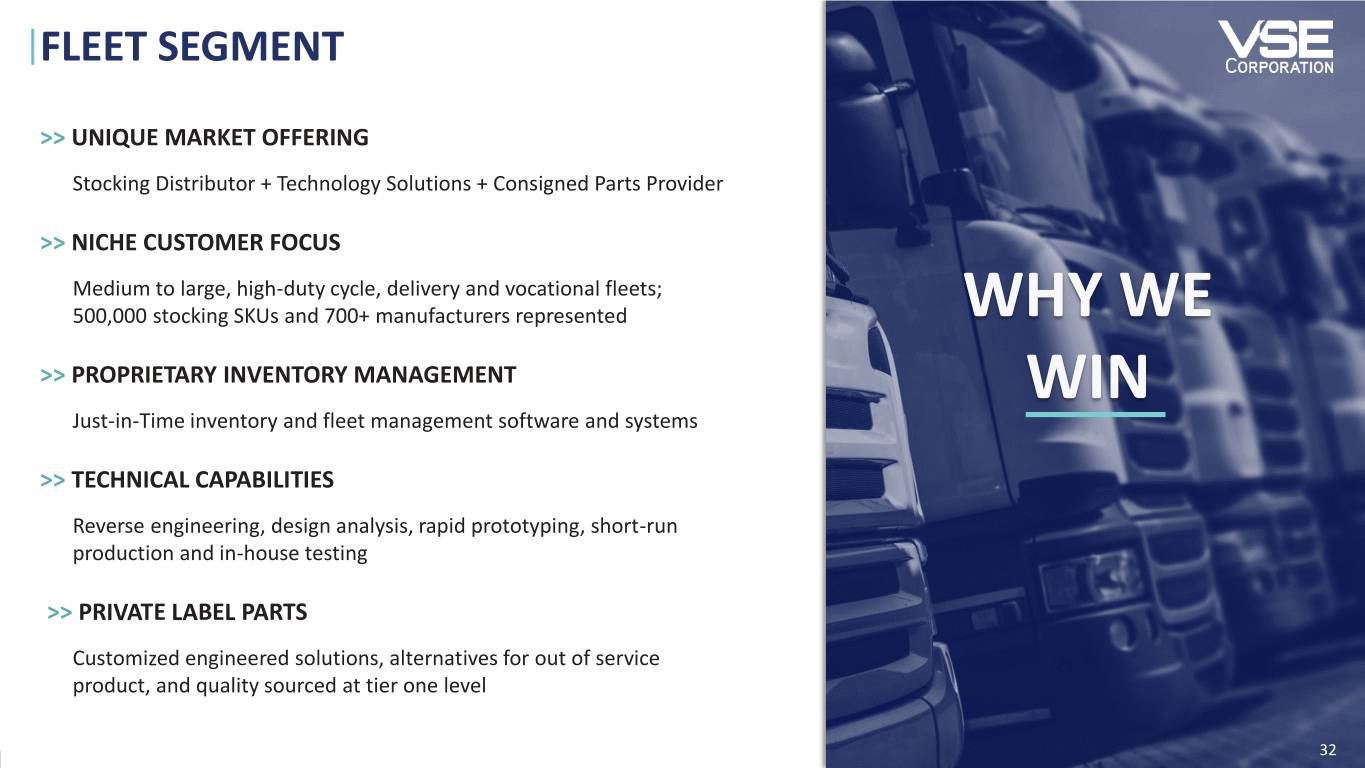
VSE's Fleet segment provides parts, inventory management, e-commerce fulfillment, logistics, supply chain support and other services to support the commercial aftermarket medium- and heavy-duty truck market, the United States Postal Service (USPS), and the United States Department of Defense. Core services include parts distribution, sourcing, IT solutions, customized fleet logistics, warehousing, kitting, just-in-time supply chain management, alternative product sourcing, engineering and technical support.
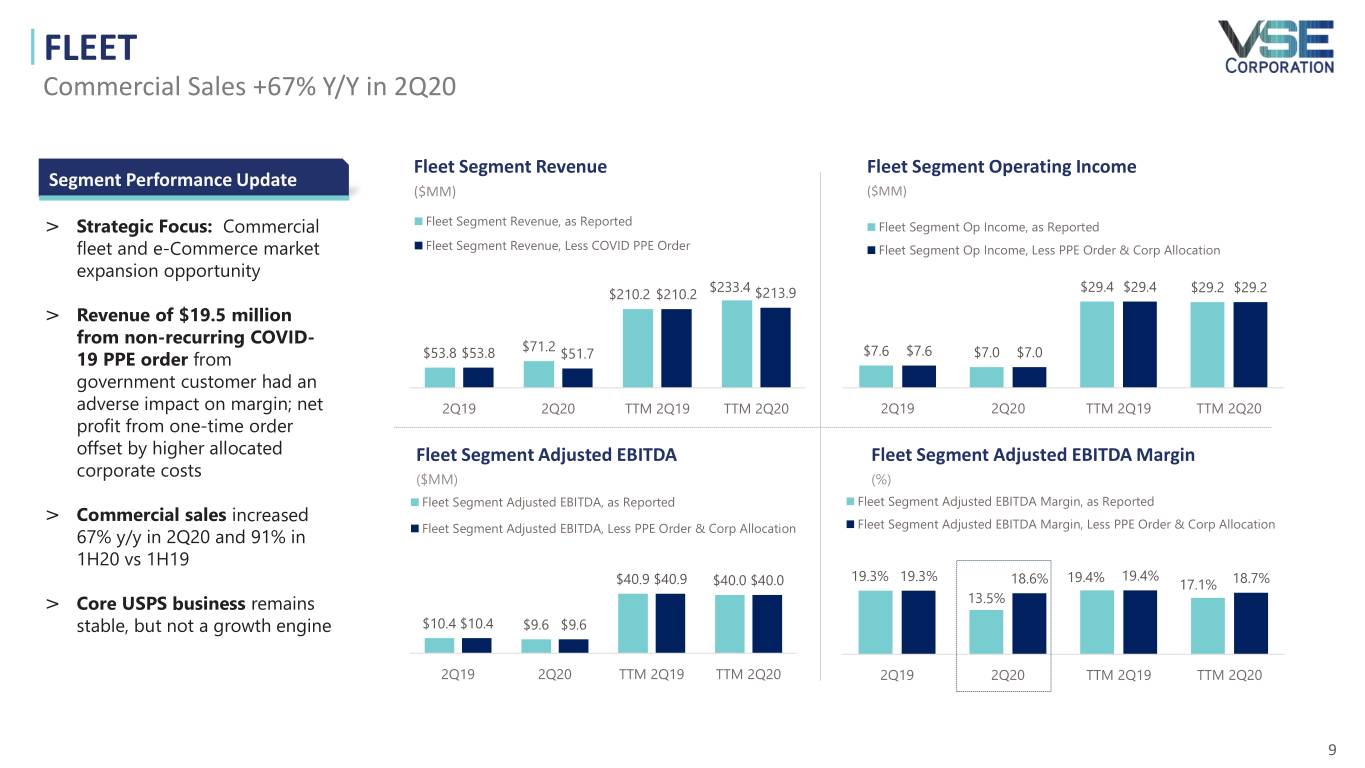
Fleet segment revenue increased 32.4% year-over-year to $71.2 million in the second quarter 2020. Revenues from sales to other government customers increased approximately $15.3 million or 36.3%. Other government customer revenue included pass-through sales of approximately $19.5 million for partial fulfillment of a non-recurring $26.6 million order for COVID-19 PPE supplies. Revenues from commercial customers increased approximately $3.4 million or 67.5%, driven by growth in the e-commerce fulfillment business. Operating income declined 7.2% year-over-year to $7.0 million in the second quarter 2020. Fleet segment Adjusted EBITDA decreased 7.1% year-over-year in the second quarter 2020 to $9.6 million. Adjusted EBITDA margin for the segment was 13.5%. After the 510 basis point impact as a result of the PPE order and allocated corporate costs in the second quarter, the Adjusted EBITDA margin was 18.6%.
FEDERAL & DEFENSE
Logistics & Sustainment Services
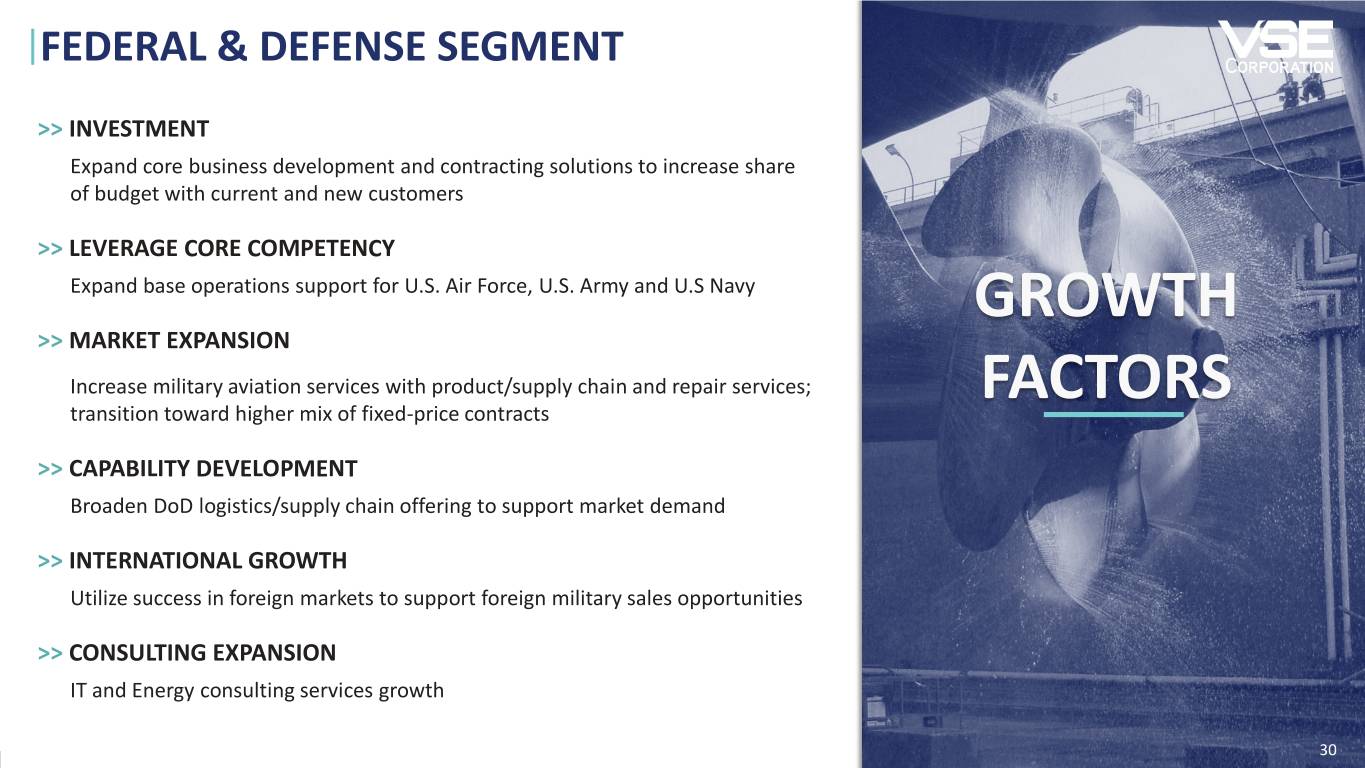
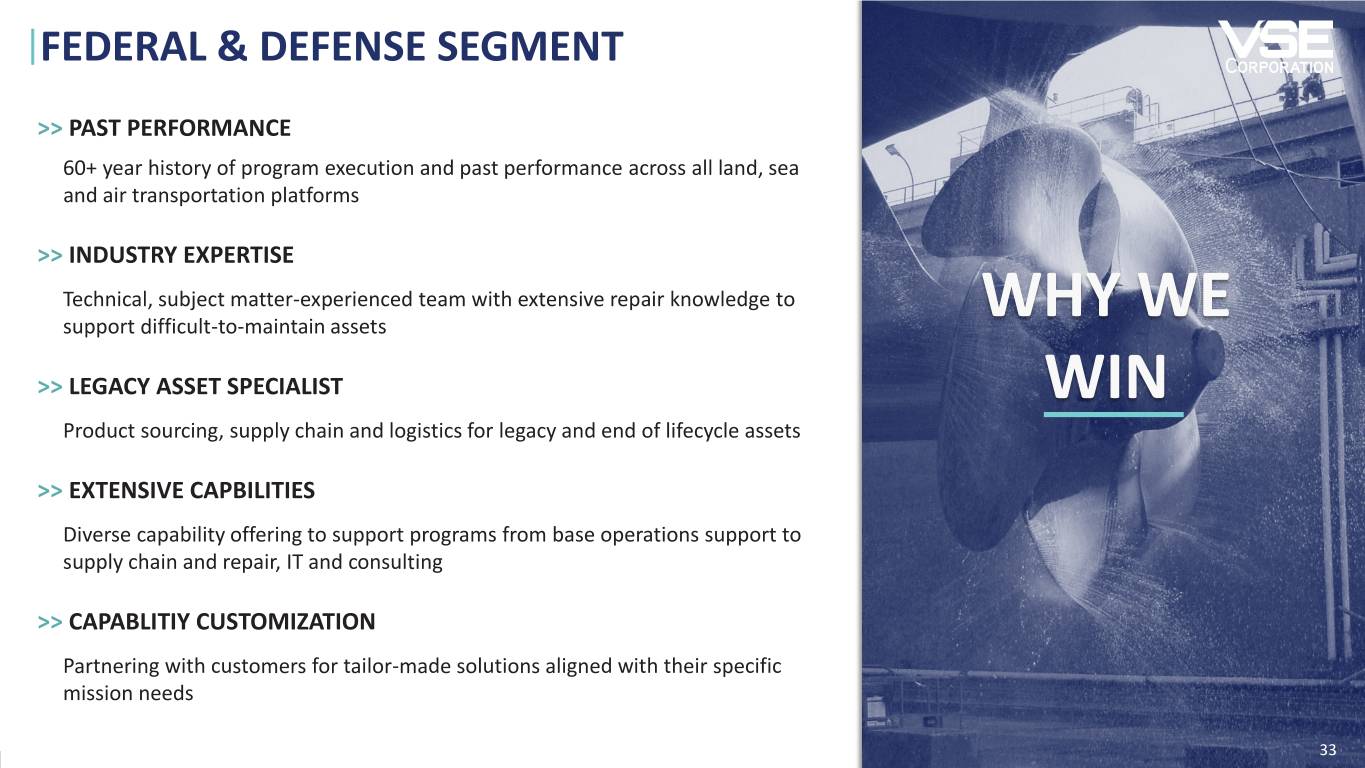
VSE's Federal & Defense segment provides aftermarket MRO and logistics services to improve operational readiness and extend the life cycle of military vehicles, ships and aircraft for the U.S. Armed Forces, federal agencies and international defense customers. Core services include base operations support, procurement, supply chain management, vehicle, maritime and aircraft sustainment services, IT services and energy consulting.
Federal & Defense segment revenue declined 18.7% year-over-year to $65.3 million in the second quarter of 2020. Operating income increased 33.9% year-over-year to $6.8 million in the second quarter 2020. Federal & Defense segment Adjusted EBITDA increased 29.0% year-over-year in the second quarter 2020 to $7.5 million.
Federal & Defense segment bookings decreased 37.5% year-over-year to $45 million, while funded backlog declined 36.4% year-over-year to $171 million. The decline in funded backlog was attributable to the expiration of a contract in January 2020 and delay of new business awards. During the month of July, we announced $42 million of new bookings. The Company continues to be focused on revitalizing this business with an emphasis on growing backlog and developing a channel of new customer activity in the current year.
FINANCIAL RESOURCES AND LIQUIDITY
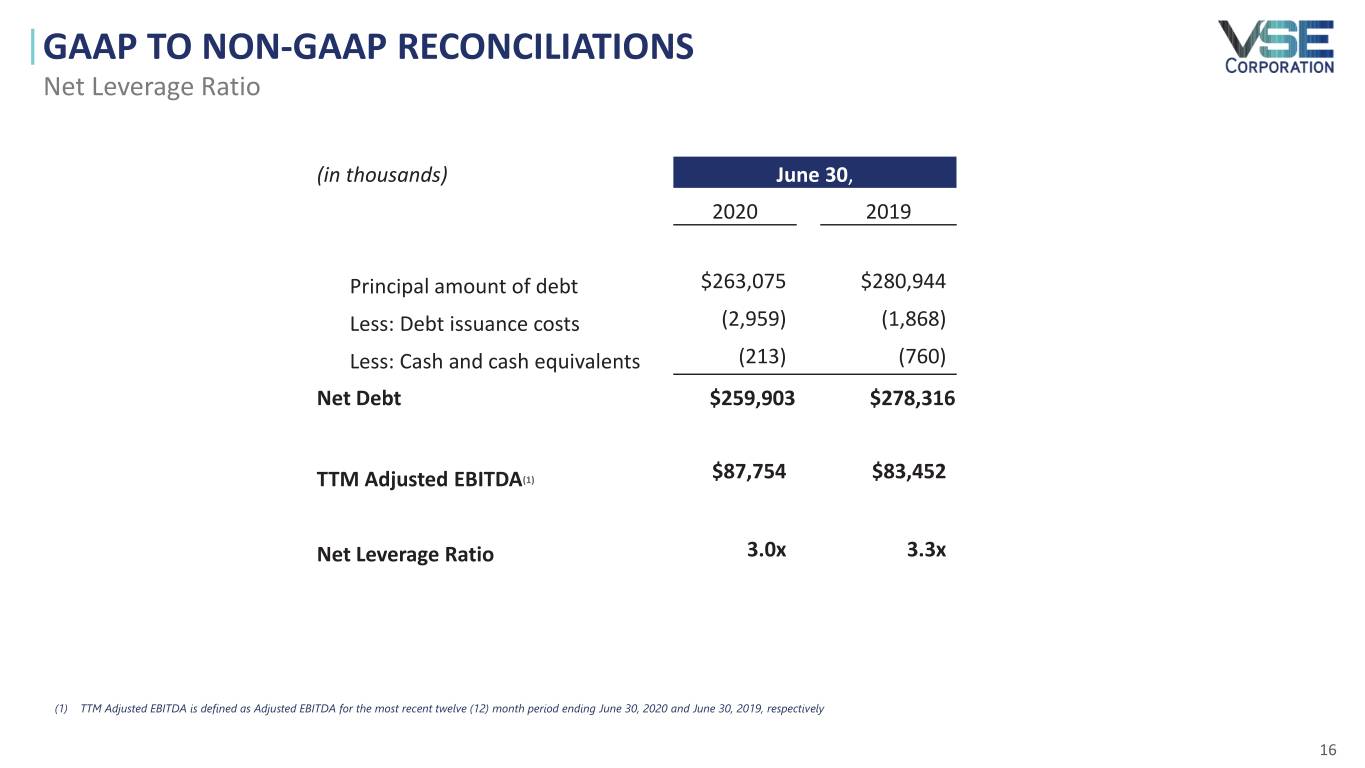
As of June 30, 2020, the Company had $184 million in cash and unused commitment availability under its $350 million revolving credit facility maturing in 2023. The Company’s existing credit facility includes a $100 million accordion provision, subject to customary lender commitment approvals. As of June 30, 2020, VSE had total net debt outstanding of $260 million and $88 million of trailing-twelve months Adjusted EBITDA.
On June 29, 2020, VSE amended its credit facility with its bank group to provide increased financial covenant flexibility given market volatility resulting from the COVID-19 pandemic. Prior to the Amendment, VSE was in compliance with all of its financial covenants as of June 29, 2020, as defined under the credit facility. The Amendment provided, among other things, (i) an increase to the maximum Total Funded Debt to EBITDA Ratio permitted for certain periods; (ii) an adjustment to the definition of the Fixed Charge Coverage Ratio; and (iii) an adjustment to the ranges of the interest rates and commitment fee payable to the banks. The Amendment does not modify the loan commitments or extend the term. For more information, please refer to the Current Report on Form 8-K filed with the SEC on June 29, 2020.
CONFERENCE CALL
A conference call will be held Thursday, July 30, 2020 at 11:00 A.M. ET to review the Company’s financial results, discuss recent events and conduct a question-and-answer session.
A webcast of the conference call and accompanying presentation materials will be available in the Investor Relations section of VSE’s website at https://ir.vsecorp.com. To listen to a live broadcast, go to the site at least 15 minutes prior to the scheduled start time in order to register, download, and install any necessary audio software.
To participate in the live teleconference:
Domestic Live: (877) 407-0789
International Live: (201) 689-8562
Audio Webcast: http://public.viavid.com/index.php?id=140478
To listen to a replay of the teleconference through August 13, 2020:
Domestic Replay: (844) 512-2921
International Replay: (412) 317-6671
Replay PIN Number: 13706117
Non-GAAP Measures
In addition to the financial measures prepared in accordance with generally accepted accounting principles (GAAP), this earnings release also contains Non-GAAP financial measures. The reasons why we believe these measures provide useful information to investors and a reconciliation of these measures to the most directly comparable GAAP measures and other information relating to these Non-GAAP measures are included in the supplemental schedules attached.
SECOND QUARTER RESULTS
(in thousands, except per share data) | ||||||||||||||||||||||
Three months ended June 30, | Six months ended June 30, | |||||||||||||||||||||
2020 | 2019 | % Change | 2020 | 2019 | % Change | |||||||||||||||||
Revenues | $ | 168,715 | $ | 189,111 | (10.8 | )% | $ | 346,133 | $ | 359,030 | (3.6 | )% | ||||||||||
Operating (loss) income | $ | (21,910 | ) | $ | 16,416 | (233.5 | )% | $ | (12,176 | ) | $ | 28,229 | (143.1 | )% | ||||||||
Net (loss) income | $ | (22,624 | ) | $ | 9,898 | (328.6 | )% | $ | (19,292 | ) | $ | 16,501 | (216.9 | )% | ||||||||
EPS (Diluted) | $ | (2.05 | ) | $ | 0.89 | (330.3 | )% | $ | (1.75 | ) | $ | 1.50 | (216.7 | )% | ||||||||
Second Quarter Segment Results
The following is a summary of revenues and operating (loss) income for the three and six months ended June 30, 2020 and June 30, 2019:
(in thousands) | Three months ended June 30, | Six months ended June 30, | ||||||||||||||||||||
2020 | 2019 | % Change | 2020 | 2019 | % Change | |||||||||||||||||
Revenues: | ||||||||||||||||||||||
Aviation | $ | 32,221 | $ | 54,997 | (41.4 | )% | $ | 90,301 | $ | 104,367 | (13.5 | )% | ||||||||||
Fleet | 71,222 | 53,805 | 32.4 | % | 124,426 | 105,509 | 17.9 | % | ||||||||||||||
Federal & Defense | 65,272 | 80,309 | (18.7 | )% | 131,406 | 149,154 | (11.9 | )% | ||||||||||||||
Total Revenues | $ | 168,715 | $ | 189,111 | (10.8 | )% | $ | 346,133 | $ | 359,030 | (3.6 | )% | ||||||||||
Operating (Loss) Income: | ||||||||||||||||||||||
Aviation | $ | (34,387 | ) | $ | 5,204 | (760.8 | )% | $ | (36,267 | ) | $ | 8,252 | (539.5 | )% | ||||||||
Fleet | 7,014 | 7,557 | (7.2 | )% | 13,920 | 14,545 | (4.3 | )% | ||||||||||||||
Federal & Defense | 6,772 | 5,059 | 33.9 | % | 11,696 | 8,444 | 38.5 | % | ||||||||||||||
Corporate/unallocated expenses | (1,309 | ) | (1,404 | ) | (6.8 | )% | (1,525 | ) | (3,012 | ) | (49.4 | )% | ||||||||||
Operating (Loss) Income | $ | (21,910 | ) | $ | 16,416 | (233.5 | )% | $ | (12,176 | ) | $ | 28,229 | (143.1 | )% | ||||||||
The Company reported total capital expenditures in the second quarter of $1.1 million.
NON-GAAP FINANCIAL INFORMATION
Reconciliation of Adjusted Net Income and Adjusted EPS to Net (Loss) Income
(in thousands) | Three months ended June 30, | Six months ended June 30, | |||||||||||||||||||||
2020 | 2019 | % Change | 2020 | 2019 | % Change | ||||||||||||||||||
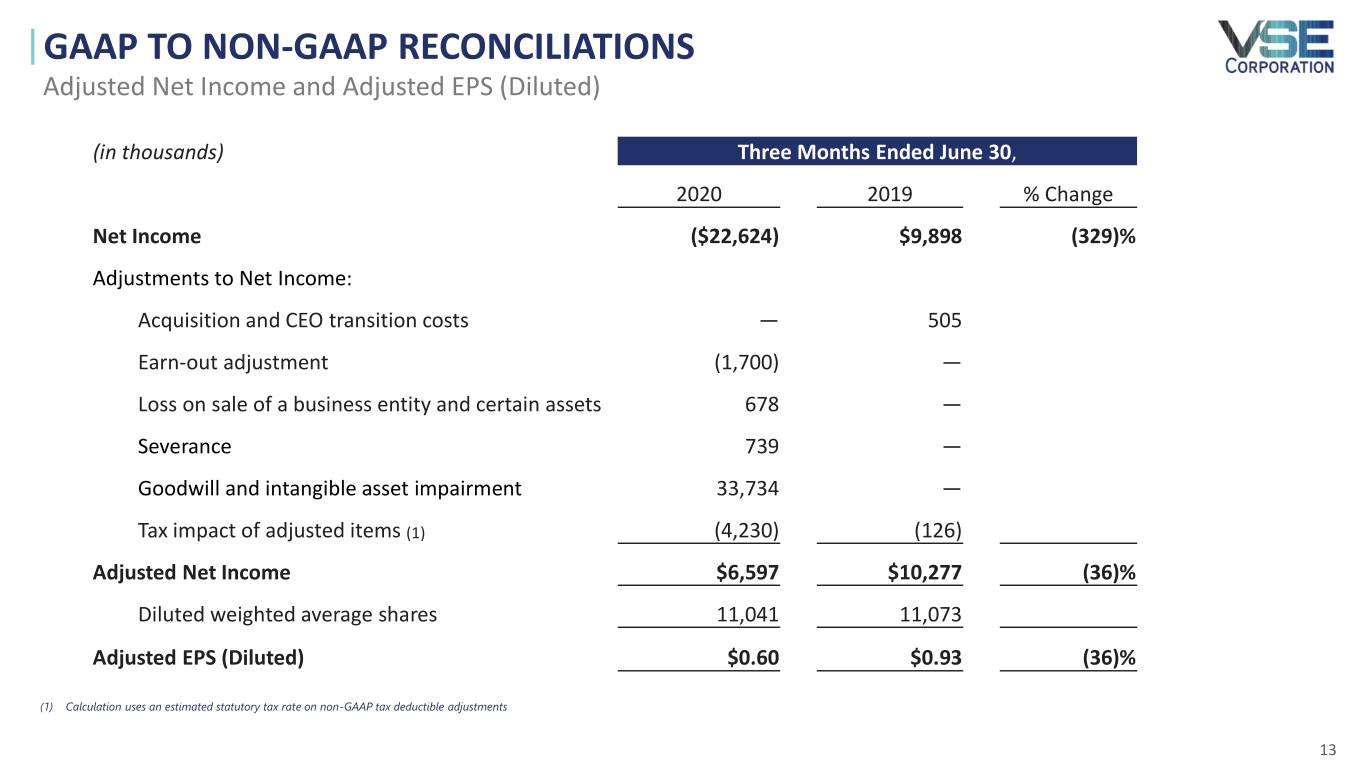
Net (Loss) Income | $ | (22,624 | ) | $ | 9,898 | (328.6 | )% | $ | (19,292 | ) | $ | 16,501 | (216.9 | )% | |||||||||
Adjustments to Net (Loss) Income: | |||||||||||||||||||||||
Acquisition and CEO Transition Costs | — | 505 | — | % | — | 1,626 | — | % | |||||||||||||||
Earn-out adjustment | (1,700 | ) | — | — | % | (1,399 | ) | — | — | % | |||||||||||||
Loss on sale of a business entity and certain assets | 678 | — | — | % | 8,214 | — | — | % | |||||||||||||||
Gain on sale of property | — | — | — | (1,108 | ) | — | — | % | |||||||||||||||
Severance | 739 | — | — | % | 739 | — | — | % | |||||||||||||||
Goodwill and intangible impairment | 33,734 | — | — | % | 33,734 | — | — | % | |||||||||||||||
10,827 | 10,403 | 4.1 | % | 20,888 | 18,127 | 15.2 | % | ||||||||||||||||
Tax impact of adjusted items | (4,230 | ) | (126 | ) | — | % | (4,466 | ) | (406 | ) | — | % | |||||||||||
Adjusted Net Income | $ | 6,597 | $ | 10,277 | (35.8 | )% | $ | 16,422 | $ | 17,721 | (7.3 | )% | |||||||||||
Weighted Average Dilutive Shares | 11,041 | 11,073 | — | % | 11,021 | 11,024 | — | % | |||||||||||||||
Adjusted EPS (Diluted) | $ | 0.60 | $ | 0.93 | (35.5 | )% | $ | 1.49 | $ | 1.61 | (7.5 | )% | |||||||||||
Reconciliation of Consolidated EBIDTA and Adjusted EBITDA to Net (Loss) Income
(in thousands) | Three months ended June 30, | Six months ended June 30, | |||||||||||||||||||||
2020 | 2019 | % Change | 2020 | 2019 | % Change | ||||||||||||||||||
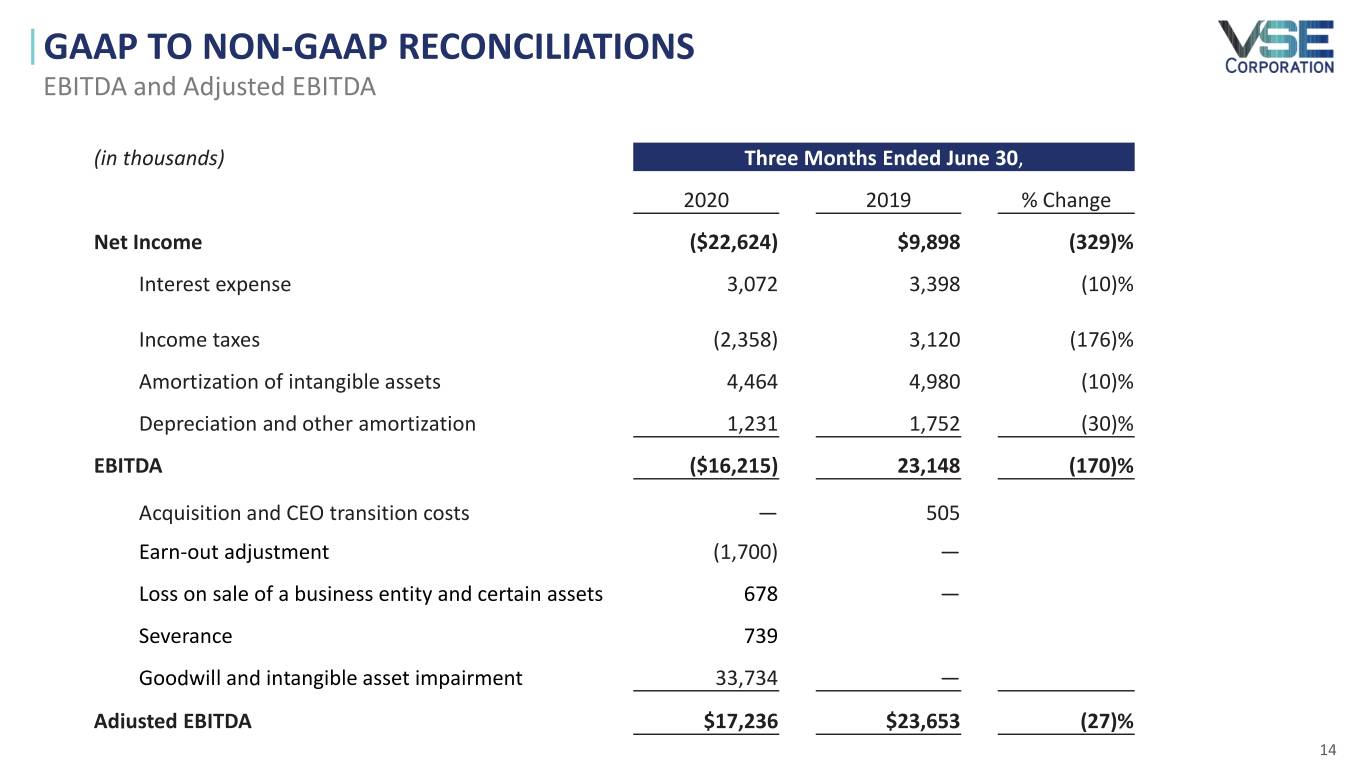
Net (Loss) Income | $ | (22,624 | ) | $ | 9,898 | (328.6 | )% | $ | (19,292 | ) | $ | 16,501 | (216.9 | )% | |||||||||
Interest Expense | 3,072 | 3,398 | (9.6 | )% | 6,558 | 6,556 | — | % | |||||||||||||||
Income Taxes | (2,358 | ) | 3,120 | (175.6 | )% | 558 | 5,172 | (89.2 | )% | ||||||||||||||
Amortization of Intangible Assets | 4,464 | 4,980 | (10.4 | )% | 9,187 | 9,971 | (7.9 | )% | |||||||||||||||
Depreciation and Other Amortization | 1,231 | 1,752 | (29.7 | )% | 2,752 | 3,499 | (21.3 | )% | |||||||||||||||
EBITDA | (16,215 | ) | 23,148 | (170.0 | )% | (237 | ) | 41,699 | (100.6 | )% | |||||||||||||
Acquisition and CEO transition costs | — | 505 | — | % | — | 1,626 | — | % | |||||||||||||||
Earn-out adjustment | (1,700 | ) | — | — | % | (1,399 | ) | — | — | % | |||||||||||||
Loss on sale of a business entity and certain assets | 678 | — | — | % | 8,214 | — | — | % | |||||||||||||||
Gain on sale of property | — | — | — | % | (1,108 | ) | — | — | % | ||||||||||||||
Severance | 739 | — | — | % | 739 | — | — | % | |||||||||||||||
Goodwill and intangible impairment | 33,734 | — | — | % | 33,734 | — | — | % | |||||||||||||||
Adjusted EBITDA | $ | 17,236 | $ | 23,653 | (27.1 | )% | $ | 39,943 | $ | 43,325 | (7.8 | )% | |||||||||||
Reconciliation of Segment EBITDA and Adjusted EBITDA to Operating (Loss) Income
(in thousands) | Three months ended June 30, | Six months ended June 30, | |||||||||||||||||||||
2020 | 2019 | % Change | 2020 | 2019 | % Change | ||||||||||||||||||
Aviation | |||||||||||||||||||||||
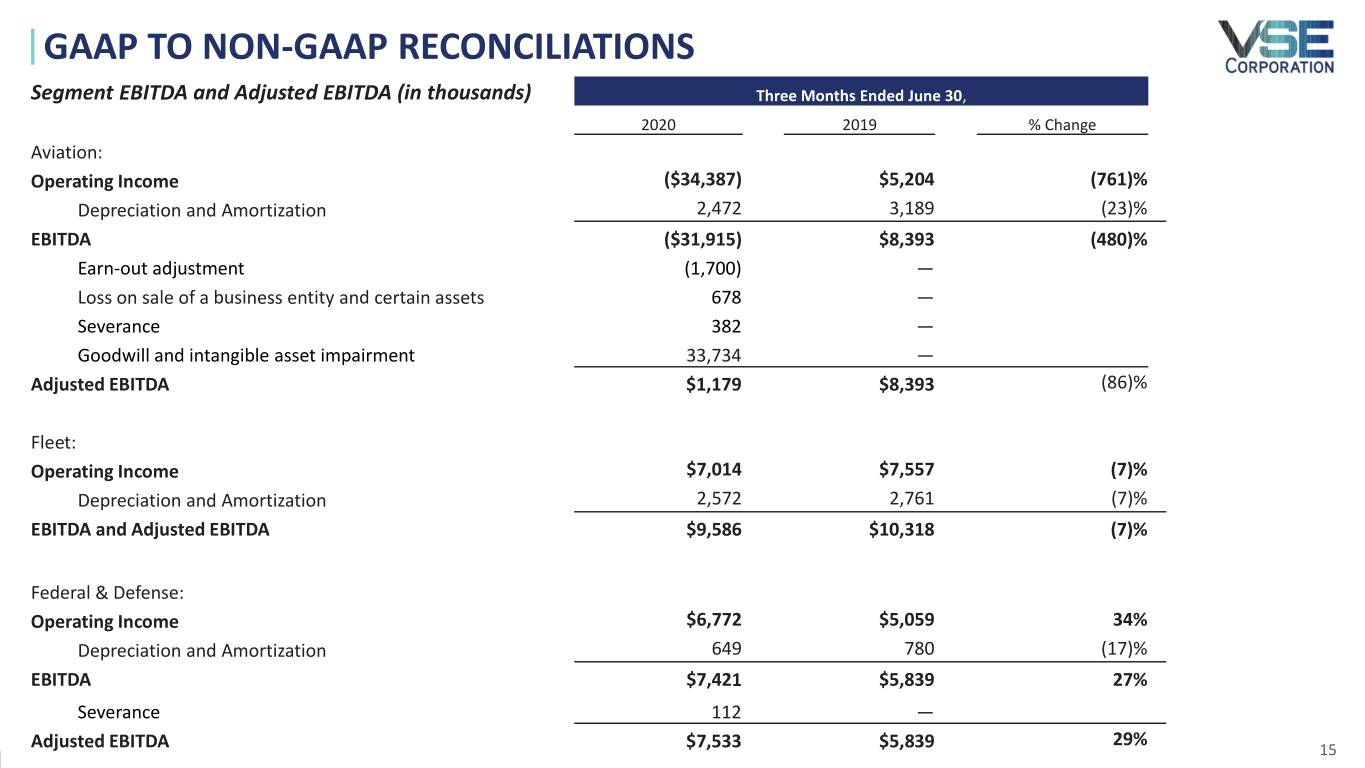
Operating (Loss) Income | $ | (34,387 | ) | $ | 5,204 | (760.8 | )% | $ | (36,267 | ) | $ | 8,252 | (539.5 | )% | |||||||||
Depreciation and Amortization | 2,472 | 3,189 | (22.5 | )% | 5,538 | 6,419 | (13.7 | )% | |||||||||||||||
EBITDA | $ | (31,915 | ) | $ | 8,393 | (480.3 | )% | (30,729 | ) | 14,671 | (309.5 | )% | |||||||||||
Earn-out adjustment | (1,700 | ) | — | — | % | (1,399 | ) | — | — | % | |||||||||||||
Loss on sale of a business entity and certain assets | 678 | — | — | % | 8,214 | — | — | % | |||||||||||||||
Gain on sale of property | — | — | — | % | (1,108 | ) | — | — | % | ||||||||||||||
Severance | 382 | — | — | % | 382 | — | — | % | |||||||||||||||
Goodwill and intangible asset impairment | 33,734 | — | — | % | 33,734 | — | — | % | |||||||||||||||
Adjusted EBITDA | 1,179 | 8,393 | (86.0 | )% | $ | 9,094 | $ | 14,671 | (38.0 | )% | |||||||||||||
Fleet | |||||||||||||||||||||||
Operating Income | $ | 7,014 | $ | 7,557 | (7.2 | )% | $ | 13,920 | $ | 14,545 | (4.3 | )% | |||||||||||
Depreciation and Amortization | 2,572 | 2,761 | (6.8 | )% | 5,244 | 5,555 | (5.6 | )% | |||||||||||||||
EBITDA and Adjusted EBITDA | $ | 9,586 | $ | 10,318 | (7.1 | )% | $ | 19,164 | $ | 20,100 | (4.7 | )% | |||||||||||
Federal & Defense | |||||||||||||||||||||||
Operating Income | $ | 6,772 | $ | 5,059 | 33.9 | % | $ | 11,696 | $ | 8,444 | 38.5 | % | |||||||||||
Depreciation and Amortization | 649 | 780 | (16.8 | )% | 1,388 | 1,628 | (14.7 | )% | |||||||||||||||
EBITDA | $ | 7,421 | $ | 5,839 | 27.1 | % | $ | 13,084 | $ | 10,072 | 29.9 | % | |||||||||||
Severance | $ | 112 | $ | — | — | % | $ | 112 | $ | — | — | % | |||||||||||
Adjusted EBITDA | $ | 7,533 | $ | 5,839 | 29.0 | % | $ | 13,196 | $ | 10,072 | 31.0 | % | |||||||||||
The non-GAAP Financial Information set forth in this document is not calculated in accordance with U.S. generally accepted accounting principles ("GAAP") under SEC Regulation G. We consider Adjusted Net Income, Adjusted EPS (Diluted), EBITDA, Adjusted EBITDA, trailing-twelve months Adjusted EBITDA and free cash flow as non-GAAP financial measures and important indicators of performance and useful metrics for management and investors to evaluate our business' ongoing operating performance on a consistent basis across reporting periods. These non-GAAP financial measures, however, should not be considered in isolation or as a substitute for performance measures prepared in accordance with GAAP. Adjusted Net Income represents Net Income adjusted for executive succession costs, 1st Choice Aerospace acquisition-related costs including any earn-out adjustments, loss on sale of a business entity and certain assets, gain on sale of property, and related tax impact. Adjusted EPS (Diluted) is computed by dividing net income, adjusted for the discrete items as identified above and the related tax impacts, by the diluted weighted average number of common shares outstanding. EBITDA represents net income before interest expense, income taxes, amortization of intangible assets and depreciation and other amortization. Adjusted EBITDA represents EBITDA (as defined above) adjusted for discrete items as identified above, and trailing-twelve months Adjusted EBITDA is defined as Adjusted EBITDA for the most recent twelve (12) month period ending June 30, 2020. Free cash flow represents operating cash flow less capital expenditures.
ABOUT VSE CORPORATION
VSE is a leading provider of aftermarket distribution and repair services for land, sea and air transportation assets for government and commercial markets. Core services include maintenance, repair and overhaul (MRO) services, parts distribution, supply chain management and logistics, engineering support, and consulting and training services for global commercial, federal, military and defense customers. VSE also provides information technology and energy consulting services. For additional information regarding VSE’s services and products, visit us at www.vsecorp.com.
Please refer to the Form 10-Q that will be filed with the Securities and Exchange Commission (SEC) on or about July 30, 2020 for more details on our 2020 second quarter results. Also, refer to VSE’s Annual Report on Form 10-K for the year ended December 31, 2019 for further information and analysis of VSE’s financial condition and results of operations. VSE encourages investors and others to review the detailed reporting and disclosures contained in VSE’s public filings for additional discussion about the status of customer programs and contract awards, risks, revenue sources and funding, dependence on material customers, and management’s discussion of short- and long-term business challenges and opportunities.
FORWARD LOOKING STATEMENTS
This document contains certain forward-looking statements. These forward-looking statements, which are included in accordance with the safe harbor provisions of the Private Securities Litigation Reform Act of 1995, may involve known and unknown risks, uncertainties and other factors that may cause VSE’s actual results and performance in future periods to be materially different from any future results or performance suggested by the forward-looking statements in this document. Although we believe the expectations reflected in such forward-looking statements are based upon reasonable assumptions, we can give no assurance that actual results will not differ materially from these expectations. “Forward-looking” statements, as such term is defined by the Securities Exchange Commission (the “SEC”) in its rules, regulations and releases, represent our expectations or beliefs, including, but not limited to, statements concerning our operations, economic performance, financial condition, the impact of widespread health developments, such as the ongoing COVID-19 outbreak, the health and economic impact thereof, and the governmental, commercial, consumer and other responses thereto, growth and acquisition strategies, investments and future operational plans. Without limiting the generality of the foregoing, words such as “may,” “will,” “expect,” “believe,” “anticipate,” “intend,” “forecast,” “seek,” “plan,” “predict,” “project,” “could,” “estimate,” “might,” “continue,” “seeking” or the negative or other variations thereof or comparable terminology are intended to identify forward-looking statements. These statements, by their nature, involve substantial risks and uncertainties, certain of which are beyond our control, and actual results may differ materially depending on a variety of important factors, including, but not limited to, the uncertainty surrounding the ongoing COVID-19 outbreak and the other factors identified in our reports filed or expected to be filed with the SEC including our Annual Report on Form 10-K for the year ended December 31, 2019. All forward-looking statements made herein are qualified by these cautionary statements and risk factors and there can be no assurance that the actual results, events or developments referenced herein will occur or be realized. Readers are cautioned not to place undue reliance on these forward looking-statements, which reflect management's analysis only as of the date hereof. We undertake no obligation to update or revise forward-looking statements to reflect changed assumptions, the occurrence of unanticipated events or changes to future operating results.
INVESTOR CONTACT
Noel Ryan
(720) 778-2415
VSE Corporation and Subsidiaries
Unaudited Consolidated Balance Sheets
(in thousands except share and per share amounts)
June 30, | December 31, | ||||||
2020 | 2019 | ||||||
Assets | |||||||
Current assets: | |||||||
Cash and cash equivalents | $ | 213 | $ | 734 | |||
Receivables, net | 58,615 | 70,630 | |||||
Unbilled receivables, net | 41,859 | 46,279 | |||||
Inventories, net | 223,134 | 218,627 | |||||
Other current assets | 30,257 | 19,071 | |||||
Total current assets | 354,078 | 355,341 | |||||
Property and equipment, net | 36,987 | 43,465 | |||||
Intangible assets, net | 111,912 | 132,175 | |||||
Goodwill | 238,126 | 276,450 | |||||
Operating lease right-of-use asset | 21,395 | 20,943 | |||||
Other assets | 25,064 | 17,490 | |||||
Total assets | $ | 787,562 | $ | 845,864 | |||
Liabilities and Stockholders' equity | |||||||
Current liabilities: | |||||||
Current portion of long-term debt | $ | 18,504 | $ | 16,883 | |||
Accounts payable | 76,183 | 68,099 | |||||
Current portion of earn-out obligation | 3,600 | 31,700 | |||||
Accrued expenses and other current liabilities | 47,472 | 46,514 | |||||
Dividends payable | 994 | 987 | |||||
Total current liabilities | 146,753 | 164,183 | |||||
Long-term debt, less current portion | 241,612 | 253,128 | |||||
Deferred compensation | 20,535 | 18,146 | |||||
Long-term operating lease obligations | 24,272 | 24,441 | |||||
Earn-out obligation, less current portion | — | 5,000 | |||||
Deferred tax liabilities | 11,436 | 17,865 | |||||
Total liabilities | 444,608 | 482,763 | |||||
Commitments and contingencies | |||||||
Stockholders' equity: | |||||||
Common stock, par value $0.05 per share, authorized 15,000,000 shares; issued and outstanding 11,043,246 and 10,970,123, respectively | 552 | 549 | |||||
Additional paid-in capital | 31,494 | 29,411 | |||||
Retained earnings | 312,965 | 334,246 | |||||
Accumulated other comprehensive loss | (2,057 | ) | (1,105 | ) | |||
Total stockholders' equity | 342,954 | 363,101 | |||||
Total liabilities and stockholders' equity | $ | 787,562 | $ | 845,864 | |||
VSE Corporation and Subsidiaries
Unaudited Consolidated Statements of (Loss) Income
(in thousands except share and per share amounts)
For the three months ended June 30, | For the six months ended June 30, | |||||||||||||||
2020 | 2019 | 2020 | 2019 | |||||||||||||
Revenues: | ||||||||||||||||
Products | $ | 85,747 | $ | 76,959 | $ | 162,089 | $ | 150,700 | ||||||||
Services | 82,968 | 112,152 | 184,044 | 208,330 | ||||||||||||
Total revenues | 168,715 | 189,111 | 346,133 | 359,030 | ||||||||||||
Costs and operating expenses: | ||||||||||||||||
Products | 76,522 | 65,255 | 142,049 | 128,112 | ||||||||||||
Services | 73,932 | 101,472 | 164,690 | 190,348 | ||||||||||||
Selling, general and administrative expenses | 1,295 | 988 | 1,543 | 2,370 | ||||||||||||
Amortization of intangible assets | 4,464 | 4,980 | 9,187 | 9,971 | ||||||||||||
Total costs and operating expenses | 156,213 | 172,695 | 317,469 | 330,801 | ||||||||||||
12,502 | 16,416 | 28,664 | 28,229 | |||||||||||||
Loss on sale of a business entity and certain assets | (678 | ) | — | (8,214 | ) | — | ||||||||||
Gain on sale of property | — | — | 1,108 | — | ||||||||||||
Goodwill and intangible asset impairment | (33,734 | ) | — | (33,734 | ) | — | ||||||||||
Operating (loss) income | (21,910 | ) | 16,416 | (12,176 | ) | 28,229 | ||||||||||
Interest expense, net | 3,072 | 3,398 | 6,558 | 6,556 | ||||||||||||
(Loss) income before income taxes | (24,982 | ) | 13,018 | (18,734 | ) | 21,673 | ||||||||||
Provision for income taxes | (2,358 | ) | 3,120 | 558 | 5,172 | |||||||||||
Net (loss) income | $ | (22,624 | ) | $ | 9,898 | $ | (19,292 | ) | $ | 16,501 | ||||||
Basic (loss) earnings per share | $ | (2.05 | ) | $ | 0.91 | $ | (1.75 | ) | $ | 1.51 | ||||||
Basic weighted average shares outstanding | 11,041,235 | 10,969,899 | 11,020,720 | 10,945,172 | ||||||||||||
Diluted (loss) earnings per share | $ | (2.05 | ) | $ | 0.89 | $ | (1.75 | ) | $ | 1.50 | ||||||
Diluted weighted average shares outstanding | 11,041,235 | 11,072,745 | 11,020,720 | 11,023,685 | ||||||||||||
Dividends declared per share | $ | 0.09 | $ | 0.09 | $ | 0.18 | $ | 0.17 | ||||||||
VSE Corporation and Subsidiaries
Unaudited Consolidated Statements of Cash Flows
(in thousands)
For the six months ended June 30, | ||||||||
2020 | 2019 | |||||||
Cash flows from operating activities: | ||||||||
Net (loss) income | $ | (19,292 | ) | $ | 16,501 | |||
Adjustments to reconcile net income to net cash provided by operating activities: | ||||||||
Depreciation and amortization | 12,403 | 13,637 | ||||||
Deferred taxes | (2,980 | ) | (312 | ) | ||||
Stock-based compensation | 1,313 | 1,982 | ||||||
Loss on sale of a business entity and certain assets | 8,214 | — | ||||||
Gain on sale of property and equipment | (1,000 | ) | — | |||||
Goodwill and intangible asset impairment | 33,734 | — | ||||||
Earn-out obligation fair value adjustment | (1,399 | ) | — | |||||
Changes in operating assets and liabilities, net of impact of acquisitions: | ||||||||
Receivables | 4,588 | (6,599 | ) | |||||
Unbilled receivables | 193 | (4,706 | ) | |||||
Inventories | (19,884 | ) | (23,942 | ) | ||||
Other current assets and noncurrent assets | (8,320 | ) | (3,914 | ) | ||||
Accounts payable and deferred compensation | 11,512 | 14,149 | ||||||
Accrued expenses and other current and noncurrent liabilities | 3,726 | (2,744 | ) | |||||
Net cash provided by operating activities | 22,808 | 4,052 | ||||||
Cash flows from investing activities: | ||||||||
Purchases of property and equipment | (1,828 | ) | (6,303 | ) | ||||
Proceeds from the sale of property and equipment | 2,424 | 4 | ||||||
Proceeds from the sale of a business entity and certain assets | 20,753 | — | ||||||
Cash paid for acquisitions, net of cash acquired | — | (112,660 | ) | |||||
Net cash provided by (used in) investing activities | 21,349 | (118,959 | ) | |||||
Cash flows from financing activities: | ||||||||
Borrowings on loan agreement | 235,118 | 300,726 | ||||||
Repayments on loan agreement | (244,843 | ) | (182,516 | ) | ||||
Earn-out obligation payments | (31,701 | ) | — | |||||
Payment of debt financing costs | (636 | ) | — | |||||
Payments of taxes for equity transactions | (635 | ) | (955 | ) | ||||
Dividends paid | (1,981 | ) | (1,750 | ) | ||||
Net cash (used in) provided by financing activities | (44,678 | ) | 115,505 | |||||
Net (decrease) increase in cash and cash equivalents | (521 | ) | 598 | |||||
Cash and cash equivalents at beginning of period | 734 | 162 | ||||||
Cash and cash equivalents at end of period | $ | 213 | $ | 760 | ||||