vec-20220510
false000160154800016015482022-05-102022-05-10

UNITED STATES
SECURITIES AND EXCHANGE COMMISSION

Washington, D.C. 20549

FORM 8-K

CURRENT REPORT
Pursuant to Section 13 or 15(d) of
the Securities Exchange Act of 1934

Date of Report (Date of earliest event reported): May 10, 2022

VECTRUS, INC.

(Exact name of Registrant as specified in its charter)

Indiana
001-36341
38-3924636
(State or other jurisdiction of incorporation)
(Commission File Number)
(I.R.S. Employer Identification No.)

2424 Garden of the Gods Road, Suite 300
Colorado Springs, CO 80919
(Address of principal executive offices) (Zip Code)

Registrant's telephone number, including area code: (719) 591-3600

Not Applicable
(Former name or former address, if changed since last report)
Securities Registered Under Section 12(b) of the Act:
Title of each class
Trading symbol(s)
Name of each exchange on which registered
Common Stock, Par Value $0.01 Per Share
VEC
New York Stock Exchange

Check the appropriate box below if the Form 8-K filing is intended to simultaneously satisfy the filing obligation of the registrant under any of the following provisions:

    Written communications pursuant to Rule 425 under the Securities Act (17 CFR 230.425)

    Soliciting material pursuant to Rule 14a-12 under the Exchange Act (17 CFR 240.14a-12)

    Pre-commencement communications pursuant to Rule 14d-2(b) under the Exchange Act (17 CFR 240.14d-2(b))

    Pre-commencement communications pursuant to Rule 13e-4(c) under the Exchange Act (17 CFR 240.13e-4(c))


Indicate by check mark whether the registrant is an emerging growth company as defined in Rule 405 of the Securities Act of 1933 (§230.405 of this chapter) or Rule 12b-2 of the Securities Exchange Act of 1934 (§240.12b-2 of this chapter).
Emerging growth company
If an emerging growth company, indicate by check mark if the registrant has elected not to use the extended transition period for complying with any new or revised financial accounting standards provided pursuant to Section 13(a) of the Exchange Act. ☐


ITEM 2.02 Results of Operations and Financial Condition.

Attached hereto as Exhibit 99.1 and incorporated by reference herein is a press release issued by Vectrus, Inc. (the “Company”) on May 10, 2022 that includes financial information for the Company for the first quarter of 2022 and guidance for fiscal 2022. This information shall not be deemed filed for purposes of Section 18 of the Securities Exchange Act of 1934, as amended (the “Exchange Act”) or incorporated by reference into any filing under the Securities Act of 1933, as amended (the “Securities Act”), or the Exchange Act, except as shall be expressly set forth by specific reference in such filing.

ITEM 7.01 Regulation FD Disclosure.

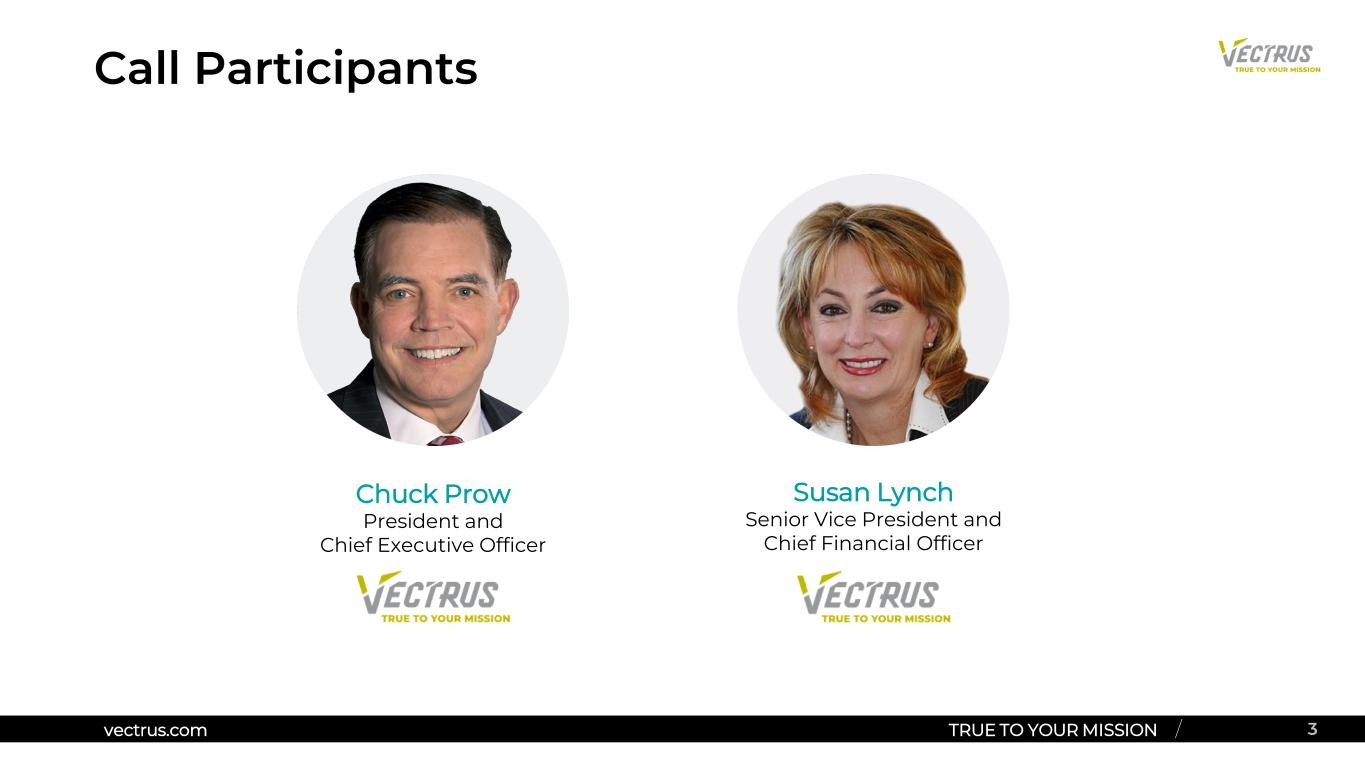
Mr. Charles Prow, President and Chief Executive Officer, and Ms. Susan Lynch, Senior Vice President and Chief Financial Officer, will present the financial information for the Company for the first quarter of 2022 and guidance for fiscal 2022 on May 10, 2022. A copy of the presentation is attached hereto and incorporated by reference herein as Exhibit 99.2. This information is furnished pursuant to Item 7.01 Regulation FD Disclosure and shall not be deemed filed for purposes of Section 18 of the Exchange Act or incorporated by reference into any filing under the Securities Act or the Exchange Act, except as shall be expressly set forth by specific reference in such filing.

ITEM 9.01 Financial Statements and Exhibits

(d) Exhibits.
Exhibit No.Description


SIGNATURES

Pursuant to the requirements of the Securities Exchange Act of 1934, the registrant has duly caused this report to be signed on its behalf by the undersigned hereunto duly authorized.

Date: May 10, 2022VECTRUS, INC.
By:/s/ William B. Noon
Its:Corporate Vice President and Chief Accounting Officer

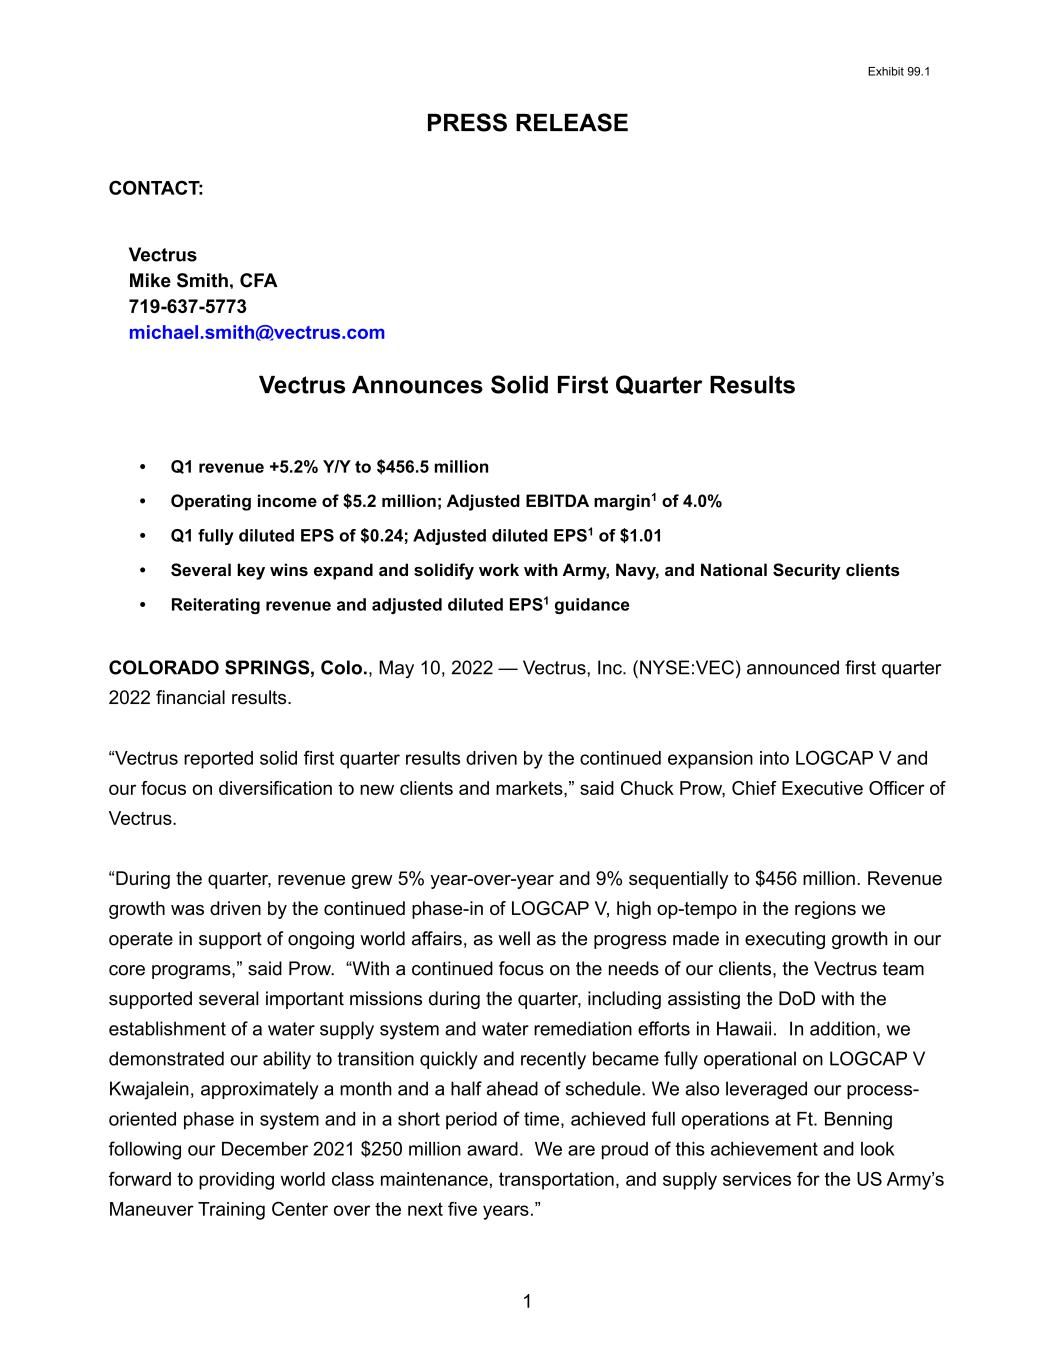
Exhibit 99.1 1 PRESS RELEASE CONTACT: Vectrus Mike Smith, CFA 719-637-5773 [email protected] Vectrus Announces Solid First Quarter Results • Q1 revenue +5.2% Y/Y to $456.5 million • Operating income of $5.2 million; Adjusted EBITDA margin1 of 4.0% • Q1 fully diluted EPS of $0.24; Adjusted diluted EPS1 of $1.01 • Several key wins expand and solidify work with Army, Navy, and National Security clients • Reiterating revenue and adjusted diluted EPS1 guidance COLORADO SPRINGS, Colo., May 10, 2022 — Vectrus, Inc. (NYSE:VEC) announced first quarter 2022 financial results. “Vectrus reported solid first quarter results driven by the continued expansion into LOGCAP V and our focus on diversification to new clients and markets,” said Chuck Prow, Chief Executive Officer of Vectrus. “During the quarter, revenue grew 5% year-over-year and 9% sequentially to $456 million. Revenue growth was driven by the continued phase-in of LOGCAP V, high op-tempo in the regions we operate in support of ongoing world affairs, as well as the progress made in executing growth in our core programs,” said Prow. “With a continued focus on the needs of our clients, the Vectrus team supported several important missions during the quarter, including assisting the DoD with the establishment of a water supply system and water remediation efforts in Hawaii. In addition, we demonstrated our ability to transition quickly and recently became fully operational on LOGCAP V Kwajalein, approximately a month and a half ahead of schedule. We also leveraged our process- oriented phase in system and in a short period of time, achieved full operations at Ft. Benning following our December 2021 $250 million award. We are proud of this achievement and look forward to providing world class maintenance, transportation, and supply services for the US Army’s Maneuver Training Center over the next five years.”
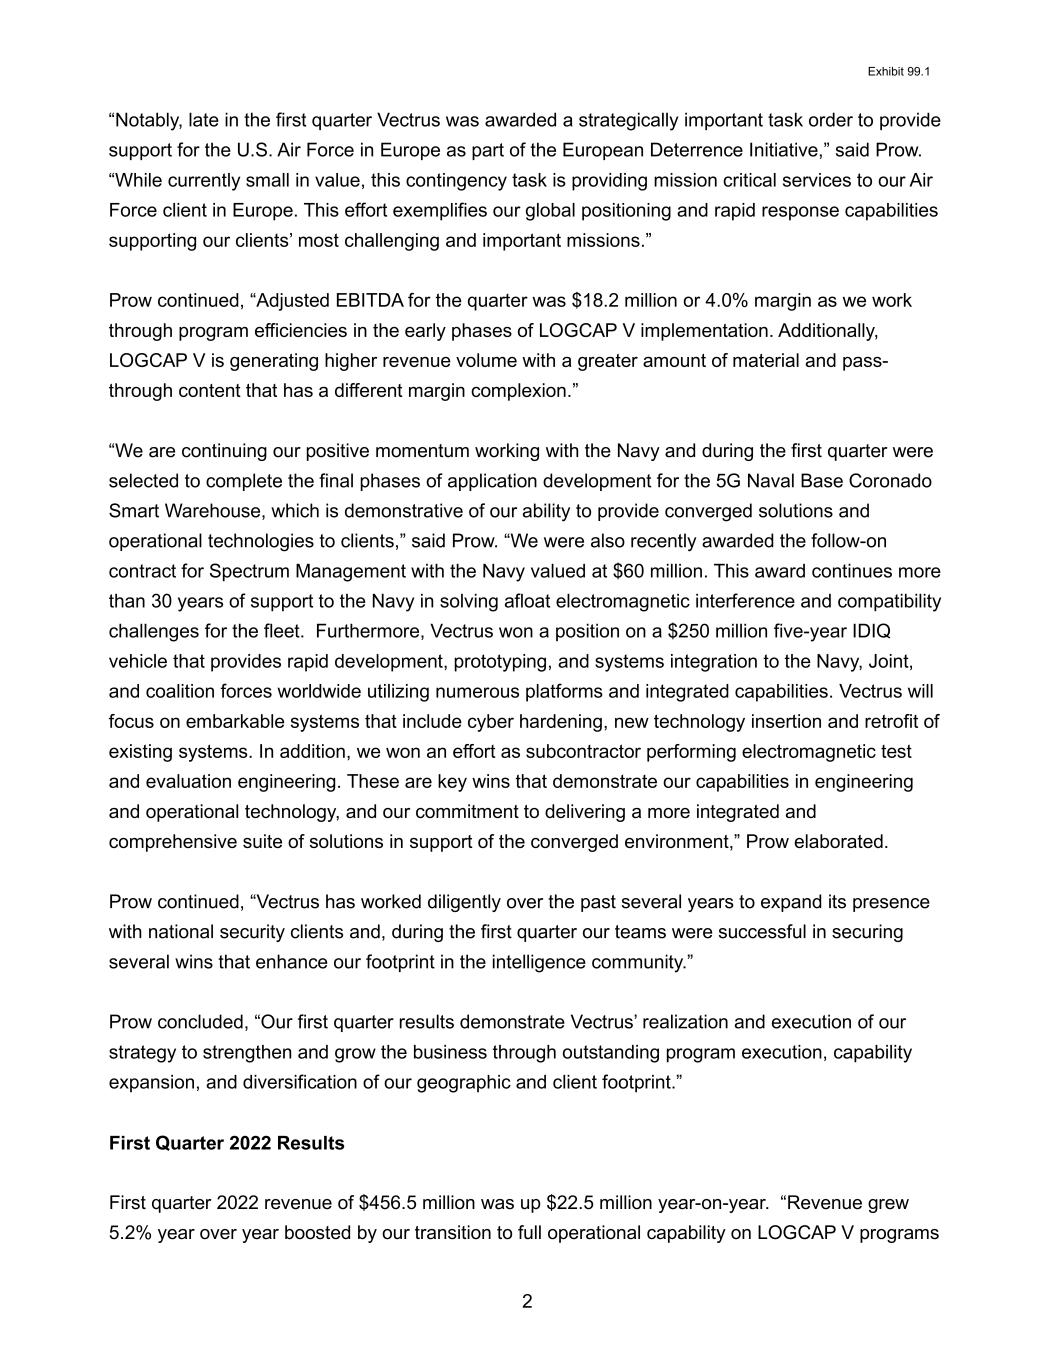

 
Exhibit 99.1 2 “Notably, late in the first quarter Vectrus was awarded a strategically important task order to provide support for the U.S. Air Force in Europe as part of the European Deterrence Initiative,” said Prow. “While currently small in value, this contingency task is providing mission critical services to our Air Force client in Europe. This effort exemplifies our global positioning and rapid response capabilities supporting our clients’ most challenging and important missions.” Prow continued, “Adjusted EBITDA for the quarter was $18.2 million or 4.0% margin as we work through program efficiencies in the early phases of LOGCAP V implementation. Additionally, LOGCAP V is generating higher revenue volume with a greater amount of material and pass- through content that has a different margin complexion.” “We are continuing our positive momentum working with the Navy and during the first quarter were selected to complete the final phases of application development for the 5G Naval Base Coronado Smart Warehouse, which is demonstrative of our ability to provide converged solutions and operational technologies to clients,” said Prow. “We were also recently awarded the follow-on contract for Spectrum Management with the Navy valued at $60 million. This award continues more than 30 years of support to the Navy in solving afloat electromagnetic interference and compatibility challenges for the fleet. Furthermore, Vectrus won a position on a $250 million five-year IDIQ vehicle that provides rapid development, prototyping, and systems integration to the Navy, Joint, and coalition forces worldwide utilizing numerous platforms and integrated capabilities. Vectrus will focus on embarkable systems that include cyber hardening, new technology insertion and retrofit of existing systems. In addition, we won an effort as subcontractor performing electromagnetic test and evaluation engineering. These are key wins that demonstrate our capabilities in engineering and operational technology, and our commitment to delivering a more integrated and comprehensive suite of solutions in support of the converged environment,” Prow elaborated. Prow continued, “Vectrus has worked diligently over the past several years to expand its presence with national security clients and, during the first quarter our teams were successful in securing several wins that enhance our footprint in the intelligence community.” Prow concluded, “Our first quarter results demonstrate Vectrus’ realization and execution of our strategy to strengthen and grow the business through outstanding program execution, capability expansion, and diversification of our geographic and client footprint.” First Quarter 2022 Results First quarter 2022 revenue of $456.5 million was up $22.5 million year-on-year. “Revenue grew 5.2% year over year boosted by our transition to full operational capability on LOGCAP V programs
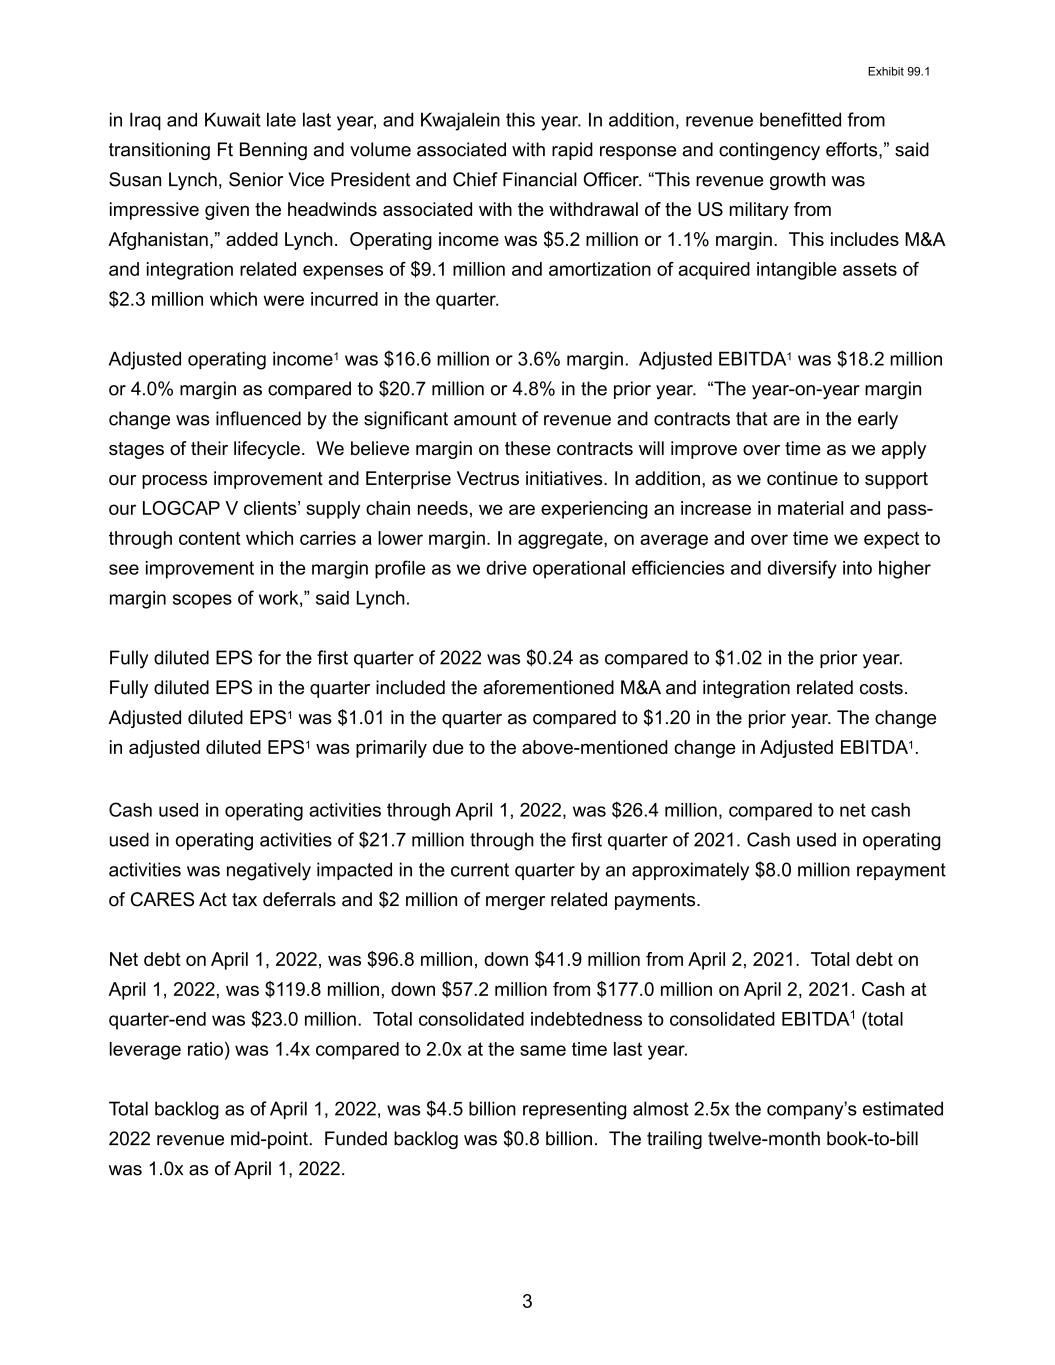

 
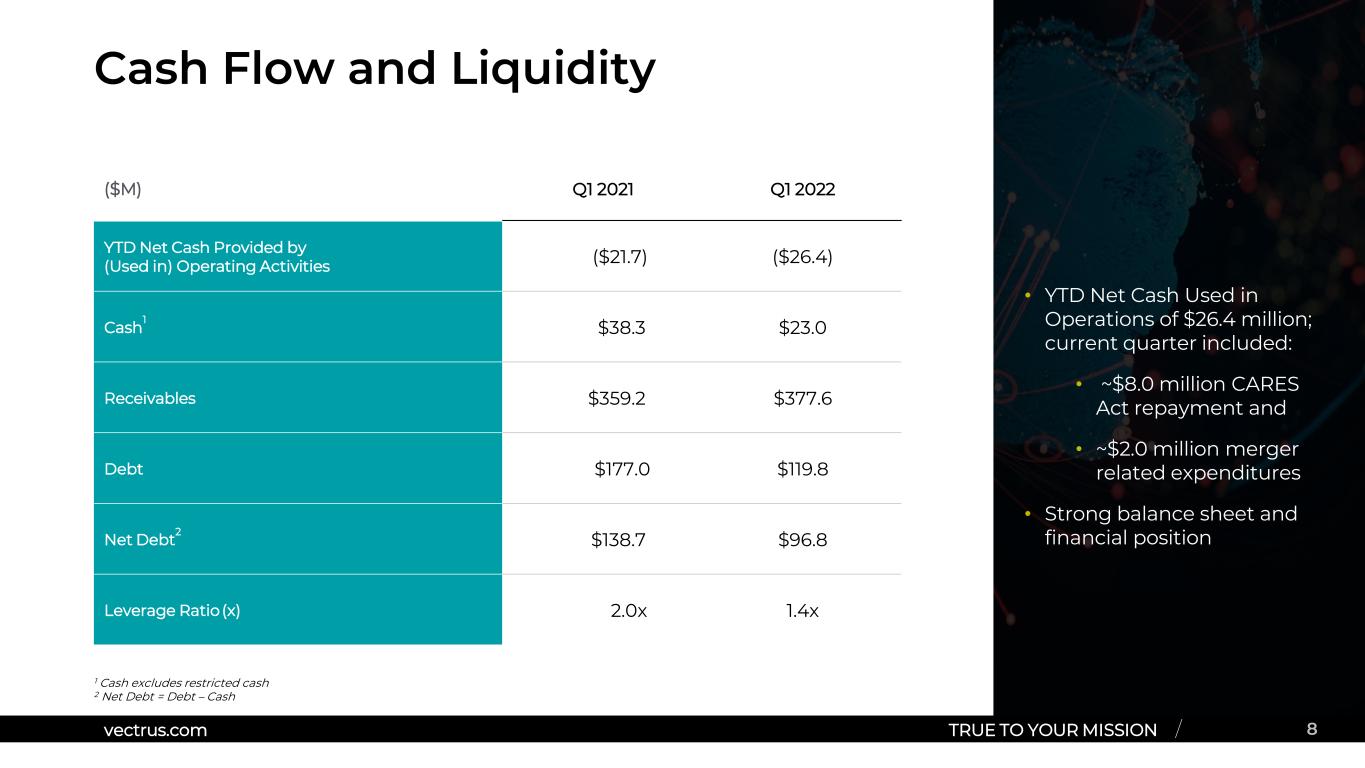
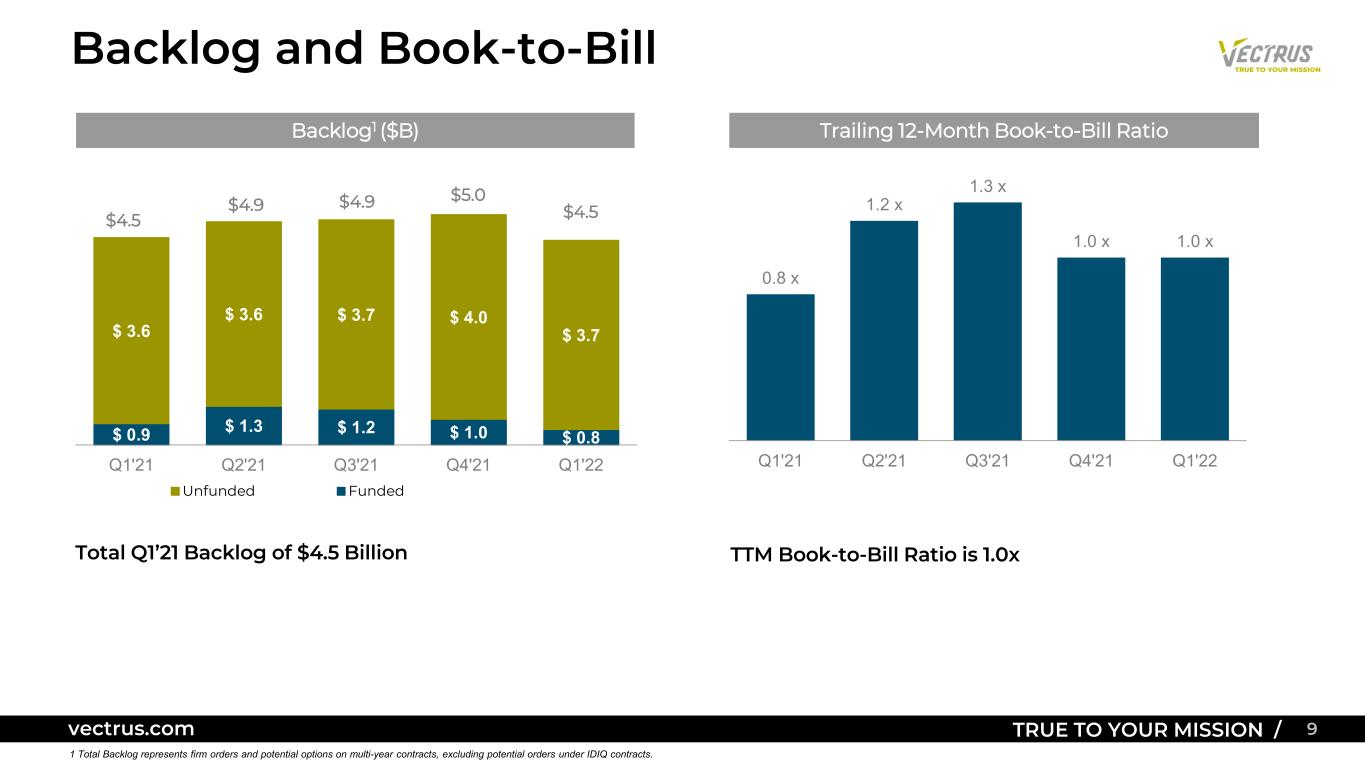
Exhibit 99.1 3 in Iraq and Kuwait late last year, and Kwajalein this year. In addition, revenue benefitted from transitioning Ft Benning and volume associated with rapid response and contingency efforts,” said Susan Lynch, Senior Vice President and Chief Financial Officer. “This revenue growth was impressive given the headwinds associated with the withdrawal of the US military from Afghanistan,” added Lynch. Operating income was $5.2 million or 1.1% margin. This includes M&A and integration related expenses of $9.1 million and amortization of acquired intangible assets of $2.3 million which were incurred in the quarter. Adjusted operating income1 was $16.6 million or 3.6% margin. Adjusted EBITDA1 was $18.2 million or 4.0% margin as compared to $20.7 million or 4.8% in the prior year. “The year-on-year margin change was influenced by the significant amount of revenue and contracts that are in the early stages of their lifecycle. We believe margin on these contracts will improve over time as we apply our process improvement and Enterprise Vectrus initiatives. In addition, as we continue to support our LOGCAP V clients’ supply chain needs, we are experiencing an increase in material and pass- through content which carries a lower margin. In aggregate, on average and over time we expect to see improvement in the margin profile as we drive operational efficiencies and diversify into higher margin scopes of work,” said Lynch. Fully diluted EPS for the first quarter of 2022 was $0.24 as compared to $1.02 in the prior year. Fully diluted EPS in the quarter included the aforementioned M&A and integration related costs. Adjusted diluted EPS1 was $1.01 in the quarter as compared to $1.20 in the prior year. The change in adjusted diluted EPS1 was primarily due to the above-mentioned change in Adjusted EBITDA1. Cash used in operating activities through April 1, 2022, was $26.4 million, compared to net cash used in operating activities of $21.7 million through the first quarter of 2021. Cash used in operating activities was negatively impacted in the current quarter by an approximately $8.0 million repayment of CARES Act tax deferrals and $2 million of merger related payments. Net debt on April 1, 2022, was $96.8 million, down $41.9 million from April 2, 2021. Total debt on April 1, 2022, was $119.8 million, down $57.2 million from $177.0 million on April 2, 2021. Cash at quarter-end was $23.0 million. Total consolidated indebtedness to consolidated EBITDA1 (total leverage ratio) was 1.4x compared to 2.0x at the same time last year. Total backlog as of April 1, 2022, was $4.5 billion representing almost 2.5x the company’s estimated 2022 revenue mid-point. Funded backlog was $0.8 billion. The trailing twelve-month book-to-bill was 1.0x as of April 1, 2022.
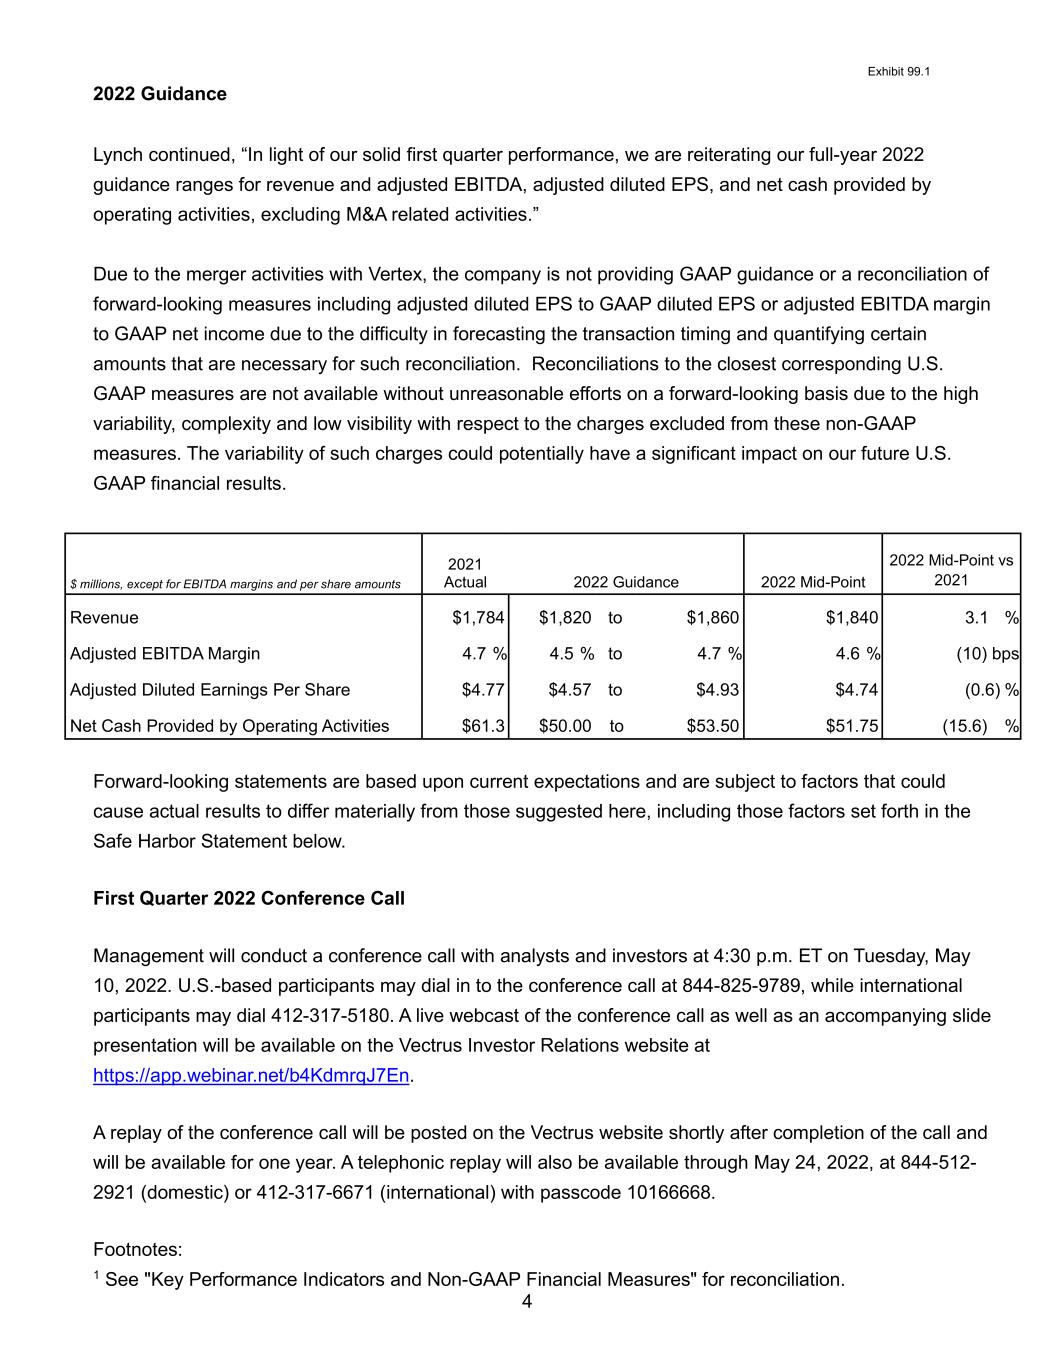

 
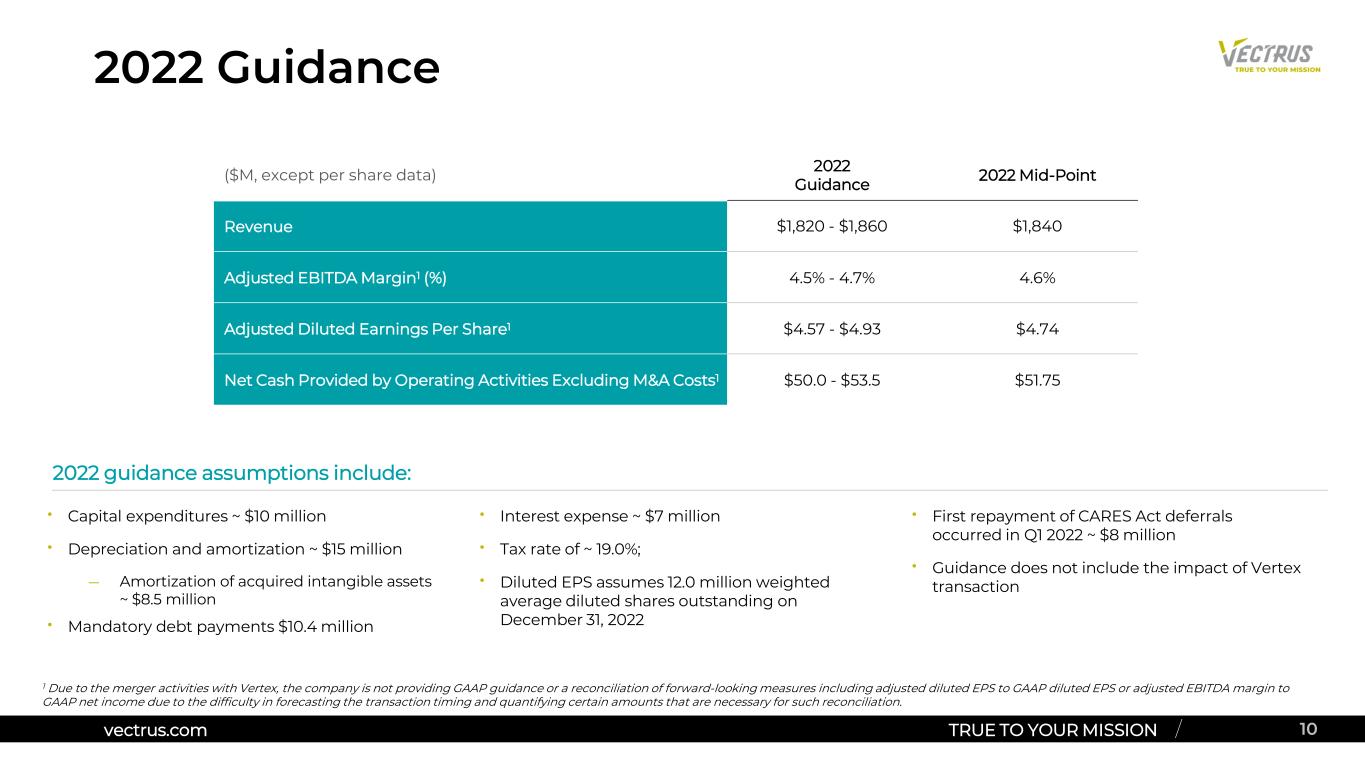
Exhibit 99.1 4 2022 Guidance Lynch continued, “In light of our solid first quarter performance, we are reiterating our full-year 2022 guidance ranges for revenue and adjusted EBITDA, adjusted diluted EPS, and net cash provided by operating activities, excluding M&A related activities.” Due to the merger activities with Vertex, the company is not providing GAAP guidance or a reconciliation of forward-looking measures including adjusted diluted EPS to GAAP diluted EPS or adjusted EBITDA margin to GAAP net income due to the difficulty in forecasting the transaction timing and quantifying certain amounts that are necessary for such reconciliation. Reconciliations to the closest corresponding U.S. GAAP measures are not available without unreasonable efforts on a forward-looking basis due to the high variability, complexity and low visibility with respect to the charges excluded from these non-GAAP measures. The variability of such charges could potentially have a significant impact on our future U.S. GAAP financial results. $ millions, except for EBITDA margins and per share amounts 2021 Actual 2022 Guidance 2022 Mid-Point 2022 Mid-Point vs 2021 Revenue $1,784 $1,820 to $1,860 $1,840 3.1 % Adjusted EBITDA Margin 4.7 % 4.5 % to 4.7 % 4.6 % (10) bps Adjusted Diluted Earnings Per Share $4.77 $4.57 to $4.93 $4.74 (0.6) % Net Cash Provided by Operating Activities $61.3 $50.00 to $53.50 $51.75 (15.6) % Forward-looking statements are based upon current expectations and are subject to factors that could cause actual results to differ materially from those suggested here, including those factors set forth in the Safe Harbor Statement below. First Quarter 2022 Conference Call Management will conduct a conference call with analysts and investors at 4:30 p.m. ET on Tuesday, May 10, 2022. U.S.-based participants may dial in to the conference call at 844-825-9789, while international participants may dial 412-317-5180. A live webcast of the conference call as well as an accompanying slide presentation will be available on the Vectrus Investor Relations website at https://app.webinar.net/b4KdmrqJ7En. A replay of the conference call will be posted on the Vectrus website shortly after completion of the call and will be available for one year. A telephonic replay will also be available through May 24, 2022, at 844-512- 2921 (domestic) or 412-317-6671 (international) with passcode 10166668. Footnotes: 1 See "Key Performance Indicators and Non-GAAP Financial Measures" for reconciliation.
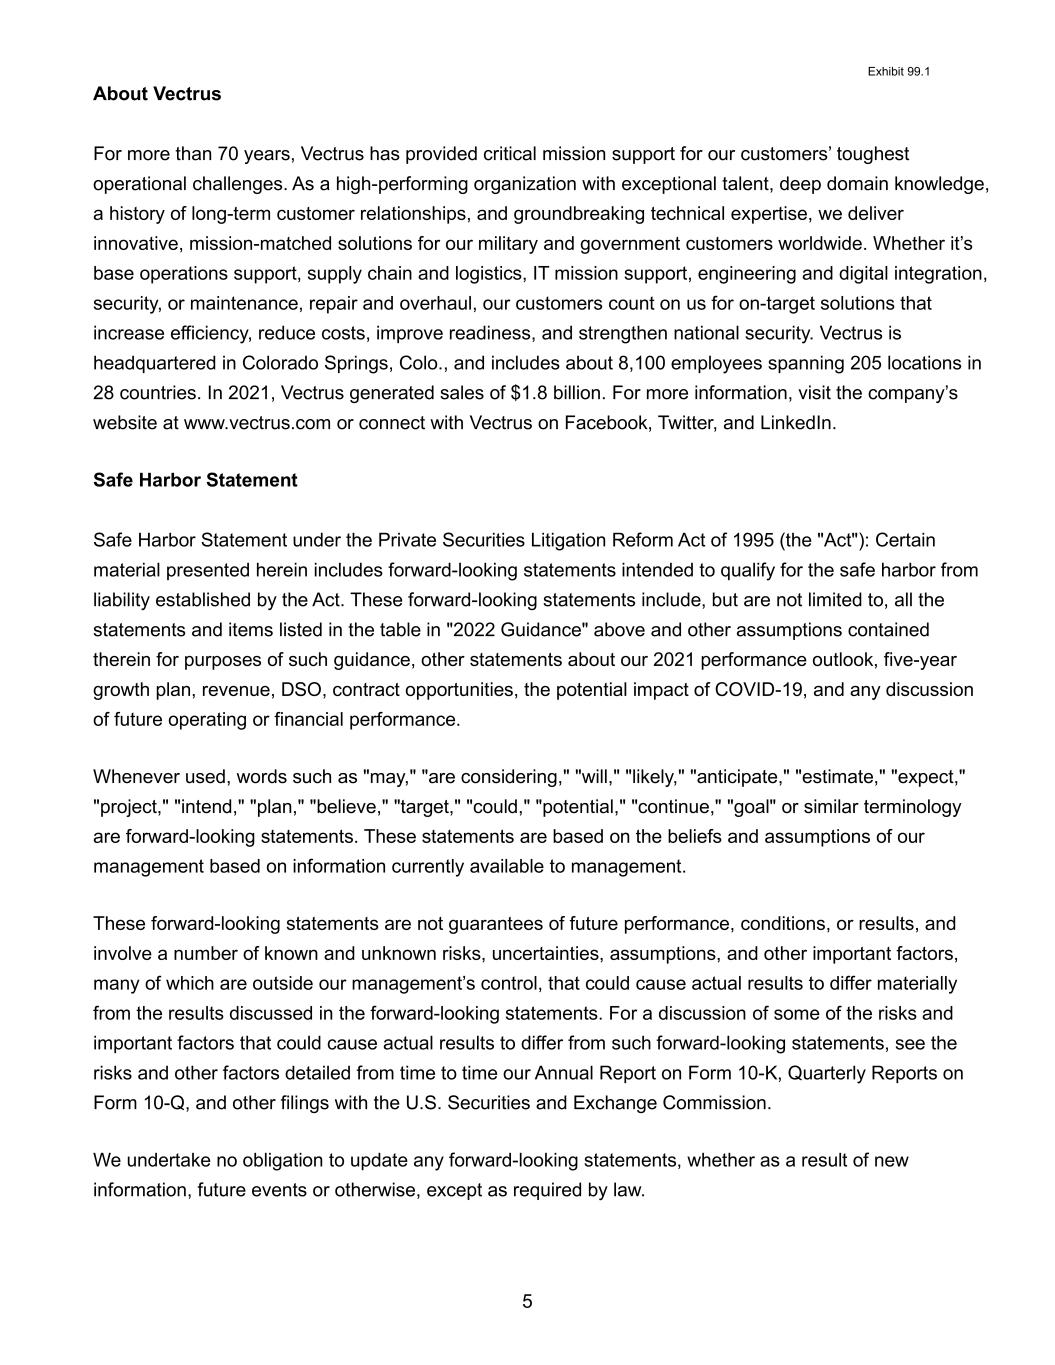

 
Exhibit 99.1 5 About Vectrus For more than 70 years, Vectrus has provided critical mission support for our customers’ toughest operational challenges. As a high-performing organization with exceptional talent, deep domain knowledge, a history of long-term customer relationships, and groundbreaking technical expertise, we deliver innovative, mission-matched solutions for our military and government customers worldwide. Whether it’s base operations support, supply chain and logistics, IT mission support, engineering and digital integration, security, or maintenance, repair and overhaul, our customers count on us for on-target solutions that increase efficiency, reduce costs, improve readiness, and strengthen national security. Vectrus is headquartered in Colorado Springs, Colo., and includes about 8,100 employees spanning 205 locations in 28 countries. In 2021, Vectrus generated sales of $1.8 billion. For more information, visit the company’s website at www.vectrus.com or connect with Vectrus on Facebook, Twitter, and LinkedIn. Safe Harbor Statement Safe Harbor Statement under the Private Securities Litigation Reform Act of 1995 (the "Act"): Certain material presented herein includes forward-looking statements intended to qualify for the safe harbor from liability established by the Act. These forward-looking statements include, but are not limited to, all the statements and items listed in the table in "2022 Guidance" above and other assumptions contained therein for purposes of such guidance, other statements about our 2021 performance outlook, five-year growth plan, revenue, DSO, contract opportunities, the potential impact of COVID-19, and any discussion of future operating or financial performance. Whenever used, words such as "may," "are considering," "will," "likely," "anticipate," "estimate," "expect," "project," "intend," "plan," "believe," "target," "could," "potential," "continue," "goal" or similar terminology are forward-looking statements. These statements are based on the beliefs and assumptions of our management based on information currently available to management. These forward-looking statements are not guarantees of future performance, conditions, or results, and involve a number of known and unknown risks, uncertainties, assumptions, and other important factors, many of which are outside our management’s control, that could cause actual results to differ materially from the results discussed in the forward-looking statements. For a discussion of some of the risks and important factors that could cause actual results to differ from such forward-looking statements, see the risks and other factors detailed from time to time our Annual Report on Form 10-K, Quarterly Reports on Form 10-Q, and other filings with the U.S. Securities and Exchange Commission. We undertake no obligation to update any forward-looking statements, whether as a result of new information, future events or otherwise, except as required by law.
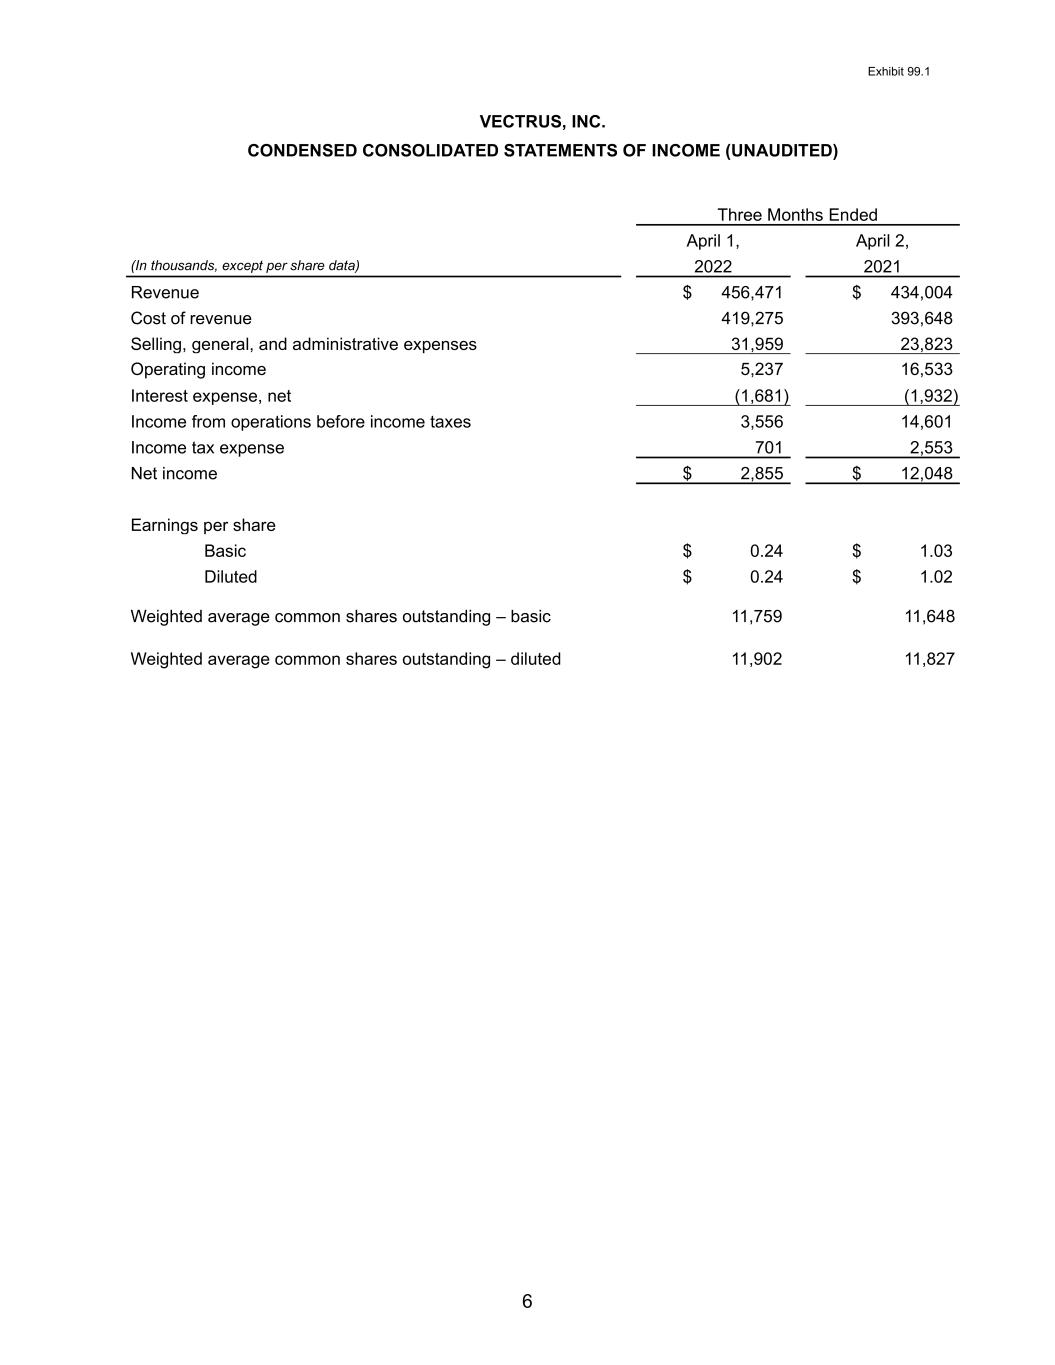

 
Exhibit 99.1 6 VECTRUS, INC. CONDENSED CONSOLIDATED STATEMENTS OF INCOME (UNAUDITED) Three Months Ended April 1, April 2, (In thousands, except per share data) 2022 2021 Revenue $ 456,471 $ 434,004 Cost of revenue 419,275 393,648 Selling, general, and administrative expenses 31,959 23,823 Operating income 5,237 16,533 Interest expense, net (1,681) (1,932) Income from operations before income taxes 3,556 14,601 Income tax expense 701 2,553 Net income $ 2,855 $ 12,048 Earnings per share Basic $ 0.24 $ 1.03 Diluted $ 0.24 $ 1.02 Weighted average common shares outstanding – basic 11,759 11,648 Weighted average common shares outstanding – diluted 11,902 11,827
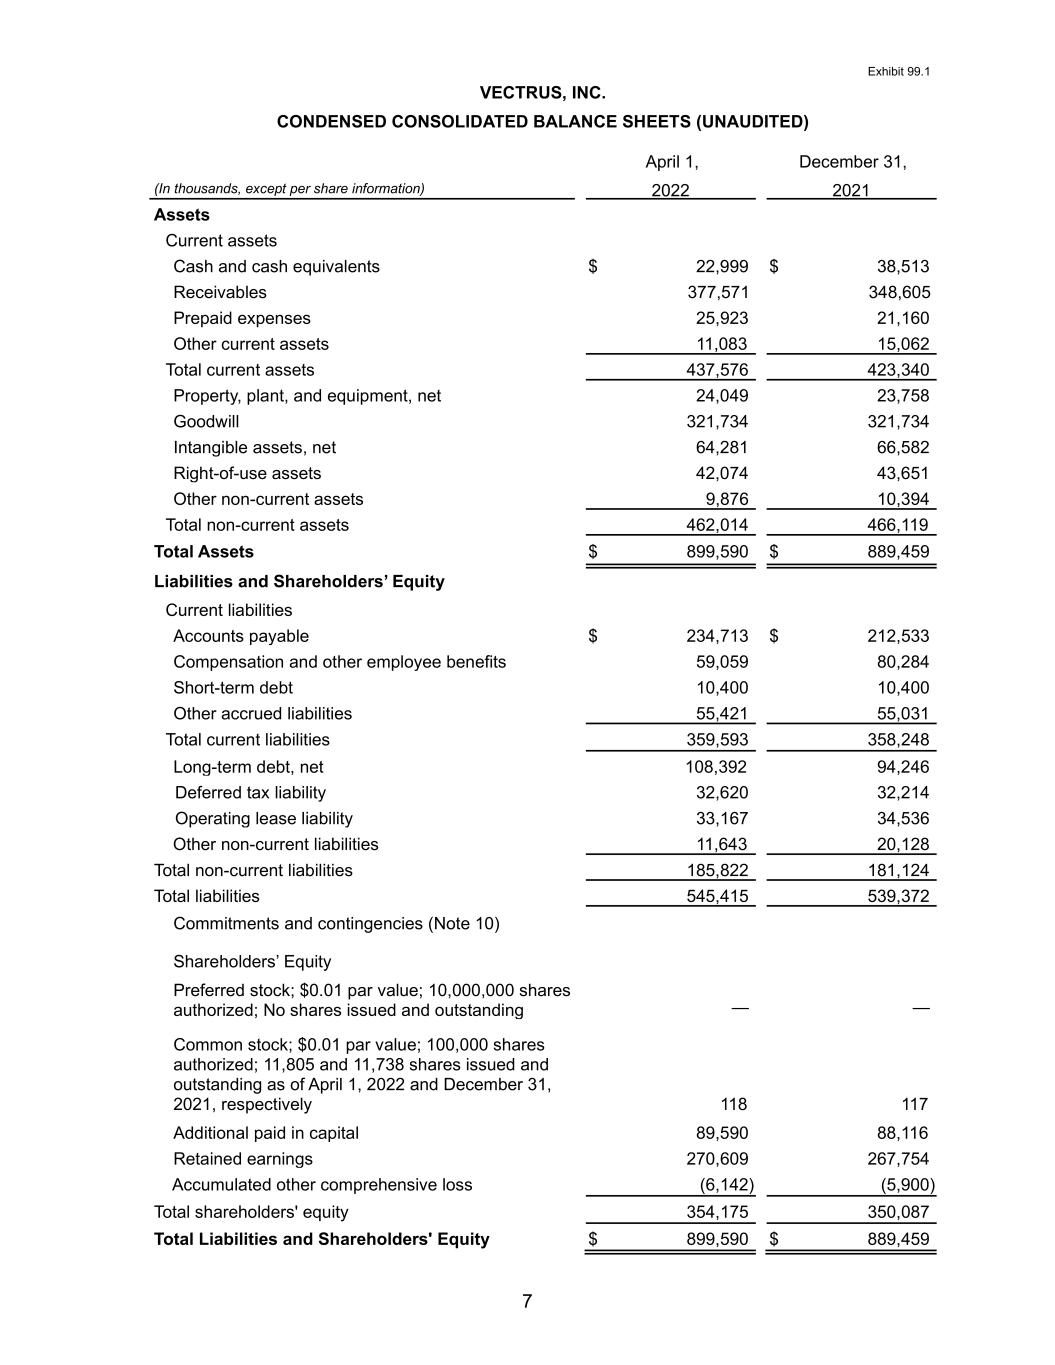

 
Exhibit 99.1 7 VECTRUS, INC. CONDENSED CONSOLIDATED BALANCE SHEETS (UNAUDITED) April 1, December 31, (In thousands, except per share information) 2022 2021 Assets Current assets Cash and cash equivalents $ 22,999 $ 38,513 Receivables 377,571 348,605 Prepaid expenses 25,923 21,160 Other current assets 11,083 15,062 Total current assets 437,576 423,340 Property, plant, and equipment, net 24,049 23,758 Goodwill 321,734 321,734 Intangible assets, net 64,281 66,582 Right-of-use assets 42,074 43,651 Other non-current assets 9,876 10,394 Total non-current assets 462,014 466,119 Total Assets $ 899,590 $ 889,459 Liabilities and Shareholders’ Equity Current liabilities Accounts payable $ 234,713 $ 212,533 Compensation and other employee benefits 59,059 80,284 Short-term debt 10,400 10,400 Other accrued liabilities 55,421 55,031 Total current liabilities 359,593 358,248 Long-term debt, net 108,392 94,246 Deferred tax liability 32,620 32,214 Operating lease liability 33,167 34,536 Other non-current liabilities 11,643 20,128 Total non-current liabilities 185,822 181,124 Total liabilities 545,415 539,372 Commitments and contingencies (Note 10) Shareholders’ Equity Preferred stock; $0.01 par value; 10,000,000 shares authorized; No shares issued and outstanding — — Common stock; $0.01 par value; 100,000 shares authorized; 11,805 and 11,738 shares issued and outstanding as of April 1, 2022 and December 31, 2021, respectively 118 117 Additional paid in capital 89,590 88,116 Retained earnings 270,609 267,754 Accumulated other comprehensive loss (6,142) (5,900) Total shareholders' equity 354,175 350,087 Total Liabilities and Shareholders' Equity $ 899,590 $ 889,459
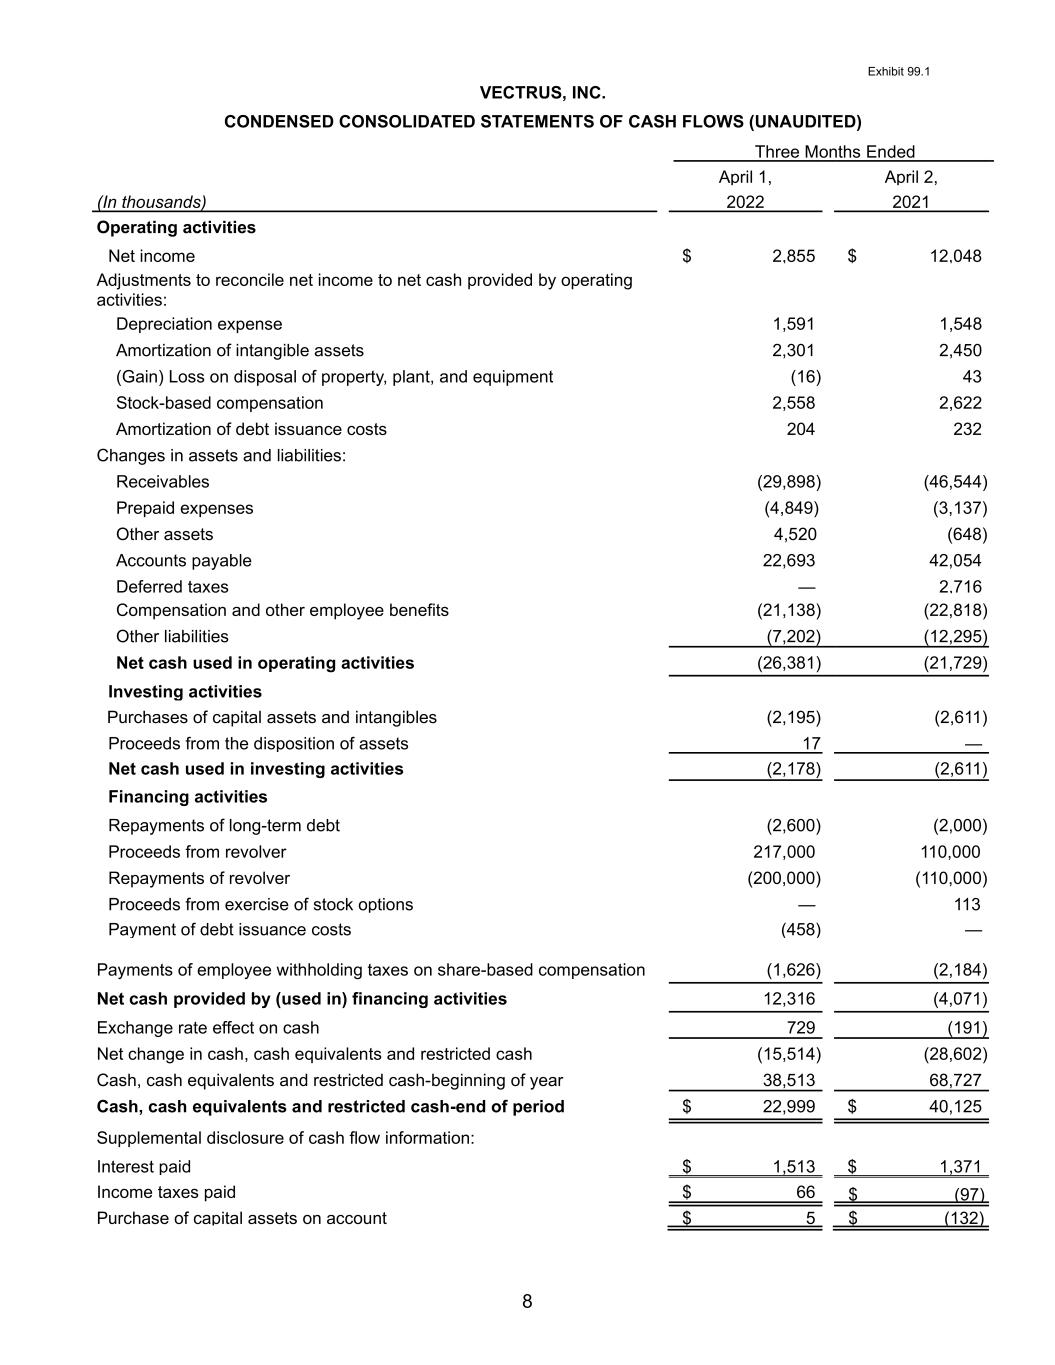

 
Exhibit 99.1 8 VECTRUS, INC. CONDENSED CONSOLIDATED STATEMENTS OF CASH FLOWS (UNAUDITED) Three Months Ended April 1, April 2, (In thousands) 2022 2021 Operating activities Net income $ 2,855 $ 12,048 Adjustments to reconcile net income to net cash provided by operating activities: Depreciation expense 1,591 1,548 Amortization of intangible assets 2,301 2,450 (Gain) Loss on disposal of property, plant, and equipment (16) 43 Stock-based compensation 2,558 2,622 Amortization of debt issuance costs 204 232 Changes in assets and liabilities: Receivables (29,898) (46,544) Prepaid expenses (4,849) (3,137) Other assets 4,520 (648) Accounts payable 22,693 42,054 Deferred taxes — 2,716 Compensation and other employee benefits (21,138) (22,818) Other liabilities (7,202) (12,295) Net cash used in operating activities (26,381) (21,729) Investing activities Purchases of capital assets and intangibles (2,195) (2,611) Proceeds from the disposition of assets 17 — Net cash used in investing activities (2,178) (2,611) Financing activities Repayments of long-term debt (2,600) (2,000) Proceeds from revolver 217,000 110,000 Repayments of revolver (200,000) (110,000) Proceeds from exercise of stock options — 113 Payment of debt issuance costs (458) — Payments of employee withholding taxes on share-based compensation (1,626) (2,184) Net cash provided by (used in) financing activities 12,316 (4,071) Exchange rate effect on cash 729 (191) Net change in cash, cash equivalents and restricted cash (15,514) (28,602) Cash, cash equivalents and restricted cash-beginning of year 38,513 68,727 Cash, cash equivalents and restricted cash-end of period $ 22,999 $ 40,125 Supplemental disclosure of cash flow information: Interest paid $ 1,513 $ 1,371 Income taxes paid $ 66 $ (97) Purchase of capital assets on account $ 5 $ (132)
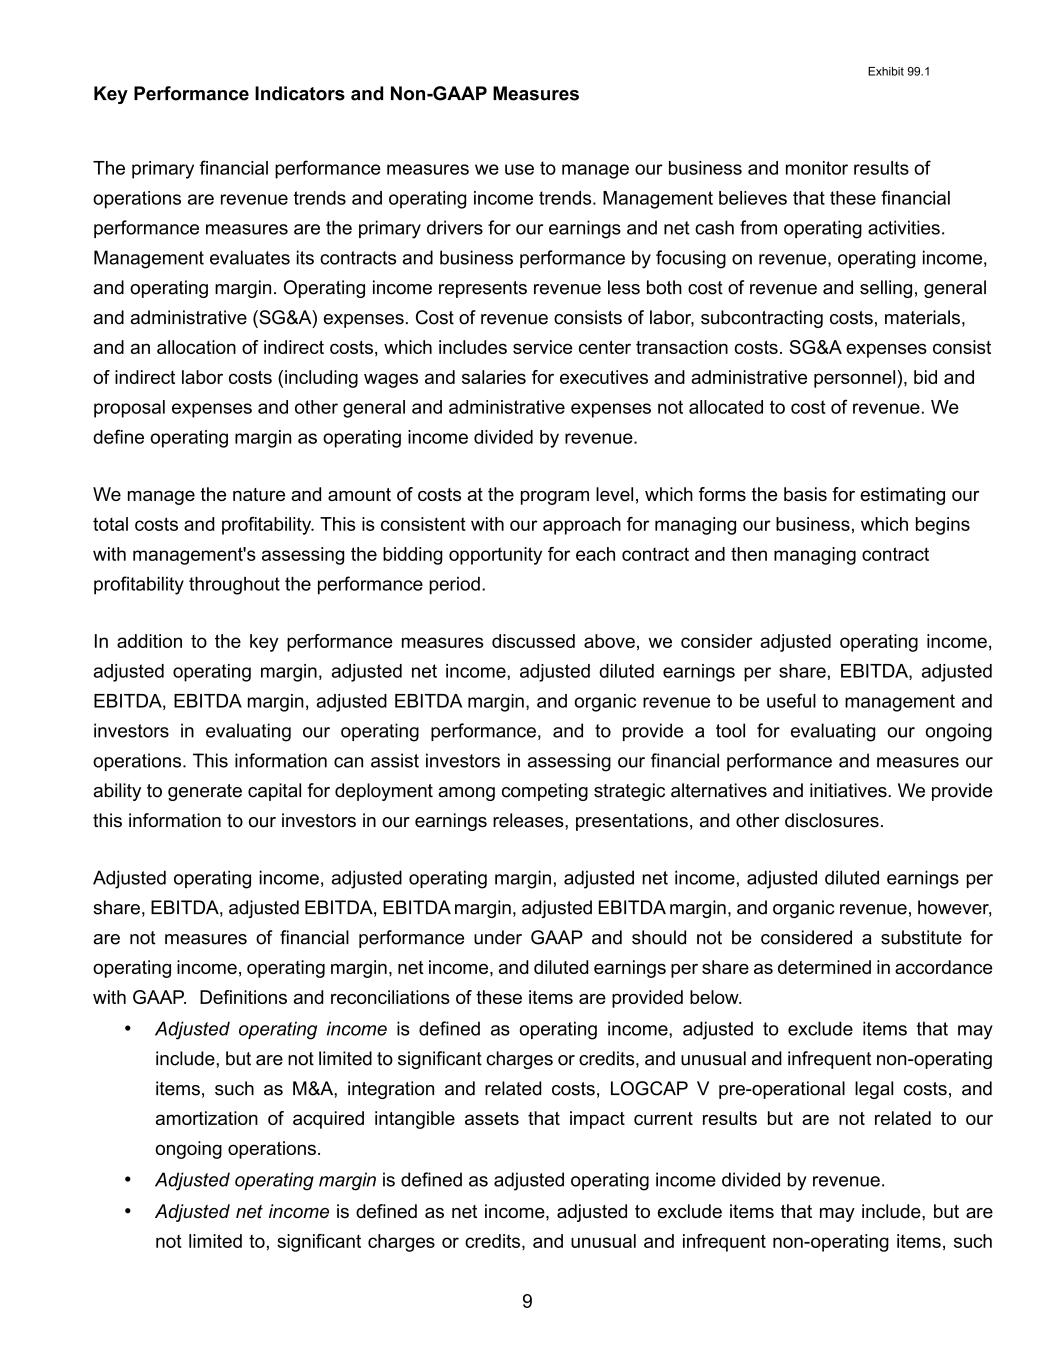

 
Exhibit 99.1 9 Key Performance Indicators and Non-GAAP Measures The primary financial performance measures we use to manage our business and monitor results of operations are revenue trends and operating income trends. Management believes that these financial performance measures are the primary drivers for our earnings and net cash from operating activities. Management evaluates its contracts and business performance by focusing on revenue, operating income, and operating margin. Operating income represents revenue less both cost of revenue and selling, general and administrative (SG&A) expenses. Cost of revenue consists of labor, subcontracting costs, materials, and an allocation of indirect costs, which includes service center transaction costs. SG&A expenses consist of indirect labor costs (including wages and salaries for executives and administrative personnel), bid and proposal expenses and other general and administrative expenses not allocated to cost of revenue. We define operating margin as operating income divided by revenue. We manage the nature and amount of costs at the program level, which forms the basis for estimating our total costs and profitability. This is consistent with our approach for managing our business, which begins with management's assessing the bidding opportunity for each contract and then managing contract profitability throughout the performance period. In addition to the key performance measures discussed above, we consider adjusted operating income, adjusted operating margin, adjusted net income, adjusted diluted earnings per share, EBITDA, adjusted EBITDA, EBITDA margin, adjusted EBITDA margin, and organic revenue to be useful to management and investors in evaluating our operating performance, and to provide a tool for evaluating our ongoing operations. This information can assist investors in assessing our financial performance and measures our ability to generate capital for deployment among competing strategic alternatives and initiatives. We provide this information to our investors in our earnings releases, presentations, and other disclosures. Adjusted operating income, adjusted operating margin, adjusted net income, adjusted diluted earnings per share, EBITDA, adjusted EBITDA, EBITDA margin, adjusted EBITDA margin, and organic revenue, however, are not measures of financial performance under GAAP and should not be considered a substitute for operating income, operating margin, net income, and diluted earnings per share as determined in accordance with GAAP. Definitions and reconciliations of these items are provided below. • Adjusted operating income is defined as operating income, adjusted to exclude items that may include, but are not limited to significant charges or credits, and unusual and infrequent non-operating items, such as M&A, integration and related costs, LOGCAP V pre-operational legal costs, and amortization of acquired intangible assets that impact current results but are not related to our ongoing operations. • Adjusted operating margin is defined as adjusted operating income divided by revenue. • Adjusted net income is defined as net income, adjusted to exclude items that may include, but are not limited to, significant charges or credits, and unusual and infrequent non-operating items, such
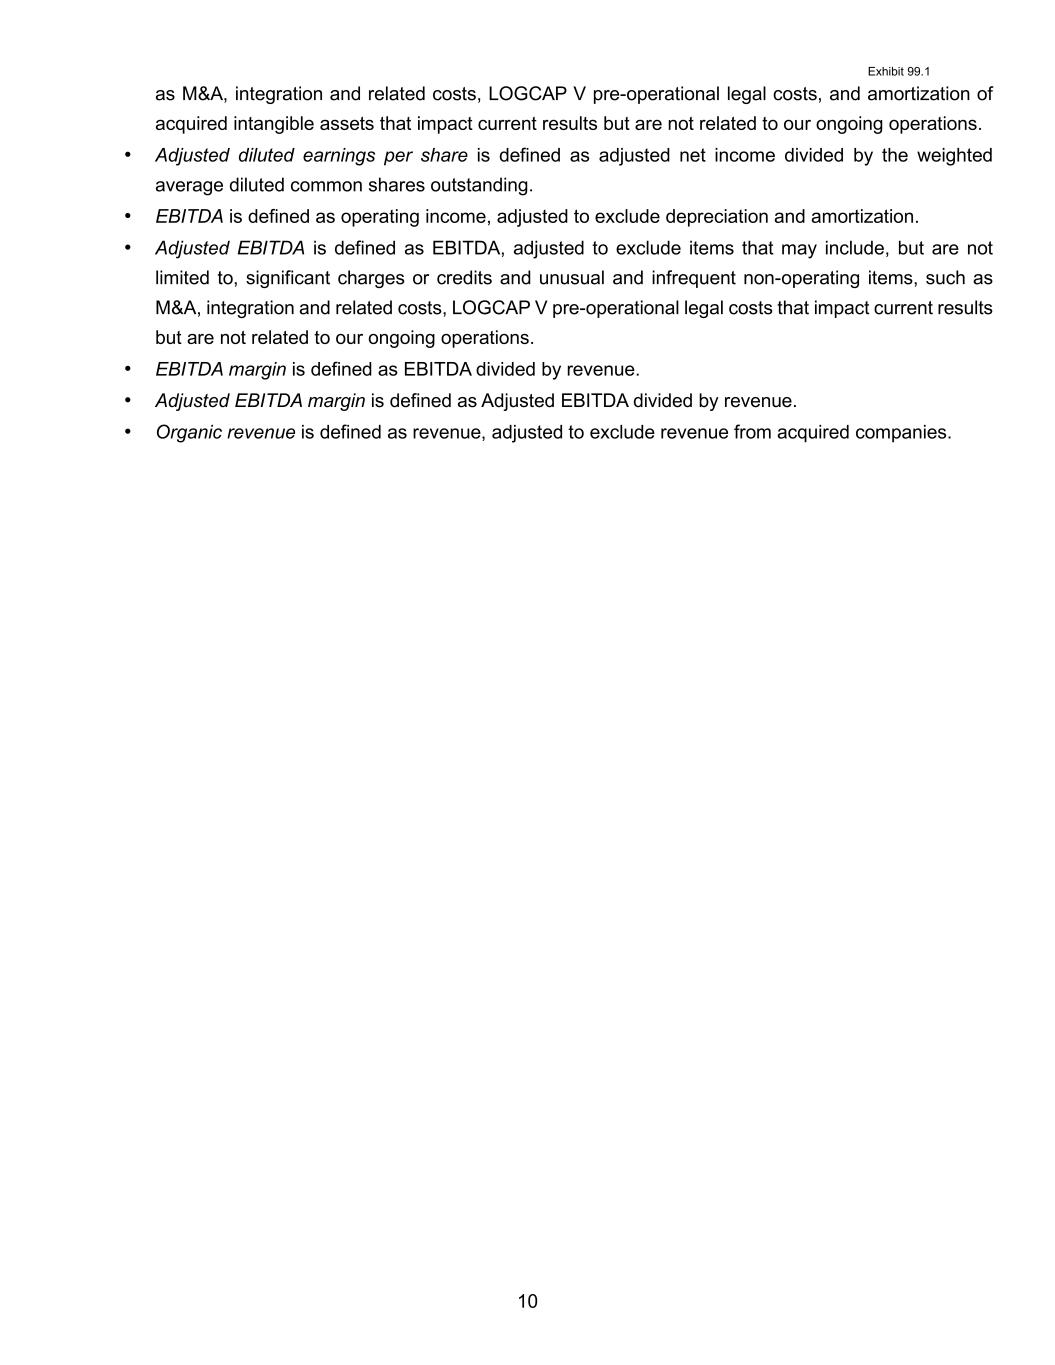

 
Exhibit 99.1 10 as M&A, integration and related costs, LOGCAP V pre-operational legal costs, and amortization of acquired intangible assets that impact current results but are not related to our ongoing operations. • Adjusted diluted earnings per share is defined as adjusted net income divided by the weighted average diluted common shares outstanding. • EBITDA is defined as operating income, adjusted to exclude depreciation and amortization. • Adjusted EBITDA is defined as EBITDA, adjusted to exclude items that may include, but are not limited to, significant charges or credits and unusual and infrequent non-operating items, such as M&A, integration and related costs, LOGCAP V pre-operational legal costs that impact current results but are not related to our ongoing operations. • EBITDA margin is defined as EBITDA divided by revenue. • Adjusted EBITDA margin is defined as Adjusted EBITDA divided by revenue. • Organic revenue is defined as revenue, adjusted to exclude revenue from acquired companies.
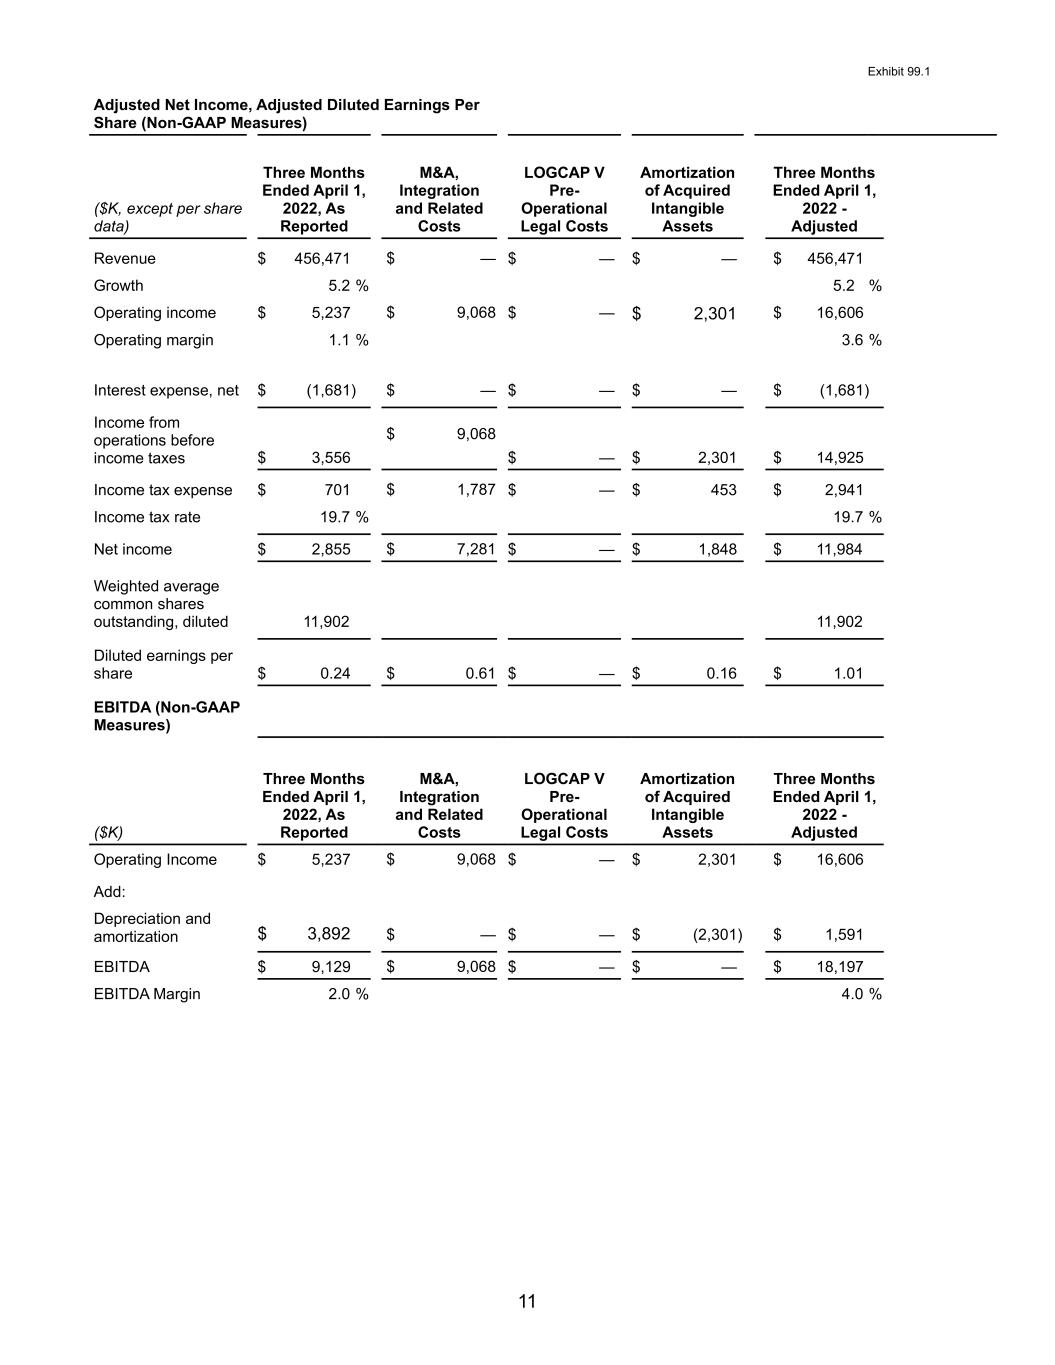

 
Exhibit 99.1 11 Adjusted Net Income, Adjusted Diluted Earnings Per Share (Non-GAAP Measures) ($K, except per share data) Three Months Ended April 1, 2022, As Reported M&A, Integration and Related Costs LOGCAP V Pre- Operational Legal Costs Amortization of Acquired Intangible Assets Three Months Ended April 1, 2022 - Adjusted Revenue $ 456,471 $ — $ — $ — $ 456,471 Growth 5.2 % 5.2 % Operating income $ 5,237 $ 9,068 $ — $ 2,301 $ 16,606 Operating margin 1.1 % 3.6 % Interest expense, net $ (1,681) $ — $ — $ — $ (1,681) Income from operations before income taxes $ 3,556 $ 9,068 $ — $ 2,301 $ 14,925 Income tax expense $ 701 $ 1,787 $ — $ 453 $ 2,941 Income tax rate 19.7 % 19.7 % Net income $ 2,855 $ 7,281 $ — $ 1,848 $ 11,984 Weighted average common shares outstanding, diluted 11,902 11,902 Diluted earnings per share $ 0.24 $ 0.61 $ — $ 0.16 $ 1.01 EBITDA (Non-GAAP Measures) ($K) Three Months Ended April 1, 2022, As Reported M&A, Integration and Related Costs LOGCAP V Pre- Operational Legal Costs Amortization of Acquired Intangible Assets Three Months Ended April 1, 2022 - Adjusted Operating Income $ 5,237 $ 9,068 $ — $ 2,301 $ 16,606 Add: Depreciation and amortization $ 3,892 $ — $ — $ (2,301) $ 1,591 EBITDA $ 9,129 $ 9,068 $ — $ — $ 18,197 EBITDA Margin 2.0 % 4.0 %
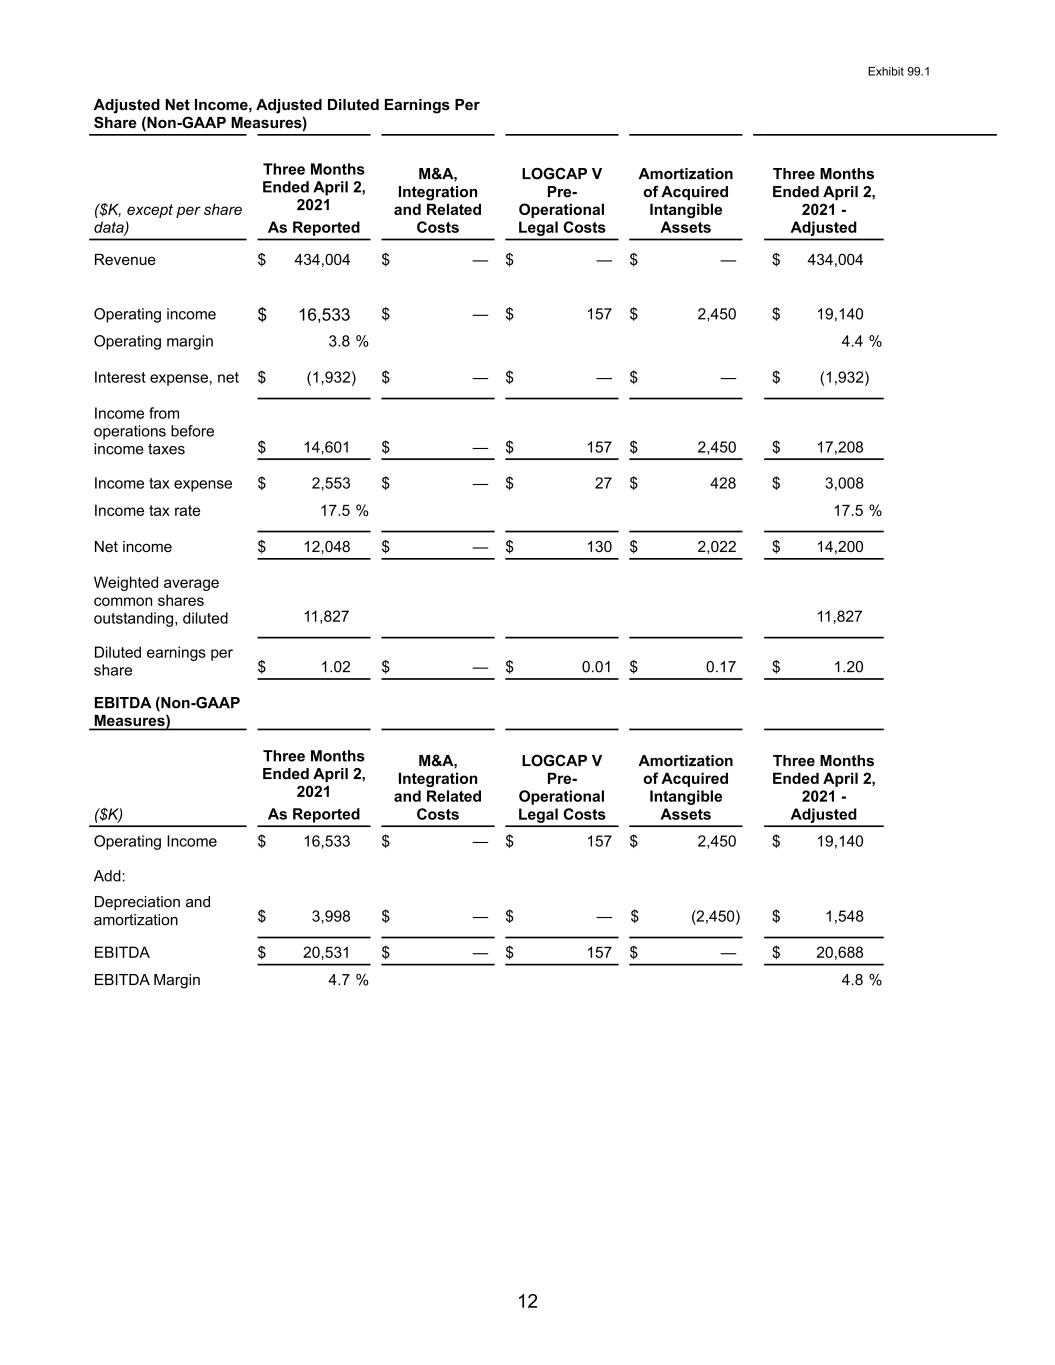

 
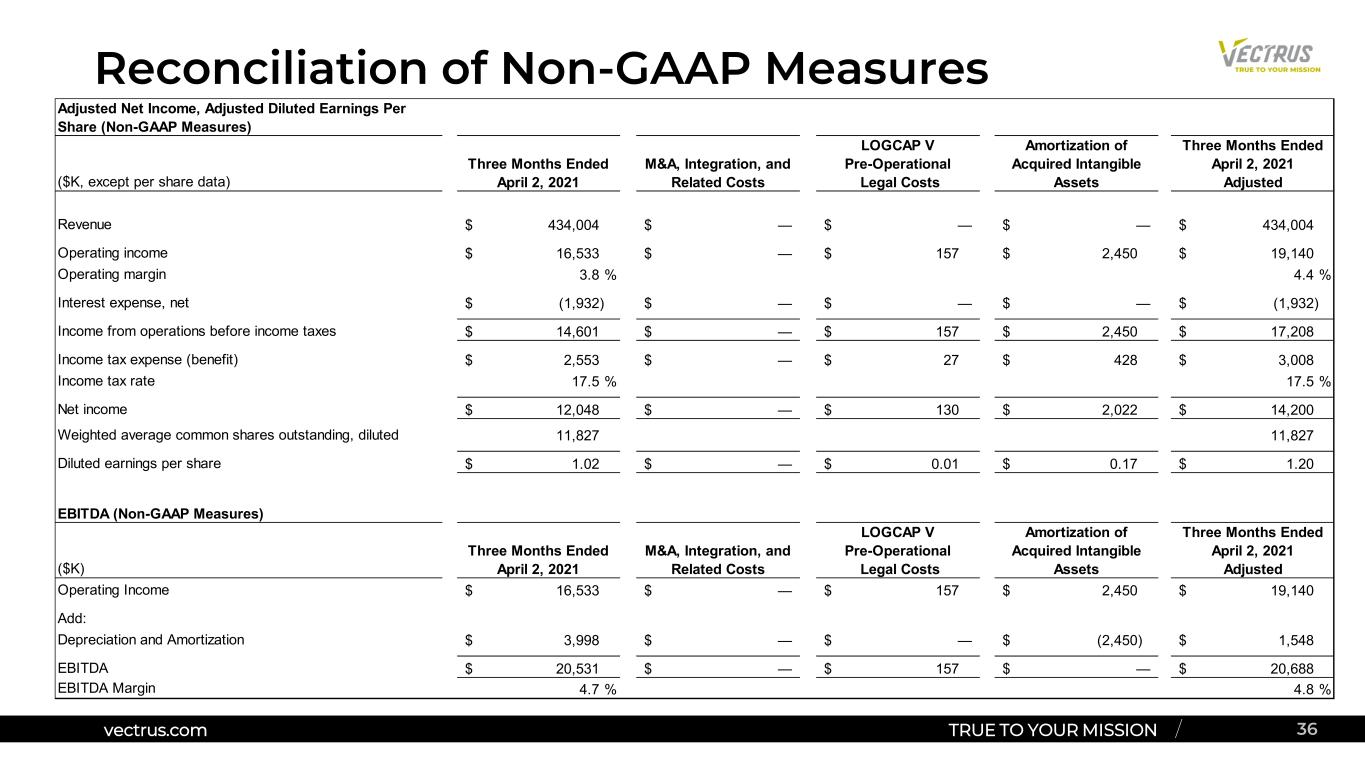
Exhibit 99.1 12 Adjusted Net Income, Adjusted Diluted Earnings Per Share (Non-GAAP Measures) ($K, except per share data) Three Months Ended April 2, 2021 As Reported M&A, Integration and Related Costs LOGCAP V Pre- Operational Legal Costs Amortization of Acquired Intangible Assets Three Months Ended April 2, 2021 - Adjusted Revenue $ 434,004 $ — $ — $ — $ 434,004 Operating income $ 16,533 $ — $ 157 $ 2,450 $ 19,140 Operating margin 3.8 % 4.4 % Interest expense, net $ (1,932) $ — $ — $ — $ (1,932) Income from operations before income taxes $ 14,601 $ — $ 157 $ 2,450 $ 17,208 Income tax expense $ 2,553 $ — $ 27 $ 428 $ 3,008 Income tax rate 17.5 % 17.5 % Net income $ 12,048 $ — $ 130 $ 2,022 $ 14,200 Weighted average common shares outstanding, diluted 11,827 11,827 Diluted earnings per share $ 1.02 $ — $ 0.01 $ 0.17 $ 1.20 EBITDA (Non-GAAP Measures) ($K) Three Months Ended April 2, 2021 As Reported M&A, Integration and Related Costs LOGCAP V Pre- Operational Legal Costs Amortization of Acquired Intangible Assets Three Months Ended April 2, 2021 - Adjusted Operating Income $ 16,533 $ — $ 157 $ 2,450 $ 19,140 Add: Depreciation and amortization $ 3,998 $ — $ — $ (2,450) $ 1,548 EBITDA $ 20,531 $ — $ 157 $ — $ 20,688 EBITDA Margin 4.7 % 4.8 %
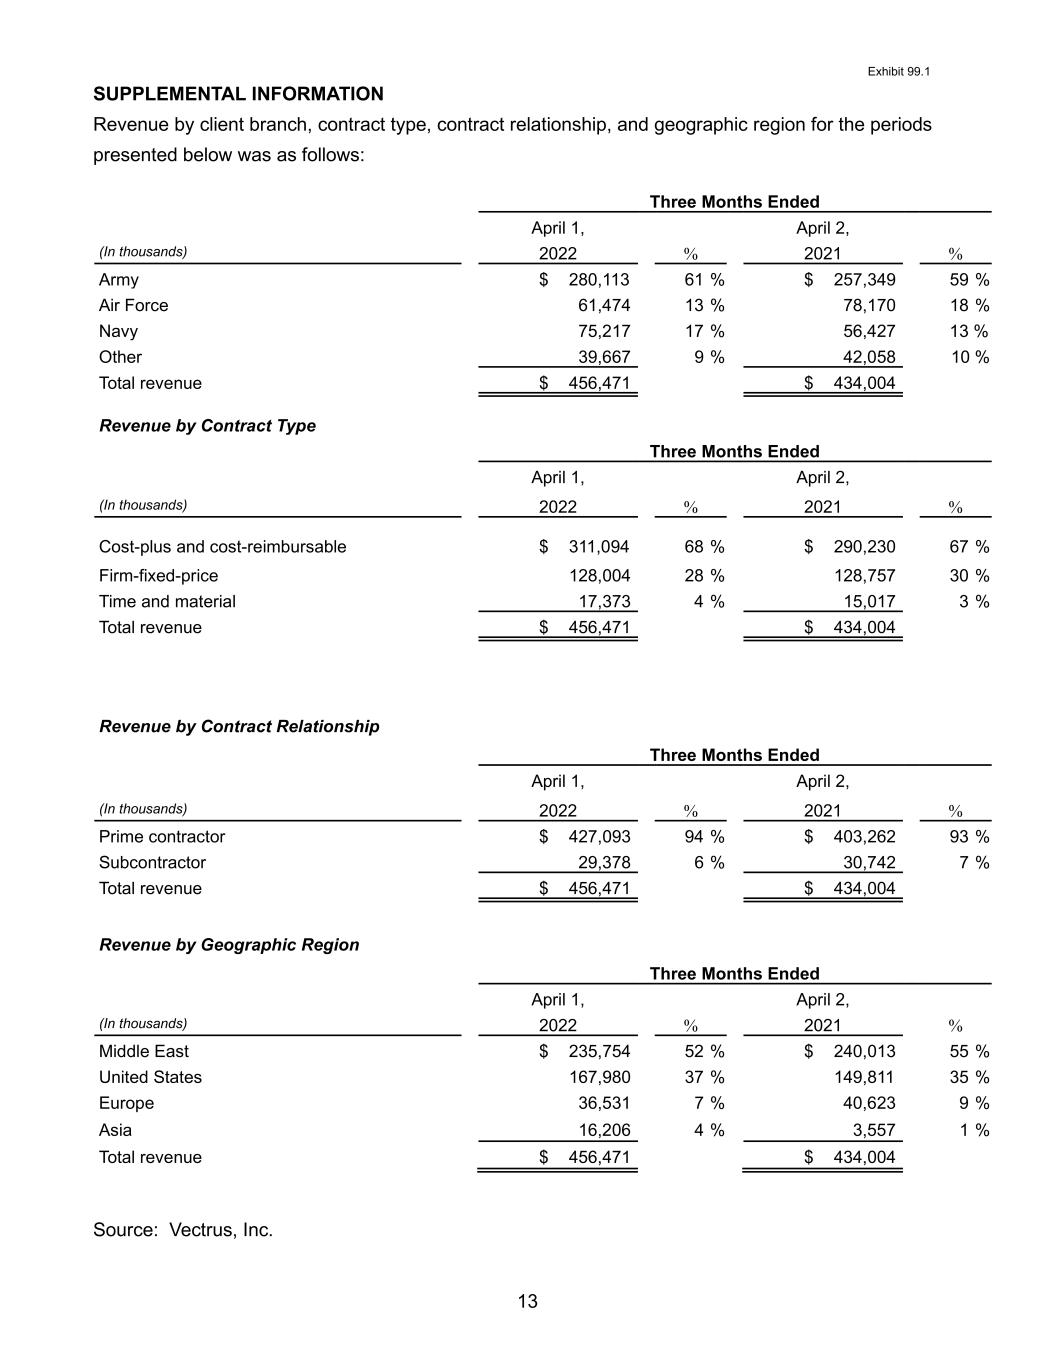

 
Exhibit 99.1 13 SUPPLEMENTAL INFORMATION Revenue by client branch, contract type, contract relationship, and geographic region for the periods presented below was as follows: Three Months Ended April 1, April 2, (In thousands) 2022 % 2021 % Army $ 280,113 61 % $ 257,349 59 % Air Force 61,474 13 % 78,170 18 % Navy 75,217 17 % 56,427 13 % Other 39,667 9 % 42,058 10 % Total revenue $ 456,471 $ 434,004 Revenue by Contract Type Three Months Ended April 1, April 2, (In thousands) 2022 % 2021 % Cost-plus and cost-reimbursable $ 311,094 68 % $ 290,230 67 % Firm-fixed-price 128,004 28 % 128,757 30 % Time and material 17,373 4 % 15,017 3 % Total revenue $ 456,471 $ 434,004 Revenue by Contract Relationship Three Months Ended April 1, April 2, (In thousands) 2022 % 2021 % Prime contractor $ 427,093 94 % $ 403,262 93 % Subcontractor 29,378 6 % 30,742 7 % Total revenue $ 456,471 $ 434,004 Revenue by Geographic Region Three Months Ended April 1, April 2, (In thousands) 2022 % 2021 % Middle East $ 235,754 52 % $ 240,013 55 % United States 167,980 37 % 149,811 35 % Europe 36,531 7 % 40,623 9 % Asia 16,206 4 % 3,557 1 % Total revenue $ 456,471 $ 434,004 Source: Vectrus, Inc.
 
VECTRUS 1st Quarter 2022 Results Chuck Prow – President and Chief Executive Officer Susan Lynch – Senior Vice President and Chief Financial Officer May 10, 2022


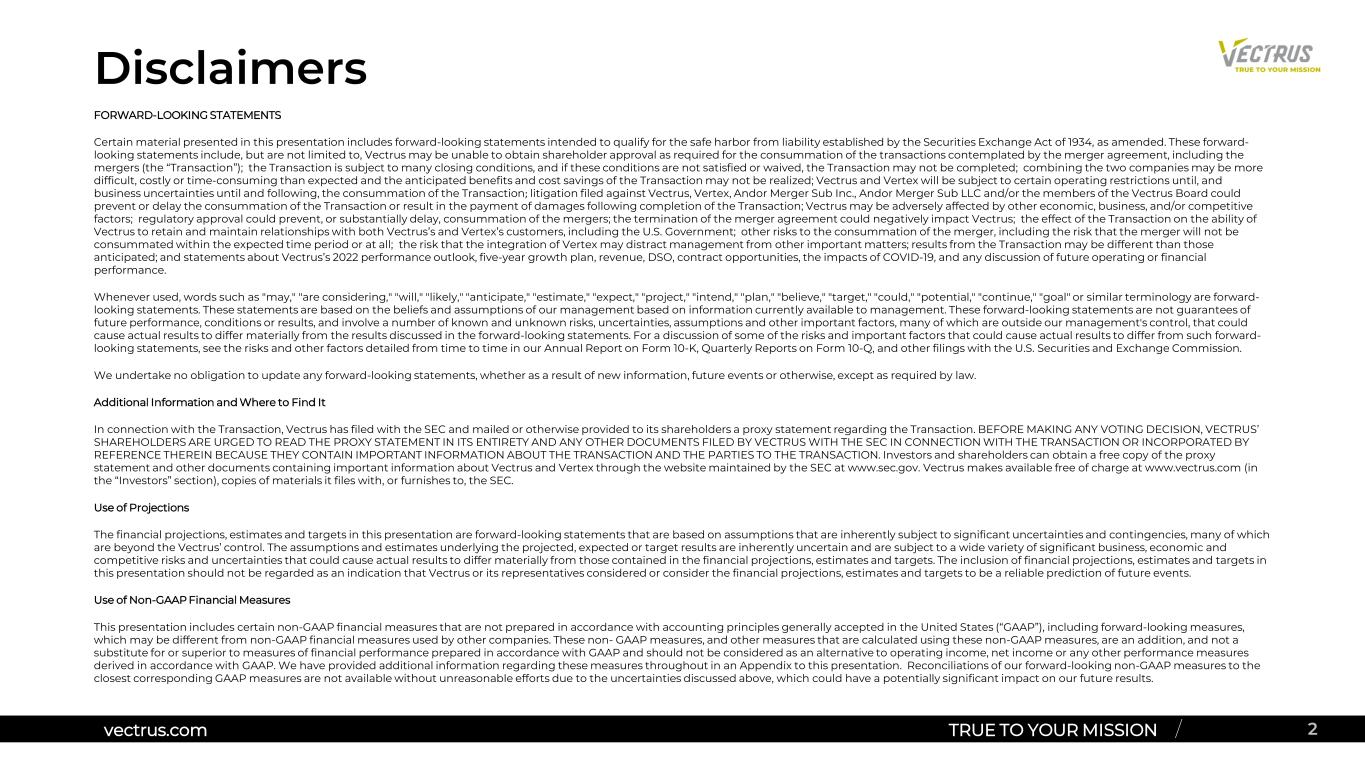
vectrus.com TRUE TO YOUR MISSION / FORWARD-LOOKING STATEMENTS Certain material presented in this presentation includes forward-looking statements intended to qualify for the safe harbor from liability established by the Securities Exchange Act of 1934, as amended. These forward- looking statements include, but are not limited to, Vectrus may be unable to obtain shareholder approval as required for the consummation of the transactions contemplated by the merger agreement, including the mergers (the “Transaction”); the Transaction is subject to many closing conditions, and if these conditions are not satisfied or waived, the Transaction may not be completed; combining the two companies may be more difficult, costly or time-consuming than expected and the anticipated benefits and cost savings of the Transaction may not be realized; Vectrus and Vertex will be subject to certain operating restrictions until, and business uncertainties until and following, the consummation of the Transaction; litigation filed against Vectrus, Vertex, Andor Merger Sub Inc., Andor Merger Sub LLC and/or the members of the Vectrus Board could prevent or delay the consummation of the Transaction or result in the payment of damages following completion of the Transaction; Vectrus may be adversely affected by other economic, business, and/or competitive factors; regulatory approval could prevent, or substantially delay, consummation of the mergers; the termination of the merger agreement could negatively impact Vectrus; the effect of the Transaction on the ability of Vectrus to retain and maintain relationships with both Vectrus’s and Vertex’s customers, including the U.S. Government; other risks to the consummation of the merger, including the risk that the merger will not be consummated within the expected time period or at all; the risk that the integration of Vertex may distract management from other important matters; results from the Transaction may be different than those anticipated; and statements about Vectrus’s 2022 performance outlook, five-year growth plan, revenue, DSO, contract opportunities, the impacts of COVID-19, and any discussion of future operating or financial performance. Whenever used, words such as "may," "are considering," "will," "likely," "anticipate," "estimate," "expect," "project," "intend," "plan," "believe," "target," "could," "potential," "continue," "goal" or similar terminology are forward- looking statements. These statements are based on the beliefs and assumptions of our management based on information currently available to management. These forward-looking statements are not guarantees of future performance, conditions or results, and involve a number of known and unknown risks, uncertainties, assumptions and other important factors, many of which are outside our management's control, that could cause actual results to differ materially from the results discussed in the forward-looking statements. For a discussion of some of the risks and important factors that could cause actual results to differ from such forward- looking statements, see the risks and other factors detailed from time to time in our Annual Report on Form 10-K, Quarterly Reports on Form 10-Q, and other filings with the U.S. Securities and Exchange Commission. We undertake no obligation to update any forward-looking statements, whether as a result of new information, future events or otherwise, except as required by law. Additional Information and Where to Find It In connection with the Transaction, Vectrus has filed with the SEC and mailed or otherwise provided to its shareholders a proxy statement regarding the Transaction. BEFORE MAKING ANY VOTING DECISION, VECTRUS’ SHAREHOLDERS ARE URGED TO READ THE PROXY STATEMENT IN ITS ENTIRETY AND ANY OTHER DOCUMENTS FILED BY VECTRUS WITH THE SEC IN CONNECTION WITH THE TRANSACTION OR INCORPORATED BY REFERENCE THEREIN BECAUSE THEY CONTAIN IMPORTANT INFORMATION ABOUT THE TRANSACTION AND THE PARTIES TO THE TRANSACTION. Investors and shareholders can obtain a free copy of the proxy statement and other documents containing important information about Vectrus and Vertex through the website maintained by the SEC at www.sec.gov. Vectrus makes available free of charge at www.vectrus.com (in the “Investors” section), copies of materials it files with, or furnishes to, the SEC. Use of Projections The financial projections, estimates and targets in this presentation are forward-looking statements that are based on assumptions that are inherently subject to significant uncertainties and contingencies, many of which are beyond the Vectrus’ control. The assumptions and estimates underlying the projected, expected or target results are inherently uncertain and are subject to a wide variety of significant business, economic and competitive risks and uncertainties that could cause actual results to differ materially from those contained in the financial projections, estimates and targets. The inclusion of financial projections, estimates and targets in this presentation should not be regarded as an indication that Vectrus or its representatives considered or consider the financial projections, estimates and targets to be a reliable prediction of future events. Use of Non-GAAP Financial Measures This presentation includes certain non-GAAP financial measures that are not prepared in accordance with accounting principles generally accepted in the United States (“GAAP”), including forward-looking measures, which may be different from non-GAAP financial measures used by other companies. These non- GAAP measures, and other measures that are calculated using these non-GAAP measures, are an addition, and not a substitute for or superior to measures of financial performance prepared in accordance with GAAP and should not be considered as an alternative to operating income, net income or any other performance measures derived in accordance with GAAP. We have provided additional information regarding these measures throughout in an Appendix to this presentation. Reconciliations of our forward-looking non-GAAP measures to the closest corresponding GAAP measures are not available without unreasonable efforts due to the uncertainties discussed above, which could have a potentially significant impact on our future results. Disclaimers 2vectrus.com TRUE TO YOUR MISSION /


vectrus.com TRUE TO YOUR MISSION / Call Participants 3 Chuck Prow President and Chief Executive Officer Susan Lynch Senior Vice President and Chief Financial Officer vectrus.com TRUE TO YOUR MISSION /


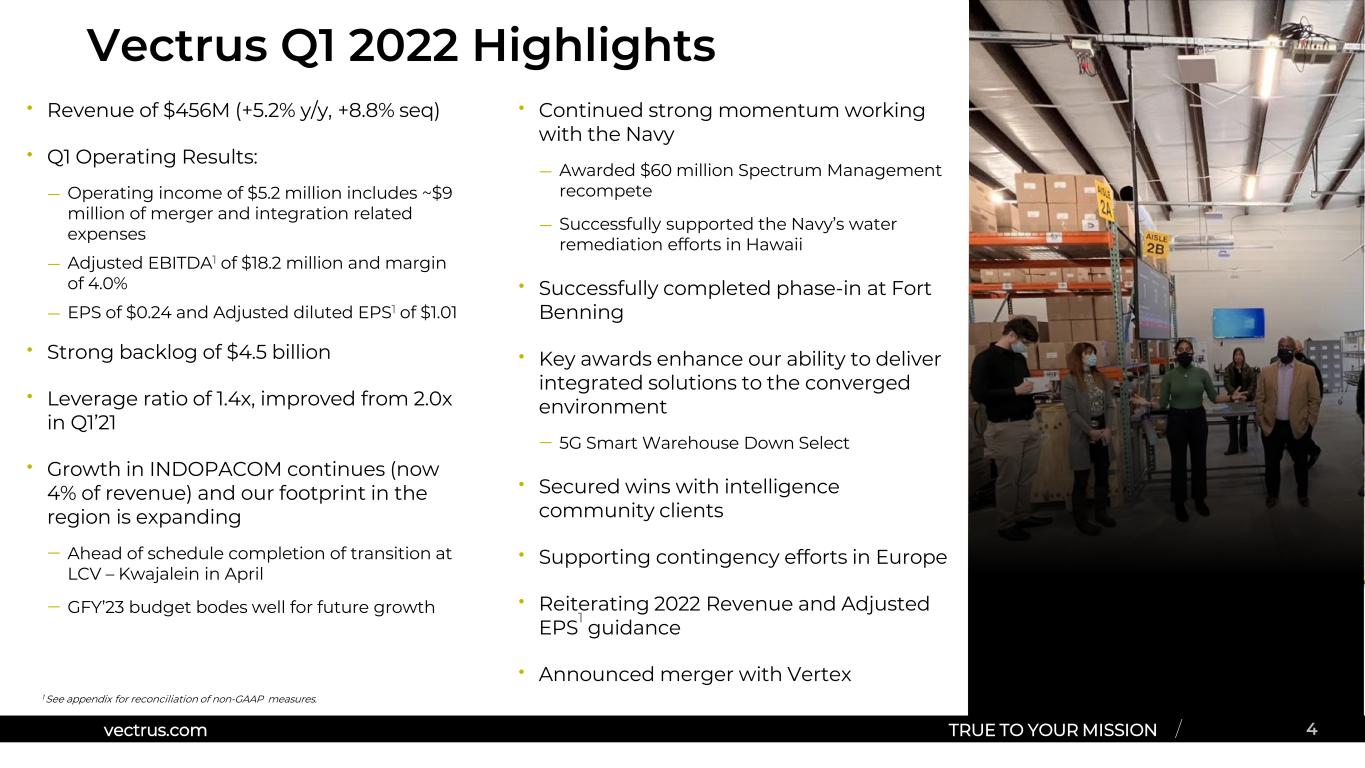
vectrus.com TRUE TO YOUR MISSION / Vectrus Q1 2022 Highlights 4 1 See appendix for reconciliation of non-GAAP measures. vectrus.com TRUE TO YOUR MISSION / • Revenue of $456M (+5.2% y/y, +8.8% seq) • Q1 Operating Results: — Operating income of $5.2 million includes ~$9 million of merger and integration related expenses — Adjusted EBITDA1 of $18.2 million and margin of 4.0% — EPS of $0.24 and Adjusted diluted EPS1 of $1.01 • Strong backlog of $4.5 billion • Leverage ratio of 1.4x, improved from 2.0x in Q1’21 • Growth in INDOPACOM continues (now 4% of revenue) and our footprint in the region is expanding — Ahead of schedule completion of transition at LCV – Kwajalein in April — GFY’23 budget bodes well for future growth • Continued strong momentum working with the Navy — Awarded $60 million Spectrum Management recompete — Successfully supported the Navy’s water remediation efforts in Hawaii • Successfully completed phase-in at Fort Benning • Key awards enhance our ability to deliver integrated solutions to the converged environment — 5G Smart Warehouse Down Select • Secured wins with intelligence community clients • Supporting contingency efforts in Europe • Reiterating 2022 Revenue and Adjusted EPS1 guidance • Announced merger with Vertex


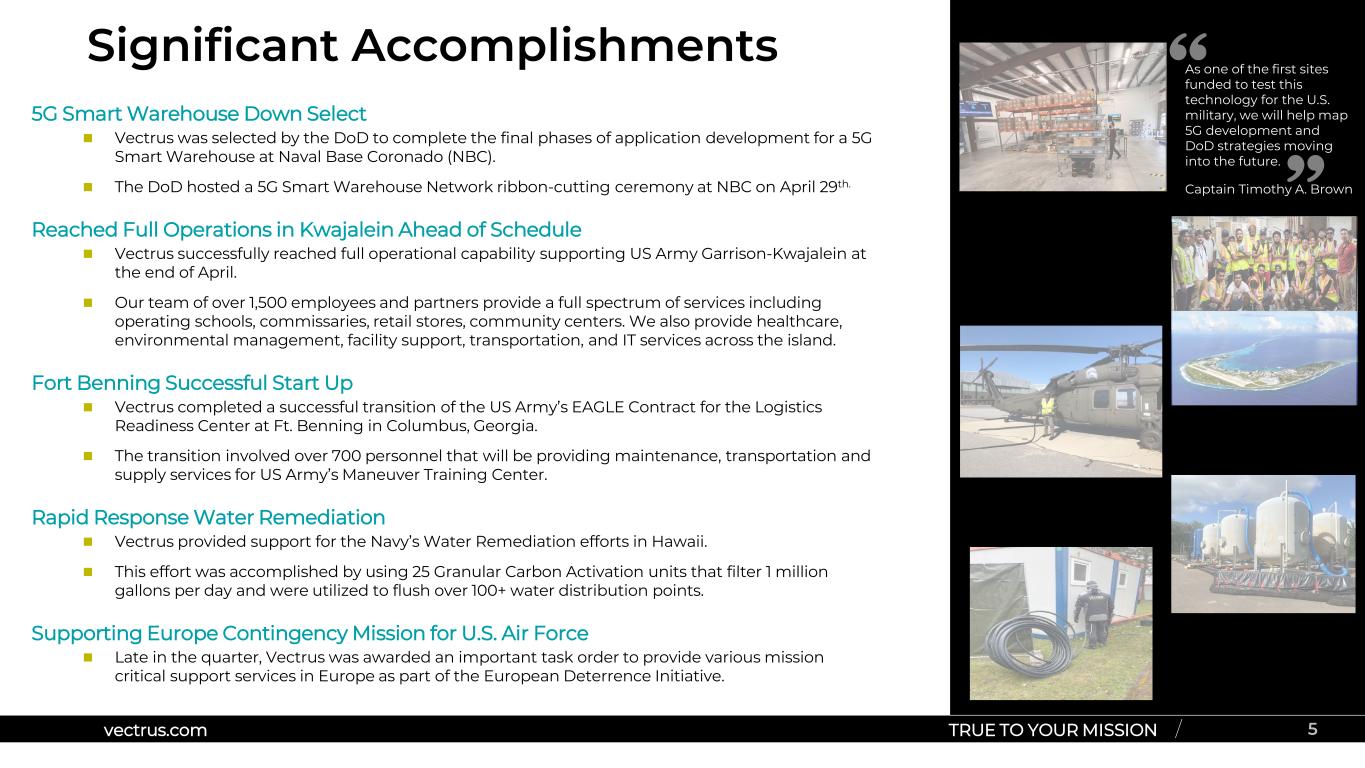
vectrus.com TRUE TO YOUR MISSION / Significant Accomplishments 5vectrus.com TRUE TO YOUR MISSION / 5G Smart Warehouse Down Select  Vectrus was selected by the DoD to complete the final phases of application development for a 5G Smart Warehouse at Naval Base Coronado (NBC).  The DoD hosted a 5G Smart Warehouse Network ribbon-cutting ceremony at NBC on April 29th. Reached Full Operations in Kwajalein Ahead of Schedule  Vectrus successfully reached full operational capability supporting US Army Garrison-Kwajalein at the end of April.  Our team of over 1,500 employees and partners provide a full spectrum of services including operating schools, commissaries, retail stores, community centers. We also provide healthcare, environmental management, facility support, transportation, and IT services across the island. Fort Benning Successful Start Up  Vectrus completed a successful transition of the US Army’s EAGLE Contract for the Logistics Readiness Center at Ft. Benning in Columbus, Georgia.  The transition involved over 700 personnel that will be providing maintenance, transportation and supply services for US Army’s Maneuver Training Center. Rapid Response Water Remediation  Vectrus provided support for the Navy’s Water Remediation efforts in Hawaii.  This effort was accomplished by using 25 Granular Carbon Activation units that filter 1 million gallons per day and were utilized to flush over 100+ water distribution points. Supporting Europe Contingency Mission for U.S. Air Force  Late in the quarter, Vectrus was awarded an important task order to provide various mission critical support services in Europe as part of the European Deterrence Initiative. Captain Timothy A. Brown As one of the first sites funded to test this technology for the U.S. military, we will help map 5G development and DoD strategies moving into the future.


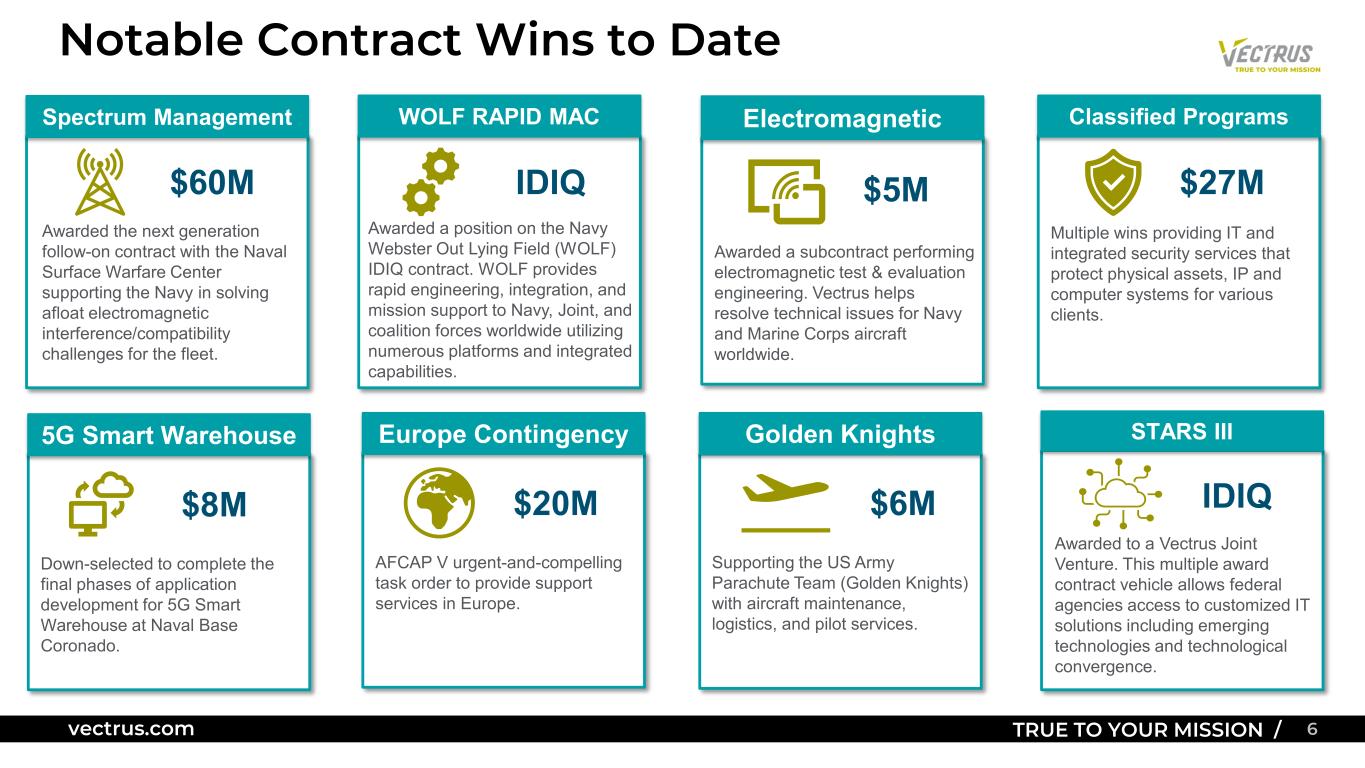
vectrus.com TRUE TO YOUR MISSION / 6 Notable Contract Wins to Date $8M Down-selected to complete the final phases of application development for 5G Smart Warehouse at Naval Base Coronado. 5G Smart Warehouse $5M Awarded a subcontract performing electromagnetic test & evaluation engineering. Vectrus helps resolve technical issues for Navy and Marine Corps aircraft worldwide. Electromagnetic $6M Golden Knights Supporting the US Army Parachute Team (Golden Knights) with aircraft maintenance, logistics, and pilot services. $27M Multiple wins providing IT and integrated security services that protect physical assets, IP and computer systems for various clients. Classified Programs AFCAP V urgent-and-compelling task order to provide support services in Europe. Europe Contingency $20M IDIQ Awarded a position on the Navy Webster Out Lying Field (WOLF) IDIQ contract. WOLF provides rapid engineering, integration, and mission support to Navy, Joint, and coalition forces worldwide utilizing numerous platforms and integrated capabilities. WOLF RAPID MAC IDIQ Awarded to a Vectrus Joint Venture. This multiple award contract vehicle allows federal agencies access to customized IT solutions including emerging technologies and technological convergence. STARS III $60M Awarded the next generation follow-on contract with the Naval Surface Warfare Center supporting the Navy in solving afloat electromagnetic interference/compatibility challenges for the fleet. Spectrum Management


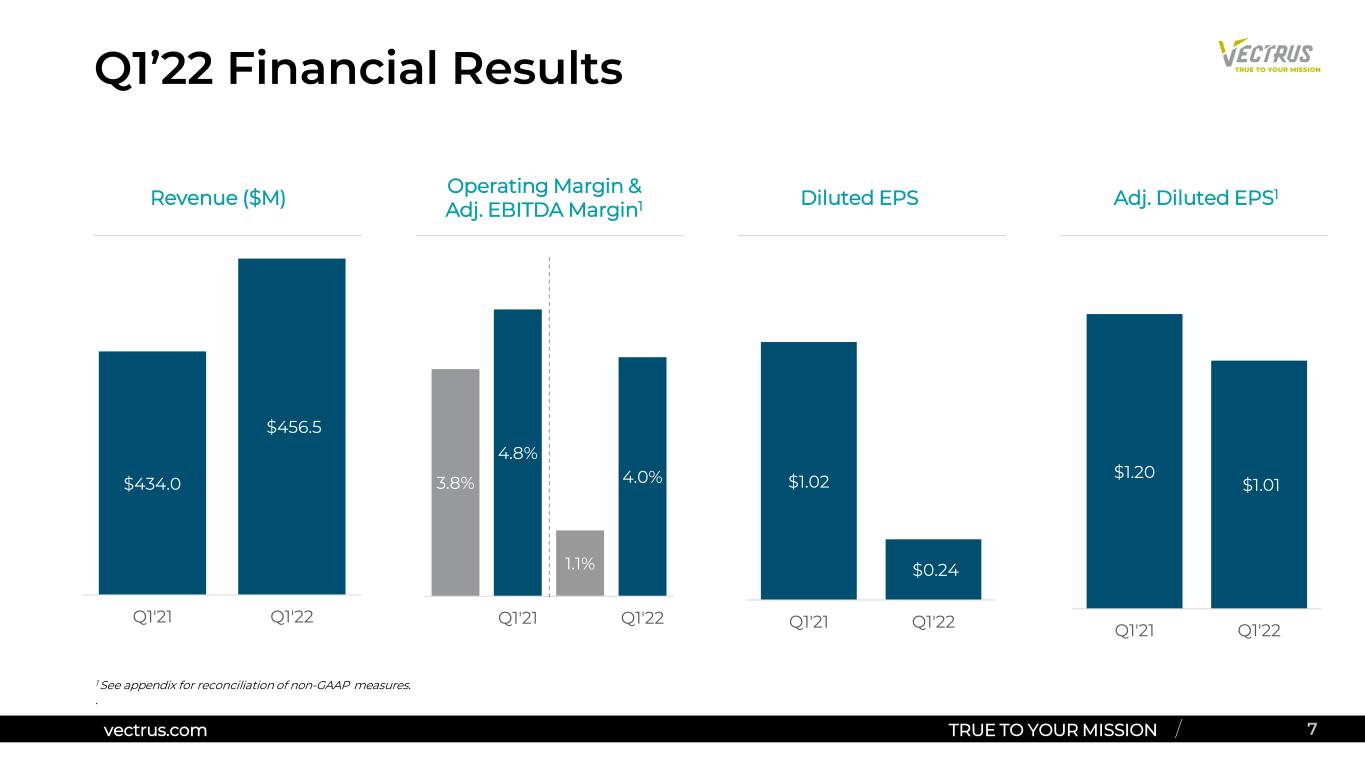
vectrus.com TRUE TO YOUR MISSION / Q1’22 Financial Results 7 1 See appendix for reconciliation of non-GAAP measures. . Revenue ($M) Operating Margin & Adj. EBITDA Margin1 Diluted EPS Adj. Diluted EPS1 $434.0 $456.5 Q1'21 Q1'22 3.8% 4.8% 1.1% 4.0% Q1'21 Q1'22 $1.02 $0.24 Q1'21 Q1'22 $1.20 $1.01 Q1'21 Q1'22 vectrus.com TRUE TO YOUR MISSION /


vectrus.com TRUE TO YOUR MISSION / Cash Flow and Liquidity 8 1 Cash excludes restricted cash 2 Net Debt = Debt – Cash ($M) Q1 2021 Q1 2022 YTD Net Cash Provided by (Used in) Operating Activities ($21.7) ($26.4) Cash1 $38.3 $23.0 Receivables $359.2 $377.6 Debt $177.0 $119.8 Net Debt2 $138.7 $96.8 Leverage Ratio(x) 2.0x 1.4x • YTD Net Cash Used in Operations of $26.4 million; current quarter included: • ~$8.0 million CARES Act repayment and • ~$2.0 million merger related expenditures • Strong balance sheet and financial position vectrus.com TRUE TO YOUR MISSION /


vectrus.com TRUE TO YOUR MISSION / 9 Backlog and Book-to-Bill Total Q1’21 Backlog of $4.5 Billion Backlog1 ($B) Trailing 12-Month Book-to-Bill Ratio 0.8 x 1.2 x 1.3 x 1.0 x 1.0 x Q1'21 Q2'21 Q3'21 Q4'21 Q1'22 $ 0.9 $ 1.3 $ 1.2 $ 1.0 $ 0.8 $ 3.6 $ 3.6 $ 3.7 $ 4.0 $ 3.7 Q1'21 Q2'21 Q3'21 Q4'21 Q1'22 Unfunded Funded $4.9 $4.5$4.9 $4.5 $5.0 TTM Book-to-Bill Ratio is 1.0x 1 Total Backlog represents firm orders and potential options on multi-year contracts, excluding potential orders under IDIQ contracts.


vectrus.com TRUE TO YOUR MISSION / 2022 Guidance 10vectrus.com TRUE TO YOUR MISSION / 2022 guidance assumptions include: • Capital expenditures ~ $10 million • Depreciation and amortization ~ $15 million — Amortization of acquired intangible assets ~ $8.5 million • Mandatory debt payments $10.4 million • Interest expense ~ $7 million • Tax rate of ~ 19.0%; • Diluted EPS assumes 12.0 million weighted average diluted shares outstanding on December 31, 2022 • First repayment of CARES Act deferrals occurred in Q1 2022 ~ $8 million • Guidance does not include the impact of Vertex transaction ($M, except per share data) 2022 Guidance 2022 Mid-Point Revenue $1,820 - $1,860 $1,840 Adjusted EBITDA Margin1 (%) 4.5% - 4.7% 4.6% Adjusted Diluted Earnings Per Share1 $4.57 - $4.93 $4.74 Net Cash Provided by Operating Activities Excluding M&A Costs1 $50.0 - $53.5 $51.75 1 Due to the merger activities with Vertex, the company is not providing GAAP guidance or a reconciliation of forward-looking measures including adjusted diluted EPS to GAAP diluted EPS or adjusted EBITDA margin to GAAP net income due to the difficulty in forecasting the transaction timing and quantifying certain amounts that are necessary for such reconciliation. .


Merger Update


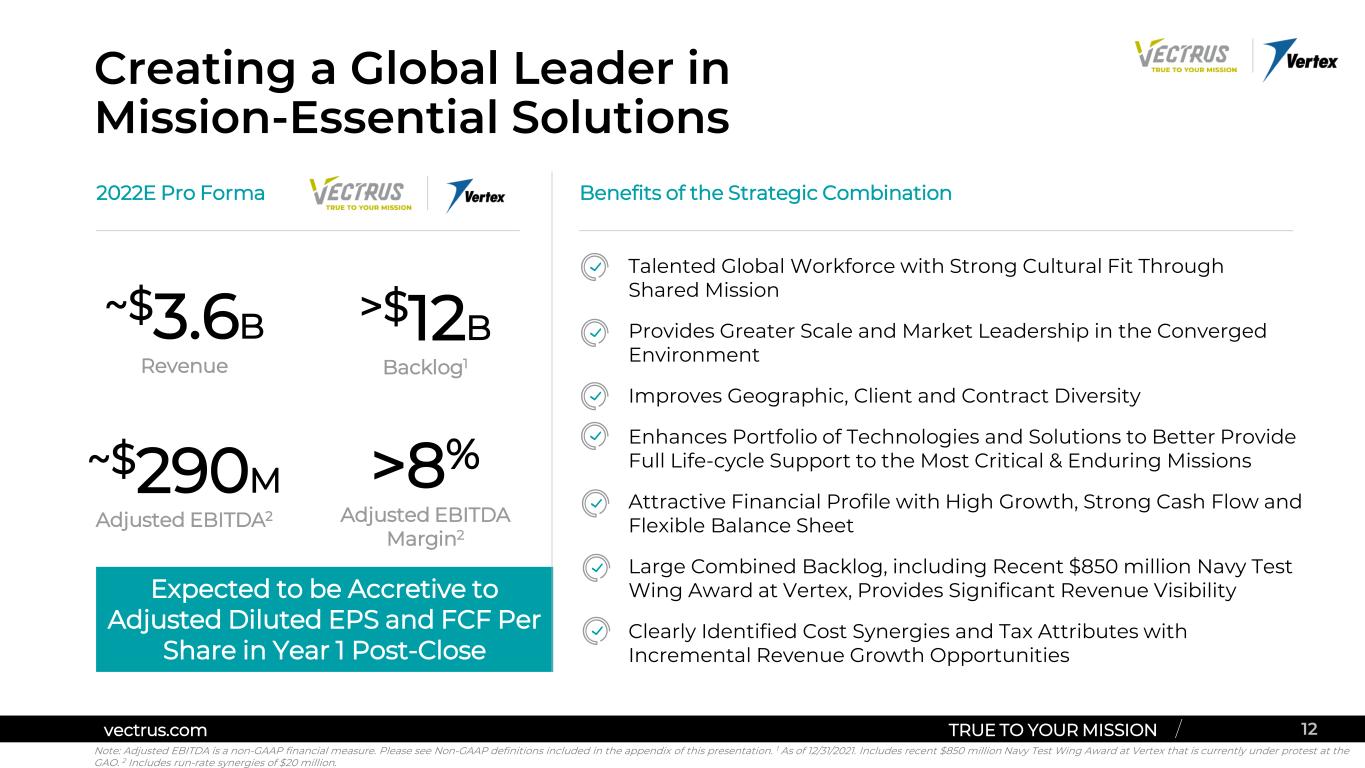
vectrus.com TRUE TO YOUR MISSION /  Talented Global Workforce with Strong Cultural Fit Through Shared Mission  Provides Greater Scale and Market Leadership in the Converged Environment  Improves Geographic, Client and Contract Diversity  Enhances Portfolio of Technologies and Solutions to Better Provide Full Life-cycle Support to the Most Critical & Enduring Missions  Attractive Financial Profile with High Growth, Strong Cash Flow and Flexible Balance Sheet  Large Combined Backlog, including Recent $850 million Navy Test Wing Award at Vertex, Provides Significant Revenue Visibility  Clearly Identified Cost Synergies and Tax Attributes with Incremental Revenue Growth Opportunities Creating a Global Leader in Mission-Essential Solutions 12vectrus.com TRUE TO YOUR MISSION / Expected to be Accretive to Adjusted Diluted EPS and FCF Per Share in Year 1 Post-Close Benefits of the Strategic Combination ~$3.6B Revenue >8% Adjusted EBITDA Margin2 2022E Pro Forma >$12B Backlog1 Note: Adjusted EBITDA is a non-GAAP financial measure. Please see Non-GAAP definitions included in the appendix of this presentation. 1 As of 12/31/2021. Includes recent $850 million Navy Test Wing Award at Vertex that is currently under protest at the GAO. 2 Includes run-rate synergies of $20 million. ~$290M Adjusted EBITDA2


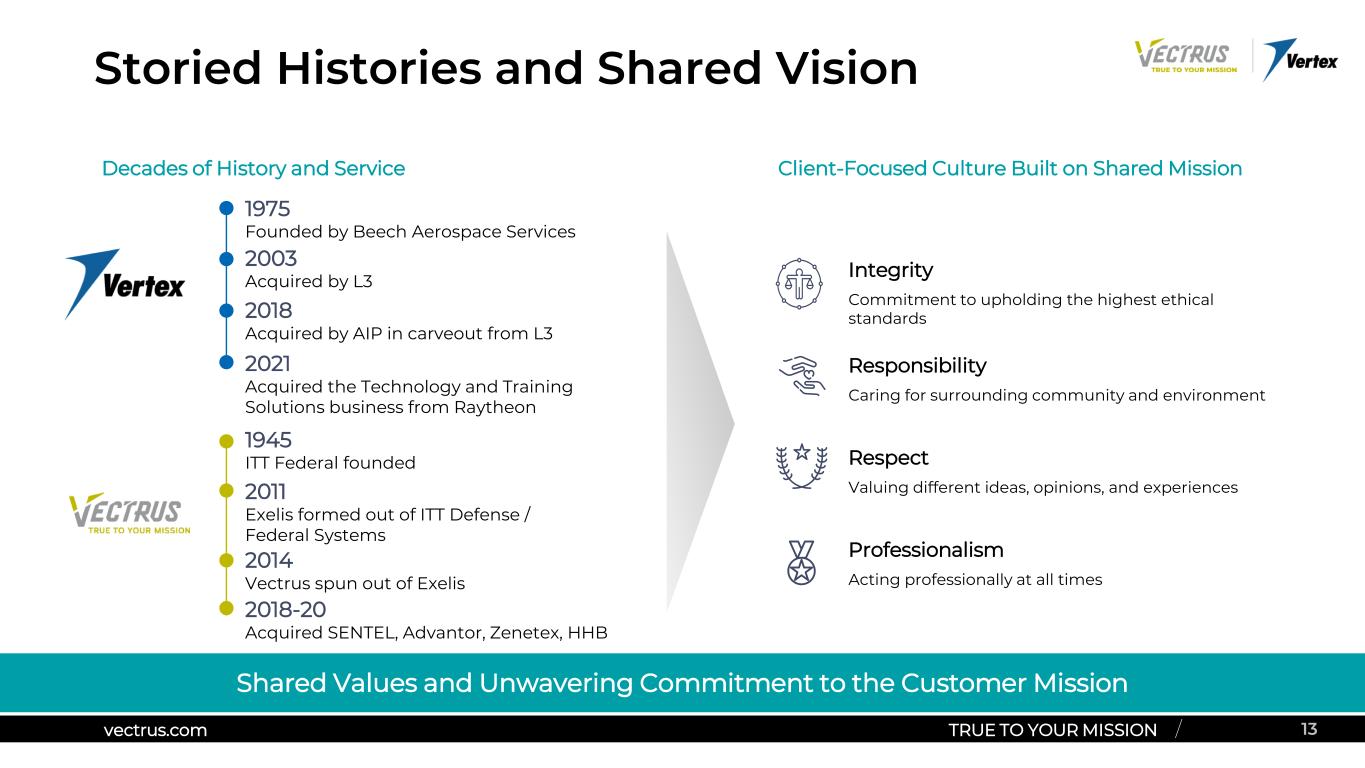
vectrus.com TRUE TO YOUR MISSION / Storied Histories and Shared Vision 13vectrus.com TRUE TO YOUR MISSION / Shared Values and Unwavering Commitment to the Customer Mission 1975 Founded by Beech Aerospace Services 2018 Acquired by AIP in carveout from L3 2021 Acquired the Technology and Training Solutions business from Raytheon 1945 ITT Federal founded 2014 Vectrus spun out of Exelis 2018-20 Acquired SENTEL, Advantor, Zenetex, HHB Decades of History and Service Client-Focused Culture Built on Shared Mission Integrity Commitment to upholding the highest ethical standards Responsibility Caring for surrounding community and environment Respect Valuing different ideas, opinions, and experiences Professionalism Acting professionally at all times 2011 Exelis formed out of ITT Defense / Federal Systems 2003 Acquired by L3


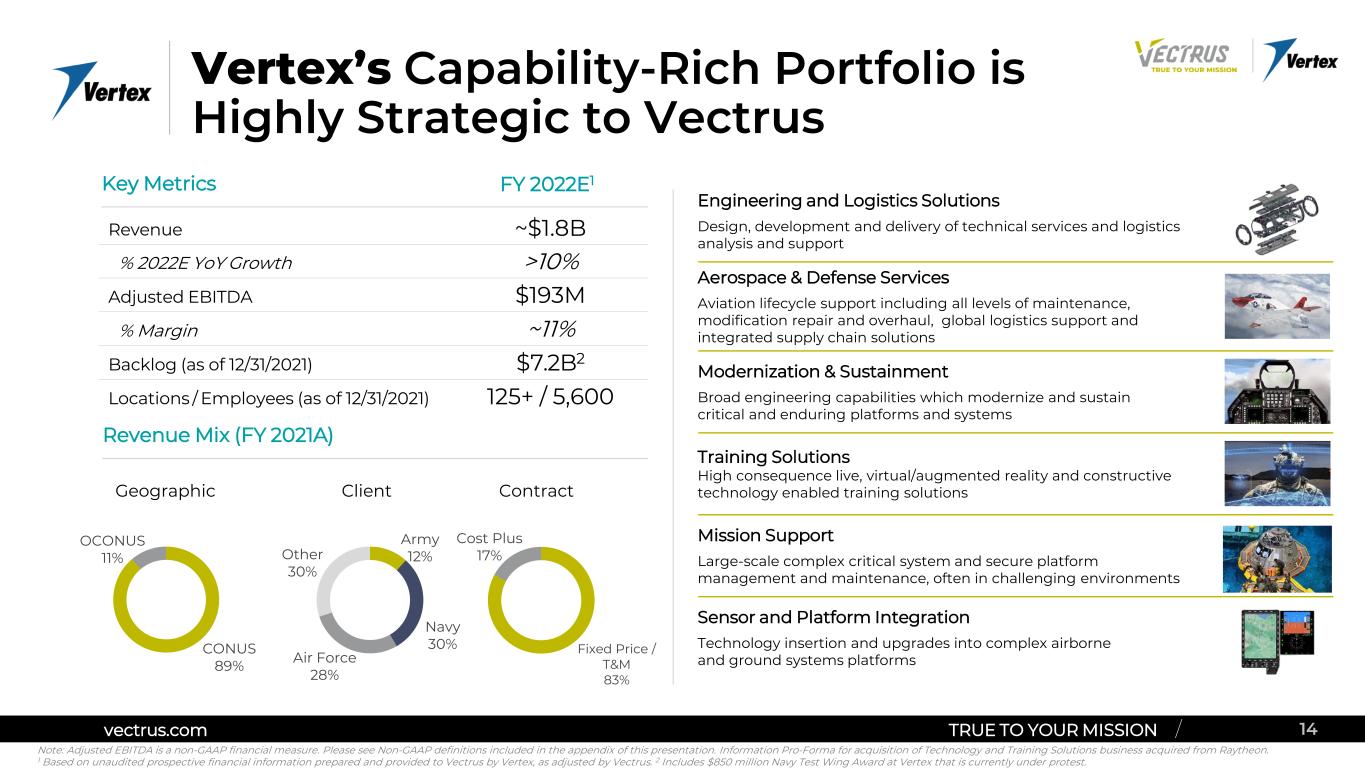
vectrus.com TRUE TO YOUR MISSION / Engineering and Logistics Solutions Design, development and delivery of technical services and logistics analysis and support Aerospace & Defense Services Aviation lifecycle support including all levels of maintenance, modification repair and overhaul, global logistics support and integrated supply chain solutions Modernization & Sustainment Broad engineering capabilities which modernize and sustain critical and enduring platforms and systems Training Solutions High consequence live, virtual/augmented reality and constructive technology enabled training solutions Mission Support Large-scale complex critical system and secure platform management and maintenance, often in challenging environments Sensor and Platform Integration Technology insertion and upgrades into complex airborne and ground systems platforms Vertex’s Capability-Rich Portfolio is Highly Strategic to Vectrus vectrus.com TRUE TO YOUR MISSION / 14 Revenue ~$1.8B % 2022E YoY Growth >10% Adjusted EBITDA $193M % Margin ~11% Backlog (as of 12/31/2021) $7.2B2 Locations / Employees (as of 12/31/2021) 125+ / 5,600 Key Metrics Revenue Mix (FY 2021A) Geographic Client Contract Army 12% Navy 30% Air Force 28% Other 30% Fixed Price / T&M 83% Cost Plus 17% CONUS 89% OCONUS 11% Note: Adjusted EBITDA is a non-GAAP financial measure. Please see Non-GAAP definitions included in the appendix of this presentation. Information Pro-Forma for acquisition of Technology and Training Solutions business acquired from Raytheon. 1 Based on unaudited prospective financial information prepared and provided to Vectrus by Vertex, as adjusted by Vectrus. 2 Includes $850 million Navy Test Wing Award at Vertex that is currently under protest. FY 2022E1


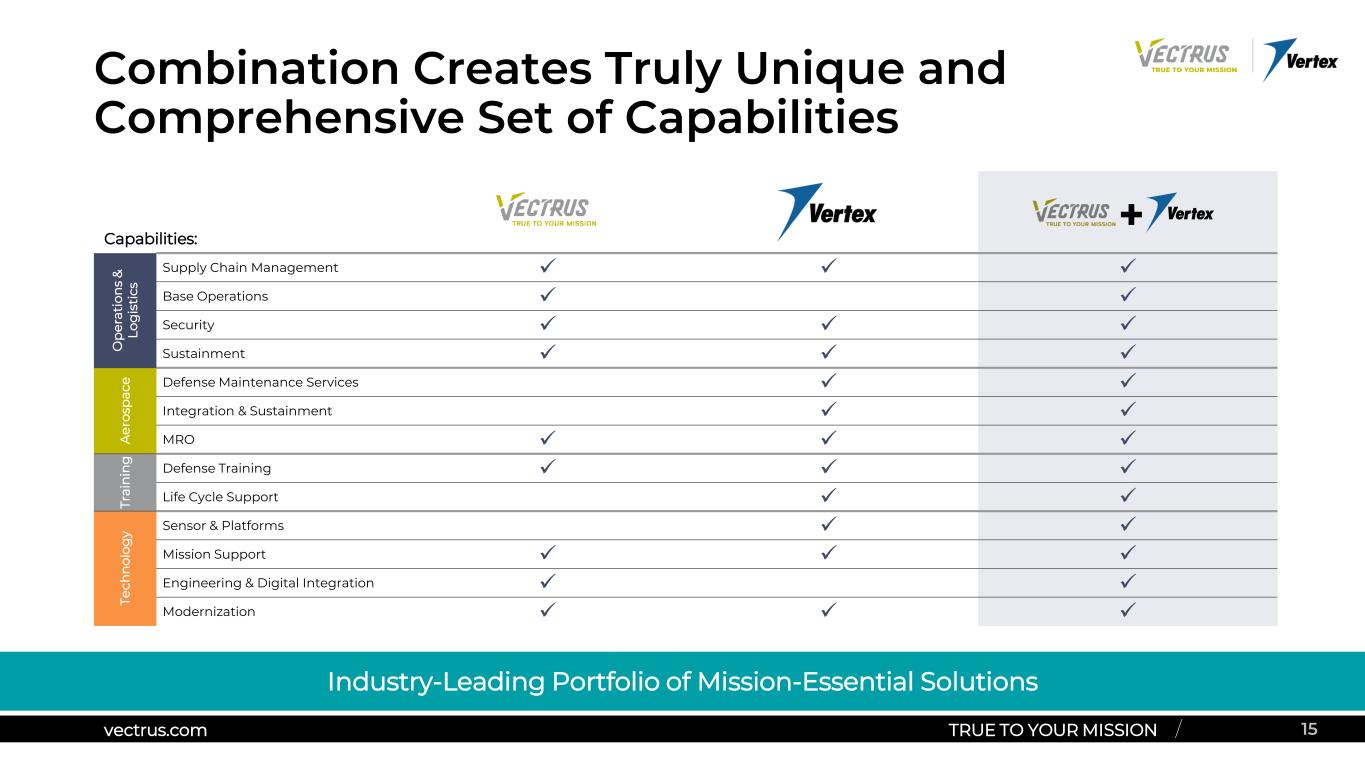
vectrus.com TRUE TO YOUR MISSION /vectrus.com TRUE TO YOUR MISSION / Combination Creates Truly Unique and Comprehensive Set of Capabilities 15 Capabilities: O p er at io n s & Lo g is ti cs Supply Chain Management    Base Operations   Security    Sustainment    A er os p ac e Defense Maintenance Services   Integration & Sustainment   MRO    Tr ai n in g Defense Training    Life Cycle Support   Te ch n ol og y Sensor & Platforms   Mission Support    Engineering & Digital Integration   Modernization    Industry-Leading Portfolio of Mission-Essential Solutions


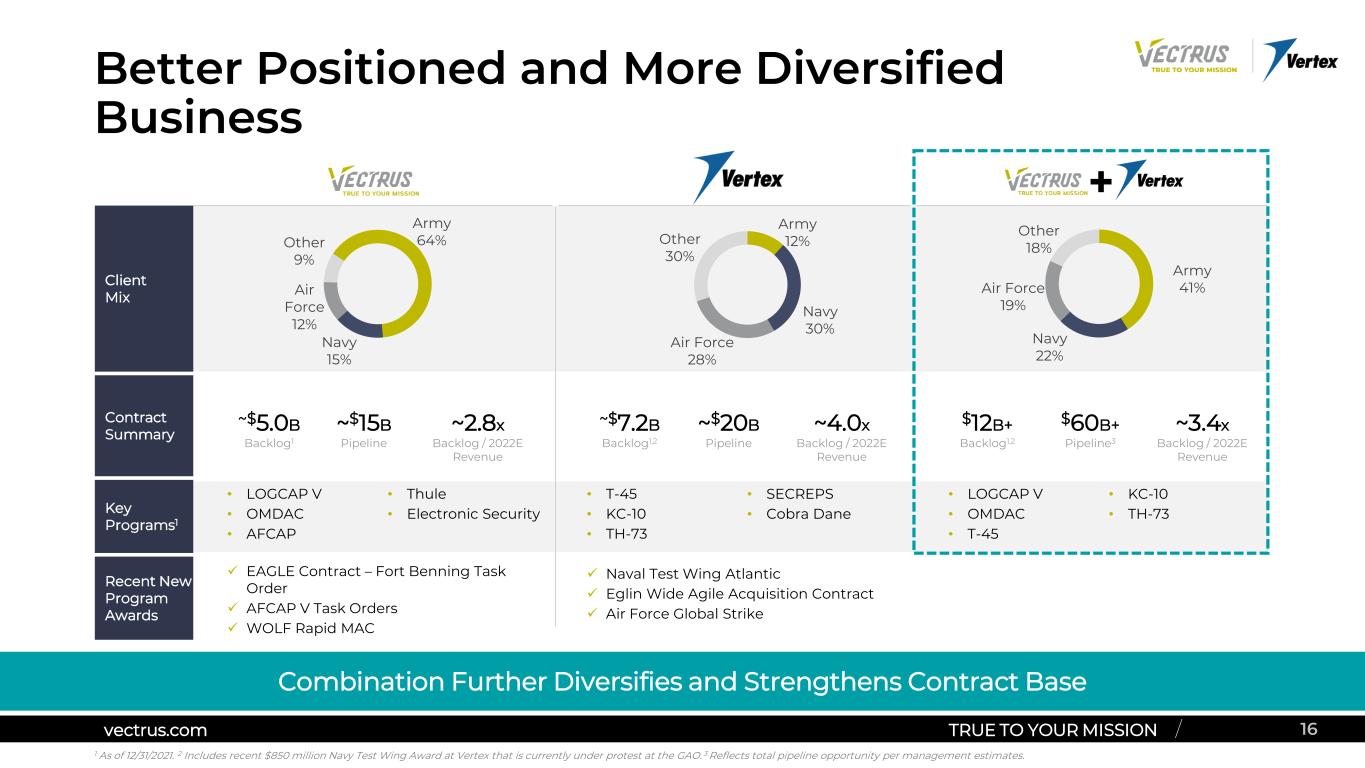
vectrus.com TRUE TO YOUR MISSION /vectrus.com TRUE TO YOUR MISSION / Better Positioned and More Diversified Business 16 Combination Further Diversifies and Strengthens Contract Base Army 41% Navy 22% Air Force 19% Other 18% • LOGCAP V • OMDAC • AFCAP $12B+ Backlog1,2 $60B+ Pipeline3 1 As of 12/31/2021. 2 Includes recent $850 million Navy Test Wing Award at Vertex that is currently under protest at the GAO. 3 Reflects total pipeline opportunity per management estimates. Army 64% Navy 15% Air Force 12% Other 9% Army 12% Navy 30% Air Force 28% Other 30% Client Mix Contract Summary Key Programs1 Recent New Program Awards • Thule • Electronic Security ~3.4x Backlog / 2022E Revenue ~$7.2B Backlog1,2 ~$20B Pipeline ~4.0x Backlog / 2022E Revenue ~$5.0B Backlog1 ~$15B Pipeline ~2.8x Backlog / 2022E Revenue • T-45 • KC-10 • TH-73 • SECREPS • Cobra Dane • LOGCAP V • OMDAC • T-45 • KC-10 • TH-73  EAGLE Contract – Fort Benning Task Order  AFCAP V Task Orders  WOLF Rapid MAC  Naval Test Wing Atlantic  Eglin Wide Agile Acquisition Contract  Air Force Global Strike


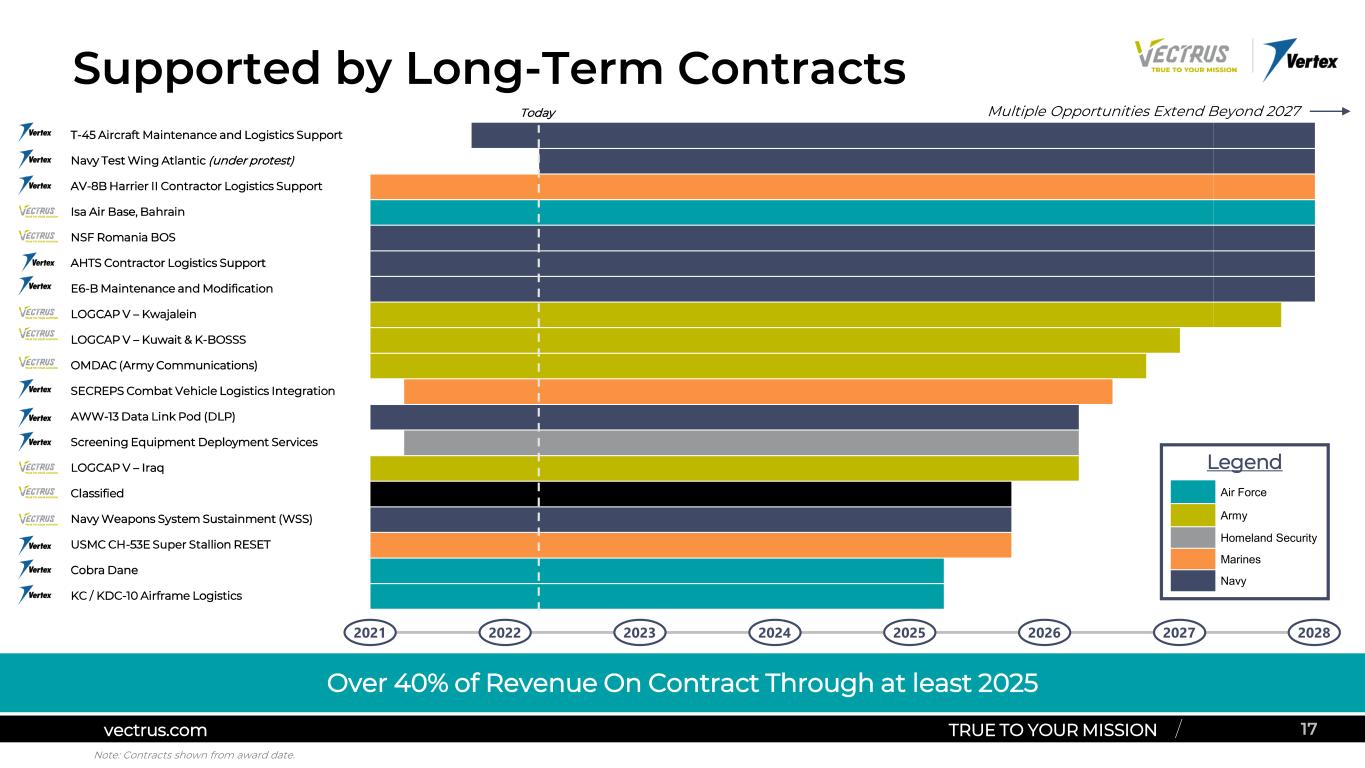
vectrus.com TRUE TO YOUR MISSION / Supported by Long-Term Contracts 17vectrus.com TRUE TO YOUR MISSION / 2021 Over 40% of Revenue On Contract Through at least 2025 T-45 Aircraft Maintenance and Logistics Support Navy Test Wing Atlantic (under protest) AV-8B Harrier II Contractor Logistics Support Isa Air Base, Bahrain NSF Romania BOS AHTS Contractor Logistics Support E6-B Maintenance and Modification LOGCAP V – Kwajalein LOGCAP V – Kuwait & K-BOSSS OMDAC (Army Communications) SECREPS Combat Vehicle Logistics Integration AWW-13 Data Link Pod (DLP) Screening Equipment Deployment Services LOGCAP V – Iraq Classified Navy Weapons System Sustainment (WSS) USMC CH-53E Super Stallion RESET Cobra Dane KC / KDC-10 Airframe Logistics 202820272022 2023 2024 2025 2026 Multiple Opportunities Extend Beyond 2027 Legend Air Force Army Homeland Security Marines Navy Today Note: Contracts shown from award date.


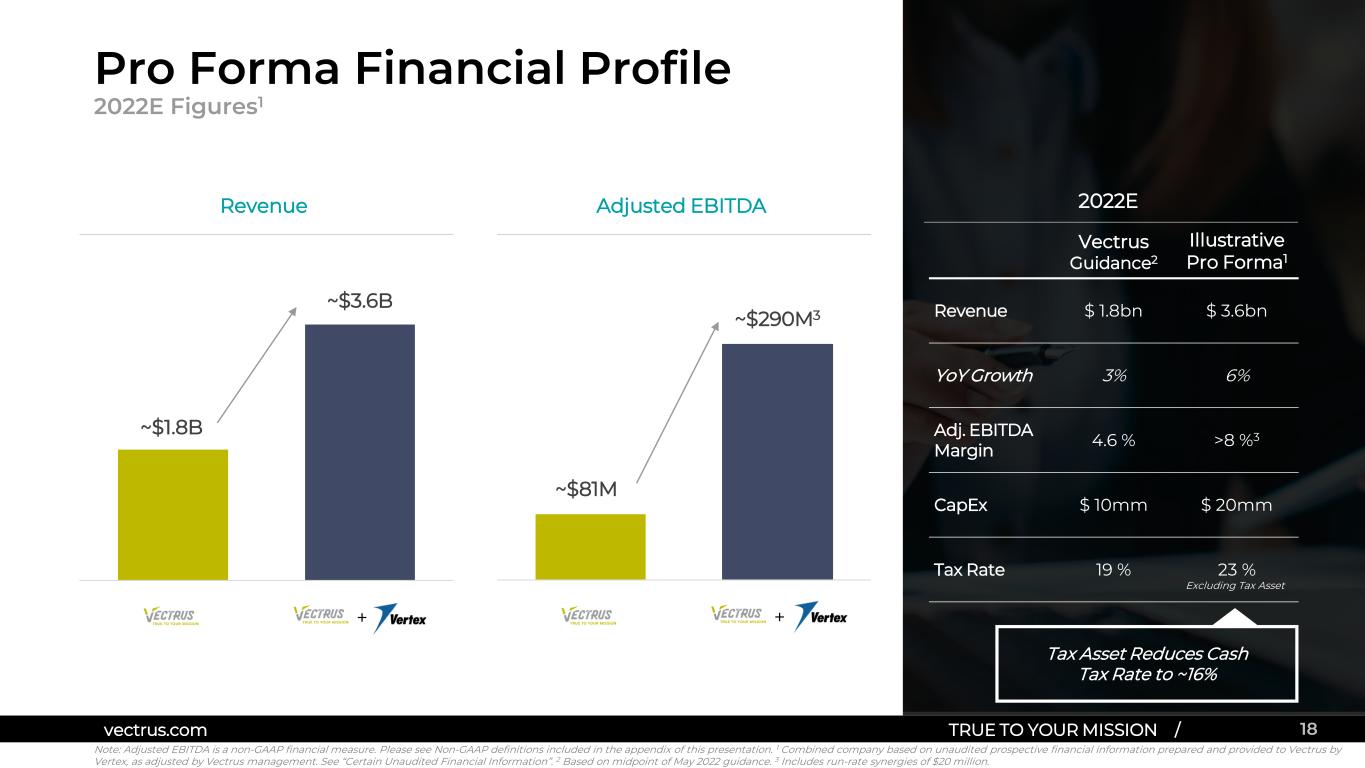
vectrus.com TRUE TO YOUR MISSION / ~$81M ~$290M3 Category 1 Category 2 18vectrus.com TRUE TO YOUR MISSION / Pro Forma Financial Profile 2022E Figures1 Note: Adjusted EBITDA is a non-GAAP financial measure. Please see Non-GAAP definitions included in the appendix of this presentation. 1 Combined company based on unaudited prospective financial information prepared and provided to Vectrus by Vertex, as adjusted by Vectrus management. See “Certain Unaudited Financial Information”. 2 Based on midpoint of May 2022 guidance. 3 Includes run-rate synergies of $20 million. Revenue Adjusted EBITDA ~$1.8B ~$3.6B Category 1 Category 2 + + 2022E Vectrus Guidance2 Illustrative Pro Forma1 Revenue $ 1.8bn $ 3.6bn YoY Growth 3% 6% Adj. EBITDA Margin 4.6 % >8 %3 CapEx $ 10mm $ 20mm Tax Rate 19 % 23 % Excluding Tax Asset Tax Asset Reduces Cash Tax Rate to ~16%


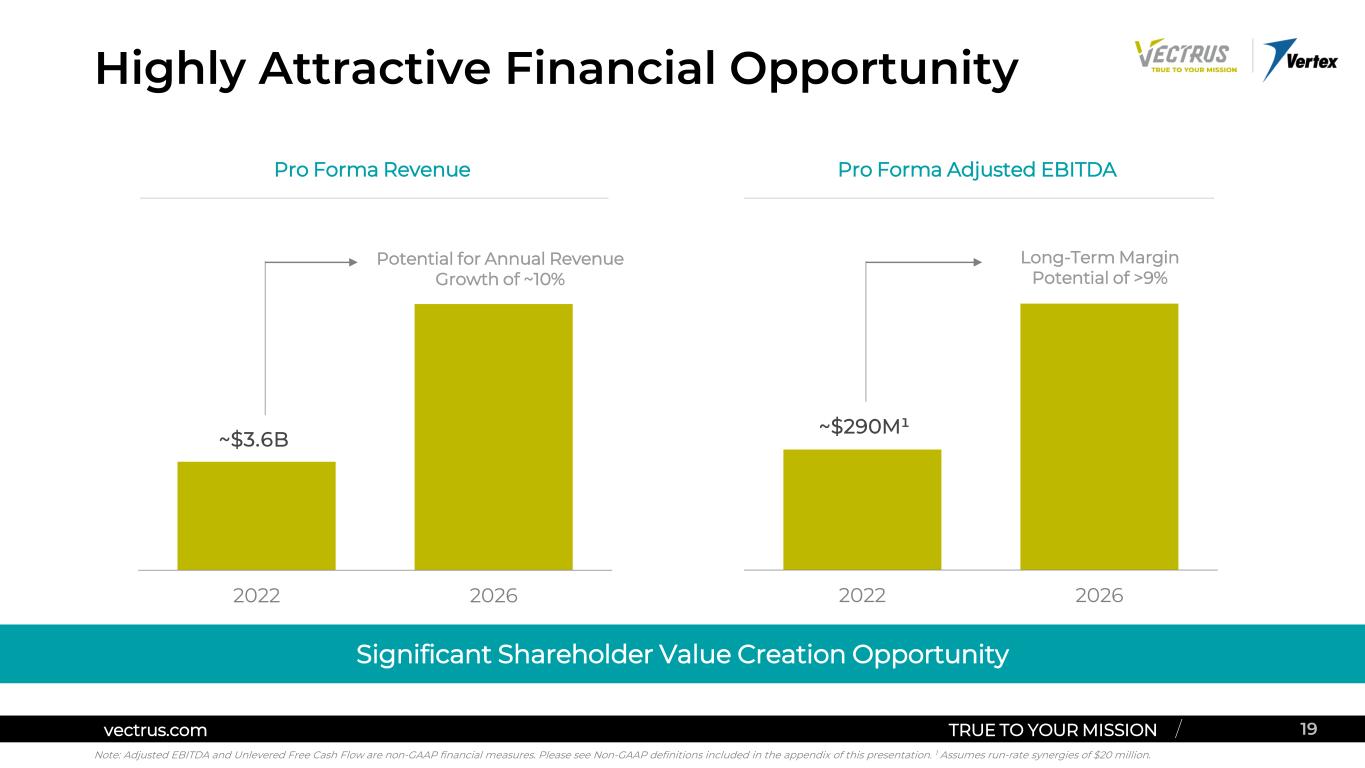
vectrus.com TRUE TO YOUR MISSION / ~$290M¹ 2022 2026 ~$3.6B 2022 2026 vectrus.com TRUE TO YOUR MISSION / Highly Attractive Financial Opportunity 19 Significant Shareholder Value Creation Opportunity Pro Forma Revenue Pro Forma Adjusted EBITDA Note: Adjusted EBITDA and Unlevered Free Cash Flow are non-GAAP financial measures. Please see Non-GAAP definitions included in the appendix of this presentation. 1 Assumes run-rate synergies of $20 million. Long-Term Margin Potential of >9% Potential for Annual Revenue Growth of ~10%


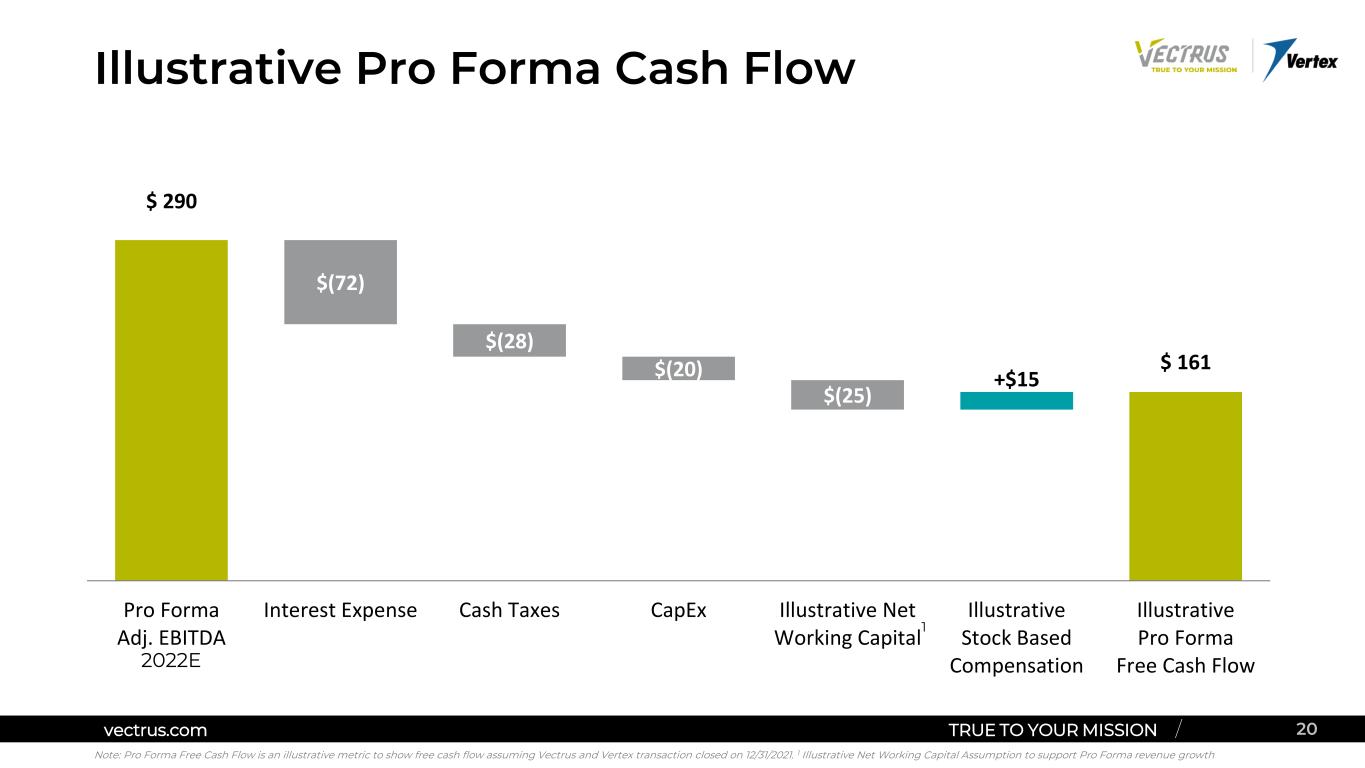
vectrus.com TRUE TO YOUR MISSION /vectrus.com TRUE TO YOUR MISSION / 20 $ 290 $ 161 $(72) $(28) $(20) $(25) +$15 Pro Forma Adj. EBITDA Interest Expense Cash Taxes CapEx Illustrative Net Working Capital Illustrative Stock Based Compensation Illustrative Pro Forma Free Cash Flow Note: Pro Forma Free Cash Flow is an illustrative metric to show free cash flow assuming Vectrus and Vertex transaction closed on 12/31/2021. 1 Illustrative Net Working Capital Assumption to support Pro Forma revenue growth 1 Illustrative Pro Forma Cash Flow 2022E


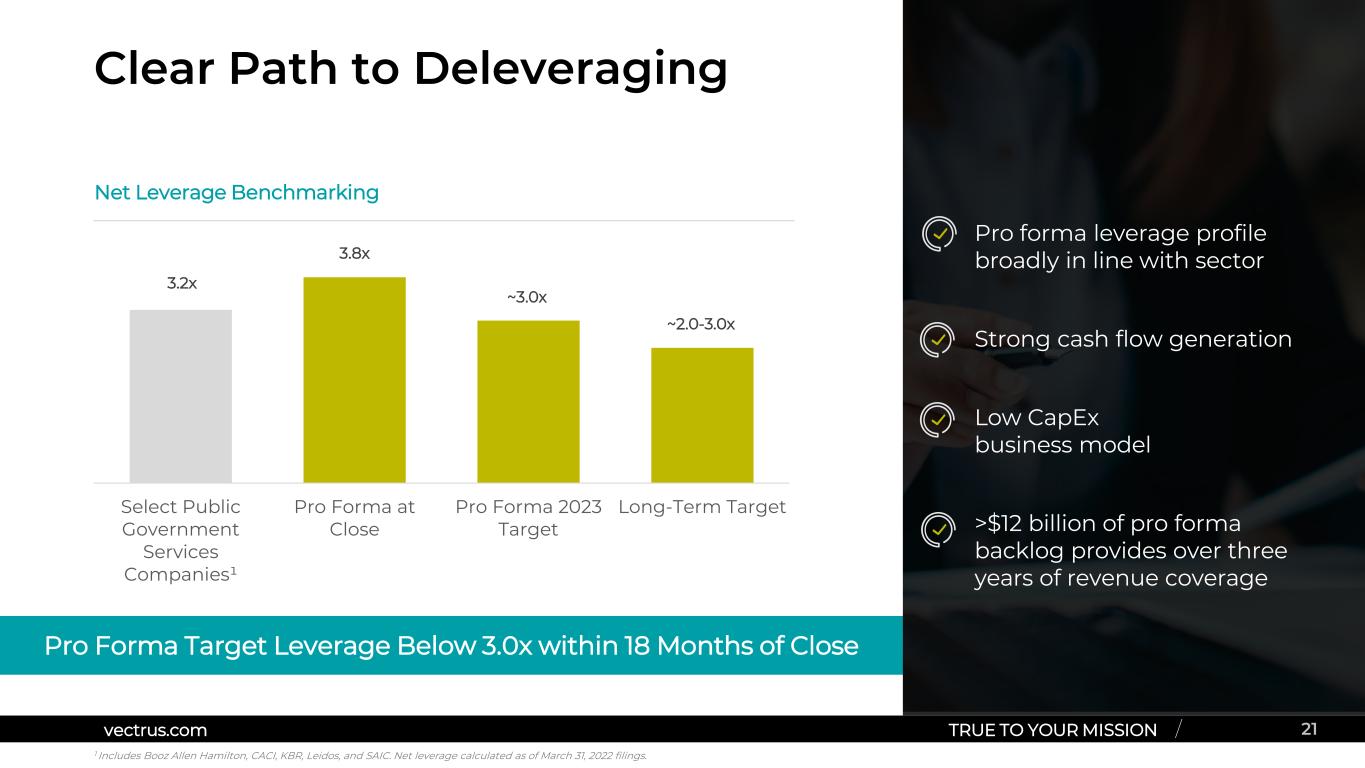
vectrus.com TRUE TO YOUR MISSION /vectrus.com TRUE TO YOUR MISSION / Clear Path to Deleveraging 21 Pro forma leverage profile broadly in line with sector Strong cash flow generation Low CapEx business model >$12 billion of pro forma backlog provides over three years of revenue coverage Net Leverage Benchmarking 3.2x 3.8x ~3.0x ~2.0-3.0x Select Public Government Services Companies¹ Pro Forma at Close Pro Forma 2023 Target Long-Term Target Pro Forma Target Leverage Below 3.0x within 18 Months of Close 1 Includes Booz Allen Hamilton, CACI, KBR, Leidos, and SAIC. Net leverage calculated as of March 31, 2022 filings.


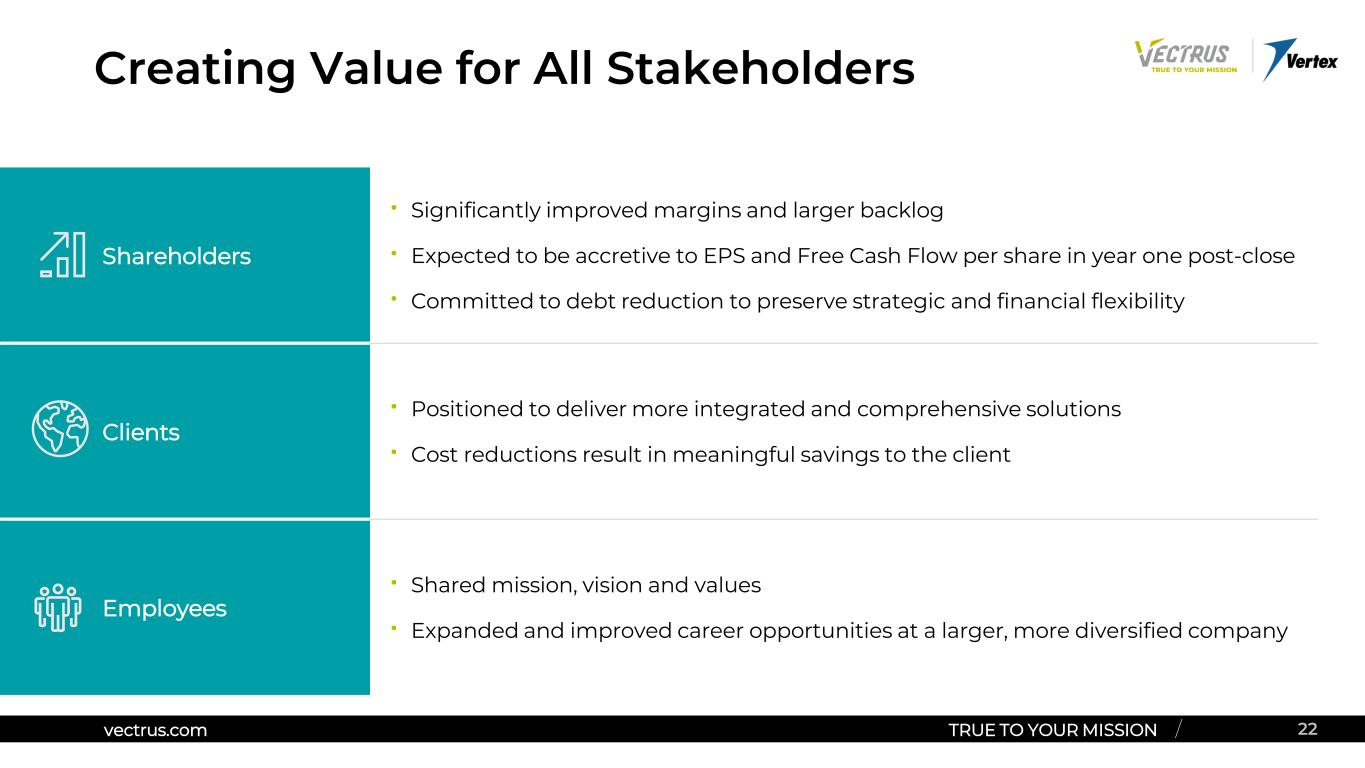
vectrus.com TRUE TO YOUR MISSION / 22vectrus.com TRUE TO YOUR MISSION / Creating Value for All Stakeholders Shareholders • Significantly improved margins and larger backlog • Expected to be accretive to EPS and Free Cash Flow per share in year one post-close • Committed to debt reduction to preserve strategic and financial flexibility Clients • Positioned to deliver more integrated and comprehensive solutions • Cost reductions result in meaningful savings to the client Employees • Shared mission, vision and values • Expanded and improved career opportunities at a larger, more diversified company


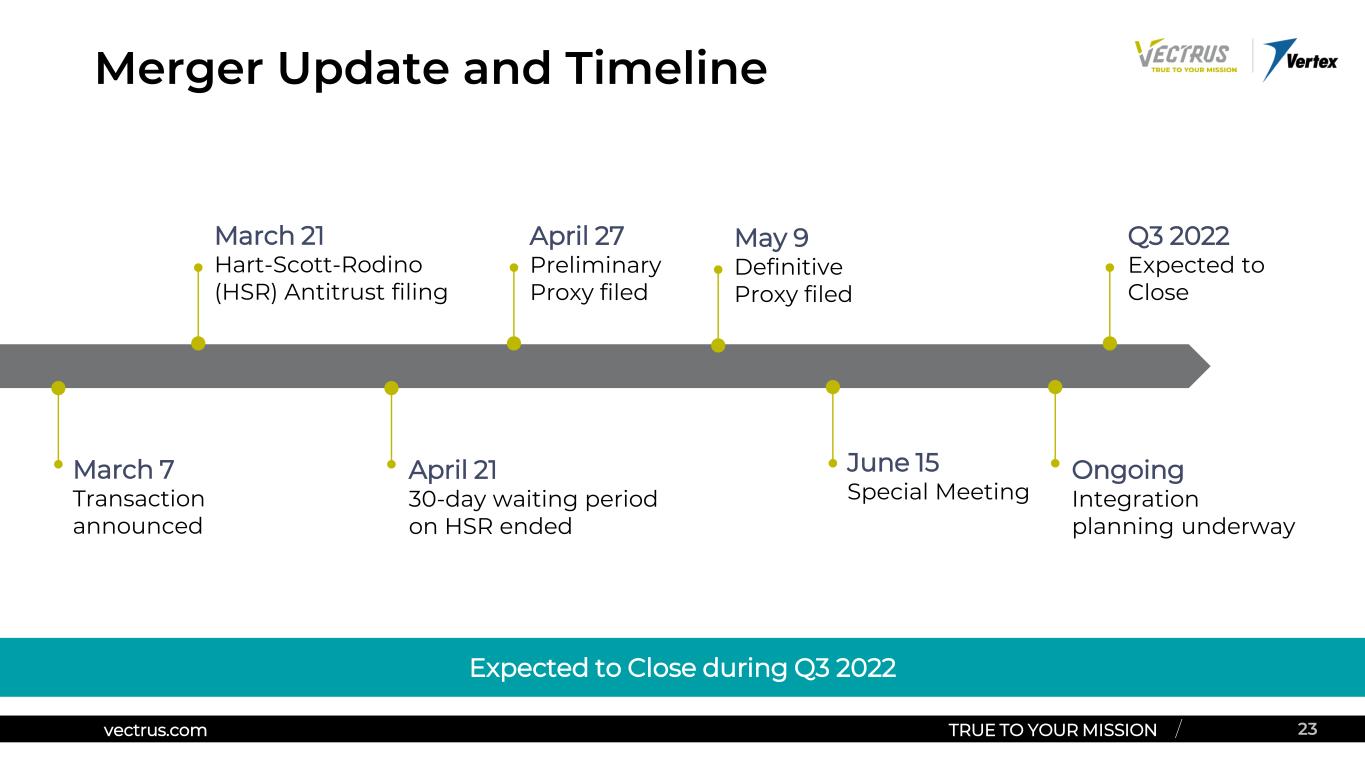
vectrus.com TRUE TO YOUR MISSION / Merger Update and Timeline 23vectrus.com TRUE TO YOUR MISSION / Expected to Close during Q3 2022 March 7 Transaction announced March 21 Hart-Scott-Rodino (HSR) Antitrust filing April 21 30-day waiting period on HSR ended April 27 Preliminary Proxy filed Ongoing Integration planning underway Q3 2022 Expected to Close May 9 Definitive Proxy filed June 15 Special Meeting


Appendix


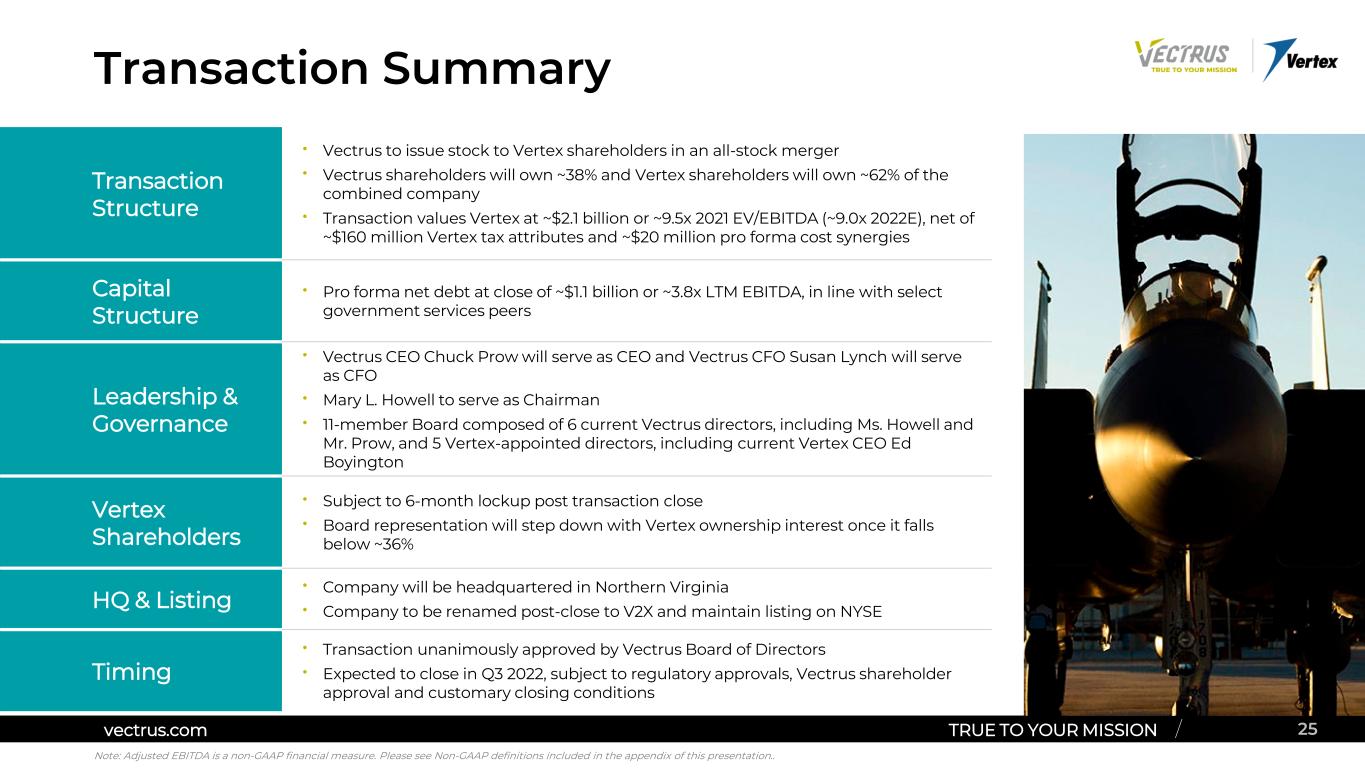
vectrus.com TRUE TO YOUR MISSION / Transaction Summary 25vectrus.com TRUE TO YOUR MISSION / Transaction Structure • Vectrus to issue stock to Vertex shareholders in an all-stock merger • Vectrus shareholders will own ~38% and Vertex shareholders will own ~62% of the combined company • Transaction values Vertex at ~$2.1 billion or ~9.5x 2021 EV/EBITDA (~9.0x 2022E), net of ~$160 million Vertex tax attributes and ~$20 million pro forma cost synergies Capital Structure • Pro forma net debt at close of ~$1.1 billion or ~3.8x LTM EBITDA, in line with select government services peers Leadership & Governance • Vectrus CEO Chuck Prow will serve as CEO and Vectrus CFO Susan Lynch will serve as CFO • Mary L. Howell to serve as Chairman • 11-member Board composed of 6 current Vectrus directors, including Ms. Howell and Mr. Prow, and 5 Vertex-appointed directors, including current Vertex CEO Ed Boyington Vertex Shareholders • Subject to 6-month lockup post transaction close • Board representation will step down with Vertex ownership interest once it falls below ~36% HQ & Listing • Company will be headquartered in Northern Virginia • Company to be renamed post-close to V2X and maintain listing on NYSE Timing • Transaction unanimously approved by Vectrus Board of Directors • Expected to close in Q3 2022, subject to regulatory approvals, Vectrus shareholder approval and customary closing conditions Note: Adjusted EBITDA is a non-GAAP financial measure. Please see Non-GAAP definitions included in the appendix of this presentation..


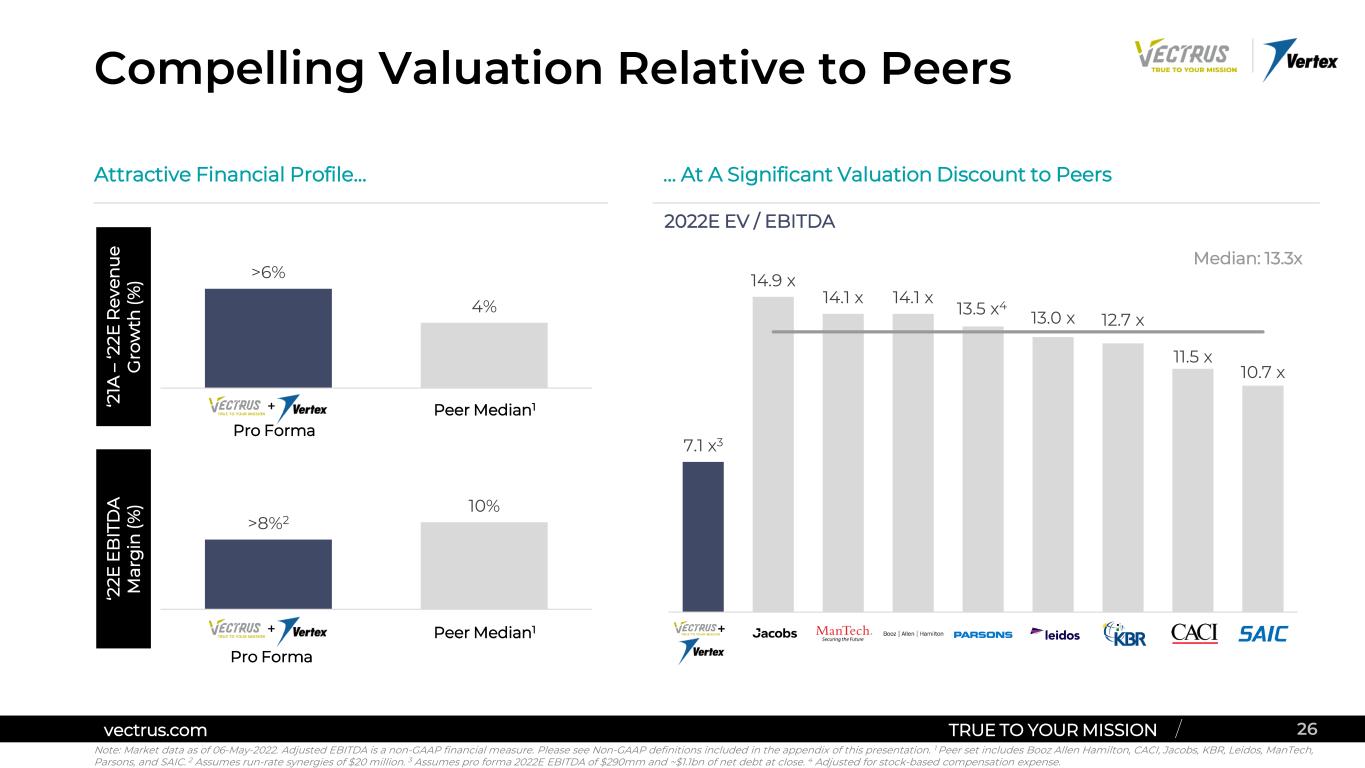
vectrus.com TRUE TO YOUR MISSION / Compelling Valuation Relative to Peers 26vectrus.com TRUE TO YOUR MISSION / … At A Significant Valuation Discount to PeersAttractive Financial Profile… Note: Market data as of 06-May-2022. Adjusted EBITDA is a non-GAAP financial measure. Please see Non-GAAP definitions included in the appendix of this presentation. 1 Peer set includes Booz Allen Hamilton, CACI, Jacobs, KBR, Leidos, ManTech, Parsons, and SAIC. 2 Assumes run-rate synergies of $20 million. 3 Assumes pro forma 2022E EBITDA of $290mm and ~$1.1bn of net debt at close. 4 Adjusted for stock-based compensation expense. 7.1 x3 14.9 x 14.1 x 14.1 x 13.5 x4 13.0 x 12.7 x 11.5 x 10.7 x + Median: 13.3x >6% 4% ‘2 1A – ‘2 2E R ev en u e G ro w th (% ) >8%2 10% + Peer Median1 ‘2 2E E B IT D A M ar g in (% ) + Peer Median1 2022E EV / EBITDA Pro Forma Pro Forma


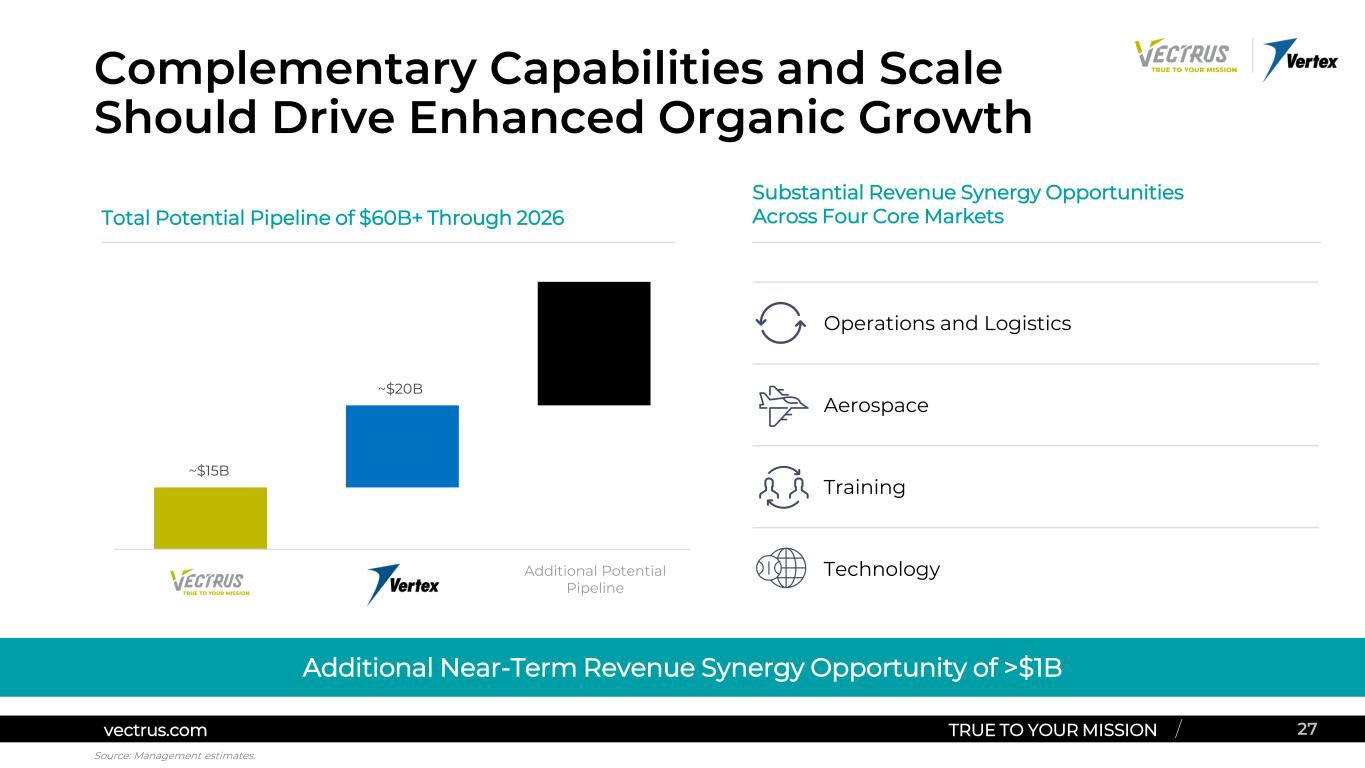
vectrus.com TRUE TO YOUR MISSION / Complementary Capabilities and Scale Should Drive Enhanced Organic Growth 27vectrus.com TRUE TO YOUR MISSION / Substantial Revenue Synergy Opportunities Across Four Core Markets Operations and Logistics Aerospace Training Technology Additional Near-Term Revenue Synergy Opportunity of >$1B Total Potential Pipeline of $60B+ Through 2026 Additional Potential Pipeline ~$20B ~$15B Source: Management estimates.


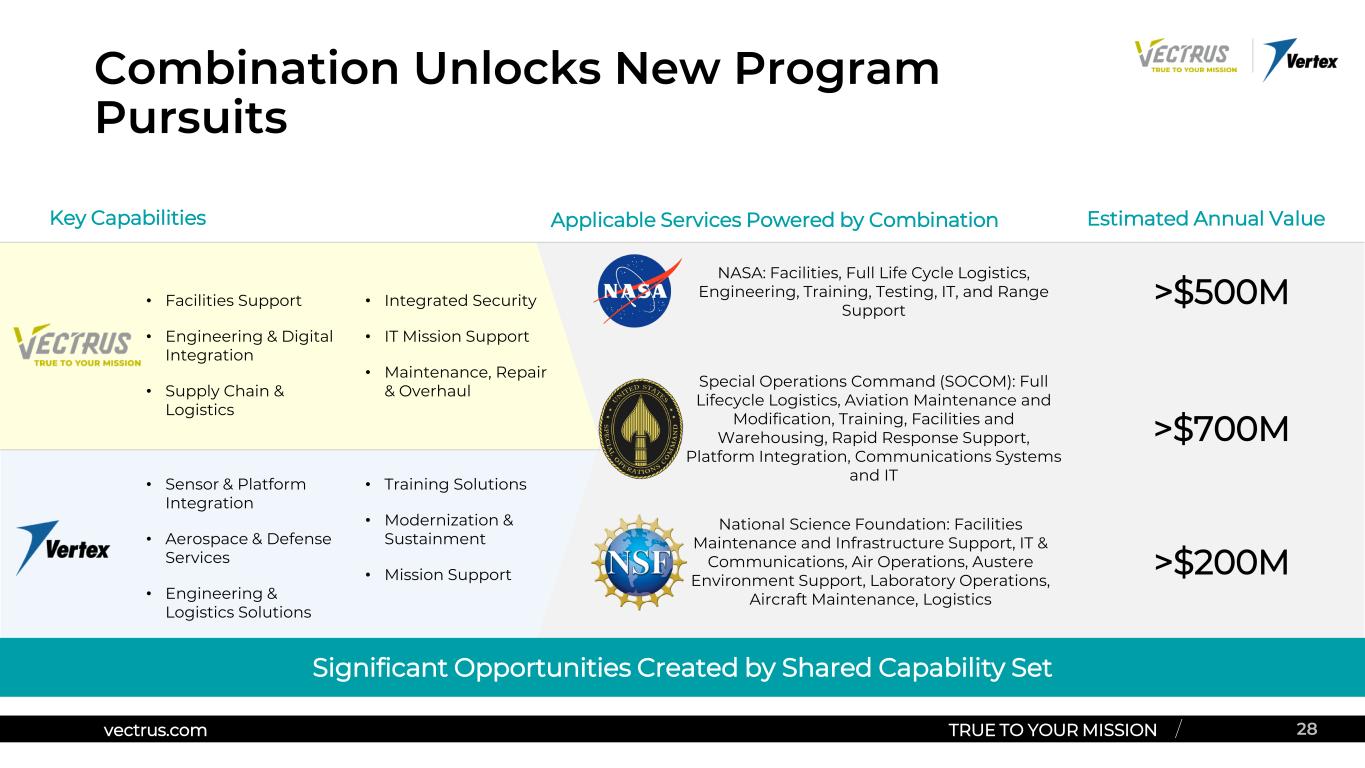
vectrus.com TRUE TO YOUR MISSION / Combination Unlocks New Program Pursuits 28vectrus.com TRUE TO YOUR MISSION / Significant Opportunities Created by Shared Capability Set • Facilities Support • Engineering & Digital Integration • Supply Chain & Logistics • Integrated Security • IT Mission Support • Maintenance, Repair & Overhaul NASA: Facilities, Full Life Cycle Logistics, Engineering, Training, Testing, IT, and Range Support Special Operations Command (SOCOM): Full Lifecycle Logistics, Aviation Maintenance and Modification, Training, Facilities and Warehousing, Rapid Response Support, Platform Integration, Communications Systems and IT Applicable Services Powered by CombinationKey Capabilities • Sensor & Platform Integration • Aerospace & Defense Services • Engineering & Logistics Solutions • Training Solutions • Modernization & Sustainment • Mission Support >$500M >$700M >$200M Estimated Annual Value National Science Foundation: Facilities Maintenance and Infrastructure Support, IT & Communications, Air Operations, Austere Environment Support, Laboratory Operations, Aircraft Maintenance, Logistics


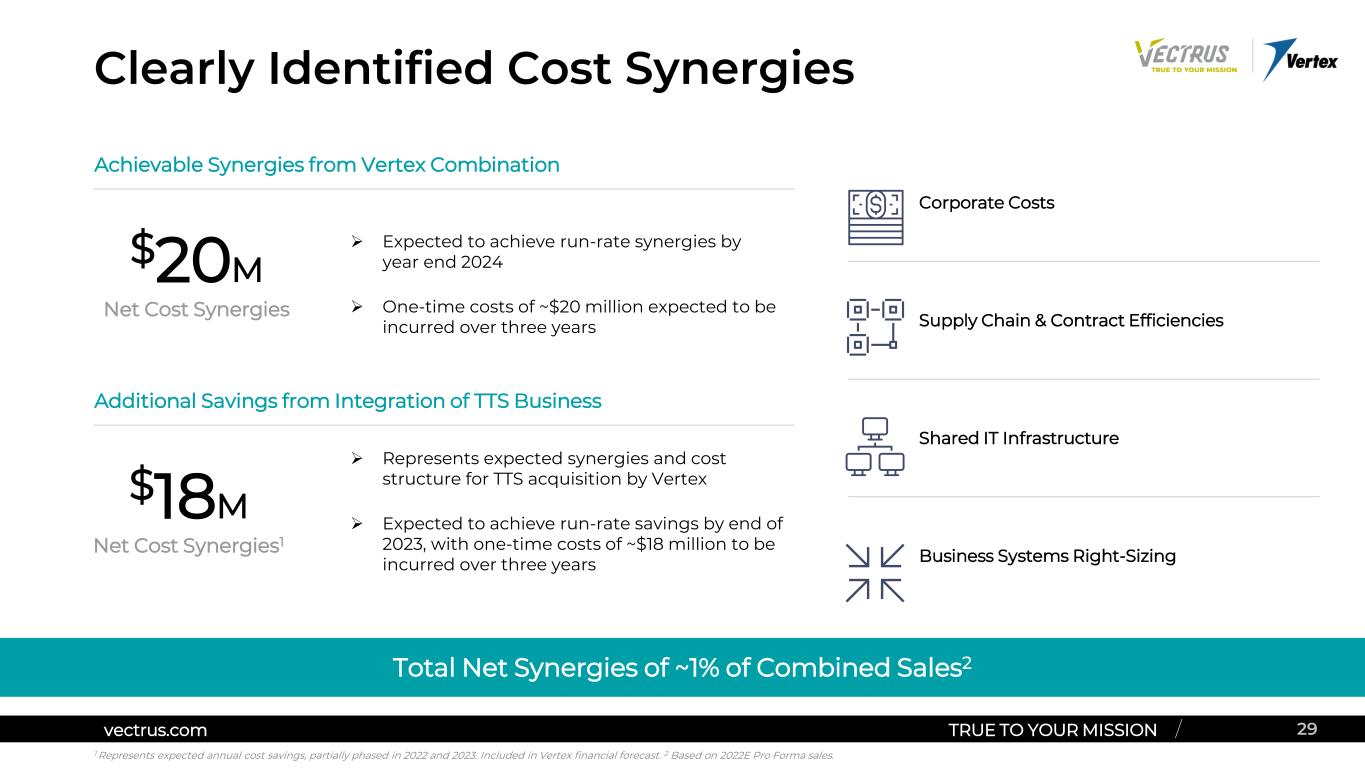
vectrus.com TRUE TO YOUR MISSION / Corporate Costs Supply Chain & Contract Efficiencies Shared IT Infrastructure Business Systems Right-Sizing Clearly Identified Cost Synergies 29vectrus.com TRUE TO YOUR MISSION / $20M Net Cost Synergies $18M Net Cost Synergies1 Achievable Synergies from Vertex Combination Additional Savings from Integration of TTS Business  Expected to achieve run-rate synergies by year end 2024  One-time costs of ~$20 million expected to be incurred over three years  Represents expected synergies and cost structure for TTS acquisition by Vertex  Expected to achieve run-rate savings by end of 2023, with one-time costs of ~$18 million to be incurred over three years Total Net Synergies of ~1% of Combined Sales2 1 Represents expected annual cost savings, partially phased in 2022 and 2023. Included in Vertex financial forecast. 2 Based on 2022E Pro Forma sales.


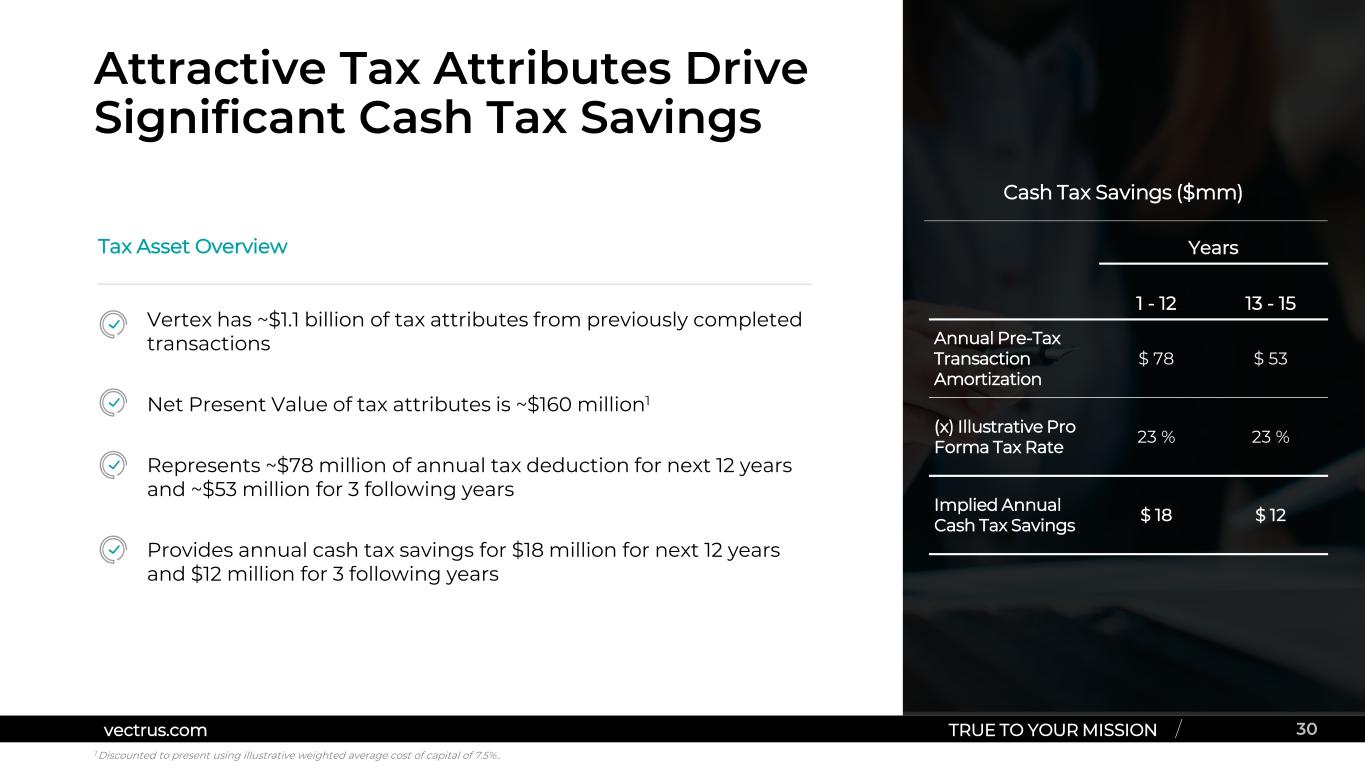
vectrus.com TRUE TO YOUR MISSION /vectrus.com TRUE TO YOUR MISSION / Attractive Tax Attributes Drive Significant Cash Tax Savings 30  Vertex has ~$1.1 billion of tax attributes from previously completed transactions  Net Present Value of tax attributes is ~$160 million1  Represents ~$78 million of annual tax deduction for next 12 years and ~$53 million for 3 following years  Provides annual cash tax savings for $18 million for next 12 years and $12 million for 3 following years Tax Asset Overview Cash Tax Savings ($mm) Years 1 - 12 13 - 15 Annual Pre-Tax Transaction Amortization $ 78 $ 53 (x) Illustrative Pro Forma Tax Rate 23 % 23 % Implied Annual Cash Tax Savings $ 18 $ 12 1 Discounted to present using illustrative weighted average cost of capital of 7.5%..


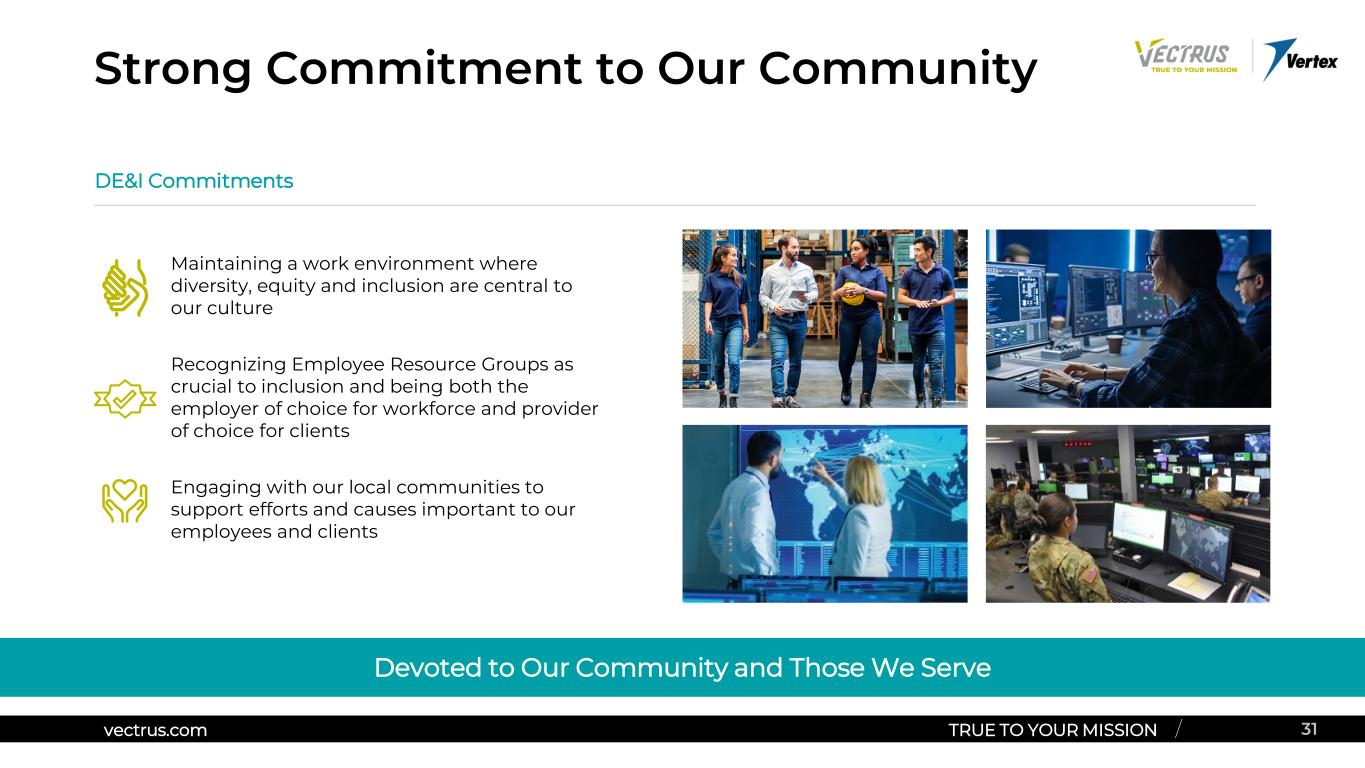
vectrus.com TRUE TO YOUR MISSION / Strong Commitment to Our Community 31vectrus.com TRUE TO YOUR MISSION / DE&I Commitments Devoted to Our Community and Those We Serve Maintaining a work environment where diversity, equity and inclusion are central to our culture Recognizing Employee Resource Groups as crucial to inclusion and being both the employer of choice for workforce and provider of choice for clients Engaging with our local communities to support efforts and causes important to our employees and clients


Reconciliation Of Non-GAAP Measures


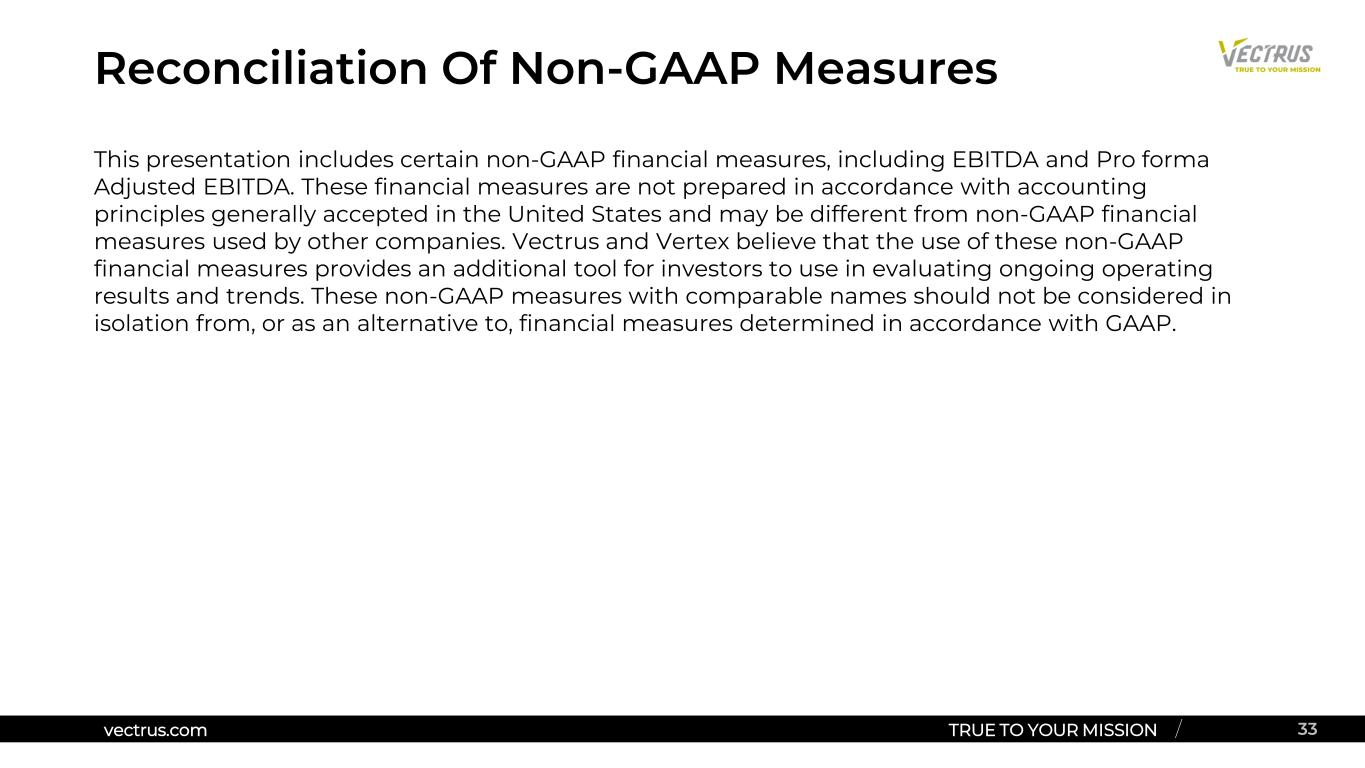
vectrus.com TRUE TO YOUR MISSION /vectrus.com TRUE TO YOUR MISSION / Reconciliation Of Non-GAAP Measures 33 This presentation includes certain non-GAAP financial measures, including EBITDA and Pro forma Adjusted EBITDA. These financial measures are not prepared in accordance with accounting principles generally accepted in the United States and may be different from non-GAAP financial measures used by other companies. Vectrus and Vertex believe that the use of these non-GAAP financial measures provides an additional tool for investors to use in evaluating ongoing operating results and trends. These non-GAAP measures with comparable names should not be considered in isolation from, or as an alternative to, financial measures determined in accordance with GAAP.


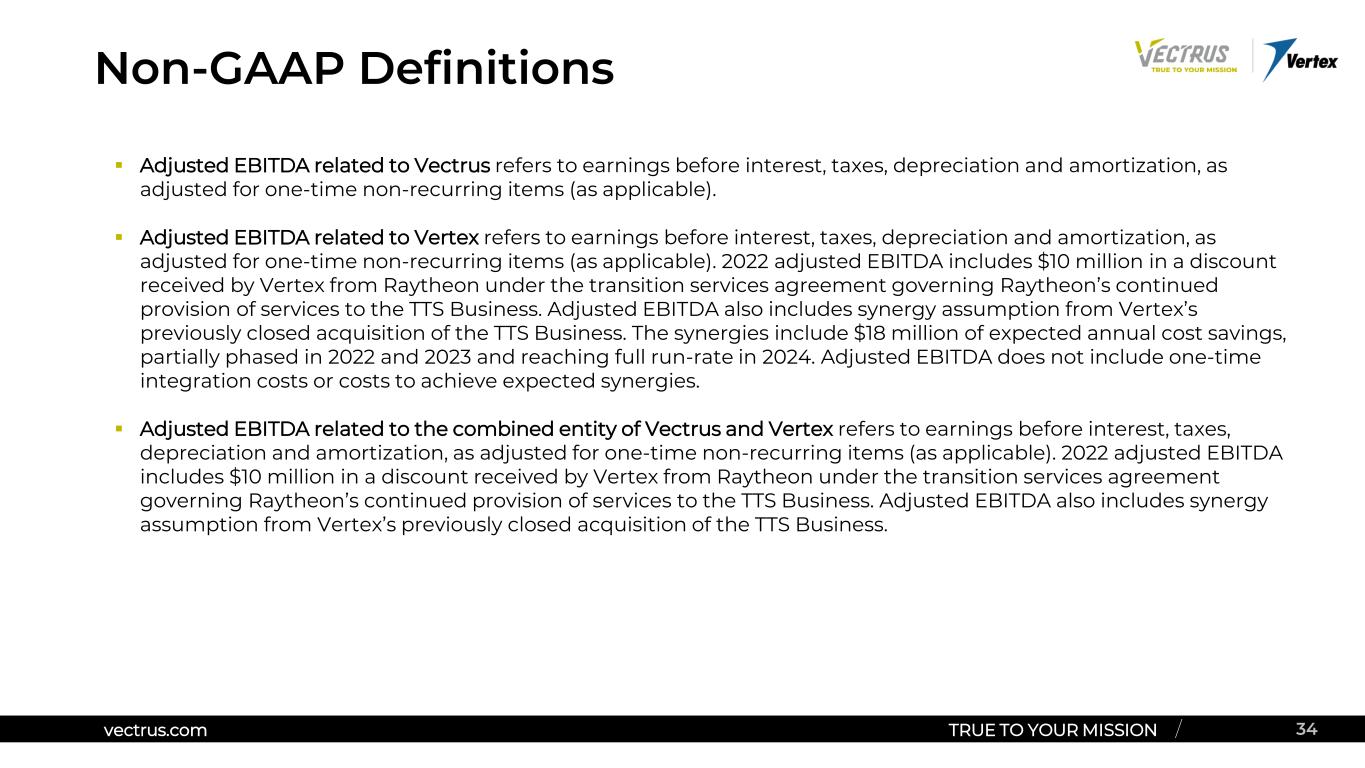
vectrus.com TRUE TO YOUR MISSION / Non-GAAP Definitions 34vectrus.com TRUE TO YOUR MISSION /  Adjusted EBITDA related to Vectrus refers to earnings before interest, taxes, depreciation and amortization, as adjusted for one-time non-recurring items (as applicable).  Adjusted EBITDA related to Vertex refers to earnings before interest, taxes, depreciation and amortization, as adjusted for one-time non-recurring items (as applicable). 2022 adjusted EBITDA includes $10 million in a discount received by Vertex from Raytheon under the transition services agreement governing Raytheon’s continued provision of services to the TTS Business. Adjusted EBITDA also includes synergy assumption from Vertex’s previously closed acquisition of the TTS Business. The synergies include $18 million of expected annual cost savings, partially phased in 2022 and 2023 and reaching full run-rate in 2024. Adjusted EBITDA does not include one-time integration costs or costs to achieve expected synergies.  Adjusted EBITDA related to the combined entity of Vectrus and Vertex refers to earnings before interest, taxes, depreciation and amortization, as adjusted for one-time non-recurring items (as applicable). 2022 adjusted EBITDA includes $10 million in a discount received by Vertex from Raytheon under the transition services agreement governing Raytheon’s continued provision of services to the TTS Business. Adjusted EBITDA also includes synergy assumption from Vertex’s previously closed acquisition of the TTS Business.


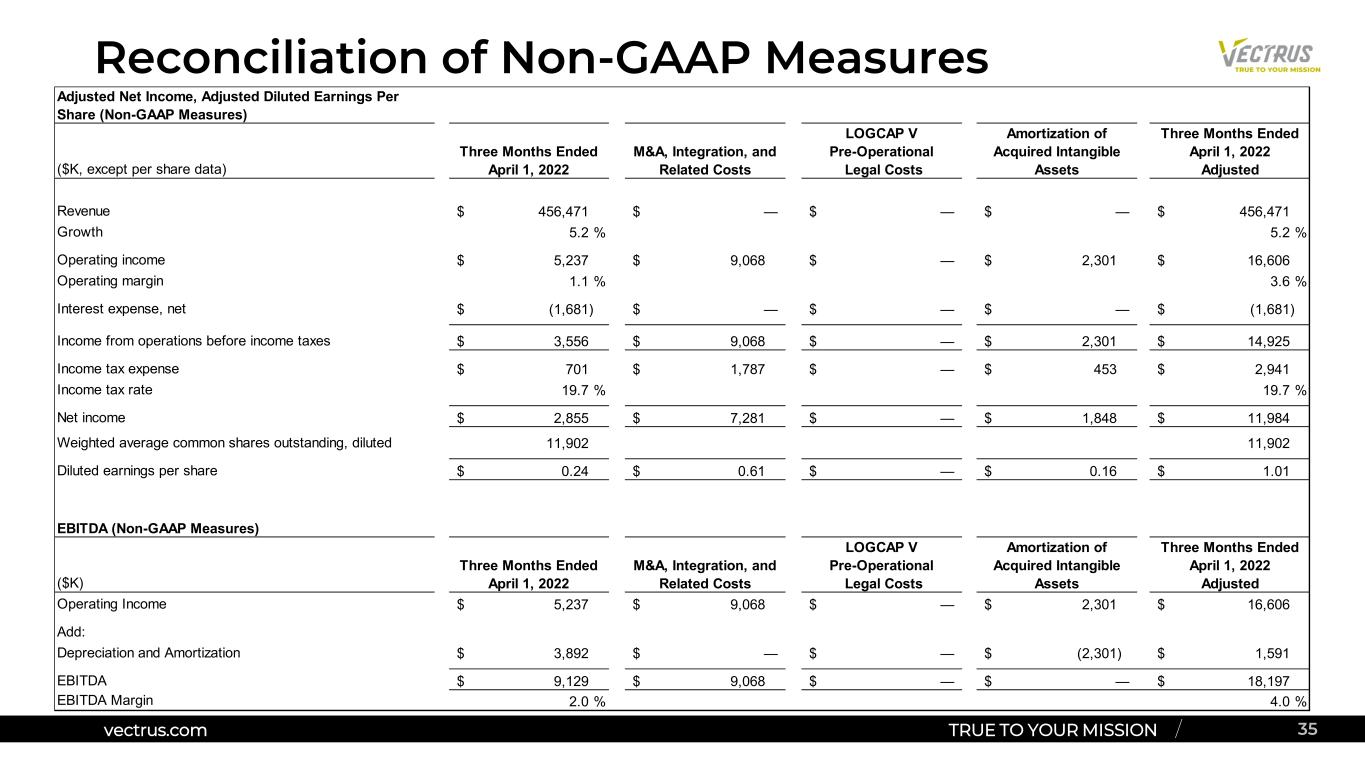
vectrus.com TRUE TO YOUR MISSION /vectrus.com TRUE TO YOUR MISSION / Reconciliation of Non-GAAP Measures 35 Adjusted Net Income, Adjusted Diluted Earnings Per Share (Non-GAAP Measures) ($K, except per share data) Three Months Ended April 1, 2022 M&A, Integration, and Related Costs LOGCAP V Pre-Operational Legal Costs Amortization of Acquired Intangible Assets Three Months Ended April 1, 2022 Adjusted Revenue 456,471$ —$ —$ —$ 456,471$ Growth 5.2 % 5.2 % Operating income 5,237$ 9,068$ —$ 2,301$ 16,606$ Operating margin 1.1 % 3.6 % Interest expense, net (1,681)$ —$ —$ —$ (1,681)$ Income from operations before income taxes 3,556$ 9,068$ —$ 2,301$ 14,925$ Income tax expense 701$ 1,787$ —$ 453$ 2,941$ Income tax rate 19.7 % 19.7 % Net income 2,855$ 7,281$ —$ 1,848$ 11,984$ Weighted average common shares outstanding, diluted 11,902 11,902 Diluted earnings per share 0.24$ 0.61$ —$ 0.16$ 1.01$ EBITDA (Non-GAAP Measures) ($K) Three Months Ended April 1, 2022 M&A, Integration, and Related Costs LOGCAP V Pre-Operational Legal Costs Amortization of Acquired Intangible Assets Three Months Ended April 1, 2022 Adjusted Operating Income 5,237$ 9,068$ —$ 2,301$ 16,606$ Add: Depreciation and Amortization 3,892$ —$ —$ (2,301)$ 1,591$ EBITDA 9,129$ 9,068$ —$ —$ 18,197$ EBITDA Margin 2.0 % 4.0 %


vectrus.com TRUE TO YOUR MISSION /vectrus.com TRUE TO YOUR MISSION / Reconciliation of Non-GAAP Measures 36 Adjusted Net Income, Adjusted Diluted Earnings Per Share (Non-GAAP Measures) ($K, except per share data) Three Months Ended April 2, 2021 M&A, Integration, and Related Costs LOGCAP V Pre-Operational Legal Costs Amortization of Acquired Intangible Assets Three Months Ended April 2, 2021 Adjusted Revenue 434,004$ —$ —$ —$ 434,004$ Operating income 16,533$ —$ 157$ 2,450$ 19,140$ Operating margin 3.8 % 4.4 % Interest expense, net (1,932)$ —$ —$ —$ (1,932)$ Income from operations before income taxes 14,601$ —$ 157$ 2,450$ 17,208$ Income tax expense (benefit) 2,553$ —$ 27$ 428$ 3,008$ Income tax rate 17.5 % 17.5 % Net income 12,048$ —$ 130$ 2,022$ 14,200$ Weighted average common shares outstanding, diluted 11,827 11,827 Diluted earnings per share 1.02$ —$ 0.01$ 0.17$ 1.20$ EBITDA (Non-GAAP Measures) ($K) Three Months Ended April 2, 2021 M&A, Integration, and Related Costs LOGCAP V Pre-Operational Legal Costs Amortization of Acquired Intangible Assets Three Months Ended April 2, 2021 Adjusted Operating Income 16,533$ —$ 157$ 2,450$ 19,140$ Add: Depreciation and Amortization 3,998$ —$ —$ (2,450)$ 1,548$ EBITDA 20,531$ —$ 157$ —$ 20,688$ EBITDA Margin 4.7 % 4.8 %