
1NASDAQ: WBTN Shareholder Letter WEBTOON Entertainment Q2 2026
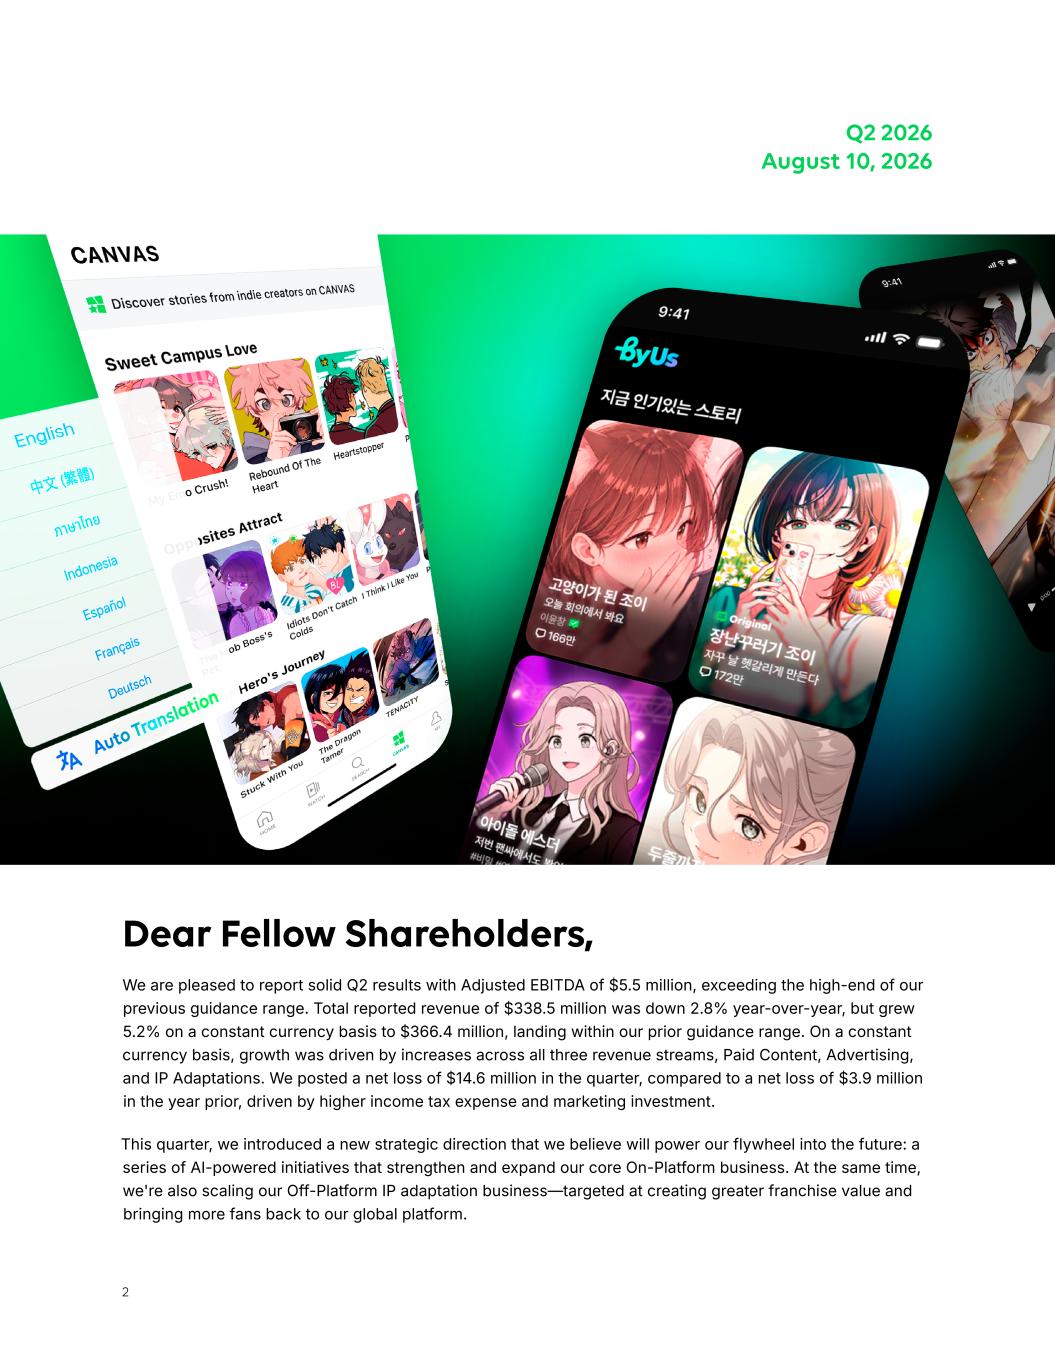
2 Dear Fellow Shareholders, We are pleased to report solid Q2 results with Adjusted EBITDA of $5.5 million, exceeding the high-end of our previous guidance range. Total reported revenue of $338.5 million was down 2.8% year-over-year, but grew 5.2% on a constant currency basis to $366.4 million, landing within our prior guidance range. On a constant currency basis, growth was driven by increases across all three revenue streams, Paid Content, Advertising, and IP Adaptations. We posted a net loss of $14.6 million in the quarter, compared to a net loss of $3.9 million in the year prior, driven by higher income tax expense and marketing investment. This quarter, we introduced a new strategic direction that we believe will power our flywheel into the future: a series of AI-powered initiatives that strengthen and expand our core On-Platform business. At the same time, we're also scaling our Off-Platform IP adaptation business—targeted at creating greater franchise value and bringing more fans back to our global platform. Q2 2026 August 10, 2026
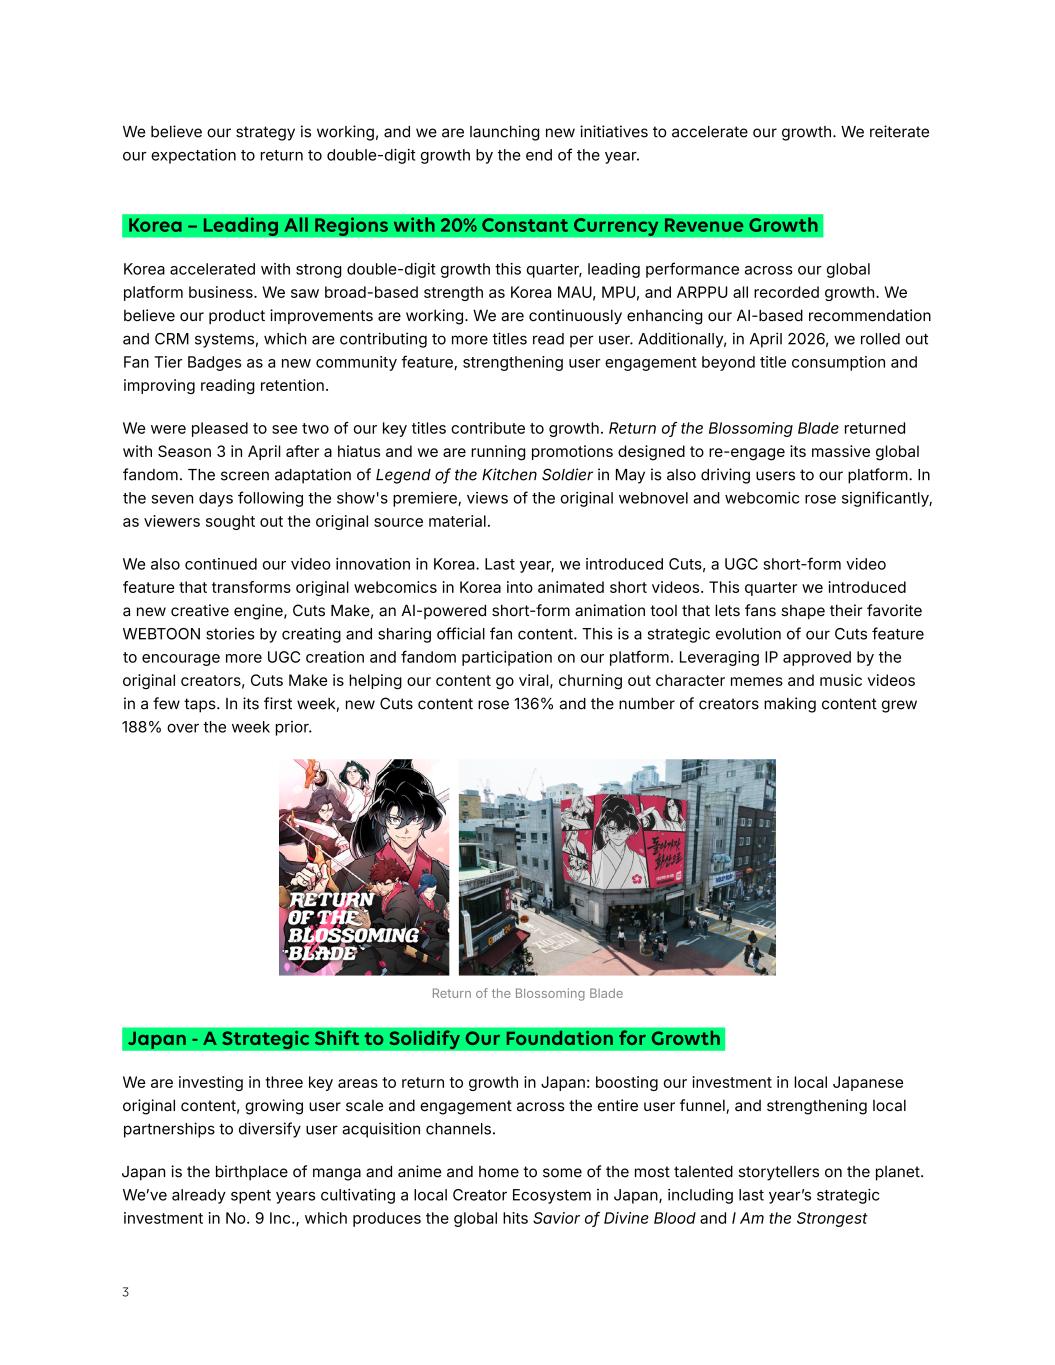
3 Korea accelerated with strong double-digit growth this quarter, leading performance across our global platform business. We saw broad-based strength as Korea MAU, MPU, and ARPPU all recorded growth. We believe our product improvements are working. We are continuously enhancing our AI-based recommendation and CRM systems, which are contributing to more titles read per user. Additionally, in April 2026, we rolled out Fan Tier Badges as a new community feature, strengthening user engagement beyond title consumption and improving reading retention. We were pleased to see two of our key titles contribute to growth. Return of the Blossoming Blade returned with Season 3 in April after a hiatus and we are running promotions designed to re-engage its massive global fandom. The screen adaptation of Legend of the Kitchen Soldier in May is also driving users to our platform. In the seven days following the show's premiere, views of the original webnovel and webcomic rose significantly, as viewers sought out the original source material. We also continued our video innovation in Korea. Last year, we introduced Cuts, a UGC short-form video feature that transforms original webcomics in Korea into animated short videos. This quarter we introduced a new creative engine, Cuts Make, an AI-powered short-form animation tool that lets fans shape their favorite WEBTOON stories by creating and sharing official fan content. This is a strategic evolution of our Cuts feature to encourage more UGC creation and fandom participation on our platform. Leveraging IP approved by the original creators, Cuts Make is helping our content go viral, churning out character memes and music videos in a few taps. In its first week, new Cuts content rose 136% and the number of creators making content grew 188% over the week prior. Korea – Leading All Regions with 20% Constant Currency Revenue Growth We are investing in three key areas to return to growth in Japan: boosting our investment in local Japanese original content, growing user scale and engagement across the entire user funnel, and strengthening local partnerships to diversify user acquisition channels. Japan is the birthplace of manga and anime and home to some of the most talented storytellers on the planet. We’ve already spent years cultivating a local Creator Ecosystem in Japan, including last year’s strategic investment in No. 9 Inc., which produces the global hits Savior of Divine Blood and I Am the Strongest Japan - A Strategic Shift to Solidify Our Foundation for Growth We believe our strategy is working, and we are launching new initiatives to accelerate our growth. We reiterate our expectation to return to double-digit growth by the end of the year. Return of the Blossoming Blade
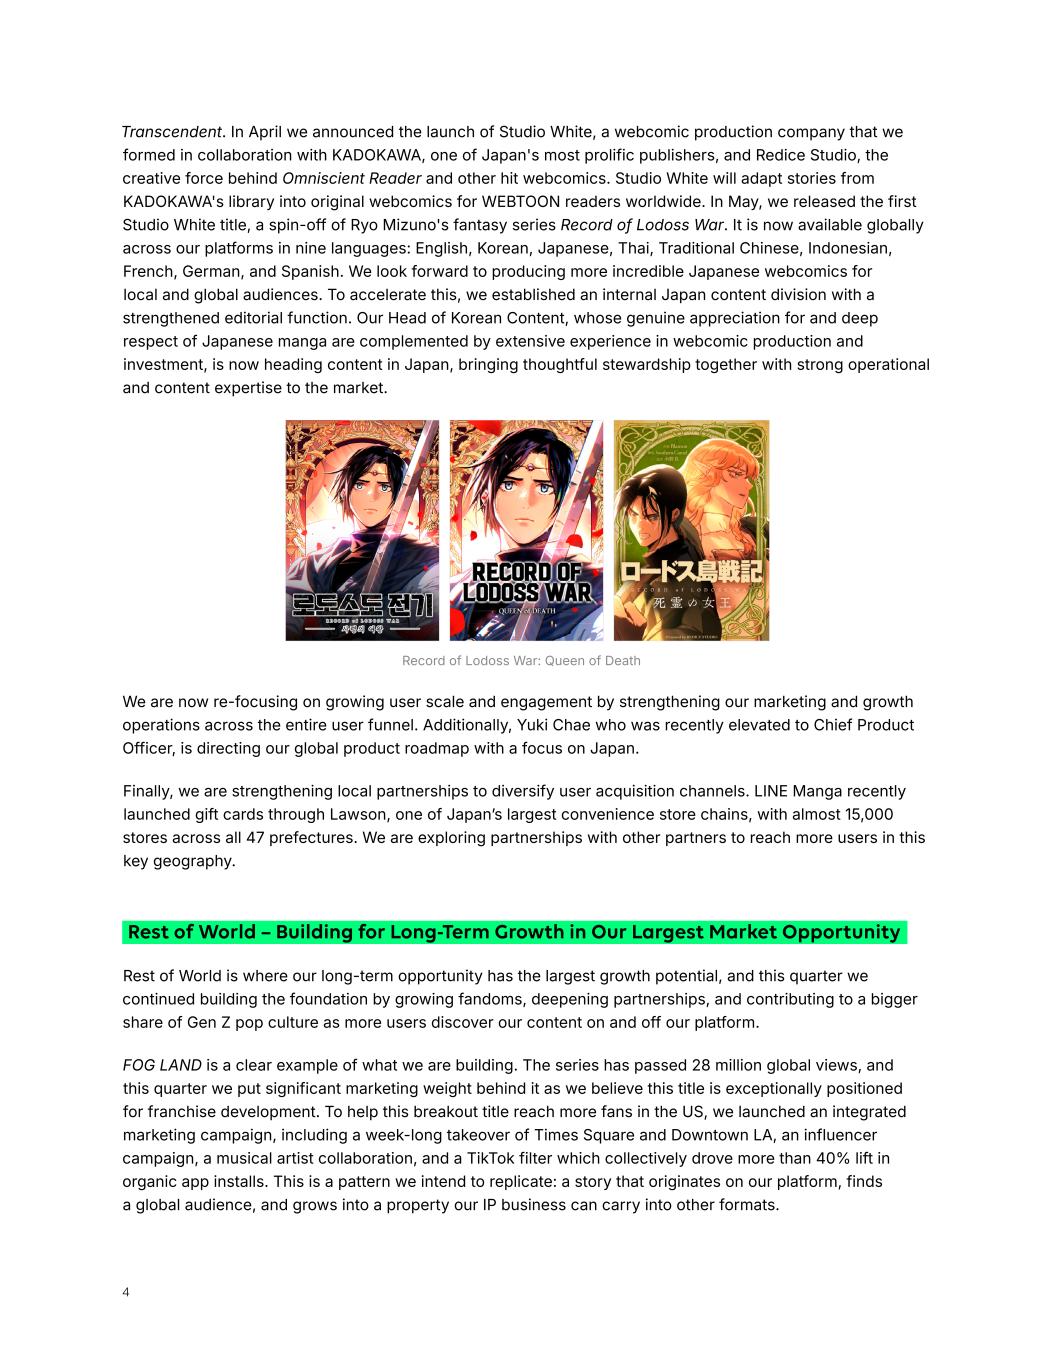
4 Transcendent. In April we announced the launch of Studio White, a webcomic production company that we formed in collaboration with KADOKAWA, one of Japan's most prolific publishers, and Redice Studio, the creative force behind Omniscient Reader and other hit webcomics. Studio White will adapt stories from KADOKAWA's library into original webcomics for WEBTOON readers worldwide. In May, we released the first Studio White title, a spin-off of Ryo Mizuno's fantasy series Record of Lodoss War. It is now available globally across our platforms in nine languages: English, Korean, Japanese, Thai, Traditional Chinese, Indonesian, French, German, and Spanish. We look forward to producing more incredible Japanese webcomics for local and global audiences. To accelerate this, we established an internal Japan content division with a strengthened editorial function. Our Head of Korean Content, whose genuine appreciation for and deep respect of Japanese manga are complemented by extensive experience in webcomic production and investment, is now heading content in Japan, bringing thoughtful stewardship together with strong operational and content expertise to the market. Record of Lodoss War: Queen of Death We are now re-focusing on growing user scale and engagement by strengthening our marketing and growth operations across the entire user funnel. Additionally, Yuki Chae who was recently elevated to Chief Product Officer, is directing our global product roadmap with a focus on Japan. Finally, we are strengthening local partnerships to diversify user acquisition channels. LINE Manga recently launched gift cards through Lawson, one of Japan’s largest convenience store chains, with almost 15,000 stores across all 47 prefectures. We are exploring partnerships with other partners to reach more users in this key geography. Rest of World – Building for Long-Term Growth in Our Largest Market Opportunity Rest of World is where our long-term opportunity has the largest growth potential, and this quarter we continued building the foundation by growing fandoms, deepening partnerships, and contributing to a bigger share of Gen Z pop culture as more users discover our content on and off our platform. FOG LAND is a clear example of what we are building. The series has passed 28 million global views, and this quarter we put significant marketing weight behind it as we believe this title is exceptionally positioned for franchise development. To help this breakout title reach more fans in the US, we launched an integrated marketing campaign, including a week-long takeover of Times Square and Downtown LA, an influencer campaign, a musical artist collaboration, and a TikTok filter which collectively drove more than 40% lift in organic app installs. This is a pattern we intend to replicate: a story that originates on our platform, finds a global audience, and grows into a property our IP business can carry into other formats.
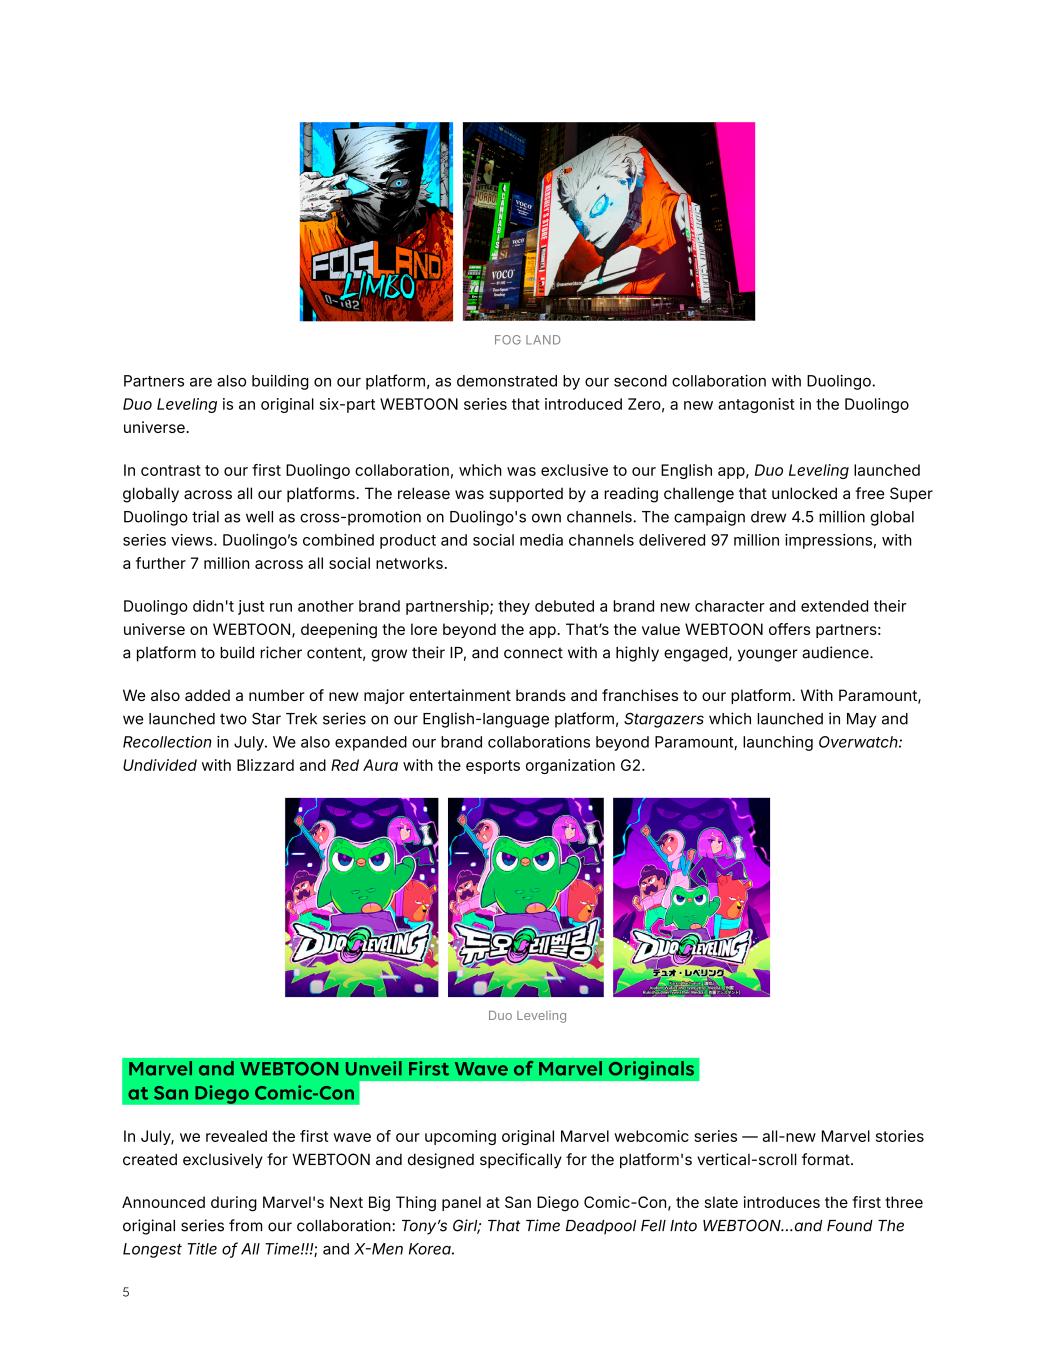
5 Partners are also building on our platform, as demonstrated by our second collaboration with Duolingo. Duo Leveling is an original six-part WEBTOON series that introduced Zero, a new antagonist in the Duolingo universe. In contrast to our first Duolingo collaboration, which was exclusive to our English app, Duo Leveling launched globally across all our platforms. The release was supported by a reading challenge that unlocked a free Super Duolingo trial as well as cross-promotion on Duolingo's own channels. The campaign drew 4.5 million global series views. Duolingo’s combined product and social media channels delivered 97 million impressions, with a further 7 million across all social networks. Duolingo didn't just run another brand partnership; they debuted a brand new character and extended their universe on WEBTOON, deepening the lore beyond the app. That’s the value WEBTOON offers partners: a platform to build richer content, grow their IP, and connect with a highly engaged, younger audience. We also added a number of new major entertainment brands and franchises to our platform. With Paramount, we launched two Star Trek series on our English-language platform, Stargazers which launched in May and Recollection in July. We also expanded our brand collaborations beyond Paramount, launching Overwatch: Undivided with Blizzard and Red Aura with the esports organization G2. Duo Leveling FOG LAND Marvel and WEBTOON Unveil First Wave of Marvel Originals at San Diego Comic-Con In July, we revealed the first wave of our upcoming original Marvel webcomic series — all-new Marvel stories created exclusively for WEBTOON and designed specifically for the platform's vertical-scroll format. Announced during Marvel's Next Big Thing panel at San Diego Comic-Con, the slate introduces the first three original series from our collaboration: Tony’s Girl; That Time Deadpool Fell Into WEBTOON...and Found The Longest Title of All Time!!!; and X-Men Korea.
6 Strengthening Our Flywheel WEBTOON's vision is to be the world's storytelling technology platform—empowering creation by anyone, for everyone. Our business has two sides. At the core of our On-Platform business is a continuous content pipeline for discovering original IP—which fuels our Off-Platform IP Adaptation business. The two sides work as dual engines. Our platform produces a steady stream of hits with built-in fandoms, and every adaptation starts from a story that has already proven itself. This quarter we strengthened both sides of our flywheel. On our platform, we are taking advantage of AI technology to advance across recommendation, CRM systems, and translations, with the goal of improving discovery, deepening retention, and breaking down language barriers. We are also introducing new products to give fans tools to create and take part in the stories they love. Tony's Girl DeadpoolX-Men KOREA These titles feature some of the biggest superheroes in comics, developed by an exciting lineup of WEBTOON creators, bringing fans new stories and characters from across Marvel that can only be found on WEBTOON. This announcement builds on the ongoing collaboration between Marvel and WEBTOON, which has already brought over 20 fan-favorite comics to our vertical-scroll format, all available in the dedicated Disney section of the English-language WEBTOON app. Additional details and release timing for each series will be announced at a later date.
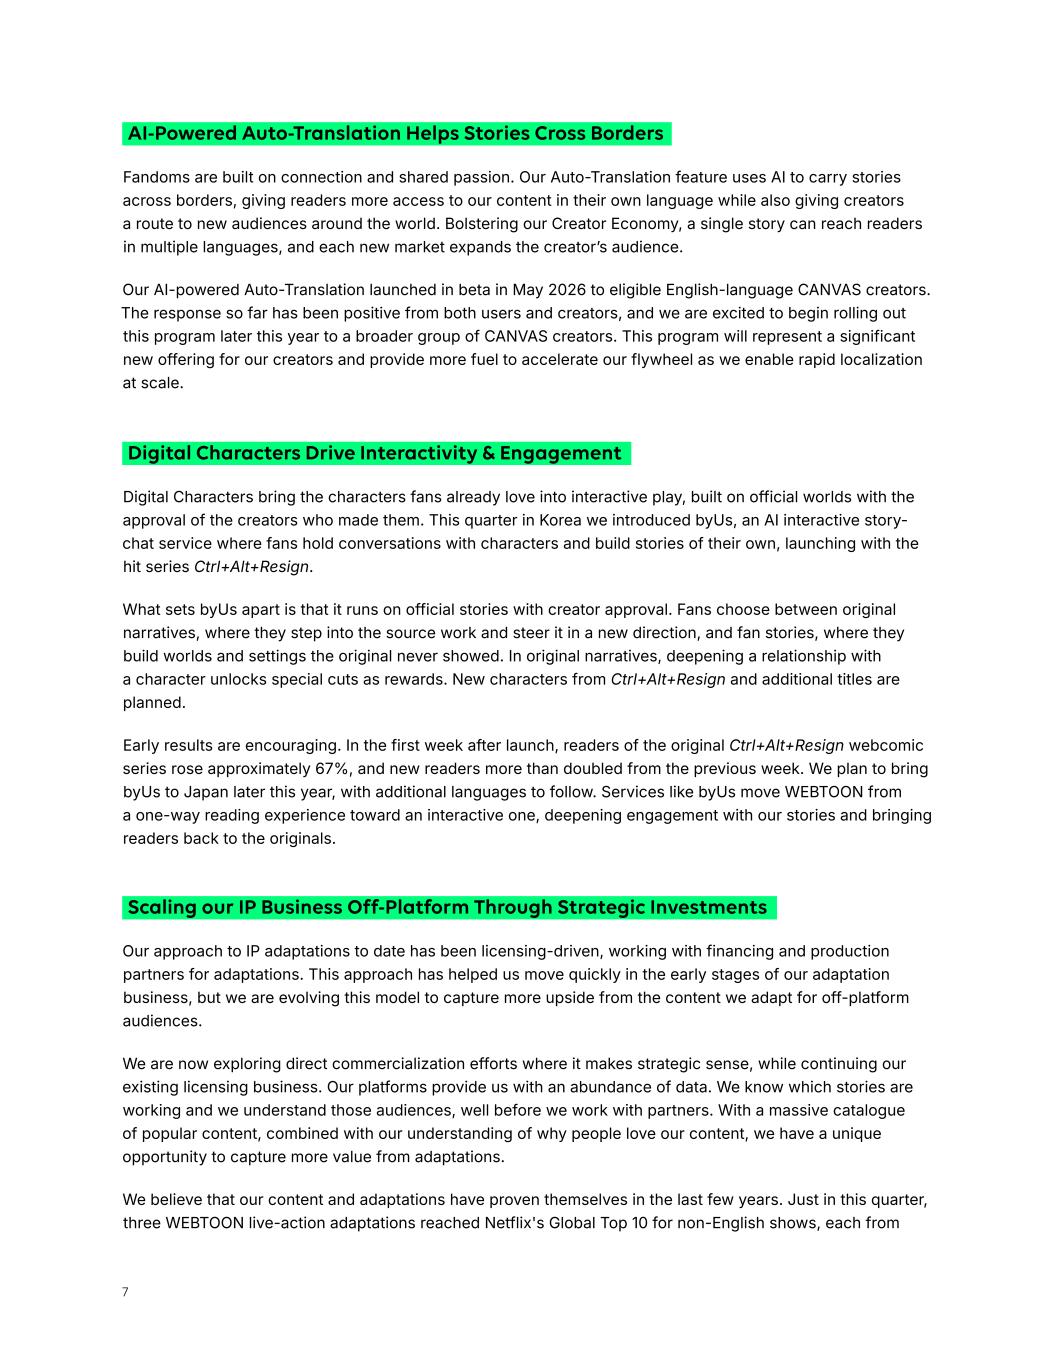
7 Digital Characters Drive Interactivity & Engagement Digital Characters bring the characters fans already love into interactive play, built on official worlds with the approval of the creators who made them. This quarter in Korea we introduced byUs, an AI interactive story- chat service where fans hold conversations with characters and build stories of their own, launching with the hit series Ctrl+Alt+Resign. What sets byUs apart is that it runs on official stories with creator approval. Fans choose between original narratives, where they step into the source work and steer it in a new direction, and fan stories, where they build worlds and settings the original never showed. In original narratives, deepening a relationship with a character unlocks special cuts as rewards. New characters from Ctrl+Alt+Resign and additional titles are planned. Early results are encouraging. In the first week after launch, readers of the original Ctrl+Alt+Resign webcomic series rose approximately 67%, and new readers more than doubled from the previous week. We plan to bring byUs to Japan later this year, with additional languages to follow. Services like byUs move WEBTOON from a one-way reading experience toward an interactive one, deepening engagement with our stories and bringing readers back to the originals. Scaling our IP Business Off-Platform Through Strategic Investments Our approach to IP adaptations to date has been licensing-driven, working with financing and production partners for adaptations. This approach has helped us move quickly in the early stages of our adaptation business, but we are evolving this model to capture more upside from the content we adapt for off-platform audiences. We are now exploring direct commercialization efforts where it makes strategic sense, while continuing our existing licensing business. Our platforms provide us with an abundance of data. We know which stories are working and we understand those audiences, well before we work with partners. With a massive catalogue of popular content, combined with our understanding of why people love our content, we have a unique opportunity to capture more value from adaptations. We believe that our content and adaptations have proven themselves in the last few years. Just in this quarter, three WEBTOON live-action adaptations reached Netflix's Global Top 10 for non-English shows, each from Fandoms are built on connection and shared passion. Our Auto-Translation feature uses AI to carry stories across borders, giving readers more access to our content in their own language while also giving creators a route to new audiences around the world. Bolstering our Creator Economy, a single story can reach readers in multiple languages, and each new market expands the creator’s audience. Our AI-powered Auto-Translation launched in beta in May 2026 to eligible English-language CANVAS creators. The response so far has been positive from both users and creators, and we are excited to begin rolling out this program later this year to a broader group of CANVAS creators. This program will represent a significant new offering for our creators and provide more fuel to accelerate our flywheel as we enable rapid localization at scale. AI-Powered Auto-Translation Helps Stories Cross Borders
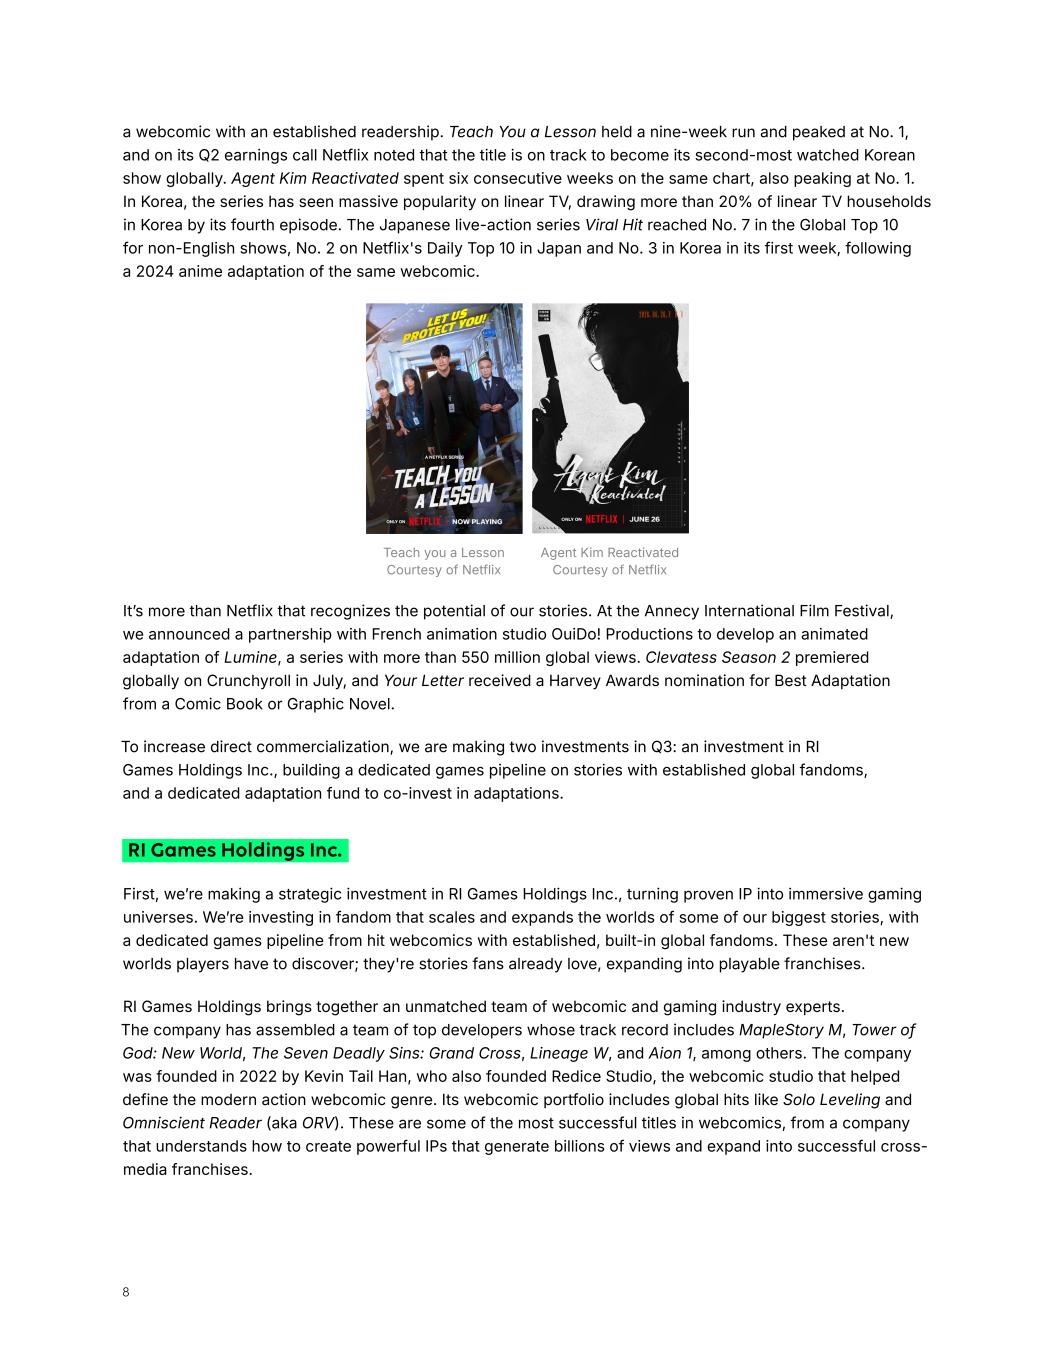
8 Teach you a Lesson Courtesy of Netflix Agent Kim Reactivated Courtesy of Netflix It’s more than Netflix that recognizes the potential of our stories. At the Annecy International Film Festival, we announced a partnership with French animation studio OuiDo! Productions to develop an animated adaptation of Lumine, a series with more than 550 million global views. Clevatess Season 2 premiered globally on Crunchyroll in July, and Your Letter received a Harvey Awards nomination for Best Adaptation from a Comic Book or Graphic Novel. To increase direct commercialization, we are making two investments in Q3: an investment in RI Games Holdings Inc., building a dedicated games pipeline on stories with established global fandoms, and a dedicated adaptation fund to co-invest in adaptations. RI Games Holdings Inc. First, we’re making a strategic investment in RI Games Holdings Inc., turning proven IP into immersive gaming universes. We’re investing in fandom that scales and expands the worlds of some of our biggest stories, with a dedicated games pipeline from hit webcomics with established, built-in global fandoms. These aren't new worlds players have to discover; they're stories fans already love, expanding into playable franchises. RI Games Holdings brings together an unmatched team of webcomic and gaming industry experts. The company has assembled a team of top developers whose track record includes MapleStory M, Tower of God: New World, The Seven Deadly Sins: Grand Cross, Lineage W, and Aion 1, among others. The company was founded in 2022 by Kevin Tail Han, who also founded Redice Studio, the webcomic studio that helped define the modern action webcomic genre. Its webcomic portfolio includes global hits like Solo Leveling and Omniscient Reader (aka ORV). These are some of the most successful titles in webcomics, from a company that understands how to create powerful IPs that generate billions of views and expand into successful cross- media franchises. a webcomic with an established readership. Teach You a Lesson held a nine-week run and peaked at No. 1, and on its Q2 earnings call Netflix noted that the title is on track to become its second-most watched Korean show globally. Agent Kim Reactivated spent six consecutive weeks on the same chart, also peaking at No. 1. In Korea, the series has seen massive popularity on linear TV, drawing more than 20% of linear TV households in Korea by its fourth episode. The Japanese live-action series Viral Hit reached No. 7 in the Global Top 10 for non-English shows, No. 2 on Netflix's Daily Top 10 in Japan and No. 3 in Korea in its first week, following a 2024 anime adaptation of the same webcomic.
9 NAVER × WEBTOON IP Adaptation Fund Alongside our in-house games pipeline, we’re also investing in our adaptation business with a new webcomic adaptation fund to drive more value from our franchise expansion projects across animation, live-action, games and more. Together with NAVER, we are establishing a $100 million IP Adaptation fund. Historically, our ability to capture value from massive global hits was limited because we relied heavily on a licensing-driven approach. This joint fund provides a dedicated pool of capital specifically for producing global screen hits. By co-investing through this fund, we’re evolving beyond licensing to secure stronger IP rights, gain greater control over our growing adaptation slate, and capture significantly more financial upside from successful franchises. Our investment reflects our conviction in the long-term value of these projects and aligns our capital with our strongest IP. Direct participation also gives us greater oversight over adaptations, enabling us to leverage our content expertise and audience insights to deliver high-quality adaptations that reach global audiences. Unlike many others in this space, we start with a proven pipeline from day one. Together, WEBTOON and RI Games Holdings plan to develop and launch multiple games over the next four years, based on proven IP with an established global fan base. The slate includes games based on the hit series Overgeared (1.3B global views), Doom Breaker (590M global views), and WEBTOON sensation Omniscient Reader (aka ORV, 3.05B global views). Each title is part of a broader franchise strategy, with planned anime adaptations helping extend these stories and engage wider audiences: from webcomic to animation and game. Leading the lineup is a new action MMORPG based on Overgeared, scheduled for a global launch later this year. Developed by GrayGames and published by NEXON, the game is planned to launch alongside an anime adaptation, which premieres in October 2026. Together, the releases will drive a coordinated cross-media expansion designed to broaden the franchise’s global reach and give fans new ways to experience the world of Overgeared. Games are one of the most engaged forms of fandom, pulling fans deep into a story universe unlike any other format. This investment deepens engagement with our IP and grows its global audience, extending the value from stories on our platform. Fans smoothly flow from our adaptations back to the original stories on WEBTOON. Each format expands the audience for the whole IP. The formula underpinning our strategy does not stop at games. We’re building an adaptation pipeline that can extend a single IP across formats, creating a repeatable success formula of adaptations that flow from webcomics on our platform, to animation, and games.

10 Junkoo Kim Founder & CEO, WEBTOON Entertainment Inc. In Closing This quarter we made significant moves to accelerate our business, with AI-powered platform innovations to support engagement and significant investments to expand our off-platform IP adaptation business. We’re evolving our on-platform experience, expanding into interactive fandom and participation, and accelerating our off-platform IP business, to enable the full franchise value from each IP. I would like to express my sincerest thanks to our teammates, content creators, as well as our users who come to our platform daily. Thank you for your continued support of our company and the joy that storytelling brings,
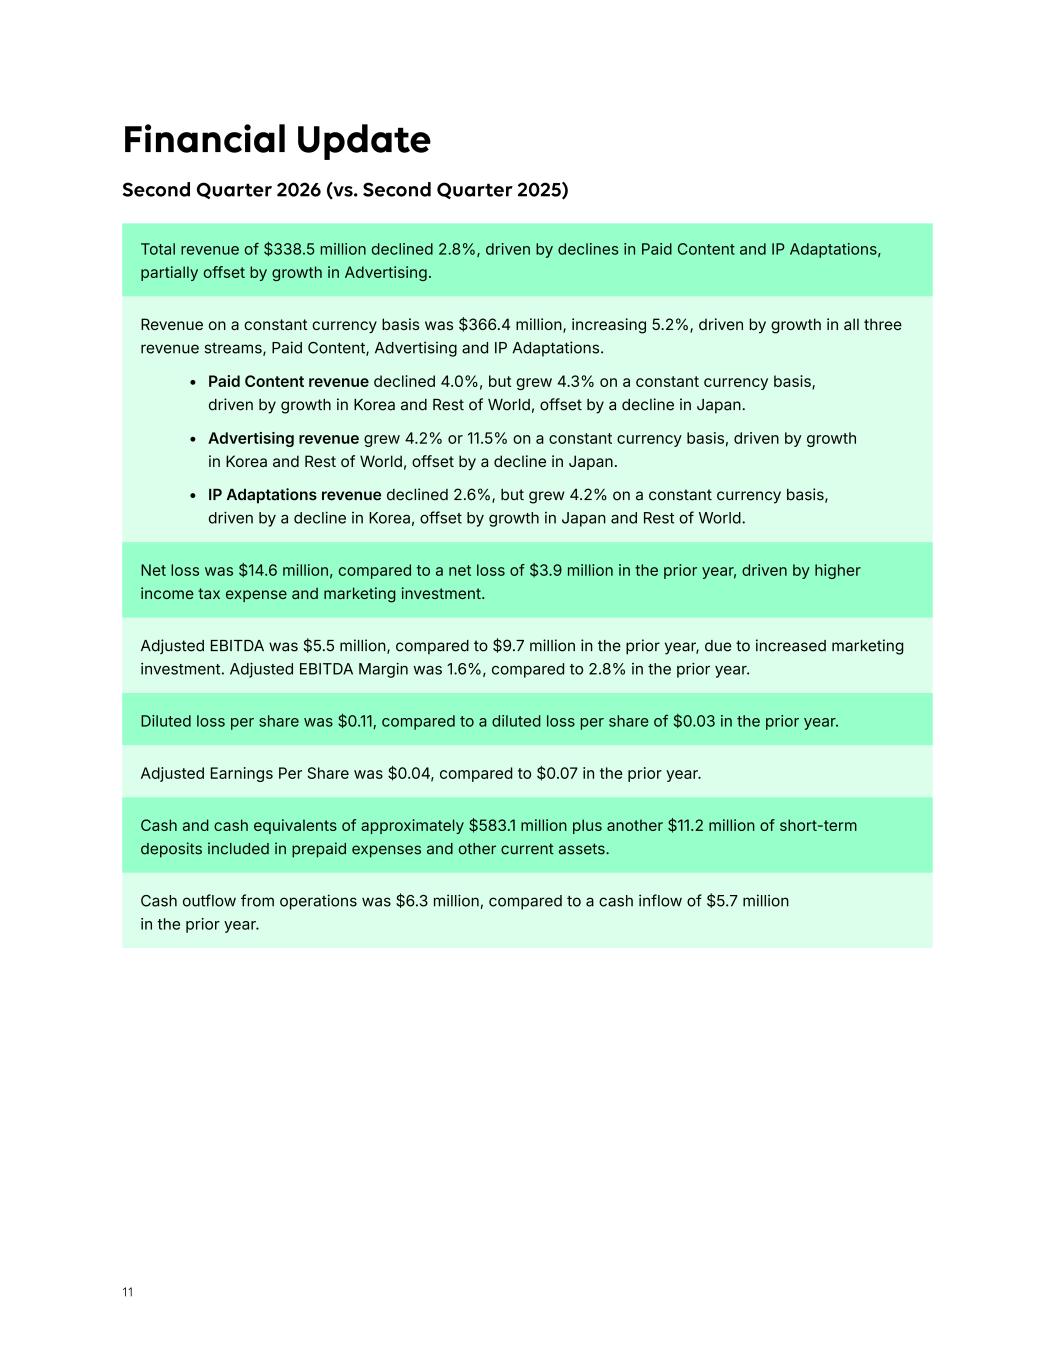
11 Adjusted EBITDA was $5.5 million, compared to $9.7 million in the prior year, due to increased marketing investment. Adjusted EBITDA Margin was 1.6%, compared to 2.8% in the prior year. Cash outflow from operations was $6.3 million, compared to a cash inflow of $5.7 million in the prior year. Net loss was $14.6 million, compared to a net loss of $3.9 million in the prior year, driven by higher income tax expense and marketing investment. Total revenue of $338.5 million declined 2.8%, driven by declines in Paid Content and IP Adaptations, partially offset by growth in Advertising. Diluted loss per share was $0.11, compared to a diluted loss per share of $0.03 in the prior year. Adjusted Earnings Per Share was $0.04, compared to $0.07 in the prior year. Cash and cash equivalents of approximately $583.1 million plus another $11.2 million of short-term deposits included in prepaid expenses and other current assets. Revenue on a constant currency basis was $366.4 million, increasing 5.2%, driven by growth in all three revenue streams, Paid Content, Advertising and IP Adaptations. • Paid Content revenue declined 4.0%, but grew 4.3% on a constant currency basis, driven by growth in Korea and Rest of World, offset by a decline in Japan. • Advertising revenue grew 4.2% or 11.5% on a constant currency basis, driven by growth in Korea and Rest of World, offset by a decline in Japan. • IP Adaptations revenue declined 2.6%, but grew 4.2% on a constant currency basis, driven by a decline in Korea, offset by growth in Japan and Rest of World. Financial Update Second Quarter 2026 (vs. Second Quarter 2025)
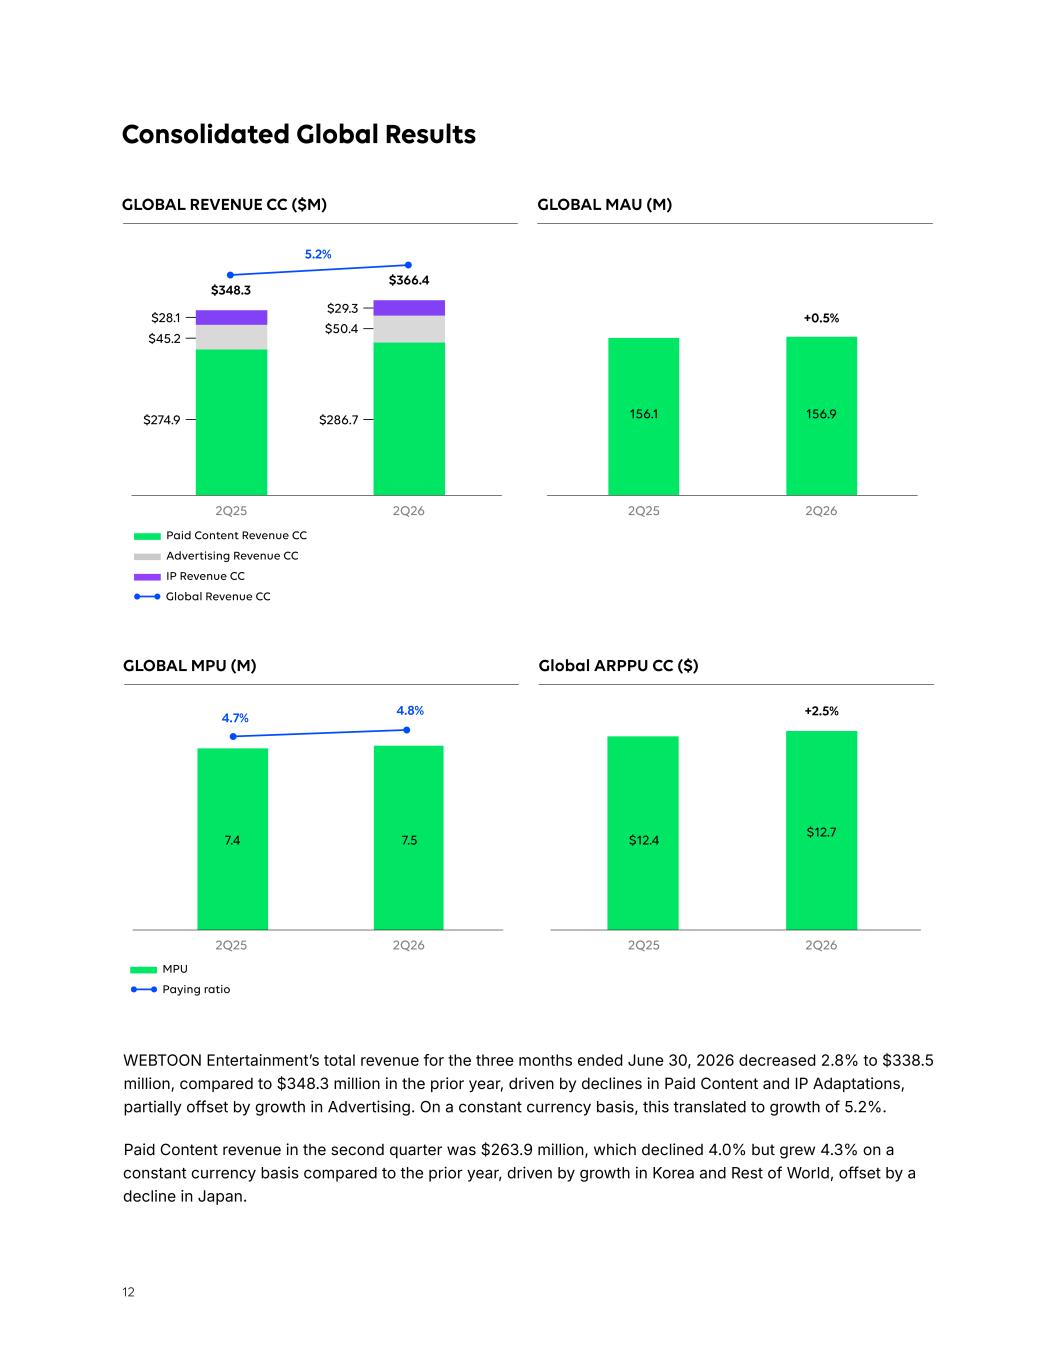
12 Consolidated Global Results GLOBAL REVENUE CC ($M) GLOBAL MPU (M) GLOBAL MAU (M) Global ARPPU CC ($) Paid Content Revenue CC $28.1 $29.3 2Q25 2Q25 2Q25 2Q25 2Q26 2Q26 2Q26 2Q26 $45.2 $50.4 $274.9 $286.7 Advertising Revenue CC IP Revenue CC MPU Paying ratio +0.5% $366.4 $348.3 5.2% +2.5% WEBTOON Entertainment’s total revenue for the three months ended June 30, 2026 decreased 2.8% to $338.5 million, compared to $348.3 million in the prior year, driven by declines in Paid Content and IP Adaptations, partially offset by growth in Advertising. On a constant currency basis, this translated to growth of 5.2%. Paid Content revenue in the second quarter was $263.9 million, which declined 4.0% but grew 4.3% on a constant currency basis compared to the prior year, driven by growth in Korea and Rest of World, offset by a decline in Japan. 4.7% 4.8% Global Revenue CC 156.1 156.9 7.4 7.5 $12.4 $12.7
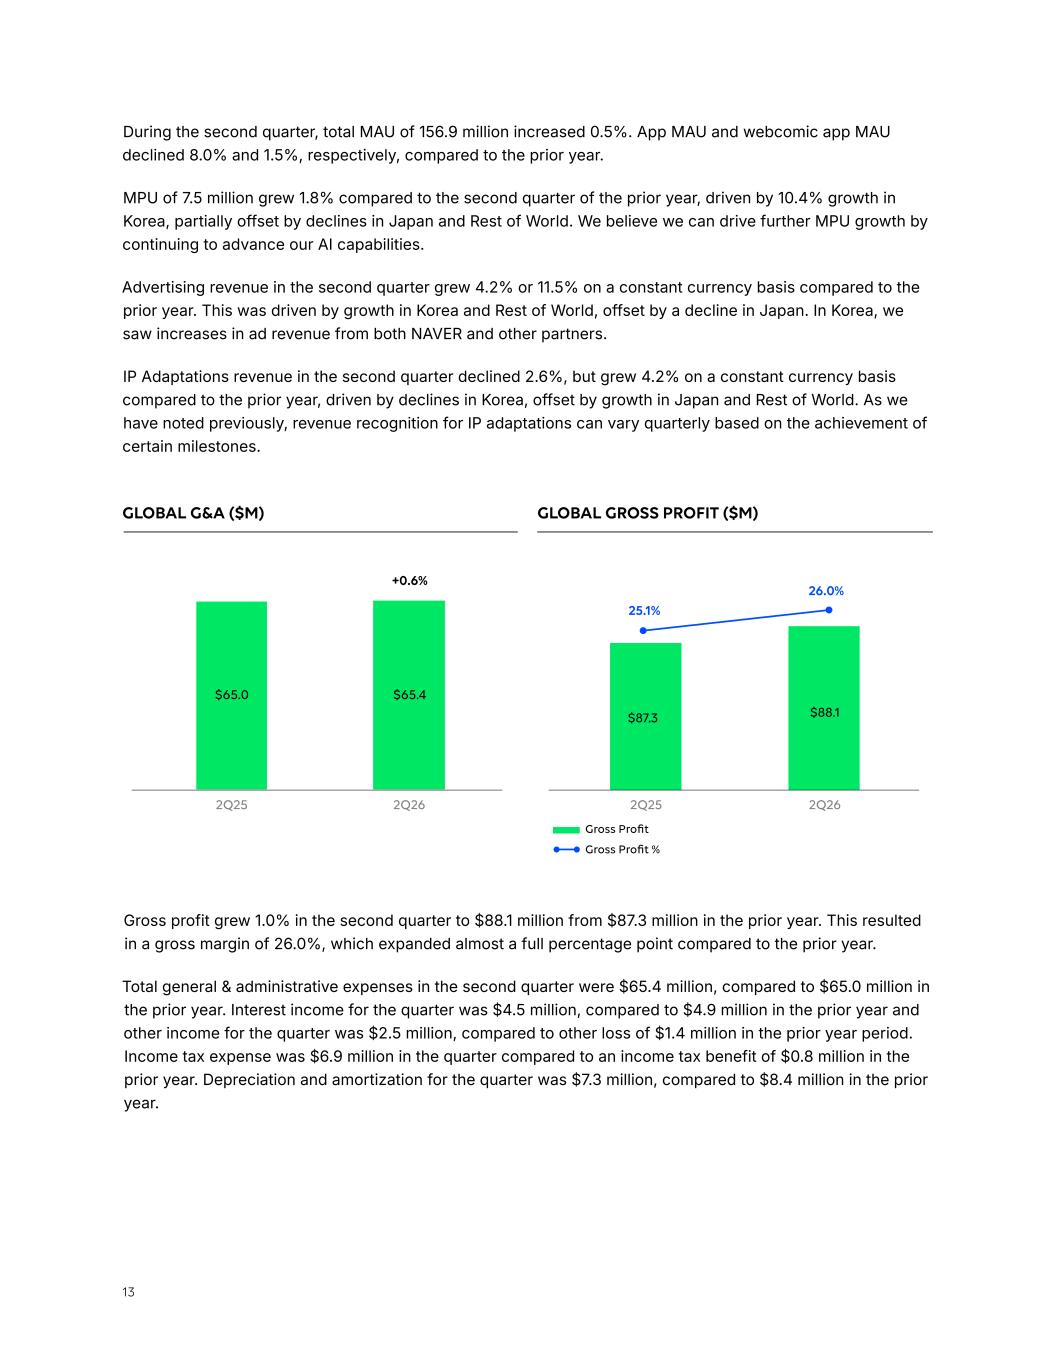
13 During the second quarter, total MAU of 156.9 million increased 0.5%. App MAU and webcomic app MAU declined 8.0% and 1.5%, respectively, compared to the prior year. MPU of 7.5 million grew 1.8% compared to the second quarter of the prior year, driven by 10.4% growth in Korea, partially offset by declines in Japan and Rest of World. We believe we can drive further MPU growth by continuing to advance our AI capabilities. Advertising revenue in the second quarter grew 4.2% or 11.5% on a constant currency basis compared to the prior year. This was driven by growth in Korea and Rest of World, offset by a decline in Japan. In Korea, we saw increases in ad revenue from both NAVER and other partners. IP Adaptations revenue in the second quarter declined 2.6%, but grew 4.2% on a constant currency basis compared to the prior year, driven by declines in Korea, offset by growth in Japan and Rest of World. As we have noted previously, revenue recognition for IP adaptations can vary quarterly based on the achievement of certain milestones. Gross Profit Gross Profit % +0.6% 25.1% 26.0% GLOBAL G&A ($M) GLOBAL GROSS PROFIT ($M) Gross profit grew 1.0% in the second quarter to $88.1 million from $87.3 million in the prior year. This resulted in a gross margin of 26.0%, which expanded almost a full percentage point compared to the prior year. Total general & administrative expenses in the second quarter were $65.4 million, compared to $65.0 million in the prior year. Interest income for the quarter was $4.5 million, compared to $4.9 million in the prior year and other income for the quarter was $2.5 million, compared to other loss of $1.4 million in the prior year period. Income tax expense was $6.9 million in the quarter compared to an income tax benefit of $0.8 million in the prior year. Depreciation and amortization for the quarter was $7.3 million, compared to $8.4 million in the prior year. 2Q25 2Q252Q26 2Q26 $65.0 $87.3 $65.4 $88.1
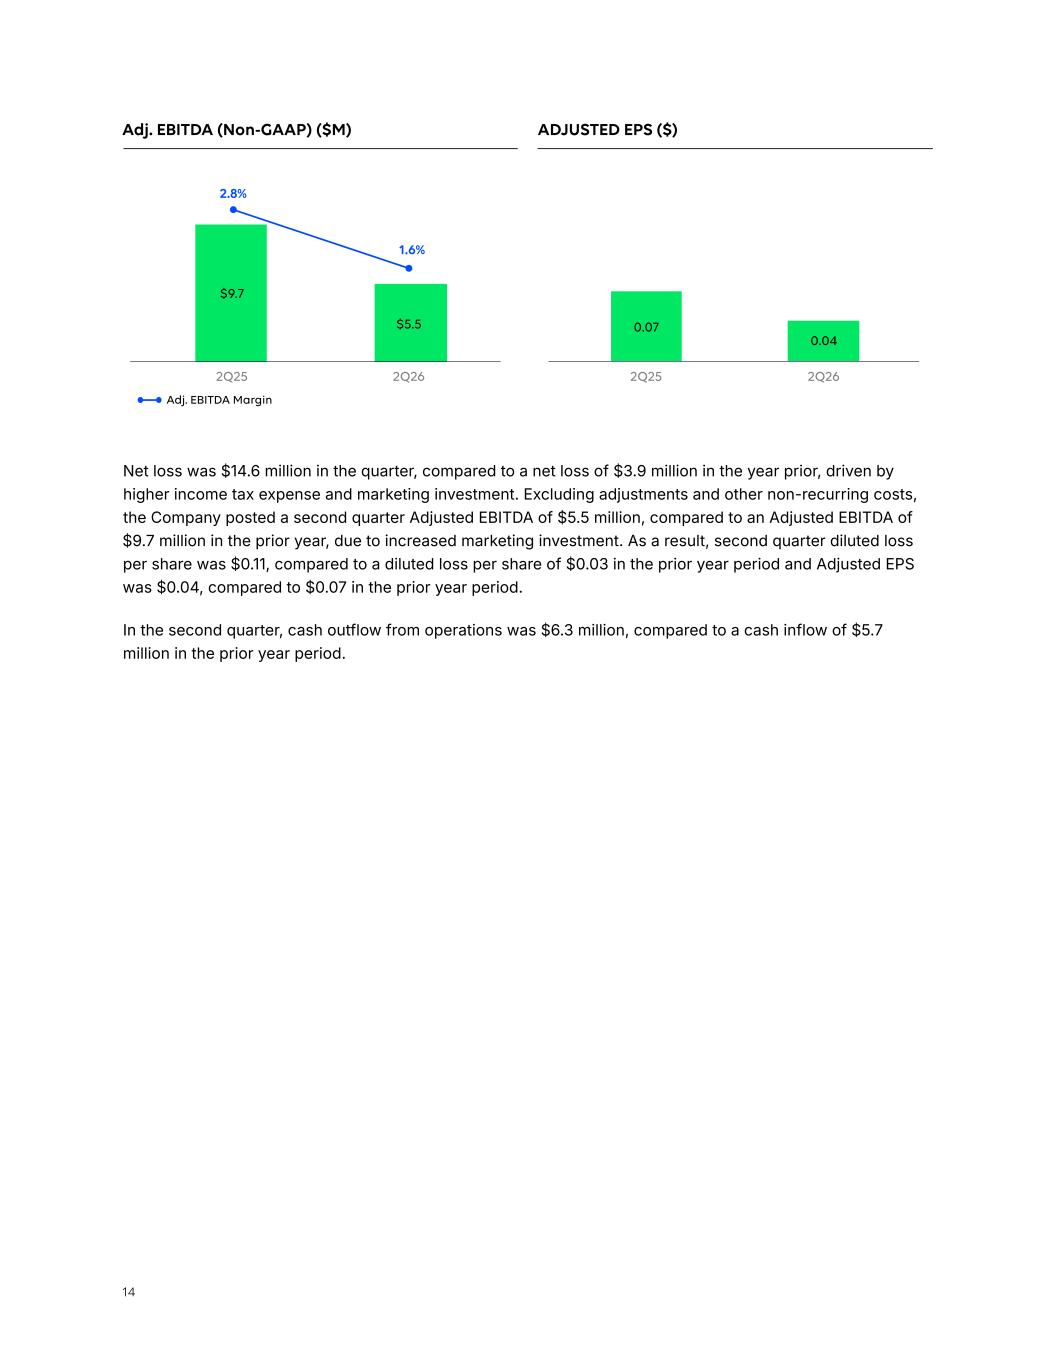
14 2Q25 2Q262Q25 2Q26 Net loss was $14.6 million in the quarter, compared to a net loss of $3.9 million in the year prior, driven by higher income tax expense and marketing investment. Excluding adjustments and other non-recurring costs, the Company posted a second quarter Adjusted EBITDA of $5.5 million, compared to an Adjusted EBITDA of $9.7 million in the prior year, due to increased marketing investment. As a result, second quarter diluted loss per share was $0.11, compared to a diluted loss per share of $0.03 in the prior year period and Adjusted EPS was $0.04, compared to $0.07 in the prior year period. In the second quarter, cash outflow from operations was $6.3 million, compared to a cash inflow of $5.7 million in the prior year period. Adj. EBITDA Margin Adj. EBITDA (Non-GAAP) ($M) ADJUSTED EPS ($) 2.8% 1.6% $9.7 0.07 0.04 $5.5
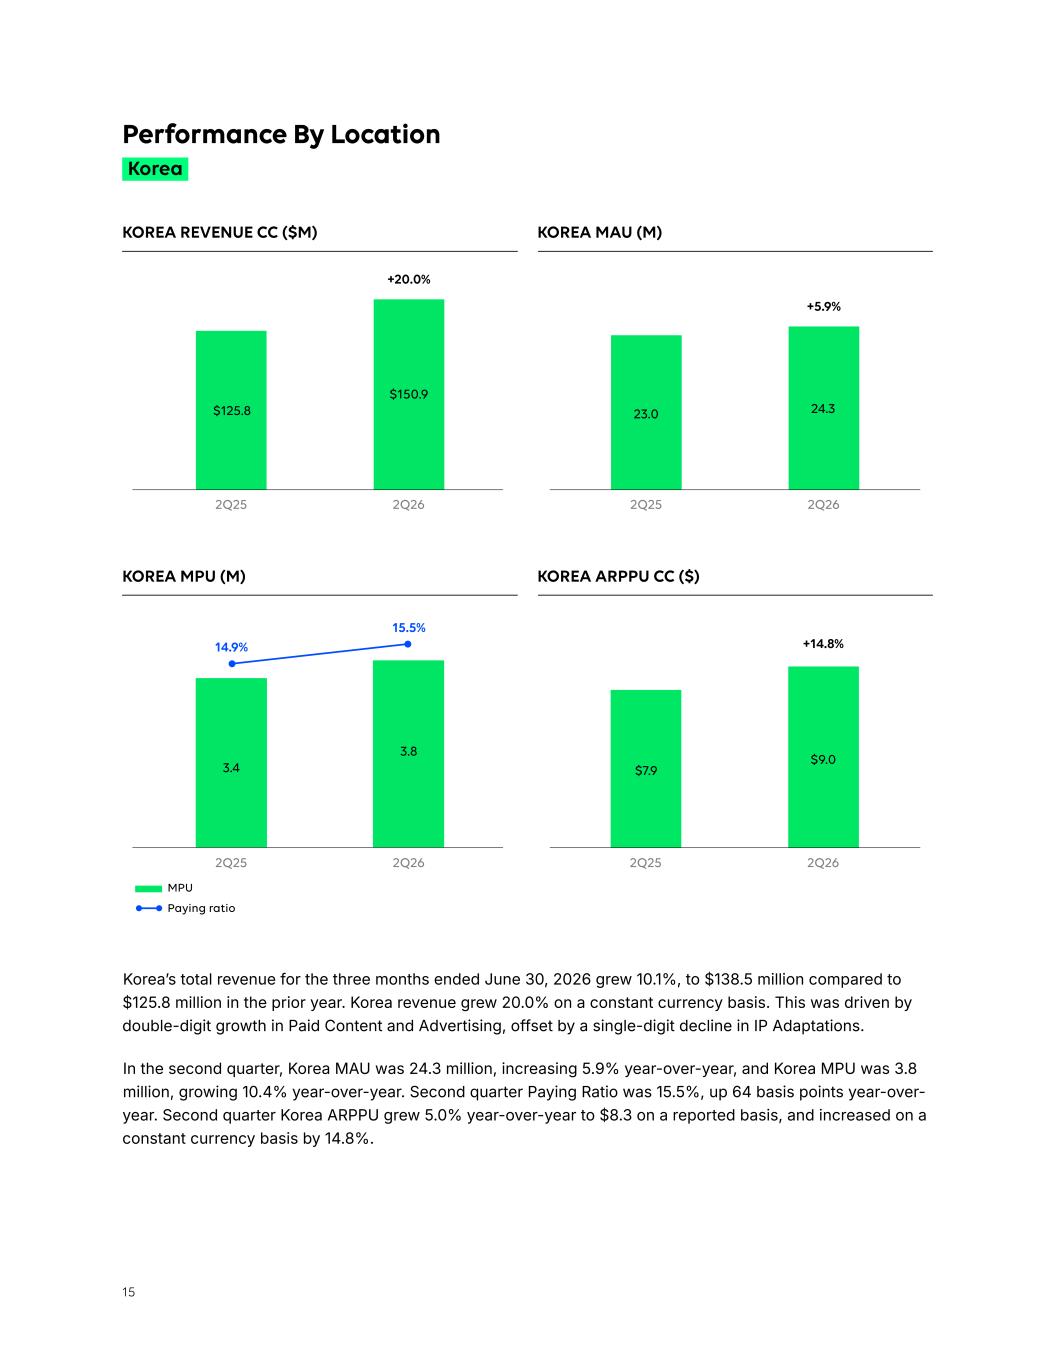
15 +14.8% KOREA MPU (M) KOREA ARPPU CC ($) MPU Paying ratio Korea’s total revenue for the three months ended June 30, 2026 grew 10.1%, to $138.5 million compared to $125.8 million in the prior year. Korea revenue grew 20.0% on a constant currency basis. This was driven by double-digit growth in Paid Content and Advertising, offset by a single-digit decline in IP Adaptations. In the second quarter, Korea MAU was 24.3 million, increasing 5.9% year-over-year, and Korea MPU was 3.8 million, growing 10.4% year-over-year. Second quarter Paying Ratio was 15.5%, up 64 basis points year-over- year. Second quarter Korea ARPPU grew 5.0% year-over-year to $8.3 on a reported basis, and increased on a constant currency basis by 14.8%. Korea Performance By Location KOREA REVENUE CC ($M) KOREA MAU (M) +20.0% +5.9% 14.9% 15.5% 2Q25 2Q25 2Q252Q26 2Q26 2Q26 2Q262Q25 $125.8 3.4 23.0 $7.9 $150.9 3.8 24.3 $9.0
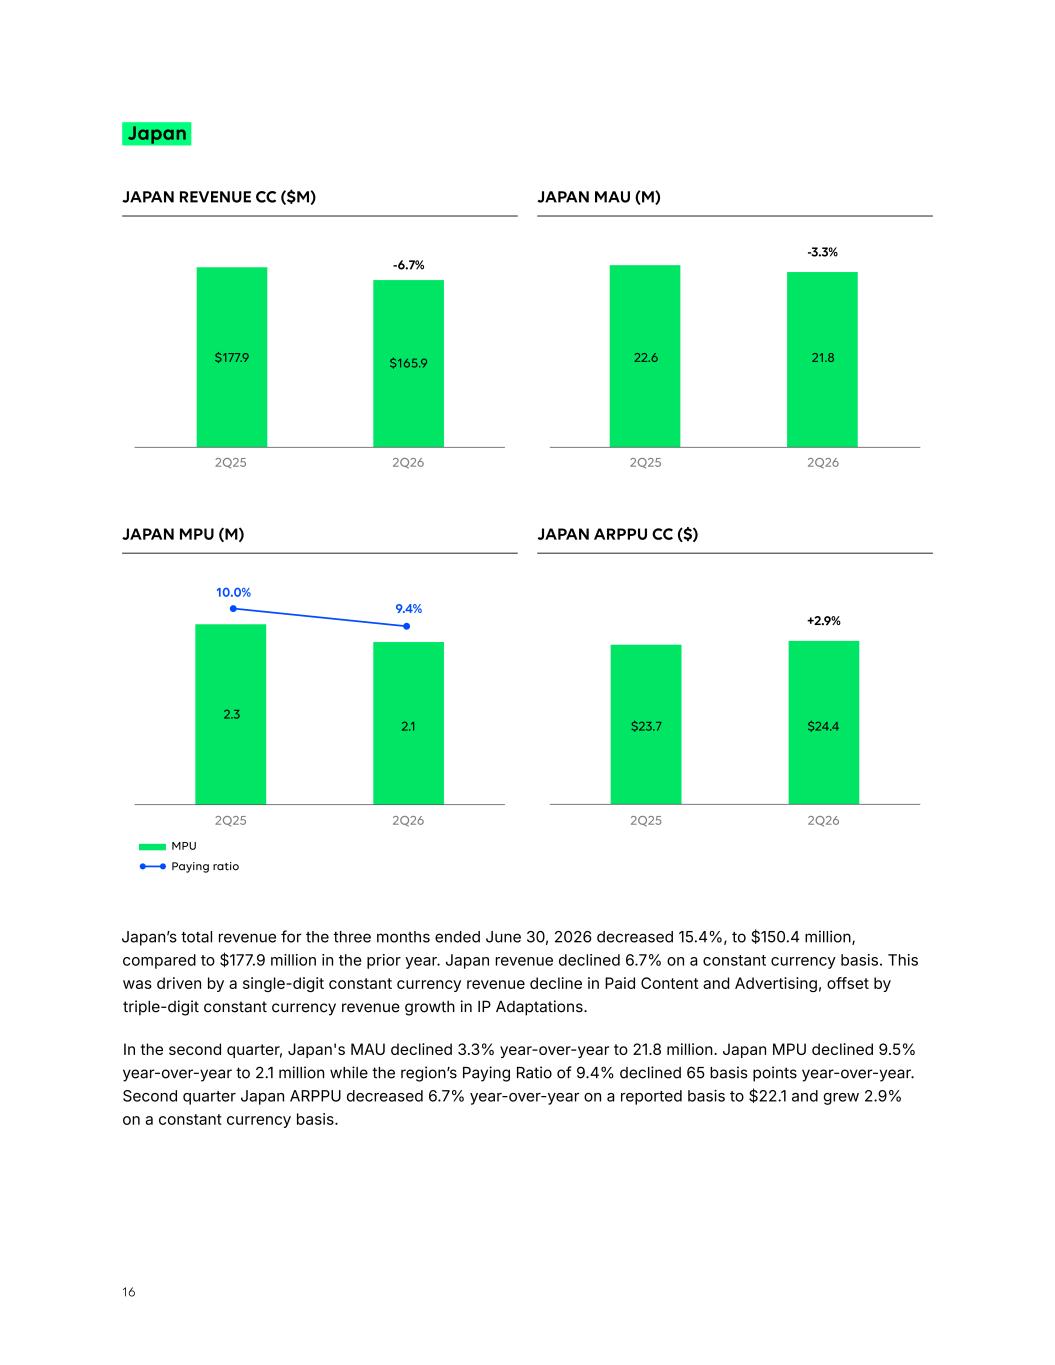
16 -3.3% JAPAN REVENUE CC ($M) JAPAN MAU (M) JAPAN MPU (M) JAPAN ARPPU CC ($) MPU Paying ratio +2.9% Japan -6.7% 10.0% 9.4% Japan’s total revenue for the three months ended June 30, 2026 decreased 15.4%, to $150.4 million, compared to $177.9 million in the prior year. Japan revenue declined 6.7% on a constant currency basis. This was driven by a single-digit constant currency revenue decline in Paid Content and Advertising, offset by triple-digit constant currency revenue growth in IP Adaptations. In the second quarter, Japan's MAU declined 3.3% year-over-year to 21.8 million. Japan MPU declined 9.5% year-over-year to 2.1 million while the region’s Paying Ratio of 9.4% declined 65 basis points year-over-year. Second quarter Japan ARPPU decreased 6.7% year-over-year on a reported basis to $22.1 and grew 2.9% on a constant currency basis. 2Q25 2Q25 2Q25 2Q252Q26 2Q26 2Q26 2Q26 $177.9 2.3 $165.9 2.1 22.6 $23.7 21.8 $24.4
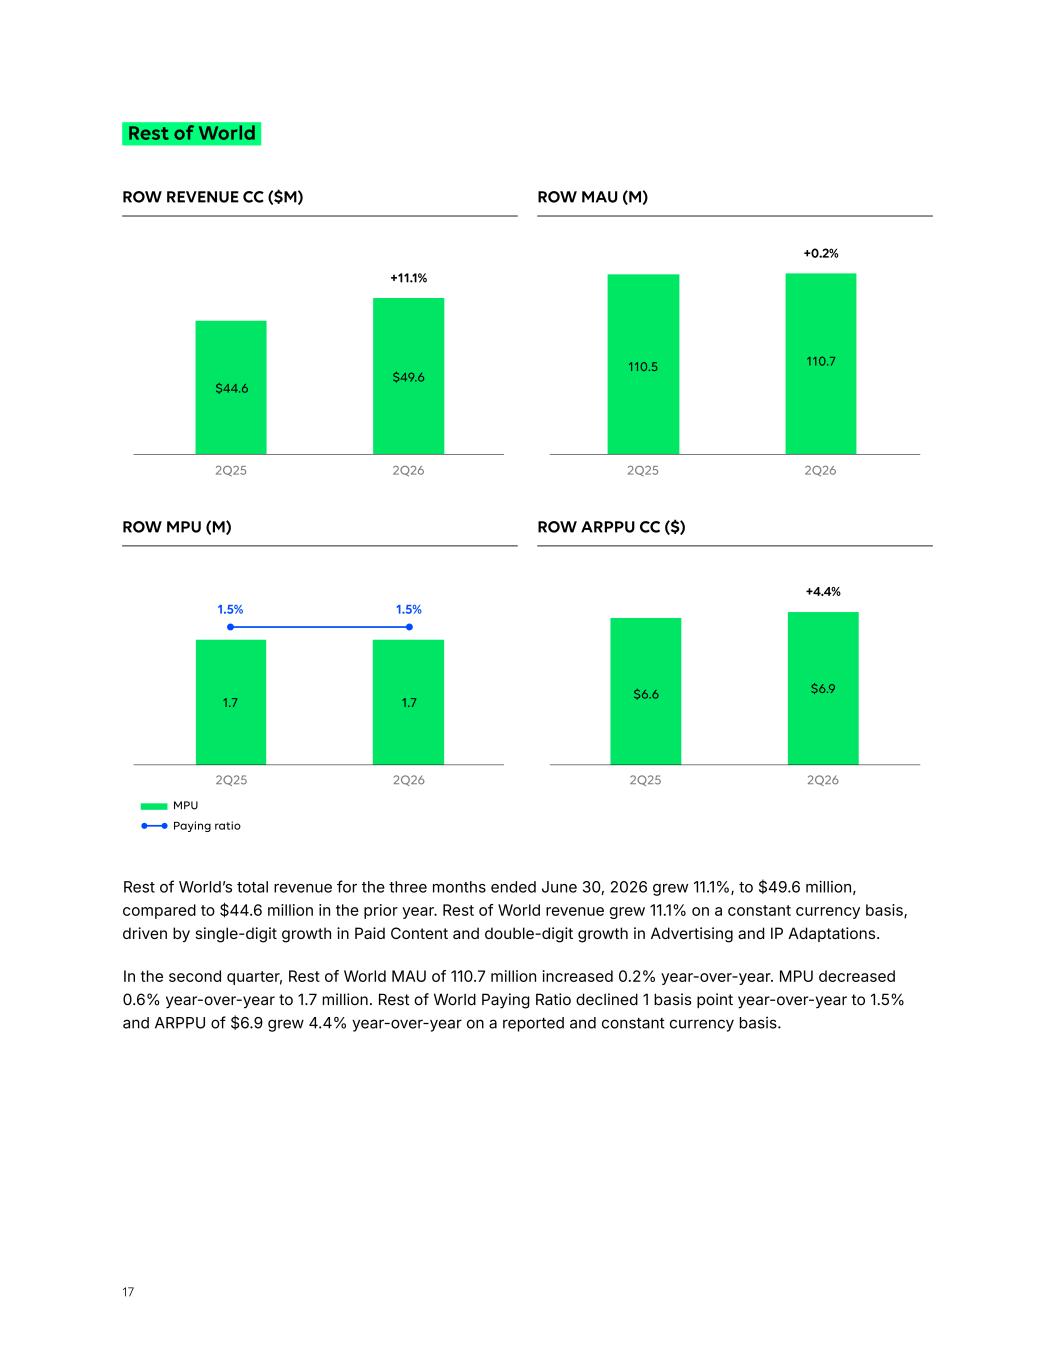
17 ROW REVENUE CC ($M) ROW MAU (M) +0.2% Rest of World +11.1% Rest of World’s total revenue for the three months ended June 30, 2026 grew 11.1%, to $49.6 million, compared to $44.6 million in the prior year. Rest of World revenue grew 11.1% on a constant currency basis, driven by single-digit growth in Paid Content and double-digit growth in Advertising and IP Adaptations. In the second quarter, Rest of World MAU of 110.7 million increased 0.2% year-over-year. MPU decreased 0.6% year-over-year to 1.7 million. Rest of World Paying Ratio declined 1 basis point year-over-year to 1.5% and ARPPU of $6.9 grew 4.4% year-over-year on a reported and constant currency basis. ROW MPU (M) ROW ARPPU CC ($) MPU Paying ratio +4.4% 1.5% 1.5% 2Q25 2Q252Q26 2Q26 2Q25 2Q252Q26 2Q26 $44.6 $49.6 110.5 110.7 1.7 1.7 $6.6 $6.9
18 For the third quarter 2026, the Company expects: • Revenue growth on a constant currency basis in the range of 0.7%-3.3%. This represents revenue in the range of $358-$368 million, based on current FX rates. • Adjusted EBITDA in the range of $0.0-$5.0 million, representing an Adjusted EBITDA Margin in the range of 0.0%-1.4%. Guidance Third Quarter 2026 Outlook About WEBTOON Entertainment WEBTOON Entertainment is a leading global entertainment company and home to some of the world's largest storytelling platforms. As the global leader and pioneer of the mobile webcomic format, WEBTOON Entertainment has transformed comics and visual storytelling for fans and creators. With its CANVAS UGC platform empowering anyone to become a creator, and a growing roster of superstar WEBTOON Originals creators and series, WEBTOON Entertainment’s passionate fandoms are the new face of pop culture. WEBTOON Entertainment adaptations are available on Netflix, Prime Video, Crunchyroll, and other screens around the world, and the company’s content partners have included Warner Bros. Animation, Discord, HYBE, and Duolingo, among many others. With approximately 155 million monthly active users, WEBTOON Entertainment’s IP & Creator Ecosystem of aligned brands and platforms include WEBTOON, Wattpad--the world’s leading webnovel platform--WEBTOON Productions, Studio N, Studio LICO, WEBTOON Unscrolled, LINE MANGA, and eBookJapan, among others. Conference Call & Webcast Details As previously disclosed, the Company will host a webcast and conference call on August 10, 2026, at 5:30 p.m. Eastern Time, to discuss the Company’s financial results for its second quarter ended June 30, 2026. A live webcast of the conference call will be available online at https://ir.webtoon.com/. For those unable to listen to the live webcast, an archived version will be available at the same location for up to one year.
19 Forward-Looking Statements This letter contains forward-looking statements within the meaning of the safe harbor provisions of the U.S. Private Securities Litigation Reform Act of 1995, and involves risks, assumptions and uncertainties that could cause actual results to differ materially from those expressed or implied by forward-looking statements. Forward-looking statements cover all matters which are not historical facts and include, without limitation, statements or guidance regarding or relating to our future financial position, results of operations and growth, plans and objectives for future capabilities, ability to attract users in both our core and underpenetrated geographies, ability to grow our Paid Content, Advertising and IP Adaptations businesses, the impact of our product development initiatives, including our use of AI, our financial condition and liquidity, and other statements concerning the success of our business and strategies. Forward-looking statements may be identified by the use of words such as “anticipate,” “intend,” “plan,” “goal,” “seek,” “believe,” “project,” “estimate,” “expect,” “strategy,” “future,” “likely,” “may,” “should,” “will” and similar references to future periods. Forward-looking statements speak only as of the date on which they are made. They are not assurances of future performance and are based only on our current beliefs, expectations and assumptions regarding the future of our business, future plans and strategies, projections, anticipated events and trends, the economy and other future conditions. Therefore, you should not place undue reliance on any of these forward-looking statements. Although we believe that the forward-looking statements contained in this letter are based on reasonable assumptions, you should be aware that many factors could cause actual results to differ materially from those in such forward-looking statements, including, but not limited to: weakness in the economy, market trends, uncertainty and other conditions in the markets in which we operate, and other geopolitical or macroeconomic factors beyond our control; inability to attract, empower, properly support or incentivize our creators; inability to retain, attract and engage with our users; inability to anticipate, understand and appropriately respond to market trends and changing user preferences; failure to retain or increase our paying users; failure to effectively operate in highly competitive markets; inability to innovate and expand our Advertising business; inability to continue to diversify our monetization strategy or to increase revenues from IP Adaptations; failure to realize returns on investments made toward entering new markets and lines of business; failure to control our content-related costs; exposure to significant legal proceedings and regulatory investigations which may result in significant expenses, fines and reputational damage; failure to provide a safe online environment for children; exposure to claims that we violated third parties’ intellectual property rights; failure to obtain, maintain, protect or enforce our proprietary and intellectual property rights; exposure to liability and adverse effects from the use of AI; rise of conflicts of interests with NAVER Corporation, our majority stockholder; and other risks and uncertainties set forth under the caption “Risk Factors” in our most recent Annual Report on Form 10-K, and in other filings we make with the SEC in the future. Additionally, forward-looking statements regarding past trends or activities should not be taken as a representation that such trends or activities will continue in the future. Other than in accordance with our legal or regulatory obligations, we undertake no obligations to publicly update or revise any forward-looking statement, whether as a result of new information, future events or otherwise. A Note About Key Business Metrics We define MAU as users based on each device logged in and each offering accessed from a single device and may include the same individual user multiple times if the user is logged in from multiple devices or if the user accesses multiple offerings from one device. We define app MAU as users who visited one of our mobile applications at least once in the applicable calendar month, averaged over each month in the given period.
20 Use of Non-GAAP Financial Measures & Definitions This letter contains certain financial information that is not presented in conformity with U.S. GAAP. These non-GAAP measures include Adjusted EBITDA, Adjusted EBITDA Margin, Adjusted Earnings Per Share (Adjusted EPS), revenue on a constant currency basis and revenue growth on a constant currency basis. We believe that these non-GAAP measures provide users of the Company’s financial information with additional meaningful information to assist in understanding financial results and assessing the Company’s performance from period to period. Management believes these measures are important indicators of operations because they exclude items that may not be indicative of our core operating results and provide a better baseline for analyzing trends in our underlying businesses, and they are consistent with how business performance is planned, reported and assessed internally by management and the board of directors of the Company. Our non-GAAP financial measures should not be considered in isolation, or as substitutes for, financial information prepared in accordance with GAAP. Non-GAAP measures have limitations as they do not reflect all the amounts associated with our results of operations as determined in accordance with GAAP, and should only be used to evaluate our results of operations in conjunction with the corresponding or most directly comparable GAAP measures. We strongly encourage investors and shareholders to review our financial statements and publicly filed reports in their entirety and not to rely on any single financial measure. A reconciliation is provided at the end of this shareholder letter for each historical non-GAAP financial measure to the most directly comparable financial measure stated in accordance with U.S. GAAP. We encourage investors and shareholders to review the related U.S. GAAP financial measures and the reconciliation of these non-GAAP financial measures to their most directly comparable U.S. GAAP financial measures, and not to rely on any single financial measure to evaluate our business. We do not provide a reconciliation of forward- looking non-GAAP financial measures to the most directly comparable U.S. GAAP financial measures on a forward-looking basis because we are unable to predict with reasonable certainty or without unreasonable effort non-recurring items that may arise in the future. Adjusted EBITDA: We define Adjusted EBITDA as net income (loss), adjusted to remove the impact of interest income, interest expense, income tax expense (benefit) and depreciation and amortization, with further adjustments to eliminate the effects of loss on equity method investments, effect of applying the valuation method of fair value through profit or loss, impairment of goodwill, non-cash stock-based compensation and certain other non-recurring costs. Adjusted EBITDA Margin: We define Adjusted EBITDA Margin as Adjusted EBITDA divided by revenue. Adjusted Earnings Per Share (Adjusted EPS): We define Adjusted Earnings Per Share as Earnings Per Share Webcomic app MAU refers to users who visited one of our webcomic mobile applications, rather than our webnovel mobile applications, averaged over each month in the given period. We define MPU as users who have paid to access Paid Content in the applicable calendar month, averaged over each month in the given period. We define Paying Ratio as the ratio of MPU divided by MAU for the respective periods. We define ARPPU as average Paid Content revenue in a given month divided by the number of MPU for such month, averaged over each month in the given period.
21 before interest expense, interest income, income tax expense (benefit) and depreciation and amortization, with further adjustments to eliminate the effects of loss on equity method investments, effect of applying the valuation method of fair value through profit or loss, impairment of goodwill, non-cash stock-based compensation and certain other non-recurring costs. We calculate Adjusted Earnings Per Share by making the adjustments described herein from Net Income (Loss) and dividing by basic and diluted weighted average shares of common stock outstanding, respectively, for the applicable period. Revenue on a Constant Currency Basis: We define revenue on a constant currency basis as revenue adjusted to remove the impact of foreign currency rate fluctuations and the impact of deconsolidated and transferred operations. We calculate revenue on a constant currency basis in a given period by applying the average currency exchange rates in the comparable period of the prior year to the local currency revenue in the current period. We calculate revenue on a constant currency basis in each of our revenue streams – Paid Content, Advertising and IP Adaptations – using the same method as laid out herein. Revenue Growth on a Constant Currency Basis: We define revenue growth on a constant currency basis as period-over-period growth rates of revenue, adjusted to remove the impact of foreign currency rate fluctuations and the impact of deconsolidated and transferred operations. We calculate revenue growth (as a percentage) on a constant currency basis by determining the increase in current period revenue over prior period revenue, where current period foreign currency revenue is translated using prior period average currency exchange rates. ARPPU on a Constant Currency Basis: We define ARPPU on a constant currency basis as average Paid Content revenue on a constant currency basis in a given month divided by the number of MPU for such month, averaged over each month in the given period. As discussed above, we calculate revenue on a constant currency basis in a given period by applying the average currency exchange rates in the comparable period of the prior year to the local currency revenue in the current period and excluding deconsolidated and transferred operations. ARPPU Growth on a Constant Currency Basis: We define ARPPU growth (as a percentage) on a constant currency basis as the increase in current period ARPPU over prior period ARPPU, with current period foreign currency ARPPU translated using prior period average currency exchange rates and excluding deconsolidated and transferred operations. Contact Information Investor Relations Corporate Communications Soohwan Kim, CFA [email protected] Kiel Hume [email protected]
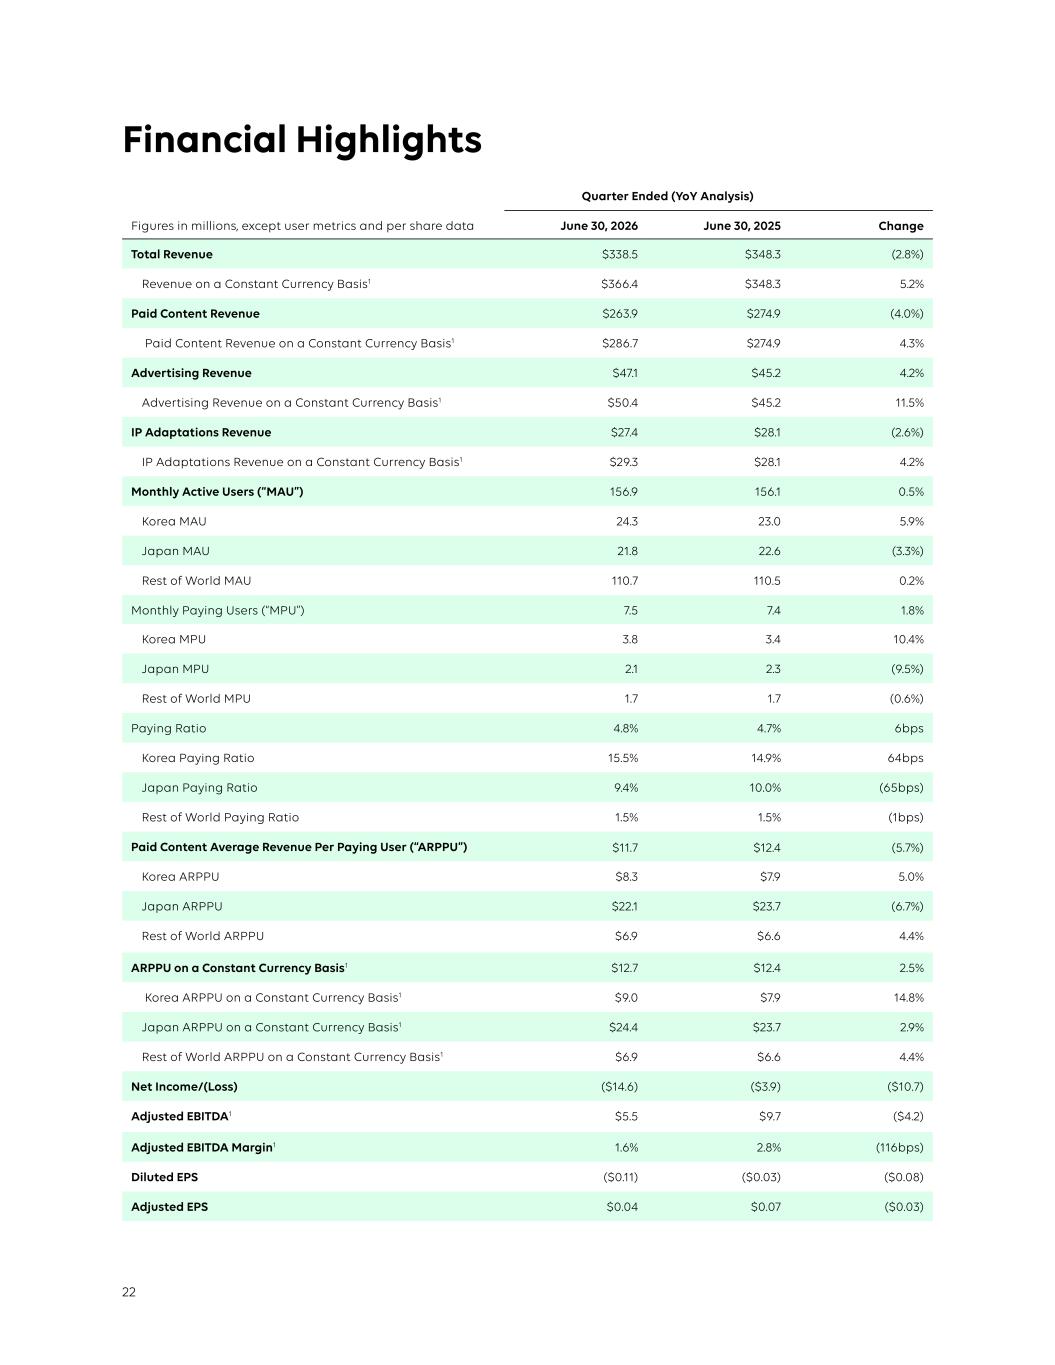
22 Quarter Ended (YoY Analysis) Figures in millions, except user metrics and per share data June 30, 2026 June 30, 2025 Change Total Revenue $338.5 $348.3 (2.8%) Revenue on a Constant Currency Basis1 $366.4 $348.3 5.2% Paid Content Revenue $263.9 $274.9 (4.0%) Paid Content Revenue on a Constant Currency Basis1 $286.7 $274.9 4.3% Advertising Revenue $47.1 $45.2 4.2% Advertising Revenue on a Constant Currency Basis1 $50.4 $45.2 11.5% IP Adaptations Revenue $27.4 $28.1 (2.6%) IP Adaptations Revenue on a Constant Currency Basis1 $29.3 $28.1 4.2% Monthly Active Users (“MAU”) 156.9 156.1 0.5% Korea MAU 24.3 23.0 5.9% Japan MAU 21.8 22.6 (3.3%) Rest of World MAU 110.7 110.5 0.2% Monthly Paying Users (“MPU”) 7.5 7.4 1.8% Korea MPU 3.8 3.4 10.4% Japan MPU 2.1 2.3 (9.5%) Rest of World MPU 1.7 1.7 (0.6%) Paying Ratio 4.8% 4.7% 6bps Korea Paying Ratio 15.5% 14.9% 64bps Japan Paying Ratio 9.4% 10.0% (65bps) Rest of World Paying Ratio 1.5% 1.5% (1bps) Paid Content Average Revenue Per Paying User (“ARPPU”) $11.7 $12.4 (5.7%) Korea ARPPU $8.3 $7.9 5.0% Japan ARPPU $22.1 $23.7 (6.7%) Rest of World ARPPU $6.9 $6.6 4.4% ARPPU on a Constant Currency Basis1 $12.7 $12.4 2.5% Korea ARPPU on a Constant Currency Basis1 $9.0 $7.9 14.8% Japan ARPPU on a Constant Currency Basis1 $24.4 $23.7 2.9% Rest of World ARPPU on a Constant Currency Basis1 $6.9 $6.6 4.4% Net Income/(Loss) ($14.6) ($3.9) ($10.7) Adjusted EBITDA1 $5.5 $9.7 ($4.2) Adjusted EBITDA Margin1 1.6% 2.8% (116bps) Diluted EPS ($0.11) ($0.03) ($0.08) Adjusted EPS $0.04 $0.07 ($0.03) Financial Highlights

23 1 Revenue on a constant currency basis, Paid Content revenue on a constant currency basis, Advertising revenue on a constant currency basis, IP Adaptations revenue on a constant currency basis, ARPPU on a constant currency basis, Korea ARPPU on a constant currency basis, Japan ARPPU on a constant currency basis, Rest of World ARPPU on a constant currency basis, Adjusted EBITDA, Adjusted EBITDA Margin and Adjusted EPS are non-GAAP financial measures. For definitions of these non-GAAP financial measures, see “Non-GAAP Financial Measures & Definitions” of this letter. A reconciliation of non-GAAP financial measures to the most directly comparable U.S. GAAP measure can be found at the end of this letter.
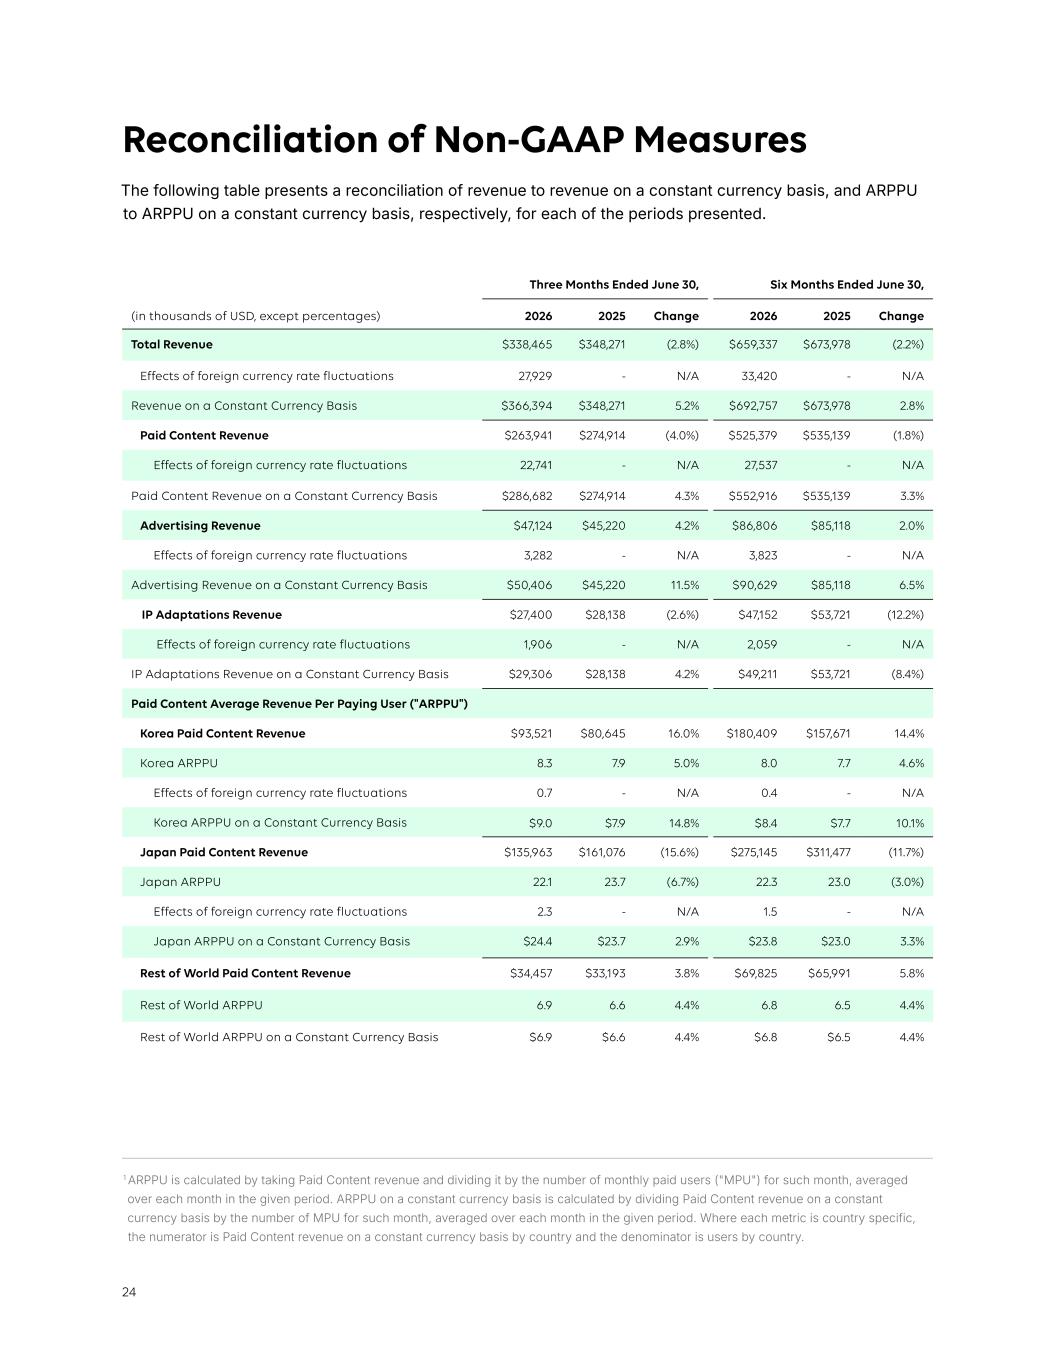
24 Reconciliation of Non-GAAP Measures The following table presents a reconciliation of revenue to revenue on a constant currency basis, and ARPPU to ARPPU on a constant currency basis, respectively, for each of the periods presented. Three Months Ended June 30, Six Months Ended June 30, (in thousands of USD, except percentages) 2026 2025 Change 2026 2025 Change Total Revenue $338,465 $348,271 (2.8%) $659,337 $673,978 (2.2%) Effects of foreign currency rate fluctuations 27,929 - N/A 33,420 - N/A Revenue on a Constant Currency Basis $366,394 $348,271 5.2% $692,757 $673,978 2.8% Paid Content Revenue $263,941 $274,914 (4.0%) $525,379 $535,139 (1.8%) Effects of foreign currency rate fluctuations 22,741 - N/A 27,537 - N/A Paid Content Revenue on a Constant Currency Basis $286,682 $274,914 4.3% $552,916 $535,139 3.3% Advertising Revenue $47,124 $45,220 4.2% $86,806 $85,118 2.0% Effects of foreign currency rate fluctuations 3,282 - N/A 3,823 - N/A Advertising Revenue on a Constant Currency Basis $50,406 $45,220 11.5% $90,629 $85,118 6.5% IP Adaptations Revenue $27,400 $28,138 (2.6%) $47,152 $53,721 (12.2%) Effects of foreign currency rate fluctuations 1,906 - N/A 2,059 - N/A IP Adaptations Revenue on a Constant Currency Basis $29,306 $28,138 4.2% $49,211 $53,721 (8.4%) Paid Content Average Revenue Per Paying User ("ARPPU") Korea Paid Content Revenue $93,521 $80,645 16.0% $180,409 $157,671 14.4% Korea ARPPU 8.3 7.9 5.0% 8.0 7.7 4.6% Effects of foreign currency rate fluctuations 0.7 - N/A 0.4 - N/A Korea ARPPU on a Constant Currency Basis $9.0 $7.9 14.8% $8.4 $7.7 10.1% Japan Paid Content Revenue $135,963 $161,076 (15.6%) $275,145 $311,477 (11.7%) Japan ARPPU 22.1 23.7 (6.7%) 22.3 23.0 (3.0%) Effects of foreign currency rate fluctuations 2.3 - N/A 1.5 - N/A Japan ARPPU on a Constant Currency Basis $24.4 $23.7 2.9% $23.8 $23.0 3.3% Rest of World Paid Content Revenue $34,457 $33,193 3.8% $69,825 $65,991 5.8% Rest of World ARPPU 6.9 6.6 4.4% 6.8 6.5 4.4% Rest of World ARPPU on a Constant Currency Basis $6.9 $6.6 4.4% $6.8 $6.5 4.4% 1 ARPPU is calculated by taking Paid Content revenue and dividing it by the number of monthly paid users ("MPU") for such month, averaged over each month in the given period. ARPPU on a constant currency basis is calculated by dividing Paid Content revenue on a constant currency basis by the number of MPU for such month, averaged over each month in the given period. Where each metric is country specific, the numerator is Paid Content revenue on a constant currency basis by country and the denominator is users by country.
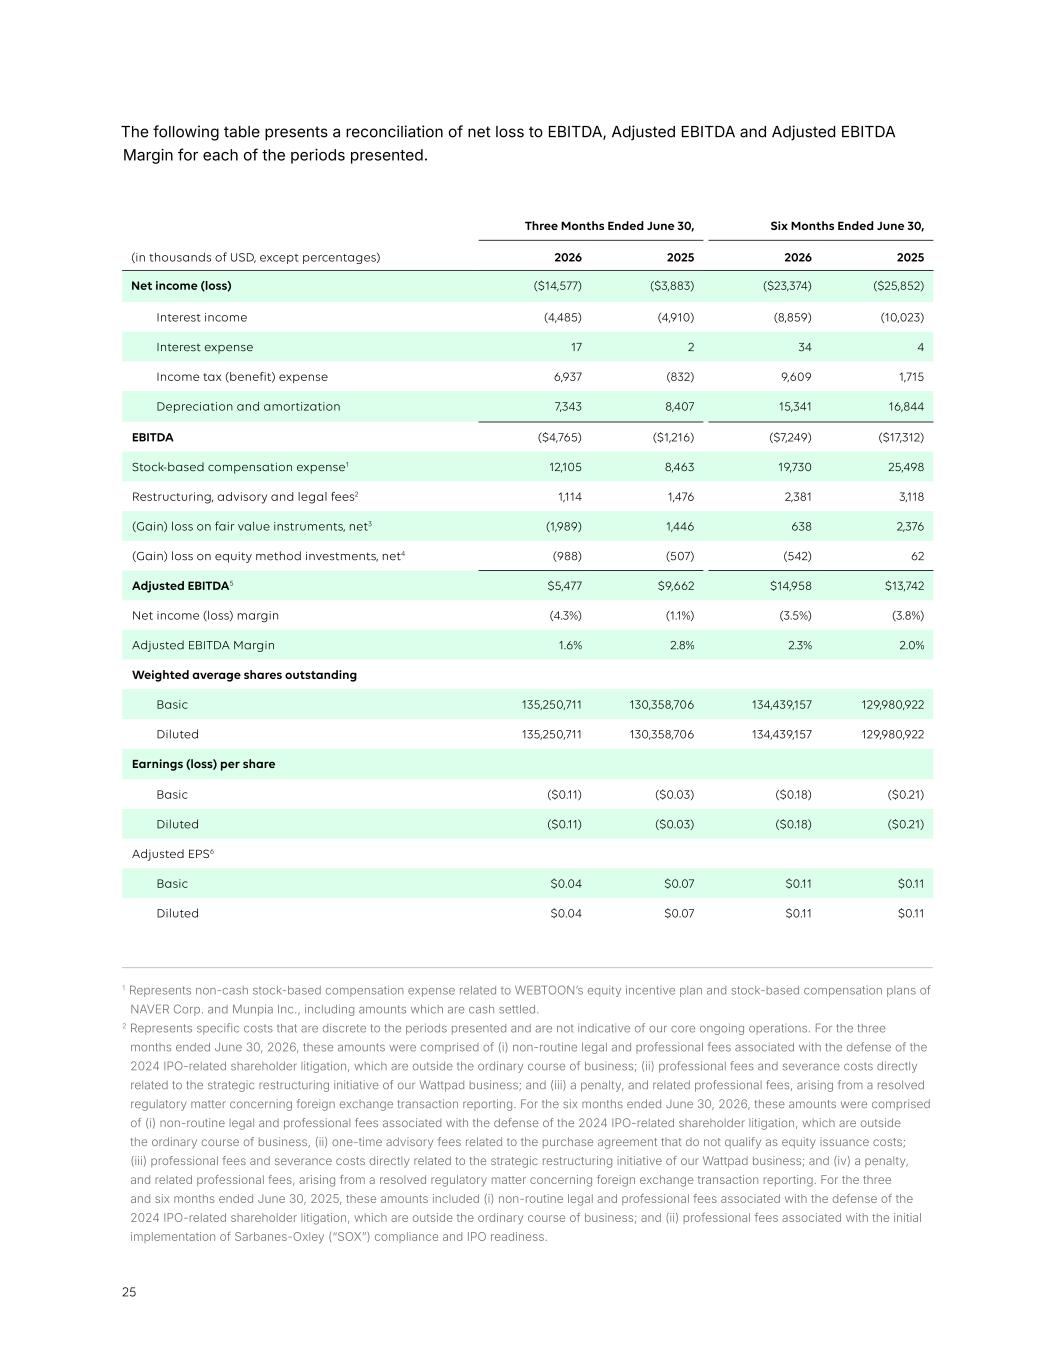
25 The following table presents a reconciliation of net loss to EBITDA, Adjusted EBITDA and Adjusted EBITDA Margin for each of the periods presented. 1 Represents non-cash stock-based compensation expense related to WEBTOON’s equity incentive plan and stock-based compensation plans of NAVER Corp. and Munpia Inc., including amounts which are cash settled. 2 Represents specific costs that are discrete to the periods presented and are not indicative of our core ongoing operations. For the three months ended June 30, 2026, these amounts were comprised of (i) non-routine legal and professional fees associated with the defense of the 2024 IPO-related shareholder litigation, which are outside the ordinary course of business; (ii) professional fees and severance costs directly related to the strategic restructuring initiative of our Wattpad business; and (iii) a penalty, and related professional fees, arising from a resolved regulatory matter concerning foreign exchange transaction reporting. For the six months ended June 30, 2026, these amounts were comprised of (i) non-routine legal and professional fees associated with the defense of the 2024 IPO-related shareholder litigation, which are outside the ordinary course of business, (ii) one-time advisory fees related to the purchase agreement that do not qualify as equity issuance costs; (iii) professional fees and severance costs directly related to the strategic restructuring initiative of our Wattpad business; and (iv) a penalty, and related professional fees, arising from a resolved regulatory matter concerning foreign exchange transaction reporting. For the three and six months ended June 30, 2025, these amounts included (i) non-routine legal and professional fees associated with the defense of the 2024 IPO-related shareholder litigation, which are outside the ordinary course of business; and (ii) professional fees associated with the initial implementation of Sarbanes-Oxley (“SOX”) compliance and IPO readiness. Three Months Ended June 30, Six Months Ended June 30, (in thousands of USD, except percentages) 2026 2025 2026 2025 Net income (loss) ($14,577) ($3,883) ($23,374) ($25,852) Interest income (4,485) (4,910) (8,859) (10,023) Interest expense 17 2 34 4 Income tax (benefit) expense 6,937 (832) 9,609 1,715 Depreciation and amortization 7,343 8,407 15,341 16,844 EBITDA ($4,765) ($1,216) ($7,249) ($17,312) Stock-based compensation expense1 12,105 8,463 19,730 25,498 Restructuring, advisory and legal fees2 1,114 1,476 2,381 3,118 (Gain) loss on fair value instruments, net3 (1,989) 1,446 638 2,376 (Gain) loss on equity method investments, net4 (988) (507) (542) 62 Adjusted EBITDA5 $5,477 $9,662 $14,958 $13,742 Net income (loss) margin (4.3%) (1.1%) (3.5%) (3.8%) Adjusted EBITDA Margin 1.6% 2.8% 2.3% 2.0% Weighted average shares outstanding Basic 135,250,711 130,358,706 134,439,157 129,980,922 Diluted 135,250,711 130,358,706 134,439,157 129,980,922 Earnings (loss) per share Basic ($0.11) ($0.03) ($0.18) ($0.21) Diluted ($0.11) ($0.03) ($0.18) ($0.21) Adjusted EPS6 Basic $0.04 $0.07 $0.11 $0.11 Diluted $0.04 $0.07 $0.11 $0.11

26 3 Represents unrealized net (gain) loss of financial assets measured at FVPL, which include the Company's equity investments. 4 Represents our proportionate share of recognized losses associated with our investments accounted for using the equity method. 5 Totals may not foot due to rounding. 6 The numerator for Adjusted EPS is calculated by adjusting Net Income (Loss) by the same items in the Net Income (Loss) to Adjusted EBITDA reconciliation. The denominator for computing Adjusted EPS is the same as that used for Basic and Diluted EPS.

27