PORTLAND, Maine--(BUSINESS WIRE)--October 27, 2022--WEX (NYSE: WEX), the global commerce platform that simplifies the business of running a business, today reported financial results for the three and nine months ended September 30, 2022.
“I am pleased to report that WEX had record third quarter revenue that exceeded our expectations. We continue to leverage our powerful growth engine to win new customers, expand on relationships with existing customers, and diversify our
offerings with compelling new solutions that extend our addressable market,” said Melissa Smith, WEX’s Chair and Chief Executive Officer.
Ms. Smith added, "As we move forward our ability to generate strong cash flows combined with the flexibility and diversity of our business model, gives us confidence in our capacity to invest in the business and return capital to
shareholders.”
Third Quarter 2022 Financial Results
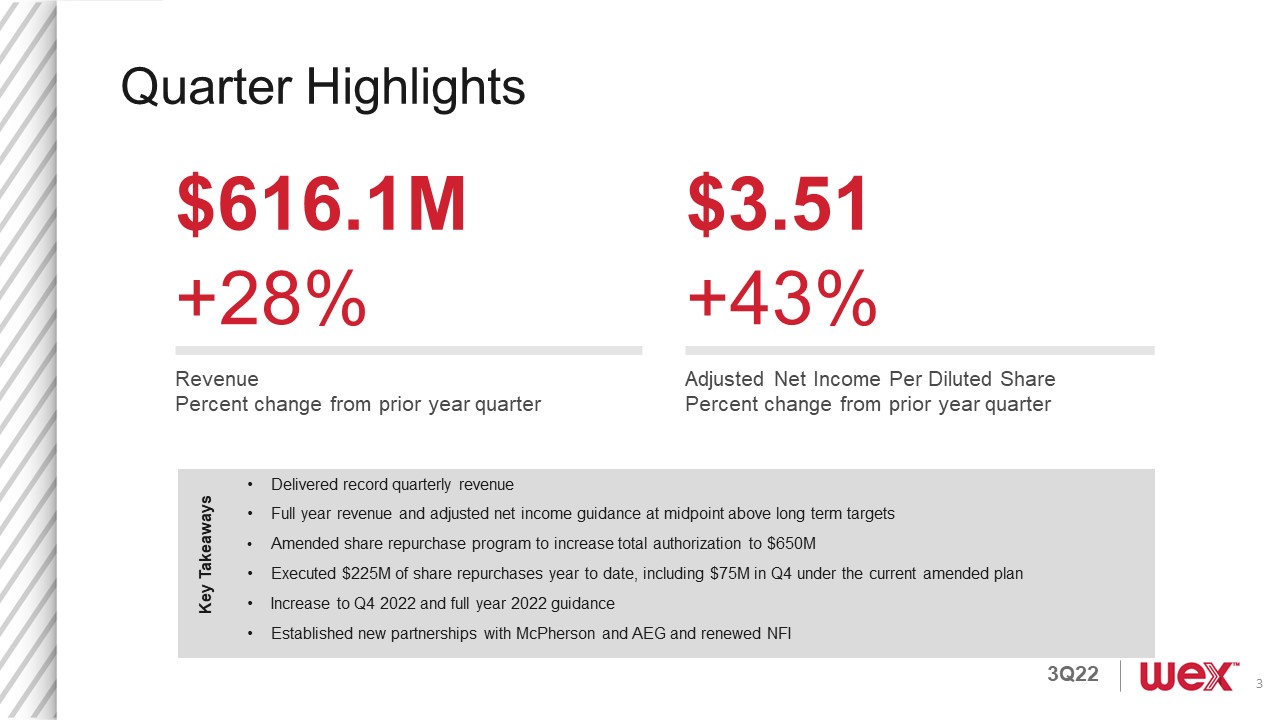
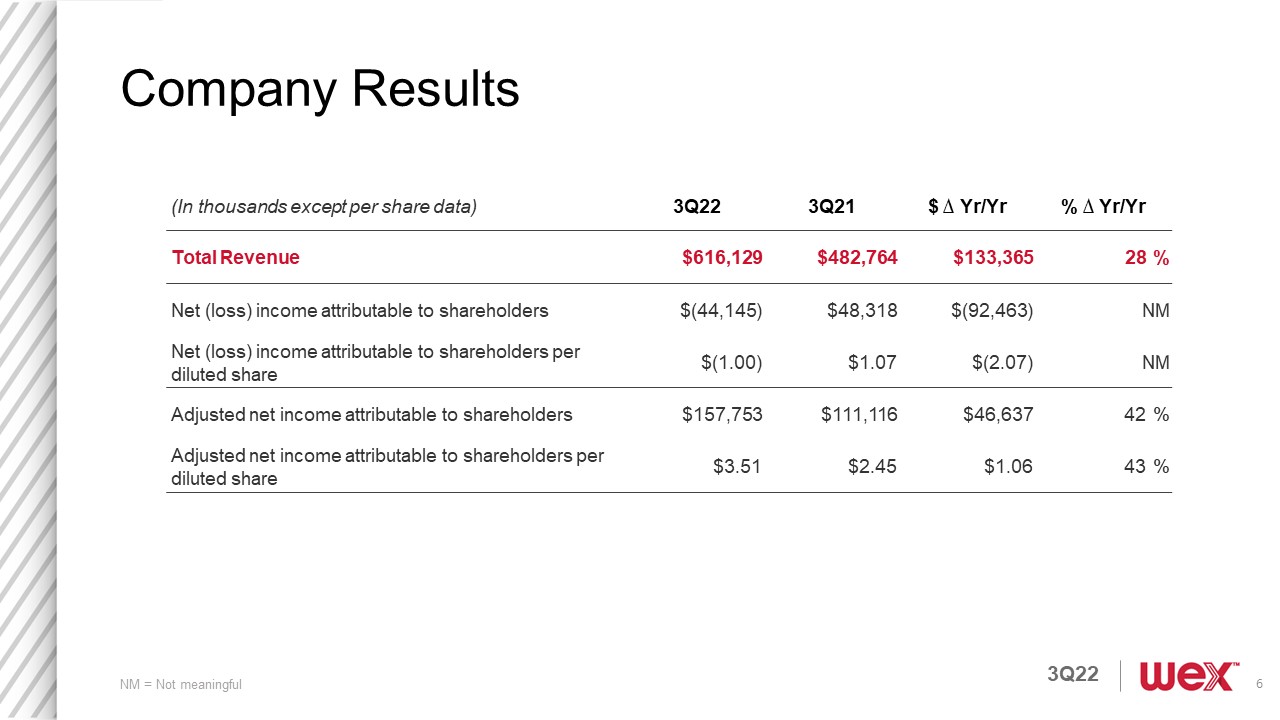
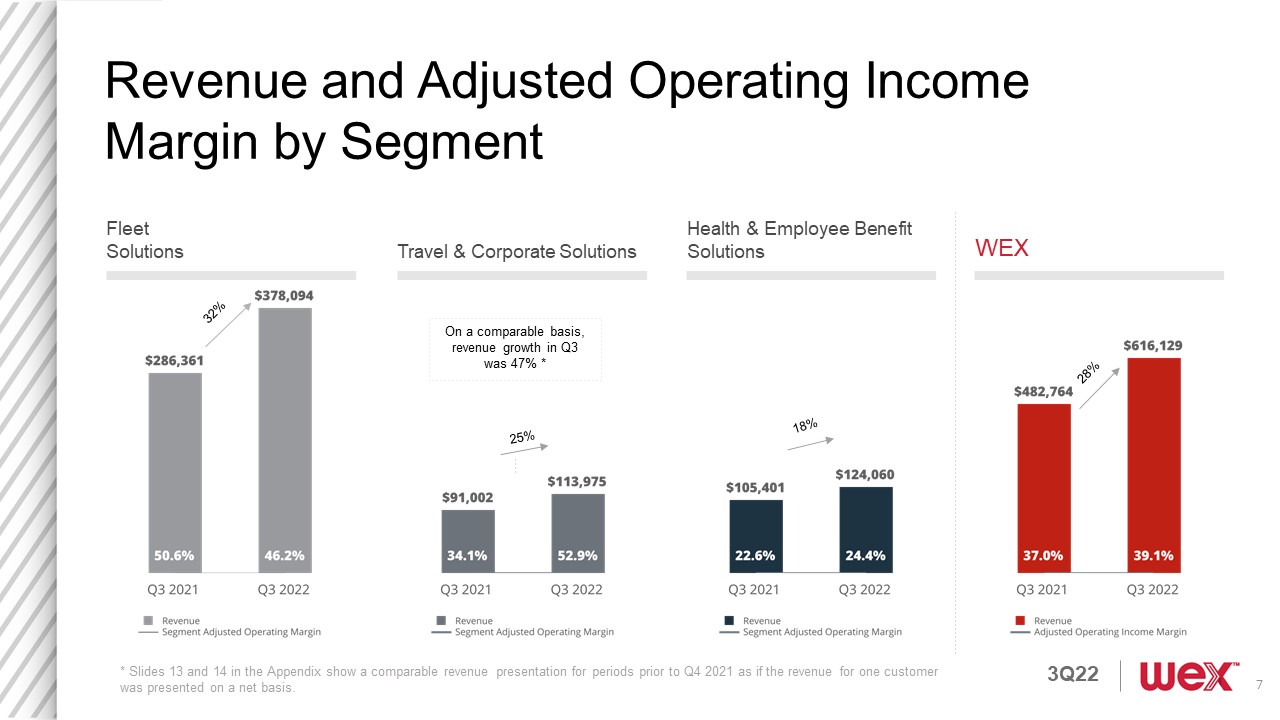
Total revenue for the third quarter of 2022 increased 28% to $616.1 million from $482.8 million for the third quarter of 2021. The revenue increase in the quarter includes a $55.7 million favorable impact from fuel prices and spreads and an
$11.7 million negative impact from foreign exchange rates.
Net income attributable to shareholders on a GAAP basis decreased by $92.5 million to a net loss of $44.1 million, or $1.00 per diluted share for the third quarter of 2022, compared with net income of $48.3 million, or $1.07 per diluted
share, for the third quarter of 2021. The Company's adjusted net income attributable to shareholders, which is a non-GAAP measure, was $157.8 million for the third quarter of 2022, or $3.51 per diluted share, up 43% per diluted share from
$111.1 million or $2.45 per diluted share for the same period last year. GAAP operating income margin for the third quarter of 2022 was 3.5% compared to 20.9% for the prior year comparable period. Adjusted operating income margin was 39.1% in
the third quarter of 2022 compared to 37.0% for the prior year comparable period. See Exhibit 5 for information on the calculation of adjusted operating income margin. See Exhibit 1 for a full explanation and reconciliation of adjusted net
income attributable to shareholders, adjusted net income attributable to shareholders per diluted share and adjusted operating income to the most directly comparable GAAP financial measures.
Third Quarter 2022 Performance Metrics
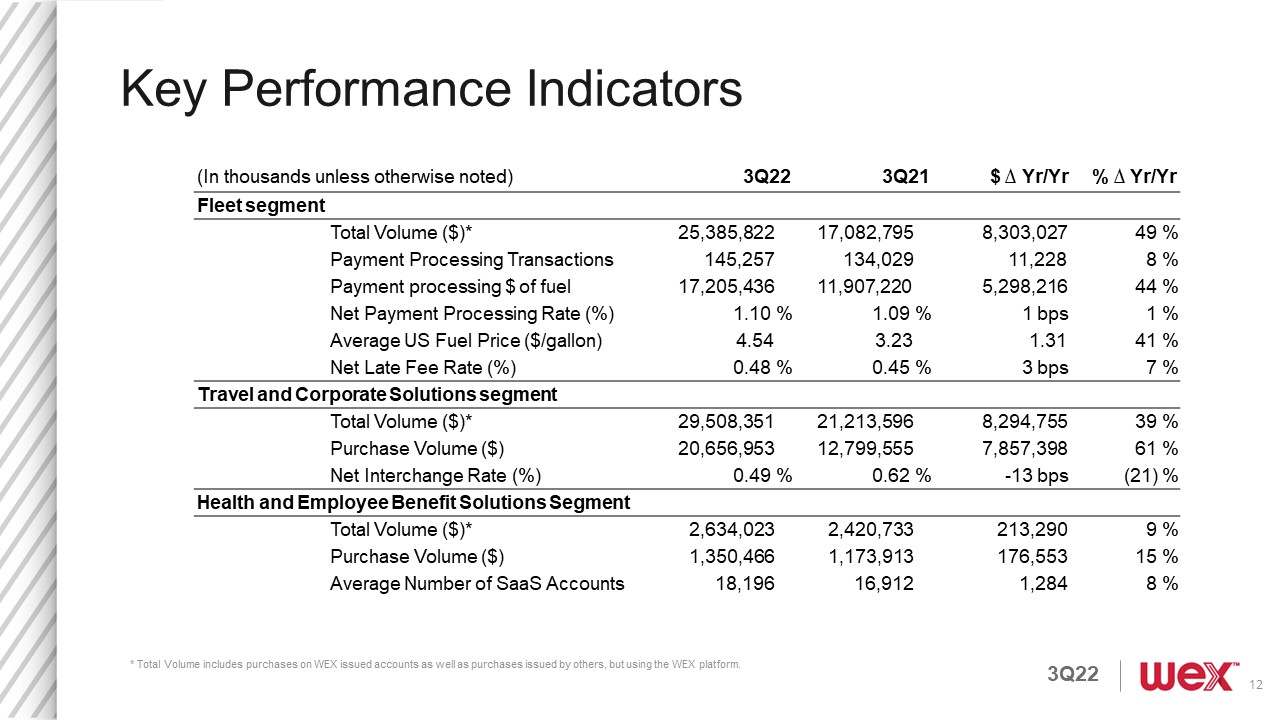
- Total volume across the Company totaled $57.5 billion, an increase of 41% from the third quarter of 2021.
- Fleet Solutions segment payment processing transactions increased 8% from the third quarter of 2021 to 145.3 million.
- Average number of vehicles serviced was approximately 18.3 million, an increase of 13% from the third quarter of 2021.
- Health and Employee Benefit Solutions’ average number of Software-as-a-Service (SaaS) accounts in the U.S. grew 8% to 18.2 million from 16.9 million in the third quarter of 2021.
- Travel and Corporate Solutions’ segment purchase volume grew 61% to $20.7 billion from $12.8 billion in the third quarter of 2021.
- During the third quarter of 2022 the Company repurchased 434,582 shares of its stock for a total cost of approximately $69 million.
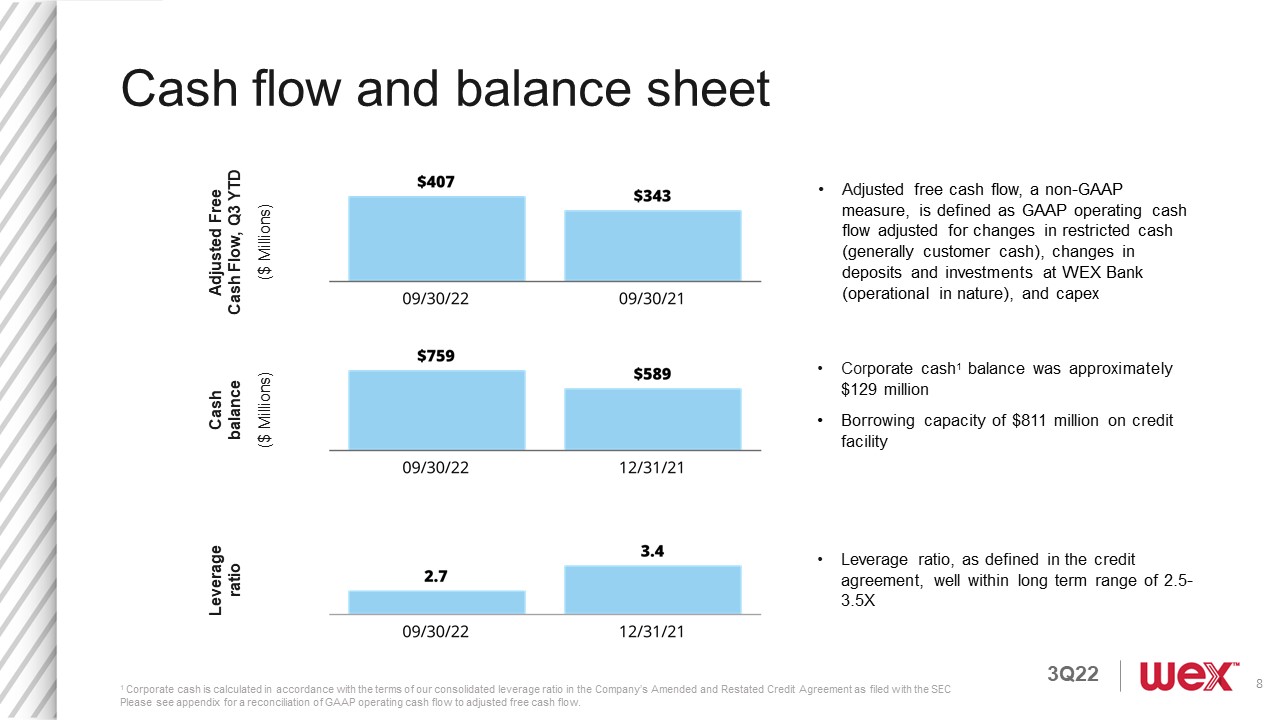
- Cash flow provided by operating activities through the third quarter of this year is $456.6 million. Adjusted free cash flow, which is a non-GAAP measure, is $406.8 million for the same period of time. Please see reconciliation of this
non-GAAP measure to operating cash flow in exhibit 1.
“We delivered excellent third quarter results, achieving strong top-line growth while continuing to make good progress on our strategic objectives,” said Jagtar Narula, WEX’s Chief Financial Officer. “As a result, I’m pleased to share that
we are again raising our full year guidance.”
Financial Guidance and Assumptions
The Company provides revenue guidance on a GAAP basis and earnings guidance on a non-GAAP basis, due to the uncertainty and the indeterminate amount of certain elements that are included in reported GAAP earnings.
- For the fourth quarter of 2022, the Company expects revenue in the range of $570 million to $580 million and adjusted net income in the range of $3.15 to $3.25 per diluted share.
- For the full year 2022, the Company now expects revenue in the range of $2.302 billion to $2.312 billion, up from the prior guidance range of $2.250 billion to $2.280 billion. Adjusted net income is now expected to be in the range of
$13.24 to $13.34 per diluted share, an increase from the prior guidance range of $13.05 to $13.30 per diluted share.
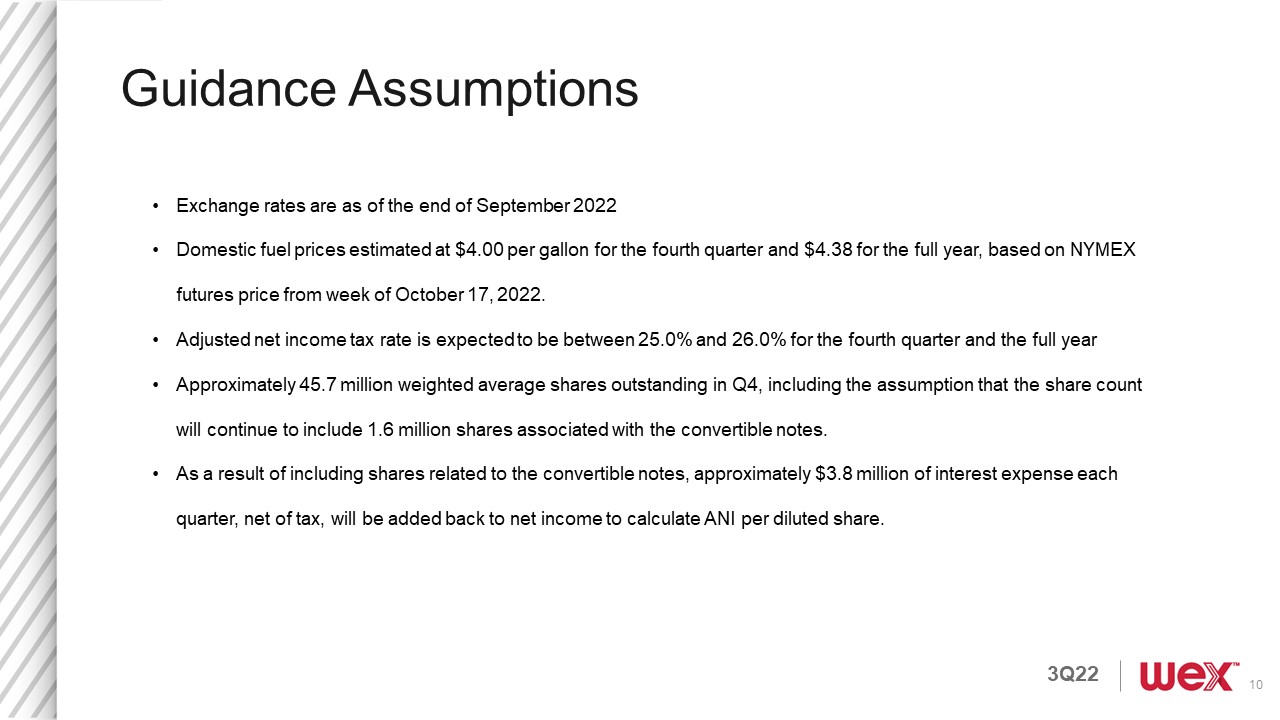
Fourth quarter and full year 2022 guidance is based on assumed average U.S. retail fuel prices of $4.00 and $4.38 per gallon, respectively. The fuel prices referenced above are based on the applicable NYMEX futures price from the week of
October 17, 2022. Our guidance assumes approximately 46.3 million fully diluted shares outstanding for the full year.
The Company's adjusted net income guidance, which is a non-GAAP measure, excludes unrealized gains and losses on financial instruments, net foreign currency gains and losses, changes in fair value of contingent consideration,
acquisition-related intangible amortization, other acquisition and divestiture related items, stock-based compensation, other costs, impairment charges, debt restructuring and debt issuance cost amortization, adjustments attributable to our
non-controlling interests and certain tax related items. We are unable to reconcile our adjusted net income guidance to the comparable GAAP measure without unreasonable effort because of the difficulty in predicting the amounts to be
adjusted, including, but not limited to, foreign currency exchange rates, unrealized gains and losses on financial instruments, and acquisition and divestiture related items, which may have a significant impact on our financial results.
Additional Information
Management uses the non-GAAP measures presented within this earnings release to evaluate the Company's performance on a comparable basis. Management believes that investors may find these measures useful for the same purposes, but cautions
that they should not be considered a substitute for, or superior to, disclosure in accordance with GAAP.
To provide investors with additional insight into its operational performance, WEX has included in this earnings release in: Exhibit 1, reconciliations of non-GAAP measures referenced in this earnings release; in Exhibit 2, tables
illustrating the impact of foreign currency rates and fuel prices for each of our reportable segments for the three and nine months ended September 30, 2022; and in Exhibit 3, a table of selected non-financial metrics for the quarter ended
September 30, 2022 and the four preceding quarters. The Company is also providing segment revenue for the three and nine months ended September 30, 2022 and 2021 in Exhibit 4 and information regarding segment adjusted operating income margin
and adjusted operating income margin in Exhibit 5.
Conference Call Details
In conjunction with this announcement, WEX will host a conference call today, October 27, 2022, at 10:00 a.m. (ET). As previously announced, the conference call will be webcast live on the Internet, and can be accessed along with the
accompanying slides at the Investor Relations section of the WEX website, www.wexinc.com. The live conference call also can be accessed by dialing (888) 510-2008 or (646) 960-0306. The Conference ID number is 2237921. A replay of the webcast
and the accompanying slides will be available on the Company's website.
About WEX
WEX (NYSE: WEX) is the global commerce platform that simplifies the business of running a business. WEX has created a powerful ecosystem that offers seamlessly embedded, personalized solutions for its customers around the world. Through its
rich data and specialized expertise in simplifying benefits, reimagining mobility and paying and getting paid, WEX aims to make it easy for companies to overcome complexity and reach their full potential. For more information, please visit
www.wexinc.com.
Forward-Looking Statements
This earnings release include forward-looking statements including, but not limited to, statements about management’s plan and goals. Any statements in this earnings release that are not statements of historical facts are forward-looking
statements. When used in this earnings release, the words “anticipate,” “believe,” “continue,” “could,” “estimate,” “expect,” “intend,” “may,” “plan,” “project”, “will” and similar expressions are intended to identify forward-looking
statements, although not all forward-looking statements contain such words. Forward-looking statements relate to our future plans, objectives, expectations and intentions and are not historical facts and accordingly involve known and unknown
risks and uncertainties and other factors that may cause the actual results or performance to be materially different from future results or performance expressed or implied by these forward-looking statements. The following factors, among
others, could cause actual results to differ materially from those contained in forward-looking statements made in this earnings release and in oral statements made by our authorized officers: the effects of general economic conditions,
including a decline in demand for fuel, travel related services, or healthcare related services, and payment and transaction processing activity; the impact of the level of, and fluctuations in, fuel prices and fuel spreads, including the
resulting impact on the Company’s revenues and net income; the impact and size of credit losses, including losses attributable to fraud; breaches of, or other issues with, the Company’s technology systems or those of its third-party service
providers and any resulting negative impact on its reputation, liabilities or relationships with customers or merchants; the actions of regulatory bodies, including banking and securities regulators, and the Company’s and its industrial
bank’s responses thereto, or possible changes in banking or financial regulations impacting the Company’s industrial bank, the Company as the corporate parent or other subsidiaries or affiliates; failure to expand the Company’s technological
capabilities and service offerings as rapidly as the Company’s competitors; the failure to maintain or renew key customer and partner agreements and relationships, or to maintain volumes under such agreements; the failure to comply with the
applicable requirements of MasterCard or Visa contracts and rules; changes in interest rates and the rate of inflation; the failure to comply with the Treasury Regulations applicable to non-bank custodians; the extent to which the COVID-19
pandemic, including emergence of new variants, and measures taken in response thereto impact the Company’s employees, business, results of operations and financial condition in excess of current expectations, particularly with respect to
demand for worldwide travel; the ability to attract and retain employees; limitations on or compression of interchange fees; the effects of the Company’s business expansion and acquisition efforts; the failure of corporate investments to
result in anticipated strategic value; potential adverse changes to business or employee relationships, including those resulting from the completion of an acquisition; uncertainty of the expected financial performance of the combined
operations following completion of an acquisition; the failure to realize anticipated synergies and cost savings from the Company’s acquisitions; the impact of changes to the Company’s credit standards; the impact of foreign currency exchange
rates on the Company’s operations, revenue and income; the impact of the Company’s debt instruments on the Company’s operations; the impact of leverage on the Company’s operations, results or borrowing capacity generally, and as a result of
acquisitions specifically; the impact of sales or dispositions of significant amounts of the Company’s outstanding common stock into the public market, or the perception that such sales or dispositions could occur; the possible dilution to
the Company’s stockholders caused by the issuance of additional shares of common stock or equity-linked securities, whether as result of the Company’s convertible notes or otherwise; the impact of the transition from LIBOR as a global
benchmark to a replacement rate; the incurrence of impairment charges if the Company’s assessment of the fair value of certain of its reporting units changes; the uncertainties of litigation; as well as other risks and uncertainties
identified in Item 1A of the Company’s Annual Report on Form 10-K for the year ended December 31, 2021, filed with the Securities and Exchange Commission on March 1, 2022. The Company's forward-looking statements do not reflect the potential
future impact of any alliance, merger, acquisition, disposition or stock repurchases. The forward-looking statements speak only as of the date of the initial filing of this earnings release and undue reliance should not be placed on these
statements. The Company disclaims any obligation to update any forward-looking statements as a result of new information, future events or otherwise.
|
WEX INC.
|
|
CONDENSED CONSOLIDATED STATEMENTS OF OPERATIONS
|
|
(in thousands, except per share data)
|
|
(unaudited)
|
|
|
|
|
|
|
Three months ended September 30,
|
|
Nine months ended September 30,
|
|
|
2022
|
|
2021
|
|
2022
|
|
2021
|
|
Revenues
|
|
|
|
|
|
|
|
|
Payment processing revenue
|
$
|
309,032
|
|
|
$
|
226,126
|
|
|
$
|
860,815
|
|
|
$
|
627,941
|
|
|
Account servicing revenue
|
|
138,324
|
|
|
|
137,724
|
|
|
|
415,903
|
|
|
|
389,344
|
|
|
Finance fee revenue
|
|
96,698
|
|
|
|
67,769
|
|
|
|
260,590
|
|
|
|
179,421
|
|
|
Other revenue
|
|
72,075
|
|
|
|
51,145
|
|
|
|
194,593
|
|
|
|
156,298
|
|
|
Total revenues
|
|
616,129
|
|
|
|
482,764
|
|
|
|
1,731,901
|
|
|
|
1,353,004
|
|
|
Cost of services
|
|
|
|
|
|
|
|
|
Processing costs
|
|
146,316
|
|
|
|
121,207
|
|
|
|
416,258
|
|
|
|
347,177
|
|
|
Service fees
|
|
16,614
|
|
|
|
14,246
|
|
|
|
47,220
|
|
|
|
39,151
|
|
|
Provision for credit losses
|
|
54,030
|
|
|
|
14,127
|
|
|
|
121,856
|
|
|
|
32,148
|
|
|
Operating interest
|
|
7,887
|
|
|
|
2,124
|
|
|
|
13,384
|
|
|
|
7,019
|
|
|
Depreciation and amortization
|
|
27,265
|
|
|
|
28,226
|
|
|
|
79,900
|
|
|
|
83,871
|
|
|
Total cost of services
|
|
252,112
|
|
|
|
179,930
|
|
|
|
678,618
|
|
|
|
509,366
|
|
|
General and administrative
|
|
86,506
|
|
|
|
79,486
|
|
|
|
248,651
|
|
|
|
245,460
|
|
|
Sales and marketing
|
|
80,882
|
|
|
|
82,225
|
|
|
|
235,267
|
|
|
|
246,177
|
|
|
Depreciation and amortization
|
|
38,855
|
|
|
|
40,301
|
|
|
|
118,186
|
|
|
|
118,360
|
|
|
Impairment charges
|
|
136,486
|
|
|
|
—
|
|
|
|
136,486
|
|
|
|
—
|
|
|
Operating income
|
|
21,288
|
|
|
|
100,822
|
|
|
|
314,693
|
|
|
|
233,641
|
|
|
Financing interest expense
|
|
(34,419
|
)
|
|
|
(32,493
|
)
|
|
|
(95,928
|
)
|
|
|
(98,250
|
)
|
|
Change in fair value of contingent consideration
|
|
(30,300
|
)
|
|
|
2,800
|
|
|
|
(135,100
|
)
|
|
|
(44,900
|
)
|
|
Other income
|
|
—
|
|
|
|
3,617
|
|
|
|
—
|
|
|
|
3,617
|
|
|
Net foreign currency loss
|
|
(23,445
|
)
|
|
|
(9,962
|
)
|
|
|
(37,847
|
)
|
|
|
(11,375
|
)
|
|
Net unrealized gain on financial instruments
|
|
23,540
|
|
|
|
6,424
|
|
|
|
90,261
|
|
|
|
19,470
|
|
|
(Loss) income before income taxes
|
|
(43,336
|
)
|
|
|
71,208
|
|
|
|
136,079
|
|
|
|
102,203
|
|
|
Income tax expense
|
|
809
|
|
|
|
19,340
|
|
|
|
57,309
|
|
|
|
16,924
|
|
|
Net (loss) income
|
|
(44,145
|
)
|
|
|
51,868
|
|
|
|
78,770
|
|
|
|
85,279
|
|
|
Less: Net income from non-controlling interests
|
|
—
|
|
|
|
134
|
|
|
|
268
|
|
|
|
1,099
|
|
|
Net (loss) income attributable to WEX Inc.
|
$
|
(44,145
|
)
|
|
$
|
51,734
|
|
|
$
|
78,502
|
|
|
$
|
84,180
|
|
|
Change in value of redeemable non-controlling interest
|
|
—
|
|
|
|
(3,416
|
)
|
|
|
34,245
|
|
|
|
(72,283
|
)
|
|
Net (loss) income attributable to shareholders
|
$
|
(44,145
|
)
|
|
$
|
48,318
|
|
|
$
|
112,747
|
|
|
$
|
11,897
|
|
|
|
|
|
|
|
|
|
|
|
Net (loss) income attributable to shareholders per share:
|
|
|
|
|
|
|
|
|
Basic
|
$
|
(1.00
|
)
|
|
$
|
1.08
|
|
|
$
|
2.53
|
|
|
$
|
0.27
|
|
|
Diluted
|
$
|
(1.00
|
)
|
|
$
|
1.07
|
|
|
$
|
2.51
|
|
|
$
|
0.26
|
|
|
Weighted average common shares outstanding:
|
|
|
|
|
|
|
|
|
Basic
|
|
44,229
|
|
|
|
44,861
|
|
|
|
44,644
|
|
|
|
44,664
|
|
|
Diluted
|
|
44,229
|
|
|
|
45,279
|
|
|
|
44,972
|
|
|
|
45,334
|
|
|
WEX INC.
|
|
CONDENSED CONSOLIDATED BALANCE SHEETS
|
|
(in thousands)
|
|
(unaudited)
|
|
|
|
|
|
|
September 30,
2022
|
|
December 31,
2021
|
|
Assets
|
|
|
|
|
Cash and cash equivalents
|
$
|
759,375
|
|
$
|
588,923
|
|
Restricted cash
|
|
942,132
|
|
|
667,915
|
|
Accounts receivable
|
|
3,830,178
|
|
|
2,891,242
|
|
Investment securities
|
|
1,379,411
|
|
|
948,677
|
|
Securitized accounts receivable, restricted
|
|
143,252
|
|
|
125,186
|
|
Prepaid expenses and other current assets
|
|
144,379
|
|
|
77,569
|
|
Total current assets
|
|
7,198,727
|
|
|
5,299,512
|
|
Property, equipment and capitalized software
|
|
186,819
|
|
|
179,531
|
|
Goodwill and other intangible assets
|
|
4,216,687
|
|
|
4,551,353
|
|
Investment securities
|
|
36,005
|
|
|
39,650
|
|
Deferred income taxes, net
|
|
20,667
|
|
|
5,635
|
|
Other assets
|
|
250,243
|
|
|
231,147
|
|
Total assets
|
$
|
11,909,148
|
|
$
|
10,306,828
|
|
|
|
|
|
|
Liabilities and Stockholders’ Equity
|
|
|
|
|
Accounts payable
|
$
|
1,561,033
|
|
$
|
1,021,911
|
|
Accrued expenses
|
|
567,036
|
|
|
476,971
|
|
Restricted cash payable
|
|
942,153
|
|
|
668,014
|
|
Short-term deposits
|
|
3,145,770
|
|
|
2,026,420
|
|
Short-term debt, net
|
|
156,483
|
|
|
155,769
|
|
Other current liabilities
|
|
41,782
|
|
|
50,614
|
|
Total current liabilities
|
|
6,414,257
|
|
|
4,399,699
|
|
Long-term debt, net
|
|
2,644,478
|
|
|
2,695,365
|
|
Long-term deposits
|
|
489,942
|
|
|
652,214
|
|
Deferred income taxes, net
|
|
155,536
|
|
|
192,965
|
|
Other liabilities
|
|
573,849
|
|
|
273,706
|
|
Total liabilities
|
|
10,278,062
|
|
|
8,213,949
|
|
Redeemable non-controlling interest
|
|
—
|
|
|
254,106
|
|
Total stockholders’ equity
|
|
1,631,086
|
|
|
1,838,773
|
|
Total liabilities and stockholders’ equity
|
$
|
11,909,148
|
|
$
|
10,306,828
|
|
WEX INC.
|
|
CONDENSED CONSOLIDATED STATEMENTS OF CASH FLOWS
|
|
(in thousands)
|
|
(unaudited)
|
|
|
|
|
Nine Months Ended September 30,
|
|
|
2022
|
|
2021
|
|
Cash flows from operating activities
|
|
|
|
|
Net income
|
$
|
78,770
|
|
|
$
|
85,279
|
|
|
Adjustments to reconcile net income to net cash provided by (used for) operating activities:
|
|
|
|
|
Change in fair value of contingent consideration
|
|
135,100
|
|
|
|
44,900
|
|
|
Stock-based compensation
|
|
76,760
|
|
|
|
60,250
|
|
|
Depreciation and amortization
|
|
198,086
|
|
|
|
202,231
|
|
|
Gain on sale of equity investment
|
|
—
|
|
|
|
(3,617
|
)
|
|
Amortization of premiums on investment securities
|
|
3,958
|
|
|
|
—
|
|
|
Debt issuance cost amortization and accretion expense
|
|
12,595
|
|
|
|
13,315
|
|
|
Deferred tax benefit
|
|
(54,085
|
)
|
|
|
(8,829
|
)
|
|
Provision for credit losses
|
|
121,856
|
|
|
|
32,148
|
|
|
Impairment charges
|
|
136,486
|
|
|
|
—
|
|
|
Other non-cash gains
|
|
(58,159
|
)
|
|
|
(7,499
|
)
|
|
Changes in operating assets and liabilities, net of effects of acquisitions:
|
|
|
|
|
Accounts receivable and securitized accounts receivable
|
|
(1,147,791
|
)
|
|
|
(1,138,233
|
)
|
|
Prepaid expenses and other current and other long-term assets
|
|
(11,233
|
)
|
|
|
13,212
|
|
|
Accounts payable
|
|
568,438
|
|
|
|
517,455
|
|
|
Accrued expenses and restricted cash payable
|
|
389,896
|
|
|
|
211,855
|
|
|
Income taxes
|
|
10,838
|
|
|
|
(12,363
|
)
|
|
Other current and other long-term liabilities
|
|
(4,871
|
)
|
|
|
(20,459
|
)
|
|
Net cash provided by (used for) operating activities
|
|
456,644
|
|
|
|
(10,355
|
)
|
|
Cash flows from investing activities
|
|
|
|
|
Purchases of property, equipment and capitalized software
|
|
(75,476
|
)
|
|
|
(55,484
|
)
|
|
Cash proceeds from sale of equity investment
|
|
—
|
|
|
|
3,117
|
|
|
Purchases of equity securities
|
|
(267
|
)
|
|
|
(250
|
)
|
|
Maturities of equity securities
|
|
—
|
|
|
|
130
|
|
|
Purchases of available-for-sale debt securities
|
|
(632,782
|
)
|
|
|
—
|
|
|
Sales and maturities of available-for-sale debt securities
|
|
47,972
|
|
|
|
—
|
|
|
Acquisitions, net of cash and restricted cash acquired
|
|
(3,338
|
)
|
|
|
(558,247
|
)
|
|
Net cash used for investing activities
|
|
(663,891
|
)
|
|
|
(610,734
|
)
|
|
Cash flows from financing activities
|
|
|
|
|
Repurchase of share-based awards to satisfy tax withholdings
|
|
(17,101
|
)
|
|
|
(23,012
|
)
|
|
Purchase of treasury shares
|
|
(149,608
|
)
|
|
|
—
|
|
|
Proceeds from stock option exercises
|
|
3,779
|
|
|
|
43,744
|
|
|
Net change in deposits
|
|
960,551
|
|
|
|
558,042
|
|
|
Net activity on other debt
|
|
28,448
|
|
|
|
21,500
|
|
|
Borrowings on revolving credit facility
|
|
1,825,400
|
|
|
|
1,176,300
|
|
|
Repayments on revolving credit facility
|
|
(1,856,999
|
)
|
|
|
(962,900
|
)
|
|
Borrowings on term loans
|
|
—
|
|
|
|
112,819
|
|
|
Repayments on term loans
|
|
(47,506
|
)
|
|
|
(47,824
|
)
|
|
Redemption of Notes
|
|
—
|
|
|
|
(400,000
|
)
|
|
Debt issuance costs
|
|
—
|
|
|
|
(8,934
|
)
|
|
Net change in securitized debt
|
|
6,417
|
|
|
|
8,004
|
|
|
Net cash provided by financing activities
|
|
753,381
|
|
|
|
477,739
|
|
|
Effect of exchange rates on cash, cash equivalents and restricted cash
|
|
(101,465
|
)
|
|
|
(24,037
|
)
|
|
Net change in cash, cash equivalents and restricted cash
|
|
444,669
|
|
|
|
(167,387
|
)
|
|
Cash, cash equivalents and restricted cash, beginning of period(a)
|
|
1,256,838
|
|
|
|
1,329,653
|
|
|
Cash, cash equivalents and restricted cash, end of period(a)
|
$
|
1,701,507
|
|
|
$
|
1,162,266
|
|
|
Exhibit 1
Reconciliation of Non-GAAP Measures
(in thousands, except per share data)
(unaudited)
|
|
Reconciliation of GAAP Net Income Attributable to Shareholders to Adjusted Net Income Attributable to Shareholders
|
|
|
|
|
Three Months Ended September 30,
|
|
|
2022
|
|
2021
|
|
|
|
|
per diluted share
|
|
|
|
per diluted share
|
|
Net (loss) income attributable to shareholders
|
$ (44,145)
|
|
$ (1.00)
|
|
$ 48,318
|
|
$ 1.07
|
|
Unrealized gain on financial instruments
|
(23,540)
|
|
(0.53)
|
|
(6,424)
|
|
(0.14)
|
|
Net foreign currency loss
|
23,445
|
|
0.53
|
|
9,962
|
|
0.22
|
|
Change in fair value of contingent consideration
|
30,300
|
|
0.69
|
|
(2,800)
|
|
(0.06)
|
|
Acquisition–related intangible amortization
|
42,486
|
|
0.96
|
|
46,965
|
|
1.04
|
|
Other acquisition and divestiture related items
|
4,142
|
|
0.09
|
|
3,395
|
|
0.07
|
|
Stock–based compensation
|
27,873
|
|
0.63
|
|
22,166
|
|
0.49
|
|
Other costs
|
8,806
|
|
0.20
|
|
1,711
|
|
0.04
|
|
Impairment charges
|
136,486
|
|
3.09
|
|
—
|
|
—
|
|
Debt restructuring and debt issuance cost amortization
|
4,704
|
|
0.11
|
|
2,879
|
|
0.06
|
|
ANI adjustments attributable to non–controlling interests
|
—
|
|
—
|
|
2,848
|
|
0.06
|
|
Tax related items
|
(52,804)
|
|
(1.19)
|
|
(17,904)
|
|
(0.40)
|
|
Dilutive impact of stock awards1
|
—
|
|
(0.02)
|
|
—
|
|
—
|
|
Dilutive impact of convertible debt2
|
—
|
|
(0.05)
|
|
—
|
|
—
|
|
Adjusted net income attributable to shareholders
|
$ 157,753
|
|
$ 3.51
|
|
$ 111,116
|
|
$ 2.45
|
|
|
|
|
|
|
|
|
|
|
Nine Months Ended September 30,
|
|
|
2022
|
|
2021
|
|
|
|
|
per diluted share
|
|
|
|
per diluted share
|
|
Net income attributable to shareholders
|
$ 112,747
|
|
$ 2.51
|
|
$ 11,897
|
|
$ 0.26
|
|
Unrealized gain on financial instruments
|
(90,261)
|
|
(2.01)
|
|
(19,470)
|
|
(0.43)
|
|
Net foreign currency loss
|
37,847
|
|
0.84
|
|
11,375
|
|
0.25
|
|
Change in fair value of contingent consideration
|
135,100
|
|
3.00
|
|
44,900
|
|
0.99
|
|
Acquisition–related intangible amortization
|
127,743
|
|
2.84
|
|
134,713
|
|
2.97
|
|
Other acquisition and divestiture related items
|
15,143
|
|
0.34
|
|
28,881
|
|
0.64
|
|
Stock–based compensation
|
78,360
|
|
1.74
|
|
62,771
|
|
1.38
|
|
Other costs
|
24,911
|
|
0.55
|
|
15,653
|
|
0.35
|
|
Impairment charges
|
136,486
|
|
3.03
|
|
—
|
|
—
|
|
Debt restructuring and debt issuance cost amortization
|
12,677
|
|
0.28
|
|
19,432
|
|
0.43
|
|
ANI adjustments attributable to non–controlling interests
|
(34,587)
|
|
(0.77)
|
|
69,854
|
|
1.54
|
|
Tax related items
|
(97,977)
|
|
(2.18)
|
|
(82,722)
|
|
(1.82)
|
|
Dilutive impact of convertible debt2
|
—
|
|
(0.08)
|
|
—
|
|
—
|
|
Adjusted net income attributable to shareholders
|
$ 458,189
|
|
$ 10.09
|
|
$ 297,284
|
|
$ 6.56
|
1 As the Company reported a net loss for the three months ended September 30, 2022 under U.S. Generally Accepted Accounting Principles (“GAAP”), the diluted weighted average shares outstanding equals the basic weighted average
shares outstanding for that period. The non-GAAP adjustments described above resulted in adjusted net income attributable to shareholders (versus a loss on a GAAP basis) for the three months ended September 30, 2022. Therefore, dilutive
common stock equivalents have been included in the calculation of adjusted diluted weighted average shares outstanding to arrive at adjusted per share data.
2 During the three and nine months ended September 30, 2022, the dilutive impact of convertible notes has been calculated under the 'if-converted' method in accordance with GAAP. Under such method, $3.8 million and $11.3
million of interest expense associated with our convertible notes, net of tax, was added back to adjusted net income for the three and nine months ended September 30, 2022, respectively, and approximately 1.6 million shares of the Company’s
common stock associated with the assumed conversion of the convertible notes as of the beginning of the periods were included in the calculation of adjusted net income per diluted share, as the effect of including such adjustments was
dilutive.
|
Reconciliation of GAAP Operating Income to Total Segment Adjusted Operating Income and Adjusted Operating Income
|
|
|
|
|
|
|
Three Months Ended September 30,
|
|
Nine Months Ended September 30,
|
|
|
2022
|
|
2021
|
|
2022
|
|
2021
|
|
Operating income
|
$
|
21,288
|
|
|
$
|
100,822
|
|
|
$
|
314,693
|
|
|
$
|
233,641
|
|
|
Unallocated corporate expenses
|
|
23,918
|
|
|
|
20,977
|
|
|
|
63,915
|
|
|
|
54,360
|
|
|
Acquisition-related intangible amortization
|
|
42,486
|
|
|
|
46,965
|
|
|
|
127,743
|
|
|
|
134,713
|
|
|
Other acquisition and divestiture related items
|
|
4,142
|
|
|
|
7,012
|
|
|
|
15,143
|
|
|
|
32,498
|
|
|
Stock-based compensation
|
|
27,873
|
|
|
|
22,166
|
|
|
|
78,360
|
|
|
|
62,771
|
|
|
Other costs
|
|
8,806
|
|
|
|
1,711
|
|
|
|
24,911
|
|
|
|
15,653
|
|
|
Debt restructuring costs
|
|
72
|
|
|
|
120
|
|
|
|
43
|
|
|
|
6,056
|
|
|
Impairment charges
|
|
136,486
|
|
|
|
—
|
|
|
|
136,486
|
|
|
|
—
|
|
|
Total segment adjusted operating income
|
$
|
265,071
|
|
|
$
|
199,773
|
|
|
$
|
761,294
|
|
|
$
|
539,692
|
|
|
Unallocated corporate expenses
|
|
(23,918
|
)
|
|
|
(20,977
|
)
|
|
|
(63,915
|
)
|
|
|
(54,360
|
)
|
|
Adjusted operating income
|
$
|
241,153
|
|
|
$
|
178,796
|
|
|
$
|
697,379
|
|
|
$
|
485,332
|
|
The Company's non-GAAP adjusted net income excludes unrealized gains and losses on financial instruments, net foreign currency gains and losses, changes in fair value of contingent consideration, acquisition-related intangible amortization,
other acquisition and divestiture related items, stock-based compensation, impairment charges, other costs, debt restructuring and debt issuance cost amortization, adjustments attributable to our non-controlling interests and certain tax
related items.
The Company's non-GAAP adjusted operating income excludes acquisition-related intangible amortization, other acquisition and divestiture related items, stock-based compensation, other costs, debt restructuring costs and impairment charges.
Total segment adjusted operating income incorporates these same adjustments and further excludes unallocated corporate expenses.
Although adjusted net income, adjusted operating income and total segment adjusted operating income are not calculated in accordance with GAAP, these non-GAAP measures are integral to the Company's reporting and planning processes and the
chief operating decision maker of the Company uses segment adjusted operating income to allocate resources among our operating segments. The Company considers these measures integral because they exclude the above specified items that the
Company's management excludes in evaluating the Company's performance. Specifically, in addition to evaluating the Company's performance on a GAAP basis, management evaluates the Company's performance on a basis that excludes the above items
because:
- Exclusion of the non-cash, mark-to-market adjustments on financial instruments, including interest rate swap agreements and investment securities, helps management identify and assess trends in the Company's underlying business that
might otherwise be obscured due to quarterly non-cash earnings fluctuations associated with these financial instruments. Additionally, the non-cash mark-to-market adjustments on financial instruments are difficult to forecast accurately,
making comparisons across historical and future quarters difficult to evaluate.
- Net foreign currency gains and losses primarily result from the remeasurement to functional currency of cash, accounts receivable and accounts payable balances, certain intercompany notes denominated in foreign currencies and any gain or
loss on foreign currency hedges relating to these items. The exclusion of these items helps management compare changes in operating results between periods that might otherwise be obscured due to currency fluctuations.
- The change in fair value of contingent consideration, which is related to the acquisition of certain contractual rights to serve as custodian or sub-custodian to health savings accounts, is dependent upon changes in future interest rate
assumptions and has no significant impact on the ongoing operations of the Company. Additionally, the non-cash, mark-to-market adjustments on financial instruments are difficult to forecast accurately, making comparisons across historical
and future quarters difficult to evaluate.
- The Company considers certain acquisition-related costs, including certain financing costs, investment banking fees, warranty and indemnity insurance, certain integration-related expenses and amortization of acquired intangibles, as well
as gains and losses from divestitures to be unpredictable, dependent on factors that may be outside of our control and unrelated to the continuing operations of the acquired or divested business or the Company. In addition, the size and
complexity of an acquisition, which often drives the magnitude of acquisition-related costs, may not be indicative of such future costs. The Company believes that excluding acquisition-related costs and gains or losses on divestitures
facilitates the comparison of our financial results to the Company's historical operating results and to other companies in our industry.
- Stock-based compensation is different from other forms of compensation as it is a non-cash expense. For example, a cash salary generally has a fixed and unvarying cash cost. In contrast, the expense associated with an equity-based award
is generally unrelated to the amount of cash ultimately received by the employee, and the cost to the Company is based on a stock-based compensation valuation methodology and underlying assumptions that may vary over time.
- Impairment charges represent non-cash asset write-offs, which do not reflect recurring costs that would be relevant to the Company’s continuing operations. The Company believes that excluding these nonrecurring expenses facilitates the
comparison of our financial results to the Company’s historical operating results and to other companies in its industry;
- We exclude certain other costs when evaluating our continuing business performance when such items are not consistently occurring and do not reflect expected future operating expense, nor provide insight into the fundamentals of current
or past operations of our business. These include non-recurring professional service costs, costs related to certain identified initiatives (including technology initiatives) to further streamline the business, improve the Company's
efficiency, create synergies and globalize the Company's operations, all with an objective to improve scale and efficiency and increase profitability going forward. For the nine months ended September 30, 2021, other costs additionally
include a penalty incurred on a vendor contract termination.
- Debt restructuring and debt issuance cost amortization are unrelated to the continuing operations of the Company. Debt restructuring costs are not consistently occurring and do not reflect expected future operating expense, nor do they
provide insight into the fundamentals of current or past operations of our business. In addition, since debt issuance cost amortization is dependent upon the financing method, which can vary widely company to company, we believe that
excluding these costs helps to facilitate comparison to historical results as well as to other companies within our industry.
- The adjustments attributable to non-controlling interests, including adjustments to the redemption value of a non-controlling interest, have no significant impact on the ongoing operations of the business.
- The tax related items are the difference between the Company’s GAAP tax provision and a pro forma tax provision based upon the Company’s adjusted net income before taxes as well as the impact from certain discrete tax items. The
methodology utilized for calculating the Company’s adjusted net income tax provision is the same methodology utilized in calculating the Company’s GAAP tax provision.
- The Company does not allocate certain corporate expenses to our operating segments, as these items are centrally controlled and are not directly attributable to any reportable segment.
For the same reasons, WEX believes that adjusted net income, adjusted operating income and total segment adjusted operating income may also be useful to investors when evaluating the Company's performance. However, because adjusted net
income, adjusted operating income and total segment adjusted operating income are non-GAAP measures, they should not be considered as a substitute for, or superior to, net income, operating income or cash flows from operating activities as
determined in accordance with GAAP. In addition, adjusted net income, adjusted operating income and total segment adjusted operating income as used by WEX may not be comparable to similarly titled measures employed by other companies.
Reconciliation of GAAP Operating Cash Flow to Adjusted Free Cash Flow
The Company’s non-GAAP adjusted free cash flow is calculated as cash generated from operations, excluding the change in restricted cash payable, less net purchases (maturities) of available-for-sale debt securities and capital expenditures
plus the change in net deposits. Although non-GAAP adjusted free cash flow is not calculated in accordance with GAAP, we feel adjusted free cash flow is a useful measure because: Adjusted free cash flow indicates the level of cash generated
by the operations of the business after appropriate reinvestment for recurring investments in property, equipment and capitalized software that are required to operate the business; the activity in restricted cash payable is not able to be
used by the Company for general corporate purposes; changes in net deposits occur on a daily basis as a regular part of operations and available for sale investments are made as a result of deposits gathered operationally. We believe this is
a useful measure for investors to further evaluate the results of operations. However, because adjusted free cash flow is a non-GAAP measure, it should not be considered as a substitute for, or superior to, operating cash flow as determined
in accordance with GAAP. In addition, adjusted free cash flow as used by WEX may not be comparable to similarly titled measures employed by other companies. Refer to our reconciliation below for our calculation of adjusted free cash flow for
the nine months ended September 30, 2022 and 2021.
|
|
Nine Months ended
September 30,
|
|
|
|
2022
|
|
2021
|
|
Operating cash flow, as reported
|
|
$
|
456,644
|
|
|
$
|
(10,355
|
)
|
|
Excluding:
|
|
|
|
|
|
(Increases) decreases in restricted cash payable
|
|
|
(350,079
|
)
|
|
|
(148,925
|
)
|
|
Adjusted for certain investing and financing activities:
|
|
|
|
|
|
Increases (decreases) in net deposits
|
|
|
960,551
|
|
|
|
558,042
|
|
|
Less: Purchases of available-for-sale debt securities, net of sales and maturities
|
|
|
(584,810
|
)
|
|
|
—
|
|
|
Less: Capital expenditures
|
|
|
(75,476
|
)
|
|
|
(55,484
|
)
|
|
Adjusted free cash flow
|
|
$
|
406,830
|
|
|
$
|
343,278
|
|
|
Exhibit 2
Impact of Certain Macro Factors on Reported Revenue and Adjusted Net Income
(in thousands, except per share data)
(unaudited)
|
|
The tables below show the impact of certain macro factors on reported revenue:
|
|
|
|
|
Segment Revenue Results
|
|
|
Fleet Solutions
|
|
Travel and Corporate
Solutions
|
|
Health and Employee
Benefit Solutions
|
|
Total WEX Inc.
|
|
|
Three months ended September 30,
|
|
|
2022
|
|
2021
|
|
2022
|
|
2021
|
|
2022
|
|
2021
|
|
2022
|
|
2021
|
|
Reported revenue
|
$
|
378,094
|
|
|
$
|
286,361
|
|
$
|
113,975
|
|
$
|
91,002
|
|
$
|
124,060
|
|
$
|
105,401
|
|
$
|
616,129
|
|
|
$
|
482,764
|
|
FX impact (favorable) /
unfavorable
|
$
|
5,270
|
|
|
$
|
—
|
|
$
|
6,466
|
|
$
|
—
|
|
$
|
—
|
|
$
|
—
|
|
$
|
11,736
|
|
|
$
|
—
|
|
PPG impact (favorable) /
unfavorable
|
$
|
(55,726
|
)
|
|
$
|
—
|
|
$
|
—
|
|
$
|
—
|
|
$
|
—
|
|
$
|
—
|
|
$
|
(55,726
|
)
|
|
$
|
—
|
|
|
|
|
|
|
|
|
|
|
|
|
|
|
|
|
|
|
Segment Revenue Results
|
|
|
Fleet Solutions
|
|
Travel and Corporate
Solutions
|
|
Health and Employee
Benefit Solutions
|
|
Total WEX Inc.
|
|
|
Nine Months Ended September 30,
|
|
|
2022
|
|
2021
|
|
2022
|
|
2021
|
|
2022
|
|
2021
|
|
2022
|
|
2021
|
|
Reported revenue
|
|
1,076,456
|
|
|
|
804,586
|
|
|
291,636
|
|
|
243,406
|
|
|
363,809
|
|
|
305,012
|
|
$
|
1,731,901
|
|
|
$
|
1,353,004
|
|
FX impact (favorable) /
unfavorable
|
$
|
12,203
|
|
|
$
|
—
|
|
$
|
10,726
|
|
$
|
—
|
|
$
|
—
|
|
$
|
—
|
|
$
|
22,929
|
|
|
$
|
—
|
|
PPG impact (favorable) /
unfavorable
|
$
|
(161,068
|
)
|
|
$
|
—
|
|
$
|
—
|
|
$
|
—
|
|
$
|
—
|
|
$
|
—
|
|
$
|
(161,068
|
)
|
|
$
|
—
|
To determine the impact of foreign exchange translation (“FX”) on revenue, revenue from entities whose functional currency is not denominated in U.S. dollars, as well as revenue from purchase volume transacted in non-U.S. denominated
currencies, were translated using the weighted average exchange rates for the same period in the prior year, exclusive of revenue derived from acquisitions for one year following the acquisition dates.
To determine the impact of price per gallon of fuel (“PPG”) on revenue, revenue subject to changes in fuel prices was calculated based on the average retail price of fuel for the same period in the prior year for the portion of our business
that earns revenue based on a percentage of fuel spend, exclusive of revenue derived from acquisitions for one year following the acquisition dates. For the portions of our business that earn revenue based on margin spreads, revenue was
calculated utilizing the comparable margin from the prior year.
The table below shows the impact of certain macro factors on Adjusted Net Income:
|
Segment Estimated Adjusted Net Income Impact
|
|
|
Fleet Solutions
|
|
Travel and Corporate
Solutions
|
|
Health and Employee
Benefit Solutions
|
|
|
Three months ended September 30,
|
|
|
2022
|
|
2021
|
|
2022
|
|
2021
|
|
2022
|
|
2021
|
|
FX impact (favorable) / unfavorable
|
$
|
3,262
|
|
|
$
|
—
|
|
$
|
5,915
|
|
$
|
—
|
|
$
|
(2
|
)
|
|
$
|
—
|
|
PPG impact (favorable) / unfavorable
|
$
|
(36,643
|
)
|
|
$
|
—
|
|
$
|
—
|
|
$
|
—
|
|
$
|
—
|
|
|
$
|
—
|
|
|
|
|
|
|
|
|
|
|
|
|
|
|
Segment Estimated Adjusted Net Income Impact
|
|
|
Fleet Solutions
|
|
Travel and Corporate
Solutions
|
|
Health and Employee
Benefit Solutions
|
|
|
Nine Months Ended September 30,
|
|
|
2022
|
|
2021
|
|
2022
|
|
2021
|
|
2022
|
|
2021
|
|
FX impact (favorable) / unfavorable
|
$
|
6,157
|
|
|
$
|
—
|
|
$
|
8,464
|
|
$
|
—
|
|
$
|
22
|
|
|
$
|
—
|
|
PPG impact (favorable) / unfavorable
|
$
|
(102,709
|
)
|
|
$
|
—
|
|
$
|
—
|
|
$
|
—
|
|
$
|
—
|
|
|
$
|
—
|
To determine the estimated adjusted net income impact of FX on revenue and expenses from entities whose functional currency is not denominated in U.S. dollars, as well as revenue and variable expenses from purchase volume transacted in
non-U.S. denominated currencies, amounts were translated using the weighted average exchange rates for the same period in the prior year, net of tax, exclusive of revenue and expenses derived from acquisitions for one year following the
acquisition dates.
To determine the estimated adjusted net income impact of PPG, revenue and certain variable expenses impacted by changes in fuel prices were adjusted based on the average retail price of fuel for the same period in the prior year for the
portion of our business that earns revenue based on a percentage of fuel spend, net of applicable taxes, exclusive of revenue and expenses derived from acquisitions for one year following the acquisition dates. For the portions of our
business that earn revenue based on margin spreads, revenue was adjusted to the comparable margin from the prior year, net of non-controlling interests and applicable taxes.
|
Exhibit 3
Selected Non-Financial Metrics
(unaudited)
|
|
|
Q3 2022
|
|
Q2 2022
|
|
Q1 2022
|
|
Q4 2021
|
|
Q3 2021
|
|
Fleet Solutions:
|
|
|
|
|
|
|
|
|
|
|
Payment processing transactions (000s) (1)
|
|
145,257
|
|
|
|
143,163
|
|
|
|
132,663
|
|
|
|
132,894
|
|
|
|
134,029
|
|
|
Payment processing gallons of fuel (000s) (2)
|
|
3,729,664
|
|
|
|
3,690,875
|
|
|
|
3,549,562
|
|
|
|
3,569,979
|
|
|
|
3,576,781
|
|
|
Average US fuel price (US$ / gallon)
|
$
|
4.54
|
|
|
$
|
4.98
|
|
|
$
|
3.95
|
|
|
$
|
3.42
|
|
|
$
|
3.23
|
|
|
Payment processing $ of fuel (000s) (3)
|
$
|
17,205,436
|
|
|
$
|
18,639,733
|
|
|
$
|
14,390,257
|
|
|
$
|
12,600,745
|
|
|
$
|
11,907,220
|
|
|
Net payment processing rate (4)
|
|
1.10
|
%
|
|
|
1.09
|
%
|
|
|
1.06
|
%
|
|
|
1.16
|
%
|
|
|
1.09
|
%
|
|
Payment processing revenue (000s)
|
$
|
188,584
|
|
|
$
|
202,359
|
|
|
$
|
151,906
|
|
|
$
|
146,333
|
|
|
$
|
130,006
|
|
|
Net late fee rate (5)
|
|
0.48
|
%
|
|
|
0.38
|
%
|
|
|
0.44
|
%
|
|
|
0.48
|
%
|
|
|
0.45
|
%
|
|
Late fee revenue (000s) (6)
|
$
|
83,194
|
|
|
$
|
70,830
|
|
|
$
|
63,110
|
|
|
$
|
60,101
|
|
|
$
|
53,104
|
|
|
Travel and Corporate Solutions:
|
|
|
|
|
|
|
|
|
|
|
Purchase volume (000s) (7)
|
$
|
20,656,953
|
|
|
$
|
17,119,962
|
|
|
$
|
11,809,450
|
|
|
$
|
10,916,015
|
|
|
$
|
12,799,555
|
|
|
Net interchange rate (8)
|
|
0.49
|
%
|
|
|
0.52
|
%
|
|
|
0.55
|
%
|
|
|
0.63
|
%
|
|
|
0.62
|
%
|
|
Payment solutions processing revenue (000s)
|
$
|
101,533
|
|
|
$
|
88,608
|
|
|
$
|
65,075
|
|
|
$
|
68,747
|
|
|
$
|
79,815
|
|
|
Health and Employee Benefit Solutions:
|
|
|
|
|
|
|
|
|
|
|
Purchase volume (000s) (9)
|
$
|
1,350,466
|
|
|
$
|
1,514,004
|
|
|
$
|
1,630,218
|
|
|
$
|
1,146,436
|
|
|
$
|
1,173,913
|
|
|
Average number of SaaS accounts (000s) (10)
|
|
18,196
|
|
|
|
17,572
|
|
|
|
17,847
|
|
|
|
16,222
|
|
|
|
16,912
|
|
Definitions and explanations:
(1) Payment processing transactions represents the total number of purchases made by fleets that have a payment processing relationship with WEX.
(2) Payment processing gallons of fuel represents the total number of gallons of fuel purchased by fleets that have a payment processing relationship with WEX.
(3) Payment processing $ of fuel represents the total dollar value of the fuel purchased by fleets that have a payment processing relationship with WEX.
(4) Net payment processing rate represents the percentage of the dollar value of each payment processing transaction that WEX records as revenue from merchants, less certain discounts given to customers and network fees.
(5) Net late fee rate represents late fee revenue as a percentage of fuel purchased by fleets that have a payment processing relationship with WEX.
(6) Late fee revenue represents fees charged for payments not made within the terms of the customer agreement based upon the outstanding customer receivable balance.
(7) Purchase volume represents the total dollar value of all WEX issued transactions that use WEX corporate card products and virtual card products.
(8) Net interchange rate represents the percentage of the dollar value of each payment processing transaction that WEX records as revenue from merchants, less certain discounts given to customers and network fees.
(9) Purchase volume in the Health and Employee Benefit Solutions segment represents the total U.S. dollar value of all transactions where interchange is earned by WEX.
(10) Average number of Health and Employee Benefit Solutions accounts represents the number of active Consumer Directed Health, COBRA, and billing accounts on our SaaS platforms in the United States.
|
Exhibit 4
|
|
Segment Revenue Information
|
|
(in thousands)
|
|
(unaudited)
|
|
|
|
|
|
|
|
|
|
|
Three months ended
September 30,
|
|
Increase (decrease)
|
|
Nine months ended
September 30,
|
|
Increase (decrease)
|
|
Fleet Solutions
|
2022
|
|
2021
|
|
Amount
|
|
Percent
|
|
2022
|
|
2021
|
|
Amount
|
|
Percent
|
|
Revenues
|
|
|
|
|
|
|
|
|
|
|
|
|
|
|
|
|
Payment processing revenue
|
$
|
188,586
|
|
$
|
130,006
|
|
$
|
58,580
|
|
|
45
|
%
|
|
$
|
542,851
|
|
$
|
367,032
|
|
$
|
175,819
|
|
|
48
|
%
|
|
Account servicing revenue
|
|
41,632
|
|
|
43,671
|
|
|
(2,039
|
)
|
|
(5
|
) %
|
|
|
127,935
|
|
|
125,955
|
|
|
1,980
|
|
|
2
|
%
|
|
Finance fee revenue
|
|
96,495
|
|
|
67,529
|
|
|
28,966
|
|
|
43
|
%
|
|
|
259,967
|
|
|
178,627
|
|
|
81,340
|
|
|
46
|
%
|
|
Other revenue
|
|
51,381
|
|
|
45,155
|
|
|
6,226
|
|
|
14
|
%
|
|
|
145,703
|
|
|
132,972
|
|
|
12,731
|
|
|
10
|
%
|
|
Total revenues
|
$
|
378,094
|
|
$
|
286,361
|
|
$
|
91,733
|
|
|
32
|
%
|
|
$
|
1,076,456
|
|
$
|
804,586
|
|
$
|
271,870
|
|
|
34
|
%
|
|
|
|
|
|
|
|
|
|
|
|
|
|
|
|
|
|
|
|
|
|
|
|
|
|
|
|
|
Three months ended
September 30,
|
|
Increase (decrease)
|
|
Nine months ended
September 30,
|
|
Increase (decrease)
|
|
Travel and Corporate Solutions
|
2022
|
|
2021
|
|
Amount
|
|
Percent
|
|
2022
|
|
2021
|
|
Amount
|
|
Percent
|
|
Revenues
|
|
|
|
|
|
|
|
|
|
|
|
|
|
|
|
|
Payment processing revenue
|
$
|
101,533
|
|
$
|
79,815
|
|
$
|
21,718
|
|
|
27
|
%
|
|
$
|
255,216
|
|
$
|
205,345
|
|
$
|
49,871
|
|
|
24
|
|
%
|
|
Account servicing revenue
|
|
10,748
|
|
|
10,908
|
|
|
(160
|
)
|
|
(1
|
) %
|
|
|
31,906
|
|
|
32,817
|
|
|
(911
|
)
|
|
(3
|
|
) %
|
|
Finance fee revenue
|
|
162
|
|
|
200
|
|
|
(38
|
)
|
|
(19
|
) %
|
|
|
519
|
|
|
693
|
|
|
(174
|
)
|
|
(25
|
|
) %
|
|
Other revenue
|
|
1,532
|
|
|
79
|
|
|
1,453
|
|
|
1,839
|
%
|
|
|
3,995
|
|
|
4,551
|
|
|
(556
|
)
|
|
(12
|
|
) %
|
|
Total revenues
|
$
|
113,975
|
|
$
|
91,002
|
|
$
|
22,973
|
|
|
25
|
%
|
|
$
|
291,636
|
|
$
|
243,406
|
|
$
|
48,230
|
|
|
20
|
|
%
|
|
|
|
|
|
|
|
|
|
|
|
|
|
|
|
|
|
|
|
|
|
|
|
|
|
|
|
|
|
Three months ended
September 30,
|
|
Increase (decrease)
|
|
Nine months ended
September 30,
|
|
Increase (decrease)
|
|
Health and Employee Benefit
Solutions
|
2022
|
|
2021
|
|
Amount
|
|
Percent
|
|
2022
|
|
2021
|
|
Amount
|
|
Percent
|
|
Revenues
|
|
|
|
|
|
|
|
|
|
|
|
|
|
|
|
|
Payment processing revenue
|
$
|
18,913
|
|
$
|
16,305
|
|
$
|
2,608
|
|
|
16
|
%
|
|
$
|
62,748
|
|
$
|
55,564
|
|
$
|
7,184
|
|
|
13
|
|
%
|
|
Account servicing revenue
|
|
85,944
|
|
|
83,145
|
|
|
2,799
|
|
|
3
|
%
|
|
|
256,062
|
|
|
230,572
|
|
|
25,490
|
|
|
11
|
|
%
|
|
Finance fee revenue
|
|
41
|
|
|
40
|
|
|
1
|
|
|
3
|
%
|
|
|
104
|
|
|
101
|
|
|
3
|
|
|
3
|
|
%
|
|
Other revenue
|
|
19,162
|
|
|
5,911
|
|
|
13,251
|
|
|
224
|
%
|
|
|
44,895
|
|
|
18,775
|
|
|
26,120
|
|
|
139
|
|
%
|
|
Total revenues
|
$
|
124,060
|
|
$
|
105,401
|
|
$
|
18,659
|
|
|
18
|
%
|
|
$
|
363,809
|
|
$
|
305,012
|
|
$
|
58,797
|
|
|
19
|
|
%
|
|
Exhibit 5
Segment Adjusted Operating Income and Adjusted Operating Income Margin Information
|
|
(in thousands)
|
|
(unaudited)
|
|
|
|
|
Segment Adjusted Operating Income
|
|
Segment Adjusted Operating Income
Margin(1)
|
|
|
Three Months Ended September 30,
|
|
Three Months Ended September 30,
|
|
|
2022
|
|
2021
|
|
2022
|
|
2021
|
|
Fleet Solutions
|
$
|
174,521
|
|
$
|
144,853
|
|
46.2
|
%
|
|
50.6
|
%
|
|
Travel and Corporate Solutions
|
$
|
60,289
|
|
$
|
31,057
|
|
52.9
|
%
|
|
34.1
|
%
|
|
Health and Employee Benefit Solutions
|
$
|
30,261
|
|
$
|
23,863
|
|
24.4
|
%
|
|
22.6
|
%
|
|
Total segment adjusted operating income
|
$
|
265,071
|
|
$
|
199,773
|
|
43.0
|
%
|
|
41.4
|
%
|
|
|
|
|
|
|
|
|
|
|
|
|
|
|
|
|
|
|
|
|
Segment Adjusted Operating Income
|
|
Segment Adjusted Operating Income
Margin(1)
|
|
|
Nine Months Ended September 30,
|
|
Nine Months Ended September 30,
|
|
|
2022
|
|
2021
|
|
2022
|
|
2021
|
|
Fleet Solutions
|
$
|
527,591
|
|
$
|
400,976
|
|
49.0
|
%
|
|
49.8
|
%
|
|
Travel and Corporate Solutions
|
$
|
139,635
|
|
$
|
55,229
|
|
47.9
|
%
|
|
22.7
|
%
|
|
Health and Employee Benefit Solutions
|
$
|
94,068
|
|
$
|
83,487
|
|
25.9
|
%
|
|
27.4
|
%
|
|
Total segment adjusted operating income
|
$
|
761,294
|
|
$
|
539,692
|
|
44.0
|
%
|
|
39.9
|
%
|
(1) Segment adjusted operating income margin is derived by dividing segment adjusted operating income by the revenue of the corresponding segment (or the entire Company in the case of total segment adjusted operating income).
See Exhibit 1 for a reconciliation of total segment adjusted operating income to GAAP operating income.
|
|
|
|
|
|
Three Months Ended September 30,
|
|
Nine Months Ended September 30,
|
|
|
2022
|
|
2021
|
|
2022
|
|
2021
|
|
Adjusted operating income
|
$
|
241,153
|
|
|
$
|
178,796
|
|
|
$
|
697,379
|
|
|
$
|
485,332
|
|
|
Adjusted operating income margin (1)
|
|
39.1
|
%
|
|
|
37.0
|
%
|
|
|
40.3
|
%
|
|
|
35.9
|
%
|
(1) Adjusted operating income margin is derived by dividing adjusted operating income by total revenues of the entire Company as shown on the Condensed Consolidated Statement of Operations. See Exhibit 1 for a reconciliation of
GAAP operating income to adjusted operating income.