Document
false0001262823 0001262823 2020-05-04 2020-05-04 0001262823 us-gaap:CommonStockMember 2020-05-04 2020-05-04 0001262823 wlk:OnePointSixTwoFivePercentageSeniorNotesDueTwentyTwentyNineMemberDomain 2020-05-04 2020-05-04


UNITED STATES
SECURITIES AND EXCHANGE COMMISSION
Washington, D.C. 20549

FORM 8-K

CURRENT REPORT
Pursuant to Section 13 or 15(d) of
the Securities Exchange Act of 1934
Date of Report (date of earliest event reported): May 4, 2020

Westlake Chemical Corporation
(Exact name of registrant as specified in its charter)

Delaware
 
001-32260
 
76-0346924
(State or other jurisdiction
of incorporation)
 
(Commission File Number)
 
(I.R.S. Employer
Identification No.)

2801 Post Oak Boulevard,
 
 Suite 600
 
 
Houston,
 
Texas
 
77056
(Address of principal executive offices)


(Zip Code)
Registrant's telephone number, including area code: (713) 960-9111

Check the appropriate box below if the Form 8-K filing is intended to simultaneously satisfy the filing obligation of the registrant under any of the following provisions:

☐
Written communications pursuant to Rule 425 under the Securities Act (17 CFR 230.425)
☐
Soliciting material pursuant to Rule 14a-12 under the Exchange Act (17 CFR 240.14a-12)
☐
Pre-commencement communications pursuant to Rule 14d-2(b) under the Exchange Act (17 CFR 240.14d-2(b))
☐
Pre-commencement communications pursuant to Rule 13e-4(c) under the Exchange Act (17 CFR 240.13e-4(c))

Securities registered pursuant to Section 12(b) of the Act:
Title of each class
Trading Symbol(s)
Name of each exchange on which registered
Common Stock, $0.01 par value
WLK
The New York Stock Exchange
1.625% Senior Notes due 2029
WLK29
The New York Stock Exchange

Indicate by check mark whether the registrant is an emerging growth company as defined in as defined in Rule 405 of the Securities Act of 1933 (§230.405 of this chapter) or Rule 12b-2 of the Securities Exchange Act of 1934 (§240.12b-2 of this chapter).
 
Emerging growth company ☐


If an emerging growth company, indicate by check mark if the registrant has elected not to use the extended transition period for complying with any new or revised financial accounting standards provided pursuant to Section 13(a) of the Exchange Act. ◻


Item 2.02. Results of Operations and Financial Condition.
On May 4, 2020, Westlake Chemical Corporation (the "Company") issued a press release announcing its 2020 first quarter results. A copy of the press release is furnished with this Current Report as Exhibit 99.1.
The information furnished pursuant to this Current Report, including Exhibit 99.1, shall not be deemed to be "filed" for the purposes of Section 18 of the Securities Exchange Act of 1934, as amended, and will not be incorporated by reference into any registration statement filed by Westlake Chemical Corporation under the Securities Act of 1933, as amended, unless specifically identified as being incorporated therein.
Item 7.01. Regulation FD Disclosure.
The Company is holding a conference call on May 4, 2020 to discuss its 2020 first quarter results. Information about the call can be found in the press release furnished with this Current Report as Exhibit 99.1. In addition, the Company made available an investor presentation regarding its 2020 first quarter results, which is furnished with this Current Report as Exhibit 99.2.
Item 9.01. Financial Statements and Exhibits.
(d) Exhibits
The following exhibits are furnished herewith:
99.1    Press release issued on May 4, 2020
99.2    Investor Presentation
104    The cover page from this Current Report on Form 8-K, formatted in Inline XBRL.


SIGNATURE
Pursuant to the requirements of the Securities Exchange Act of 1934, the Registrant has duly caused this report to be signed on its behalf by the undersigned hereunto duly authorized.


WESTLAKE CHEMICAL CORPORATION
Date:
May 4, 2020
 
By:
/S/ ALBERT CHAO


Albert Chao
President and Chief Executive Officer


EXHIBIT 99.1
WESTLAKE CHEMICAL CORPORATION

Contact—(713) 960-9111
Investors—Steve Bender
Media—L. Benjamin Ederington


Westlake Chemical Corporation Reports First Quarter 2020 Results
•
Net income of $1.13 per diluted share, or $145 million, for the first quarter of 2020
•
Cash and cash equivalents of $1.54 billion
•
EBITDA of $337 million for the first quarter of 2020
HOUSTON--(BUSINESS WIRE)-- Westlake Chemical Corporation (NYSE: WLK) (the "Company" or "Westlake") today reported net income attributable to Westlake for the three months ended March 31, 2020 of $145 million, or $1.13 per diluted share, on net sales of $1,932 million. Net income in the first quarter of 2020 increased by $73 million compared to first quarter 2019 net income of $72 million, or $0.55 per diluted share, on net sales of $2,025 million. The increase in net income was primarily due to the income tax rate benefit of $62 million, or $0.48 per diluted share, resulting from the carryback of federal net operating losses, as permitted under the CARES Act enacted in March 2020. Income from operations of $136 million for the first quarter of 2020 increased by $2 million from income from operations of $134 million for the first quarter of 2019. The increase in income from operations was primarily due to higher sales volumes for our major products, mostly offset by lower sales prices.
First quarter 2020 net income of $145 million, or $1.13 per diluted share, increased by $73 million from fourth quarter 2019 net income of $72 million, or $0.56 per diluted share. Income from operations of $136 million for the first quarter of 2020 increased by $34 million from income from operations of $102 million for the fourth quarter of 2019. The increases in income from operations versus the prior quarter were primarily due to higher sales volumes of our major products and lower feedstock and fuel costs partially offset by lower sales prices for caustic soda, while net income benefited from the tax items referred to in the preceding paragraph.
"We experienced a solid first quarter in 2020 anchored by strong sales volumes in both our Olefins and Vinyls segments," said Albert Chao, President and Chief Executive Officer. "The start of the first quarter saw strength in construction materials and flexible food packaging relative to the first quarter of 2019, but as we progressed through the first quarter, we began to see the impact on the demand for our products as a result of COVID-19 and the response thereto. With the outbreak of the pandemic, our first priority is to ensure the health and safety of our employees around the world who continue to work diligently to provide essential products that serve a number of industries, including healthcare, food services and packaging. We are confident that Westlake is well positioned to serve the needs of our customers while taking action to manage working capital, lower our operating costs and reduce capital expenditures."
Net cash provided by operating activities was $61 million for the first quarter of 2020. As of March 31, 2020, cash and cash equivalents were $1,537 million and long-term debt was $4,432 million. Capital expenditures for the first quarter of 2020 were $164 million.
EBITDA (earnings before interest expense, income taxes, depreciation and amortization) of $337 million for the first quarter of 2020 increased by $23 million compared to first quarter 2019 EBITDA of $314 million. First quarter 2020 EBITDA of $337 million increased by $41 million compared to fourth quarter 2019 EBITDA of $296 million. A reconciliation of EBITDA to net income, income from operations, and net cash provided by operating activities can be found in the financial schedules at the end of this press release.

i


OLEFINS SEGMENT
First quarter 2020 income from operations for the Olefins segment of $62 million increased by $25 million from first quarter 2019 income from operations of $37 million. This increase in income from operations versus the prior-year period was primarily due to higher polyethylene sales volumes and lower feedstock and fuel costs, partially offset by lower polyethylene sales prices as a result of increased olefins production from new industry capacity.
Olefins income from operations of $62 million in the first quarter of 2020 increased by $13 million from fourth quarter 2019 income from operations of $49 million. This increase in income from operations versus the prior quarter was primarily due to higher sales volumes of polyethylene and lower feedstock and fuel costs.
VINYLS SEGMENT
First quarter 2020 income from operations for the Vinyls segment of $73 million decreased by $28 million from first quarter 2019 income from operations of $101 million. This decrease in income from operations versus the prior-year period was primarily due to lower global sales prices for caustic soda and PVC resin resulting from slower global economic growth and the initial impact of COVID-19 in Asia and Europe. These decreases were partially offset by higher sales volumes for PVC resins and lower ethane feedstock and fuel costs as well as the contribution from our ethylene joint venture with Lotte Chemical in Lake Charles, Louisiana, which began operating in the summer of 2019.
Vinyls income from operations for the first quarter of 2020 of $73 million increased by $5 million from fourth quarter 2019 income from operations of $68 million primarily due to higher sales volumes and prices for PVC resin and lower ethane feedstock and fuel costs, partially offset by lower global sales prices for caustic soda.
The statements in this release and the related teleconference relating to matters that are not historical facts, including actions to manage working capital, lower operating costs and reduce capital expenditures, are forward-looking statements. These forward-looking statements are subject to significant risks and uncertainties. Actual results could differ materially, based on factors including, but not limited to: the COVID-19 pandemic and the response thereto; general economic and business conditions; the cyclical nature of the chemical industry; availability, cost and volatility of raw materials and utilities, including natural gas and natural gas liquids from shale production; the price of crude oil; uncertainties associated with the United States and worldwide economies, including those due to global economic and financial conditions; governmental regulatory actions, including environmental regulation and changes in trade policies; political unrest; industry production capacity and operating rates; the supply/demand balance for Westlake's products; competitive products and pricing pressures; access to capital markets; technological developments; the effect and results of litigation and settlements of litigation; operating interruptions; and other risk factors. For more detailed information about the factors that could cause actual results to differ materially, please refer to Westlake's Annual Report on Form 10-K for the year ended December 31, 2019, which was filed with the SEC in February 2020.

ii


Use of Non-GAAP Financial Measures
This release makes reference to certain "non-GAAP" financial measures, such as EBITDA, as defined in Regulation G of the U.S. Securities Exchange Act of 1934, as amended. For this purpose, a non-GAAP financial measure is generally defined by the Securities and Exchange Commission ("SEC") as a numerical measure of a registrant's historical or future financial performance, financial position or cash flows that (1) excludes amounts, or is subject to adjustments that have the effect of excluding amounts, that are included in the most directly comparable measure calculated and presented in accordance with GAAP in the statement of income, balance sheet or statement of cash flows (or equivalent statements) of the registrant; or (2) includes amounts, or is subject to adjustments that have the effect of including amounts, that are excluded from the most directly comparable measure so calculated and presented. We report our financial results in accordance with U.S. generally accepted accounting principles ("U.S. GAAP"), but believe that certain non-GAAP financial measures, such as EBITDA, provide useful supplemental information to investors regarding the underlying business trends and performance of the Company's ongoing operations and are useful for period-over-period comparisons of such operations. These non-GAAP financial measures should be considered as a supplement to, and not as a substitute for, or superior to, the financial measures prepared in accordance with U.S. GAAP. A reconciliation of EBITDA to net income, income from operations and net cash provided by operating activities can be found in the financial schedules at the end of this press release.
Westlake Chemical Corporation
Westlake is a global manufacturer and supplier of materials and innovative products that enhance life every day. Headquartered in Houston, we provide the building blocks for vital solutions — from packaging and healthcare products to automotive and consumer goods, to building and construction products. Westlake produces: ethylene; polyethylene; propylene; styrene; chlor-alkali and derivative products; PVC suspension and specialty resins; PVC compounds; building products including pipe, fittings and specialty components, decking, roofing, siding, trim and molding, and window lineals; and PVC film. For more information, visit the Company's web site at www.westlake.com.
Westlake Chemical Corporation Conference Call Information:
A conference call to discuss Westlake Chemical Corporation's first quarter 2020 results will be held Monday, May 4, 2020 at 11:00 AM Eastern Time (10:00 AM Central Time). To access the conference call, dial (855) 760-8160 or (704) 288-0624 for international callers, approximately 10 minutes prior to the scheduled start time and reference passcode 5672078.
A replay of the conference call will be available beginning two hours after its conclusion until 11:59 p.m. Eastern Time on May 11, 2020. To hear a replay, dial (855) 859-2056 or (404) 537-3406 for international callers. The replay passcode is 5672078.
The conference call will also be available via webcast at: https://edge.media-server.com/mmc/p/ksc4zxqo and the earnings release can be obtained via the Company's web page at: http://www.westlake.com/investor-relations.


iii


WESTLAKE CHEMICAL CORPORATION
CONSOLIDATED STATEMENTS OF OPERATIONS
(Unaudited)
 
 
Three Months Ended March 31,
 
 
2020
 
2019


(In millions of dollars, except per share data)
Net sales
 
$
1,932

 
$
2,025

Cost of sales
 
1,649

 
1,726

Gross profit
 
283

 
299

Selling, general and administrative expenses
 
120

 
116

Amortization of intangibles
 
27

 
27

Restructuring, transaction and integration-related costs
 
—

 
22

Income from operations
 
136

 
134

Interest expense
 
(31
)
 
(30
)
Other income, net
 
11

 
9

Income before income taxes
 
116

 
113

Provision for (benefit from) income taxes
 
(41
)
 
31

Net income
 
157

 
82

Net income attributable to noncontrolling interests
 
12

 
10

Net income attributable to Westlake Chemical Corporation
 
$
145

 
$
72

Earnings per common share attributable to Westlake Chemical Corporation:


Basic
 
$
1.13

 
$
0.56

Diluted
 
$
1.13

 
$
0.55


iv


WESTLAKE CHEMICAL CORPORATION
CONDENSED CONSOLIDATED BALANCE SHEETS
(Unaudited)
 
 
March 31,
2020
 
December 31,
2019


(In millions of dollars)
ASSETS


Current assets


Cash and cash equivalents
 
$
1,537

 
$
728

Accounts receivable, net
 
1,265

 
1,036

Inventories
 
934

 
936

Prepaid expenses and other current assets
 
32

 
42

Total current assets
 
3,768

 
2,742

Property, plant and equipment, net
 
6,883

 
6,912

Other assets, net
 
3,512

 
3,607

Total assets
 
$
14,163

 
$
13,261


LIABILITIES AND EQUITY


Current liabilities (accounts payable and accrued and other liabilities)
 
$
1,024

 
$
1,241

Long-term debt, net
 
4,432

 
3,445

Other liabilities
 
2,269

 
2,172

Total liabilities
 
7,725

 
6,858

Total Westlake Chemical Corporation stockholders' equity
 
5,893

 
5,860

Noncontrolling interests
 
545

 
543

Total equity
 
6,438

 
6,403

Total liabilities and equity
 
$
14,163

 
$
13,261


v


WESTLAKE CHEMICAL CORPORATION
CONDENSED CONSOLIDATED STATEMENTS OF CASH FLOWS
(Unaudited)
 
 
Three Months Ended March 31,
 
 
2020
 
2019


(In millions of dollars)
Cash flows from operating activities


Net income
 
$
157

 
$
82

Adjustments to reconcile net income to net cash provided by operating activities:


Depreciation and amortization
 
190

 
171

Deferred income taxes
 
126

 
15

Net loss on disposition and others
 
9

 
36

Other balance sheet changes
 
(421
)
 
(157
)
Net cash provided by operating activities
 
61

 
147

Cash flows from investing activities


Acquisition of businesses, net of cash acquired
 
—

 
(236
)
Additions to property, plant and equipment
 
(164
)
 
(203
)
Additions to investments in unconsolidated subsidiaries
 
—

 
(42
)
Return of investment from an equity investee
 
39

 
—

Other, net
 
(7
)
 
6

Net cash used for investing activities
 
(132
)
 
(475
)
Cash flows from financing activities


Dividends paid
 
(34
)
 
(33
)
Distributions to noncontrolling interests
 
(10
)
 
(8
)
Net proceeds from issuance of Westlake Chemical Partners LP common units
 
—

 
63

Proceeds from drawdown of revolver
 
1,000

 
—

Repayment of notes payable
 
(27
)
 
(4
)
Repurchase of common stock for treasury
 
(54
)
 
—

Other
 
8

 
3

Net cash provided by financing activities
 
883

 
21

Effect of exchange rate changes on cash, cash equivalents and restricted cash
 
(3
)
 
(1
)
Net increase (decrease) in cash, cash equivalents and restricted cash
 
809

 
(308
)
Cash, cash equivalents and restricted cash at beginning of period
 
750

 
775

Cash, cash equivalents and restricted cash at end of period
 
$
1,559

 
$
467


vi


WESTLAKE CHEMICAL CORPORATION
SEGMENT INFORMATION
(Unaudited)
 
 
Three Months Ended March 31,
 
 
2020
 
2019


(In millions of dollars)
Net external sales


Olefins
 
$
427

 
$
459

Vinyls
 
1,505

 
1,566


$
1,932

 
$
2,025

Income (loss) from operations


Olefins
 
$
62

 
$
37

Vinyls
 
73

 
101

Corporate and other
 
1

 
(4
)
 
 
$
136

 
$
134

Depreciation and amortization


Olefins
 
$
35

 
$
35

Vinyls
 
153

 
134

Corporate and other
 
2

 
2


$
190

 
$
171

Other income, net


Olefins
 
$
1

 
$
2

Vinyls
 
6

 
4

Corporate and other
 
4

 
3


$
11

 
$
9


vii


WESTLAKE CHEMICAL CORPORATION
RECONCILIATION OF EBITDA TO NET INCOME, INCOME FROM OPERATIONS AND
NET CASH PROVIDED BY OPERATING ACTIVITIES
(Unaudited)
 
 
Three Months Ended December 31,
 
Three Months Ended March 31,
 
 
2019
 
2020
 
2019


(In millions of dollars)
Net cash provided by operating activities
 
$
333

 
$
61

 
$
147

Changes in operating assets and liabilities and other
 
(228
)
 
222

 
(50
)
Deferred income taxes
 
(20
)
 
(126
)
 
(15
)
Net income
 
85

 
157

 
82

Less:


Other income, net
 
6

 
11

 
9

Interest expense
 
(35
)
 
(31
)
 
(30
)
Benefit from (provision for) income taxes
 
12

 
41

 
(31
)
Income from operations
 
102

 
136

 
134

Add:


Depreciation and amortization
 
188

 
190

 
171

Other income, net
 
6

 
11

 
9

EBITDA
 
$
296

 
$
337

 
$
314


viii


WESTLAKE CHEMICAL CORPORATION
SUPPLEMENTAL INFORMATION
Product Sales Price and Volume Variance by Operating Segments
 
 
First Quarter 2020 vs. First Quarter 2019
 
First Quarter 2020 vs. Fourth Quarter 2019
 
 
Average
Sales Price
 
Volume
 
Average
Sales Price
 
Volume
Olefins
 
-10.8
 %
 
+3.9
%
 
-2.6
 %
 
+10.0
%
Vinyls
 
-8.8
 %
 
+4.9
%
 
-1.4
 %
 
+2.8
%
Company
 
-9.3
 %
 
+4.7
%
 
-1.7
 %
 
+4.3
%
Average Quarterly Industry Prices (1) 
 
 
Quarter Ended
 
 
March 31,
2019
 
June 30,
2019
 
September 30,
2019
 
December 31,
2019
 
March 31,
2020
Average domestic prices


Ethane (cents/lb) (2)
 
10.0
 
7.1
 
5.8
 
6.3
 
4.7
Propane (cents/lb) (3)
 
15.7
 
12.8
 
10.3
 
11.8
 
8.8
Ethylene (cents/lb) (4)
 
17.0
 
13.7
 
20.7
 
22.8
 
15.8
Polyethylene (cents/lb) (5)
 
60.0
 
63.0
 
59.0
 
54.0
 
52.3
Styrene (cents/lb) (6)
 
78.8
 
80.8
 
79.9
 
77.1
 
62.3
Caustic soda ($/short ton) (7)
 
717
 
697
 
692
 
662
 
648
Chlorine ($/short ton) (8)
 
175
 
175
 
175
 
175
 
176
PVC (cents/lb) (9)
 
68.8
 
68.2
 
68.8
 
67.8
 
71.8


Average export prices


Polyethylene (cents/lb) (10)
 
44.0
 
42.8
 
39.7
 
37.7
 
38.9
Caustic soda ($/short ton) (11)
 
314
 
283
 
275
 
219
 
203
PVC (cents/lb) (12)
 
36.0
 
35.0
 
35.1
 
33.6
 
36.9
________________
(1)
Industry pricing data was obtained through IHS Markit ("IHS"). We have not independently verified the data.
(2)
Average Mont Belvieu spot prices of purity ethane over the period.
(3)
Average Mont Belvieu spot prices of non-TET propane over the period.
(4)
Average North American spot prices of ethylene over the period.
(5)
Average North American Net Transaction prices of polyethylene low density GP-Film grade over the period.
(6)
Average North American contract prices of styrene over the period.
(7)
Average USGC-CSLi index values for caustic soda over the period. As stated by IHS, "the caustic soda price listing represents the USGC-CSLi values. USGC-CSLi does not reflect contract price discounts, implementation lags, caps or other adjustments factors. Additionally, it is not intended to represent a simple arithmetic average of all market transactions occurring during the month. Rather, the USGC-CSLi is most representative of the month-to-month caustic soda price movement for contract volumes of liquid 50% caustic soda rather than the absolute value of contract prices at a particular point in time. It is intended to serve only as a benchmark."
(8)
Average North American contract prices of chlorine over the period.
(9)
Average North American contract prices of pipe grade polyvinyl chloride ("PVC") over the period. As stated by IHS, "the contract resin prices posted reflect an "index" or "market" for prices before discounts, rebates, incentives, etc."
(10)
Average North American export price for low density polyethylene GP-Film grade over the period.
(11)
Average North American low spot export prices of caustic soda over the period.
(12)
Average North American spot export prices of PVC over the period.

ix
Westlake Chemical Corporation First Quarter 2020 Earnings Presentation May 4, 2020
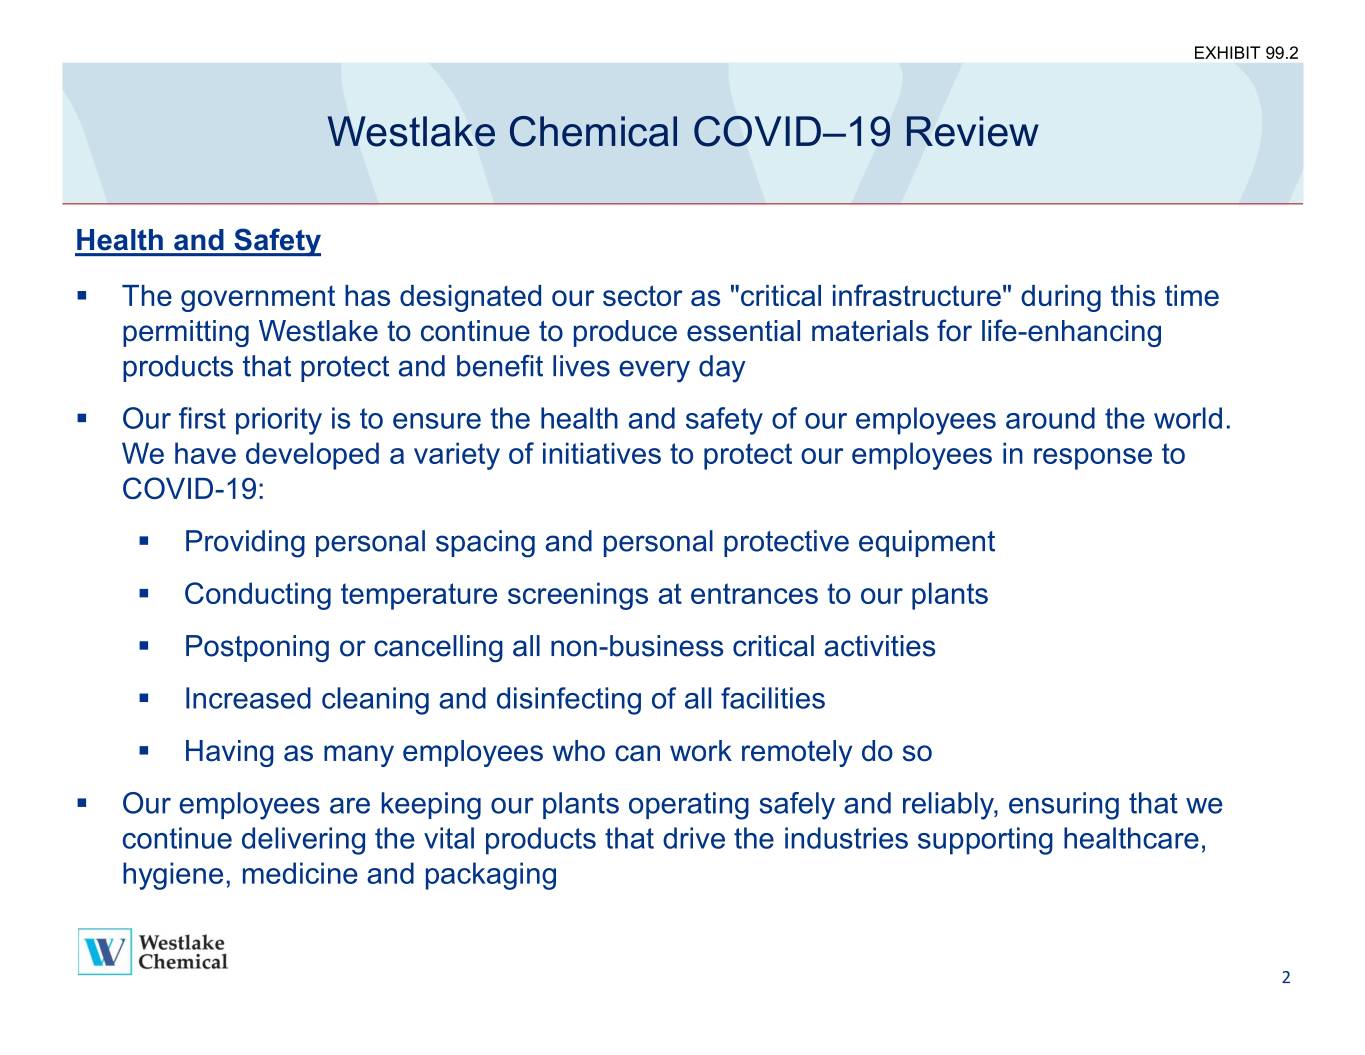

 
Westlake Chemical COVID–19 Review Health and Safety . The government has designated our sector as "critical infrastructure" during this time permitting Westlake to continue to produce essential materials for life-enhancing products that protect and benefit lives every day . Our first priority is to ensure the health and safety of our employees around the world. We have developed a variety of initiatives to protect our employees in response to COVID-19: . Providing personal spacing and personal protective equipment . Conducting temperature screenings at entrances to our plants . Postponing or cancelling all non-business critical activities . Increased cleaning and disinfecting of all facilities . Having as many employees who can work remotely do so . Our employees are keeping our plants operating safely and reliably, ensuring that we continue delivering the vital products that drive the industries supporting healthcare, hygiene, medicine and packaging 2
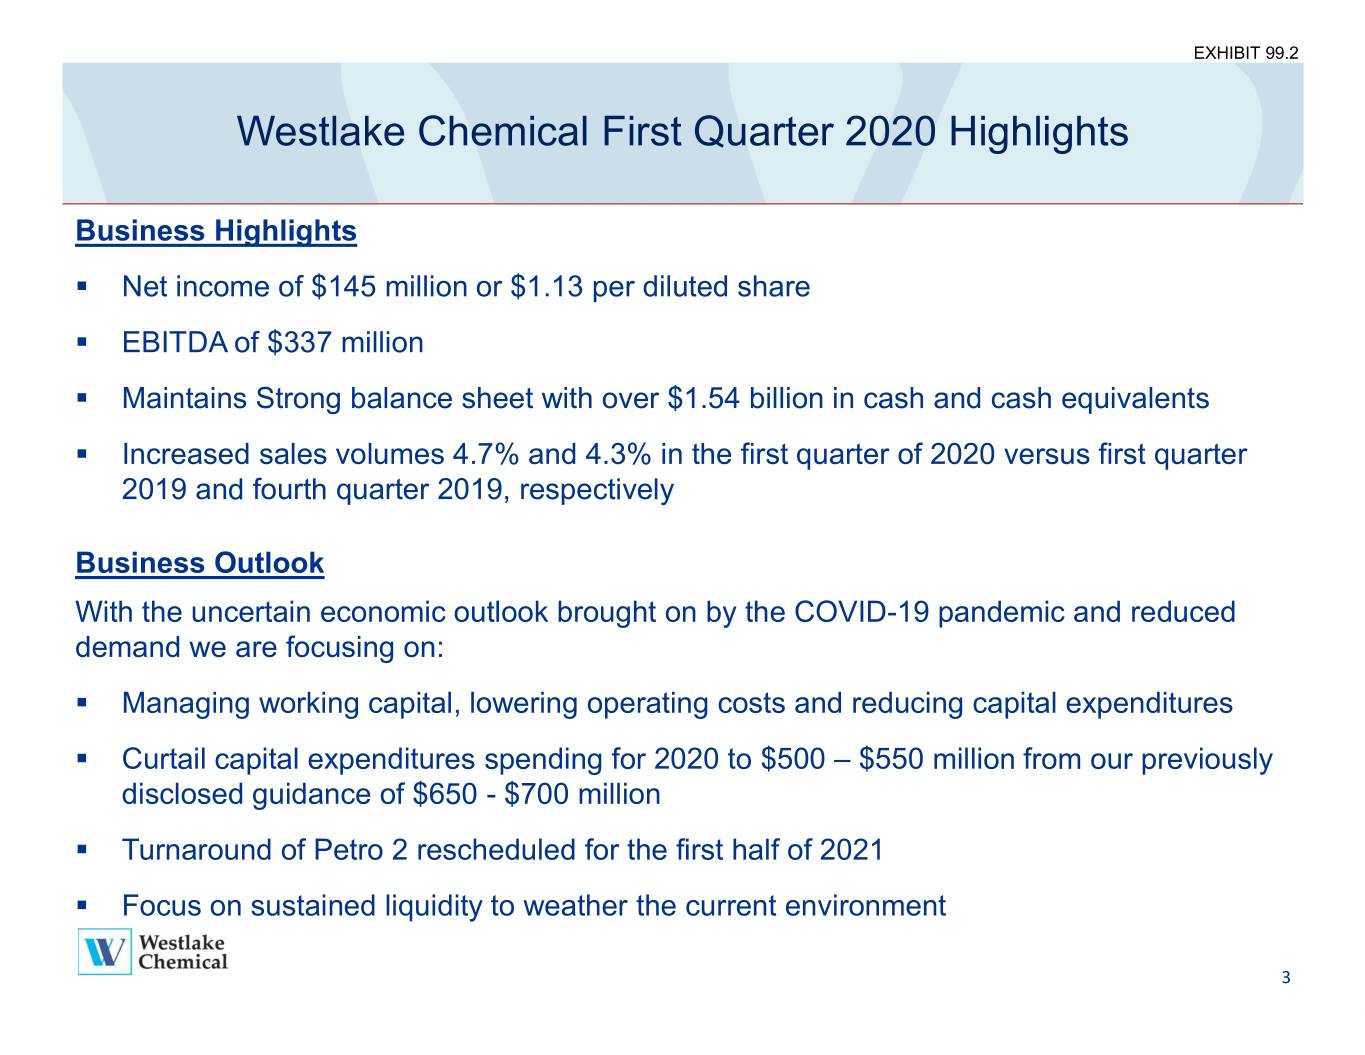

 
Westlake Chemical First Quarter 2020 Highlights Business Highlights . Net income of $145 million or $1.13 per diluted share . EBITDA of $337 million . Maintains Strong balance sheet with over $1.54 billion in cash and cash equivalents . Increased sales volumes 4.7% and 4.3% in the first quarter of 2020 versus first quarter 2019 and fourth quarter 2019, respectively Business Outlook With the uncertain economic outlook brought on by the COVID-19 pandemic and reduced demand we are focusing on: . Managing working capital, lowering operating costs and reducing capital expenditures . Curtail capital expenditures spending for 2020 to $500 – $550 million from our previously disclosed guidance of $650 - $700 million . Turnaround of Petro 2 rescheduled for the first half of 2021 . Focus on sustained liquidity to weather the current environment 3
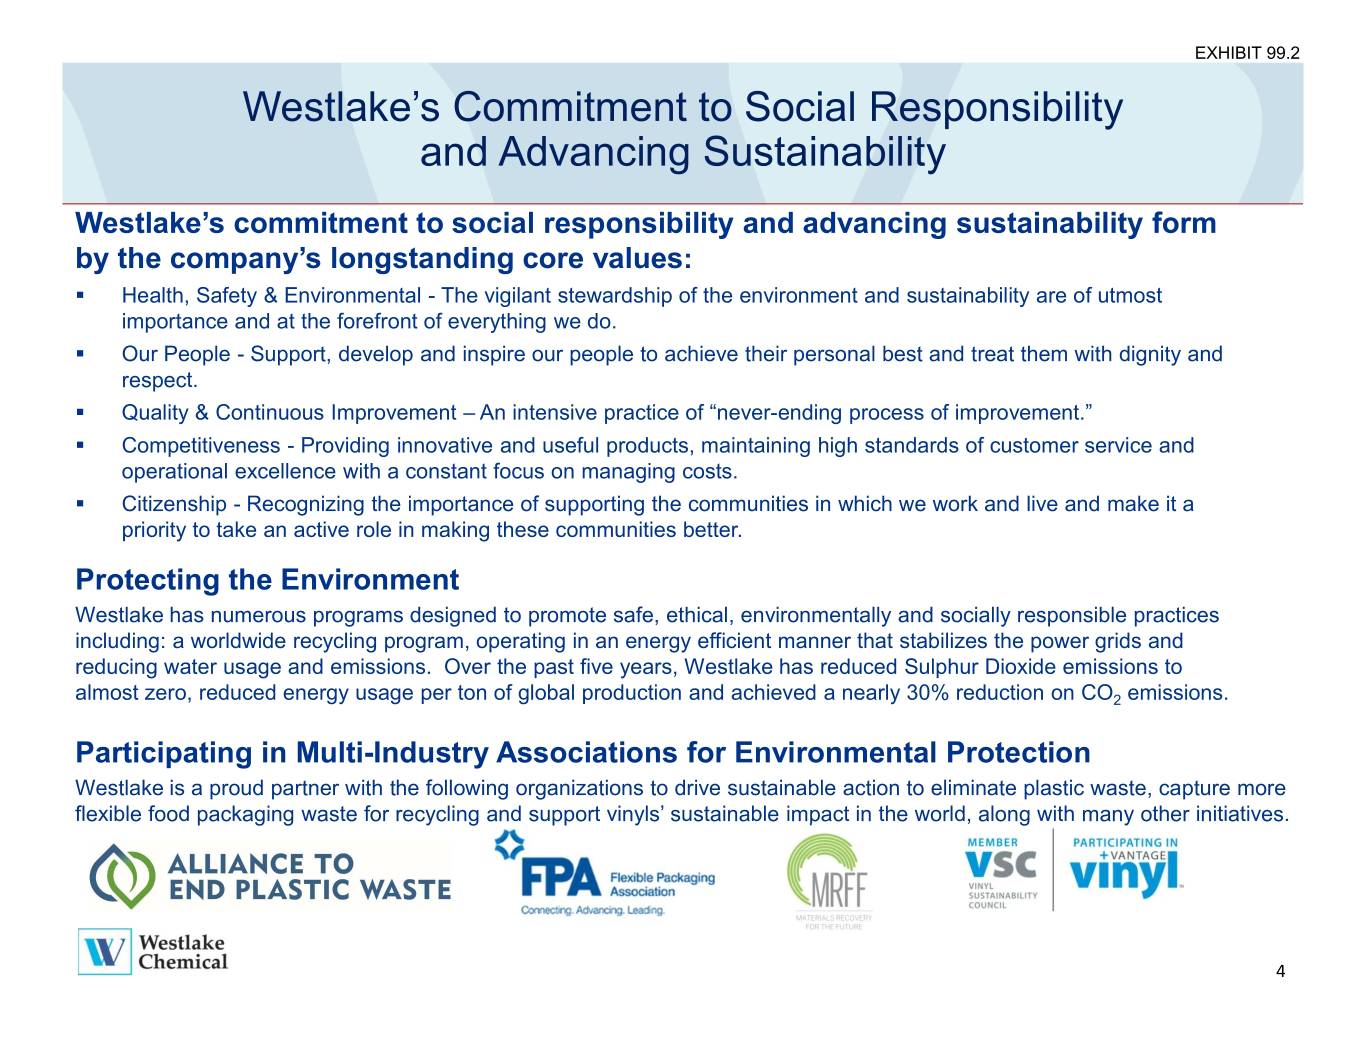

 
Westlake’s Commitment to Social Responsibility and Advancing Sustainability Westlake’s commitment to social responsibility and advancing sustainability form by the company’s longstanding core values: . Health, Safety & Environmental - The vigilant stewardship of the environment and sustainability are of utmost importance and at the forefront of everything we do. . Our People - Support, develop and inspire our people to achieve their personal best and treat them with dignity and respect. . Quality & Continuous Improvement – An intensive practice of “never-ending process of improvement.” . Competitiveness - Providing innovative and useful products, maintaining high standards of customer service and operational excellence with a constant focus on managing costs. . Citizenship - Recognizing the importance of supporting the communities in which we work and live and make it a priority to take an active role in making these communities better. Protecting the Environment Westlake has numerous programs designed to promote safe, ethical, environmentally and socially responsible practices including: a worldwide recycling program, operating in an energy efficient manner that stabilizes the power grids and reducing water usage and emissions. Over the past five years, Westlake has reduced Sulphur Dioxide emissions to almost zero, reduced energy usage per ton of global production and achieved a nearly 30% reduction on CO2 emissions. Participating in Multi-Industry Associations for Environmental Protection Westlake is a proud partner with the following organizations to drive sustainable action to eliminate plastic waste, capture more flexible food packaging waste for recycling and support vinyls’ sustainable impact in the world, along with many other initiatives. 4
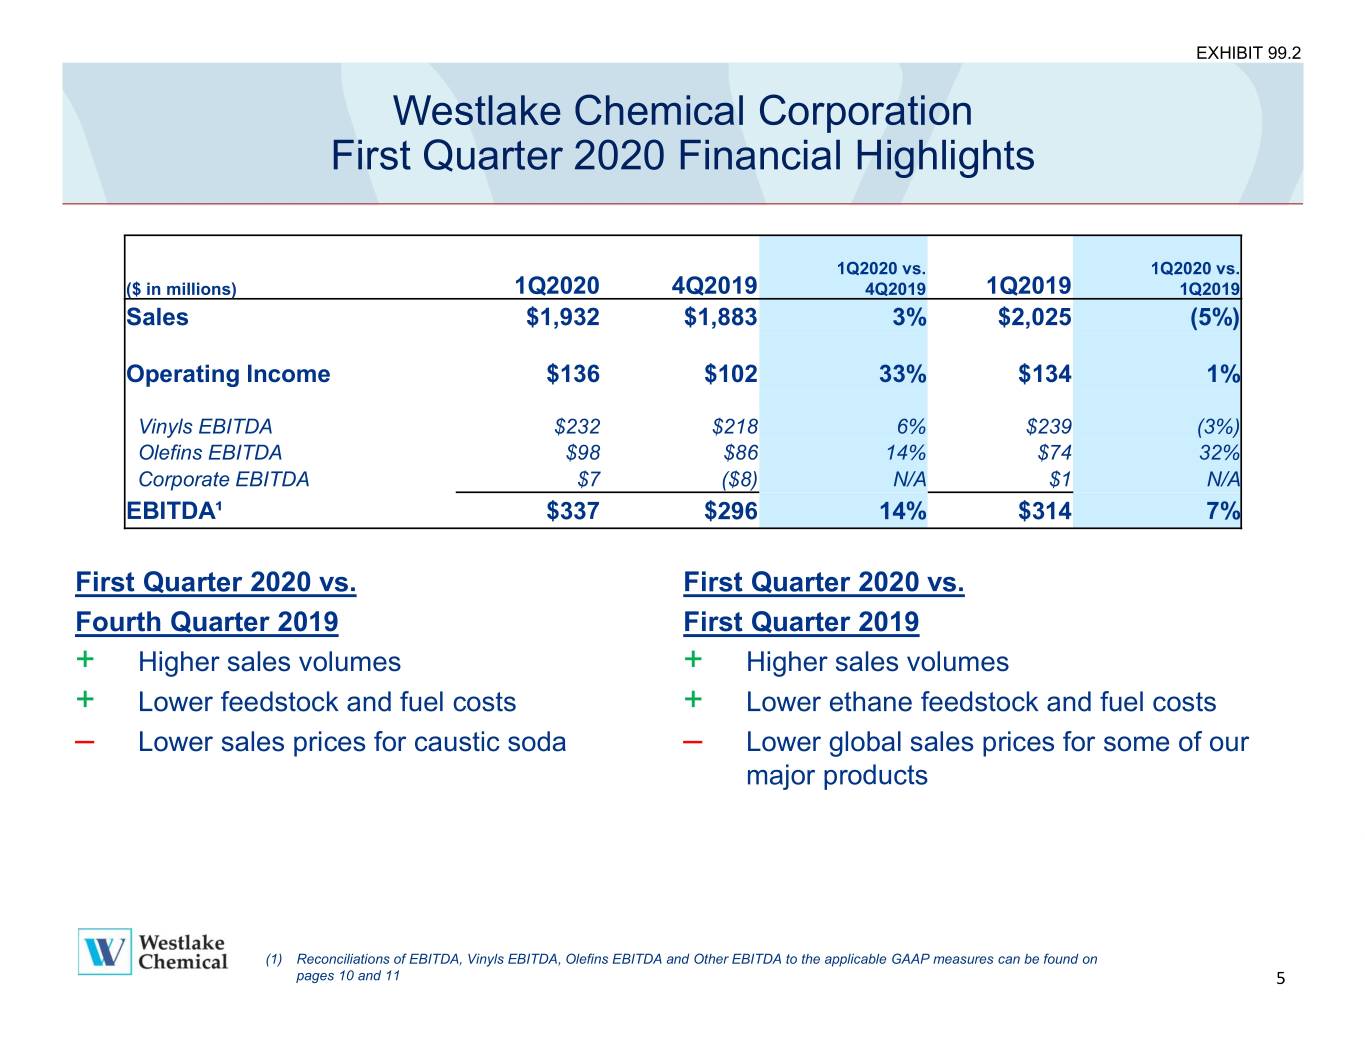

 
Westlake Chemical Corporation First Quarter 2020 Financial Highlights 1Q2020 vs. 1Q2020 vs. ($ in millions) 1Q2020 4Q2019 4Q2019 1Q2019 1Q2019 Sales $1,932 $1,883 3% $2,025 (5%) Operating Income $136 $102 33% $134 1% Vinyls EBITDA $232 $218 6% $239 (3%) Olefins EBITDA $98 $86 14% $74 32% Corporate EBITDA $7 ($8) N/A $1 N/A EBITDA¹ $337 $296 14% $314 7% First Quarter 2020 vs. First Quarter 2020 vs. Fourth Quarter 2019 First Quarter 2019 + Higher sales volumes + Higher sales volumes + Lower feedstock and fuel costs + Lower ethane feedstock and fuel costs – Lower sales prices for caustic soda – Lower global sales prices for some of our major products (1) Reconciliations of EBITDA, Vinyls EBITDA, Olefins EBITDA and Other EBITDA to the applicable GAAP measures can be found on pages 10 and 11 5
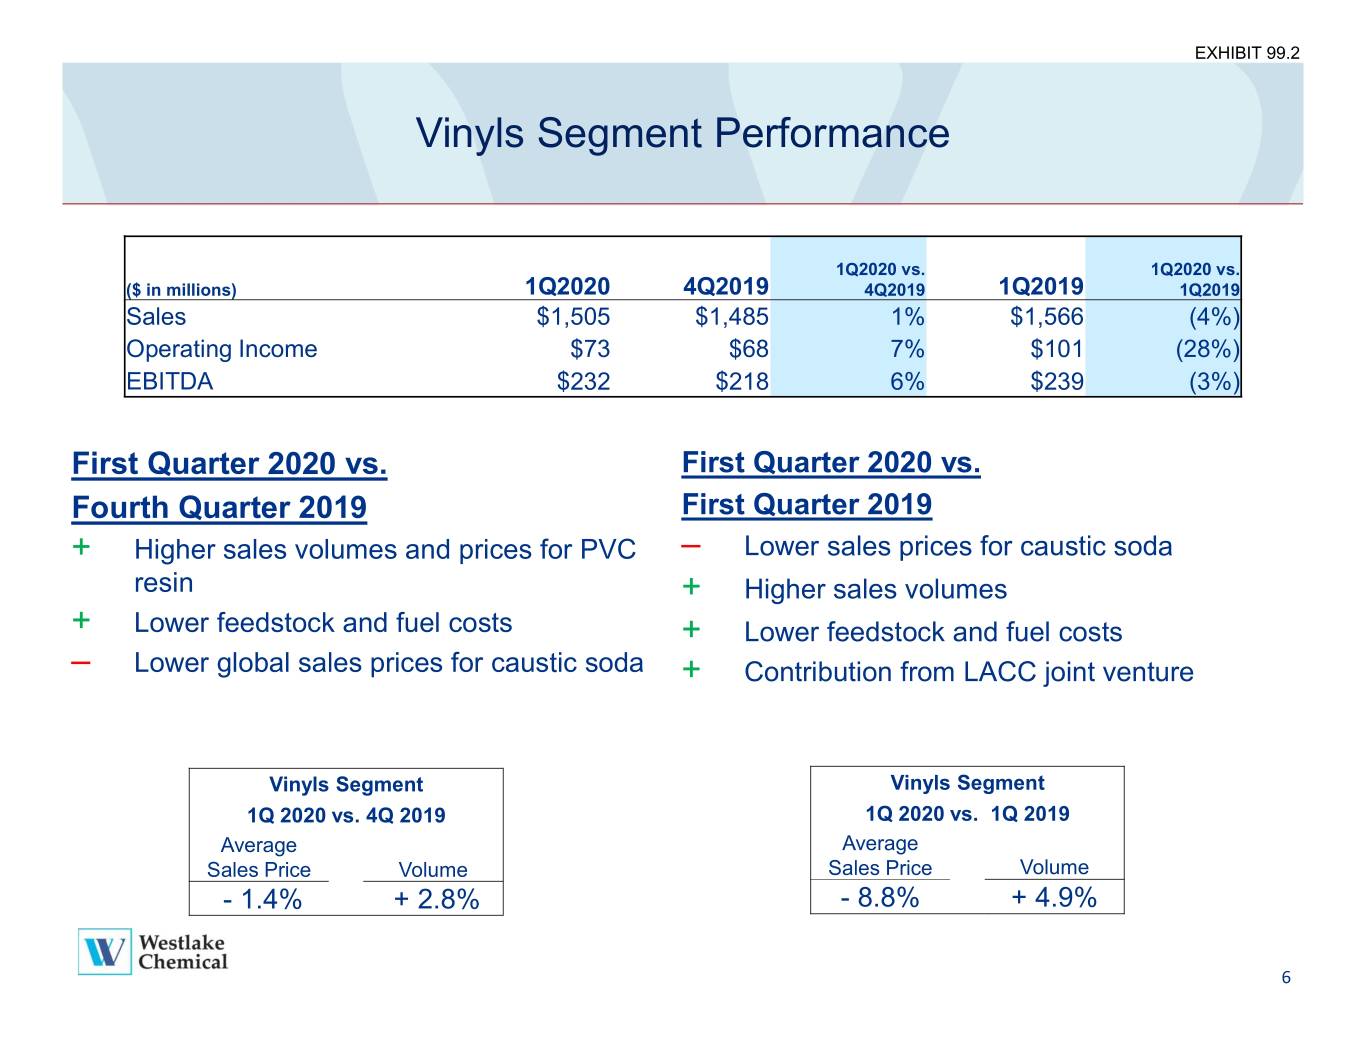

 
Vinyls Segment Performance 1Q2020 vs. 1Q2020 vs. ($ in millions) 1Q2020 4Q2019 4Q2019 1Q2019 1Q2019 Sales $1,505 $1,485 1% $1,566 (4%) Operating Income $73 $68 7% $101 (28%) EBITDA $232 $218 6% $239 (3%) First Quarter 2020 vs. First Quarter 2020 vs. Fourth Quarter 2019 First Quarter 2019 + Higher sales volumes and prices for PVC – Lower sales prices for caustic soda resin + Higher sales volumes + Lower feedstock and fuel costs + Lower feedstock and fuel costs – Lower global sales prices for caustic soda + Contribution from LACC joint venture Vinyls Segment Vinyls Segment 1Q 2020 vs. 4Q 2019 1Q 2020 vs. 1Q 2019 Average Average Sales Price Volume Sales Price Volume -1.4% +2.8% -8.8% + 4.9% 6
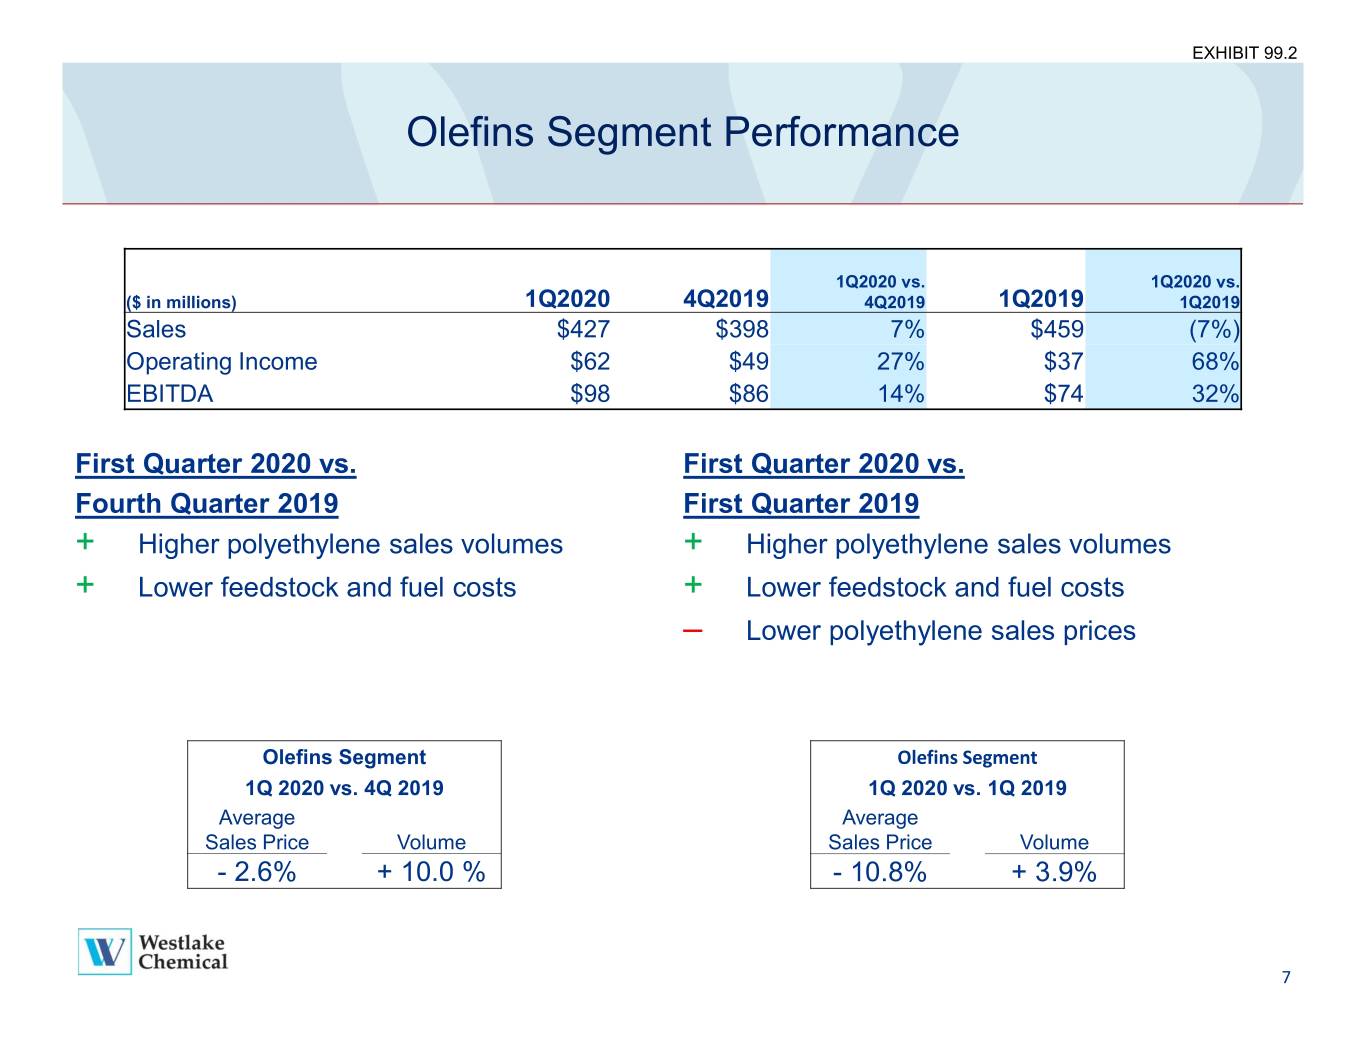

 
Olefins Segment Performance 1Q2020 vs. 1Q2020 vs. ($ in millions) 1Q2020 4Q2019 4Q2019 1Q2019 1Q2019 Sales $427 $398 7% $459 (7%) Operating Income $62 $49 27% $37 68% EBITDA $98 $86 14% $74 32% First Quarter 2020 vs. First Quarter 2020 vs. Fourth Quarter 2019 First Quarter 2019 + Higher polyethylene sales volumes + Higher polyethylene sales volumes + Lower feedstock and fuel costs + Lower feedstock and fuel costs – Lower polyethylene sales prices Olefins Segment Olefins Segment 1Q 2020 vs. 4Q 2019 1Q 2020 vs. 1Q 2019 Average Average Sales Price Volume Sales Price Volume -2.6% +10.0 % -10.8% + 3.9% 7

 
Financial Reconciliations
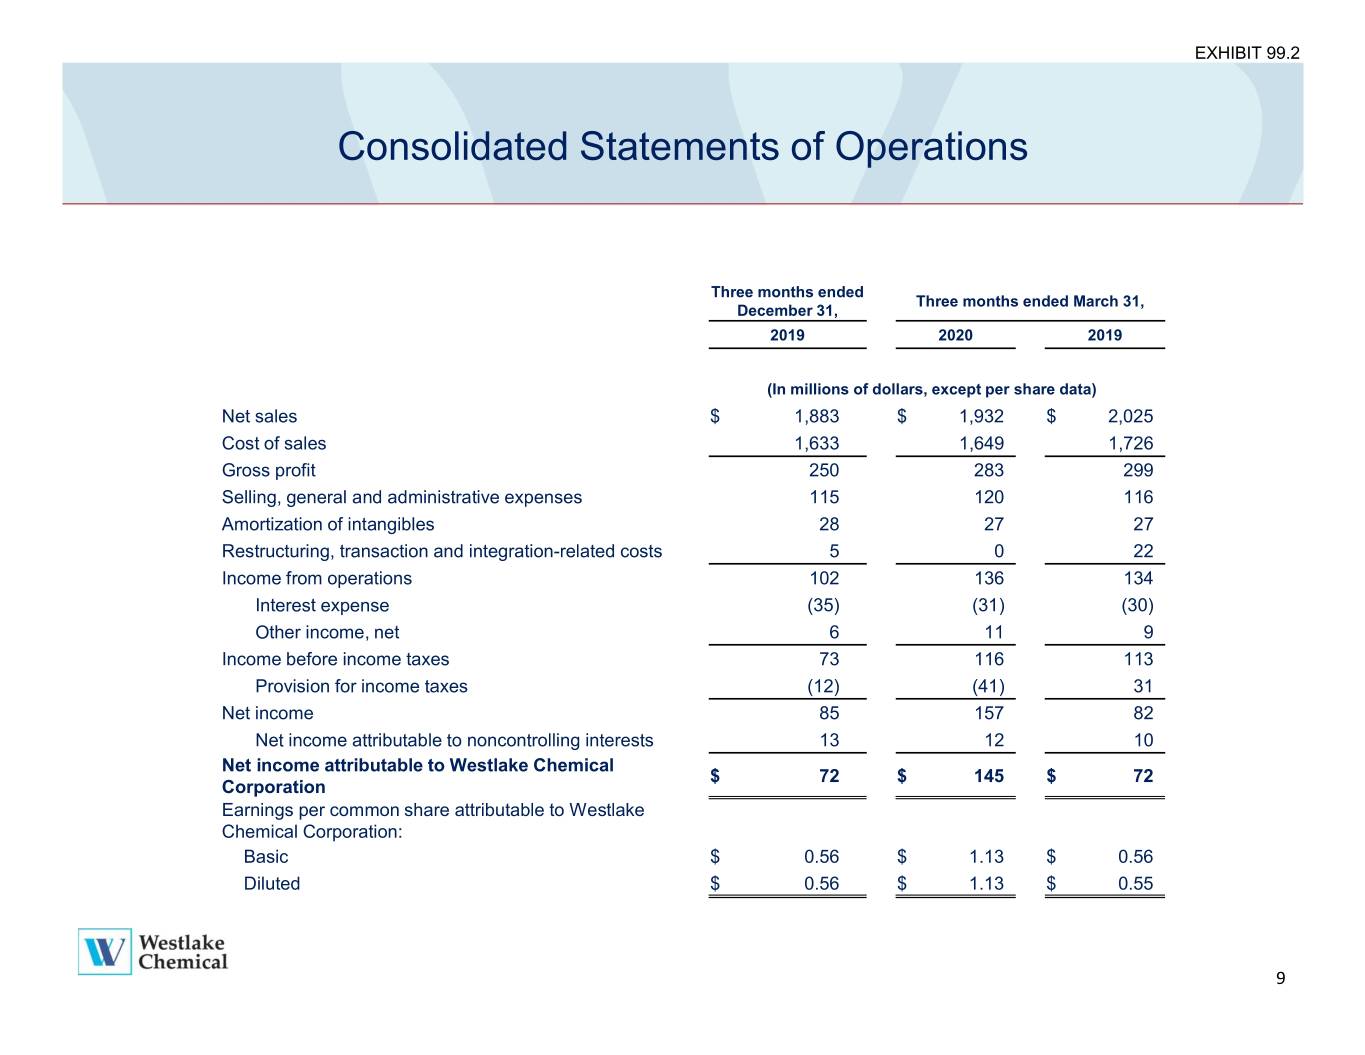

 
Consolidated Statements of Operations Three months ended Three months ended March 31, December 31, 2019 2020 2019 (In millions of dollars, except per share data) Net sales $ 1,883 $ 1,932 $ 2,025 Cost of sales 1,633 1,649 1,726 Gross profit 250 283 299 Selling, general and administrative expenses 115 120 116 Amortization of intangibles 28 27 27 Restructuring, transaction and integration-related costs 5 0 22 Income from operations 102 136 134 Interest expense (35) (31) (30) Other income, net 6 11 9 Income before income taxes 73 116 113 Provision for income taxes (12) (41) 31 Net income 85 157 82 Net income attributable to noncontrolling interests 13 12 10 Net income attributable to Westlake Chemical $ 72 $ 145 $ 72 Corporation Earnings per common share attributable to Westlake Chemical Corporation: Basic $ 0.56 $ 1.13$ 0.56 Diluted $ 0.56 $ 1.13 $ 0.55 9
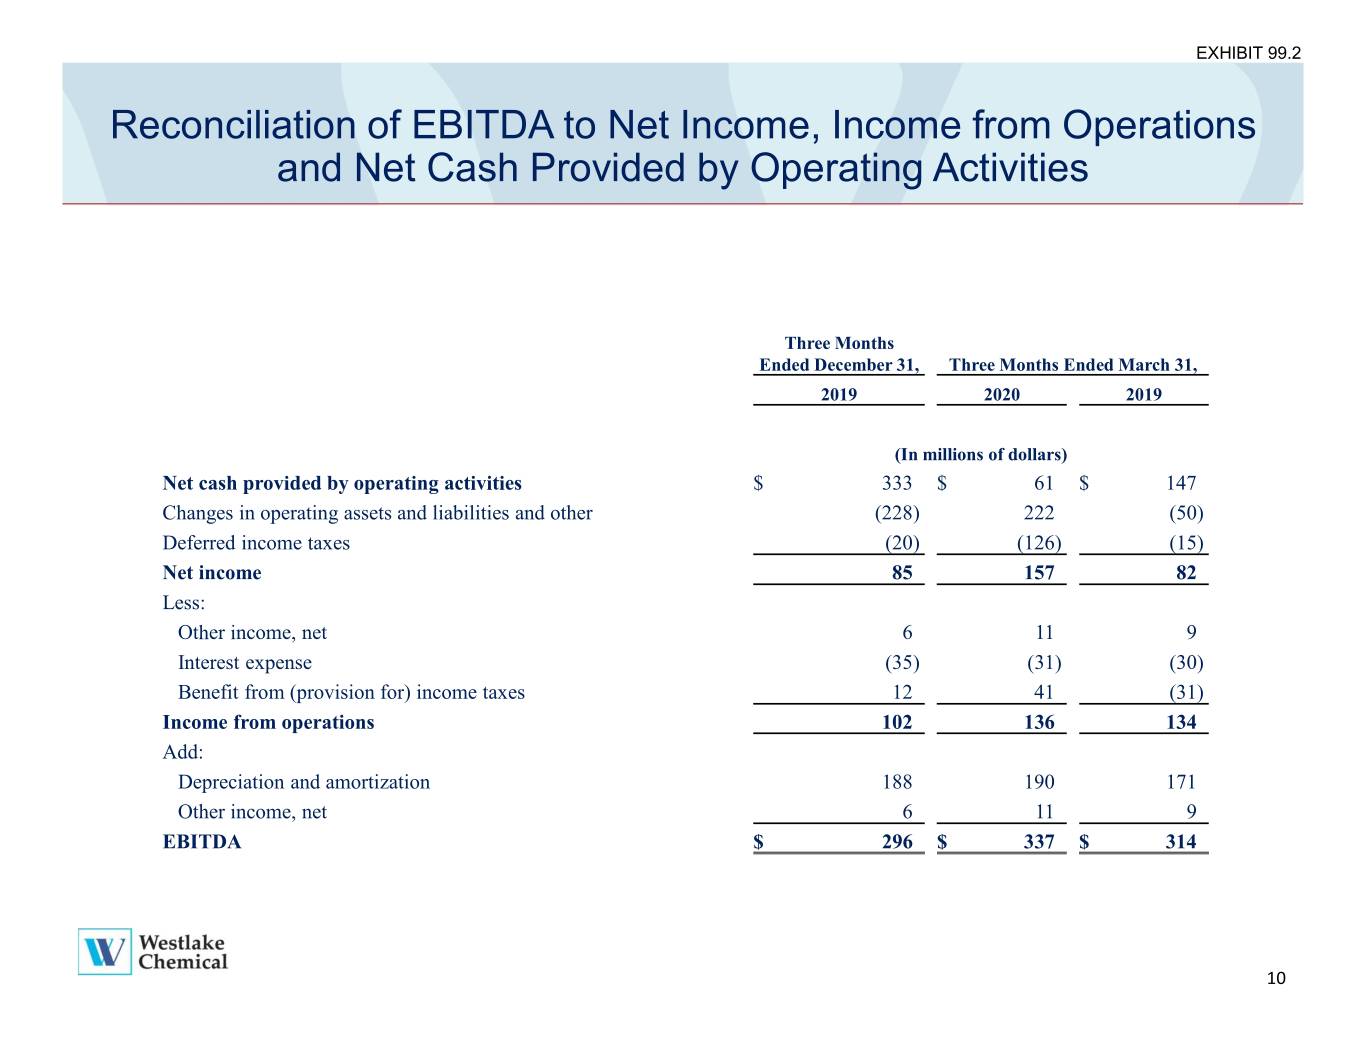

 
Reconciliation of EBITDA to Net Income, Income from Operations and Net Cash Provided by Operating Activities Three Months Ended December 31, Three Months Ended March 31, 2019 2020 2019 (In millions of dollars) Net cash provided by operating activities $ 333 $ 61 $ 147 Changes in operating assets and liabilities and other (228) 222 (50) Deferred income taxes (20) (126) (15) Net income 85 157 82 Less: Other income, net 6 11 9 Interest expense (35) (31) (30) Benefit from (provision for) income taxes 12 41 (31) Income from operations 102 136 134 Add: Depreciation and amortization 188 190 171 Other income, net 6 11 9 EBITDA $ 296 $ 337 $ 314 10
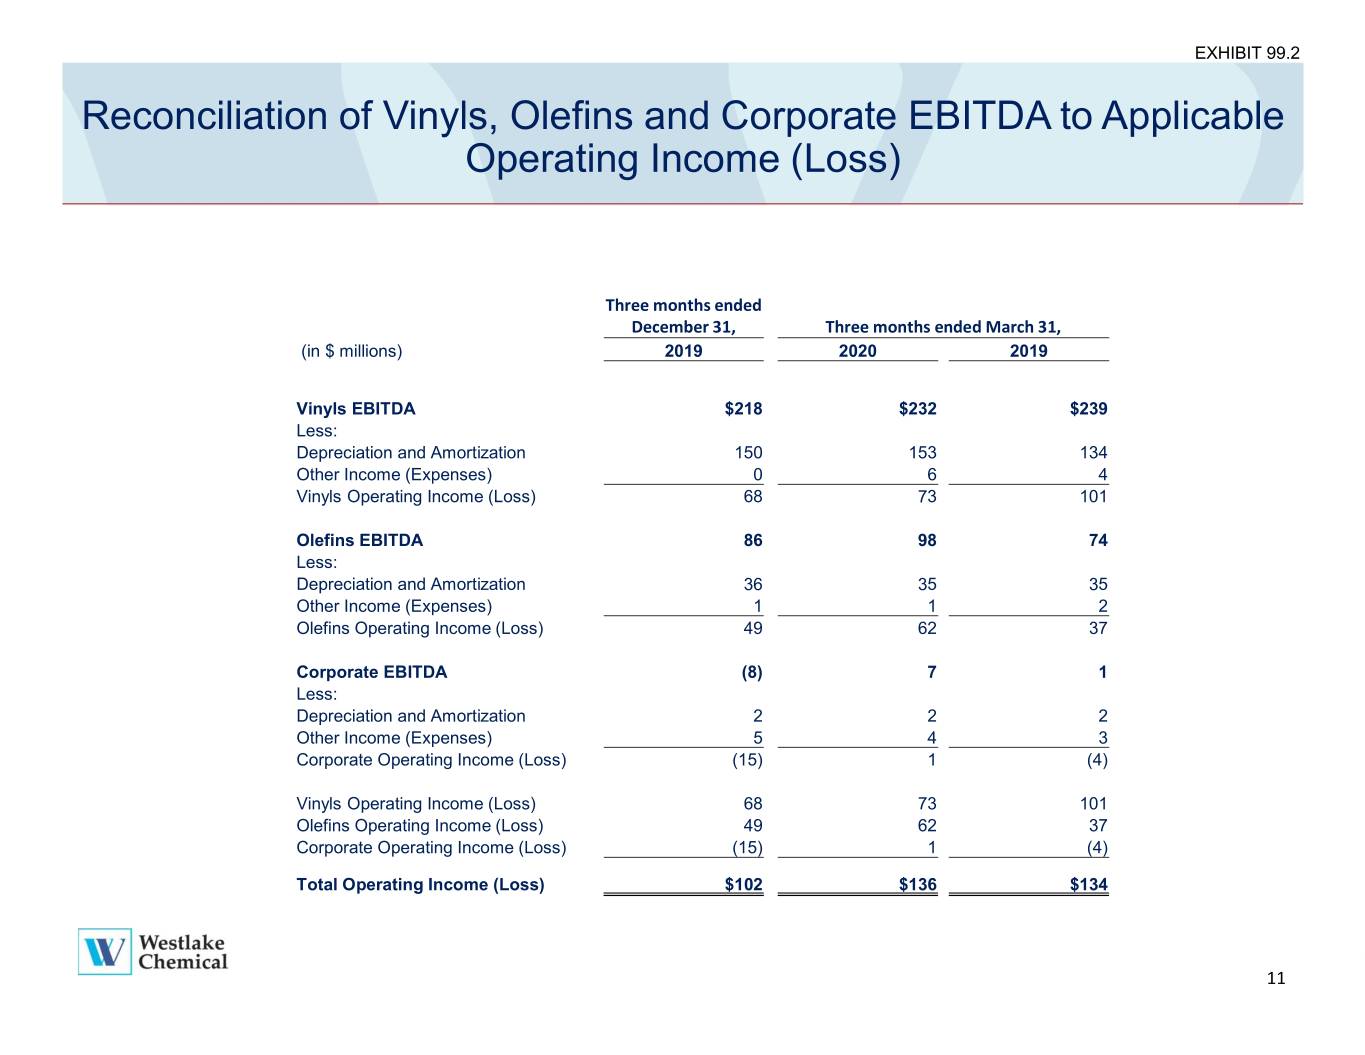

 
Reconciliation of Vinyls, Olefins and Corporate EBITDA to Applicable Operating Income (Loss) Three months ended December 31, Three months ended March 31, (in $ millions) 2019 2020 2019 Vinyls EBITDA $218 $232 $239 Less: Depreciation and Amortization 150 153 134 Other Income (Expenses) 0 6 4 Vinyls Operating Income (Loss) 68 73 101 Olefins EBITDA 86 98 74 Less: Depreciation and Amortization 36 35 35 Other Income (Expenses) 1 1 2 Olefins Operating Income (Loss) 49 62 37 Corporate EBITDA (8) 7 1 Less: Depreciation and Amortization 2 2 2 Other Income (Expenses) 5 4 3 Corporate Operating Income (Loss) (15) 1 (4) Vinyls Operating Income (Loss) 68 73 101 Olefins Operating Income (Loss) 49 62 37 Corporate Operating Income (Loss) (15) 1 (4) Total Operating Income (Loss) $102 $136 $134 11

 
Quarterly Industry Pricing
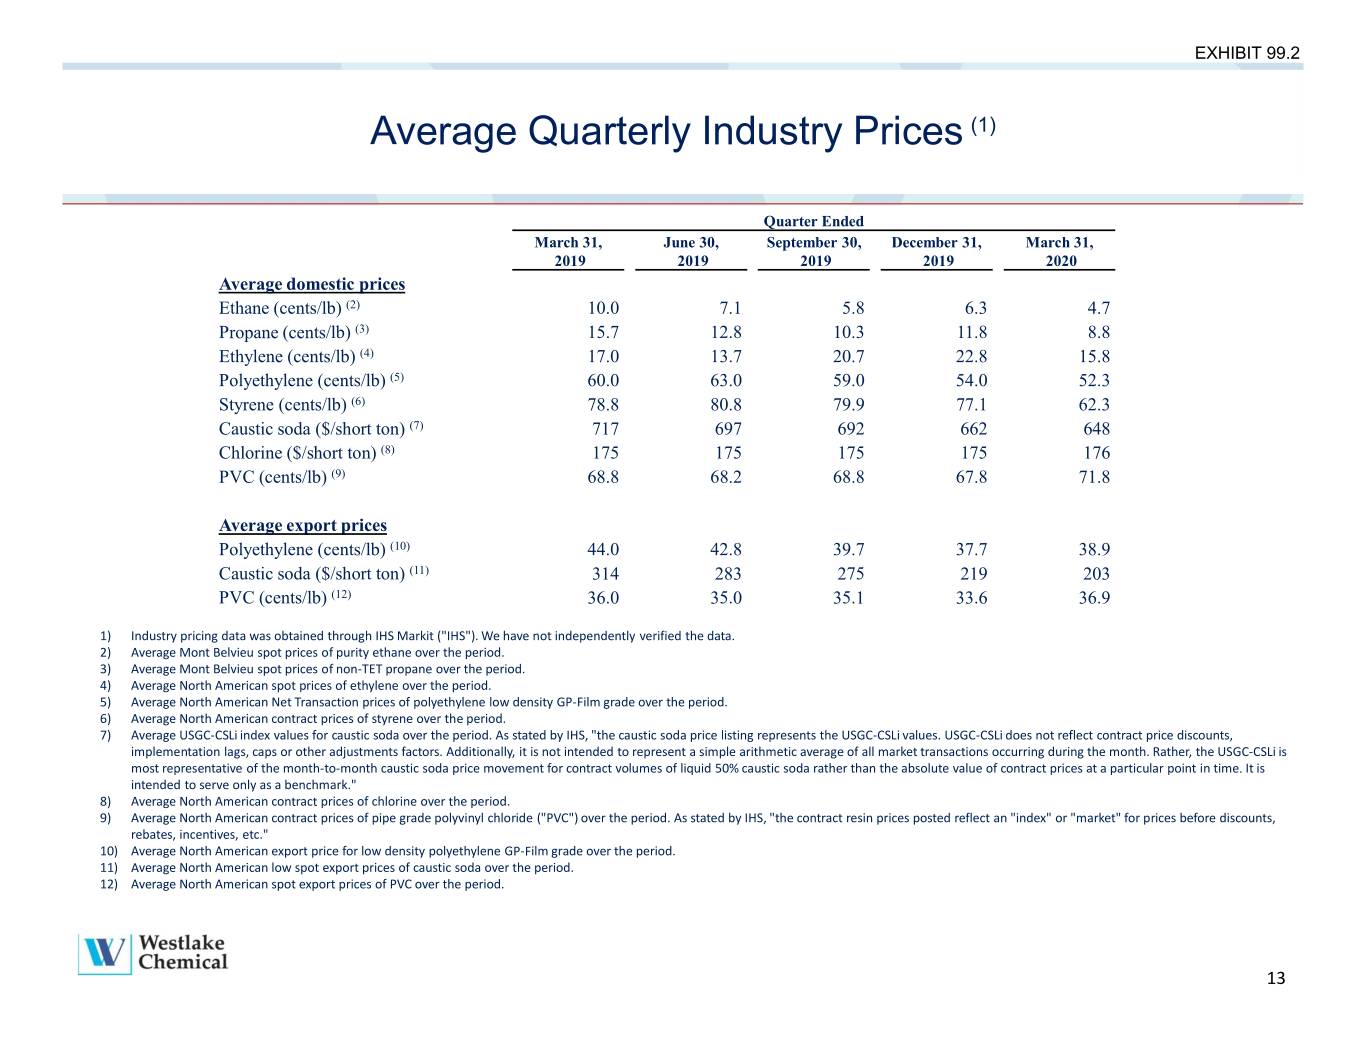

 
Average Quarterly Industry Prices (1) Quarter Ended March 31, June 30, September 30, December 31, March 31, 2019 2019 2019 2019 2020 Average domestic prices Ethane (cents/lb) (2) 10.0 7.1 5.8 6.3 4.7 Propane (cents/lb) (3) 15.7 12.8 10.3 11.8 8.8 Ethylene (cents/lb) (4) 17.0 13.7 20.7 22.8 15.8 Polyethylene (cents/lb) (5) 60.0 63.0 59.0 54.0 52.3 Styrene (cents/lb) (6) 78.8 80.8 79.9 77.1 62.3 Caustic soda ($/short ton) (7) 717 697 692 662 648 Chlorine ($/short ton) (8) 175 175 175 175 176 PVC (cents/lb) (9) 68.8 68.2 68.8 67.8 71.8 Average export prices Polyethylene (cents/lb) (10) 44.0 42.8 39.7 37.7 38.9 Caustic soda ($/short ton) (11) 314 283 275 219 203 PVC (cents/lb) (12) 36.0 35.0 35.1 33.6 36.9 1) Industry pricing data was obtained through IHS Markit ("IHS"). We have not independently verified the data. 2) Average Mont Belvieu spot prices of purity ethane over the period. 3) Average Mont Belvieu spot prices of non-TET propane over the period. 4) Average North American spot prices of ethylene over the period. 5) Average North American Net Transaction prices of polyethylene low density GP-Film grade over the period. 6) Average North American contract prices of styrene over the period. 7) Average USGC-CSLi index values for caustic soda over the period. As stated by IHS, "the caustic soda price listing represents the USGC-CSLi values. USGC-CSLi does not reflect contract price discounts, implementation lags, caps or other adjustments factors. Additionally, it is not intended to represent a simple arithmetic average of all market transactions occurring during the month. Rather, the USGC-CSLi is most representative of the month-to-month caustic soda price movement for contract volumes of liquid 50% caustic soda rather than the absolute value of contract prices at a particular point in time. It is intended to serve only as a benchmark." 8) Average North American contract prices of chlorine over the period. 9) Average North American contract prices of pipe grade polyvinyl chloride ("PVC") over the period. As stated by IHS, "the contract resin prices posted reflect an "index" or "market" for prices before discounts, rebates, incentives, etc." 10) Average North American export price for low density polyethylene GP-Film grade over the period. 11) Average North American low spot export prices of caustic soda over the period. 12) Average North American spot export prices of PVC over the period. 13
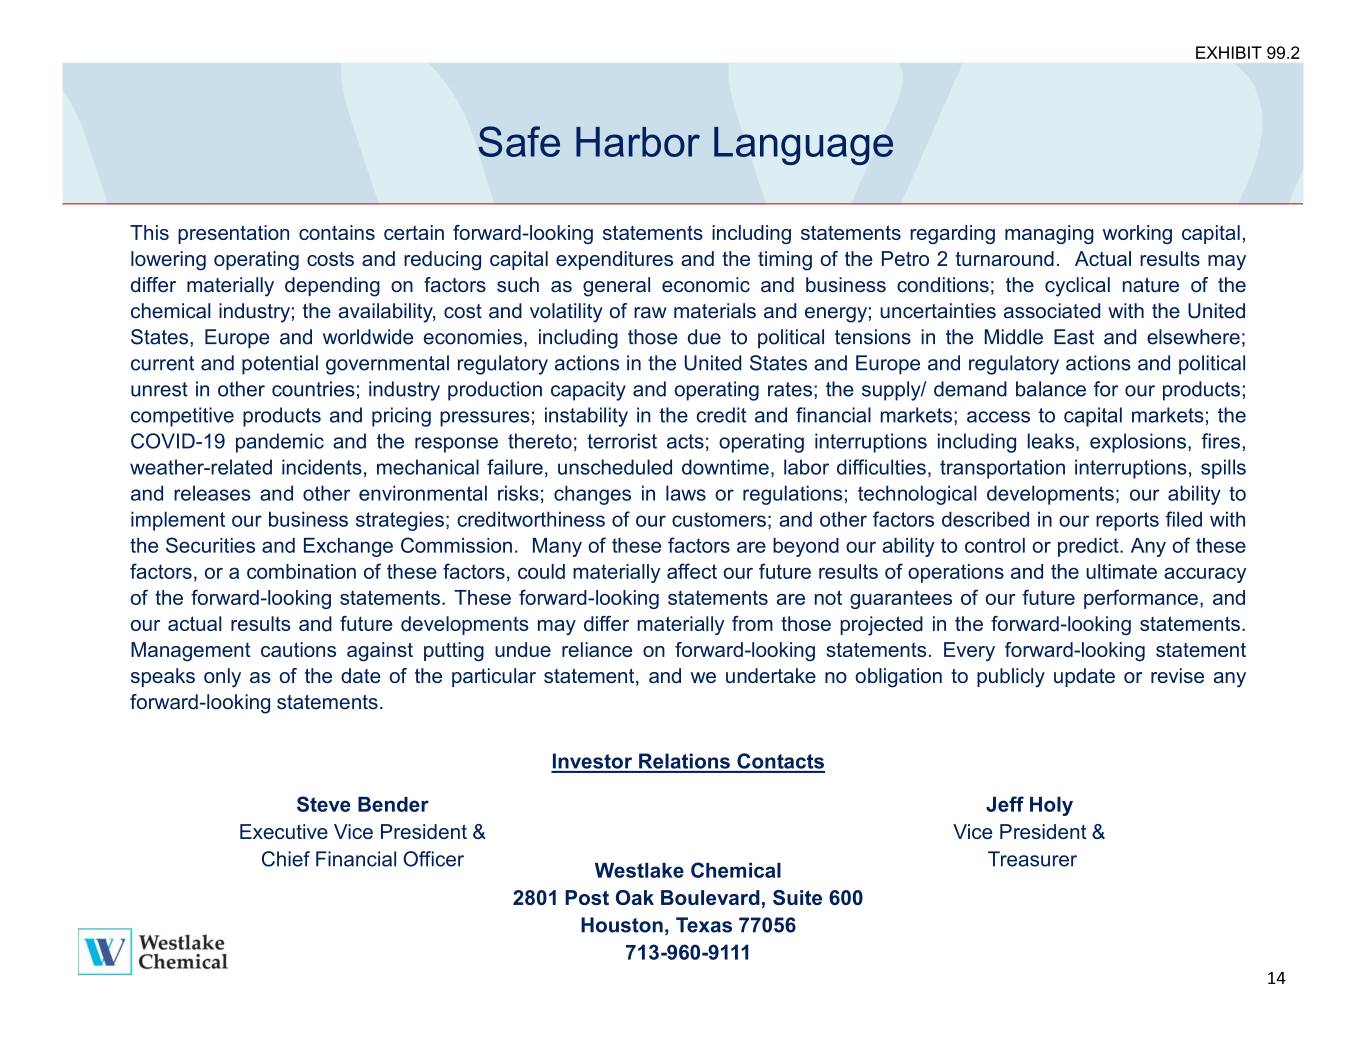

 
Safe Harbor Language This presentation contains certain forward-looking statements including statements regarding managing working capital, lowering operating costs and reducing capital expenditures and the timing of the Petro 2 turnaround. Actual results may differ materially depending on factors such as general economic and business conditions; the cyclical nature of the chemical industry; the availability, cost and volatility of raw materials and energy; uncertainties associated with the United States, Europe and worldwide economies, including those due to political tensions in the Middle East and elsewhere; current and potential governmental regulatory actions in the United States and Europe and regulatory actions and political unrest in other countries; industry production capacity and operating rates; the supply/ demand balance for our products; competitive products and pricing pressures; instability in the credit and financial markets; access to capital markets; the COVID-19 pandemic and the response thereto; terrorist acts; operating interruptions including leaks, explosions, fires, weather-related incidents, mechanical failure, unscheduled downtime, labor difficulties, transportation interruptions, spills and releases and other environmental risks; changes in laws or regulations; technological developments; our ability to implement our business strategies; creditworthiness of our customers; and other factors described in our reports filed with the Securities and Exchange Commission. Many of these factors are beyond our ability to control or predict. Any of these factors, or a combination of these factors, could materially affect our future results of operations and the ultimate accuracy of the forward-looking statements. These forward-looking statements are not guarantees of our future performance, and our actual results and future developments may differ materially from those projected in the forward-looking statements. Management cautions against putting undue reliance on forward-looking statements. Every forward-looking statement speaks only as of the date of the particular statement, and we undertake no obligation to publicly update or revise any forward-looking statements. Investor Relations Contacts Steve Bender Jeff Holy Executive Vice President & Vice President & Chief Financial Officer Treasurer Westlake Chemical 2801 Post Oak Boulevard, Suite 600 Houston, Texas 77056 713-960-9111 14