Wiley Reports First Quarter Fiscal Year 2023 Results
September 7, 2022 - Hoboken, NJ – Wiley (NYSE: WLY),
one of the world’s largest publishers and a global leader in scientific research and career-connected education, today announced results for the first quarter ended July 31, 2022.
FIRST QUARTER SUMMARY
|
•
|
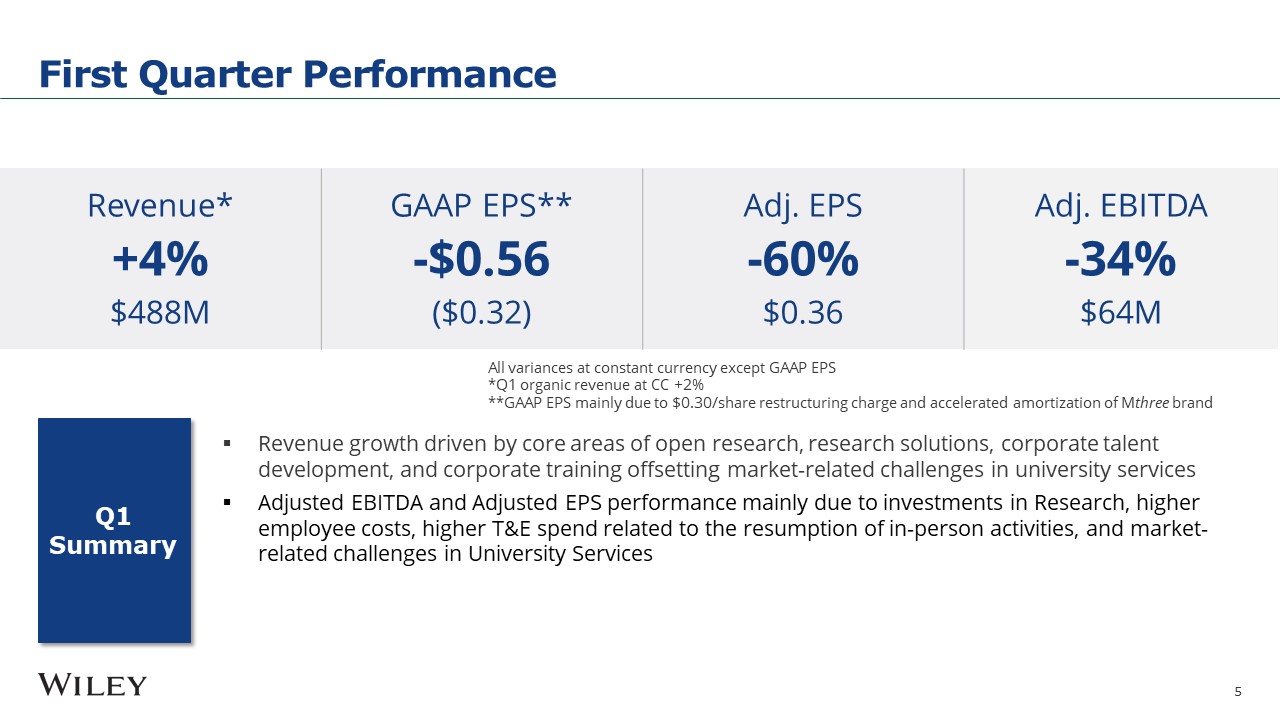
GAAP Results: Revenue of $488 million (-0%
vs. prior year), Operating (loss) of -$17 million (-$58 million vs. prior year), and EPS (loss) of -$0.32 (-$0.56 vs. prior year)
|
|
•
|
Fiscal 2023 Outlook: Wiley reaffirms its
full year outlook for Revenue, Adjusted EBITDA, Adjusted EPS, and Free Cash Flow
|
|
•
|
Dividend Increase: Wiley raises quarterly
dividend for 29th consecutive year
|
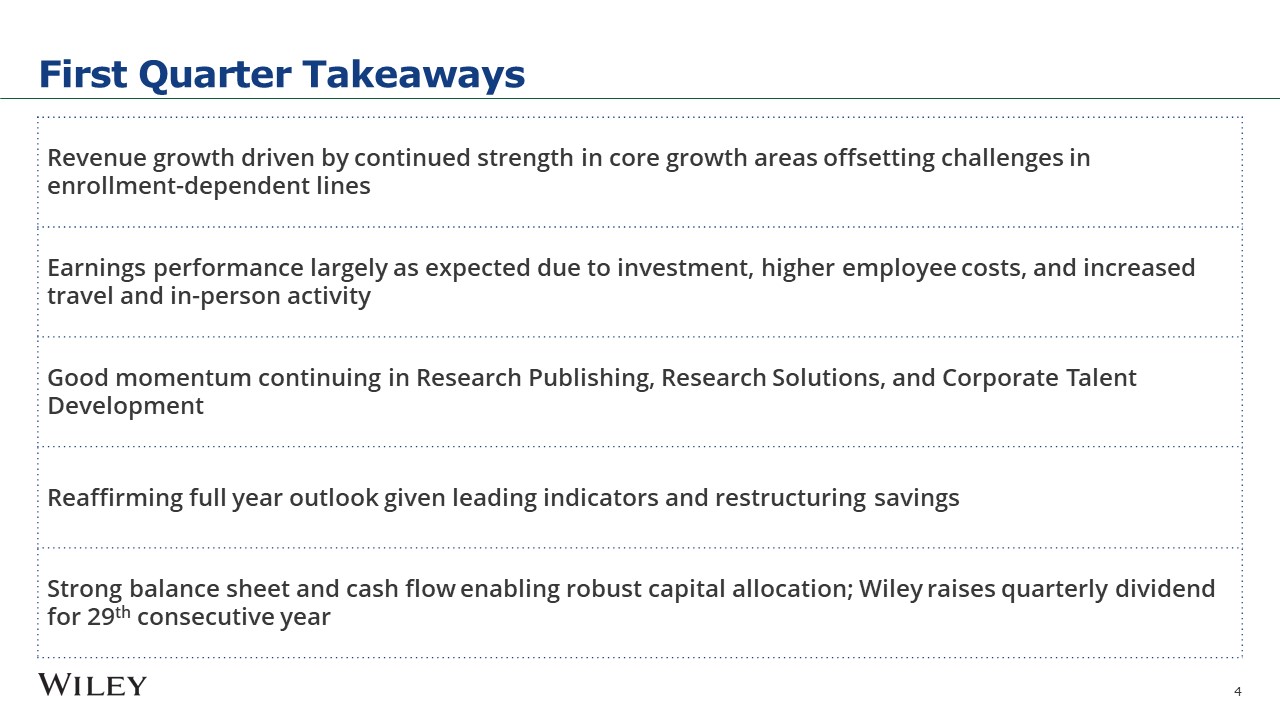
“Q1 unfolded largely as expected, and we are confident in the full year outlook based on our strong, continued momentum in Research Publishing, Research
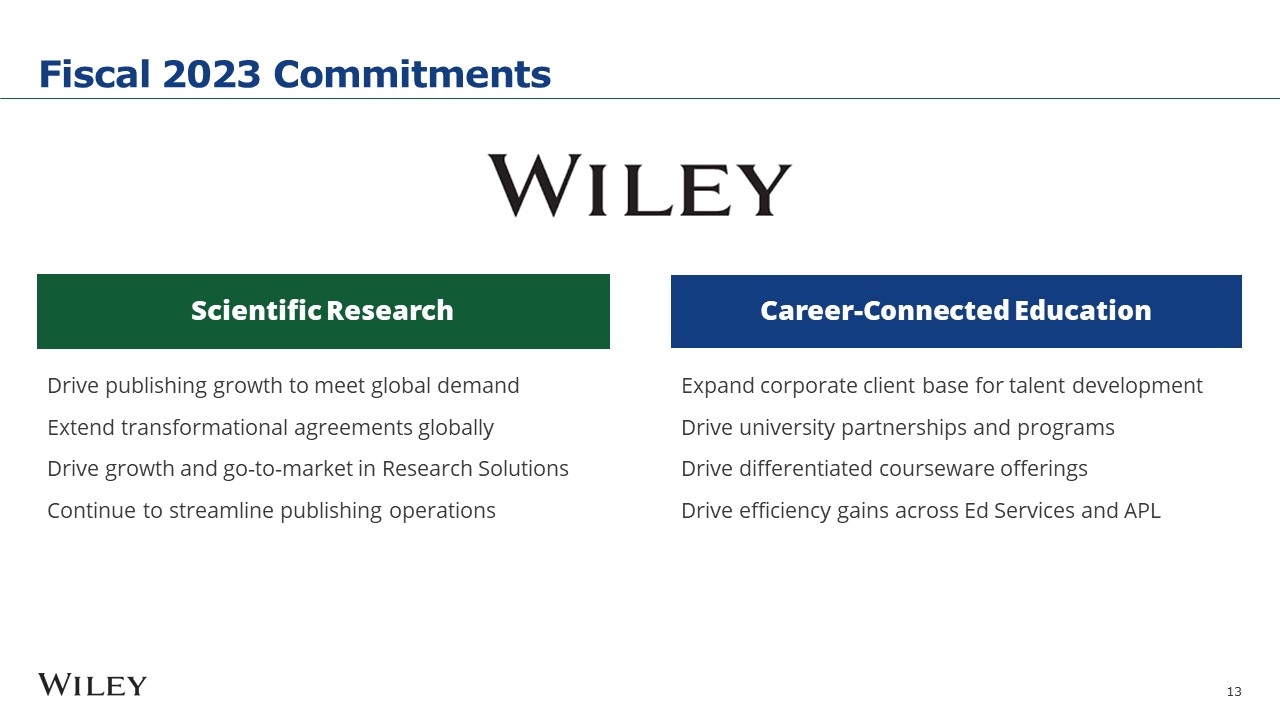
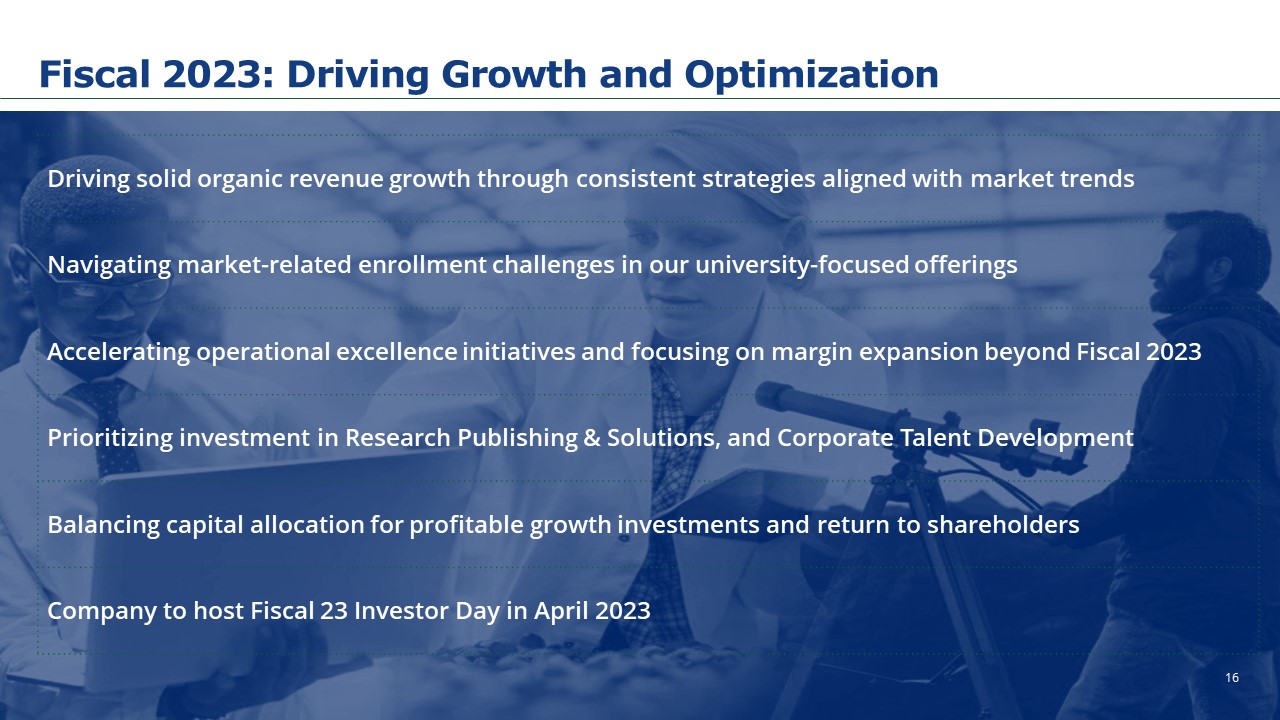
Solutions, and Corporate Talent Development and the execution of our cost savings program,” said Brian Napack, President and CEO. “Our core growth strategies in open research and career-connected education are working, and they are supported by
favorable long term market trends, consistent cash generation, and our sharp focus on operational excellence.”
FIRST QUARTER PERFORMANCE
|
Unaudited ($millions except for EPS)
|
Q1 2023
|
Q1 2022
|
Change
|
|||||||||||||
|
Revenue
|
$
|
487.6
|
$
|
488.4
|
0
|
%
|
||||||||||
|
Operating (Loss) Income
|
$
|
(17.0
|
)
|
$
|
41.0
|
#
|
||||||||||
|
Diluted EPS
|
$
|
(0.32
|
)
|
$
|
0.24
|
#
|
||||||||||
|
Non-GAAP Measures
|
Q1 2023
|
Q1 2022
|
Change
|
Change
Constant Currency
|
||||||||||||
|
Revenue
|
$
|
487.6
|
$
|
488.4
|
0
|
%
|
+4
|
%
|
||||||||
|
Adjusted EBITDA
|
$
|
63.8
|
$
|
95.3
|
(33
|
%)
|
(34
|
%)
|
||||||||
|
Adjusted EPS
|
$
|
0.36
|
$
|
0.85
|
(58
|
%)
|
(60
|
%)
|
||||||||
Excluding acquisitions and currency impact, revenue rose 2% for the quarter.
# Variance greater than 100%
Unfavorable FX variance of $19 million in Revenue and a favorable variance of $0.8 million in Adjusted EBITDA and $0.02 in Adjusted EPS
Revenue
|
•
|
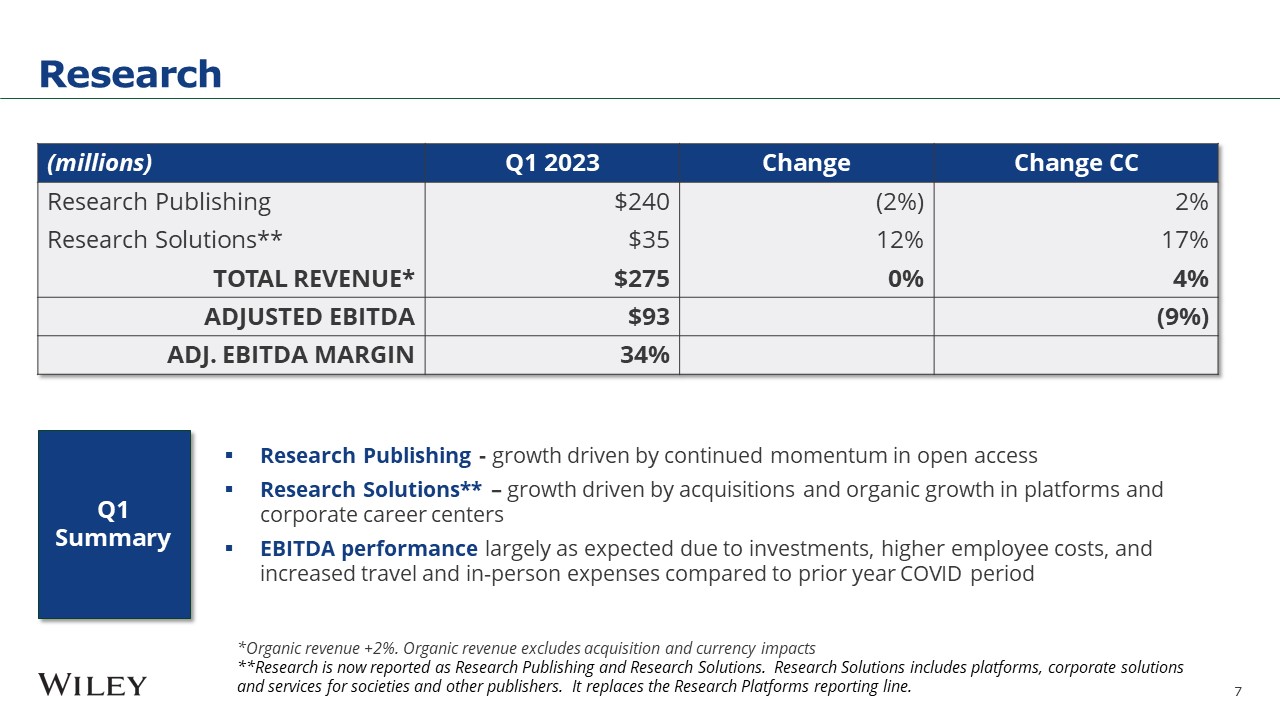
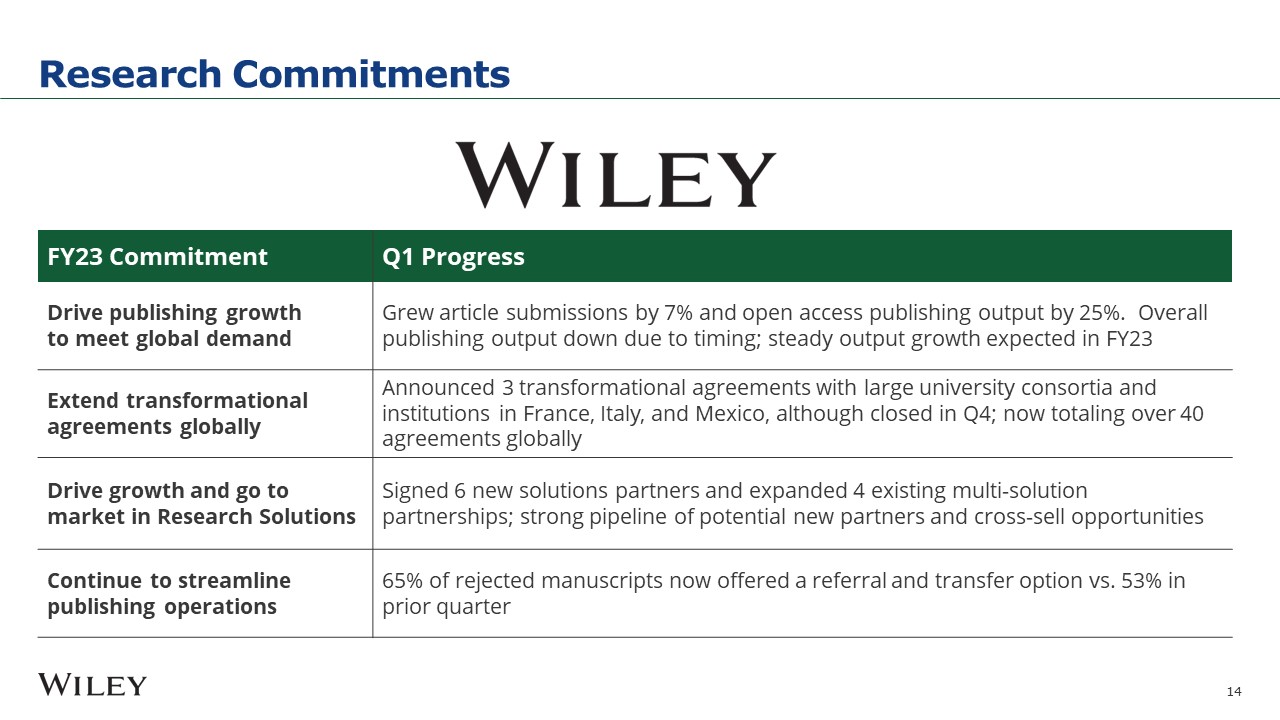
Research was flat as reported, or up 4% at
constant currency, driven by organic growth in Publishing and Solutions and contributions from recent acquisitions.
|
|
o
|
Revenue by product type reporting change –
Research is now reported as Research Publishing and Research Solutions. Research Solutions includes platforms, corporate solutions and services for societies and other publishers. It replaces the Research Platforms reporting line. Please
see the tables below for more detail.
|
|
•
|
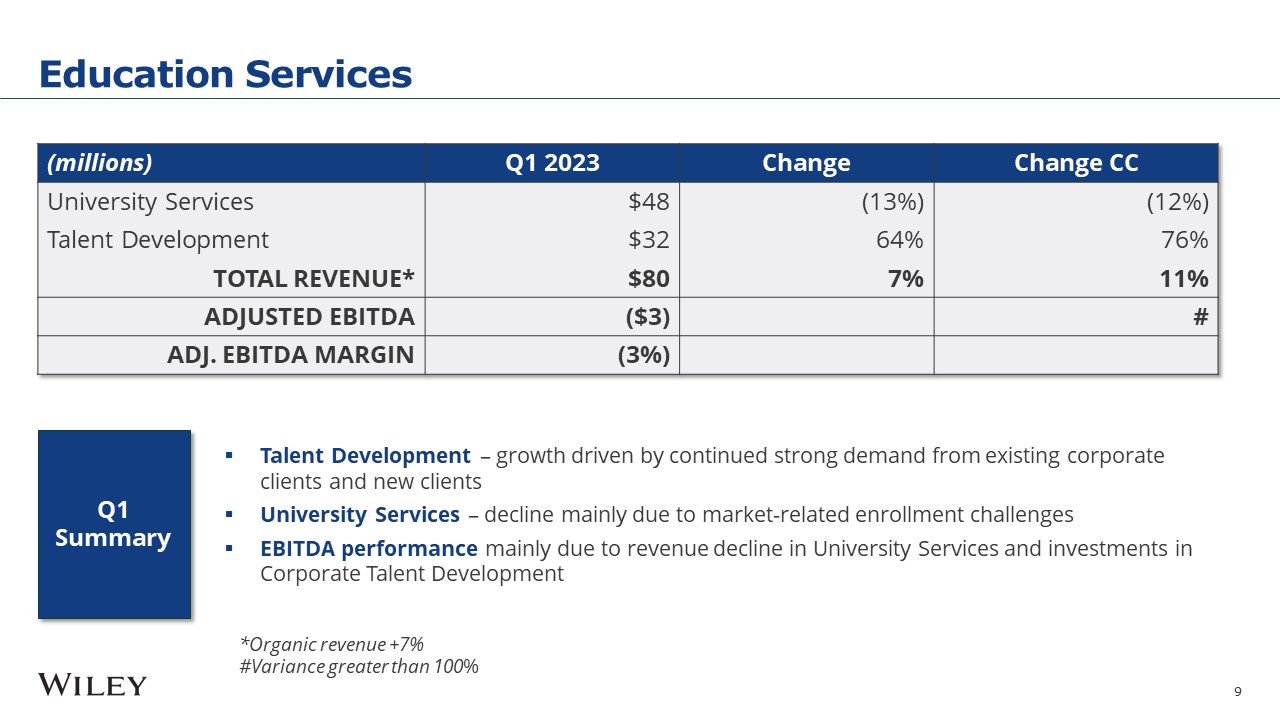
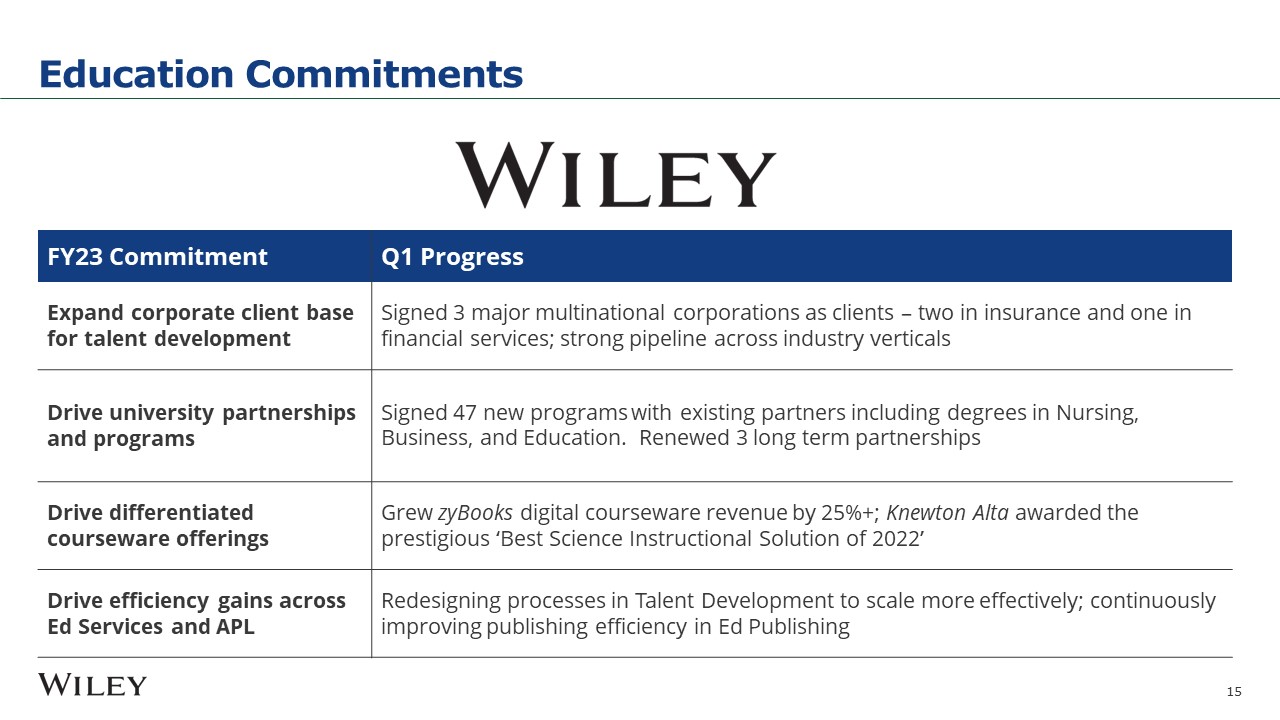
Education Services increased 7% as reported
and 11% at constant currency, with very strong double-digit growth in Talent Development offsetting a decline in University Services from market-related enrollment challenges.
|
Adjusted EBITDA
|
•
|
Research was down 9% at constant currency
with revenue growth more than offset by investment, higher employee costs, and increased T&E compared to prior year COVID period.
|
|
•
|
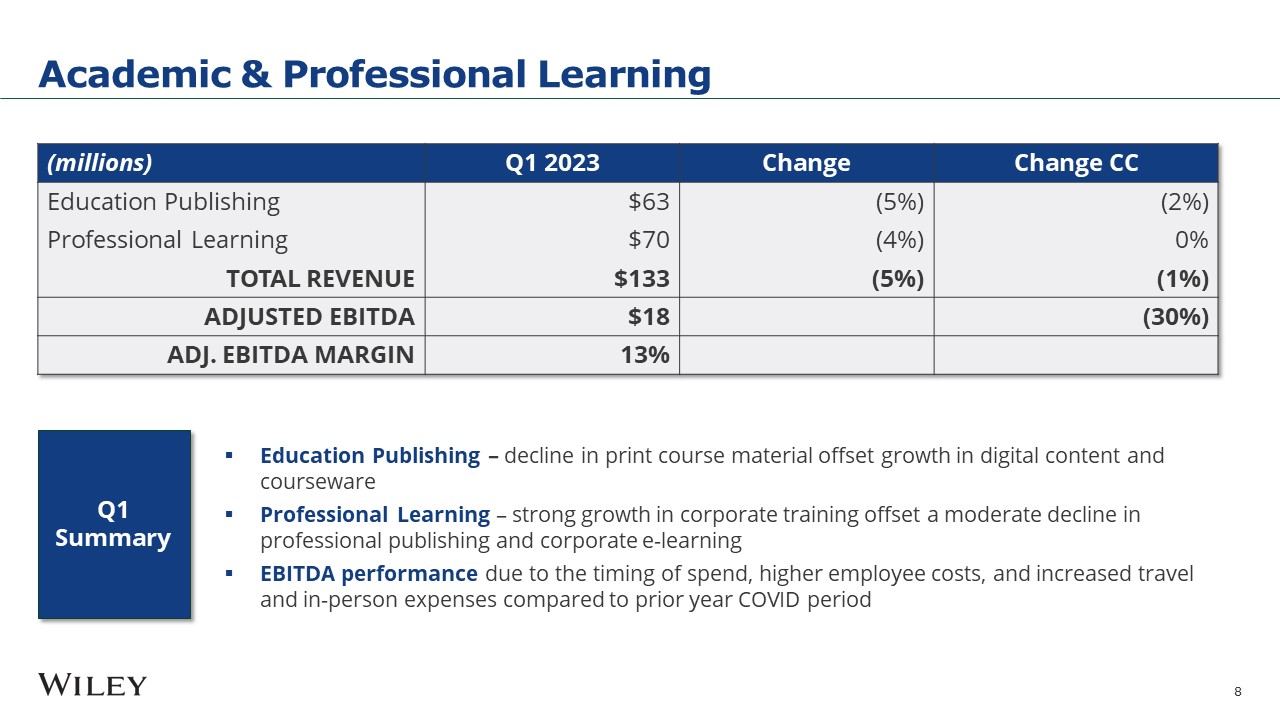
Academic & Professional Learning declined
30% at constant currency due to revenue performance, timing of spend, higher employee costs, and higher T&E expenses compared to prior year COVID period
|
|
•
|
Education Services reported a loss of $3
million due to the revenue decline in University Services and investments in Talent Development growth initiatives.
|
|
•
|
Adjusted Corporate Expenses were $6 million higher at constant currency mainly due to higher employee costs
and the timing of expenses.
|
EPS
|
•
|
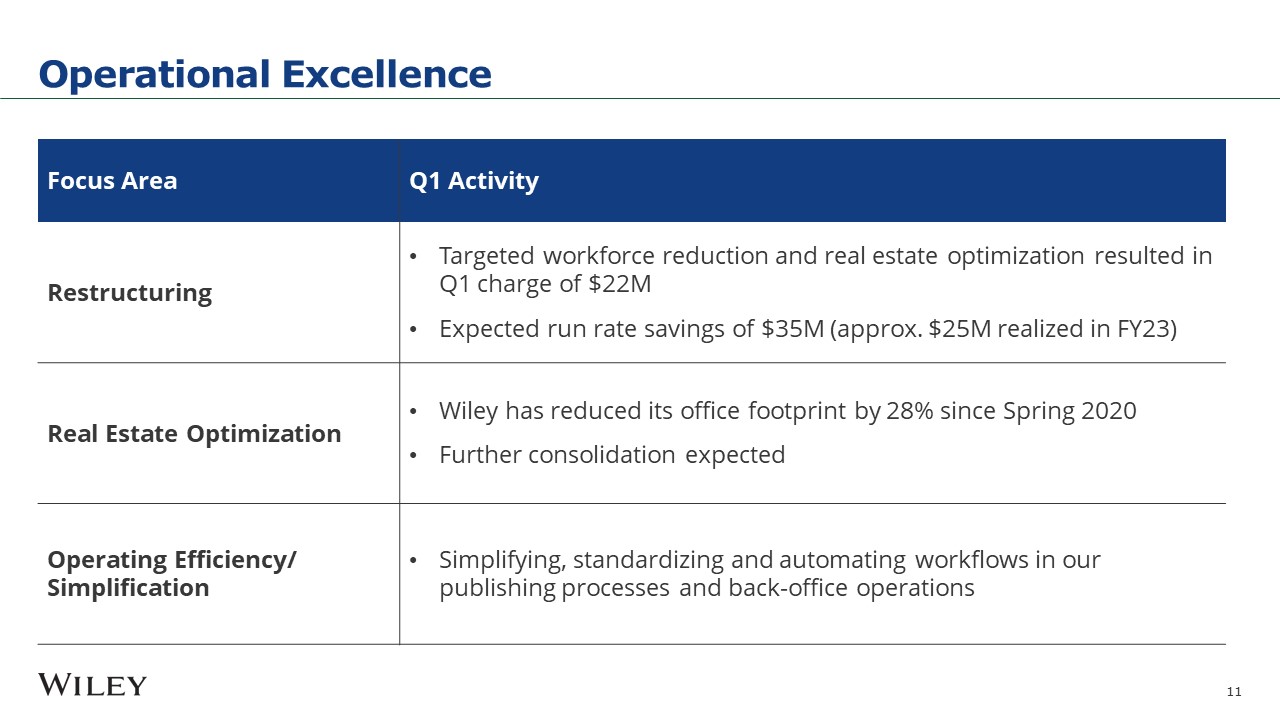
GAAP EPS was a loss of $0.32 as compared to
+$0.24 in the prior year period, primarily reflecting a $0.30/share ($22 million) restructuring charge and accelerated amortization of intangibles of $0.07/share
($5 million) related to the discontinuation of the mthree brand.
|
|
•
|
Adjusted EPS of $0.36 was down 60% at constant currency, driven by lower adjusted EBITDA, lower pension income, and higher interest expense.
|
Balance Sheet, Cash Flow, and Capital Allocation
|
•
|
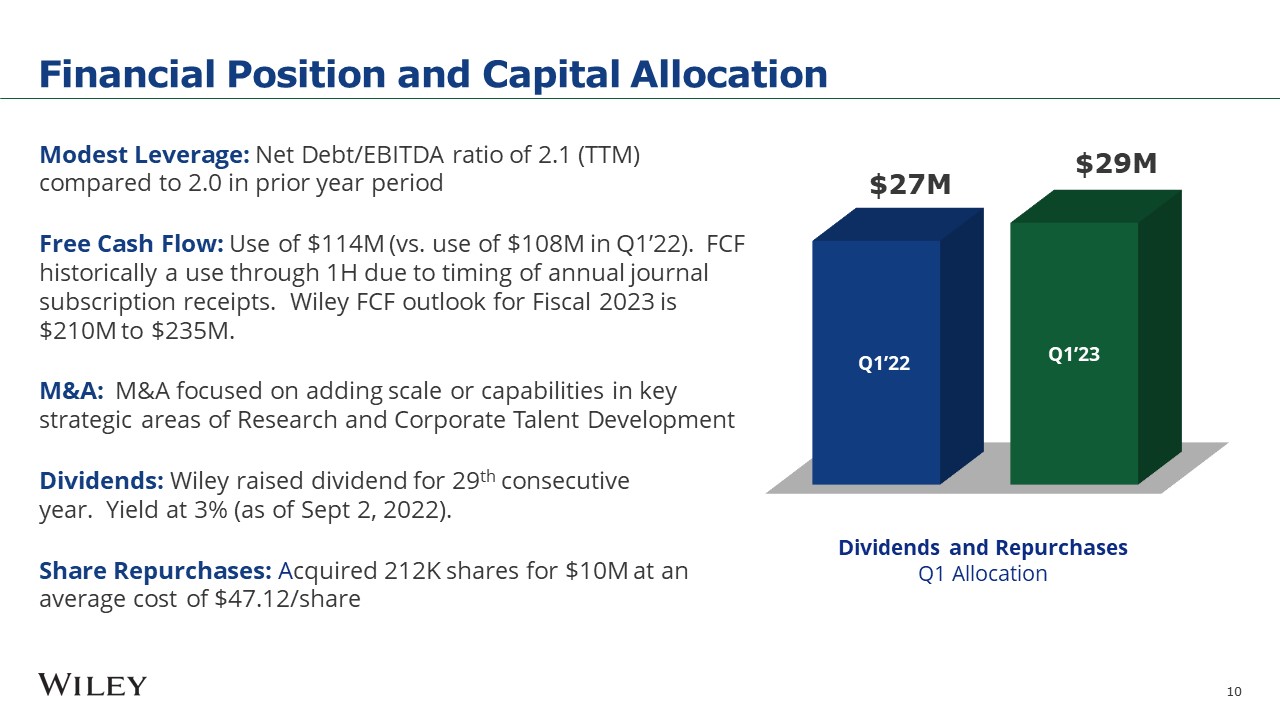
Net Debt-to-EBITDA ratio (trailing twelve
months) at quarter-end was 2.1 compared to 2.0 in the year-ago period, and 1.6 at year end (April 30).
|
|
•
|
Net Cash Used in Operating Activities was a
use of $90 million compared to $85 million in the prior year period. Note, Wiley’s regular use of cash in the first half of the fiscal year is driven by the timing of cash collections for annual journal subscriptions, which are
concentrated in Q3 and Q4.
|
|
•
|
Free Cash Flow less Product Development
Spending was a use of $114 million compared to a use of $108 million in the prior year.
|
|
•
|
Dividends: In June, Wiley raised its dividend for the 29th consecutive year. The current quarterly
dividend is equivalent to an annual dividend of $1.39 per share, an increase from $1.38 per share in Fiscal 2022.
|
|
•
|
Share Repurchases: The Company utilized $10
million to repurchase approximately 212,200 shares at an average cost per share of $47.12.
|
FISCAL YEAR 2023 OUTLOOK
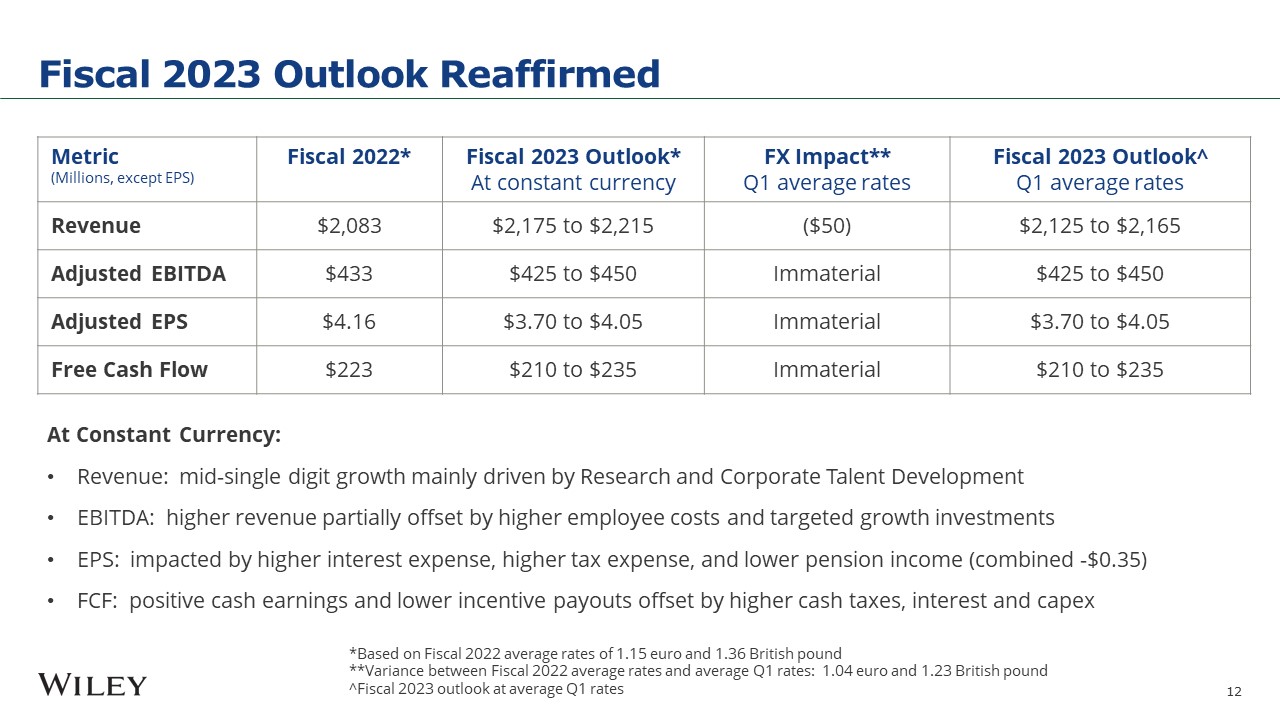
The Company is reaffirming its full year outlook.
|
Metric
($millions, except EPS)
|
Fiscal 2022*
|
FY23 Outlook*
At constant currency
|
FX Impact**
At Q1 average rates
|
FY23 Outlook^
At Q1 average rates
|
||||||||||||
|
Revenue
|
$
|
2,083
|
$
|
2,175 - $2,215
|
|
($50)
|
|
$
|
2,125 - $2,165
|
|||||||
|
Adjusted EBITDA
|
$
|
433
|
$
|
425 - $450
|
Immaterial
|
$
|
425 - $450
|
|||||||||
|
Adjusted EPS
|
$
|
4.16
|
$
|
3.70 - $4.05
|
Immaterial
|
$
|
3.70 - $4.05
|
|||||||||
|
Free Cash Flow
|
$
|
223
|
$
|
210 - $235
|
Immaterial
|
$
|
210 - $235
|
|||||||||
*Based on Fiscal 2022 average rates of 1.15 euro and 1.36 British pound
**Variance between Fiscal 2022 average rates and Q1 average rates: 1.04 euro and 1.23 British pound
^Fiscal 2023 outlook at Q1 average rates
EARNINGS CONFERENCE CALL
Scheduled for today, September 7 at 10:00 am (ET). Access webcast at investors.wiley.com, or directly at https://events.q4inc.com/attendee/191702722. US callers,
please dial (888) 210-3346 and enter the participant code 2521217#. International callers, please dial (646) 960-0253 and enter the participant code 2521217#.
ABOUT WILEY
Wiley (NYSE: WLY), a global leader in scientific research and career-connected education, is unlocking human potential by enabling discovery, powering
education, and shaping workforces. For over 200 years, Wiley has fueled the world’s knowledge ecosystem. Today, our high-impact content, platforms, and services help researchers, learners, institutions, and corporations achieve their goals in an
ever-changing world. Visit us at investors.wiley.com, Like us on Facebook
and Follow us on Twitter and LinkedIn
NON-GAAP FINANCIAL MEASURES
Wiley provides non-GAAP financial measures and
performance results such as “Adjusted EPS,” “EBITDA”, “Adjusted EBITDA,” “Adjusted Contribution to Profit,” “Adjusted Income before Taxes,” “Adjusted Income Tax Provision,” “Adjusted Effective Tax Rate,” “Free Cash Flow less Product Development
Spending,” “organic revenue,” and results on a Constant Currency basis to assess underlying business performance and trends. Management believes non-GAAP financial measures, which exclude the impact of
restructuring charges and credits and certain other items, and the impact of acquisitions provide a useful comparable basis to analyze operating results and earnings. See the reconciliations of non-GAAP financial measures and explanations
of the uses of non- GAAP measures in the supplementary information. We have not provided our 2023 outlook for the most directly comparable US GAAP financial measures, as they are not available without unreasonable effort due to the high variability,
complexity, and low visibility with respect to certain items, including restructuring charges and credits, gains and losses on foreign currency, and other gains and losses. These items are uncertain, depend on various factors, and could be material
to our consolidated results computed in accordance with US GAAP.
FORWARD-LOOKING STATEMENTS
This release contains certain forward-looking statements concerning the Company's operations, performance, and financial condition. Reliance should not be
placed on forward-looking statements, as actual results may differ materially from those in any forward-looking statements. Any such forward-looking statements are based upon a number of assumptions and estimates that are inherently subject to
uncertainties and contingencies, many of which are beyond the control of the Company and are subject to change based on many important factors. Such factors include, but are not limited to: (i) the level of investment by Wiley in new technologies
and products; (ii) subscriber renewal rates for the Company's journals; (iii) the financial stability and liquidity of journal subscription agents; (iv) the consolidation of book wholesalers and retail accounts; (v) the market position and financial
stability of key retailers; (vi) the seasonal nature of the Company's educational business and the impact of the used book market; (vii) worldwide economic and political conditions; (viii) the Company's ability to protect its copyrights and other
intellectual property worldwide (ix) the ability of the Company to successfully integrate acquired operations and realize expected opportunities; (x) the Company’s ability to realize operating savings over time and in fiscal year 2023 in connection
with our multi-year Business Optimization Program and Fiscal Year 2023 Restructuring Program; (xi) the impact of COVID-19 on our operations, performance, and financial condition; and (xii) other factors detailed from time to time in the Company's
filings with the Securities and Exchange Commission. The Company undertakes no obligation to update or revise any such forward-looking statements to reflect subsequent events or circumstances.
CATEGORY: ALL CORPORATE NEWS
CATEGORY: EARNINGS RELEASES
|
JOHN WILEY & SONS, INC.
|
||||||||
|
SUPPLEMENTARY INFORMATION (1)(2)
|
||||||||
|
CONDENSED CONSOLIDATED STATEMENTS OF NET (LOSS) INCOME
|
||||||||
|
(Dollars in thousands, except per share information)
|
||||||||
|
(unaudited)
|
||||||||
|
Three Months Ended
|
||||||||
|
July 31,
|
||||||||
|
2022
|
2021
|
|||||||
|
Revenue, net
|
$
|
487,569
|
$
|
488,388
|
||||
|
Costs and expenses:
|
||||||||
|
Cost of sales
|
174,031
|
165,956
|
||||||
|
Operating and administrative expenses
|
282,751
|
260,589
|
||||||
|
Restructuring and related charges (credits)
|
22,441
|
(276
|
)
|
|||||
|
Amortization of intangible assets
|
25,311
|
21,151
|
||||||
|
Total costs and expenses
|
504,534
|
447,420
|
||||||
|
Operating (loss) income
|
(16,965
|
)
|
40,968
|
|||||
|
As a % of revenue
|
-3.5
|
%
|
8.4
|
%
|
||||
|
Interest expense
|
(6,332
|
)
|
(4,639
|
)
|
||||
|
Foreign exchange transaction (losses) gains
|
(616
|
)
|
370
|
|||||
|
Gain on sale of certain assets
|
-
|
3,750
|
||||||
|
Other income, net
|
526
|
3,553
|
||||||
|
(Loss) Income before taxes
|
(23,387
|
)
|
44,002
|
|||||
|
(Benefit) provision for income taxes
|
(5,552
|
)
|
30,172
|
|||||
|
Effective tax rate
|
23.7
|
%
|
68.6
|
%
|
||||
|
Net (loss) income
|
$
|
(17,835
|
)
|
$
|
13,830
|
|||
|
As a % of revenue
|
-3.7
|
%
|
2.8
|
%
|
||||
|
(Loss) Earnings per share
|
||||||||
|
Basic
|
$
|
(0.32
|
)
|
$
|
0.25
|
|||
|
Diluted (3)
|
$
|
(0.32
|
)
|
$
|
0.24
|
|||
|
Weighted average number of common shares outstanding
|
||||||||
|
Basic
|
55,736
|
55,869
|
||||||
|
Diluted (3)
|
55,736
|
56,599
|
||||||
|
Notes:
|
||||||||
|
(1) The supplementary information included in this press release for the three months ended July 31, 2022 is preliminary and subject to change prior
to the filing of our upcoming Quarterly Report on Form 10-Q with the Securities and Exchange Commission.
|
||||||||
|
(2) All amounts are approximate due to rounding.
|
||||||||
|
(3) In calculating diluted net loss per common share for the three months ended July 31, 2022, our diluted weighted average number of common shares
outstanding excludes the effect of unvested restricted stock units and other stock awards as the effect was antidilutive. This occurs when a US GAAP net loss is reported and the effect of using dilutive shares is antidilutive.
|
||||||||
|
JOHN WILEY & SONS, INC.
|
|||||||||
|
SUPPLEMENTARY INFORMATION (1) (2)
|
|||||||||
|
RECONCILIATION OF US GAAP MEASURES to NON-GAAP MEASURES
|
|||||||||
|
(unaudited)
|
|||||||||
|
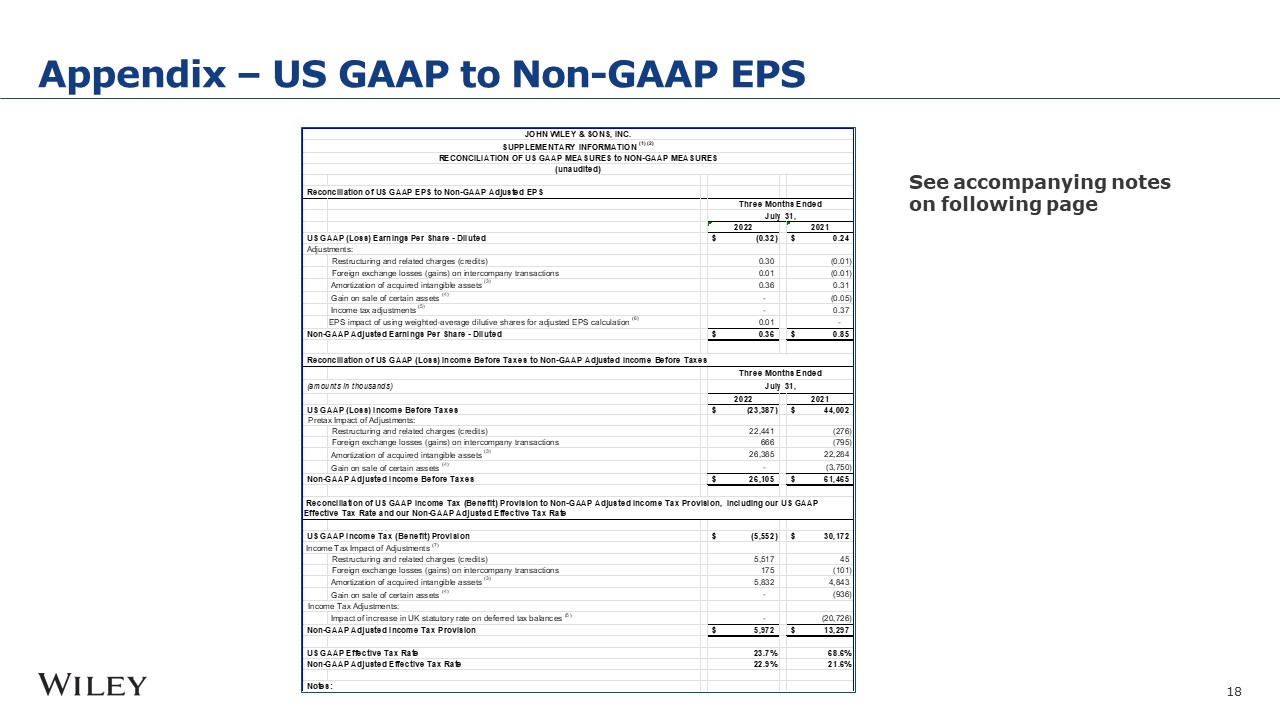
Reconciliation of US GAAP EPS to Non-GAAP Adjusted EPS
|
|||||||||
|
Three Months Ended
|
|||||||||
|
July 31,
|
|||||||||
|
2022
|
2021
|
||||||||
|
US GAAP (Loss) Earnings Per Share - Diluted
|
$
|
(0.32
|
)
|
$
|
0.24
|
||||
|
Adjustments:
|
|||||||||
|
Restructuring and related charges (credits)
|
0.30
|
(0.01
|
)
|
||||||
|
Foreign exchange losses (gains) on intercompany transactions
|
0.01
|
(0.01
|
)
|
||||||
|
Amortization of acquired intangible assets (3)
|
0.36
|
0.31
|
|||||||
|
Gain on sale of certain assets (4)
|
-
|
(0.05
|
)
|
||||||
|
Income tax adjustments (5)
|
-
|
0.37
|
|||||||
|
EPS impact of using weighted-average dilutive shares for adjusted EPS calculation (6)
|
0.01 |
-
|
|||||||
|
Non-GAAP Adjusted Earnings Per Share - Diluted
|
$
|
0.36
|
$
|
0.85
|
|||||
|
Reconciliation of US GAAP (Loss) Income Before Taxes to Non-GAAP Adjusted Income Before Taxes
|
|||||||||
|
Three Months Ended
|
|||||||||
|
(amounts in thousands)
|
July 31,
|
||||||||
|
2022
|
2021
|
||||||||
|
US GAAP (Loss) Income Before Taxes
|
$
|
(23,387
|
)
|
$
|
44,002
|
||||
|
Pretax Impact of Adjustments:
|
|||||||||
|
Restructuring and related charges (credits)
|
22,441
|
(276
|
)
|
||||||
|
Foreign exchange losses (gains) on intercompany transactions
|
666
|
(795
|
)
|
||||||
|
Amortization of acquired intangible assets (3)
|
26,385
|
22,284
|
|||||||
|
Gain on sale of certain assets (4)
|
-
|
(3,750
|
)
|
||||||
|
Non-GAAP Adjusted Income Before Taxes
|
$
|
26,105
|
$
|
61,465
|
|||||
|
Reconciliation of US GAAP Income Tax (Benefit) Provision to Non-GAAP Adjusted Income Tax Provision, including our US GAAP
Effective Tax Rate and our Non-GAAP Adjusted Effective Tax Rate
|
|||||||||
|
US GAAP Income Tax (Benefit) Provision
|
$
|
(5,552
|
)
|
$
|
30,172
|
||||
|
Income Tax Impact of Adjustments (7)
|
|||||||||
|
Restructuring and related charges (credits)
|
5,517
|
45
|
|||||||
|
Foreign exchange losses (gains) on intercompany transactions
|
175
|
(101
|
)
|
||||||
|
Amortization of acquired intangible assets (3)
|
5,832
|
4,843
|
|||||||
|
Gain on sale of certain assets (4)
|
-
|
(936
|
)
|
||||||
|
Income Tax Adjustments:
|
|||||||||
|
Impact of increase in UK statutory rate on deferred tax balances (5)
|
-
|
(20,726
|
)
|
||||||
|
Non-GAAP Adjusted Income Tax Provision
|
$
|
5,972
|
$
|
13,297
|
|||||
|
US GAAP Effective Tax Rate
|
23.7
|
%
|
68.6
|
%
|
|||||
|
Non-GAAP Adjusted Effective Tax Rate
|
22.9
|
%
|
21.6
|
%
|
|||||
|
Notes:
|
|||||||||
|
(1) See Explanation of Usage of Non-GAAP Performance Measures included in this supplementary information for additional details on the reasons why
management believes presentation of each non-GAAP performance measure provides useful information to investors. The supplementary information included in this press release for the three months ended July 31, 2022 is preliminary and subject
to change prior to the filing of our upcoming Quarterly Report on Form 10-Q with the Securities and Exchange Commission.
|
|||||||||
|
(2) All amounts are approximate due to rounding.
|
|||||||||
|
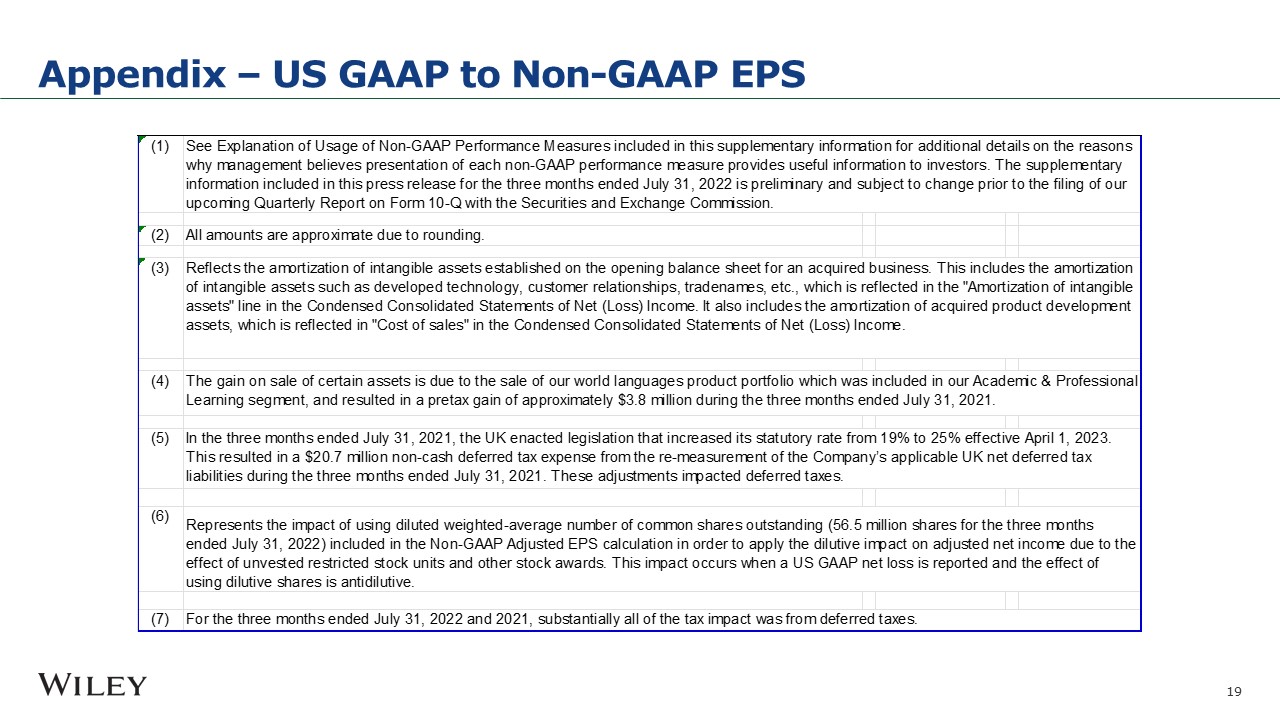
(3) Reflects the amortization of intangible assets established on the opening balance sheet for an acquired business. This includes the
amortization of intangible assets such as developed technology, customer relationships, tradenames, etc., which is reflected in the "Amortization of intangible assets" line in the Condensed Consolidated Statements of Net (Loss) Income. It
also includes the amortization of acquired product development assets, which is reflected in "Cost of sales" in the Condensed Consolidated Statements of Net (Loss) Income.
|
|||||||||
|
(4) The gain on sale of certain assets is due to the sale of our world languages product portfolio which was included in our Academic &
Professional Learning segment, and resulted in a pretax gain of approximately $3.8 million during the three months ended July 31, 2021.
|
|||||||||
|
(5) In the three months ended July 31, 2021, the UK enacted legislation that increased its statutory rate from 19% to 25% effective April 1, 2023.
This resulted in a $20.7 million non-cash deferred tax expense from the re-measurement of the Company’s applicable UK net deferred tax liabilities during the three months ended July 31, 2021. These adjustments impacted deferred taxes.
|
|||||||||
|
(6) Represents the impact of using diluted weighted-average number of common shares outstanding (56.5 million shares for the three months ended July
31, 2022) included in the Non-GAAP Adjusted EPS calculation in order to apply the dilutive impact on adjusted net income due to the effect of unvested restricted stock units and other stock awards. This impact occurs when a US GAAP net loss
is reported and the effect of using dilutive shares is antidilutive.
|
|||||||||
|
(7) For the three months ended July 31, 2022 and 2021, substantially all of the tax impact was from deferred taxes.
|
|||||||||
|
JOHN WILEY & SONS, INC.
|
||||||||
|
SUPPLEMENTARY INFORMATION (1)
|
||||||||
|
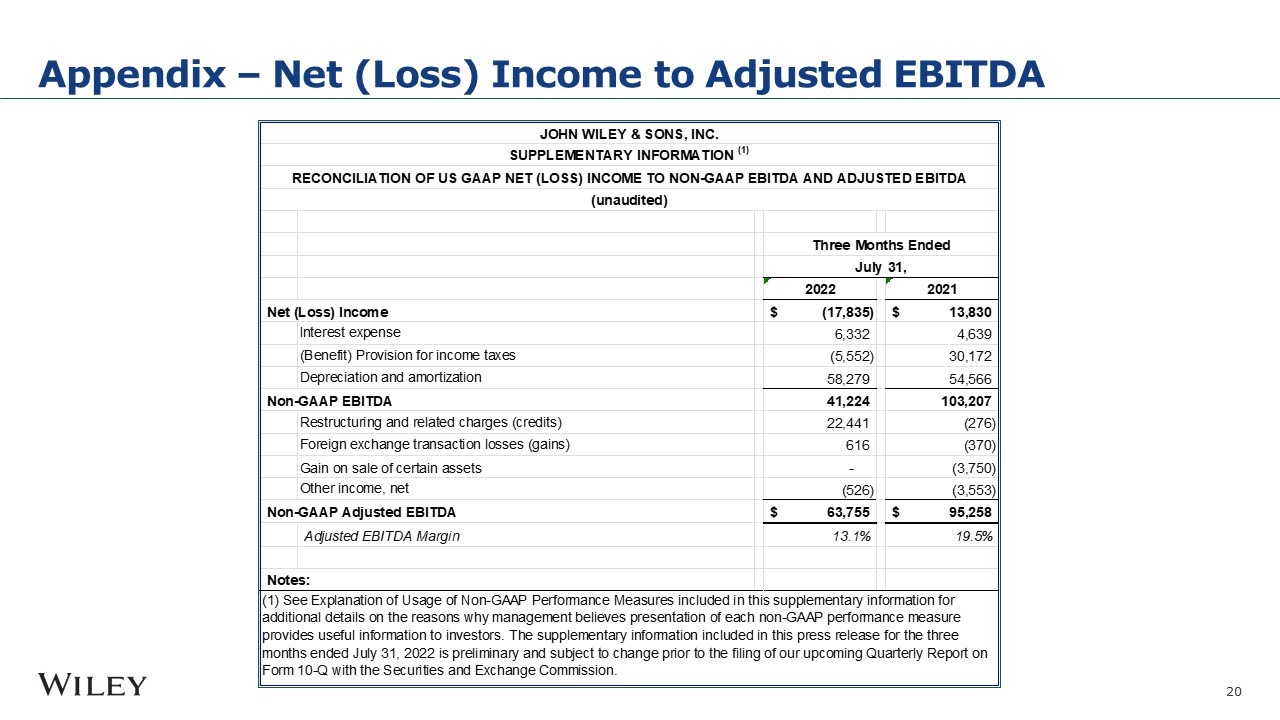
RECONCILIATION OF US GAAP NET (LOSS) INCOME TO NON-GAAP EBITDA AND ADJUSTED EBITDA
|
||||||||
|
(unaudited)
|
||||||||
|
Three Months Ended
|
||||||||
|
July 31,
|
||||||||
|
2022
|
2021
|
|||||||
|
Net (Loss) Income
|
$
|
(17,835
|
)
|
$
|
13,830
|
|||
|
Interest expense
|
6,332
|
4,639
|
||||||
|
(Benefit) Provision for income taxes
|
(5,552
|
)
|
30,172
|
|||||
|
Depreciation and amortization
|
58,279
|
54,566
|
||||||
|
Non-GAAP EBITDA
|
41,224
|
103,207
|
||||||
|
Restructuring and related charges (credits)
|
22,441
|
(276
|
)
|
|||||
|
Foreign exchange transaction losses (gains)
|
616
|
(370
|
)
|
|||||
|
Gain on sale of certain assets
|
-
|
(3,750
|
)
|
|||||
|
Other income, net
|
(526
|
)
|
(3,553
|
)
|
||||
|
Non-GAAP Adjusted EBITDA
|
$
|
63,755
|
$
|
95,258
|
||||
|
Adjusted EBITDA Margin
|
13.1
|
%
|
19.5
|
%
|
||||
|
Notes:
|
||||||||
|
(1) See Explanation of Usage of Non-GAAP Performance Measures included in this supplementary information for additional details on the reasons why
management believes presentation of each non-GAAP performance measure provides useful information to investors. The supplementary information included in this press release for the three months ended July 31, 2022 is preliminary and
subject to change prior to the filing of our upcoming Quarterly Report on Form 10-Q with the Securities and Exchange Commission.
|
||||||||
|
JOHN WILEY & SONS, INC.
|
||||||||||||||||
|
SUPPLEMENTARY INFORMATION (1)
|
||||||||||||||||
|
SEGMENT RESULTS
|
||||||||||||||||
|
(in thousands)
|
||||||||||||||||
|
(unaudited)
|
||||||||||||||||
|
% Change
|
||||||||||||||||
|
Three Months Ended July 31,
|
Favorable (Unfavorable)
|
|||||||||||||||
|
2022
|
2021
|
Reported
|
Constant
Currency
|
|||||||||||||
|
Research (2):
|
||||||||||||||||
|
Revenue, net
|
||||||||||||||||
|
Research Publishing (3)
|
$
|
239,523
|
$
|
243,284
|
-2
|
%
|
2
|
%
|
||||||||
|
Research Solutions (3)
|
35,390
|
31,472
|
12
|
%
|
17
|
%
|
||||||||||
|
Total Revenue, net
|
$
|
274,913
|
$
|
274,756
|
0
|
%
|
4
|
%
|
||||||||
|
Contribution to Profit
|
$
|
69,023
|
$
|
78,808
|
-12
|
%
|
-13
|
%
|
||||||||
|
Adjustments:
|
||||||||||||||||
|
Restructuring charges
|
81
|
216
|
63
|
%
|
63
|
%
|
||||||||||
|
Non-GAAP Adjusted Contribution to Profit
|
$
|
69,104
|
$
|
79,024
|
-13
|
%
|
-13
|
%
|
||||||||
|
Depreciation and amortization
|
23,801
|
23,762
|
0
|
%
|
-3
|
%
|
||||||||||
|
Non-GAAP Adjusted EBITDA
|
$
|
92,905
|
$
|
102,786
|
-10
|
%
|
-9
|
%
|
||||||||
|
Adjusted EBITDA margin
|
33.8
|
%
|
37.4
|
%
|
||||||||||||
|
Academic & Professional Learning:
|
||||||||||||||||
|
Revenue, net
|
||||||||||||||||
|
Education Publishing
|
$
|
63,056
|
$
|
66,380
|
-5
|
%
|
-2
|
%
|
||||||||
|
Professional Learning
|
69,903
|
72,884
|
-4
|
%
|
0
|
%
|
||||||||||
|
Total Revenue, net
|
$
|
132,959
|
$
|
139,264
|
-5
|
%
|
-1
|
%
|
||||||||
|
Contribution to Profit
|
$
|
(4,415
|
)
|
$
|
8,152
|
#
|
#
|
|||||||||
|
Adjustments:
|
||||||||||||||||
|
Restructuring charges
|
5,790
|
171
|
#
|
#
|
||||||||||||
|
Non-GAAP Adjusted Contribution to Profit
|
$
|
1,375
|
$
|
8,323
|
-83
|
%
|
-80
|
%
|
||||||||
|
Depreciation and amortization
|
16,532
|
18,364
|
10
|
%
|
7
|
%
|
||||||||||
|
Non-GAAP Adjusted EBITDA
|
$
|
17,907
|
$
|
26,687
|
-33
|
%
|
-30
|
%
|
||||||||
|
Adjusted EBITDA margin
|
13.5
|
%
|
19.2
|
%
|
||||||||||||
|
Education Services:
|
||||||||||||||||
|
Revenue, net
|
||||||||||||||||
|
University Services (4)
|
$
|
47,811
|
$
|
54,968
|
-13
|
%
|
-12
|
%
|
||||||||
|
Talent Development Services (4)
|
31,886
|
19,400
|
64
|
%
|
76
|
%
|
||||||||||
|
Total Revenue, net
|
$
|
79,697
|
$
|
74,368
|
7
|
%
|
11
|
%
|
||||||||
|
Contribution to Profit
|
$
|
(17,169
|
)
|
$
|
(1,827
|
)
|
#
|
#
|
||||||||
|
Adjustments:
|
||||||||||||||||
|
Restructuring charges (credits)
|
833
|
(34
|
)
|
#
|
#
|
|||||||||||
|
Accelerated amortization of an intangible asset (5)
|
4,594
|
-
|
#
|
#
|
||||||||||||
|
Non-GAAP Adjusted Contribution to Profit
|
$
|
(11,742
|
)
|
$
|
(1,861
|
)
|
#
|
#
|
||||||||
|
Depreciation and amortization
|
9,196
|
8,303
|
-11
|
%
|
-12
|
%
|
||||||||||
|
Non-GAAP Adjusted EBITDA
|
$
|
(2,546
|
)
|
$
|
6,442
|
#
|
#
|
|||||||||
|
Adjusted EBITDA margin
|
-3
|
%
|
8.7
|
%
|
||||||||||||
|
Corporate Expenses:
|
$
|
(64,404
|
)
|
$
|
(44,165
|
)
|
-46
|
%
|
-51
|
%
|
||||||
|
Adjustments:
|
||||||||||||||||
|
Restructuring charges (credits)
|
15,737
|
(629
|
)
|
#
|
#
|
|||||||||||
|
Non-GAAP Adjusted Contribution to Profit
|
$
|
(48,667
|
)
|
$
|
(44,794
|
)
|
-9
|
%
|
-13
|
%
|
||||||
|
Depreciation and amortization
|
4,156
|
4,137
|
0
|
%
|
-3
|
%
|
||||||||||
|
Non-GAAP Adjusted EBITDA
|
$
|
(44,511
|
)
|
$
|
(40,657
|
)
|
-9
|
%
|
-14
|
%
|
||||||
|
Consolidated Results:
|
||||||||||||||||
|
Revenue, net
|
$
|
487,569
|
$
|
488,388
|
0
|
%
|
4
|
%
|
||||||||
|
Operating (Loss) Income
|
$
|
(16,965
|
)
|
$
|
40,968
|
#
|
#
|
|||||||||
|
Adjustments:
|
||||||||||||||||
|
Restructuring charges (credits)
|
22,441
|
(276
|
)
|
#
|
#
|
|||||||||||
|
Accelerated amortization of an intangible asset (5)
|
4,594
|
-
|
#
|
#
|
||||||||||||
|
Non-GAAP Adjusted Operating Income
|
$
|
10,070
|
$
|
40,692
|
-75
|
%
|
-81
|
%
|
||||||||
|
Depreciation and amortization
|
53,685
|
54,566
|
2
|
%
|
-1
|
%
|
||||||||||
|
Non-GAAP Adjusted EBITDA
|
$
|
63,755
|
$
|
95,258
|
-33
|
%
|
-34
|
%
|
||||||||
|
Adjusted EBITDA margin
|
13.1
|
%
|
19.5
|
%
|
||||||||||||
|
Notes:
|
|||||||
|
(1) The supplementary information included in this press release for the three months ended July 31, 2022 is preliminary and subject to
change prior to the filing of our upcoming Quarterly Report on Form 10-Q with the Securities and Exchange Commission.
|
|||||||
|
(2) The Research segment was previously referred to as Research Publishing & Platforms.
|
|||||||
|
(3) As previously announced in May 2022, our revenue by product type previously referred to as Research Platforms was changed to Research
Solutions. Research Solutions includes infrastructure and publishing services that help societies and corporations thrive in a complex knowledge ecosystem. In addition to Platforms (Atypon), certain product offerings such as corporate
sales which included the recent acquisitions of Madgex Holdings Limited (Madgex), and Bio-Rad Laboratories Inc.’s Informatics products (Informatics) that were previously included in Research Publishing moved to Research Solutions to
align with our strategic focus. Research Solutions also includes product offerings related to certain recent acquisitions such as J&J, and EJP. Prior period results have been revised to the new presentation. There were no
changes to the total Research segment or our consolidated financial results. The revenue was $20.0 million for the three months ended July 31, 2021, $93.3 million for the year ended April 30, 2022, and $80.3 million for the year ended
April 30, 2021.
|
|||||||
|
(4) In May 2022, we moved the WileyNXT product offering from Talent Development Services to University Services and the prior period results
have been included in University Services. The revenue was $0.6 million for the three months ended July 31, 2021. There were no changes to the total Education Services segment or our total consolidated financial results.
|
|||||||
|
(5) On January 1, 2020, Wiley acquired mthree, a talent placement provider that addresses the IT skills gap by finding, training, and placing
job-ready technology talent in roles with leading corporations worldwide. Its results of operations are included in our Education Services segment. In late May 2022, Wiley renamed the mthree talent development solution to Wiley Edge
and discontinued use of the mthree trademark during the three months ended July 31, 2022. As a result of these actions, we determined that a revision of the useful life was warranted, and the intangible asset was fully amortized over
its remaining useful life resulting in accelerated amortization expense of $4.6 million in the three months ended July 31, 2022.
|
|||||||
|
# Variance greater than 100%
|
|
||||||
|
JOHN WILEY & SONS, INC.
|
||||||||
|
SUPPLEMENTARY INFORMATION (1)
|
||||||||
|
CONDENSED CONSOLIDATED STATEMENTS OF FINANCIAL POSITION
|
||||||||
|
(in thousands)
|
||||||||
|
(unaudited)
|
||||||||
|
July 31,
|
April 30,
|
|||||||
|
2022
|
2022
|
|||||||
|
Assets:
|
||||||||
|
Current assets
|
||||||||
|
Cash and cash equivalents
|
$
|
104,495
|
$
|
100,397
|
||||
|
Accounts receivable, net
|
281,443
|
331,960
|
||||||
|
Inventories, net
|
33,422
|
36,585
|
||||||
|
Prepaid expenses and other current assets
|
81,410
|
81,924
|
||||||
|
Total current assets
|
500,770
|
550,866
|
||||||
|
Technology, property and equipment, net
|
258,454
|
271,572
|
||||||
|
Intangible assets, net
|
895,808
|
931,429
|
||||||
|
Goodwill
|
1,289,242
|
1,302,142
|
||||||
|
Operating lease right-of-use assets
|
103,196
|
111,719
|
||||||
|
Other non-current assets
|
181,838
|
193,967
|
||||||
|
Total assets
|
$
|
3,229,308
|
$
|
3,361,695
|
||||
|
Liabilities and shareholders' equity:
|
||||||||
|
Current liabilities
|
||||||||
|
Accounts payable
|
$
|
56,677
|
$
|
77,438
|
||||
|
Accrued royalties
|
93,552
|
101,596
|
||||||
|
Short-term portion of long-term debt
|
21,875
|
18,750
|
||||||
|
Contract liabilities
|
407,098
|
538,126
|
||||||
|
Accrued employment costs
|
80,200
|
117,121
|
||||||
|
Short-term portion of operating lease liabilities
|
19,788
|
20,576
|
||||||
|
Other accrued liabilities
|
101,554
|
95,812
|
||||||
|
Total current liabilities
|
780,744
|
969,419
|
||||||
|
Long-term debt
|
917,236
|
768,277
|
||||||
|
Accrued pension liability
|
77,511
|
78,622
|
||||||
|
Deferred income tax liabilities
|
159,717
|
180,065
|
||||||
|
Operating lease liabilities
|
127,055
|
132,541
|
||||||
|
Other long-term liabilities
|
84,719
|
90,502
|
||||||
|
Total liabilities
|
2,146,982
|
2,219,426
|
||||||
|
Shareholders' equity
|
1,082,326
|
1,142,269
|
||||||
|
Total liabilities and shareholders' equity
|
$
|
3,229,308
|
$
|
3,361,695
|
||||
|
Notes:
|
||||||||
|
(1) The supplementary information included in this press release for July 31, 2022 is preliminary and subject to change prior to the filing
of our upcoming Quarterly Report on Form 10-Q with the Securities and Exchange Commission.
|
||||||||
|
JOHN WILEY & SONS, INC.
|
|||||||||
|
SUPPLEMENTARY INFORMATION (1)
|
|||||||||
|
CONDENSED CONSOLIDATED STATEMENTS OF CASH FLOWS
|
|||||||||
|
(in thousands)
|
|||||||||
|
(unaudited)
|
|||||||||
|
Three Months Ended
|
|||||||||
|
July 31,
|
|||||||||
|
2022
|
2021
|
||||||||
|
Operating activities:
|
|||||||||
|
Net (loss) income
|
$
|
(17,835
|
)
|
$
|
13,830
|
||||
|
Amortization of intangible assets
|
25,311
|
21,151
|
|||||||
|
Amortization of product development assets
|
8,288
|
9,058
|
|||||||
|
Depreciation and amortization of technology, property, and equipment
|
24,680
|
24,357
|
|||||||
|
Other noncash charges
|
27,714
|
35,856
|
|||||||
|
Net change in operating assets and liabilities
|
(158,097
|
)
|
(189,026
|
)
|
|||||
|
Net cash used in operating activities
|
(89,939
|
)
|
(84,774
|
)
|
|||||
|
Investing activities:
|
|||||||||
|
Additions to technology, property, and equipment
|
(17,923
|
)
|
(17,910
|
)
|
|||||
|
Product development spending
|
(5,825
|
)
|
(5,670
|
)
|
|||||
|
Businesses acquired in purchase transactions, net of cash acquired
|
(96
|
)
|
(3,032
|
)
|
|||||
|
Proceeds related to the sale of certain assets
|
-
|
3,375
|
|||||||
|
Acquisitions of publication rights and other
|
2,038
|
(295
|
)
|
||||||
|
Net cash used in investing activities
|
(21,806
|
)
|
(23,532
|
)
|
|||||
|
Financing activities:
|
|||||||||
|
Net debt borrowings
|
156,873
|
142,703
|
|||||||
|
Cash dividends
|
(19,468
|
)
|
(19,307
|
)
|
|||||
|
Purchases of treasury shares
|
(10,000
|
)
|
(7,367
|
)
|
|||||
|
Other
|
(9,416
|
)
|
(16,940
|
)
|
|||||
|
Net cash provided by financing activities
|
117,989
|
99,089
|
|||||||
|
Effects of exchange rate changes on cash, cash equivalents and restricted cash
|
(1,985
|
)
|
(1,586
|
)
|
|||||
|
Change in cash, cash equivalents and restricted cash for period
|
4,259
|
(10,803
|
)
|
||||||
|
Cash, cash equivalents and restricted cash - beginning
|
100,727
|
94,359
|
|||||||
|
Cash, cash equivalents and restricted cash - ending
|
$
|
104,986
|
$
|
83,556
|
|||||
|
CALCULATION OF NON-GAAP FREE CASH FLOW LESS PRODUCT DEVELOPMENT SPENDING (2)
|
|||||||||
|
Three Months Ended
|
|||||||||
|
July 31,
|
|||||||||
|
2022
|
2021
|
||||||||
|
Net cash used in operating activities
|
$
|
(89,939
|
)
|
$
|
(84,774
|
)
|
|||
|
Less: Additions to technology, property, and equipment
|
|
(17,923
|
)
|
(17,910
|
)
|
||||
|
Less: Product development spending
|
|
(5,825
|
)
|
(5,670
|
)
|
||||
|
Free cash flow less product development spending
|
$
|
(113,687
|
)
|
$
|
(108,354
|
)
|
|||
|
Notes:
|
|||||||||
|
(1) The supplementary information included in this press release for the three months ended July 31, 2022 is preliminary and subject to
change prior to the filing of our upcoming Quarterly Report on Form 10-Q with the Securities and Exchange Commission.
|
|||||||||
|
(2) See Explanation of Usage of Non-GAAP Performance Measures included in this supplemental information.
|
|||||||||
|
JOHN WILEY & SONS, INC.
|
|
EXPLANATION OF USAGE OF NON-GAAP PERFORMANCE MEASURES
|
|
In this earnings release and supplemental information, management may present the following non-GAAP performance measures:
|
|
• Adjusted Earnings Per Share (Adjusted EPS);
|
|
• Free Cash Flow less Product Development Spending;
|
|
• Adjusted Contribution to Profit and margin;
|
|
• Adjusted Operating Income and margin;
|
|
• Adjusted Income Before Taxes;
|
|
• Adjusted Income Tax Provision;
|
|
• Adjusted Effective Tax Rate;
|
|
• EBITDA, Adjusted EBITDA and margin;
|
|
• Organic revenue; and
|
|
• Results on a constant currency basis.
|
|
Management uses these non-GAAP performance measures as supplemental indicators of our operating performance and financial position as
well as for internal reporting and forecasting purposes, when publicly providing our outlook, to evaluate our performance and calculate incentive compensation.
|
|
We present these non-GAAP performance measures in addition to US GAAP financial results because we believe that these non-GAAP
performance measures provide useful information to certain investors and financial analysts for operational trends and comparisons over time. The use of these non-GAAP performance measures may also provide a consistent basis to
evaluate operating profitability and performance trends by excluding items that we do not consider to be controllable activities for this purpose.
|
|
The performance metric used by our chief operating decision maker to evaluate performance of our reportable segments is Adjusted
Contribution to Profit. We present both Adjusted Contribution to Profit and Adjusted EBITDA for each of our reportable segments as we believe Adjusted EBITDA provides additional useful information to certain investors and
financial analysts for operational trends and comparisons over time. It removes the impact of depreciation and amortization expense, as well as presents a consistent basis to evaluate operating profitability and compare our
financial performance to that of our peer companies and competitors.
|
|
For example:
|
|
• Adjusted EPS, Adjusted Contribution to Profit, Adjusted Operating Income, Adjusted Income Before Taxes, Adjusted Income Tax Provision, Adjusted Effective Tax Rate, Adjusted EBITDA and
organic revenue (excluding acquisitions) provide a more comparable basis to analyze operating results and earnings, and are measures commonly used by shareholders to measure our performance.
|
|
• Free Cash Flow less Product Development Spending helps assess our ability, over the long term, to create value for our shareholders as it represents cash available to repay debt, pay
common stock dividends, and fund share repurchases and acquisitions.
|
|
• Results on a constant currency basis remove distortion from the effects of foreign currency movements to provide better comparability of our business trends from period to period. We
measure our performance excluding the impact of foreign currency (or at constant currency), which means that we apply the same foreign currency exchange rates for the current and equivalent prior period.
|
|
In addition, we have historically provided these or similar non-GAAP performance measures and understand that some investors and
financial analysts find this information helpful in analyzing our operating margins and net income, and in comparing our financial performance to that of our peer companies and competitors. Based on interactions with investors,
we also believe that our non-GAAP performance measures are regarded as useful to our investors as supplemental to our US GAAP financial results, and that there is no confusion regarding the adjustments or our operating
performance to our investors due to the comprehensive nature of our disclosures.
|
|
We have not provided our 2023 outlook for the most directly comparable US GAAP financial measures, as they are not available without
unreasonable effort due to the high variability, complexity, and low visibility with respect to certain items, including restructuring charges and credits, gains and losses on foreign currency, and other gains and losses. These
items are uncertain, depend on various factors, and could be material to our consolidated results computed in accordance with US GAAP.
|
|
Non-GAAP performance measures do not have standardized meanings prescribed by US GAAP and therefore may not be comparable to the
calculation of similar measures used by other companies and should not be viewed as alternatives to measures of financial results under US GAAP. The adjusted metrics have limitations as analytical tools, and should not be
considered in isolation from, or as a substitute for, US GAAP information. It does not purport to represent any similarly titled US GAAP information and is not an indicator of our performance under US GAAP. Non-GAAP financial
metrics that we present may not be comparable with similarly titled measures used by others. Investors are cautioned against placing undue reliance on these non-GAAP measures.
|