Western New England Bancorp, Inc. 8-K
Exhibit 99.1
| |
For
further information contact:
James C. Hagan, President and CEO
Guida R. Sajdak, Executive Vice President and CFO
Meghan Hibner, Vice President and Investor Relations Officer
413-568-1911 |
| |
|
WESTERN
NEW ENGLAND BANCORP, INC. REPORTS RESULTS FOR THREE AND SIX MONTHS
ENDED
JUNE 30, 2022 AND DECLARES QUARTERLY CASH DIVIDEND
THE
COMPANY ALSO ANNOUNCES A NEW 5% SHARE REPURCHASE PLAN
Westfield,
Massachusetts, July 26, 2022: Western New England Bancorp, Inc. (the “Company” or “WNEB”) (NasdaqGS:
WNEB), the holding company for Westfield Bank (the “Bank”), announced today the unaudited results of operations for
the three and six months ended June 30, 2022. For the three months ended June 30, 2022, the Company reported net income of $5.5
million, or $0.25 per diluted share, compared to net income of $5.7 million, or $0.24 per diluted share, for the three months
ended June 30, 2021. On a linked quarter basis, net income was $5.5 million, or $0.25 per diluted share, as compared to net income
of $5.3 million, or $0.24 per diluted share, for the three months ended March 31, 2022. For the six months ended June 30, 2022,
net income was $10.9 million, or $0.49 per diluted share, compared to net income of $11.4 million, or $0.47 per diluted share,
for the six months ended June 30, 2021.
The
Company also announced that the Board of Directors declared a quarterly cash dividend of $0.06 per share on the Company’s
common stock. The dividend will be payable on or about August 24, 2022 to shareholders of record on August 10, 2022. In addition,
the Board of Directors authorized a stock repurchase plan (the “2022 Plan”), pursuant to which the Company may repurchase
up to 1.1 million shares of the Company’s common stock, or approximately 5.0%, of the Company’s outstanding shares,
of common stock as of the date the 2022 Plan was adopted. Repurchase under the 2022 Plan may begin after the Company has repurchased
all of the shares of its common stock authorized for repurchase under the stock repurchase plan adopted in 2021 (the “2021
Plan”). The 2021 Plan was announced on April 27, 2021 and as of June 30, 2022, there were 271,472 shares of common stock
available for purchase under the 2021 Plan.
“The
Company continues to experience strong quarterly earnings adding to the momentum from last year’s record profitability.
We are pleased to report solid earnings for the second quarter of 2022 along with strong overall loan growth. We remain focused
on executing our strategy of driving commercial loan growth, which has been a key contributor to the Company’s ongoing profitability,”
said James C. Hagan, President and Chief Executive Officer. “We remain optimistic about the Company’s growth opportunities
in 2022 and we continue to be successful despite the current economic environment.
The
Company continues to show strong loan growth in key loan categories funded by excess cash generated through increases in our core
deposits. We saw strong organic core deposit grow of $96.7 million, or 5.2%, since year-end, which will be beneficial in a rising
interest rate environment. We are pleased to report that our total loan portfolio increased $133.7 million, or 7.3% during the
six months ended June 30, 2022, excluding Paycheck Protection Program (“PPP”) loans that were forgiven by the Small
Business Administration (“SBA”). As we continue to add new customer relationships throughout New England and in key
strategic lending areas, we have seen the strongest growth from our commercial real estate lending portfolio, which increased
$94.9 million, or 9.7%, during the six months ended June 30, 2022. Commercial and industrial loans continue to be added to our
loan portfolio and remain a strategic priority. We continue to be mindful of certain economic and business conditions, such as
inflation, utilization of accumulated cash to fund operations, and supply chain issues that may affect some of our business customers,
as well as the additional anticipated Federal Reserve interest rate increases, but remain optimistic about our loan portfolio
growth and meeting the needs of our business and commercial customers.
We
believe the balance sheet management steps we took in 2021 have had a positive impact on earnings and growth and have directly
resulted in an increase in net interest income and the net interest margin, which increased from 3.08% in the fourth quarter of
2021 to 3.24% in the second quarter of 2022. Our disciplined approach to managing funding costs has helped to expand our net interest
margin as we continue to deploy our excess liquidity and core deposits to fund loan growth. Our asset quality remains extremely
solid, with historical lows for nonperforming loans to total loans of 0.21%, and our capital position continues to remain strong.”
Hagan
concluded, “We will continue to implement our various strategic initiatives which have resulted in solid earnings last year
and through the first two quarters of this year and will continue our efforts to grow the Company throughout the remaining quarters
and increase overall shareholder value.”
Key
Highlights:
Loans
and Deposits. At June 30, 2022, total loans were $2.0 billion, an increase of $111.0 million, or 6.0%, from December 31, 2021.
Excluding PPP loans, total loans increased $133.7 million, or 7.3%, from December 31, 2021, primarily due to a $94.9 million,
or 9.7%, increase in commercial real estate loans from December 31, 2021 to June 30, 2022.
At
June 30, 2022, total deposits were $2.3 billion, an increase of $45.1 million, or 2.0%, from December 31, 2021. Core deposits,
which include non-interest bearing demand accounts, increased $96.7 million, or 5.2%, from $1.9 billion, or 82.2% of total deposits,
at December 31, 2021, to $2.0 billion, or 84.8% of total deposits at June 30, 2022. The loan to deposit ratio increased from 82.6%
at December 31, 2021 to 85.8% at June 30, 2022.
Allowance
for Loan Losses and Credit Quality. At June 30, 2022, the allowance for loan losses as a percentage of total loans and as
a percentage of nonperforming loans was 0.99% and 476.5%, respectively. At June 30, 2022, nonperforming loans totaled $4.1 million,
or 0.21% of total loans, compared to $5.0 million, or 0.27% of total loans, at December 31, 2021. Total delinquency increased
$71,000, or 3.3%, from $2.1 million, or 0.11% of total loans at December 31, 2021 to $2.2 million, or 0.11% of total loans at
June 30, 2022.
Net
Interest Margin. The net interest margin was 3.24% for the three months ended June 30, 2022 compared to 3.18% for the three
months ended March 31, 2022. The net interest margin, on a tax-equivalent basis, was 3.26% for the three months ended June 30,
2022, compared to 3.20% for the three months ended March 31, 2022.
Repurchases.
On April 27, 2021, the Board of Directors authorized the 2021 Plan, pursuant to which the Company is authorized to repurchase
up to 2.4 million shares, or 10% of its outstanding common stock, as of the date the 2021 Plan was adopted. During the three months
ended June 30, 2022, the Company repurchased 293,173 shares of common stock under the 2021 Plan. During the six months ended June
30, 2022, the Company repurchased 405,847 shares of common stock under the 2021 Plan. At June 30, 2022, there were 271,472 shares
of common stock available for repurchase under the 2021 Plan.
On
July 26, 2022, the Board of Directors authorized the 2022 Plan, pursuant to which the Company may repurchase up to 1.1 million
shares of common stock, which is approximately 5.0% of the Company’s outstanding shares as of the date the 2022 Plan was
adopted. Repurchases under the 2022 Plan may commence after the Company has repurchased all of the shares of common stock authorized
for repurchase under the 2021 Plan.
The
shares of common stock repurchased under the 2021 Plan and the 2022 Plan will be purchased from time to time at prevailing market
prices, through open market or privately negotiated transactions, or otherwise, depending upon market conditions. There is no
guarantee as to the exact number, or value, of shares that will be repurchased by the Company, and the Company may discontinue
repurchases at any time that management determines additional repurchases are not warranted. The timing and amount of additional
share repurchases under the 2021 Plan and the 2022 Plan will depend on a number of factors, including the Company’s stock
price performance, ongoing capital planning considerations, general market conditions, and applicable legal requirements.
Capital
Management. Book value per share was $9.58 at June 30, 2022, compared to $9.87 at December 31, 2021, while tangible book value
per share, a non-GAAP financial measure, decreased $0.29, or 3.1%, from $9.21 at December 31, 2021 to $8.92 at June 30, 2022.
During the six months ended June 30, 2022, the change in accumulated other comprehensive income/loss (“AOCI”) reduced
the tangible book value per common share by $0.64 as of June 30, 2022, primarily due to the impact of higher interest
rates on the fair value of available-for-sale securities. Tangible book value is a non-GAAP measure. See pages 18-21 for
the related tangible book value calculation and a reconciliation of GAAP to non-GAAP financial measures. As of June 30, 2022,
the Company’s and the Bank’s regulatory capital ratios continued to exceed the levels required to be considered “well-capitalized”
under federal banking regulations.
Net
Income for the Three Months Ended June 30, 2022 Compared to the Three Months Ended March 31, 2022.
The
Company reported net income of $5.5 million, or $0.25 per diluted share, for the three months ended June 30, 2022, compared to
net income of $5.3 million, or $0.24 per diluted share, for the three months ended March 31, 2022. Net interest income increased
$694,000, or 3.7%, non-interest income increased $393,000, or 16.7%, and non-interest expense decreased $23,000, or 0.2%, while
the provision for loan losses increased $725,000, or 170.6%, during the same period. Return on average assets and return on average
equity were 0.87% and 10.22%, respectively, for the three months ended June 30, 2022, compared to 0.85% and 9.65%, respectively,
for the three months ended March 31, 2022.
Net
Interest Income and Net Interest Margin
On
a sequential quarter basis, net interest income increased $694,000, or 3.7%, to $19.4 million for the three months ended June
30, 2022, from $18.7 million for the three months ended March 31, 2022. The increase in net interest income was primarily due
to an increase in interest and dividend income of $703,000, or 3.5%. During the three months ended June 30, 2022 and the three
months ended March 31, 2022, interest and dividend income included PPP interest and fee income (“PPP income”) of $129,000
and $562,000, respectively. During the three months ended June 30, 2022, the Company recorded $64,000 in positive purchase accounting
adjustments, compared to positive purchase accounting adjustments of $39,000 during the three months ended March 31, 2022. Excluding
PPP income and purchase accounting adjustments, net interest income increased $1.1 million, or 6.1%, from the three months ended
March 31, 2022 to the three months ended June 30, 2022.
The
net interest margin was 3.24% for the three months ended June 30, 2022 compared to 3.18% for the three months ended March 31,
2022. The net interest margin, on a tax-equivalent basis, was 3.26% for the three months ended June 30, 2022, compared to 3.20%
for the three months ended March 31, 2022. The average yield on interest-earning assets was 3.47% for the three months ended June
30, 2022, compared to 3.41% for the three months ended March 31, 2022. The average loan yield was 3.83% for the three months ended
June 30, 2022, compared to 3.87% for the three months ended March 31, 2022. Excluding PPP income, the net interest margin was
3.23% for the three months ended June 30, 2022, compared to 3.10% for the three months ended March 31, 2022.
During
the three months ended June 30, 2022, average interest-earning assets increased $12.6 million, or 0.5%, to $2.4 billion, primarily
due to an increase in average loans of $54.6 million, or 2.9%, partially offset by a decrease in short-term investments of $32.1
million, or 56.3%, and a decrease in average securities of $9.9 million, or 2.3%. Excluding PPP loans, average loans increased
$66.6 million, or 3.5%, from the three months ended March 31, 2022 to the three months ended June 30, 2022.
The
average cost of total funds, including non-interest bearing accounts and borrowings, remained unchanged at 0.22% for the three
months ended June 30, 2022, compared to the three months ended March 31, 2022. The average cost of core deposits, including non-interest
bearing demand deposits, increased one basis point to 15 basis points for the three months ended June 30, 2022, from 14 basis
points for the three months ended March 31, 2022. The average cost of time deposits decreased three basis points from 0.35% for
the three months ended March 31, 2022 to 0.32% for the three months ended June 30, 2022. The average cost of borrowings, including
subordinated debt, decreased 55 basis points from 4.65% for the three months ended March 31, 2022 to 4.10% for the three months
ended June 30, 2022. Average demand deposits, an interest-free source of funds, increased $2.6 million, or 0.4%, from $633.1 million,
or 28.1% of total average deposits, for the three months ended March 31, 2022, to $635.7 million, or 28.0% of total average deposits,
for the three months ended June 30, 2022.
Provision
for Loan Losses
During
the three months ended June 30, 2022, the provision for loan losses increased $725,000, from a credit for loan losses of $425,000
for the three months ended March 31, 2022, to a provision for loan losses of $300,000. The increase in the provision for loan
losses was due to strong organic loan growth during the quarter. Management continues to assess the exposure of the Company’s
loan portfolio to the COVID-19 pandemic, economic trends and their potential effect on asset quality. The Company has deferred
the adoption of the Current Expected Credit Loss allowance methodology, as permitted by its classification as a Smaller Reporting
Company under Securities and Exchange Commission rules. Management will continue to closely monitor portfolio conditions and re-evaluate
the adequacy of the allowance.
The
Company recorded net charge-offs of $48,000 for the three months ended June 30, 2022, as compared to net charge-offs of $54,000
for the three months ended March 31, 2022. At June 30, 2022, nonperforming loans totaled $4.1 million, or 0.21% of total loans,
and total delinquency as a percentage of total loans was 0.11%.
Non-Interest
Income
On
a sequential quarter basis, non-interest income increased $393,000, or 16.7%, to $2.7 million for the three months ended June
30, 2022, from $2.3 million for the three months ended March 31, 2022. Service charges and fees increased $172,000, or 8.0%, from
the three months ended March 31, 2022 to $2.3 million for the three months ended June 30, 2022. The Company reported unrealized
losses on marketable equity securities of $225,000 for the three months ended June 30, 2022, compared to unrealized losses of
$276,000 for the three months ended March 31, 2022. Income from bank-owned life insurance increased $10,000, or 2.2%, from the
three months ended March 31, 2022 to $458,000, for the three months ended June 30, 2022. During the three months ended June 30,
2022, the Company reported $21,000 in other income from loan-level swap fees on commercial loans and a gain of $141,000 on non-marketable
equity investments. During the three months ended March 31, 2022, the Company reported a net loss of $4,000 on securities sales.
The Company did not sell any securities during the three months ended June 30, 2022.
Non-Interest
Expense
For
the three months ended June 30, 2022, non-interest expense decreased $23,000, or 0.2%, to $14.4 million from the three months
ended March 31, 2022. Salaries and employee benefits decreased $3,000 to $8.2 million, occupancy expense decreased $186,000, or
13.6%, FDIC insurance expense decreased $52,000, or 18.2%, and furniture and equipment expenses decreased $4,000, or 0.7%. These
decreases were partially offset by increases in professional fees of $142,000, or 24.6%, advertising expense of $13,000, or 3.3%,
data processing expense of $8,000, or 1.1%, and other non-interest expense of $59,000, or 2.5%. For the three months ended June
30, 2022, the adjusted efficiency ratio, a non-GAAP financial measure, was 65.0%, compared to 67.8% for the three months ended
March 31, 2022. The adjusted efficiency ratio is a non-GAAP measure. See pages 18-21 for the related ratio calculation and a reconciliation
of GAAP to non-GAAP financial measures.
Income
Tax Provision
Income
tax expense for the three months ended June 30, 2022 was $1.9 million, or an effective tax rate of 25.2%, compared to $1.7 million,
or an effective tax rate of 24.2%, for three months ended March 31, 2022. The increase in the effective tax rate reflects higher
projected pre-tax income for the year ending December 31, 2022.
Net
Income for the Three Months Ended June 30, 2022 Compared to the Three Months Ended June 30, 2021.
The
Company reported net income of $5.5 million, or $0.25 per diluted share, for the three months ended June 30, 2022, compared to
net income of $5.7 million, or $0.24 per diluted share, for the three months ended June 30, 2021. Return on average assets and
return on average equity was 0.87% and 10.22%, respectively, for the three months ended June 30, 2022, as compared to 0.92% and
10.16%, respectively, for the three months ended June 30, 2021.
Net
Interest Income and Net Interest Margin
Net
interest income increased $1.6 million, or 8.9%, to $19.4 million, for the three months ended June 30, 2022, from $17.8 million
for the three months ended June 30, 2021. The increase was due to an increase in interest and dividend income of $994,000, or
5.1%, and a decrease in interest expense of $594,000, or 32.2%. Interest expense on deposits decreased $476,000, or 32.5%, and
interest expense on borrowings decreased $118,000, or 30.9%. For the three months ended June 30, 2022, net interest income included
$129,000 in PPP income, compared to $1.6 million for the three months ended June 30, 2021. Excluding PPP income, net interest
income increased $3.1 million, or 19.1%, primarily due to an increase in interest and dividend income of $2.5 million, or 13.8%.
The
net interest margin was 3.24% for the three months ended June 30, 2022, compared to 3.06% for the three months ended June 30,
2021. The net interest margin, on a tax-equivalent basis, was 3.26% for the three months ended June 30, 2022, compared to 3.08%
for the three months ended June 30, 2021. The increase in the net interest margin was due to an increase in average loans outstanding
of $38.1 million, or 2.0%, from the three months ended June 30, 2021, compared to the three months ended June 30, 2022.
The
average yield on interest-earning assets increased seven basis points from 3.40% for the three months ended June 30, 2021 to 3.47%
for the three months ended June 30, 2022. During the three months ended June 30, 2022, the average cost of funds, including non-interest-bearing
demand accounts and borrowings, decreased 11 basis points, from 0.33% for the three months ended June 30, 2021 to 0.22% for the
three months ended June 30, 2022. The average cost of core deposits, which include non-interest-bearing demand accounts, decreased
four basis points, from 0.19% for the three months ended June 30, 2021 to 0.15% for the three months ended June 30, 2022. The
average cost of time deposits decreased 24 basis points from 0.56% for the three months ended June 30, 2021 to 0.32% for the three
months ended June 30, 2022. The average cost of borrowings increased 129 basis points during the same period due to the full quarter
impact of the $20.0 million in subordinated debt issued on April 19, 2021. For the three months ended June 30, 2022, average demand
deposits, an interest-free source of funds, increased $32.4 million, or 5.4%, to $635.7 million, or 28.0% of total average deposits,
from $603.3 million, or 27.9% of total average deposits for the three months ended June 30, 2021.
During
the three months ended June 30, 2022, average interest-earning assets increased $68.2 million, or 2.9%, to $2.4 billion compared
to the three months ended June 30, 2021, primarily due to an increase in average securities of $120.0 million, or 39.5%, and an
increase in average loans of $38.1 million, or 2.0%, partially offset by a decrease in short-term investments of $89.9 million,
or 78.3%. Excluding average PPP loans, average interest-earning assets increased $220.7 million, or 10.2%, and average loans increased
$190.7 million, or 10.9%, from the three months ended June 30, 2021 to the three months ended June 30, 2022.
Provision
for Loan Losses
The
Company recorded a provision for loan losses of $300,000 for three months ended June 30, 2022, compared to a credit for loan losses
of $1.2 million for the three months ended June 30, 2021. The increase in the provision for loan losses was due to strong organic
loan growth during the second quarter of 2022. The Company recorded net charge-offs of $48,000 for the three months ended June
30, 2022, as compared to net charge-offs of $157,000 for the three months ended June 30, 2021. Management continues to assess
the exposure of the Company’s loan portfolio to the COVID-19 pandemic related factors, economic trends and their potential
effect on asset quality.
Non-Interest
Income
Non-interest
income increased $332,000, or 13.8%, to $2.7 million for the three months ended June 30, 2022, from $2.4 million for the three
months ended June 30, 2021. During the three months ended June 30, 2022, service charges and fees on deposits increased $271,000,
or 13.1%, primarily due to the $177,000, or 19.1%, increase in ATM and debit card interchange income from increased card-based
transaction usage across our checking account base. Other income from loan-level swap fees on commercial loans increased $21,000
from the three months ended June 30, 2021 to the three months ended June 30, 2022. Income from bank-owned life insurance decreased
$42,000, or 8.4%, from the three months ended June 30, 2021 to the three months ended June 30, 2022. During the three months ended
June 30, 2021, mortgage banking income from the sale of fixed rate residential real estate loans totaled $242,000. The Company
did not sell any loans to the secondary market during the three months ended June 30, 2022. The Company reported a gain of $141,000
on non-marketable equity investments and reported an unrealized loss on marketable equity securities of $225,000, during the three
months ended June 30, 2022, compared to unrealized gains on marketable equity securities of $6,000 during the three months ended
June 30, 2021. The Company also reported realized losses on the sale of securities of $12,000 during the three months ended June
30, 2021. Gains and losses from the investment portfolio vary from quarter to quarter based on market conditions, as well as the
related yield curve and valuation changes.
During
the three months ended June 30, 2021, the Company recognized a loss on interest rate swap termination of $402,000 representing
the unamortized portion of a $3.4 million loss associated with the previous termination of a $32.5 million interest rate swap
on March 16, 2016. The unamortized portion of the loss was previously reported in accumulated other comprehensive income and amortized
through interest expense, however, as the previously hedged item was discontinued, the Company accelerated the remaining unamortized
loss.
Non-Interest
Expense
For
the three months ended June 30, 2022, non-interest expense increased $759,000, or 5.6%, to $14.4 million from $13.7 million, for
the three months ended June 30, 2021. The increase in non-interest expense was partially due to an increase in salaries and benefits
of $263,000, or 3.3%, due to normal annual salary increases. Other non-interest expense increased $260,000, or 12.2%, professional
fees increased $130,000, or 22.1%, occupancy expense increased $78,000, or 7.1%, advertising expense increased $65,000, or 18.7%,
furniture and equipment expense increased $26,000, or 5.1%, and FDIC insurance expense increased $9,000, or 4.0%. During the same
period, data processing expense decreased $27,000, or 3.6%. During the three months ended June 30, 2021, the Company prepaid $32.5
million of FHLB borrowings resulting in a loss of $45,000. For the three months ended June 30, 2022, the adjusted efficiency ratio,
a non-GAAP financial measure, was 65.0%, compared to 66.1% for the three months ended June 30, 2021. The adjusted efficiency ratio
is a non-GAAP measure. See pages 18-21 for the related efficiency ratio calculation and a reconciliation of GAAP to non-GAAP financial
measures.
Income
Tax Provision
Income
tax expense for the three months ended June 30, 2022 was $1.9 million, representing an effective tax rate of 25.2%, compared to
$2.1 million, representing an effective tax rate of 27.0%, for three months ended June 30, 2021.
Net
Income for the Six Months Ended June 30, 2022 Compared to the Six Months Ended June 30, 2021
For
the six months ended June 30, 2022, the Company reported net income of $10.9 million, or $0.49 per diluted share, compared to
$11.4 million, or $0.47 per diluted share, for the six months ended June 30, 2021. Return on average assets and return on average
equity were 0.86% and 9.93% for the six months ended June 30, 2022, respectively, compared to 0.95% and 10.25% for the six months
ended June 30, 2021, respectively.
Net
Interest Income and Net Interest Margin
During
the six months ended June 30, 2022, net interest income increased $2.3 million, or 6.3%, to $38.1 million, compared to $35.8 million
for the six months ended June 30, 2021. The increase in net interest income was due to a decrease in interest expense of $1.4
million, or 35.2%, and an increase in interest and dividend income of $904,000, or 2.3%. The decrease in interest expense was
due to a decrease in interest expense on deposits of $1.2 million, or 38.1%, and a decrease of $138,000, or 21.1%, in interest
expense on borrowings. For the six months ended June 30, 2022, interest and dividend income included $691,000 in PPP income, compared
to $4.0 million during the six months ended June 30, 2021. Excluding PPP income, net interest income increased $5.6 million, or
17.6% for the same period.
The
net interest margin for the six months ended June 30, 2022 was 3.21%, compared to 3.15% during the six months ended June 30, 2021.
The net interest margin, on a tax-equivalent basis, was 3.23% for the six months ended June 30, 2022, compared to 3.17% for the
six months ended June 30, 2021. Excluding the PPP income, the net interest margin increased from 3.01% for the six months ended
June 30, 2021 to 3.16% for the six months ended June 30, 2022.
The
average yield on interest-earning assets decreased seven basis points from 3.51% for the six months ended June 30, 2021 to 3.44%
for the six months ended June 30, 2022. During the six months ended June 30, 2022, the average cost of funds, including non-interest-bearing
demand accounts and borrowings, decreased 14 basis points from 0.36% for the six months ended June 30, 2021 to 0.22% for the six
months ended June 30, 2022. For the six months ended June 30, 2022, the average cost of core deposits, including non-interest-bearing
demand deposits, decreased six basis points from 0.20% for the six months ended June 30, 2021 to 0.14% for the six months ended
June 30, 2022. The average cost of time deposits decreased 28 basis points from 0.62% for the six months ended June 30, 2021 to
0.34% during the same period in 2022. The average cost of borrowings, which include FHLB advances and subordinated debt, increased
184 basis points from 2.47% for the six months ended June 30, 2021 to 4.31% for the six months ended June 20, 2022. For the six
months ended June 30, 2022, average demand deposits, an interest-free source of funds, increased $51.8 million, or 8.9%, from
$582.5 million, or 27.4% of total average deposits, for the six months ended June 30, 2021, to $634.4 million, or 28.0% of total
average deposits.
During
the six months ended June 30, 2022, average interest-earning assets increased $99.2 million, or 4.3%, to $2.4 billion. The increase
in average interest-earning assets was due to an increase in average loans of $5.0 million, or 0.3%, as well as an increase in
average securities of $158.3 million, or 58.5%. Both were partially offset by a decrease of $64.1 million, or 61.1%, in short-term
investments. Excluding average PPP loans, average interest-earning assets increased $251.2 million, or 11.8%, and average loans
increased $157.0 million, or 8.9%.
Provision
for Loan Losses
For
the six months ended June 30, 2022, the credit for loan losses decreased $1.0 million, or 88.9%, from $1.1 million for the six
months ended June 30, 2021 to $125,000 for the six months ended June 30, 2022. During the six months ended June 30, 2021, the
Company adjusted its qualitative factors related to the impact of the COVID-19 pandemic and other economic trends used in the
Company’s allowance calculation which resulted in a credit for loan losses of $1.1 million. The Company recorded net charge-offs
of $102,000 for the six months ended June 30, 2022, as compared to net charge-offs of $162,000 for the six months ended June 30,
2021.
Non-Interest
Income
For
the six months ended June 30, 2022, non-interest income was $5.1 million, compared to $5.4 million for the six months ended June
30, 2021. During the same period, service charges and fees increased $562,000, or 14.2%. Other income from loan-level swap fees
on commercial loans decreased $37,000, or 63.8%, and income from bank-owned life insurance decreased $35,000, or 3.7%. Mortgage
banking income was $469,000 for the six months ended June 30, 2021 due to the sale of fixed rate residential real estate loans
to the secondary market. The Company sold $17.6 million of low coupon residential real estate loans to the secondary market during
the six months ended June 30, 2021, compared to $277,000 during the six months ended June 30, 2022.
During
the six months ended June 30, 2022, the Company reported unrealized losses on marketable equity securities of $501,000, compared
to unrealized losses of $83,000 during the six months ended June 30, 2021. During the six months ended June 30, 2022, the Company
also reported realized losses on the sale of securities of $4,000, compared to realized losses of $74,000 on the sale of securities
during the six months ended June 30, 2021. The Company reported a gain of $141,000 on non-marketable equity investments during
the six months ended June 30, 2022, compared to $546,000 during the six months ended June 30, 2021. Gains and losses from the
investment portfolio vary from quarter to quarter based on market conditions, as well as the related yield curve and valuation
changes.
During
the six months ended June 30, 2021, the Company recognized a loss on interest rate swap termination of $402,000 representing the
unamortized portion of a $3.4 million loss associated with the previous termination of a $32.5 million interest rate swap on March
16, 2016. The unamortized portion of the loss was previously reported in accumulated other comprehensive income and amortized
through interest expense, however, as the previously hedged item was discontinued, the Company accelerated the remaining unamortized
loss.
Non-Interest
Expense
For
the six months ended June 30, 2022, non-interest expense increased $1.9 million, or 7.0%, to $28.9 million, compared to $27.0
million for the six months ended June 30, 2021. The increase in non-interest expense was primarily due to an increase in salaries
and employee benefits of $739,000, or 4.7%, due to normal annual salary increases as well as higher compensation incentive costs
to support overall franchise growth. The increase in salary related expenses was also partially due to a decrease of $279,000
in deferred direct origination costs associated with Round 3 of PPP loans. The origination costs were recorded against salary
expense during the six months ended June 30, 2021.
Other
non-interest expense increased $702,000, or 17.5%, professional fees increased $163,000, or 14.4%, occupancy expense increased
$152,000, or 6.4%, advertising expense increased $126,000, or 18.4%, furniture and equipment expense increased $79,000, or 7.9%,
data processing expenses decreased $25,000, or 1.7%, and FDIC insurance expense decreased $3,000, or 0.6%. During the six months
ended June 30, 2021, the Company prepaid $32.5 million of FHLB borrowings resulting in a loss of $45,000. For the six months ended
June 30, 2022, the adjusted efficiency ratio, a non-GAAP financial measure, was 66.4%, compared to 65.3% for the six months ended
June 30, 2021. The adjusted efficiency ratio is a non-GAAP measure. See pages 18-21 for the related efficiency ratio calculation
and a reconciliation of GAAP to non-GAAP financial measures.
Income
Tax Provision
Income
tax expense for the six months ended June 30, 2022 was $3.6 million, representing an effective tax rate of 24.7%, compared to
$3.9 million, representing an effective tax rate of 25.5%, for six months ended June 30, 2021.
Balance
Sheet
At
June 30, 2022, total assets were $2.6 billion, an increase of $38.9 million, or 1.5%, from December 31, 2021. During the six months
ended June 30, 2022, cash and cash equivalents decreased $55.9 million, or 54.1%, to $47.5 million, investment securities decreased
$22.3 million, or 5.2%, to $406.2 million and total loans increased $111.0 million, or 6.0%, to $2.0 billion.
Investments
At
June 30, 2022, the Company’s available-for-sale securities portfolio decreased $33.4 million, or 17.2%, from $194.4 million
at December 31, 2021 to $160.9 million at June 30, 2022. The held-to-maturity securities portfolio, recorded at amortized cost,
increased $11.5 million, or 5.2%, from $222.3 million at December 31, 2021 to $233.8 million at June 30, 2022. The marketable
equity securities portfolio decreased $443,000, or 3.7%, from $11.9 million at December 31, 2021 to $11.5 million at June 30,
2022. The primary objective of the investment portfolio is to provide liquidity and maximize income while preserving the safety
of principal.
Total
Loans
At
June 30, 2022, total loans were $2.0 billion, an increase of $111.0 million, or 6.0%, from December 31, 2021. Excluding PPP loans,
total loans increased $133.7 million, or 7.3%, driven by an increase in commercial real estate loans of $94.9 million, or 9.7%,
partially offset by a decrease in total commercial and industrial loans of $8.8 million, or 3.9%. Excluding a decrease in PPP
loans of $22.7 million, or 89.6%, from December 31, 2021, commercial and industrial loans increased $13.9 million, or 6.9%, at
June 30, 2022. Residential real estate loans, which include home equity loans, increased $24.2 million, or 3.7%. In accordance
with the Company’s asset/liability management strategy, at June 30, 2022, the Company serviced $82.5 million in loans sold
to the secondary market, compared to $88.2 million at December 31, 2021. Servicing rights will continue to be retained on all
loans written and sold to the secondary market.
The
following table is a summary of our outstanding loan balances for the periods indicated:
| | |
June 30, 2022 | | |
December 31, 2021 | |
| | |
(Dollars in thousands) | |
| | |
| |
| Commercial real estate loans | |
$ | 1,074,907 | | |
$ | 979,969 | |
| | |
| | | |
| | |
| Residential real estate loans: | |
| | | |
| | |
| Residential | |
| 572,700 | | |
| 552,332 | |
| Home equity | |
| 103,623 | | |
| 99,759 | |
| Total residential real estate loans | |
| 676,323 | | |
| 652,091 | |
| | |
| | | |
| | |
| Commercial and industrial loans: | |
| | | |
| | |
| PPP loans | |
| 2,631 | | |
| 25,329 | |
| Commercial and industrial loans | |
| 215,224 | | |
| 201,340 | |
| Total commercial and industrial loans | |
| 217,855 | | |
| 226,669 | |
| Consumer loans | |
| 4,457 | | |
| 4,250 | |
| Total gross loans | |
| 1,973,542 | | |
| 1,862,979 | |
| Unamortized PPP loan fees | |
| (133 | ) | |
| (781 | ) |
| Unamortized premiums and net deferred loans fees and costs | |
| 2,291 | | |
| 2,518 | |
| Total loans | |
$ | 1,975,700 | | |
$ | 1,864,716 | |
Credit
Quality
Management
continues to remain attentive to any signs of deterioration in borrowers’ financial conditions and is proactive in taking
the appropriate steps to mitigate risk. At June 30, 2022, nonperforming loans totaled $4.1 million, or 0.21% of total loans, compared
to $5.0 million, or 0.27% of total loans, at December 31, 2021. At June 30, 2022, there were no loans 90 or more days past due
and still accruing interest. Nonperforming assets to total assets, was 0.16% at June 30, 2022, compared to 0.20% at December 31,
2021. The allowance for loan losses as a percentage of total loans was 0.99% at June 30, 2022, compared to 1.06% at December 31,
2021. At June 30, 2022, the allowance for loan losses as a percentage of nonperforming loans was 476.5%, compared to 398.6%, at
December 31, 2021.
Deposits
At
June 30, 2022, total deposits were $2.3 billion, an increase of $45.1 million, or 2.0%, from December 31, 2021, primarily due
to an increase in core deposits of $96.7 million, or 5.2%. Core deposits, which the Company defines as all deposits except time
deposits, increased from $1.9 billion, or 82.2% of total deposits, at December 31, 2021, to $2.0 billion, or 84.8% of total deposits,
at June 30, 2022. Non-interest-bearing deposits increased $6.3 million, or 1.0%, to $647.6 million, interest-bearing checking
accounts increased $8.3 million, or 5.7%, to $154.0 million, savings accounts increased $9.1 million, or 4.2%, to $226.7 million,
and money market accounts increased $72.9 million, or 8.6%, to $923.2 million. Time deposits decreased $51.6 million, or 12.8%,
from $402.0 million at December 31, 2021 to $350.4 million at June 30, 2022. The Company did not have any brokered deposits at
June 30, 2022 or December 31, 2021.
Borrowings
and Subordinated Debt
At
June 30, 2022, total borrowings increased $3.5 million, or 15.7%, from $22.3 million at December 31, 2021, to $25.8 million. Other
borrowings increased $3.5 million, or 129.6%, to $6.2 million and subordinated debt outstanding totaled $19.7 million at June
30, 2022 and $19.6 million at December 31, 2021.
Capital
At
June 30, 2022, shareholders’ equity was $215.3 million, or 8.4% of total assets, compared to $223.7 million, or 8.8% of
total assets, at December 31, 2021. The decrease in shareholders’ equity reflects $3.7 million for the repurchase of the
Company’s common stock, the payment of regular cash dividends of $2.7 million and an increase in accumulated other comprehensive
loss of $14.4 million, partially offset by net income of $10.9 million. Total shares outstanding as of June 30, 2022 were 22,465,991.
Capital
Management
The
Company’s book value per share was $9.58 at June 30, 2022 compared to $9.87 at December 31, 2021, while tangible book value
per share, a non-GAAP financial measure, decreased $0.29, or 3.1%, from $9.21 at December 31, 2021 to $8.92 at June 30, 2022.
The change in AOCI reduced the tangible book value per common share by $0.64 as of June 30, 2022, primarily due
to the impact of higher interest rates on the fair value of available-for-sale securities. Tangible book value is a non-GAAP
measure. See pages 18-21 for the related tangible book value calculation and a reconciliation of GAAP to non-GAAP financial measures.
The
Company’s regulatory capital ratios remain in compliance with regulatory “well capitalized” requirements and
internal target minimal levels. At June 30, 2022, the Company’s Tier 1 leverage, common equity tier 1 capital, and total
risk-based capital ratios were 8.9%, 11.7%, and 13.7%, respectively, and the Bank’s Tier 1 leverage, common equity tier
1 capital, and total risk-based capital ratios were 9.1%, 12.0%, and 13.0%, respectively, compared with regulatory “well
capitalized” minimums of 5.00%, 6.5%, and 10.00%, respectively.
Dividends
Although
the Company has historically paid quarterly dividends on its common stock and currently intends to continue to pay such dividends,
the Company’s ability to pay such dividends depends on a number of factors, including restrictions under federal laws and
regulations on the Company’s ability to pay dividends, and as a result, there can be no assurance that dividends will continue
to be paid in the future.
About
Western New England Bancorp, Inc.
Western
New England Bancorp, Inc. is a Massachusetts-chartered stock holding company and the parent company of Westfield Bank, CSB Colts,
Inc., Elm Street Securities Corporation, WFD Securities, Inc. and WB Real Estate Holdings, LLC. Western New England Bancorp, Inc.
and its subsidiaries are headquartered in Westfield, Massachusetts and operate 25 banking offices throughout western Massachusetts
and northern Connecticut. To learn more, visit our website at www.westfieldbank.com.
Forward-Looking
Statements
This
press release contains “forward-looking statements” within the meaning of Section 27A of the Securities Act of 1933,
as amended, and Section 21E of the Securities Exchange Act of 1934, as amended, with respect to the Company’s financial
condition, liquidity, results of operations, future performance, business, measures being taken in response to the COVID-19 pandemic
and the impact of the COVID-19 impact on the Company’s business. Forward-looking statements may be identified by the use
of such words as “believe,” “expect,” “anticipate,” “should,” “planned,”
“estimated,” and “potential.” Examples of forward-looking statements include, but are not limited
to, estimates with respect to our financial condition, results of operations and business that are subject to various factors
which could cause actual results to differ materially from these estimates. These factors include, but are not limited to:
| ● | the
duration and scope of the COVID-19 pandemic and the local, national and global impact of COVID-19; |
| ● | actions
governments, businesses and individuals take in response to the COVID-19 pandemic; |
| ● | the
speed and effectiveness of vaccine and treatment developments and their deployment, including public adoption rates of COVID-19
vaccines; |
| ● | the
emergence of new COVID-19 variants, such as the Omicron variant, and the response thereto; |
| ● | the
pace of recovery when the COVID-19 pandemic subsides; |
| ● | changes
in the interest rate environment that reduce margins; |
| ● | the
effect on our operations of governmental legislation and regulation, including changes in accounting regulation or standards,
the nature and timing of the adoption and effectiveness of new requirements under the Dodd-Frank Act Wall Street Reform and Consumer
Protection Act of 2010 (“Dodd-Frank Act”), Basel guidelines, capital requirements and other applicable laws and regulations; |
| ● | the
highly competitive industry and market area in which we operate; |
| ● | general
economic conditions, either nationally or regionally, resulting in, among other things, a deterioration in credit quality; |
| ● | changes
in business conditions and inflation; |
| ● | changes
in credit market conditions; |
| ● | the
inability to realize expected cost savings or achieve other anticipated benefits in connection with business combinations and
other acquisitions; |
| ● | changes
in the securities markets which affect investment management revenues; |
| ● | increases
in Federal Deposit Insurance Corporation deposit insurance premiums and assessments; |
| ● | changes
in technology used in the banking business; |
| ● | the
soundness of other financial services institutions which may adversely affect our credit risk; |
| ● | certain
of our intangible assets may become impaired in the future; |
| ● | our
controls and procedures may fail or be circumvented; |
| ● | new
lines of business or new products and services, which may subject us to additional risks; |
| ● | changes
in key management personnel which may adversely impact our operations; |
| ● | severe
weather, natural disasters, acts of war or terrorism and other external events which could significantly impact our business;
and |
| ● | other
factors detailed from time to time in our SEC filings. |
Although
we believe that the expectations reflected in such forward-looking statements are reasonable, actual results may differ materially
from the results discussed in these forward-looking statements. You are cautioned not to place undue reliance on these forward-looking
statements, which speak only as of the date hereof. We do not undertake any obligation to republish revised forward-looking statements
to reflect events or circumstances after the date hereof or to reflect the occurrence of unanticipated events, except to the extent
required by law.
WESTERN
NEW ENGLAND BANCORP, INC. AND SUBSIDIARIES
Consolidated
Statements of Net Income and Other Data
(Dollars
in thousands, except per share data)
(Unaudited)
| | |
Three Months Ended | | |
Six Months Ended | |
| | |
June 30, | | |
March 31, | | |
December 31, | | |
September 30, | | |
June 30, | | |
June 30, | |
| | |
2022 | | |
2022 | | |
2021 | | |
2021 | | |
2021 | | |
2022 | | |
2021 | |
| INTEREST AND DIVIDEND INCOME: | |
| | | |
| | | |
| | | |
| | | |
| | | |
| | | |
| | |
| Loans | |
$ | 18,500 | | |
$ | 17,947 | | |
$ | 18,089 | | |
$ | 18,670 | | |
$ | 18,321 | | |
$ | 36,447 | | |
$ | 37,441 | |
| Securities | |
| 2,068 | | |
| 1,950 | | |
| 1,763 | | |
| 1,500 | | |
| 1,277 | | |
| 4,018 | | |
| 2,131 | |
| Other investments | |
| 30 | | |
| 25 | | |
| 25 | | |
| 28 | | |
| 28 | | |
| 55 | | |
| 63 | |
| Short-term investments | |
| 48 | | |
| 21 | | |
| 49 | | |
| 40 | | |
| 26 | | |
| 69 | | |
| 50 | |
| Total interest and dividend income | |
| 20,646 | | |
| 19,943 | | |
| 19,926 | | |
| 20,238 | | |
| 19,652 | | |
| 40,589 | | |
| 39,685 | |
| | |
| | | |
| | | |
| | | |
| | | |
| | | |
| | | |
| | |
| INTEREST EXPENSE: | |
| | | |
| | | |
| | | |
| | | |
| | | |
| | | |
| | |
| Deposits | |
| 990 | | |
| 992 | | |
| 1,091 | | |
| 1,217 | | |
| 1,466 | | |
| 1,982 | | |
| 3.200 | |
| Short-term borrowings | |
| 10 | | |
| — | | |
| — | | |
| — | | |
| — | | |
| 10 | | |
| 458 | |
| Long-term debt | |
| — | | |
| — | | |
| — | | |
| — | | |
| 185 | | |
| — | | |
| 197 | |
| Subordinated debt | |
| 254 | | |
| 253 | | |
| 253 | | |
| 256 | | |
| 197 | | |
| 507 | | |
| — | |
| Total interest expense | |
| 1,254 | | |
| 1,245 | | |
| 1,344 | | |
| 1,473 | | |
| 1,848 | | |
| 2,499 | | |
| 3,855 | |
| | |
| | | |
| | | |
| | | |
| | | |
| | | |
| | | |
| | |
| Net interest and dividend income | |
| 19,392 | | |
| 18,698 | | |
| 18,582 | | |
| 18,765 | | |
| 17,804 | | |
| 38,090 | | |
| 35,830 | |
| | |
| | | |
| | | |
| | | |
| | | |
| | | |
| | | |
| | |
| PROVISION (CREDIT) FOR LOAN LOSSES | |
| 300 | | |
| (425 | ) | |
| 300 | | |
| (100 | ) | |
| (1,200 | ) | |
| (125 | ) | |
| (1,125 | ) |
| | |
| | | |
| | | |
| | | |
| | | |
| | | |
| | | |
| | |
| Net interest and dividend income after provision (credit) for loan losses | |
| 19,092 | | |
| 19,123 | | |
| 18,282 | | |
| 18,865 | | |
| 19,004 | | |
| 38,215 | | |
| 36,955 | |
| | |
| | | |
| | | |
| | | |
| | | |
| | | |
| | | |
| | |
| NON-INTEREST INCOME: | |
| | | |
| | | |
| | | |
| | | |
| | | |
| | | |
| | |
| Service charges and fees | |
| 2,346 | | |
| 2,174 | | |
| 2,270 | | |
| 2,132 | | |
| 2,075 | | |
| 4,520 | | |
| 3,958 | |
| Income from bank-owned life insurance | |
| 458 | | |
| 448 | | |
| 486 | | |
| 485 | | |
| 500 | | |
| 906 | | |
| 941 | |
| Bank-owned life insurance death benefits | |
| — | | |
| — | | |
| 555 | | |
| — | | |
| — | | |
| — | | |
| — | |
| (Loss) gain on sales of securities, net | |
| — | | |
| (4 | ) | |
| — | | |
| 2 | | |
| (12 | ) | |
| (4 | ) | |
| (74 | ) |
| Unrealized (loss) gain on marketable equity securities | |
| (225 | ) | |
| (276 | ) | |
| (96 | ) | |
| 11 | | |
| 6 | | |
| (501 | ) | |
| (83 | ) |
| Gain on sale of mortgages | |
| — | | |
| 2 | | |
| 289 | | |
| 665 | | |
| 242 | | |
| 2 | | |
| 469 | |
| Gain on non-marketable equity investments | |
| 141 | | |
| — | | |
| 352 | | |
| — | | |
| — | | |
| 141 | | |
| 546 | |
| Loss on interest rate swap terminations | |
| — | | |
| — | | |
| — | | |
| — | | |
| (402 | ) | |
| — | | |
| (402 | ) |
| Other income | |
| 21 | | |
| 4 | | |
| — | | |
| — | | |
| — | | |
| 25 | | |
| 58 | |
| Total non-interest income | |
| 2,741 | | |
| 2,348 | | |
| 3,856 | | |
| 3,295 | | |
| 2,409 | | |
| 5,089 | | |
| 5,413 | |
| | |
| | | |
| | | |
| | | |
| | | |
| | | |
| | | |
| | |
| NON-INTEREST EXPENSE: | |
| | | |
| | | |
| | | |
| | | |
| | | |
| | | |
| | |
| Salaries and employees benefits | |
| 8,236 | | |
| 8,239 | | |
| 8,193 | | |
| 8,175 | | |
| 7,973 | | |
| 16,475 | | |
| 15,736 | |
| Occupancy | |
| 1,177 | | |
| 1,363 | | |
| 1,144 | | |
| 1,124 | | |
| 1,099 | | |
| 2,540 | | |
| 2,388 | |
| Furniture and equipment | |
| 539 | | |
| 543 | | |
| 548 | | |
| 533 | | |
| 513 | | |
| 1,082 | | |
| 1,003 | |
| Data processing | |
| 731 | | |
| 723 | | |
| 726 | | |
| 698 | | |
| 758 | | |
| 1,454 | | |
| 1,479 | |
| Professional fees | |
| 719 | | |
| 577 | | |
| 477 | | |
| 575 | | |
| 589 | | |
| 1,296 | | |
| 1,133 | |
| FDIC insurance | |
| 234 | | |
| 286 | | |
| 202 | | |
| 273 | | |
| 225 | | |
| 520 | | |
| 523 | |
| Advertising | |
| 412 | | |
| 399 | | |
| 262 | | |
| 345 | | |
| 347 | | |
| 811 | | |
| 685 | |
| Loss on prepayment of borrowings | |
| — | | |
| — | | |
| — | | |
| — | | |
| 45 | | |
| — | | |
| 45 | |
| Other | |
| 2,385 | | |
| 2,326 | | |
| 2,371 | | |
| 2,295 | | |
| 2,125 | | |
| 4,711 | | |
| 4,009 | |
| Total non-interest expense | |
| 14,433 | | |
| 14,456 | | |
| 13,923 | | |
| 14,018 | | |
| 13,674 | | |
| 28,889 | | |
| 27,001 | |
| | |
| | | |
| | | |
| | | |
| | | |
| | | |
| | | |
| | |
| INCOME BEFORE INCOME TAXES | |
| 7,400 | | |
| 7,015 | | |
| 8,215 | | |
| 8,142 | | |
| 7,739 | | |
| 14,415 | | |
| 15,367 | |
| | |
| | | |
| | | |
| | | |
| | | |
| | | |
| | | |
| | |
| INCOME TAX PROVISION | |
| 1,865 | | |
| 1,696 | | |
| 1,995 | | |
| 2,106 | | |
| 2,087 | | |
| 3,561 | | |
| 3,924 | |
| NET INCOME | |
$ | 5,535 | | |
$ | 5,319 | | |
$ | 6,220 | | |
$ | 6,036 | | |
$ | 5,652 | | |
$ | 10,854 | | |
$ | 11,443 | |
| | |
| | | |
| | | |
| | | |
| | | |
| | | |
| | | |
| | |
| Basic earnings per share | |
$ | 0.25 | | |
$ | 0.24 | | |
$ | 0.28 | | |
$ | 0.27 | | |
$ | 0.24 | | |
$ | 0.49 | | |
$ | 0.47 | |
| Weighted average shares outstanding | |
| 21,991,383 | | |
| 22,100,076 | | |
| 22,097,968 | | |
| 22,620,387 | | |
| 23,722,903 | | |
| 22,045,052 | | |
| 24,102,416 | |
| Diluted earnings per share | |
$ | 0.25 | | |
$ | 0.24 | | |
$ | 0.28 | | |
$ | 0.27 | | |
$ | 0.24 | | |
$ | 0.49 | | |
$ | 0.47 | |
| Weighted average diluted shares outstanding | |
| 22,025,687 | | |
| 22,172,909 | | |
| 22,203,876 | | |
| 22,714,429 | | |
| 23,773,562 | | |
| 22,098,620 | | |
| 24,156,450 | |
| | |
| | | |
| | | |
| | | |
| | | |
| | | |
| | | |
| | |
| Other Data: | |
| | | |
| | | |
| | | |
| | | |
| | | |
| | | |
| | |
| Return on average assets (1) | |
| 0.87 | % | |
| 0.85 | % | |
| 0.97 | % | |
| 0.96 | % | |
| 0.92 | % | |
| 0.86 | % | |
| 0.95 | % |
| Return on average equity (1) | |
| 10.22 | % | |
| 9.65 | % | |
| 11.22 | % | |
| 10.85 | % | |
| 10.16 | % | |
| 9.93 | % | |
| 10.25 | % |
| Efficiency ratio (2) | |
| 64.96 | % | |
| 67.79 | % | |
| 64.38 | % | |
| 63.58 | % | |
| 66.09 | % | |
| 66.35 | % | |
| 65.34 | % |
| Net interest margin, on a fully tax-equivalent basis | |
| 3.26 | % | |
| 3.20 | % | |
| 3.10 | % | |
| 3.20 | % | |
| 3.08 | % | |
| 3.23 | % | |
| 3.17 | % |
| (2) | The
efficiency ratio (non-GAAP) represents the ratio of operating expenses divided by the sum of net interest and dividend income
and non-interest income, excluding realized and unrealized gains and losses on securities, bank-owned life insurance death benefits,
gain on non-marketable equity investments, loss on interest rate swap termination and loss on prepayment of borrowings. |
WESTERN
NEW ENGLAND BANCORP, INC. AND SUBSIDIARIES
Consolidated
Balance Sheets
(Dollars
in thousands)
(Unaudited)
| | |
June 30, | | |
March 31, | | |
December 31, | | |
September 30, | | |
June 30, | |
| | |
2022 | | |
2022 | | |
2021 | | |
2021 | | |
2021 | |
| Cash and cash equivalents | |
$ | 47,513 | | |
$ | 62,898 | | |
$ | 103,456 | | |
$ | 148,496 | | |
$ | 105,494 | |
| Available-for-sale securities, at fair value | |
| 160,925 | | |
| 173,910 | | |
| 194,352 | | |
| 208,030 | | |
| 231,166 | |
| Held to maturity securities, at amortized cost | |
| 233,803 | | |
| 237,575 | | |
| 222,272 | | |
| 154,403 | | |
| 107,783 | |
| Marketable equity securities, at fair value | |
| 11,453 | | |
| 11,643 | | |
| 11,896 | | |
| 11,970 | | |
| 11,936 | |
| Federal Home Loan Bank of Boston and other restricted
stock - at cost | |
| 1,882 | | |
| 2,594 | | |
| 2,594 | | |
| 2,698 | | |
| 4,036 | |
| | |
| | | |
| | | |
| | | |
| | | |
| | |
| Loans | |
| 1,975,700 | | |
| 1,926,285 | | |
| 1,864,716 | | |
| 1,846,150 | | |
| 1,876,988 | |
| Allowance for loan losses | |
| (19,560 | ) | |
| (19,308 | ) | |
| (19,787 | ) | |
| (19,837 | ) | |
| (19,870 | ) |
| Net loans | |
| 1,956,140 | | |
| 1,906,977 | | |
| 1,844,929 | | |
| 1,826,313 | | |
| 1,857,118 | |
| | |
| | | |
| | | |
| | | |
| | | |
| | |
| Bank-owned life insurance | |
| 73,801 | | |
| 73,343 | | |
| 72,895 | | |
| 74,286 | | |
| 73,801 | |
| Goodwill | |
| 12,487 | | |
| 12,487 | | |
| 12,487 | | |
| 12,487 | | |
| 12,487 | |
| Core deposit intangible | |
| 2,375 | | |
| 2,469 | | |
| 2,563 | | |
| 2,656 | | |
| 2,750 | |
| Other assets | |
| 76,978 | | |
| 71,542 | | |
| 70,981 | | |
| 69,459 | | |
| 70,035 | |
| TOTAL ASSETS | |
$ | 2,577,357 | | |
$ | 2,555,438 | | |
$ | 2,538,425 | | |
$ | 2,510,798 | | |
$ | 2,476,606 | |
| | |
| | | |
| | | |
| | | |
| | | |
| | |
| Total deposits | |
$ | 2,301,972 | | |
$ | 2,278,164 | | |
$ | 2,256,898 | | |
$ | 2,230,884 | | |
$ | 2,186,459 | |
| Short-term borrowings | |
| 4,790 | | |
| — | | |
| — | | |
| — | | |
| — | |
| Long-term debt | |
| 1,360 | | |
| 1,686 | | |
| 2,653 | | |
| 3,829 | | |
| 4,990 | |
| Subordinated debt | |
| 19,653 | | |
| 19,643 | | |
| 19,633 | | |
| 19,623 | | |
| 19,614 | |
| Securities pending settlement | |
| — | | |
| 146 | | |
| — | | |
| — | | |
| 461 | |
| Other liabilities | |
| 34,252 | | |
| 36,736 | | |
| 35,553 | | |
| 38,120 | | |
| 41,411 | |
| TOTAL LIABILITIES | |
| 2,362,027 | | |
| 2,336,375 | | |
| 2,314,737 | | |
| 2,292,456 | | |
| 2,252,935 | |
| | |
| | | |
| | | |
| | | |
| | | |
| | |
| TOTAL SHAREHOLDERS' EQUITY | |
| 215,330 | | |
| 219,063 | | |
| 223,688 | | |
| 218,342 | | |
| 223,671 | |
| TOTAL LIABILITIES AND SHAREHOLDERS' EQUITY | |
$ | 2,577,357 | | |
$ | 2,555,438 | | |
$ | 2,538,425 | | |
$ | 2,510,798 | | |
$ | 2,476,606 | |
WESTERN
NEW ENGLAND BANCORP, INC. AND SUBSIDIARIES
Other
Data
(Dollars
in thousands, except per share data)
(Unaudited)
| | |
Three Months Ended | |
| | |
June 30, | | |
March 31, | | |
December 31, | | |
September 30, | | |
June 30, | |
| | |
2022 | | |
2022 | | |
2021 | | |
2021 | | |
2021 | |
| Shares outstanding at end of period | |
| 22,465,991 | | |
| 22,742,189 | | |
| 22,656,515 | | |
| 22,848,781 | | |
| 24,070,399 | |
| | |
| | | |
| | | |
| | | |
| | | |
| | |
| Operating results: | |
| | | |
| | | |
| | | |
| | | |
| | |
| Net interest income | |
$ | 19,392 | | |
$ | 18,698 | | |
$ | 18,582 | | |
$ | 18,765 | | |
$ | 17,804 | |
| Provision (credit) for loan losses | |
| 300 | | |
| (425 | ) | |
| 300 | | |
| (100 | ) | |
| (1,200 | ) |
| Non-interest income | |
| 2,741 | | |
| 2,348 | | |
| 3,856 | | |
| 3,295 | | |
| 2,409 | |
| Non-interest expense | |
| 14,433 | | |
| 14,456 | | |
| 13,923 | | |
| 14,018 | | |
| 13,674 | |
| Income before income provision for income taxes | |
| 7,400 | | |
| 7,015 | | |
| 8,215 | | |
| 8,142 | | |
| 7,739 | |
| Income tax provision | |
| 1,865 | | |
| 1,696 | | |
| 1,995 | | |
| 2,106 | | |
| 2,087 | |
| Net income | |
| 5,535 | | |
| 5,319 | | |
| 6,220 | | |
| 6,036 | | |
| 5,652 | |
| | |
| | | |
| | | |
| | | |
| | | |
| | |
| Performance Ratios: | |
| | | |
| | | |
| | | |
| | | |
| | |
| Net interest margin, on a fully tax-equivalent basis | |
| 3.26 | % | |
| 3.20 | % | |
| 3.10 | % | |
| 3.20 | % | |
| 3.08 | % |
| Interest rate spread, on a fully tax-equivalent basis | |
| 3.17 | % | |
| 3.10 | % | |
| 2.99 | % | |
| 3.09 | % | |
| 2.94 | % |
| Return on average assets | |
| 0.87 | % | |
| 0.85 | % | |
| 0.97 | % | |
| 0.96 | % | |
| 0.92 | % |
| Return on average equity | |
| 10.22 | % | |
| 9.65 | % | |
| 11.22 | % | |
| 10.85 | % | |
| 10.16 | % |
| Efficiency ratio (non-GAAP) | |
| 64.96 | % | |
| 67.79 | % | |
| 64.38 | % | |
| 63.58 | % | |
| 66.09 | % |
| | |
| | | |
| | | |
| | | |
| | | |
| | |
| Per Common Share Data: | |
| | | |
| | | |
| | | |
| | | |
| | |
| Basic earnings per share | |
$ | 0.25 | | |
$ | 0.24 | | |
$ | 0.28 | | |
$ | 0.27 | | |
$ | 0.24 | |
| Per diluted share | |
| 0.25 | | |
| 0.24 | | |
| 0.28 | | |
| 0.27 | | |
| 0.24 | |
| Cash dividend declared | |
| 0.06 | | |
| 0.06 | | |
| 0.05 | | |
| 0.05 | | |
| 0.05 | |
| Book value per share | |
| 9.58 | | |
| 9.63 | | |
| 9.87 | | |
| 9.56 | | |
| 9.29 | |
| Tangible book value per share (non-GAAP) | |
| 8.92 | | |
| 8.97 | | |
| 9.21 | | |
| 8.89 | | |
| 8.66 | |
| | |
| | | |
| | | |
| | | |
| | | |
| | |
| Asset Quality: | |
| | | |
| | | |
| | | |
| | | |
| | |
| 30-89 day delinquent loans | |
$ | 1,063 | | |
$ | 1,407 | | |
$ | 1,102 | | |
$ | 1,619 | | |
$ | 2,607 | |
| 90 days or more delinquent loans | |
| 1,149 | | |
| 1,401 | | |
| 1,039 | | |
| 1,446 | | |
| 1,808 | |
| Total delinquent loans | |
| 2,212 | | |
| 2,808 | | |
| 2,141 | | |
| 3,065 | | |
| 4,415 | |
| Total delinquent loans as a percentage of total loans | |
| 0.11 | % | |
| 0.15 | % | |
| 0.11 | % | |
| 0.17 | % | |
| 0.24 | % |
| Total delinquent loans as a percentage of total loans, excluding PPP | |
| 0.11 | % | |
| 0.15 | % | |
| 0.12 | % | |
| 0.17 | % | |
| 0.25 | % |
| Nonperforming loans | |
$ | 4,105 | | |
$ | 3,988 | | |
$ | 4,964 | | |
$ | 5,632 | | |
$ | 5,989 | |
| Nonperforming loans as a percentage of total loans | |
| 0.21 | % | |
| 0.21 | % | |
| 0.27 | % | |
| 0.31 | % | |
| 0.32 | % |
| Nonperforming loans as a percentage of total loans, excluding PPP | |
| 0.21 | % | |
| 0.21 | % | |
| 0.27 | % | |
| 0.32 | % | |
| 0.34 | % |
| Nonperforming assets as a percentage of total assets | |
| 0.16 | % | |
| 0.16 | % | |
| 0.20 | % | |
| 0.22 | % | |
| 0.24 | % |
| Nonperforming assets as a percentage of total assets, excluding PPP | |
| 0.16 | % | |
| 0.16 | % | |
| 0.20 | % | |
| 0.23 | % | |
| 0.25 | % |
| Allowance for loan losses as a percentage of nonperforming loans | |
| 476.49 | % | |
| 484.15 | % | |
| 398.61 | % | |
| 352.22 | % | |
| 331.77 | % |
| Allowance for loan losses as a percentage of total loans | |
| 0.99 | % | |
| 1.00 | % | |
| 1.06 | % | |
| 1.07 | % | |
| 1.06 | % |
| Allowance for loan losses as a percentage of total loans, excluding PPP | |
| 0.99 | % | |
| 1.01 | % | |
| 1.08 | % | |
| 1.11 | % | |
| 1.12 | % |
| Net loan charge-offs (recoveries) | |
$ | 48 | | |
$ | 54 | | |
$ | 350 | | |
$ | (67 | ) | |
$ | 157 | |
| Net loan charge-offs as a percentage of average assets | |
| 0.00 | % | |
| 0.00 | % | |
| 0.01 | % | |
| 0.00 | % | |
| 0.01 | % |
The
following tables set forth the information relating to our average balances and net interest income for the three months ended
June 30, 2022, December 31, 2021, and June 30, 2021 and reflect the average yield on interest-earning assets and average cost
of interest-bearing liabilities for the periods indicated.
| | |
Three
Months Ended | |
| | |
June
30, 2022 | | |
December
31, 2021 | | |
June
30, 2021 | |
| | |
Average | | |
| | |
Average Yield/ | | |
Average | | |
| | |
Average Yield/ | | |
Average | | |
| | |
Average Yield/ | |
| | |
Balance | | |
Interest(8) | | |
Cost(9) | | |
Balance | | |
Interest(8) | | |
Cost(9) | | |
Balance | | |
Interest(8) | | |
Cost(9) | |
| | |
(Dollars in thousands) | |
| ASSETS: | |
| | |
| | |
| | |
| | |
| | |
| | |
| | |
| | |
| |
| Interest-earning assets | |
| | |
| | |
| | |
| | |
| | |
| | |
| | |
| | |
| |
| Loans(1)(2) | |
$ | 1,949,464 | | |
$ | 18,624 | | |
| 3.83 | % | |
$ | 1,850,162 | | |
$ | 18,197 | | |
| 3.90 | % | |
$ | 1,911,323 | | |
$ | 18,425 | | |
| 3.87 | % |
| Securities(2) | |
| 414,226 | | |
| 2,068 | | |
| 2.00 | | |
| 401,811 | | |
| 1,764 | | |
| 1.74 | | |
| 293,991 | | |
| 1,278 | | |
| 1.74 | |
| Other investments | |
| 9,892 | | |
| 30 | | |
| 1.22 | | |
| 10,654 | | |
| 25 | | |
| 0.93 | | |
| 10,114 | | |
| 28 | | |
| 1.11 | |
| Short-term investments(3) | |
| 24,944 | | |
| 48 | | |
| 0.77 | | |
| 131,770 | | |
| 49 | | |
| 0.15 | | |
| 114,883 | | |
| 26 | | |
| 0.09 | |
| Total
interest-earning assets | |
| 2,398,526 | | |
| 20,770 | | |
| 3.47 | | |
| 2,394,397 | | |
| 20,035 | | |
| 3.32 | | |
| 2,330,311 | | |
| 19,757 | | |
| 3.40 | |
| Total
non-interest-earning assets | |
| 153,939 | | |
| | | |
| | | |
| 149,151 | | |
| | | |
| | | |
| 147,545 | | |
| | | |
| | |
| Total
assets | |
$ | 2,552,465 | | |
| | | |
| | | |
$ | 2,543,548 | | |
| | | |
| | | |
$ | 2,477,856 | | |
| | | |
| | |
| | |
| | | |
| | | |
| | | |
| | | |
| | | |
| | | |
| | | |
| | | |
| | |
| LIABILITIES AND EQUITY: | |
| | | |
| | | |
| | | |
| | | |
| | | |
| | | |
| | | |
| | | |
| | |
| Interest-bearing liabilities | |
| | | |
| | | |
| | | |
| | | |
| | | |
| | | |
| | | |
| | | |
| | |
| Interest-bearing checking accounts | |
$ | 137,984 | | |
| 105 | | |
| 0.31 | % | |
$ | 132,028 | | |
| 106 | | |
| 0.32 | % | |
$ | 100,455 | | |
| 92 | | |
| 0.37 | % |
| Savings accounts | |
| 224,487 | | |
| 48 | | |
| 0.09 | | |
| 214,961 | | |
| 36 | | |
| 0.07 | | |
| 206,302 | | |
| 47 | | |
| 0.09 | |
| Money market accounts | |
| 910,801 | | |
| 549 | | |
| 0.24 | | |
| 849,023 | | |
| 546 | | |
| 0.26 | | |
| 766,378 | | |
| 650 | | |
| 0.34 | |
| Time deposit accounts | |
| 365,383 | | |
| 288 | | |
| 0.32 | | |
| 410,149 | | |
| 403 | | |
| 0.39 | | |
| 487,712 | | |
| 677 | | |
| 0.56 | |
| Total interest-bearing deposits | |
| 1,638,655 | | |
| 990 | | |
| 0.24 | | |
| 1,606,161 | | |
| 1,091 | | |
| 0.27 | | |
| 1,560,847 | | |
| 1,466 | | |
| 0.38 | |
| Short-term borrowings
and long-term debt | |
| 25,829 | | |
| 264 | | |
| 4.10 | | |
| 22,614 | | |
| 253 | | |
| 4.44 | | |
| 54,459 | | |
| 382 | | |
| 2.81 | |
| Total
interest-bearing liabilities | |
| 1,664,484 | | |
| 1,254 | | |
| 0.30 | | |
| 1,628,775 | | |
| 1,344 | | |
| 0.33 | | |
| 1,615,306 | | |
| 1,848 | | |
| 0.46 | |
| Non-interest-bearing deposits | |
| 635,678 | | |
| | | |
| | | |
| 654,334 | | |
| | | |
| | | |
| 603,270 | | |
| | | |
| | |
| Other non-interest-bearing
liabilities | |
| 35,076 | | |
| | | |
| | | |
| 40,428 | | |
| | | |
| | | |
| 36,043 | | |
| | | |
| | |
| Total
non-interest-bearing liabilities | |
| 670,754 | | |
| | | |
| | | |
| 694,762 | | |
| | | |
| | | |
| 639,313 | | |
| | | |
| | |
| Total liabilities | |
| 2,335,238 | | |
| | | |
| | | |
| 2,323,537 | | |
| | | |
| | | |
| 2,254,619 | | |
| | | |
| | |
| Total
equity | |
| 217,227 | | |
| | | |
| | | |
| 220,011 | | |
| | | |
| | | |
| 223,237 | | |
| | | |
| | |
| Total
liabilities and equity | |
$ | 2,552,465 | | |
| | | |
| | | |
$ | 2,543,548 | | |
| | | |
| | | |
$ | 2,477,856 | | |
| | | |
| | |
| Less: Tax-equivalent adjustment
(2) | |
| | | |
| (124 | ) | |
| | | |
| | | |
| (109 | ) | |
| | | |
| | | |
| (105 | ) | |
| | |
| Net interest and dividend
income | |
| | | |
$ | 19,392 | | |
| | | |
| | | |
$ | 18,582 | | |
| | | |
| | | |
$ | 17,804 | | |
| | |
| Net interest rate spread (4) | |
| | | |
| | | |
| 3.15 | % | |
| | | |
| | | |
| 2.97 | % | |
| | | |
| | | |
| 2.92 | % |
| Net interest rate spread, on a tax-equivalent
basis (5) | |
| | | |
| | | |
| 3.17 | % | |
| | | |
| | | |
| 2.99 | % | |
| | | |
| | | |
| 2.94 | % |
| Net interest margin (6) | |
| | | |
| | | |
| 3.24 | % | |
| | | |
| | | |
| 3.08 | % | |
| | | |
| | | |
| 3.06 | % |
| Net interest margin, on a tax-equivalent basis
(7) | |
| | | |
| | | |
| 3.26 | % | |
| | | |
| | | |
| 3.10 | % | |
| | | |
| | | |
| 3.08 | % |
| Ratio of average
interest-earning assets to average interest-bearing liabilities | |
| | | |
| | | |
| 144.10 | % | |
| | | |
| | | |
| 147.01 | % | |
| | | |
| | | |
| 144.26 | % |
The
following tables set forth the information relating to our average balances and net interest income for the six months ended June
30, 2022 and 2021 and reflect the average yield on interest-earning assets and average cost of interest-bearing liabilities for
the periods indicated.
| | |
Six
Months Ended June 30, | |
| | |
2022 | | |
2021 | |
| | |
Average
Balance | | |
Interest
(8) | | |
Average
Yield/
Cost(9) | | |
Average
Balance | | |
Interest
(8) | | |
Average
Yield/
Cost(9) | |
| | |
(Dollars in thousands) | |
| ASSETS: | |
| | |
| | |
| | |
| | |
| | |
| |
| Interest-earning assets | |
| | | |
| | | |
| | | |
| | | |
| | | |
| | |
| Loans(1)(2) | |
$ | 1,922,318 | | |
$ | 36,690 | | |
| 3.85 | % | |
$ | 1,917,366 | | |
$ | 37,648 | | |
| 3.96 | % |
| Securities(2) | |
| 418,806 | | |
| 4,019 | | |
| 1.94 | | |
| 260,845 | | |
| 2,131 | | |
| 1.65 | |
| Other investments | |
| 10,241 | | |
| 55 | | |
| 1.08 | | |
| 9,889 | | |
| 63 | | |
| 1.28 | |
| Short-term investments(3) | |
| 40,899 | | |
| 69 | | |
| 0.34 | | |
| 104,999 | | |
| 50 | | |
| 0.10 | |
| Total
interest-earning assets | |
| 2,392,264 | | |
| 40,833 | | |
| 3.44 | | |
| 2,293,099 | | |
| 39,892 | | |
| 3.51 | |
| Total
non-interest-earning assets | |
| 148,815 | | |
| | | |
| | | |
| 146,709 | | |
| | | |
| | |
| Total
assets | |
$ | 2,541,079 | | |
| | | |
| | | |
$ | 2,439,808 | | |
| | | |
| | |
| | |
| | | |
| | | |
| | | |
| | | |
| | | |
| | |
| LIABILITIES AND EQUITY: | |
| | | |
| | | |
| | | |
| | | |
| | | |
| | |
| Interest-bearing liabilities | |
| | | |
| | | |
| | | |
| | | |
| | | |
| | |
| Interest-bearing checking accounts | |
$ | 135,104 | | |
| 200 | | |
| 0.30 | % | |
$ | 95,507 | | |
| 198 | | |
| 0.42 | % |
| Savings accounts | |
| 221,484 | | |
| 83 | | |
| 0.08 | | |
| 196,812 | | |
| 83 | | |
| 0.09 | |
| Money market accounts | |
| 894,687 | | |
| 1,070 | | |
| 0.24 | | |
| 721,270 | | |
| 1,303 | | |
| 0.36 | |
| Time deposit accounts | |
| 377,158 | | |
| 629 | | |
| 0.34 | | |
| 527,188 | | |
| 1,616 | | |
| 0.62 | |
| Total interest-bearing deposits | |
| 1,628,433 | | |
| 1,982 | | |
| 0.25 | | |
| 1,540,777 | | |
| 3,200 | | |
| 0.42 | |
| Short-term borrowings
and long-term debt | |
| 24,164 | | |
| 517 | | |
| 4.31 | | |
| 53,569 | | |
| 655 | | |
| 2.47 | |
| Total
interest-bearing liabilities | |
| 1,652,597 | | |
| 2,499 | | |
| 0.30 | | |
| 1,594,346 | | |
| 3,855 | | |
| 0.49 | |
| Non-interest-bearing deposits | |
| 634,387 | | |
| | | |
| | | |
| 582,541 | | |
| | | |
| | |
| Other non-interest-bearing
liabilities | |
| 33,721 | | |
| | | |
| | | |
| 37,829 | | |
| | | |
| | |
| Total
non-interest-bearing liabilities | |
| 668,108 | | |
| | | |
| | | |
| 620,370 | | |
| | | |
| | |
| | |
| | | |
| | | |
| | | |
| | | |
| | | |
| | |
| Total liabilities | |
| 2,320,705 | | |
| | | |
| | | |
| 2,214,716 | | |
| | | |
| | |
| Total
equity | |
| 220,374 | | |
| | | |
| | | |
| 225,092 | | |
| | | |
| | |
| Total
liabilities and equity | |
$ | 2,541,079 | | |
| | | |
| | | |
$ | 2,439,808 | | |
| | | |
| | |
| Less: Tax-equivalent adjustment
(2) | |
| | | |
| (244 | ) | |
| | | |
| | | |
| (207 | ) | |
| | |
| Net interest and dividend
income | |
| | | |
$ | 38,090 | | |
| | | |
| | | |
$ | 35,830 | | |
| | |
| Net interest rate spread (4) | |
| | | |
| | | |
| 3.12 | % | |
| | | |
| | | |
| 3.00 | % |
| Net interest rate spread, on a tax-equivalent
basis (5) | |
| | | |
| | | |
| 3.14 | % | |
| | | |
| | | |
| 3.02 | % |
| Net interest margin (6) | |
| | | |
| | | |
| 3.21 | % | |
| | | |
| | | |
| 3.15 | % |
| Net interest margin, on a tax-equivalent basis
(7) | |
| | | |
| | | |
| 3.23 | % | |
| | | |
| | | |
| 3.17 | % |
Ratio
of average interest-earning
assets to average interest-bearing liabilities | |
| | | |
| | | |
| 144.76 | % | |
| | | |
| | | |
| 143.83 | % |
| (1) | Loans,
including nonaccrual loans, are net of deferred loan origination costs and unadvanced
funds. |
| (2) | Loan
and securities income are presented on a tax-equivalent basis using a tax rate of 21%.
The tax-equivalent adjustment is deducted from tax-equivalent net interest and dividend
income to agree to the amount reported on the consolidated statements of net income. |
| (3) | Short-term
investments include federal funds sold. |
| (4) | Net
interest rate spread represents the difference between the weighted average yield on
interest-earning assets and the weighted average cost of interest-bearing liabilities. |
| (5) | Net
interest rate spread, on a tax-equivalent basis, represents the difference between the
tax-equivalent weighted average yield on interest-earning assets and the tax-equivalent
weighted average cost of interest-bearing liabilities. |
| (6) | Net
interest margin represents net interest and dividend income as a percentage of average
interest-earning assets. |
| (7) | Net
interest margin, on a tax-equivalent basis, represents tax-equivalent net interest and
dividend income as a percentage of average interest-earning assets. |
| (8) | Acquired
loans, time deposits and borrowings are recorded at fair value at the time of acquisition.
The fair value marks on the loans, time deposits and borrowings acquired accrete and
amortize into net interest income over time. For the three months ended June 30, 2022,
December 31, 2021 and June 30, 2021, the loan accretion income and interest expense reduction
on time deposits and borrowings increased (decreased) net interest income $64,000, ($31,000)
and $(33,000), respectively, and for the six months ended June 30, 2022 and June 30,
2021, the loan accretion income and interest expense reduction on time deposits and borrowings
increased (decreased) net interest income $103,000 and $(78,000), respectively. Excluding
these items, net interest margin, on a tax-equivalent basis, for the three months ended
June 30, 2022, December 31, 2021 and June 30, 2021 was 3.25%, 3.10% and 3.09%, respectively,
and the net interest margin, on a tax-equivalent basis, for the six months ended June
30, 2022 and June 30, 2021 was 3.22% and 3.18%, respectively. |
Reconciliation
of Non-GAAP to GAAP Financial Measures
The
Company believes that certain non-GAAP financial measures provide information to investors that is useful in understanding its
financial condition. Because not all companies use the same calculation, this presentation may not be comparable to other
similarly titled measures calculated by other companies. A reconciliation of these non-GAAP financial measures is provided
below.
| | |
For the quarter ended | |
| | |
6/30/2022 | | |
3/31/2022 | | |
12/31/2021 | | |
9/30/2021 | | |
6/30/2021 | |
| | |
| | |
| | |
(In thousands) | | |
| | |
| |
| | |
| | |
| | |
| | |
| | |
| |
| Loans (no tax adjustment) | |
$ | 18,500 | | |
$ | 17,947 | | |
$ | 18,089 | | |
$ | 18,670 | | |
$ | 18,321 | |
| Tax-equivalent adjustment | |
| 124 | | |
| 120 | | |
| 108 | | |
| 106 | | |
| 104 | |
| Loans (tax-equivalent basis) | |
$ | 18,624 | | |
$ | 18,067 | | |
$ | 18,197 | | |
$ | 18,776 | | |
$ | 18,425 | |
| | |
| | | |
| | | |
| | | |
| | | |
| | |
| Securities (no tax adjustment) | |
$ | 2,068 | | |
$ | 1,950 | | |
$ | 1,763 | | |
$ | 1,500 | | |
$ | 1,277 | |
| Tax-equivalent adjustment | |
| — | | |
| — | | |
| 1 | | |
| 1 | | |
| 1 | |
| Securities (tax-equivalent basis) | |
$ | 2,068 | | |
$ | 1,950 | | |
$ | 1,764 | | |
$ | 1,501 | | |
$ | 1,278 | |
| | |
| | | |
| | | |
| | | |
| | | |
| | |
| Net interest income (no tax adjustment) | |
$ | 19,392 | | |
$ | 18,698 | | |
$ | 18,582 | | |
$ | 18,765 | | |
$ | 17,804 | |
| Tax equivalent adjustment | |
| 124 | | |
| 120 | | |
| 109 | | |
| 107 | | |
| 105 | |
| Net interest income (tax-equivalent basis) | |
$ | 19,516 | | |
$ | 18,818 | | |
$ | 18,691 | | |
$ | 18,872 | | |
$ | 17,909 | |
| | |
| | | |
| | | |
| | | |
| | | |
| | |
| Net interest income (no tax adjustment) | |
$ | 19,392 | | |
$ | 18,698 | | |
$ | 18,582 | | |
$ | 18,765 | | |
$ | 17,804 | |
| Less: | |
| | | |
| | | |
| | | |
| | | |
| | |
| Purchase accounting adjustments | |
| 64 | | |
| 39 | | |
| (31 | ) | |
| 56 | | |
| (33 | ) |
| Prepayment penalties and fees | |
| 26 | | |
| 21 | | |
| 21 | | |
| 8 | | |
| 117 | |
| PPP fee income | |
| 129 | | |
| 562 | | |
| 973 | | |
| 1,757 | | |
| 1,627 | |
| Adjusted net interest income (non-GAAP) | |
$ | 19,173 | | |
$ | 18,076 | | |
$ | 17,619 | | |
$ | 16,944 | | |
$ | 16,093 | |
| | |
| | | |
| | | |
| | | |
| | | |
| | |
| Average interest-earning assets | |
$ | 2,398,526 | | |
$ | 2,385,932 | | |
$ | 2,394,397 | | |
$ | 2,337,717 | | |
$ | 2,330,311 | |
| | |
| | | |
| | | |
| | | |
| | | |
| | |
| Average interest-earnings asset, excluding average PPP loans | |
$ | 2,395,463 | | |
$ | 2,370,852 | | |
$ | 2,352,858 | | |
$ | 2,257,346 | | |
$ | 2,174,716 | |
| Net interest margin (no tax adjustment) | |
| 3.24 | % | |
| 3.18 | % | |
| 3.08 | % | |
| 3.18 | % | |
| 3.06 | % |
| Net interest margin, tax-equivalent | |
| 3.26 | % | |
| 3.20 | % | |
| 3.10 | % | |
| 3.20 | % | |
| 3.08 | % |
| Adjusted net interest margin, excluding purchase accounting adjustments, PPP fee income and prepayment penalties (non-GAAP) | |
| 3.21 | % | |
| 3.10 | % | |
| 2.97 | % | |
| 2.98 | % | |
| 2.97 | % |
| | |
For the quarter ended | |
| | |
6/30/2022 | | |
3/31/2022 | | |
12/31/2021 | | |
9/30/2021 | | |
6/30/2021 | |
| | |
| | |
| | |
(In thousands) | | |
| | |
| |
| | |
| | |
| | |
| | |
| | |
| |
| Book Value per Share (GAAP) | |
$ | 9.58 | | |
$ | 9.63 | | |
$ | 9.87 | | |
$ | 9.56 | | |
$ | 9.29 | |
| Non-GAAP adjustments: | |
| | | |
| | | |
| | | |
| | | |
| | |
| Goodwill | |
| (0.55 | ) | |
| (0.55 | ) | |
| (0.55 | ) | |
| (0.55 | ) | |
| (0.52 | ) |
| Core deposit intangible | |
| (0.11 | ) | |
| (0.11 | ) | |
| (0.11 | ) | |
| (0.12 | ) | |
| (0.11 | ) |
| Tangible Book Value per Share (non-GAAP) | |
$ | 8.92 | | |
$ | 8.97 | | |
$ | 9.21 | | |
$ | 8.89 | | |
$ | 8.66 | |
| | |
| | | |
| | | |
| | | |
| | | |
| | |
| Income Before Income Taxes (GAAP) | |
$ | 7,400 | | |
$ | 7,015 | | |
$ | 8,215 | | |
$ | 8,142 | | |
$ | 7,739 | |
| |
| | | |
| | | |
| | | |
| | | |
| | |
| Provision (credit) for loan losses | |
| 300 | | |
| (425 | ) | |
| 300 | | |
| (100 | ) | |
| (1,200 | ) |
| Income Before Taxes and Provision (non-GAAP) | |
$ | 7,700 | | |
$ | 6,590 | | |
$ | 8,515 | | |
$ | 8,042 | | |
$ | 6,539 | |
| | |
| | | |
| | | |
| | | |
| | | |
| | |
| Efficiency Ratio: | |
| | | |
| | | |
| | | |
| | | |
| | |
| Non-interest Expense (GAAP) | |
$ | 14,433 | | |
$ | 14,456 | | |
$ | 13,923 | | |
$ | 14,018 | | |
$ | 13,674 | |
| Non-GAAP adjustments: | |
| | | |
| | | |
| | | |
| | | |
| | |
| Loss on prepayment of borrowings | |
| — | | |
| — | | |
| — | | |
| — | | |
| (45 | ) |
| Non-interest Expense for Efficiency Ratio (non-GAAP) | |
$ | 14,433 | | |
$ | 14,456 | | |
$ | 13,923 | | |
$ | 14,018 | | |
$ | 13,629 | |
| | |
| | | |
| | | |
| | | |
| | | |
| | |
| Net Interest Income (GAAP) | |
$ | 19,392 | | |
$ | 18,698 | | |
$ | 18,582 | | |
$ | 18,765 | | |
$ | 17,804 | |
| | |
| | | |
| | | |
| | | |
| | | |
| | |
| Non-interest Income (GAAP) | |
$ | 2,741 | | |
$ | 2,348 | | |
$ | 3,856 | | |
$ | 3,295 | | |
$ | 2,409 | |
| Non-GAAP adjustments: | |
| | | |
| | | |
| | | |
| | | |
| | |
| Bank-owned life insurance death benefit | |
| — | | |
| — | | |
| (555 | ) | |
| — | | |
| — | |
| Loss (gain) on securities, net | |
| — | | |
| 4 | | |
| — | | |
| (2 | ) | |
| 12 | |
| Unrealized losses (gains) on marketable equity securities | |
| 225 | | |
| 276 | | |
| 96 | | |
| (11 | ) | |
| (6 | ) |
| Loss on interest rate swap termination | |
| — | | |
| — | | |
| — | | |
| — | | |
| 402 | |
| Gain on non-marketable equity investments | |
| (141 | ) | |
| — | | |
| (352 | ) | |
| — | | |
| — | |
| Non-interest Income for Efficiency Ratio (non-GAAP)_ | |
$ | 2,825 | | |
$ | 2,628 | | |
$ | 3,045 | | |
$ | 3,282 | | |
$ | 2,817 | |
| Total Revenue for Efficiency Ratio (non-GAAP) | |
$ | 22,217 | | |
$ | 21,326 | | |
$ | 21,627 | | |
$ | 22,047 | | |
$ | 20,621 | |
| | |
| | | |
| | | |
| | | |
| | | |
| | |
| Efficiency Ratio (GAAP) | |
| 65.21 | % | |
| 68.69 | % | |
| 62.05 | % | |
| 63.54 | % | |
| 67.65 | % |
| | |
| | | |
| | | |
| | | |
| | | |
| | |
| Efficiency Ratio (Non-interest Expense for Efficiency Ratio (non-GAAP)/Total Revenue for Efficiency Ratio (non-GAAP)) | |
| 64.96 | % | |
| 67.79 | % | |
| 64.38 | % | |
| 63.58 | % | |
| 66.09 | % |
| | |
For the six months ended | |
| | |
6/30/2022 | | |
6/30/2021 | |
| | |
(In thousands) | |
| | |
| | |
| |
| Loans (no tax adjustment) | |
$ | 36,447 | | |
$ | 37,441 | |
| Tax-equivalent adjustment | |
| 244 | | |
| 207 | |
| Loans (tax-equivalent basis) | |
$ | 36,691 | | |
$ | 37,648 | |
| | |
| | | |
| | |
| Securities (no tax adjustment) | |
$ | 4,018 | | |
$ | 2,131 | |
| Tax-equivalent adjustment | |
| — | | |
| — | |
| Securities (tax-equivalent basis) | |
$ | 4,018 | | |
$ | 2,131 | |
| | |
| | | |
| | |
| Net interest income (no tax adjustment) | |
$ | 38,090 | | |
$ | 35,830 | |
| Tax equivalent adjustment | |
| 244 | | |
| 207 | |
| | |
| | | |
| | |
| Net interest income (tax-equivalent basis) | |
$ | 38,334 | | |
$ | 36,037 | |
| | |
| | | |
| | |
| Net interest income (no tax adjustment) | |
$ | 38,090 | | |
$ | 35,830 | |
| Less: | |
| | | |
| | |
| Purchase accounting adjustments | |
| 103 | | |
| (78 | ) |
| Prepayment penalties and fees | |
| 48 | | |
| 152 | |
| PPP fee income | |
| 691 | | |
| 4,038 | |
| | |
| | | |
| | |
| Adjusted net interest income (non-GAAP) | |
$ | 37,248 | | |
$ | 31,718 | |
| | |
| | | |
| | |
| Average interest-earning assets | |
$ | 2,392,264 | | |
$ | 2,293,099 | |
| | |
| | | |
| | |
| Average interest-earnings asset, excluding average PPP loans | |
$ | 2,383,226 | | |
$ | 2,132,050 | |
| Net interest margin (no tax adjustment) | |
| 3.21 | % | |
| 3.15 | % |
| Net interest margin, tax-equivalent | |
| 3.23 | % | |
| 3.17 | % |
| Adjusted net interest margin, excluding purchase accounting adjustments, PPP fee income and prepayment penalties (non-GAAP) | |
| 3.16 | % | |
| 2.99 | % |
| | |
For the six months ended | |
| | |
6/30/2022 | | |
6/30/2021 | |
| | |
(In thousands) | |
| | |
| | |
| |
| Book Value per Share (GAAP) | |
$ | 9.58 | | |
$ | 9.29 | |
| Non-GAAP adjustments: | |
| | | |
| | |
| Goodwill | |
| (0.55 | ) | |
| (0.52 | ) |
| Core deposit intangible | |
| (0.11 | ) | |
| (0.11 | ) |
| Tangible Book Value per Share (non-GAAP) | |
$ | 8.92 | | |
$ | 8.66 | |
| | |
| | | |
| | |
| Income Before Income Taxes (GAAP) | |
$ | 14,415 | | |
$ | 15,367 | |
| |
| | | |
| | |
| (Credit) provision for loan losses | |
| (125 | ) | |
| (1,125 | ) |
| Income Before Taxes and Provision (non-GAAP) | |
$ | 14,290 | | |
$ | 14,242 | |
| | |
| | | |
| | |
| Efficiency Ratio: | |
| | | |
| | |
| |
| | | |
| | |
| Non-interest Expense (GAAP) | |
$ | 28,889 | | |
$ | 27,001 | |
| Non-GAAP adjustments: | |
| | | |
| | |
| Loss on prepayment of borrowings | |
| — | | |
| (45 | ) |
| Non-interest Expense for Efficiency Ratio (non-GAAP) | |
$ | 28,889 | | |
$ | 26,956 | |
| | |
| | | |
| | |
| Net Interest Income (GAAP) | |
$ | 38,090 | | |
$ | 35,830 | |
| | |
| | | |
| | |
| Non-interest Income (GAAP) | |
$ | 5,089 | | |
$ | 5,413 | |
| Non-GAAP adjustments: | |
| | | |
| | |
| Loss on securities, net | |
| 4 | | |
| 74 | |
| Unrealized losses on marketable equity securities | |
| 501 | | |
| 83 | |
| Loss on interest rate swap termination | |
| — | | |
| 402 | |
| Gain on non-marketable equity investments | |
| (141 | ) | |
| (546 | ) |
| Non-interest Income for Efficiency Ratio (non-GAAP)_ | |
$ | 5,453 | | |
$ | 5,426 | |
| | |
| | | |
| | |
| Total Revenue for Efficiency Ratio (non-GAAP) | |
$ | 43,543 | | |
$ | 41,256 | |
| | |
| | | |
| | |
| Efficiency Ratio (GAAP) | |
| 66.91 | % | |
| 65.47 | % |
| | |
| | | |
| | |
| Efficiency Ratio (Non-interest Expense for Efficiency Ratio (non-GAAP)/Total Revenue for Efficiency Ratio (non-GAAP)) | |
| 66.35 | % | |
| 65.34 | % |
Western New England Bancorp, Inc. 8-K
Exhibit 99.2

Local banking is better than ever. INVESTOR PRESENTATION SECOND QUARTER 2022
FORWARD - LOOKING STATEMENTS 2 We may, from time to time, make written or oral “forward - looking statements” within the meaning of the Private Securities Litigation Reform Act of 1995 , including statements contained in our filings with the Securities and Exchange Commission (the “SEC”), our reports to shareholders and in other communications by us . This presentation contains “forward - looking statements” with respect to the Company’s financial condition, liquidity, results of operations, future performance, business, measures being taken in response to the coronavirus disease 2019 (“COVID - 19 ”) pandemic and the impact of COVID - 19 on the Company’s business . Forward - looking statements may be identified by the use of such words as “believe,” “expect,” “anticipate,” “should,” “planned,” “estimated,” and “potential . ” Examples of forward - looking statements include, but are not limited to, estimates with respect to our financial condition, results of operations and business that are subject to various factors which could cause actual results to differ materially from these estimates . These factors include, but are not limited to : • the duration and scope of the COVID - 19 pandemic and the local, national and global impact of COVID - 19; • actions governments, businesses and individuals take in response to the COVID - 19 pandemic ; • the speed and effectiveness of COVID - 19 vaccine and treatment developments and their deployment, including public adoption rates of COVID - 19 vaccines; • the emergence of new COVID - 19 variants, such as the Omicron variant, and the response thereto; • the pace of recovery when the COVID - 19 pandemic subsides; • changes in the interest rate environment that reduce margins; • the effect on our operations of governmental legislation and regulation, including changes in accounting regulation or standa rds , the nature and timing of the adoption and effectiveness of new requirements under the Dodd - Frank Act Wall Street Reform and Consumer Protection Act of 2010 ( “Dodd - Frank Act”), Basel guidelines, capital requirements and other applicable laws and regulations; • the highly competitive industry and market area in which we operate; • general economic conditions, either nationally or regionally, resulting in, among other things, a deterioration in credit qua lit y; • changes in business conditions and inflation; • changes in credit market conditions; • the inability to realize expected cost savings or achieve other anticipated benefits in connection with business combinations an d other acquisitions; • changes in the securities markets which affect investment management revenues; • increases in Federal Deposit Insurance Corporation deposit insurance premiums and assessments; • changes in technology used in the banking business; • the soundness of other financial services institutions which may adversely affect our credit risk; • certain of our intangible assets may become impaired in the future; • our controls and procedures may fail or be circumvented; • new lines of business or new products and services, which may subject us to additional risks; • changes in key management personnel which may adversely impact our operations; • severe weather, natural disasters, acts of war or terrorism and other external events which could significantly impact our bu sin ess; and • other factors detailed from time to time in our SEC filings . Although we believe that the expectations reflected in such forward - looking statements are reasonable, actual results may differ materially from the results discussed in these forward - looking statements . You are cautioned not to place undue reliance on these forward - looking statements, which speak only as of the date hereof . We do not undertake any obligation to republish revised forward - looking statements to reflect events or circumstances after the date hereof or to reflect the occurrence of unanticipated events, except to the extent required by law .
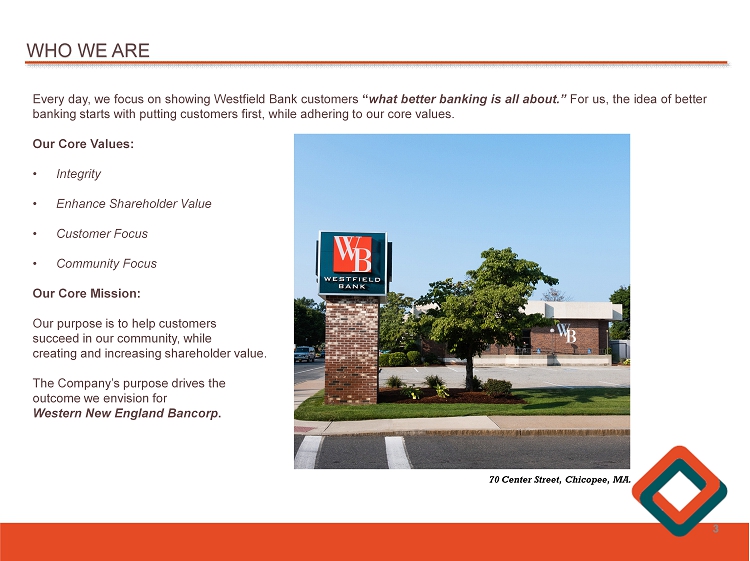
WHO WE ARE Every day, we focus on showing Westfield Bank customers “ what better banking is all about . ” For us, the idea of better banking starts with putting customers first, while adhering to our core values . Our Core Values : • Integrity • Enhance Shareholder Value • Customer Focus • Community Focus Our Core Mission : Our purpose is to help customers succeed in our community, while creating and increasing shareholder value . The Company’s purpose drives the outcome we envision for Western New England Bancorp . 3 70 Center Street, Chicopee, MA.

SENIOR MANAGEMENT TEAM James C . Hagan, President & Chief Executive Officer Guida R . Sajdak, Executive Vice President, Chief Financial Officer & Treasurer Allen J . Miles III, Executive Vice President & Chief Lender Officer Kevin C . O’Connor, Executive Vice President & Chief Banking Officer Louis O . Gorman, Senior Vice President & Chief Credit Officer Leo R . Sagan, Jr . , Senior Vice President & Chief Risk Officer Darlene Libiszewski , Senior Vice President & Chief Information Officer John Bonini , Senior Vice President & General Counsel Christine Phillips , Senior Vice President, Human Resources Cidalia Inacio , Senior Vice President, Retail Banking & Wealth Management 4
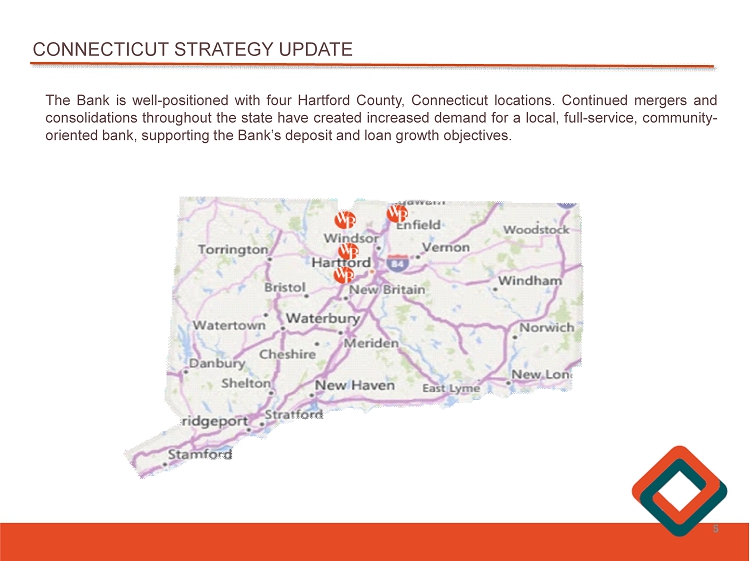
5 CONNECTICUT STRATEGY UPDATE The Bank is well - positioned with four Hartford County, Connecticut locations . Continued mergers and consolidations throughout the state have created increased demand for a local, full - service, community - oriented bank, supporting the Bank’s deposit and loan growth objectives .

6 CONNECTICUT STRATEGY UPDATE Congratulations to the West Hartford Financial Services Center team on being recognized as “Best Bank/Financial Institution” in the annual Best of West Hartford , marking two consecutive years that the Bank has earned the top spot.
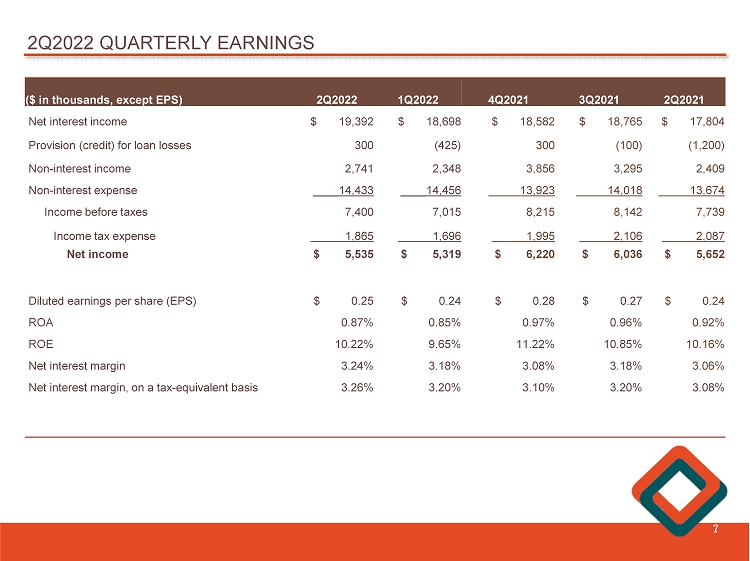
2Q2022 QUARTERLY EARNINGS 7 ($ in thousands , except EPS) 2Q2022 1Q2022 4Q2021 3Q2021 2Q2021 Net interest income $ 19,392 $ 18,698 $ 18,582 $ 18,765 $ 17,804 Provision (credit) for loan losses 300 (425) 300 (100) (1,200) Non - interest income 2,741 2,348 3,856 3,295 2,409 Non - interest expense ____ 14,433 ____ 14,456 13,923 14,018 13,674 Income before taxes 7,400 7,015 8,215 8,142 7,739 Income tax expense 1,865 1,696 1,995 2,106 2,087 Net income $ 5,535 $ 5,319 $ 6,220 $ 6,036 $ 5,652 Diluted earnings per share (EPS) $ 0.25 $ 0.24 $ 0.28 $ 0.27 $ 0.24 ROA 0.87% 0.85% 0.97% 0.96% 0.92% ROE 10.22% 9.65% 11.22% 10.85% 10.16% Net interest margin 3.24% 3.18% 3.08% 3.18% 3.06% Net interest margin, on a tax - equivalent basis 3.26% 3.20% 3.10% 3.20% 3.08%
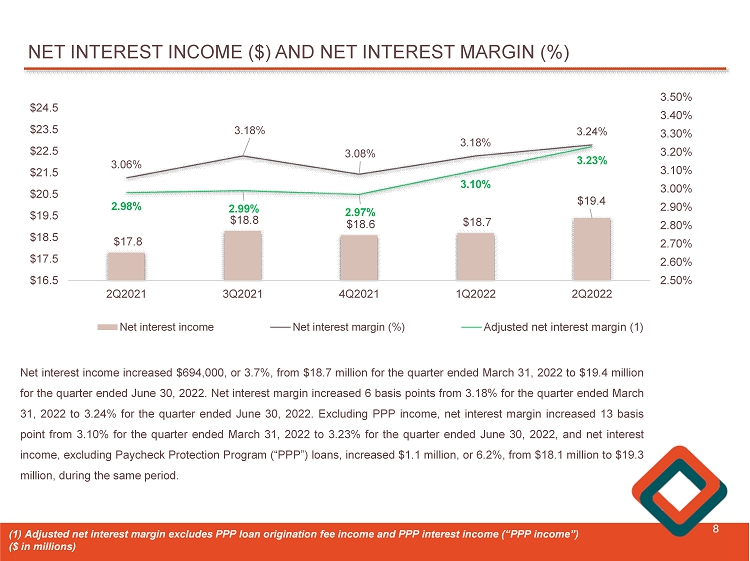
NET INTEREST INCOME ($) AND NET INTEREST MARGIN (%) 8 $17.8 $18.8 $18.6 $18.7 $19.4 3.06% 3.18% 3.08% 3.18% 3.24% 2.98% 2.99% 2.97% 3.10% 3.23% 2.50% 2.60% 2.70% 2.80% 2.90% 3.00% 3.10% 3.20% 3.30% 3.40% 3.50% 2Q2021 3Q2021 4Q2021 1Q2022 2Q2022 $16.5 $17.5 $18.5 $19.5 $20.5 $21.5 $22.5 $23.5 $24.5 Net interest income Net interest margin (%) Adjusted net interest margin (1) Net interest income increased $ 694 , 000 , or 3 . 7 % , from $ 18 . 7 million for the quarter ended March 31 , 2022 to $ 19 . 4 million for the quarter ended June 30 , 2022 . Net interest margin increased 6 basis points from 3 . 18 % for the quarter ended March 31 , 2022 to 3 . 24 % for the quarter ended June 30 , 2022 . Excluding PPP income, net interest margin increased 13 basis point from 3 . 10 % for the quarter ended March 31 , 2022 to 3 . 23 % for the quarter ended June 30 , 2022 , and net interest income, excluding Paycheck Protection Program (“PPP”) loans, increased $ 1 . 1 million, or 6 . 2 % , from $ 18 . 1 million to $ 19 . 3 million, during the same period . (1) Adjusted net interest margin excludes PPP loan origination fee income and PPP interest income (“PPP income”) ($ in millions)
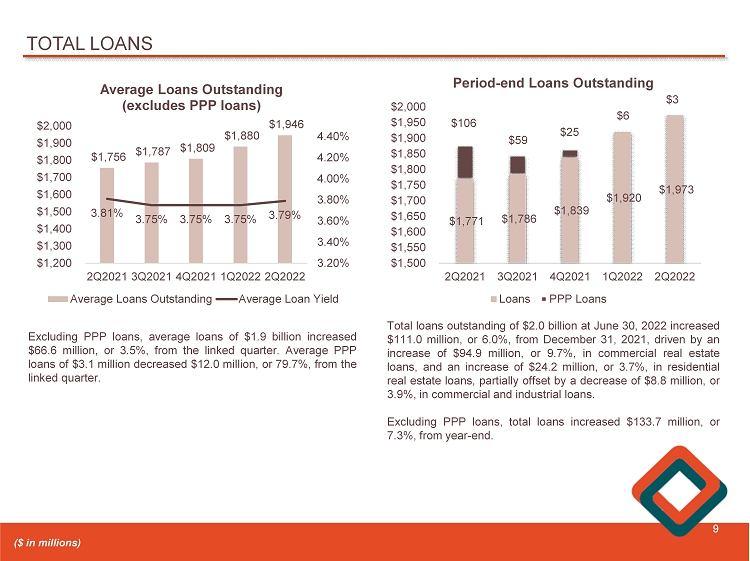
TOTAL LOANS 9 $1,756 $1,787 $1,809 $1,880 $1,946 3.81% 3.75% 3.75% 3.75% 3.79% 3.20% 3.40% 3.60% 3.80% 4.00% 4.20% 4.40% 2Q2021 3Q2021 4Q2021 1Q2022 2Q2022 $1,200 $1,300 $1,400 $1,500 $1,600 $1,700 $1,800 $1,900 $2,000 Average Loans Outstanding (excludes PPP loans) Average Loans Outstanding Average Loan Yield $1,771 $1,786 $1,839 $1,920 $1,973 $106 $59 $25 $6 $3 2Q2021 3Q2021 4Q2021 1Q2022 2Q2022 $1,500 $1,550 $1,600 $1,650 $1,700 $1,750 $1,800 $1,850 $1,900 $1,950 $2,000 Period - end Loans Outstanding Loans PPP Loans Excluding PPP loans, average loans of $ 1 . 9 billion increased $ 66 . 6 million, or 3 . 5 % , from the linked quarter . Average PPP loans of $ 3 . 1 million decreased $ 12 . 0 million, or 79 . 7 % , from the linked quarter . Total loans outstanding of $ 2 . 0 billion at June 30 , 2022 increased $ 111 . 0 million , or 6 . 0 % , from December 31 , 2021 , driven by an increase of $ 94 . 9 million, or 9 . 7 % , in commercial real estate loans, and an increase of $ 24 . 2 million, or 3 . 7 % , in residential real estate loans, partially offset by a decrease of $ 8 . 8 million, or 3 . 9 % , in commercial and industrial loans . Excluding PPP loans, total loans increased $ 133 . 7 million, or 7 . 3 % , from year - end . ($ in millions)
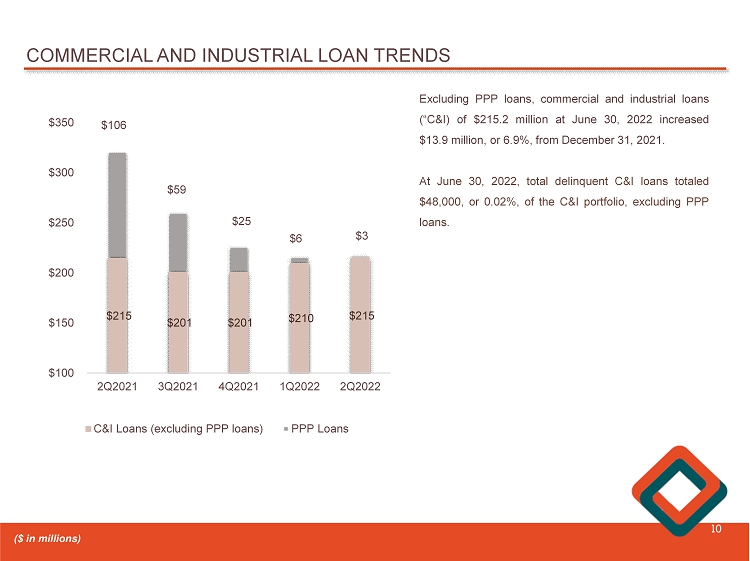
COMMERCIAL AND INDUSTRIAL LOAN TRENDS 10 $215 $201 $201 $210 $215 $106 $59 $25 $6 $3 2Q2021 3Q2021 4Q2021 1Q2022 2Q2022 $100 $150 $200 $250 $300 $350 C&I Loans (excluding PPP loans) PPP Loans Excluding PPP loans, commercial and industrial loans (“ C&I) of $ 215 . 2 million at June 30 , 2022 increased $ 13 . 9 million, or 6 . 9 % , from December 31 , 2021 . At June 30 , 2022 , total delinquent C&I loans totaled $ 48 , 000 , or 0 . 02 % , of the C&I portfolio, excluding PPP loans . ($ in millions)
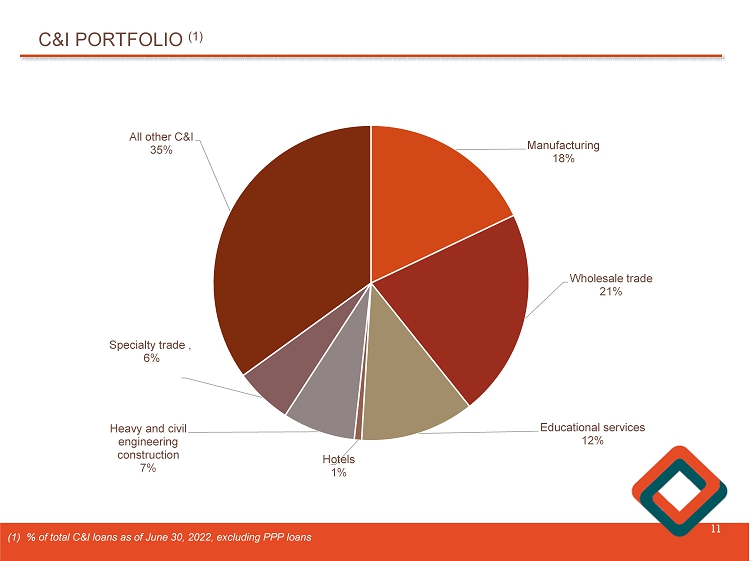
C&I PORTFOLIO (1) 11 (1) % of total C&I loans as of June 30, 2022, excluding PPP loans Manufacturing 18% Wholesale trade 21% Educational services 12% Hotels 1% Heavy and civil engineering construction 7% Specialty trade , 6% All other C&I 35%
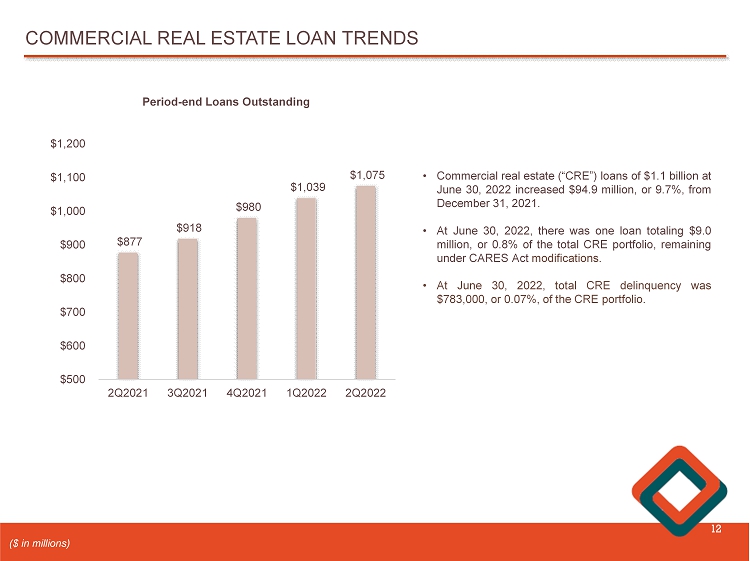
COMMERCIAL REAL ESTATE LOAN TRENDS 12 $877 $918 $980 $1,039 $1,075 2Q2021 3Q2021 4Q2021 1Q2022 2Q2022 $500 $600 $700 $800 $900 $1,000 $1,100 $1,200 • Commercial real estate (“CRE”) loans of $ 1 . 1 billion at June 30 , 2022 increased $ 94 . 9 million, or 9 . 7 % , from December 31 , 2021 . • At June 30 , 2022 , there was one loan totaling $ 9 . 0 million, or 0 . 8 % of the total CRE portfolio, remaining under CARES Act modifications . • At June 30 , 2022 , total CRE delinquency was $ 783 , 000 , or 0 . 07 % , of the CRE portfolio . ($ in millions) Period - end Loans Outstanding
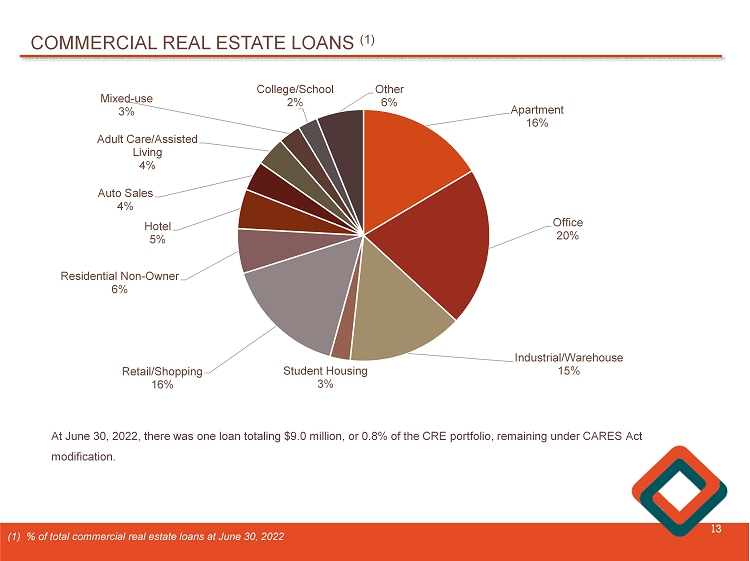
COMMERCIAL REAL ESTATE LOANS (1) 13 (1) % of total commercial real estate loans at June 30, 2022 At June 30, 2022, there was one loan totaling $9.0 million, or 0.8% of the CRE portfolio, remaining under CARES Act modification. Apartment 16% Office 20% Industrial/Warehouse 15% Student Housing 3% Retail/Shopping 16% Residential Non - Owner 6% Hotel 5% Auto Sales 4% Adult Care/Assisted Living 4% Mixed - use 3% College/School 2% Other 6%
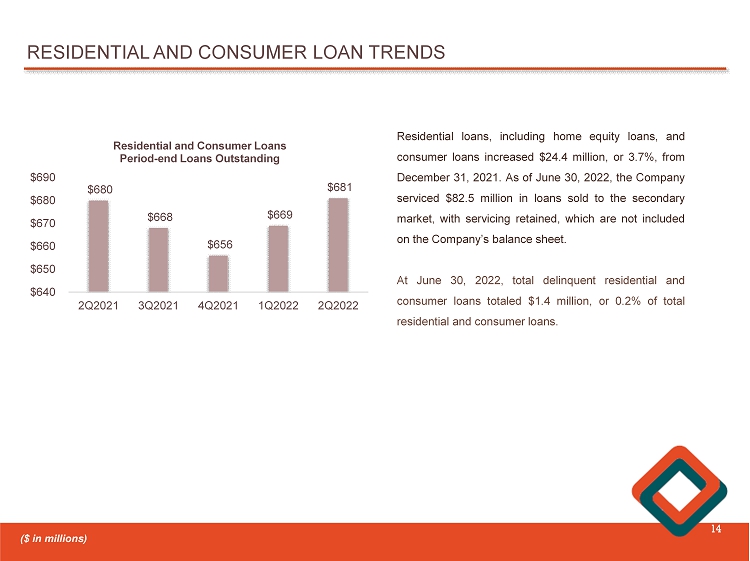
RESIDENTIAL AND CONSUMER LOAN TRENDS 14 $680 $668 $656 $669 $681 2Q2021 3Q2021 4Q2021 1Q2022 2Q2022 $640 $650 $660 $670 $680 $690 Residential and Consumer Loans Period - end Loans Outstanding Residential loans, including home equity loans, and consumer loans increased $ 24 . 4 million, or 3 . 7 % , from December 31 , 2021 . As of June 30 , 2022 , the Company serviced $ 82 . 5 million in loans sold to the secondary market, with servicing retained, which are not included on the Company’s balance sheet . At June 30 , 2022 , total delinquent residential and consumer loans totaled $ 1 . 4 million, or 0 . 2 % of total residential and consumer loans . ($ in millions)
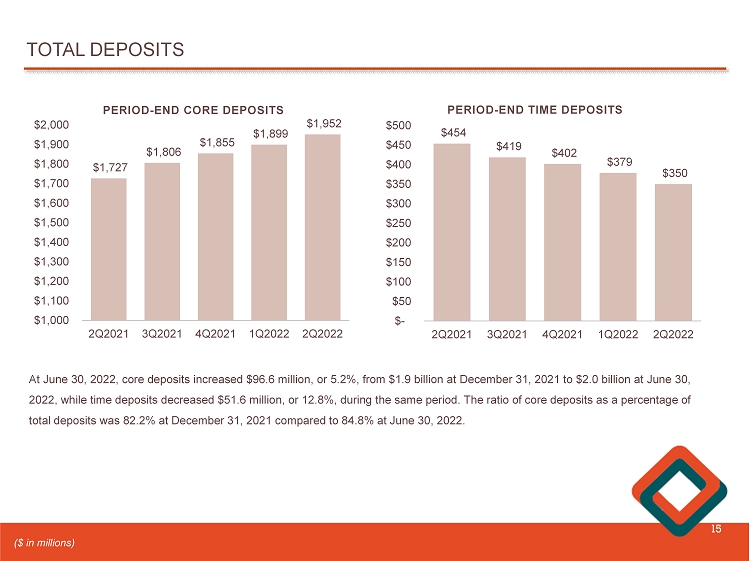
TOTAL DEPOSITS 15 $1,727 $1,806 $1,855 $1,899 $1,952 2Q2021 3Q2021 4Q2021 1Q2022 2Q2022 $1,000 $1,100 $1,200 $1,300 $1,400 $1,500 $1,600 $1,700 $1,800 $1,900 $2,000 PERIOD - END CORE DEPOSITS At June 30 , 2022 , core deposits increased $ 96 . 6 million, or 5 . 2 % , from $ 1 . 9 billion at December 31 , 2021 to $ 2 . 0 billion at June 30 , 2022 , while time deposits decreased $ 51 . 6 million, or 12 . 8 % , during the same period . The ratio of core deposits as a percentage of total deposits was 82 . 2 % at December 31 , 2021 compared to 84 . 8 % at June 30 , 2022 . $454 $419 $402 $379 $350 2Q2021 3Q2021 4Q2021 1Q2022 2Q2022 $- $50 $100 $150 $200 $250 $300 $350 $400 $450 $500 PERIOD - END TIME DEPOSITS ($ in millions)
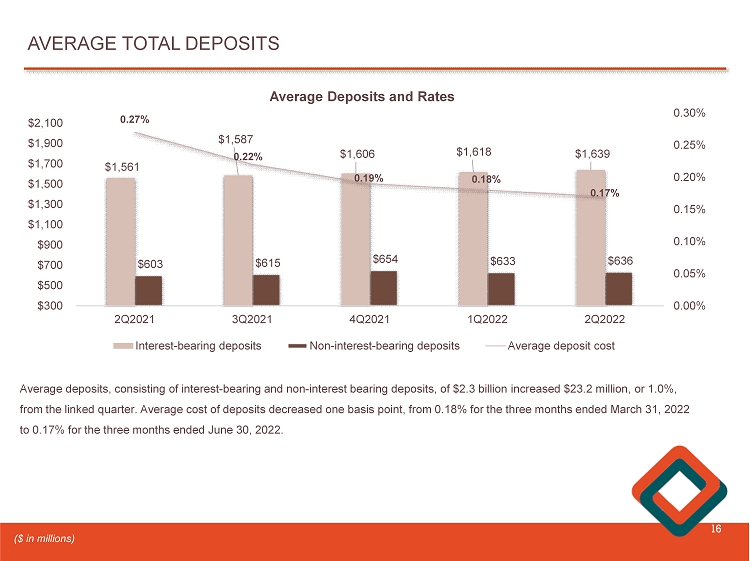
AVERAGE TOTAL DEPOSITS 16 $1,561 $1,587 $1,606 $1,618 $1,639 $603 $615 $654 $633 $636 0.27% 0.22% 0.19% 0.18% 0.17% 0.00% 0.05% 0.10% 0.15% 0.20% 0.25% 0.30% 2Q2021 3Q2021 4Q2021 1Q2022 2Q2022 $300 $500 $700 $900 $1,100 $1,300 $1,500 $1,700 $1,900 $2,100 Average Deposits and Rates Interest-bearing deposits Non-interest-bearing deposits Average deposit cost Average deposits, consisting of interest - bearing and non - interest bearing deposits, of $2.3 billion increased $23.2 million, or 1.0%, from the linked quarter. Average cost of deposits decreased one basis point, from 0.18% for the three months ended March 31, 202 2 to 0.17% for the three months ended June 30, 2022. ($ in millions)
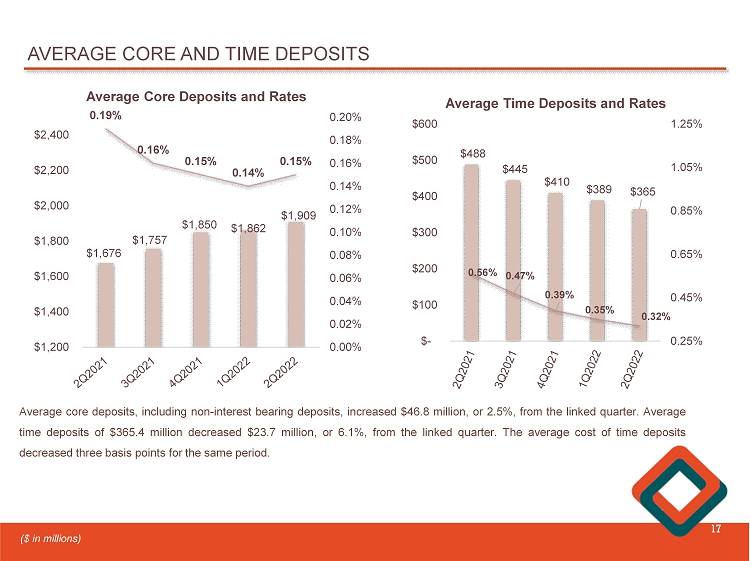
AVERAGE CORE AND TIME DEPOSITS 17 $1,676 $1,757 $1,850 $1,862 $1,909 0.19% 0.16% 0.15% 0.14% 0.15% 0.00% 0.02% 0.04% 0.06% 0.08% 0.10% 0.12% 0.14% 0.16% 0.18% 0.20% $1,200 $1,400 $1,600 $1,800 $2,000 $2,200 $2,400 Average Core Deposits and Rates Average core deposits, including non - interest bearing deposits, increased $ 46 . 8 million, or 2 . 5 % , from the linked quarter . Average time deposits of $ 365 . 4 million decreased $ 23 . 7 million, or 6 . 1 % , from the linked quarter . The average cost of time deposits decreased three basis points for the same period . ($ in millions) $488 $445 $410 $389 $365 0.56% 0.47% 0.39% 0.35% 0.32% 0.25% 0.45% 0.65% 0.85% 1.05% 1.25% $- $100 $200 $300 $400 $500 $600 Average Time Deposits and Rates
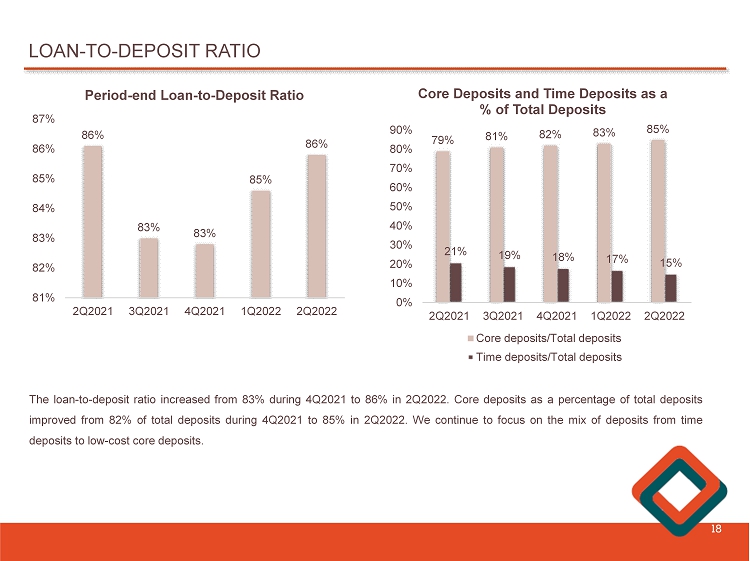
LOAN - TO - DEPOSIT RATIO 18 86% 83% 83% 85% 86% 2Q2021 3Q2021 4Q2021 1Q2022 2Q2022 81% 82% 83% 84% 85% 86% 87% Period - end Loan - to - Deposit Ratio 79% 81% 82% 83% 85% 21% 19% 18% 17% 15% 2Q2021 3Q2021 4Q2021 1Q2022 2Q2022 0% 10% 20% 30% 40% 50% 60% 70% 80% 90% Core Deposits and Time Deposits as a % of Total Deposits Core deposits/Total deposits Time deposits/Total deposits The loan - to - deposit ratio increased from 83 % during 4 Q 2021 to 86 % in 2 Q 2022 . Core deposits as a percentage of tota l deposits improved from 82 % of total deposits during 4 Q 2021 to 85 % in 2 Q 2022 . We continue to focus on the mix of deposits from time deposits to low - cost core deposits .
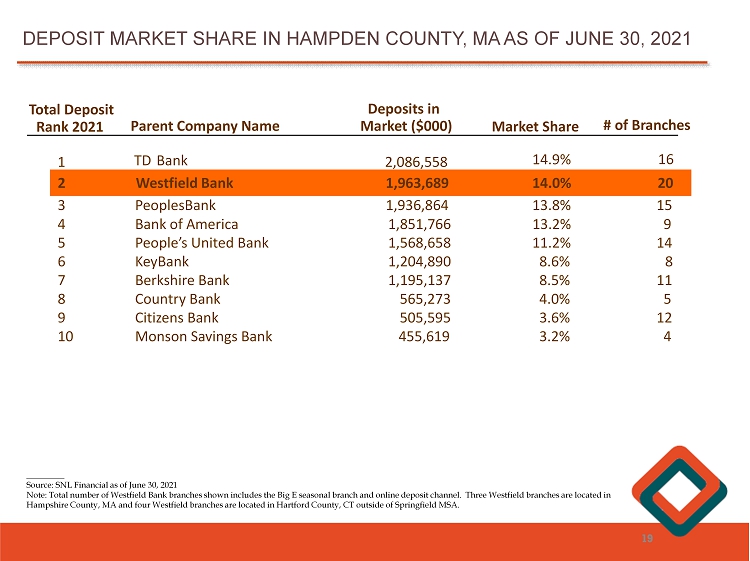
________ Source: SNL Financial as of June 30, 2021 Note: Total number of Westfield Bank branches shown includes the Big E seasonal branch and online deposit channel. Three Wes tfi eld branches are located in Hampshire County, MA and four Westfield branches are located in Hartford County, CT outside of Springfield MSA. DEPOSIT MARKET SHARE IN HAMPDEN COUNTY, MA AS OF JUNE 30, 2021 19 Total Deposit Rank 2021 Parent Company Name Deposits in Market ($000) Market Share # of Branches 1 TD Bank 2,086,558 14.9% 16 1,762,519 13.1% 20 2 Westfield Bank 1,963,689 14.0% 20 3 PeoplesBank 1,936,864 13.8 % 15 4 Bank of America 1,851,766 13.2 % 9 5 People’s United Bank 1,568,658 11.2 % 14 6 KeyBank 1,204,890 8.6% 8 7 Berkshire Bank 1,195,137 8.5 % 11 8 Country Bank 565,273 4.0 % 5 9 Citizens Bank 505,595 3.6 % 12 10 Monson Savings Bank 455,619 3.2 % 4
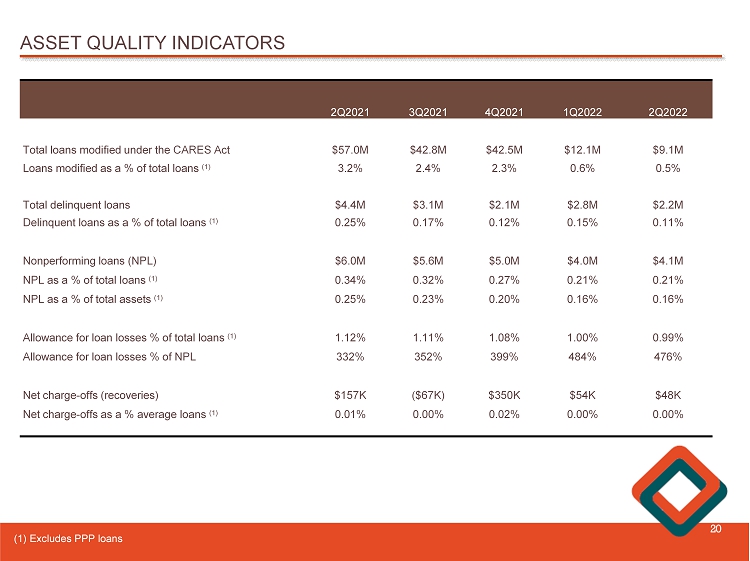
ASSET QUALITY INDICATORS 20 2Q2021 3Q2021 4Q2021 1Q2022 2Q2022 Total loans modified under the CARES Act $57.0M $42.8M $42.5M $12.1M $9.1M Loans modified as a % of total loans (1) 3.2% 2.4% 2.3% 0.6% 0.5% Total delinquent loans $4.4M $3.1M $2.1M $2.8M $2.2M Delinquent loans as a % of total loans (1) 0.25% 0.17% 0.12% 0.15% 0.11% Nonperforming loans (NPL) $6.0M $5.6M $5.0M $4.0M $4.1M NPL as a % of total loans (1) 0.34% 0.32% 0.27% 0.21% 0.21% NPL as a % of total assets (1) 0.25% 0.23% 0.20% 0.16% 0.16% Allowance for loan losses % of total loans (1) 1.12% 1.11% 1.08% 1.00% 0.99% Allowance for loan losses % of NPL 332% 352% 399% 484% 476% Net charge - offs (recoveries) $157K ($67K) $350K $54K $48K Net charge - offs as a % average loans (1) 0.01% 0.00% 0.02% 0.00% 0.00% (1) Excludes PPP loans
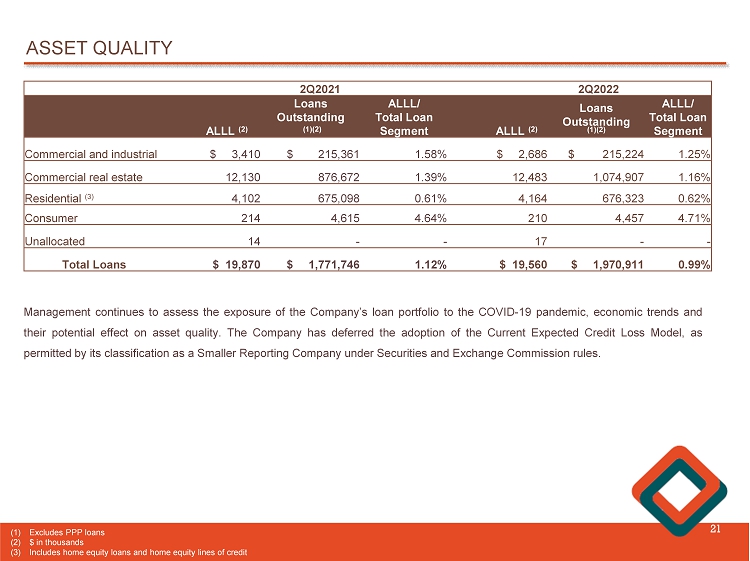
ASSET QUALITY 21 Management continues to assess the exposure of the Company’s loan portfolio to the COVID - 19 pandemic, economic trends and their potential effect on asset quality . The Company has deferred the adoption of the Current Expected Credit Loss Model , as permitted by its classification as a Smaller Reporting Company under Securities and Exchange Commission rules . 2Q2021 2Q2022 ALLL (2) Loans Outstanding (1)(2) ALLL/ Total Loan Segment ALLL (2) Loans Outstanding (1)(2) ALLL/ Total Loan Segment Commercial and industrial $ 3,410 $ 215,361 1.58% $ 2,686 $ 215,224 1.25% Commercial real estate 12,130 876,672 1.39% 12,483 1,074,907 1.16% Residential (3) 4,102 675,098 0.61% 4,164 676,323 0.62% Consumer 214 4,615 4.64% 210 4,457 4.71% Unallocated 14 - - 17 - - Total Loans $ 19,870 $ 1,771,746 1.12% $ 19,560 $ 1,970,911 0.99% (1) Excludes PPP loans (2) $ in thousands (3) Includes home equity loans and home equity lines of credit
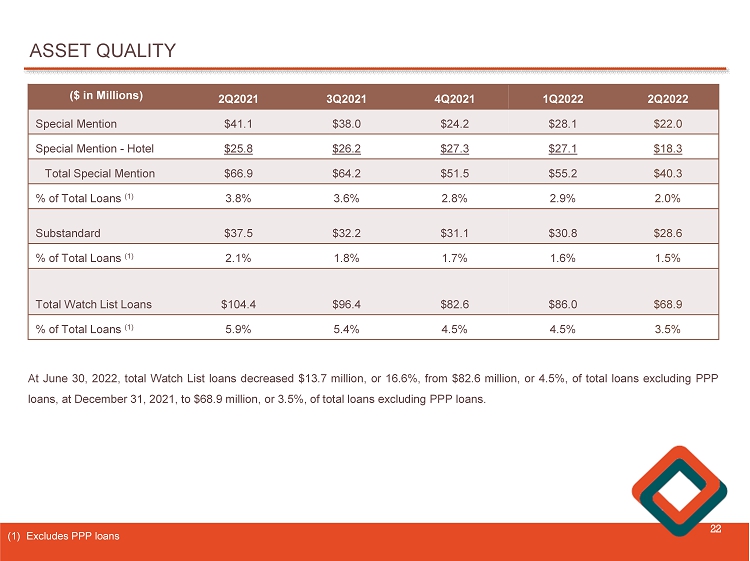
ASSET QUALITY 22 ($ in Millions) 2Q2021 3Q2021 4Q2021 1Q2022 2Q2022 Special Mention $41.1 $38.0 $24.2 $28.1 $22.0 Special Mention - Hotel $25.8 $26.2 $27.3 $27.1 $18.3 Total Special Mention $66.9 $64.2 $51.5 $55.2 $40.3 % of Total Loans (1) 3.8% 3.6% 2.8% 2.9% 2.0% Substandard $37.5 $32.2 $31.1 $30.8 $28.6 % of Total Loans (1) 2.1% 1.8% 1.7% 1.6% 1.5% Total Watch List Loans $104.4 $96.4 $82.6 $86.0 $68.9 % of Total Loans (1) 5.9% 5.4% 4.5% 4.5% 3.5% At June 30 , 2022 , total Watch List loans decreased $ 13 . 7 million, or 16 . 6 % , from $ 82 . 6 million, or 4 . 5 % , of total loans excluding PPP loans, at December 31 , 2021 , to $ 68 . 9 million, or 3 . 5 % , of total loans excluding PPP loans . (1) Excludes PPP loans
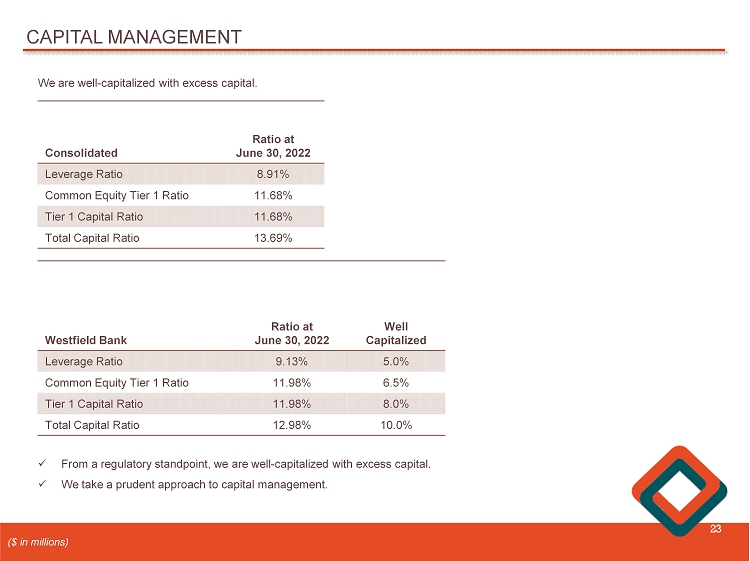
CAPITAL MANAGEMENT 23 We are well - capitalized with excess capital. Consolidated Ratio at June 30, 2022 Leverage Ratio 8.91% Common Equity Tier 1 Ratio 11.68% Tier 1 Capital Ratio 11.68% Total Capital Ratio 13.69% x From a regulatory standpoint, we are well - capitalized with excess capital. x We take a prudent approach to capital management. ($ in millions) Westfield Bank Ratio at June 30 , 2022 Well Capitalized Leverage Ratio 9.13% 5.0% Common Equity Tier 1 Ratio 11.98% 6.5% Tier 1 Capital Ratio 11.98% 8.0% Total Capital Ratio 12.98% 10.0%
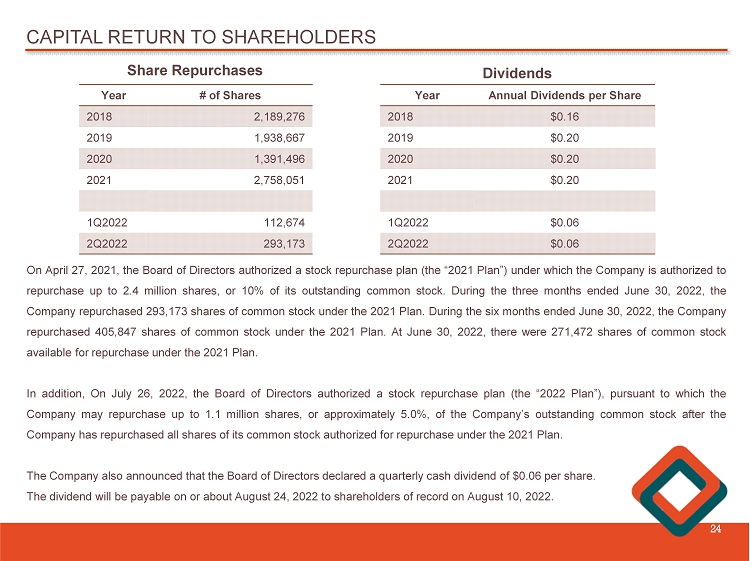
CAPITAL RETURN TO SHAREHOLDERS 24 Year # of Shares 2018 2,189,276 2019 1,938,667 2020 1,391,496 2021 2,758,051 1Q2022 112,674 2Q2022 293,173 Year Annual Dividends per Share 2018 $0.16 2019 $0.20 2020 $0.20 2021 $0.20 1Q2022 $0.06 2Q2022 $0.06 Share Repurchases Dividends On April 27 , 2021 , the Board of Directors authorized a stock repurchase plan (the “ 2021 Plan”) under which the Company is authorized to repurchase up to 2 . 4 million shares, or 10 % of its outstanding common stock . During the three months ended June 30 , 2022 , the Company repurchased 293 , 173 shares of common stock under the 2021 Plan . During the six months ended June 30 , 2022 , the Company repurchased 405 , 847 shares of common stock under the 2021 Plan . At June 30 , 2022 , there were 271 , 472 shares of common stock available for repurchase under the 2021 Plan . In addition , On July 26 , 2022 , the Board of Directors authorized a stock repurchase plan (the “ 2022 Plan”), pursuant to which the Company may repurchase up to 1 . 1 million shares, or approximately 5 . 0 % , of the Company’s outstanding common stock after the Company has repurchased all shares of its common stock authorized for repurchase under the 2021 Plan . The Company also announced that the Board of Directors declared a quarterly cash dividend of $ 0 . 06 per share . The dividend will be payable on or about August 24 , 2022 to shareholders of record on August 10 , 2022 .
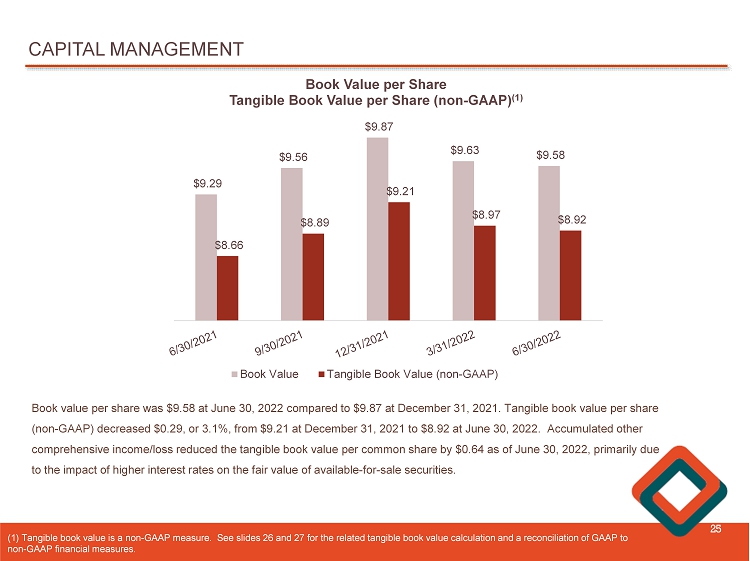
CAPITAL MANAGEMENT 25 $9.29 $9.56 $9.87 $9.63 $9.58 $8.66 $8.89 $9.21 $8.97 $8.92 Book Value per Share Tangible Book Value per Share (non - GAAP) (1) Book Value Tangible Book Value (non-GAAP) Book value per share was $ 9.58 at June 30, 2022 compared to $9.87 at December 31, 2021. Tangible book value per share (non - GAAP) decreased $ 0.29, or 3.1%, from $9.21 at December 31, 2021 to $ 8.92 at June 30, 2022. Accumulated other comprehensive income/loss reduced the tangible book value per common share by $0.64 as of June 30, 2022, primarily due to the impact of higher interest rates on the fair value of available - for - sale securities. ( 1) Tangible book value is a non - GAAP measure. See slides 26 and 27 for the related tangible book value calculation and a reconc iliation of GAAP to non - GAAP financial measures.
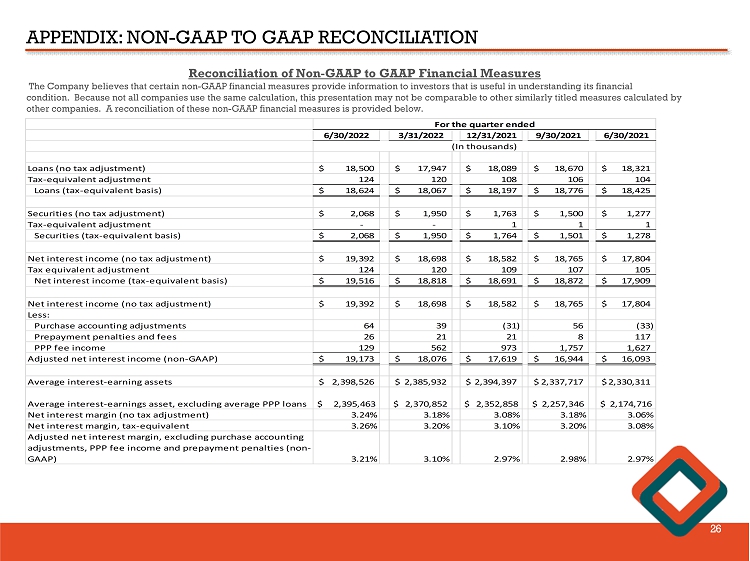
APPENDIX: NON - GAAP TO GAAP RECONCILIATION 26 Reconciliation of Non - GAAP to GAAP Financial Measures The Company believes that certain non - GAAP financial measures provide information to investors that is useful in understanding i ts financial condition. Because not all companies use the same calculation, this presentation may not be comparable to other similarly title d measures calculated by other companies. A reconciliation of these non - GAAP financial measures is provided below. 6/30/2022 3/31/2022 12/31/2021 9/30/2021 6/30/2021 Loans (no tax adjustment) 18,500$ 17,947$ 18,089$ 18,670$ 18,321$ Tax-equivalent adjustment 124 120 108 106 104 Loans (tax-equivalent basis) 18,624$ 18,067$ 18,197$ 18,776$ 18,425$ Securities (no tax adjustment) 2,068$ 1,950$ 1,763$ 1,500$ 1,277$ Tax-equivalent adjustment - - 1 1 1 Securities (tax-equivalent basis) 2,068$ 1,950$ 1,764$ 1,501$ 1,278$ Net interest income (no tax adjustment) 19,392$ 18,698$ 18,582$ 18,765$ 17,804$ Tax equivalent adjustment 124 120 109 107 105 Net interest income (tax-equivalent basis) 19,516$ 18,818$ 18,691$ 18,872$ 17,909$ Net interest income (no tax adjustment) 19,392$ 18,698$ 18,582$ 18,765$ 17,804$ Less: Purchase accounting adjustments 64 39 (31) 56 (33) Prepayment penalties and fees 26 21 21 8 117 PPP fee income 129 562 973 1,757 1,627 Adjusted net interest income (non-GAAP) 19,173$ 18,076$ 17,619$ 16,944$ 16,093$ Average interest-earning assets 2,398,526$ 2,385,932$ 2,394,397$ 2,337,717$ 2,330,311$ Average interest-earnings asset, excluding average PPP loans $ 2,395,463 $ 2,370,852 $ 2,352,858 $ 2,257,346 $ 2,174,716 Net interest margin (no tax adjustment) 3.24% 3.18% 3.08% 3.18% 3.06% Net interest margin, tax-equivalent 3.26% 3.20% 3.10% 3.20% 3.08% Adjusted net interest margin, excluding purchase accounting adjustments, PPP fee income and prepayment penalties (non- GAAP) 3.21% 3.10% 2.97% 2.98% 2.97% (In thousands) For the quarter ended
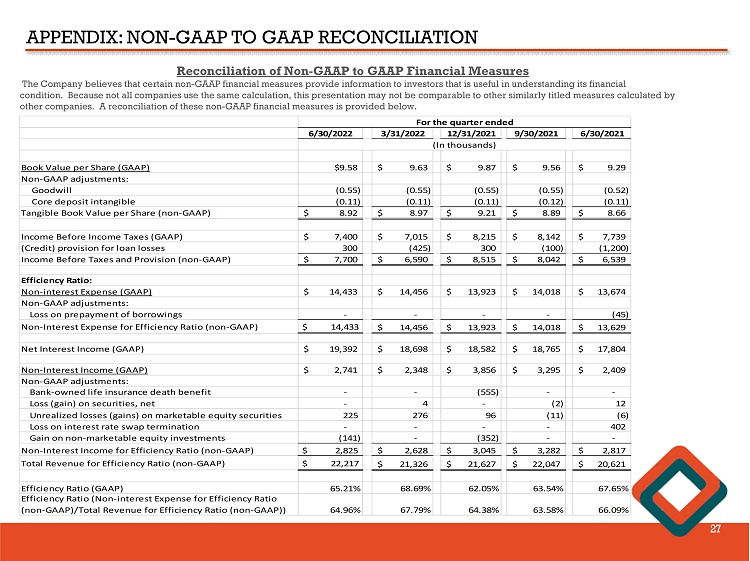
APPENDIX: NON - GAAP TO GAAP RECONCILIATION 27 Reconciliation of Non - GAAP to GAAP Financial Measures The Company believes that certain non - GAAP financial measures provide information to investors that is useful in understanding i ts financial condition. Because not all companies use the same calculation, this presentation may not be comparable to other similarly title d measures calculated by other companies. A reconciliation of these non - GAAP financial measures is provided below. 6/30/2022 3/31/2022 12/31/2021 9/30/2021 6/30/2021 Book Value per Share (GAAP) $9.58 9.63$ 9.87$ 9.56$ 9.29$ Non-GAAP adjustments: Goodwill (0.55) (0.55) (0.55) (0.55) (0.52) Core deposit intangible (0.11) (0.11) (0.11) (0.12) (0.11) Tangible Book Value per Share (non-GAAP) 8.92$ 8.97$ 9.21$ 8.89$ 8.66$ Income Before Income Taxes (GAAP) 7,400$ 7,015$ 8,215$ 8,142$ 7,739$ (Credit) provision for loan losses 300 (425) 300 (100) (1,200) Income Before Taxes and Provision (non-GAAP) 7,700$ 6,590$ 8,515$ 8,042$ 6,539$ Efficiency Ratio: Non-interest Expense (GAAP) 14,433$ 14,456$ 13,923$ 14,018$ 13,674$ Non-GAAP adjustments: Loss on prepayment of borrowings - - - - (45) Non-Interest Expense for Efficiency Ratio (non-GAAP) $ 14,433 14,456$ 13,923$ 14,018$ 13,629$ Net Interest Income (GAAP) 19,392$ 18,698$ 18,582$ 18,765$ 17,804$ Non-Interest Income (GAAP) 2,741$ 2,348$ 3,856$ 3,295$ 2,409$ Non-GAAP adjustments: Bank-owned life insurance death benefit - - (555) - - Loss (gain) on securities, net - 4 - (2) 12 Unrealized losses (gains) on marketable equity securities 225 276 96 (11) (6) Loss on interest rate swap termination - - - - 402 Gain on non-marketable equity investments (141) - (352) - - Non-Interest Income for Efficiency Ratio (non-GAAP) $ 2,825 2,628$ 3,045$ 3,282$ 2,817$ Total Revenue for Efficiency Ratio (non-GAAP) $ 22,217 21,326$ 21,627$ 22,047$ 20,621$ Efficiency Ratio (GAAP) 65.21% 68.69% 62.05% 63.54% 67.65% Efficiency Ratio (Non-interest Expense for Efficiency Ratio (non-GAAP)/Total Revenue for Efficiency Ratio (non-GAAP)) 64.96% 67.79% 64.38% 63.58% 66.09% (In thousands) For the quarter ended

WESTFIELD BANK “WHAT BETTER BANKING’S ALL ABOUT” James C. Hagan , President and Chief Executive Officer Guida R. Sajdak , Executive Vice President and Chief Financial Officer Meghan Hibner , Vice President and Investor Relations Officer 28 141 Elm Street, Westfield, MA