Western New England Bancorp, Inc. 8-K
Exhibit
99.1
| |
For
further information contact:
James
C. Hagan, President and CEO
Guida
R. Sajdak, Executive Vice President and CFO
Meghan
Hibner, First Vice President and Investor Relations Officer
413-568-1911 |
WESTERN
NEW ENGLAND BANCORP, INC. REPORTS RESULTS FOR THREE AND NINE MONTHS ENDED SEPTEMBER 30, 2025 AND DECLARES QUARTERLY CASH DIVIDEND
Westfield,
Massachusetts, October 28, 2025: Western New England Bancorp, Inc. (the “Company” or “WNEB”) (NasdaqGS:
WNEB), the holding company for Westfield Bank (the “Bank”), announced today the unaudited results of operations for
the three and nine months ended September 30, 2025. For the three months ended September 30, 2025, the Company reported net income
of $3.2 million, or $0.16 per diluted share, compared to net income of $1.9 million, or $0.09 per diluted share, for the three
months ended September 30, 2024. On a linked quarter basis, net income was $3.2 million, or $0.16 per diluted share, as compared
to net income of $4.6 million, or $0.23 per diluted share, for the three months ended June 30, 2025. For the nine months ended
September 30, 2025, net income was $10.1 million, or $0.50 per diluted share, compared to net income of $8.4 million, or $0.40
per diluted share, for the nine months ended September 30, 2024.
The
Company also announced that its Board of Directors declared a quarterly cash dividend of $0.07 per share on the Company’s
common stock. The dividend will be payable on or about November 26, 2025 to shareholders of record on November 12, 2025.
James
C. Hagan, President and Chief Executive Officer, commented, “We are pleased to report solid earnings for the third quarter
of 2025, along with strong loan growth and core deposit growth. Core deposits increased $97.4 million, or 6.3%, from year-end
and total loans increased $60.8 million, or 2.9%. From June 30, 2025 to September 30, 2025, total loans increased $38.7 million,
or 1.9%, driven by an increase in commercial real estate loans of $31.9 million, or 3.0%, and an increase in residential real
estate loans of $22.6 million, or 2.8%. Our loan growth and disciplined approach to managing funding costs have allowed us to
expand our net interest margin to 2.81% as we continue to decrease the cost of interest-bearing liabilities and reduce our reliance
on time deposits. Our asset quality remains solid, with nonperforming assets to total assets of 0.21%, and total delinquency as
a percentage of total loans of 0.21%.”
Hagan
concluded, “We remain disciplined in our capital management strategies and during the nine months ended September 30, 2025,
we repurchased 499,853 shares of common stock with an average price per share of $9.31. We are pleased with our third quarter
results and are committed to delivering long-term value to shareholders through capital management strategies, which include continued
loan growth, share repurchases and quarterly cash dividends.”
Key
Highlights:
Loans
and Deposits
At
September 30, 2025, total loans increased $60.8 million, or 2.9%, from $2.1 billion, or 77.9% of total assets, at December 31,
2024 to $2.1 billion, or 77.8% of total assets. The increase was primarily driven by an increase in residential real estate loans,
including home equity loans, of $52.3 million, or 6.7%, an increase in commercial and industrial loans of $7.3 million, or 3.4%,
and an increase in commercial real estate loans of $2.4 million, or 0.2%, partially offset by a decrease in consumer loans of
$1.2 million, or 26.5%.
At
September 30, 2025, total deposits of $2.3 billion increased $87.2 million, or 3.9%, from December 31, 2024. Core deposits, which
the Company defines as all deposits except time deposits, increased $97.4 million, or 6.3%, from $1.6 billion, or 68.9% of total
deposits, at December 31, 2024, to $1.7 billion, or 70.5% of total deposits, at September 30, 2025. Time deposits decreased $10.2
million, or 1.5%, from $703.6 million at December 31, 2024 to $693.4 million at September 30, 2025. Brokered time deposits, which
are included in time deposits, totaled $1.7 million at December 31, 2024. The Company did not have brokered time deposits at September
30, 2025. The loan-to-deposit ratio was 90.7% and 91.5% at September 30, 2025 and December 31, 2024, respectively.
Allowance
for Credit Losses and Credit Quality
At
September 30, 2025, the allowance for credit losses was $20.5 million, or 0.96% of total loans, compared to $19.5 million, or
0.94% of total loans, at December 31, 2024. The allowance for credit losses, as a percentage of nonaccrual loans, was 363.6% and
362.9% at September 30, 2025 and December 31, 2024, respectively. At September 30, 2025, nonaccrual loans totaled $5.6 million,
or 0.27% of total loans, compared to $5.4 million, or 0.26% of total loans, at December 31, 2024. Total delinquent loans decreased
from $5.0 million, or 0.24% of total loans, at December 31, 2024 to $4.5 million, or 0.21% of total loans, at September 30, 2025.
At September 30, 2025 and December 31, 2024, the Company did not have any other real estate owned.
Net
Interest Margin
The
net interest margin increased one basis point from 2.80% for the three months ended June 30, 2025 to 2.81% for the three months
ended September 30, 2025. The net interest margin, on a tax-equivalent basis, increased one basis point from 2.82% for the three
months ended June 30, 2025 to 2.83% for the three months ended September 30, 2025.
Stock
Repurchase Program
On
April 22, 2025, the Board of Directors authorized the 2025 Plan, pursuant to which the Company may repurchase up to 1.0 million
shares of its common stock, or approximately 4.8%, of the Company’s then-outstanding shares of common stock, upon the completion
of the 2024 Plan. On June 3, 2025, the Company announced the completion of its 2024 Plan under which the Company repurchased a
total of 1.0 million shares at an average price per share of $8.79.
During
the three months ended September 30, 2025, the Company repurchased 2,535 shares of its common stock at an average price per share
of $9.74. During the nine months ended September 30, 2025, the Company repurchased 499,853 shares of its common stock at an average
price per share of $9.31. As of September 30, 2025, there were 972,465 shares of common stock available for repurchase under the
2025 Plan.
The
repurchase of shares under our 2025 Plan is administered through an independent broker. The shares of common stock repurchased
under the 2025 Plan have been and will continue to be purchased from time to time at prevailing market prices, through open market
or privately negotiated transactions, or otherwise, depending upon market conditions. There is no guarantee as to the exact number,
or value, of shares that will be repurchased by the Company, and the Company may discontinue repurchases at any time that the
Company’s management (“Management”) determines additional repurchases are not warranted. The timing and amount
of additional share repurchases under the 2025 Plan will depend on a number of factors, including the Company’s stock price
performance, ongoing capital planning considerations, general market conditions, and applicable legal requirements.
Book
Value and Tangible Book Value
The
Company’s book value per share was $11.89 at September 30, 2025, compared to $11.30 at December 31, 2024, while tangible
book value per share, a non-GAAP financial measure, increased $0.59, or 5.6%, from $10.63 at December 31, 2024 to $11.22 at September
30, 2025. See pages 18-20 for the related tangible book value calculation and a reconciliation of GAAP to non-GAAP financial measures.
Net
Income for the Three Months Ended September 30, 2025 Compared to the Three Months Ended June 30, 2025
For
the three months ended September 30, 2025, the Company reported a decrease in net income of $1.4 million, or 31.0%, from $4.6
million, or $0.23 per diluted share, for the three months ended June 30, 2025, to $3.2 million, or $0.16 per diluted share. Net
interest income increased $450,000, or 2.6%, the provision for credit losses increased $1.9 million, non-interest income decreased
$238,000, or 7.0%, and non-interest expense increased $122,000, or 0.8%. Return on average assets and return on average equity
were 0.46% and 5.20%, respectively, for the three months ended September 30, 2025, compared to 0.69% and 7.76%, respectively,
for the three months ended June 30, 2025.
Net
Interest Income and Net Interest Margin
On
a sequential quarter basis, net interest income, our primary driver of revenues, increased $450,000, or 2.6%, to $18.1 million
for the three months ended September 30, 2025, from $17.6 million for the three months ended June 30, 2025. The increase in net
interest income was primarily due to an increase in interest income of $421,000, or 1.4%. During the three months ended June 30,
2025, the Company recorded $425,000 in prepayment penalties and fees (“prepayment penalties”) related to payoffs in
the commercial portfolio, compared to $34,000 during the three months ended September 30, 2025. Adjusted net interest income (net
interest income, excluding prepayment penalties), a non-GAAP financial measure, increased $841,000, or 4.9%, from the three months
ended June 30, 2025 to the three months ended September 30, 2025. See pages 18-20 for the related adjusted net interest margin,
excluding prepayment penalties calculation and a reconciliation of GAAP to non-GAAP financial measures.
The
net interest margin was 2.81% for the three months ended September 30, 2025, compared to 2.80% for the three months ended June
30, 2025. The net interest margin, on a tax-equivalent basis, was 2.83% for the three months ended September 30, 2025, compared
to 2.82% for the three months ended June 30, 2025. Excluding the prepayment penalties discussed above, the net interest margin
increased eight basis points from 2.73% for the three months ended June 30, 2025 to 2.81% for the three months ended September
30, 2025.
The
average yield on interest-earning assets, without the impact of tax-equivalent adjustments, decreased two basis points from 4.69%
for the three months ended June 30, 2025 to 4.67% for the three months ended September 30, 2025. The average loan yield, without
the impact of tax-equivalent adjustments, decreased four basis points from 5.05% for the three months ended June 30, 2025, to
5.01% for the three months ended September 30, 2025. During the three months ended June 30, 2025, the Company recorded $425,000
in prepayment penalties related to payoffs in the commercial portfolio, compared to $34,000 during the three months ended September
30, 2025. The average loan yield, excluding prepayment penalties, a non-GAAP financial measure, increased four basis points from
4.97% for the three months ended June 30, 2025 to 5.01% for the three months ended September 30, 2025. During the same period,
average loans increased $31.1 million, or 1.5%, average securities decreased $1.0 million, or 0.3%, and average short-term investments
decreased $6.2 million, or 10.6%. See pages 18-20 for the related average loan yield, excluding prepayment penalties calculation
and a reconciliation of GAAP to non-GAAP financial measures.
The
average cost of total funds, including non-interest bearing accounts and borrowings, decreased four basis points from 1.98% for
the three months ended June 30, 2025 to 1.94% for the three months ended September 30, 2025. The average cost of core deposits,
which the Company defines as all deposits except time deposits, increased three basis points to 1.04% for the three months ended
September 30, 2025, from 1.01% for the three months ended June 30, 2025. The average cost of time deposits decreased 18 basis
points from 3.69% for the three months ended June 30, 2025, to 3.51% for the three months ended September 30, 2025. The average
cost of borrowings, including subordinated debt, was 5.03% for the three months ended September 30, 2025, compared to 5.04%, for
the three months ended June 30, 2025. Average demand deposits, an interest-free source of funds, increased $9.0 million, or 1.6%,
from $572.8 million, or 24.9%, of total average deposits, for the three months ended June 30, 2025, to $581.8 million, or 25.0%
of total average deposits, for the three months ended September 30, 2025.
Provision
for (Reversal of) Credit Losses
During
the three months ended September 30, 2025, the Company recorded a provision for credit losses of $1.3 million, compared to a
reversal of credit losses of $615,000 during the three months ended June 30, 2025. The $1.9 million increase in the provision for
credit losses was primarily due to higher balances in commercial real estate loans and an increase in unfunded commitments of
$46.8 million, or 28.1%. The provision for credit losses was
determined by a number of factors: the continued strong credit performance of the Company’s loan portfolio, changes in the
loan portfolio mix and Management’s consideration of existing economic conditions and the economic outlook from the Federal
Reserve Bank’s actions to control inflation. Management continues to monitor macroeconomic variables related to increasing
interest rates, tariffs, inflation and concerns of an economic downturn, and believes it is appropriately reserved for the current
economic environment.
During
the three months ended June 30, 2025, the reversal of credit losses of $615,000 was a result of a recovery in the amount of $624,000
on a previously charged-off commercial relationship acquired on October 21, 2016 from Chicopee Bancorp, Inc. As of June 30, 2025,
the relationship paid in full.
During
the three months ended September 30, 2025, the Company recorded net charge-offs of $43,000, compared to net recoveries of $585,000
for the three months ended June 30, 2025.
Non-Interest
Income
On
a sequential quarter basis, non-interest income decreased $238,000, or 7.0%, to $3.2 million for the three months ended September
30, 2025, from $3.4 million for the three months ended June 30, 2025. During the three months ended September 30, 2025, service
charges and fees on deposits increased $24,000, or 0.9%, to $2.6 million from the three months ended June 30, 2025 and income
from bank-owned life insurance (“BOLI”) decreased $34,000, or 6.6%, from the three months ended June 30, 2025 to $482,000
for the three months ended September 30, 2025. During the three months ended September 30, 2025, the Company reported $117,000
in other income from loan-level swap fees on commercial loans compared to $95,000 during the three months ended June 30, 2025.
During
the three months ended September 30, 2025, the Company reported unrealized gains on marketable equity securities of $22,000, compared
to unrealized gains of $25,000 during the three months ended June 30, 2025. During the three months ended June 30, 2025, the Company
reported gains on non-marketable equity investments of $243,000 and did not have comparable income during the three months ended
September 30, 2025. During the three months ended June 30, 2025, the Company reported a gain of $4,000 from mortgage banking activities
and did not have comparable income during the three months ended September 30, 2025.
Non-Interest
Expense
For
the three months ended September 30, 2025, non-interest expense increased $122,000, or 0.8%, to $15.8 million from $15.7 million
for the three months ended June 30, 2025. Salaries and related benefits increased $378,000, or 4.3%, due to an increase in deferred
compensation expense to reflect updated performance award estimates. Software related expenses increased $7,000, or 1.1%, and
other non-interest expense increased $57,000, or 4.2%. These increases were partially offset by a decrease in professional fees
of $163,000, or 26.2%, a decrease in debit card processing and ATM network costs of $41,000, or 6.1%, a decrease in furniture
and equipment expense of $38,000, or 7.7%, a decrease in occupancy expense of $28,000, or 2.2%, a decrease in FDIC insurance expense
of $23,000, or 5.8%, a decrease in data processing expense of $17,000, or 1.8%, and a decrease in advertising expense of $10,000,
or 2.3%. For the three months ended September 30, 2025 and the three months ended June 30, 2025, the efficiency ratio was 74.2%
and 74.4%, respectively.
Income
Tax Provision
Income
tax expense for the three months ended September 30, 2025 was $1.0 million, with an effective tax rate of 24.5%, compared to $1.4
million, with an effective tax rate of 23.7%, for the three months ended June 30, 2025. The increase in the effective tax rate
was due to higher projected pre-tax income for the twelve months ended December 31, 2025.
Net
Income for the Three Months Ended September 30, 2025 Compared to the Three Months Ended September 30, 2024
The
Company reported an increase in net income of $1.3 million, or 66.3%, from $1.9 million, or $0.09 per diluted share, for the three
months ended September 30, 2024 to $3.2 million, or $0.16 per diluted share, for the three months ended September 30, 2025. Net
interest income increased $3.4 million, or 22.8%, provision for credit losses increased $352,000, or 37.4%, non-interest income
increased $32,000, or 1.0%, and non-interest expense increased $1.4 million, or 9.5%, during the same period. Return on average
assets and return on average equity were 0.46% and 5.20%, respectively, for the three months ended September 30, 2025, compared
to 0.29% and 3.19%, respectively, for the three months ended September 30, 2024.
Net
Interest Income and Net Interest Margin
Net
interest income increased $3.4 million, or 22.8%, to $18.1 million, for the three months ended September 30, 2025, from $14.7
million for the three months ended September 30, 2024. The increase in net interest income was due to an increase in interest
and dividend income of $2.2 million, or 7.9%, and a decrease in interest expense of $1.2 million, or 8.9%. The increase in interest
income was primarily due to a $112.6 million, or 4.6%, increase in average interest-earning assets and an increase in the average
yield on interest-earning assets of 12 basis points, from the three months ended September 30, 2024 to the three months ended
September 30, 2025.
The
net interest margin increased 41 basis points from 2.40% for the three months ended September 30, 2024 to 2.81% for the three
months ended September 30, 2025. The net interest margin, on a tax-equivalent basis, increased 41 basis points from 2.42%, for
the three months ended September 30, 2024 to 2.83% for the three months ended September 30, 2025. The average yield on interest-earning
assets, without the impact of tax-equivalent adjustments, increased 13 basis points from 4.54% for the three months ended September
30, 2024 to 4.67%, for the three months ended September 30, 2025. The average loan yield, without the impact of tax-equivalent
adjustments, increased 11 basis points from 4.90% for the three months ended September 30, 2024 to 5.01% for the three months
ended September 30, 2025. During the three months ended September 30, 2025, average interest-earning assets increased $112.6 million,
or 4.6% to $2.6 billion, primarily due to an increase in average loans of $73.8 million, or 3.6%, an increase in average short-term
investments, consisting of cash and cash equivalents, of $20.3 million, or 63.5%, and an increase in average securities of $19.4
million, or 5.5%.
The
average cost of total funds, including non-interest bearing accounts and borrowings, decreased 30 basis points from 2.24% for
the three months ended September 30, 2024 to 1.94% for the three months ended September 30, 2025. The average cost of core deposits,
which the Company defines as all deposits except time deposits, increased 11 basis points from 0.93% for the three months ended
September 30, 2024 to 1.04% for the three months ended September 30, 2025. The average cost of time deposits decreased 93 basis
points from 4.44% for the three months ended September 30, 2024 to 3.51% for the three months ended September 30, 2025. The average
cost of borrowings, including subordinated debt, decreased two basis points from 5.05% for the three months ended September 30,
2024 to 5.03%, for the three months ended September 30, 2025. Average demand deposits, an interest-free source of funds, increased
$22.6 million, or 4.0%, from $559.2 million, or 25.7% of total average deposits, for the three months ended September 30, 2024,
to $581.8 million, or 25.0% of total average deposits, for the three months ended September 30, 2025.
Provision
for Credit Losses
During
the three months ended September 30, 2025, the Company recorded a provision for credit losses of $1.3 million, compared to a provision
for credit losses of $941,000 during the three months ended September 30, 2024. The $352,000, or 37.4%, increase in the provision
for credit losses was primarily due to an increase in unfunded commitments of $46.8 million, or 28.1%, during the three months
ended September 30, 2025, compared to an increase in unfunded commitments of $33.5 million, or 20.7%, during the three months
ended September 30, 2024 and a slight deterioration in macroeconomic forecasts. The provision for credit losses was determined
by a number of factors: the continued strong credit performance of the Company’s loan portfolio, changes in the loan portfolio
mix and Management’s consideration of existing economic conditions and the economic outlook from the Federal Reserve Bank’s
actions to control inflation. Management continues to monitor macroeconomic variables related to increasing interest rates, tariffs,
inflation and concerns of an economic downturn, and believes it is appropriately reserved for the current economic environment.
The
Company recorded net charge-offs of $43,000 for the three months ended September 30, 2025, as compared to net charge-offs of $98,000
for the three months ended September 30, 2024.
Non-Interest
Income
Non-interest
income increased $32,000, or 1.0%, to $3.2 million for the three months ended September 30, 2025, from $3.1 million for the three
months ended September 30, 2024. During the three months ended September 30, 2025, service charges and fees on deposits increased
$211,000, or 9.0%, income from BOLI increased $12,000, or 2.6%, from $470,000 for the three months ended September 30, 2024 to
$482,000 for the three months ended September 30, 2025. During the three months ended September 30, 2025, the Company reported
$117,000 in other income from loan-level swap fees on commercial loans, compared to $74,000 during the three months ended September
30, 2024.
During
the three months ended September 30, 2025, the Company reported an unrealized gain on marketable equity securities of $22,000,
compared to an unrealized gain on marketable equity securities of $10,000 during the three months ended September 30, 2024. During
the three months ended September 30, 2024, the Company reported income of $246,000 on mortgage banking activities due to the sale
of $20.1 million in fixed rate residential real estate loans to the secondary market. The Company did not sell any residential
loans during the three months ended September 30, 2025.
Non-Interest
Expense
For
the three months ended September 30, 2025, non-interest expense increased $1.4 million, or 9.5%, to $15.8 million from $14.4 million
for the three months ended September 30, 2024. Salaries and employee benefits increased $1.1 million, or 13.5%, to $9.2 million,
due to an increase in deferred compensation expense to reflect updated performance award estimates, advertising expense increased
$162,000, or 59.8%, data processing expense increased $47,000, or 5.4%, FDIC insurance expense increased $38,000, or 11.2%, software
expenses increased $40,000, or 6.5%, occupancy expense increased $20,000, or 1.6%, and other non-interest expense increased $94,000,
or 7.1%. During the same period, these increases were partially offset by a decrease in professional fees of $80,000, or 14.8%,
a decrease in furniture and equipment expense of $30,000, or 6.2%, and a decrease in net debit card processing and ATM network
costs of $16,000, or 2.5%.
For
the three months ended September 30, 2025, the efficiency ratio was 74.2%, compared to 80.6% for the three months ended September
30, 2024. The decrease in the efficiency ratio was driven by an increase in total revenues, defined as the sum of net interest
income and non-interest income, of $3.4 million, or 19.0%, during the three months ended September 30, 2025, compared to the three
months ended September 30, 2024.
Income
Tax Provision
Income
tax expense for the three months ended September 30, 2025 was $1.0 million, or an effective tax rate of 24.5%, compared to $618,000,
or an effective tax rate of 24.5%, for the three months ended September 30, 2024.
Net
Income for the Nine Months Ended September 30, 2025 Compared to the Nine Months Ended September 30, 2024
For
the nine months ended September 30, 2025, the Company reported net income of $10.1 million, or $0.50 per diluted share, compared
to $8.4 million, or $0.40 per diluted share, for the nine months ended September 30, 2024. Return on average assets and return
on average equity were 0.50% and 5.64% for the nine months ended September 30, 2025, respectively, compared to 0.44% and 4.74%
for the nine months ended September 30, 2024, respectively.
Net
Interest Income and Net Interest Margin
During
the nine months ended September 30, 2025, net interest income increased $6.7 million, or 15.1%, to $51.3 million, compared to
$44.5 million for the nine months ended September 30, 2024. The increase in net interest income was primarily due to an increase
in interest income of $6.8 million, or 8.4%.
For
the nine months ended September 30, 2025, the net interest margin increased 24 basis points from 2.46% for the nine months ended
September 30, 2024 to 2.70%. The net interest margin, on a tax-equivalent basis, was 2.48% for the nine months ended September
30, 2024, compared to 2.72% for the nine months ended September 30, 2025. During the nine months ended September 30, 2025, the
Company recorded $459,000 in prepayment penalties related to payoffs in the commercial portfolio, compared to $8,000 during the
nine months ended September 30, 2024. During the nine months ended September 30, 2024, the Company had a fair value hedge which
contributed seven basis points to the net interest margin. The adjusted net interest margin, excluding prepayment penalties and
income from the fair value hedge, a non-GAAP financial measure, increased 29 basis points from 2.39% for the nine months ended
September 30, 2024 to 2.68% for the nine months ended September 30, 2025, respectively. The fair value hedge matured in October
of 2024. See pages 18-20 for the related net interest margin, excluding prepayment penalties and income from the fair value hedge
calculation and a reconciliation of GAAP to non-GAAP financial measures.
The
average yield on interest-earning assets, without the impact of tax-equivalent adjustments, was 4.64% for the nine months ended
September 30, 2025, compared to 4.49% for the nine months ended September 30, 2024. The average loan yield, without the impact
of tax-equivalent adjustments, was 4.98% for the nine months ended September 30, 2025, compared to 4.86% for the nine months ended
September 30, 2024. During the nine months ended September 30, 2025, average interest-earning assets increased $122.9 million,
or 5.1%, to $2.5 billion, from the same period in 2024. The increase was primarily due to an increase in average loans of $63.4
million, or 3.1%, an increase in average short-term investments, consisting of cash and cash equivalents, of $43.6 million and
an increase in average securities of $15.2 million, or 4.3%.
The
average cost of total funds, including non-interest bearing accounts and borrowings, was 2.02% for the nine months ended September
30, 2025, compared to 2.12% for the nine months ended September 30, 2024. The average cost of core deposits, which the Company
defines as all deposits except time deposits, increased 18 basis points to 1.04% for the nine months ended September 30, 2025,
from 0.86% for the nine months ended September 30, 2024. The average cost of time deposits decreased 55 basis points from 4.32%
for the nine months ended September 30, 2024 to 3.77% for the nine months ended September 30, 2025. The average cost of borrowings,
including subordinated debt, increased five basis points from 4.99% for the nine months ended September 30, 2024 to 5.04% for
the nine months ended September 30, 2025. Average demand deposits, an interest-free source of funds, increased $19.6 million,
or 3.5%, from $555.3 million, or 25.8% of total average deposits, for the nine months ended September 30, 2024 to $574.8 million,
or 24.9% of total average deposits, for the nine months ended September 30, 2025.
Provision
for Credit Losses
During
the nine months ended September 30, 2025, the Company recorded a provision for credit losses of $820,000, compared to a provision
for credit losses of $97,000 during the nine months ended September 30, 2024. The $723,000 increase in the provision for credit
losses was primarily due to an increase in unfunded commitments of $37.7 million, or 21.4%, changes in the loan mix and a slight
deterioration in the macroeconomic environment. The provision for credit losses was determined by a number of factors: the continued
strong credit performance of the Company’s loan portfolio, changes in the loan portfolio mix and Management’s consideration
of existing economic conditions and the economic outlook from the Federal Reserve Bank’s actions to control inflation. Management
continues to monitor macroeconomic variables related to increasing interest rates, tariffs, inflation and concerns of an economic
downturn, and believes it is appropriately reserved for the current economic environment.
The
Company recorded net recoveries of $513,000 for the nine months ended September 30, 2025, as compared to net charge-offs of $41,000
for the nine months ended September 30, 2024. During the nine months ended September 30, 2025, the Company recorded a recovery
of $624,000 on a previously charged-off commercial relationship acquired on October 21, 2016 from Chicopee Bancorp, Inc. As of
June 30, 2025, the relationship paid in full.
Non-Interest
Income
For
the nine months ended September 30, 2025, non-interest income decreased $306,000, or 3.2%, from $9.6 million during the nine months
ended September 30, 2024 to $9.3 million. During the same period, service charges and fees on deposits increased $463,000, or
6.7%, and income from BOLI increased $46,000, or 3.2%. During the nine months ended September 30, 2025, the Company reported $212,000
in other income from loan-level swap fees on commercial loans, compared to $74,000 during the same period in 2024. During the
nine months ended September 30, 2025, the Company reported a gain of $243,000 on non-marketable equity investments, compared to
a gain of $987,000 during the nine months ended September 30, 2024. During the nine months ended September 30, 2025, the Company
reported unrealized gains on marketable equity securities of $42,000, compared to unrealized gains on marketable equity securities
of $22,000 during the nine months ended September 30, 2024. Gains and losses from the investment portfolio vary from quarter to
quarter based on market conditions, as well as the related yield curve and valuation changes. During the nine months ended September
30, 2025, the Company reported $11,000 in gains from mortgage banking activities, compared to $246,000 during the nine months
ended September 30, 2024 due to the sale of fixed rate residential real estate loans. In addition, during the nine months ended
September 30, 2024, the Company reported a loss on the disposal of premises and equipment of $6,000 and did not have a comparable
gain or loss during the nine months ended September 30, 2025.
Non-Interest
Expense
For
the nine months ended September 30, 2025, non-interest expense increased $3.1 million, or 7.2%, to $46.6 million, compared to
$43.5 million for the nine months ended September 30, 2024. The increase in non-interest expense was primarily due to an increase
in salaries and employee benefits of $2.2 million, or 9.1%, due to an increase in deferred compensation expense to reflect updated
performance award estimates. Advertising expense increased $346,000, or 36.1%, data processing expense increased $154,000, or
6.0%, FDIC insurance expense increased $135,000, or 12.6%, occupancy expense increased $116,000, or 3.1%, software related expenses
increased $79,000, or 4.2%, debit card and ATM processing fees increased $40,000, or 2.2%, and other non-interest expense increased
$130,000, or 3.3%. Professional fees decreased $61,000, or 3.6%, and furniture and equipment expense decreased $19,000, or 1.3%.
For
the nine months ended September 30, 2025, the efficiency ratio was 76.9%, compared to 80.3% for the nine months ended September
30, 2024. The decrease in the efficiency ratio was driven by higher revenues, defined as the sum of net interest income and non-interest
income, during the nine months ended September 30, 2025, compared to the nine months ended September 30, 2024.
Income
Tax Provision
Income
tax expense for the nine months ended September 30, 2025 was $3.1 million, representing an effective tax rate of 23.6%, compared
to $2.2 million, representing an effective tax rate of 20.9%, for the nine months ended September 30, 2024. The increase is due
to higher projected pre-tax income for the twelve months ended December 31, 2025.
Balance
Sheet
At
September 30, 2025, total assets increased $82.4 million, or 3.1%, from December 31, 2024 to $2.7 billion. The increase in total
assets was primarily due to an increase in total loans of $60.8 million, or 2.9%, an increase in investment securities of $7.0
million, or 1.9%, and an increase in cash and cash equivalents of $16.5 million, or 24.8%.
Investments
At
September 30, 2025, the investment securities portfolio totaled $373.2 million, or 13.6% of total assets, compared to $366.1 million,
or 13.8% of total assets, at December 31, 2024. At September 30, 2025, the Company’s available-for-sale securities portfolio,
recorded at fair market value, increased $18.5 million, or 11.5%, from $160.7 million at December 31, 2024 to $179.2 million.
The held-to-maturity securities portfolio, recorded at amortized cost, decreased $11.6 million, or 5.6%, from $205.0 million at
December 31, 2024 to $193.4 million at September 30, 2025.
At
September 30, 2025, the Company reported unrealized losses on the available-for-sale securities portfolio of $23.8 million, or
11.7% of the amortized cost basis of the available-for-sale securities portfolio, compared to unrealized losses of $31.2 million,
or 16.2% of the amortized cost basis of the available-for-sale securities at December 31, 2024. At September 30, 2025, the Company
reported unrealized losses on the held-to-maturity securities portfolio of $31.9 million, or 16.5% of the amortized cost basis
of the held-to-maturity securities portfolio, compared to $39.4 million, or 19.2% of the amortized cost basis of the held-to-maturity
securities portfolio at December 31, 2024.
The
securities in which the Company may invest are limited by regulation. Federally chartered savings banks have authority to invest
in various types of assets, including U.S. Treasury obligations, securities of various government-sponsored enterprises, mortgage-backed
securities, certain certificates of deposit of insured financial institutions, repurchase agreements, overnight and short-term
loans to other banks, corporate debt instruments and marketable equity securities. The securities, with the exception of $10.8
million in corporate bonds, are issued by the United States government or government-sponsored enterprises and are therefore either
explicitly or implicitly guaranteed as to the timely payment of contractual principal and interest. These positions are deemed
to have no credit impairment, therefore, the disclosed unrealized losses with the securities portfolio relate primarily to changes
in prevailing interest rates. In all cases, price improvement in future periods will be realized as the issuances approach maturity.
Management
regularly reviews the portfolio for securities in an unrealized loss position. At September 30, 2025 and December 31, 2024, the
Company did not record any credit impairment charges on its securities portfolio and attributed the unrealized losses primarily
due to fluctuations in general interest rates or changes in expected prepayments and not due to credit quality. The primary objective
of the Company’s investment portfolio is to provide liquidity and to secure municipal deposit accounts while preserving
the safety of principal. The available-for-sale and held-to-maturity portfolios are both eligible for pledging to the Federal
Home Loan Bank (“FHLB”) and Federal Reserve Bank (“FRB”) as collateral for borrowings. The portfolios
are comprised of high-credit quality investments and both portfolios generated cash flows monthly from interest, principal amortization
and payoffs, which supports the Bank’s objective to provide liquidity.
Total
Loans
Total
loans increased $60.8 million, or 2.9%, from $2.1 billion, or 77.9% of total assets, at December 31, 2024 to $2.1 billion, or
77.8% of total assets, at September 30, 2025. The increase in total loans was primarily driven by an increase in residential real
estate loans, including home equity loans, of $52.3 million, or 6.7%, an increase in commercial and industrial loans of $7.3 million,
or 3.4%, an increase in commercial real estate loans of $2.4 million, or 0.2%, partially offset by a decrease in consumer loans
of $1.2 million, or 26.5%.
The
following table presents a summary of the loan portfolio by the major classification of loans at the periods indicated:
| | |
September 30, 2025 | | |
December 31, 2024 | |
| | |
(Dollars in thousands) | |
| | |
| |
| Commercial real estate loans: | |
| | | |
| | |
| Non-owner occupied | |
$ | 877,871 | | |
$ | 880,828 | |
| Owner occupied | |
| 200,229 | | |
| 194,904 | |
| Total commercial real estate loans | |
| 1,078,100 | | |
| 1,075,732 | |
| | |
| | | |
| | |
| Residential real estate loans: | |
| | | |
| | |
| Residential | |
| 695,844 | | |
| 653,802 | |
| Home equity | |
| 132,132 | | |
| 121,857 | |
| Total residential real estate loans | |
| 827,976 | | |
| 775,659 | |
| | |
| | | |
| | |
| Commercial and industrial loans | |
| 218,951 | | |
| 211,656 | |
| | |
| | | |
| | |
| Consumer loans | |
| 3,226 | | |
| 4,391 | |
| Total loans | |
| 2,128,253 | | |
| 2,067,438 | |
| Unamortized premiums and net deferred loan fees and costs | |
| 3,055 | | |
| 2,751 | |
| Total loans, including unamortized premiums and net deferred loan fees and costs | |
$ | 2,131,308 | | |
$ | 2,070,189 | |
Credit
Quality
Management
continues to closely monitor the loan portfolio for any signs of deterioration in borrowers’ financial condition and also
in light of speculation that commercial real estate values may deteriorate as the market continues to adjust to higher vacancies
and interest rates. We continue to proactively take steps to mitigate risk in our loan portfolio.
Total
delinquency was $4.5 million, or 0.21% of total loans, at September 30, 2025, compared to $5.0 million, or 0.24% of total loans
at December 31, 2024. At September 30, 2025, nonaccrual loans totaled $5.6 million, or 0.27% of total loans, compared to $5.4
million, or 0.26% of total loans, at December 31, 2024. At September 30, 2025 and December 31, 2024, there were no loans 90 or
more days past-due and still accruing interest. Total nonperforming assets (defined as nonaccrual loans and other real estate
owned) totaled $5.6 million, or 0.21% of total assets, at September 30, 2025, compared to $5.4 million, or 0.20% of total assets,
at December 31, 2024. At September 30, 2025 and December 31, 2024, the Company did not have any other real estate owned.
At
September 30, 2025, the allowance for credit losses was $20.5 million, or 0.96% of total loans and 363.6% of nonaccrual loans,
compared to $19.5 million, or 0.94% of total loans and 362.9% of nonaccrual loans, at December 31, 2024. Total criticized loans,
defined as special mention and substandard loans, increased $1.6 million, or 4.2%, from $38.4 million, or 1.9% of total loans,
at December 31, 2024 to $40.0 million, or 1.9% of total loans, at September 30, 2025.
Our
commercial real estate portfolio is comprised of diversified property types and primarily within our geographic footprint. At
September 30, 2025, the commercial real estate portfolio totaled $1.1 billion and represented 50.7% of total loans. Of the $1.1
billion, $877.9 million, or 81.4%, was categorized as non-owner occupied commercial real estate and represented 319.8% of the
Bank’s total risk-based capital. More details on the diversification of the loan portfolio are available in the supplementary
earnings presentation.
Deposits
At
September 30, 2025, total deposits were $2.3 billion and increased $87.2 million, or 3.9%, from December 31, 2024. Core deposits,
which the Company defines as all deposits except time deposits, increased $97.4 million, or 6.3%, from $1.6 billion, or 68.9%
of total deposits, at December 31, 2024, to $1.7 billion, or 70.5% of total deposits, at September 30, 2025. Non-interest-bearing
deposits increased $24.5 million, or 4.3%, to $590.2 million, and represent 25.1% of total deposits, money market accounts increased
$41.2 million, or 6.2%, to $702.7 million, interest-bearing checking accounts increased $26.5 million, or 17.6%, to $176.8 million,
and savings accounts increased $5.2 million, or 2.9%, to $186.8 million.
Time
deposits decreased $10.2 million, or 1.5%, from $703.6 million at December 31, 2024 to $693.4 million at September 30, 2025. Brokered
time deposits, which are included in time deposits, totaled $1.7 million at December 31, 2024. The Company did not have brokered
time deposits at September 30, 2025. We continue our disciplined and focused approach to core relationship management and customer
outreach to meet funding requirements and liquidity needs, with an emphasis on retaining a long-term core customer relationship
base by competing for and retaining deposits in our local market. At September 30, 2025, the Bank’s uninsured deposits totaled
$701.5 million, or 29.9% of total deposits, compared to $643.6 million, or 28.4% of total deposits, at December 31, 2024.
The
table below is a summary of our deposit balances for the periods noted:
| | |
September 30, 2025 | | |
December 31, 2024 | | |
September 30, 2024 | |
| | |
(Dollars in thousands) | |
| Core Deposits: | |
| | | |
| | | |
| | |
| Demand accounts | |
$ | 590,152 | | |
$ | 565,620 | | |
$ | 568,685 | |
| Interest-bearing accounts | |
| 176,823 | | |
| 150,348 | | |
| 140,332 | |
| Savings accounts | |
| 186,823 | | |
| 181,618 | | |
| 179,214 | |
| Money market accounts | |
| 702,712 | | |
| 661,478 | | |
| 635,824 | |
| Total Core Deposits | |
$ | 1,656,510 | | |
$ | 1,559,064 | | |
$ | 1,524,055 | |
| Time Deposits: | |
| 693,365 | | |
| 703,583 | | |
| 700,151 | |
| Total Deposits: | |
$ | 2,349,875 | | |
$ | 2,262,647 | | |
$ | 2,224,206 | |
FHLB
and Subordinated Debt
At
September 30, 2025, total borrowings decreased $2.4 million, or 1.9%, from $123.1 million at December 31, 2024 to $120.7 million.
At September 30, 2025, short-term borrowings decreased $2.4 million, or 44.7%, to $3.0 million, compared to $5.4 million at December
31, 2024. Long-term borrowings were $98.0 million at September 30, 2025 and December 31, 2024. At September 30, 2025 and December
31, 2024, borrowings also consisted of $19.8 million in fixed-to-floating rate subordinated notes.
As
of September 30, 2025, the Company had $468.7 million of additional borrowing capacity at the FHLB, $365.2 million of additional
borrowing capacity under the FRB Discount Window and $25.0 million of other unsecured lines of credit with correspondent
banks.
Capital
At
September 30, 2025, shareholders’ equity was $243.6 million, or 8.9% of total assets, compared to $235.9 million, or 8.9%
of total assets, at December 31, 2024. The change was primarily attributable to net income of $10.1 million and a decrease in
accumulated other comprehensive loss of $5.5 million, partially offset by cash dividends paid of $4.3 million and the repurchase
of shares at a cost of $4.8 million. At September 30, 2025, total shares outstanding were 20,491,966. The Company’s regulatory
capital ratios continue to be strong and in excess of regulatory minimum requirements to be considered well-capitalized as defined
by regulators and internal Company targets.
| | |
September 30, 2025 | | |
December 31, 2024 | |
| | |
Company | | |
Bank | | |
Company | | |
Bank | |
| Total Capital (to Risk Weighted Assets) | |
| 14.30 | % | |
| 13.58 | % | |
| 14.38 | % | |
| 13.65 | % |
| | |
| | | |
| | | |
| | | |
| | |
| Tier 1 Capital (to Risk Weighted Assets) | |
| 12.26 | % | |
| 12.52 | % | |
| 12.37 | % | |
| 12.64 | % |
| | |
| | | |
| | | |
| | | |
| | |
| Common Equity Tier 1 Capital (to Risk Weighted Assets) | |
| 12.26 | % | |
| 12.52 | % | |
| 12.37 | % | |
| 12.64 | % |
| | |
| | | |
| | | |
| | | |
| | |
| Tier 1 Leverage Ratio (to Adjusted Average Assets) | |
| 9.11 | % | |
| 9.30 | % | |
| 9.14 | % | |
| 9.34 | % |
Dividends
Although
the Company has historically paid quarterly dividends on its common stock and currently intends to continue to pay such dividends,
the Company’s ability to pay such dividends depends on a number of factors, including restrictions under federal laws and
regulations on the Company’s ability to pay dividends, and as a result, there can be no assurance that dividends will continue
to be paid in the future.
About
Western New England Bancorp, Inc.
Western
New England Bancorp, Inc. is a Massachusetts-chartered stock holding company and the parent company of Westfield Bank, CSB Colts,
Inc., Elm Street Securities Corporation, WFD Securities, Inc. and WB Real Estate Holdings, LLC. Western New England Bancorp, Inc.
and its subsidiaries are headquartered in Westfield, Massachusetts and operate 25 banking offices throughout western Massachusetts
and northern Connecticut. To learn more, visit our website at www.westfieldbank.com.
Forward-Looking
Statements
This
press release contains “forward-looking statements” within the meaning of Section 27A of the Securities Act of 1933,
as amended, and Section 21E of the Securities Exchange Act of 1934, as amended, with respect to the Company’s financial
condition, liquidity, results of operations, future performance, and business. Forward-looking statements may be identified by
the use of such words as “believe,” “expect,” “anticipate,” “should,” “planned,”
“estimated,” and “potential.” Examples of forward-looking statements include, but are not limited
to, estimates with respect to our financial condition, results of operations and business that are subject to various factors
which could cause actual results to differ materially from these estimates. These factors include, but are not limited to:
| ● | unpredictable
changes in general economic or political conditions, financial markets, fiscal, monetary and regulatory policies, including actual
or potential stress in the banking industry; |
| ● | unstable
political and economic conditions, including changes in tariff policies, which could materially impact credit quality trends and
the ability to generate loans and gather deposits; |
| ● | inflation
and governmental responses to inflation, including recent sustained increases and potential future increases in interest rates
that reduce margins; |
| ● | the
effect on our operations of governmental legislation and regulation, including changes in accounting regulation or standards,
the nature and timing of the adoption and effectiveness of new requirements under the Dodd-Frank Wall Street Reform and Consumer
Protection Act of 2010, Basel guidelines, capital requirements and other applicable laws and regulations; |
| ● | significant
changes in accounting, tax or regulatory practices or requirements; |
| ● | new
legal obligations or liabilities or unfavorable resolutions of litigation; |
| ● | disruptive
technologies in payment systems and other services traditionally provided by banks; |
| ● | the
highly competitive industry and market area in which we operate; |
| ● | operational
risks or risk management failures by us or critical third parties, including without limitation with respect to data processing,
information systems, cybersecurity, technological changes, vendor issues, business interruption, and fraud risks; |
| ● | failure
or circumvention of our internal controls or procedures; |
| ● | changes
in the securities markets which affect investment management revenues; |
| ● | increases
in Federal Deposit Insurance Corporation deposit insurance premiums and assessments; |
| ● | the
soundness of other financial services institutions which may adversely affect our credit risk; |
| ● | certain
of our intangible assets may become impaired in the future; |
| ● | the
duration and scope of potential pandemics, including the emergence of new variants and the response thereto; |
| ● | new
lines of business or new products and services, which may subject us to additional risks; |
| ● | changes
in key management personnel which may adversely impact our operations; |
| ● | severe
weather, natural disasters, acts of war or terrorism and other external events which could significantly impact our business;
and |
| ● | other
risk factors detailed from time to time in our SEC filings. |
Although
we believe that the expectations reflected in such forward-looking statements are reasonable, actual results may differ materially
from the results discussed in these forward-looking statements. You are cautioned not to place undue reliance on these forward-looking
statements, which speak only as of the date hereof. We do not undertake any obligation to republish revised forward-looking statements
to reflect events or circumstances after the date hereof or to reflect the occurrence of unanticipated events, except to the extent
required by law.
WESTERN
NEW ENGLAND BANCORP, INC. AND SUBSIDIARIES
Consolidated
Statements of Net Income and Other Data
(Dollars
in thousands, except per share data)
(Unaudited)
| | |
Three
Months Ended | | |
Nine
Months Ended | |
| | |
September
30, | | |
June
30, | | |
March
31, | | |
December
31, | | |
September
30, | | |
September
30, | |
| | |
2025 | | |
2025 | | |
2025 | | |
2024 | | |
2024 | | |
2025 | | |
2024 | |
| INTEREST
AND DIVIDEND INCOME: | |
| | | |
| | | |
| | | |
| | | |
| | | |
| | | |
| | |
| Loans | |
$ | 26,690 | | |
$ | 26,214 | | |
$ | 24,984 | | |
$ | 25,183 | | |
$ | 25,134 | | |
$ | 77,888 | | |
$ | 73,715 | |
| Securities | |
| 2,617 | | |
| 2,588 | | |
| 2,422 | | |
| 2,273 | | |
| 2,121 | | |
| 7,627 | | |
| 6,376 | |
| Other
investments | |
| 166 | | |
| 169 | | |
| 191 | | |
| 214 | | |
| 189 | | |
| 526 | | |
| 473 | |
| Short-term
investments | |
| 560 | | |
| 641 | | |
| 840 | | |
| 916 | | |
| 396 | | |
| 2,041 | | |
| 682 | |
| Total
interest and dividend income | |
| 30,033 | | |
| 29,612 | | |
| 28,437 | | |
| 28,586 | | |
| 27,840 | | |
| 88,082 | | |
| 81,246 | |
| | |
| | | |
| | | |
| | | |
| | | |
| | | |
| | | |
| | |
| INTEREST
EXPENSE: | |
| | | |
| | | |
| | | |
| | | |
| | | |
| | | |
| | |
| Deposits | |
| 10,403 | | |
| 10,437 | | |
| 11,376 | | |
| 11,443 | | |
| 11,165 | | |
| 32,216 | | |
| 30,793 | |
| Short-term
borrowings | |
| 39 | | |
| 47 | | |
| 54 | | |
| 60 | | |
| 71 | | |
| 140 | | |
| 540 | |
| Long-term
debt | |
| 1,245 | | |
| 1,232 | | |
| 1,219 | | |
| 1,557 | | |
| 1,622 | | |
| 3,696 | | |
| 4,607 | |
| Subordinated
debt | |
| 254 | | |
| 254 | | |
| 254 | | |
| 253 | | |
| 254 | | |
| 762 | | |
| 762 | |
| Total
interest expense | |
| 11,941 | | |
| 11,970 | | |
| 12,903 | | |
| 13,313 | | |
| 13,112 | | |
| 36,814 | | |
| 36,702 | |
| | |
| | | |
| | | |
| | | |
| | | |
| | | |
| | | |
| | |
| Net
interest and dividend income | |
| 18,092 | | |
| 17,642 | | |
| 15,534 | | |
| 15,273 | | |
| 14,728 | | |
| 51,268 | | |
| 44,544 | |
| | |
| | | |
| | | |
| | | |
| | | |
| | | |
| | | |
| | |
| PROVISION
FOR (REVERSAL OF) CREDIT LOSSES | |
| 1,293 | | |
| (615 | ) | |
| 142 | | |
| (762 | ) | |
| 941 | | |
| 820 | | |
| 97 | |
| | |
| | | |
| | | |
| | | |
| | | |
| | | |
| | | |
| | |
| Net
interest and dividend income after provision for (reversal of) credit losses | |
| 16,799 | | |
| 18,257 | | |
| 15,392 | | |
| 16,035 | | |
| 13,787 | | |
| 50,448 | | |
| 44,447 | |
| | |
| | | |
| | | |
| | | |
| | | |
| | | |
| | | |
| | |
| NON-INTEREST
INCOME: | |
| | | |
| | | |
| | | |
| | | |
| | | |
| | | |
| | |
| Service
charges and fees on deposits | |
| 2,552 | | |
| 2,528 | | |
| 2,284 | | |
| 2,301 | | |
| 2,341 | | |
| 7,364 | | |
| 6,901 | |
| Income
from bank-owned life insurance | |
| 482 | | |
| 516 | | |
| 473 | | |
| 486 | | |
| 470 | | |
| 1,471 | | |
| 1,425 | |
| Unrealized
gain (loss) on marketable equity securities | |
| 22 | | |
| 25 | | |
| (5 | ) | |
| (9 | ) | |
| 10 | | |
| 42 | | |
| 22 | |
| Gain
(loss) on mortgage banking activities | |
| — | | |
| 4 | | |
| 7 | | |
| (11 | ) | |
| 246 | | |
| 11 | | |
| 246 | |
| Gain
on non-marketable equity investments | |
| — | | |
| 243 | | |
| — | | |
| 300 | | |
| — | | |
| 243 | | |
| 987 | |
| Loss
on disposal of premises and equipment | |
| — | | |
| — | | |
| — | | |
| — | | |
| — | | |
| — | | |
| (6 | ) |
| Other
income | |
| 117 | | |
| 95 | | |
| — | | |
| 187 | | |
| 74 | | |
| 212 | | |
| 74 | |
| Total
non-interest income | |
| 3,173 | | |
| 3,411 | | |
| 2,759 | | |
| 3,254 | | |
| 3,141 | | |
| 9,343 | | |
| 9,649 | |
| | |
| | | |
| | | |
| | | |
| | | |
| | | |
| | | |
| | |
| NON-INTEREST
EXPENSE: | |
| | | |
| | | |
| | | |
| | | |
| | | |
| | | |
| | |
| Salaries
and employee benefits | |
| 9,209 | | |
| 8,831 | | |
| 8,413 | | |
| 8,429 | | |
| 8,112 | | |
| 26,453 | | |
| 24,257 | |
| Occupancy | |
| 1,237 | | |
| 1,265 | | |
| 1,412 | | |
| 1,256 | | |
| 1,217 | | |
| 3,914 | | |
| 3,798 | |
| Furniture
and equipment | |
| 453 | | |
| 491 | | |
| 487 | | |
| 505 | | |
| 483 | | |
| 1,431 | | |
| 1,450 | |
| Data
processing | |
| 916 | | |
| 933 | | |
| 882 | | |
| 900 | | |
| 869 | | |
| 2,731 | | |
| 2,577 | |
| Software | |
| 652 | | |
| 645 | | |
| 659 | | |
| 642 | | |
| 612 | | |
| 1,956 | | |
| 1,877 | |
| Debit/ATM
card processing expense | |
| 633 | | |
| 674 | | |
| 577 | | |
| 593 | | |
| 649 | | |
| 1,884 | | |
| 1,844 | |
| Professional
fees | |
| 460 | | |
| 623 | | |
| 546 | | |
| 471 | | |
| 540 | | |
| 1,629 | | |
| 1,690 | |
| FDIC
insurance | |
| 376 | | |
| 399 | | |
| 431 | | |
| 389 | | |
| 338 | | |
| 1,206 | | |
| 1,071 | |
| Advertising | |
| 433 | | |
| 443 | | |
| 429 | | |
| 310 | | |
| 271 | | |
| 1,305 | | |
| 959 | |
| Other | |
| 1,409 | | |
| 1,352 | | |
| 1,348 | | |
| 1,431 | | |
| 1,315 | | |
| 4,109 | | |
| 3,979 | |
| Total
non-interest expense | |
| 15,778 | | |
| 15,656 | | |
| 15,184 | | |
| 14,926 | | |
| 14,406 | | |
| 46,618 | | |
| 43,502 | |
| | |
| | | |
| | | |
| | | |
| | | |
| | | |
| | | |
| | |
| INCOME
BEFORE INCOME TAXES | |
| 4,194 | | |
| 6,012 | | |
| 2,967 | | |
| 4,363 | | |
| 2,522 | | |
| 13,173 | | |
| 10,594 | |
| | |
| | | |
| | | |
| | | |
| | | |
| | | |
| | | |
| | |
| INCOME
TAX PROVISION | |
| 1,027 | | |
| 1,422 | | |
| 664 | | |
| 1,075 | | |
| 618 | | |
| 3,113 | | |
| 2,216 | |
| NET
INCOME | |
$ | 3,167 | | |
$ | 4,590 | | |
$ | 2,303 | | |
$ | 3,288 | | |
$ | 1,904 | | |
$ | 10,060 | | |
$ | 8,378 | |
| | |
| | | |
| | | |
| | | |
| | | |
| | | |
| | | |
| | |
| Basic
earnings per share | |
$ | 0.16 | | |
$ | 0.23 | | |
$ | 0.11 | | |
$ | 0.16 | | |
$ | 0.09 | | |
$ | 0.50 | | |
$ | 0.40 | |
| Weighted
average shares outstanding | |
| 20,110,492 | | |
| 20,210,650 | | |
| 20,385,481 | | |
| 20,561,749 | | |
| 20,804,162 | | |
| 20,234,534 | | |
| 21,013,003 | |
| Diluted
earnings per share | |
$ | 0.16 | | |
$ | 0.23 | | |
$ | 0.11 | | |
$ | 0.16 | | |
$ | 0.09 | | |
$ | 0.50 | | |
$ | 0.40 | |
| Weighted
average diluted shares outstanding | |
| 20,240,975 | | |
| 20,312,881 | | |
| 20,514,098 | | |
| 20,701,276 | | |
| 20,933,833 | | |
| 20,354,977 | | |
| 21,122,208 | |
| | |
| | | |
| | | |
| | | |
| | | |
| | | |
| | | |
| | |
| Other
Data: | |
| | | |
| | | |
| | | |
| | | |
| | | |
| | | |
| | |
| Return
on average assets (1) | |
| 0.46 | % | |
| 0.69 | % | |
| 0.35 | % | |
| 0.49 | % | |
| 0.29 | % | |
| 0.50 | % | |
| 0.44 | % |
| Return
on average equity (1) | |
| 5.20 | % | |
| 7.76 | % | |
| 3.94 | % | |
| 5.48 | % | |
| 3.19 | % | |
| 5.64 | % | |
| 4.74 | % |
| Efficiency
ratio | |
| 74.20 | % | |
| 74.36 | % | |
| 83.00 | % | |
| 80.56 | % | |
| 80.62 | % | |
| 76.91 | % | |
| 80.27 | % |
| Adjusted
efficiency ratio (non-GAAP) (2) | |
| 74.27 | % | |
| 75.32 | % | |
| 82.98 | % | |
| 81.85 | % | |
| 80.67 | % | |
| 77.28 | % | |
| 81.79 | % |
| Net
interest margin | |
| 2.81 | % | |
| 2.80 | % | |
| 2.49 | % | |
| 2.41 | % | |
| 2.40 | % | |
| 2.70 | % | |
| 2.46 | % |
| Net
interest margin, on a fully tax-equivalent basis | |
| 2.83 | % | |
| 2.82 | % | |
| 2.51 | % | |
| 2.43 | % | |
| 2.42 | % | |
| 2.72 | % | |
| 2.48 | % |
| (2) | The adjusted efficiency ratio (non-GAAP) represents the
ratio of operating expenses divided by the sum of net interest and dividend income and non-interest income, excluding realized
and unrealized gains and losses on securities, gain on non-marketable equity investments, and loss on disposal of premises and
equipment. |
WESTERN
NEW ENGLAND BANCORP, INC. AND SUBSIDIARIES
Consolidated
Balance Sheets
(Dollars
in thousands)
(Unaudited)
| | |
September 30, | | |
June 30, | | |
March 31, | | |
December 31, | | |
September 30, | |
| | |
2025 | | |
2025 | | |
2025 | | |
2024 | | |
2024 | |
| Cash and cash equivalents | |
$ | 82,942 | | |
$ | 93,308 | | |
$ | 110,579 | | |
$ | 66,450 | | |
$ | 72,802 | |
| Securities available-for-sale, at fair value | |
| 179,234 | | |
| 178,785 | | |
| 167,800 | | |
| 160,704 | | |
| 155,889 | |
| Securities held to maturity, at amortized cost | |
| 193,446 | | |
| 197,671 | | |
| 201,557 | | |
| 205,036 | | |
| 213,266 | |
| Marketable equity securities, at fair value | |
| 471 | | |
| 444 | | |
| 414 | | |
| 397 | | |
| 252 | |
| Federal Home Loan Bank of Boston and other restricted stock - at cost | |
| 5,818 | | |
| 5,818 | | |
| 5,818 | | |
| 5,818 | | |
| 7,143 | |
| | |
| | | |
| | | |
| | | |
| | | |
| | |
| Loans | |
| 2,131,308 | | |
| 2,092,631 | | |
| 2,079,561 | | |
| 2,070,189 | | |
| 2,049,002 | |
| Allowance for credit losses | |
| (20,542 | ) | |
| (19,733 | ) | |
| (19,669 | ) | |
| (19,529 | ) | |
| (19,955 | ) |
| Net loans | |
| 2,110,766 | | |
| 2,072,898 | | |
| 2,059,892 | | |
| 2,050,660 | | |
| 2,029,047 | |
| | |
| | | |
| | | |
| | | |
| | | |
| | |
| Bank-owned life insurance | |
| 78,527 | | |
| 78,045 | | |
| 77,529 | | |
| 77,056 | | |
| 76,570 | |
| Goodwill | |
| 12,487 | | |
| 12,487 | | |
| 12,487 | | |
| 12,487 | | |
| 12,487 | |
| Core deposit intangible | |
| 1,156 | | |
| 1,250 | | |
| 1,344 | | |
| 1,438 | | |
| 1,531 | |
| Other assets | |
| 70,683 | | |
| 70,443 | | |
| 71,864 | | |
| 73,044 | | |
| 71,492 | |
| TOTAL ASSETS | |
$ | 2,735,530 | | |
$ | 2,711,149 | | |
$ | 2,709,284 | | |
$ | 2,653,090 | | |
$ | 2,640,479 | |
| | |
| | | |
| | | |
| | | |
| | | |
| | |
| Total deposits | |
$ | 2,349,875 | | |
$ | 2,330,113 | | |
$ | 2,328,593 | | |
$ | 2,262,647 | | |
$ | 2,224,206 | |
| Short-term borrowings | |
| 2,980 | | |
| 4,040 | | |
| 4,520 | | |
| 5,390 | | |
| 4,390 | |
| Long-term debt | |
| 98,000 | | |
| 98,000 | | |
| 98,000 | | |
| 98,000 | | |
| 128,277 | |
| Subordinated debt | |
| 19,781 | | |
| 19,771 | | |
| 19,761 | | |
| 19,751 | | |
| 19,741 | |
| Securities pending settlement | |
| — | | |
| — | | |
| 2,093 | | |
| 8,622 | | |
| 2,513 | |
| Other liabilities | |
| 21,254 | | |
| 19,797 | | |
| 18,641 | | |
| 22,770 | | |
| 20,697 | |
| TOTAL LIABILITIES | |
| 2,491,890 | | |
| 2,471,721 | | |
| 2,471,608 | | |
| 2,417,180 | | |
| 2,399,824 | |
| | |
| | | |
| | | |
| | | |
| | | |
| | |
| TOTAL SHAREHOLDERS’ EQUITY | |
| 243,640 | | |
| 239,428 | | |
| 237,676 | | |
| 235,910 | | |
| 240,655 | |
| TOTAL LIABILITIES AND SHAREHOLDERS’ EQUITY | |
$ | 2,735,530 | | |
$ | 2,711,149 | | |
$ | 2,709,284 | | |
$ | 2,653,090 | | |
$ | 2,640,479 | |
WESTERN
NEW ENGLAND BANCORP, INC. AND SUBSIDIARIES
Other
Data
(Dollars
in thousands, except per share data)
(Unaudited)
| | |
Three Months Ended | |
| | |
September 30, | | |
June 30, | | |
March 31, | | |
December 31, | | |
September 30, | |
| | |
2025 | | |
2025 | | |
2025 | | |
2024 | | |
2024 | |
| Shares outstanding at end of period | |
| 20,491,966 | | |
| 20,494,501 | | |
| 20,774,319 | | |
| 20,875,713 | | |
| 21,113,408 | |
| | |
| | | |
| | | |
| | | |
| | | |
| | |
| Operating results: | |
| | | |
| | | |
| | | |
| | | |
| | |
| Net interest income | |
$ | 18,092 | | |
$ | 17,642 | | |
$ | 15,534 | | |
$ | 15,273 | | |
$ | 14,728 | |
| Provision for (reversal of) credit losses | |
| 1,293 | | |
| (615 | ) | |
| 142 | | |
| (762 | ) | |
| 941 | |
| Non-interest income | |
| 3,173 | | |
| 3,411 | | |
| 2,759 | | |
| 3,254 | | |
| 3,141 | |
| Non-interest expense | |
| 15,778 | | |
| 15,656 | | |
| 15,184 | | |
| 14,926 | | |
| 14,406 | |
| Income before income provision for income taxes | |
| 4,194 | | |
| 6,012 | | |
| 2,967 | | |
| 4,363 | | |
| 2,522 | |
| Income tax provision | |
| 1,027 | | |
| 1,422 | | |
| 664 | | |
| 1,075 | | |
| 618 | |
| Net income | |
| 3,167 | | |
| 4,590 | | |
| 2,303 | | |
| 3,288 | | |
| 1,904 | |
| | |
| | | |
| | | |
| | | |
| | | |
| | |
| Performance Ratios: | |
| | | |
| | | |
| | | |
| | | |
| | |
| Net interest margin | |
| 2.81 | % | |
| 2.80 | % | |
| 2.49 | % | |
| 2.41 | % | |
| 2.40 | % |
| Net interest margin, on a fully tax-equivalent basis | |
| 2.83 | % | |
| 2.82 | % | |
| 2.51 | % | |
| 2.43 | % | |
| 2.42 | % |
| Interest rate spread | |
| 2.13 | % | |
| 2.10 | % | |
| 1.74 | % | |
| 1.63 | % | |
| 1.60 | % |
| Interest rate spread, on a fully tax-equivalent basis | |
| 2.14 | % | |
| 2.12 | % | |
| 1.76 | % | |
| 1.65 | % | |
| 1.62 | % |
| Return on average assets | |
| 0.46 | % | |
| 0.69 | % | |
| 0.35 | % | |
| 0.49 | % | |
| 0.29 | % |
| Return on average equity | |
| 5.20 | % | |
| 7.76 | % | |
| 3.94 | % | |
| 5.48 | % | |
| 3.19 | % |
| Efficiency ratio (GAAP) | |
| 74.20 | % | |
| 74.36 | % | |
| 83.00 | % | |
| 80.56 | % | |
| 80.62 | % |
| Adjusted
efficiency ratio (non-GAAP) (1) | |
| 74.27 | % | |
| 75.32 | % | |
| 82.98 | % | |
| 81.85 | % | |
| 80.67 | % |
| | |
| | | |
| | | |
| | | |
| | | |
| | |
| Per Common Share Data: | |
| | | |
| | | |
| | | |
| | | |
| | |
| Basic earnings per share | |
$ | 0.16 | | |
$ | 0.23 | | |
$ | 0.11 | | |
$ | 0.16 | | |
$ | 0.09 | |
| Earnings per diluted share | |
| 0.16 | | |
| 0.23 | | |
| 0.11 | | |
| 0.16 | | |
| 0.09 | |
| Cash dividend declared | |
| 0.07 | | |
| 0.07 | | |
| 0.07 | | |
| 0.07 | | |
| 0.07 | |
| Book value per share | |
| 11.89 | | |
| 11.68 | | |
| 11.44 | | |
| 11.30 | | |
| 11.40 | |
| Tangible
book value per share (non-GAAP) (2) | |
| 11.22 | | |
| 11.01 | | |
| 10.78 | | |
| 10.63 | | |
| 10.73 | |
| | |
| | | |
| | | |
| | | |
| | | |
| | |
| Asset Quality: | |
| | | |
| | | |
| | | |
| | | |
| | |
| 30-89 day delinquent loans | |
$ | 3,123 | | |
$ | 2,525 | | |
$ | 2,459 | | |
$ | 3,694 | | |
$ | 3,059 | |
| 90 days or more delinquent loans | |
| 1,425 | | |
| 1,328 | | |
| 2,027 | | |
| 1,301 | | |
| 1,253 | |
| Total delinquent loans | |
| 4,548 | | |
| 3,853 | | |
| 4,486 | | |
| 4,995 | | |
| 4,312 | |
| Total delinquent loans as a percentage of total loans | |
| 0.21 | % | |
| 0.18 | % | |
| 0.22 | % | |
| 0.24 | % | |
| 0.21 | % |
| Nonaccrual loans | |
$ | 5,649 | | |
$ | 5,752 | | |
$ | 6,014 | | |
$ | 5,381 | | |
$ | 4,873 | |
| Nonaccrual loans as a percentage of total loans | |
| 0.27 | % | |
| 0.27 | % | |
| 0.29 | % | |
| 0.26 | % | |
| 0.24 | % |
| Nonperforming assets as a percentage of total assets | |
| 0.21 | % | |
| 0.21 | % | |
| 0.22 | % | |
| 0.20 | % | |
| 0.18 | % |
| Allowance for credit losses as a percentage of nonaccrual loans | |
| 363.64 | % | |
| 343.06 | % | |
| 327.05 | % | |
| 362.93 | % | |
| 409.50 | % |
| Allowance for credit losses as a percentage of total loans | |
| 0.96 | % | |
| 0.94 | % | |
| 0.95 | % | |
| 0.94 | % | |
| 0.97 | % |
| Net loan charge-offs (recoveries) | |
$ | 43 | | |
$ | (585 | ) | |
$ | 29 | | |
$ | (128 | ) | |
$ | 98 | |
| Net loan charge-offs (recoveries) as a percentage of average loans | |
| 0.00 | % | |
| (0.03 | )% | |
| 0.00 | % | |
| (0.01 | )% | |
| 0.00 | % |
| (1) | The
adjusted efficiency ratio (non-GAAP) represents the ratio of operating expenses divided by the sum of net interest and dividend
income and non-interest income, excluding realized and unrealized gains and losses on securities, gains on non-marketable equity
investments, and loss on disposal of premises and equipment. |
| (2) | Tangible
book value per share (non-GAAP) represents the value of the Company’s tangible assets divided by its current outstanding
shares. |
The
following table sets forth the information relating to our average balances and net interest income for the three months ended
September 30, 2025, June 30, 2025 and September 30, 2024 and reflects the average yield on interest-earning assets and average
cost of interest-bearing liabilities for the periods indicated.
| | |
Three
Months Ended | |
| | |
September
30, 2025 | | |
June
30, 2025 | | |
September
30, 2024 | |
| | |
Average | | |
| | |
Average
Yield/ | | |
Average | | |
| | |
Average
Yield/ | | |
Average | | |
| | |
Average Yield/ | |
| | |
Balance | | |
Interest | | |
Cost(8) | | |
Balance | | |
Interest | | |
Cost(8) | | |
Balance | | |
Interest | | |
Cost(8) | |
| | |
(Dollars
in thousands) | |
| ASSETS: | |
| | |
| | |
| | |
| | |
| | |
| | |
| | |
| | |
| |
| Interest-earning
assets | |
| | | |
| | | |
| | | |
| | | |
| | | |
| | | |
| | | |
| | | |
| | |
| Loans(1)(2) | |
$ | 2,112,394 | | |
$ | 26,810 | | |
| 5.04 | % | |
$ | 2,081,319 | | |
$ | 26,335 | | |
| 5.08 | % | |
$ | 2,038,593 | | |
$ | 25,253 | | |
| 4.93 | % |
| Securities(2) | |
| 374,082 | | |
| 2,617 | | |
| 2.78 | | |
| 375,074 | | |
| 2,588 | | |
| 2.77 | | |
| 354,696 | | |
| 2,121 | | |
| 2.38 | |
| Other
investments | |
| 14,993 | | |
| 166 | | |
| 4.39 | | |
| 15,062 | | |
| 169 | | |
| 4.50 | | |
| 15,904 | | |
| 189 | | |
| 4.73 | |
| Short-term
investments(3) | |
| 52,380 | | |
| 560 | | |
| 4.24 | | |
| 58,622 | | |
| 641 | | |
| 4.39 | | |
| 32,043 | | |
| 396 | | |
| 4.92 | |
| Total
interest-earning assets | |
| 2,553,849 | | |
| 30,153 | | |
| 4.68 | | |
| 2,530,077 | | |
| 29,733 | | |
| 4.71 | | |
| 2,441,236 | | |
| 27,959 | | |
| 4.56 | |
| Total
non-interest-earning assets | |
| 157,127 | | |
| | | |
| | | |
| 156,247 | | |
| | | |
| | | |
| 153,585 | | |
| | | |
| | |
| Total
assets | |
$ | 2,710,976 | | |
| | | |
| | | |
$ | 2,686,324 | | |
| | | |
| | | |
$ | 2,594,821 | | |
| | | |
| | |
| | |
| | | |
| | | |
| | | |
| | | |
| | | |
| | | |
| | | |
| | | |
| | |
| LIABILITIES
AND EQUITY: | |
| | | |
| | | |
| | | |
| | | |
| | | |
| | | |
| | | |
| | | |
| | |
| Interest-bearing
liabilities | |
| | | |
| | | |
| | | |
| | | |
| | | |
| | | |
| | | |
| | | |
| | |
| Interest-bearing
checking accounts | |
$ | 161,171 | | |
| 453 | | |
| 1.12 | | |
$ | 165,329 | | |
| 424 | | |
| 1.03 | | |
$ | 131,133 | | |
| 271 | | |
| 0.82 | |
| Savings
accounts | |
| 187,279 | | |
| 42 | | |
| 0.09 | | |
| 188,498 | | |
| 55 | | |
| 0.12 | | |
| 179,844 | | |
| 38 | | |
| 0.08 | |
| Money
market accounts | |
| 703,084 | | |
| 3,784 | | |
| 2.14 | | |
| 687,621 | | |
| 3,600 | | |
| 2.10 | | |
| 621,340 | | |
| 3,172 | | |
| 2.03 | |
| Time
deposit accounts | |
| 692,742 | | |
| 6,124 | | |
| 3.51 | | |
| 690,555 | | |
| 6,358 | | |
| 3.69 | | |
| 688,797 | | |
| 7,684 | | |
| 4.44 | |
| Total
interest-bearing deposits | |
| 1,744,276 | | |
| 10,403 | | |
| 2.37 | | |
| 1,732,003 | | |
| 10,437 | | |
| 2.42 | | |
| 1,621,114 | | |
| 11,165 | | |
| 2.74 | |
| Borrowings | |
| 121,389 | | |
| 1,538 | | |
| 5.03 | | |
| 122,070 | | |
| 1,533 | | |
| 5.04 | | |
| 153,317 | | |
| 1,947 | | |
| 5.05 | |
| Interest-bearing
liabilities | |
| 1,865,665 | | |
| 11,941 | | |
| 2.54 | | |
| 1,854,073 | | |
| 11,970 | | |
| 2.59 | | |
| 1,774,431 | | |
| 13,112 | | |
| 2.94 | |
| Non-interest-bearing
deposits | |
| 581,835 | | |
| | | |
| | | |
| 572,833 | | |
| | | |
| | | |
| 559,224 | | |
| | | |
| | |
| Other
non-interest-bearing liabilities | |
| 22,014 | | |
| | | |
| | | |
| 22,207 | | |
| | | |
| | | |
| 23,466 | | |
| | | |
| | |
| Total
non-interest-bearing liabilities | |
| 603,849 | | |
| | | |
| | | |
| 595,040 | | |
| | | |
| | | |
| 582,690 | | |
| | | |
| | |
| Total
liabilities | |
| 2,469,514 | | |
| | | |
| | | |
| 2,449,113 | | |
| | | |
| | | |
| 2,357,121 | | |
| | | |
| | |
| Total
equity | |
| 241,462 | | |
| | | |
| | | |
| 237,211 | | |
| | | |
| | | |
| 237,700 | | |
| | | |
| | |
| Total
liabilities and equity | |
$ | 2,710,976 | | |
| | | |
| | | |
$ | 2,686,324 | | |
| | | |
| | | |
$ | 2,594,821 | | |
| | | |
| | |
| Less:
Tax-equivalent adjustment(2) | |
| | | |
| (120 | ) | |
| | | |
| | | |
| (121 | ) | |
| | | |
| | | |
| (119 | ) | |
| | |
| Net
interest and dividend income | |
| | | |
$ | 18,092 | | |
| | | |
| | | |
$ | 17,642 | | |
| | | |
| | | |
$ | 14,728 | | |
| | |
| Net
interest rate spread(4) | |
| | | |
| | | |
| 2.13 | % | |
| | | |
| | | |
| 2.10 | % | |
| | | |
| | | |
| 1.60 | % |
| Net
interest rate spread, on a tax-equivalent basis(5) | |
| | | |
| | | |
| 2.14 | % | |
| | | |
| | | |
| 2.12 | % | |
| | | |
| | | |
| 1.62 | % |
| Net
interest margin(6) | |
| | | |
| | | |
| 2.81 | % | |
| | | |
| | | |
| 2.80 | % | |
| | | |
| | | |
| 2.40 | % |
| Net
interest margin, on a tax-equivalent basis(7) | |
| | | |
| | | |
| 2.83 | % | |
| | | |
| | | |
| 2.82 | % | |
| | | |
| | | |
| 2.42 | % |
| Ratio
of average interest-earning assets
to average interest-bearing liabilities | |
| | | |
| | | |
| 136.89 | % | |
| | | |
| | | |
| 136.46 | % | |
| | | |
| | | |
| 137.58 | % |
The
following tables set forth the information relating to our average balances and net interest income for the nine months ended
September 30, 2025 and 2024 and reflect the average yield on interest-earning assets and average cost of interest-bearing liabilities
for the periods indicated.
| | |
Nine Months Ended September 30, | |
| | |
2025 | | |
2024 | |
| | |
Average
Balance | | |
Interest | | |
Average
Yield/ Cost(8) | | |
Average
Balance | | |
Interest | | |
Average
Yield/ Cost(8) | |
| | |
| | |
| | |
| | |
| | |
| | |
| |
| | |
(Dollars in thousands) | |
| ASSETS: | |
| | |
| | |
| | |
| | |
| | |
| |
| Interest-earning assets | |
| | | |
| | | |
| | | |
| | | |
| | | |
| | |
| Loans(1)(2) | |
$ | 2,089,208 | | |
$ | 78,250 | | |
| 5.01 | % | |
$ | 2,025,858 | | |
$ | 74,058 | | |
| 4.88 | % |
| Securities(2) | |
| 371,541 | | |
| 7,627 | | |
| 2.74 | | |
| 356,340 | | |
| 6,376 | | |
| 2.39 | |
| Other investments | |
| 14,959 | | |
| 526 | | |
| 4.70 | | |
| 14,248 | | |
| 473 | | |
| 4.43 | |
| Short-term investments(3) | |
| 62,260 | | |
| 2,041 | | |
| 4.38 | | |
| 18,634 | | |
| 682 | | |
| 4.89 | |
| Total interest-earning assets | |
| 2,537,968 | | |
| 88,444 | | |
| 4.66 | | |
| 2,415,080 | | |
| 81,589 | | |
| 4.51 | |
| Total non-interest-earning assets | |
| 156,704 | | |
| | | |
| | | |
| 154,894 | | |
| | | |
| | |
| Total assets | |
$ | 2,694,672 | | |
| | | |
| | | |
$ | 2,569,974 | | |
| | | |
| | |
| | |
| | | |
| | | |
| | | |
| | | |
| | | |
| | |
| LIABILITIES AND EQUITY: | |
| | | |
| | | |
| | | |
| | | |
| | | |
| | |
| Interest-bearing liabilities | |
| | | |
| | | |
| | | |
| | | |
| | | |
| | |
| Interest-bearing checking accounts | |
$ | 155,894 | | |
| 1,127 | | |
| 0.97 | % | |
$ | 132,708 | | |
| 759 | | |
| 0.76 | % |
| Savings accounts | |
| 186,561 | | |
| 137 | | |
| 0.10 | | |
| 183,872 | | |
| 128 | | |
| 0.09 | |
| Money market accounts | |
| 698,302 | | |
| 11,352 | | |
| 2.17 | | |
| 623,216 | | |
| 8,689 | | |
| 1.86 | |
| Time deposit accounts | |
| 695,312 | | |
| 19,600 | | |
| 3.77 | | |
| 655,700 | | |
| 21,217 | | |
| 4.32 | |
| Total interest-bearing deposits | |
| 1,736,069 | | |
| 32,216 | | |
| 2.48 | | |
| 1,595,496 | | |
| 30,793 | | |
| 2.58 | |
| Short-term borrowings and long-term debt | |
| 122,076 | | |
| 4,598 | | |
| 5.04 | | |
| 158,183 | | |
| 5,909 | | |
| 4.99 | |
| Total interest-bearing liabilities | |
| 1,858,145 | | |
| 36,814 | | |
| 2.65 | | |
| 1,753,679 | | |
| 36,702 | | |
| 2.80 | |
| Non-interest-bearing deposits | |
| 574,814 | | |
| | | |
| | | |
| 555,253 | | |
| | | |
| | |
| Other non-interest-bearing liabilities | |
| 23,216 | | |
| | | |
| | | |
| 24,931 | | |
| | | |
| | |
| Total non-interest-bearing liabilities | |
| 598,030 | | |
| | | |
| | | |
| 580,184 | | |
| | | |
| | |
| | |
| | | |
| | | |
| | | |
| | | |
| | | |
| | |
| Total liabilities | |
| 2,456,175 | | |
| | | |
| | | |
| 2,333,863 | | |
| | | |
| | |
| Total equity | |
| 238,497 | | |
| | | |
| | | |
| 236,111 | | |
| | | |
| | |
| Total liabilities and equity | |
$ | 2,694,672 | | |
| | | |
| | | |
$ | 2,569,974 | | |
| | | |
| | |
| Less: Tax-equivalent adjustment (2) | |
| | | |
| (362 | ) | |
| | | |
| | | |
| (343 | ) | |
| | |
| Net interest and dividend income | |
| | | |
$ | 51,268 | | |
| | | |
| | | |
$ | 44,544 | | |
| | |
| Net interest rate spread (4) | |
| | | |
| | | |
| 1.99 | % | |
| | | |
| | | |
| 1.70 | % |
| Net interest rate spread, on a tax-equivalent basis (5) | |
| | | |
| | | |
| 2.01 | % | |
| | | |
| | | |
| 1.71 | % |
| Net interest margin (6) | |
| | | |
| | | |
| 2.70 | % | |
| | | |
| | | |
| 2.46 | % |
| Net interest margin, on a tax-equivalent basis (7) | |
| | | |
| | | |
| 2.72 | % | |
| | | |
| | | |
| 2.48 | % |
| Ratio of average interest-earning | |
| | | |
| | | |
| | | |
| | | |
| | | |
| | |
| assets to average interest-bearing liabilities | |
| | | |
| | | |
| 136.59 | % | |
| | | |
| | | |
| 137.72 | % |
| (1) | Loans,
including nonaccrual loans, are net of deferred loan origination costs and unadvanced funds. |
| (2) | Loan
and securities income are presented on a tax-equivalent basis using a tax rate of 21%. The tax-equivalent adjustment is deducted
from tax-equivalent net interest and dividend income to agree to the amount reported on the consolidated statements of net income. |
| (3) | Short-term
investments include federal funds sold. |
| (4) | Net
interest rate spread represents the difference between the weighted average yield on interest-earning assets and the weighted
average cost of interest-bearing liabilities. |
| (5) | Net
interest rate spread, on a tax-equivalent basis, represents the difference between the tax-equivalent weighted average yield on
interest-earning assets and the weighted average cost of interest-bearing liabilities. |
| (6) | Net
interest margin represents net interest and dividend income as a percentage of average interest-earning assets. |
| (7) | Net
interest margin, on a tax-equivalent basis, represents tax-equivalent net interest and dividend income as a percentage of average
interest-earning assets. |
Reconciliation
of Non-GAAP to GAAP Financial Measures
The
Company believes that certain non-GAAP financial measures provide information to investors that is useful in understanding its
results of operations and financial condition. Because not all companies use the same calculation, this presentation may
not be comparable to other similarly titled measures calculated by other companies. A reconciliation of these non-GAAP financial
measures is provided below.
| | |
For the quarter ended | |
| | |
9/30/2025 | | |
6/30/2025 | | |
3/31/2025 | | |
12/31/2024 | | |
9/30/2024 | |
| | |
(Dollars in thousands) | |
| | |
| | |
| | |
| | |
| | |
| |
| Loan interest (no tax adjustment) | |
$ | 26,690 | | |
$ | 26,214 | | |
$ | 24,984 | | |
$ | 25,183 | | |
$ | 25,134 | |
| Tax-equivalent adjustment | |
| 120 | | |
| 121 | | |
| 121 | | |
| 128 | | |
| 119 | |
| Loan interest (tax-equivalent basis) | |
$ | 26,810 | | |
$ | 26,335 | | |
$ | 25,105 | | |
$ | 25,311 | | |
$ | 25,253 | |
| | |
| | | |
| | | |
| | | |
| | | |
| | |
| Loan interest (tax-equivalent basis) | |
$ | 26,810 | | |
$ | 26,335 | | |
$ | 25,105 | | |
$ | 25,311 | | |
$ | 25,253 | |
| Less: | |
| | | |
| | | |
| | | |
| | | |
| | |
| Prepayment penalties and fees | |
| 34 | | |
| 425 | | |
| — | | |
| — | | |
| — | |
| Adjusted loan income, excluding prepayment penalties (tax-equivalent basis) (non-GAAP) | |
$ | 26,776 | | |
$ | 25,910 | | |
$ | 25,105 | | |
$ | 25,311 | | |
$ | 25,253 | |
| | |
| | | |
| | | |
| | | |
| | | |
| | |
| Average loans | |
$ | 2,112,394 | | |
$ | 2,081,319 | | |
$ | 2,073,486 | | |
$ | 2,062,822 | | |
$ | 2,038,593 | |
| Average loan yield (no tax adjustment) | |
| 5.01 | % | |
| 5.05 | % | |
| 4.89 | % | |
| 4.86 | % | |
| 4.90 | % |
| Average loan yield (no tax adjustment), excluding prepayment penalties (non-GAAP) | |
| 5.01 | % | |
| 4.97 | % | |
| 4.89 | % | |
| 4.86 | % | |
| 4.90 | % |
| Average loan yield (tax-equivalent) | |
| 5.04 | % | |
| 5.08 | % | |
| 4.91 | % | |
| 4.88 | % | |
| 4.93 | % |
| Average loan yield (tax-equivalent basis), excluding prepayment penalties (non-GAAP) | |
| 5.03 | % | |
| 4.99 | % | |
| 4.91 | % | |
| 4.88 | % | |
| 4.93 | % |
| | |
| | | |
| | | |
| | | |
| | | |
| | |
| Net interest income (no tax adjustment) | |
$ | 18,092 | | |
$ | 17,642 | | |
$ | 15,534 | | |
$ | 15,273 | | |
$ | 14,728 | |
| Tax equivalent adjustment | |
| 120 | | |
| 121 | | |
| 121 | | |
| 128 | | |
| 119 | |
| Net interest income (tax-equivalent basis) | |
$ | 18,212 | | |
$ | 17,763 | | |
$ | 15,655 | | |
$ | 15,401 | | |
$ | 14,847 | |
| | |
| | | |
| | | |
| | | |
| | | |
| | |
| Net interest income (no tax adjustment) | |
$ | 18,092 | | |
$ | 17,642 | | |
$ | 15,534 | | |
$ | 15,273 | | |
$ | 14,728 | |
| Less: | |
| | | |
| | | |
| | | |
| | | |
| | |
| Prepayment penalties | |
| 34 | | |
| 425 | | |
| — | | |
| — | | |
| — | |
| Income from fair value hedge | |
| — | | |
| — | | |
| — | | |
| 74 | | |
| 434 | |
| Adjusted net interest income (non-GAAP) | |
$ | 18,058 | | |
$ | 17,217 | | |
$ | 15,534 | | |
$ | 15,199 | | |
$ | 14,294 | |
| | |
| | | |
| | | |
| | | |
| | | |
| | |
| Average interest-earning assets | |
$ | 2,553,849 | | |
$ | 2,530,077 | | |
$ | 2,529,715 | | |
$ | 2,517,017 | | |
$ | 2,441,236 | |
| Net interest margin (no tax adjustment) | |
| 2.81 | % | |
| 2.80 | % | |
| 2.49 | % | |
| 2.41 | % | |
| 2.40 | % |
| Net interest margin (tax-equivalent basis) | |
| 2.83 | % | |
| 2.82 | % | |
| 2.51 | % | |
| 2.43 | % | |
| 2.42 | % |
| Adjusted net interest margin, excluding prepayment penalties and income from fair value hedge (no tax adjustment) (non-GAAP) | |
| 2.81 | % | |
| 2.73 | % | |
| 2.49 | % | |
| 2.40 | % | |
| 2.33 | % |
| | |
For the quarter ended | |
| | |
9/30/2025 | | |
6/30/2025 | | |
3/31/2025 | | |
12/31/2024 | | |
09/30/2024 | |
| | |
(Dollars in thousands, except per share data) | |
| | |
| |
| Book Value per Share (GAAP) | |
$ | 11.89 | | |
$ | 11.68 | | |
$ | 11.44 | | |
$ | 11.30 | | |
$ | 11.40 | |
| Non-GAAP adjustments: | |
| | | |
| | | |
| | | |
| | | |
| | |
| Goodwill | |
| (0.61 | ) | |
| (0.61 | ) | |
| (0.60 | ) | |
| (0.60 | ) | |
| (0.59 | ) |
| Core deposit intangible | |
| (0.06 | ) | |
| (0.06 | ) | |
| (0.06 | ) | |
| (0.07 | ) | |
| (0.08 | ) |
| Tangible Book Value per Share (non-GAAP) | |
$ | 11.22 | | |
$ | 11.01 | | |
$ | 10.78 | | |
$ | 10.63 | | |
$ | 10.73 | |
| | |
| | | |
| | | |
| | | |
| | | |
| | |
| Efficiency Ratio: | |
| | | |
| | | |
| | | |
| | | |
| | |
| Non-interest Expense (GAAP) | |
$ | 15,778 | | |
$ | 15,656 | | |
$ | 15,184 | | |
$ | 14,926 | | |
$ | 14,406 | |
| | |
| | | |
| | | |
| | | |
| | | |
| | |
| Net Interest Income (GAAP) | |
$ | 18,092 | | |
$ | 17,642 | | |
$ | 15,534 | | |
$ | 15,273 | | |
$ | 14,728 | |
| | |
| | | |
| | | |
| | | |
| | | |
| | |
| Non-interest Income (GAAP) | |
$ | 3,173 | | |
$ | 3,411 | | |
$ | 2,759 | | |
$ | 3,254 | | |
$ | 3,141 | |
| Non-GAAP adjustments: | |
| | | |
| | | |
| | | |
| | | |
| | |
| Unrealized (gains) losses on marketable equity securities | |
| (22 | ) | |
| (25 | ) | |
| 5 | | |
| 9 | | |
| (10 | ) |
| Gain on non-marketable equity investments | |
| — | | |
| (243 | ) | |
| — | | |
| (300 | ) | |
| — | |
| Non-interest Income for Adjusted Efficiency Ratio (non-GAAP) | |
$ | 3,151 | | |
$ | 3,143 | | |
$ | 2,764 | | |
$ | 2,963 | | |
$ | 3,131 | |
| Total Revenue for Adjusted Efficiency Ratio (non-GAAP) | |
$ | 21,243 | | |
$ | 20,785 | | |
$ | 18,298 | | |
$ | 18,236 | | |
$ | 17,859 | |
| | |
| | | |
| | | |
| | | |
| | | |
| | |
| Efficiency Ratio (GAAP) | |
| 74.20 | % | |
| 74.36 | % | |
| 83.00 | % | |
| 80.56 | % | |
| 80.62 | % |
| | |
| | | |
| | | |
| | | |
| | | |
| | |
| Adjusted Efficiency Ratio (Non-interest Expense (GAAP)/Total Revenue for Adjusted Efficiency Ratio (non-GAAP)) | |
| 74.27 | % | |
| 75.32 | % | |
| 82.98 | % | |
| 81.85 | % | |
| 80.67 | % |
| | |
For the nine months ended | |
| | |
9/30/2025 | | |
9/30/2024 | |
| | |
(Dollars in thousands) | |
| | |
| | |
| |
| Loan income (no tax adjustment) | |
$ | 77,888 | | |
$ | 73,715 | |
| Tax-equivalent adjustment | |
| 362 | | |
| 343 | |
| Loan income (tax-equivalent basis) | |
$ | 78,250 | | |
$ | 74,058 | |
| | |
| | | |
| | |
| Net interest income (no tax adjustment) | |
$ | 51,268 | | |
$ | 44,544 | |
| Tax equivalent adjustment | |
| 362 | | |
| 343 | |
| Net interest income (tax-equivalent basis) | |
$ | 51,630 | | |
$ | 44,887 | |
| | |
| | | |
| | |
| Net interest income (no tax adjustment) | |
$ | 51,268 | | |
$ | 44,544 | |
| Less: | |
| | | |
| | |
| Prepayment penalties | |
| 459 | | |
| 8 | |
| Income from fair value hedge | |
| — | | |
| 1,324 | |
| Adjusted net interest income (non-GAAP) | |
$ | 50,809 | | |
$ | 43,212 | |
| | |
| | | |
| | |
| Average interest-earning assets | |
$ | 2,537,968 | | |
$ | 2,415,080 | |
| Net interest margin (no tax adjustment) | |
| 2.70 | % | |
| 2.46 | % |
| Net interest margin (tax-equivalent basis) | |
| 2.72 | % | |
| 2.48 | % |
| Adjusted net interest margin, excluding prepayment penalties and income from fair value hedge (no tax adjustment) (non-GAAP) | |
| 2.68 | % | |
| 2.39 | % |
| | |
| | | |
| | |
| Adjusted Efficiency Ratio: | |
| | | |
| | |
| Non-interest Expense (GAAP) | |
$ | 46,618 | | |
$ | 43,502 | |
| | |
| | | |
| | |
| Net Interest Income (GAAP) | |
$ | 51,268 | | |
$ | 44,544 | |
| | |
| | | |
| | |
| Non-interest Income (GAAP) | |
$ | 9,343 | | |
$ | 9,649 | |
| Non-GAAP adjustments: | |
| | | |
| | |
| Unrealized gains on marketable equity securities | |
| (42 | ) | |
| (22 | ) |
| Loss on disposal of premises and equipment, net | |
| — | | |
| 6 | |
| Gain on non-marketable equity investments | |
| (243 | ) | |
| (987 | ) |
| Non-interest Income for Adjusted Efficiency Ratio (non-GAAP) | |
$ | 9,058 | | |
$ | 8,646 | |
| Total Revenue for Adjusted Efficiency Ratio (non-GAAP) | |
$ | 60,326 | | |
$ | 53,190 | |
| | |
| | | |
| | |
| Efficiency Ratio (GAAP) | |
| 76.91 | % | |
| 80.27 | % |
| | |
| | | |
| | |
| Adjusted Efficiency Ratio (Non-interest Expense (GAAP)/Total Revenue for Adjusted Efficiency Ratio (non-GAAP)) | |
| 77.28 | % | |
| 81.79 | % |
Western New England Bancorp, Inc. 8-K
Exhibit 99.2

Local banking is better than ever. INVESTOR PRESENTATION 3RD QUARTER 2025
FORWARD - LOOKING STATEMENTS 2 We may, from time to time, make written or oral “forward - looking statements” within the meaning of the Private Securities Litigation Reform Act of 1995 , including statements contained in our filings with the Securities and Exchange Commission (the “SEC”), our reports to shareholders and in other communications by us . This Investor Presentation contains “forward - looking statements” with respect to the Company’s financial condition, liquidity, results of operations, future performance, and business . Forward - looking statements may be identified by the use of such words as “believe,” “expect,” “anticipate,” “should,” “planned,” “estimated,” and “potential . ” Examples of forward - looking statements include, but are not limited to, estimates with respect to our financial condition, results of operations and business that are subject to various factors which could cause actual results to differ materially from these estimates . These factors include, but are not limited to : unpredictable changes in general economic or political conditions, financial markets, fiscal, monetary and regulatory policies, including actual or potential stress in the banking industry ; unstable political and economic conditions, including changes in tariff policies, which could materially impact credit quality trends and the ability to generate loans and gather deposits ; inflation and governmental responses to inflation, including recent sustained increases and potential future increases in interest rates that reduce margins ; the effect on our operations of governmental legislation and regulation, including changes in accounting regulation or standards, the nature and timing of the adoption and effectiveness of new requirements under the Dodd - Frank Wall Street Reform and Consumer Protection Act of 2010 , Basel guidelines, capital requirements and other applicable laws and regulations ; significant changes in accounting, tax or regulatory practices or requirements ; new legal obligations or liabilities or unfavorable resolutions of litigation ; disruptive technologies in payment systems and other services traditionally provided by banks ; the highly competitive industry and market area in which we operate ; operational risks or risk management failures by us or critical third parties, including without limitation with respect to data processing, information systems, cybersecurity, technological changes, vendor issues, business interruption, and fraud risks ;
FORWARD - LOOKING STATEMENTS 3 failure or circumvention of our internal controls or procedures ; changes in the securities markets which affect investment management revenues ; increases in Federal Deposit Insurance Corporation deposit insurance premiums and assessments ; the soundness of other financial services institutions which may adversely affect our credit risk ; certain of our intangible assets may become impaired in the future ; the duration and scope of potential pandemics, including the emergence of new variants and the response thereto ; new lines of business or new products and services, which may subject us to additional risks ; changes in key management personnel which may adversely impact our operations ; severe weather, natural disasters, acts of war or terrorism and other external events which could significantly impact our business ; and other risk factors detailed from time to time in our SEC filings . Although we believe that the expectations reflected in such forward - looking statements are reasonable, actual results may differ materially from the results discussed in these forward - looking statements. You are cautioned not to place undue reliance on the se forward - looking statements, which speak only as of the date hereof. We do not undertake any obligation to republish revised for ward - looking statements to reflect events or circumstances after the date hereof or to reflect the occurrence of unanticipated events, except to the extent required by law.
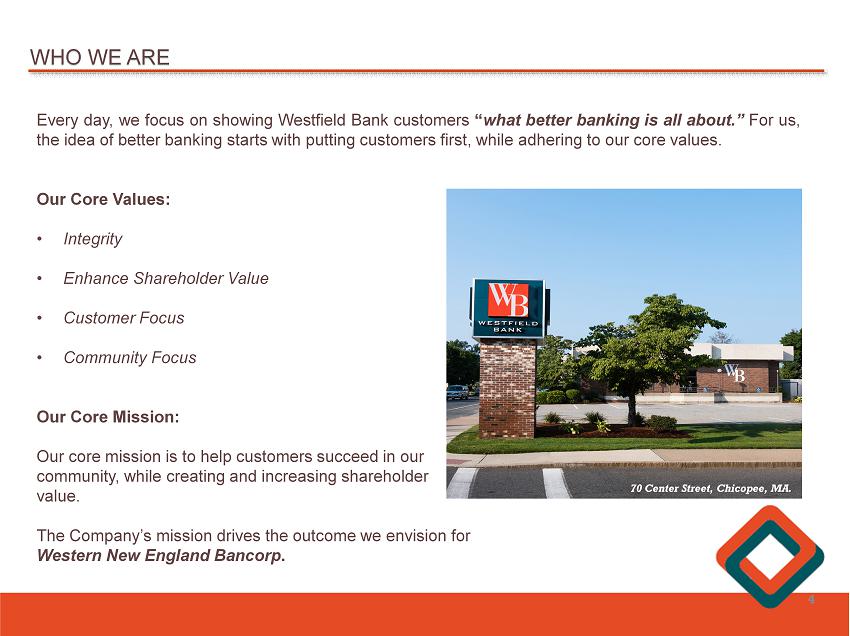
WHO WE ARE Every day, we focus on showing Westfield Bank customers “ what better banking is all about . ” For us, the idea of better banking starts with putting customers first, while adhering to our core values . Our Core Values : • Integrity • Enhance Shareholder Value • Customer Focus • Community Focus Our Core Mission : Our core mission is to help customers succeed in our community, while creating and increasing shareholder value . The Company’s mission drives the outcome we envision for Western New England Bancorp . 4 70 Center Street, Chicopee, MA.

SENIOR MANAGEMENT TEAM James C . Hagan, President & Chief Executive Officer Guida R . Sajdak, Executive Vice President, Chief Financial Officer & Treasurer Allen J . Miles III, Executive Vice President & Chief Lending Officer Kevin C . O’Connor, Executive Vice President & Chief Operating Officer John E . Bonini , Senior Vice President & General Counsel Filipe Goncalves, Senior Vice President & Chief Credit Officer Darlene Libiszewski , Senior Vice President & Chief Information Officer Christine Phillips , Senior Vice President, Chief Human Resources Officer Leo R . Sagan, Jr . , Senior Vice President & Chief Risk Officer 5
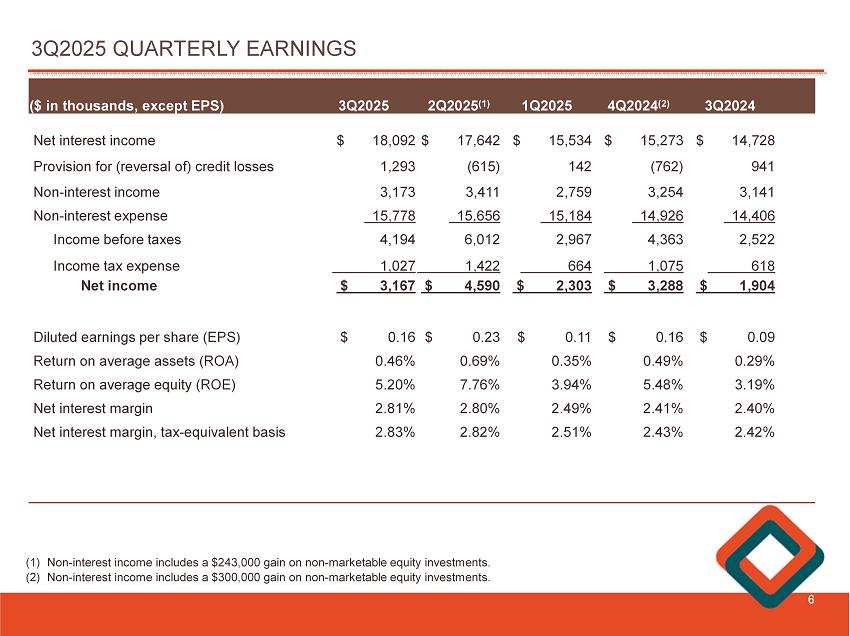
3Q2025 QUARTERLY EARNINGS 6 3Q2024 4Q2024 (2) 1Q2025 2Q2025 (1) 3Q2025 ($ in thousands, except EPS) $ 14,728 $ 15,273 $ 15,534 $ 17,642 $ 18,092 Net interest income 941 (762) 142 (615) 1,293 Provision for (reversal of) credit losses 3,141 3,254 2,759 3,411 3,173 Non - interest income 14,406 14,926 15,184 15,656 15,778 Non - interest expense 2,522 4,363 2,967 6,012 4,194 Income before taxes 618 1,075 664 1,422 1,027 Income tax expense $ 1,904 $ 3,288 $ 2,303 $ 4,590 $ 3,167 Net income $ 0.09 $ 0.16 $ 0.11 $ 0.23 $ 0.16 Diluted earnings per share (EPS) 0.29% 0.49% 0.35% 0.69% 0.46% Return on average assets (ROA) 3.19% 5.48% 3.94% 7.76% 5.20% Return on average equity (ROE) 2.40% 2.41% 2.49% 2.80% 2.81% Net interest margin 2.42% 2.43% 2.51% 2.82% 2.83% Net interest margin, tax - equivalent basis (1) Non - interest income includes a $243,000 gain on non - marketable equity investments. (2) Non - interest income includes a $300,000 gain on non - marketable equity investments.
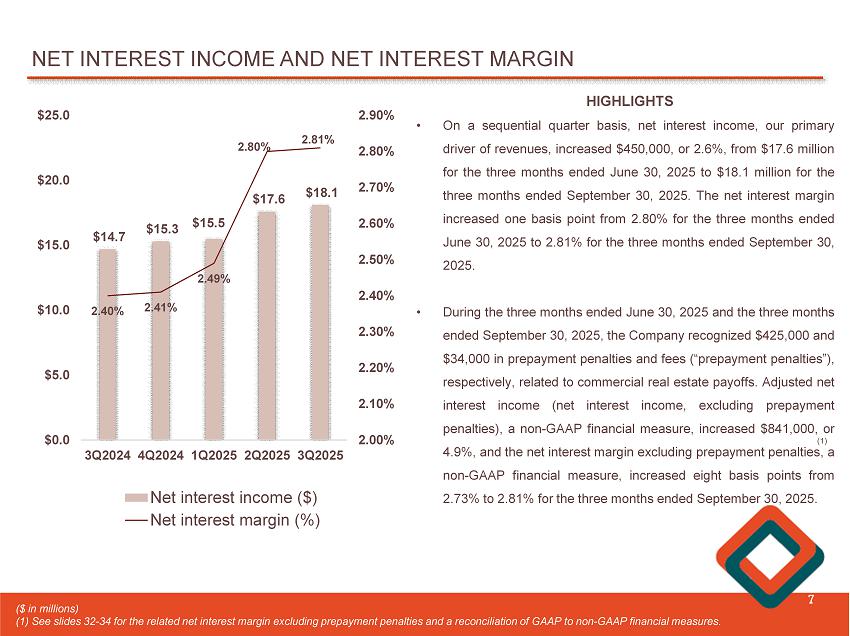
NET INTEREST INCOME AND NET INTEREST MARGIN 7 $14.7 $15.3 $15.5 $17.6 $18.1 2.40% 2.41% 2.49% 2.80% 2.81% 2.00% 2.10% 2.20% 2.30% 2.40% 2.50% 2.60% 2.70% 2.80% 2.90% 3Q2024 4Q2024 1Q2025 2Q2025 3Q2025 $0.0 $5.0 $10.0 $15.0 $20.0 $25.0 Net interest income ($) Net interest margin (%) ($ in millions) (1) See slides 32 - 34 for the related net interest margin excluding prepayment penalties and a reconciliation of GAAP to non - GAAP financial measures. HIGHLIGHTS • On a sequential quarter basis, net interest income, our primary driver of revenues, increased $ 450 , 000 , or 2 . 6 % , from $ 17 . 6 million for the three months ended June 30 , 2025 to $ 18 . 1 million for the three months ended September 30 , 2025 . The net interest margin increased one basis point from 2 . 80 % for the three months ended June 30 , 2025 to 2 . 81 % for the three months ended September 30 , 2025 . • During the three months ended June 30 , 2025 and the three months ended September 30 , 2025 , the Company recognized $ 425 , 000 and $ 34 , 000 in prepayment penalties and fees (“prepayment penalties”), respectively, related to commercial real estate payoffs . Adjusted net interest income (net interest income, excluding prepayment penalties), a non - GAAP financial measure, increased $ 841 , 000 , or 4 . 9 % , and the net interest margin excluding prepayment penalties, a non - GAAP financial measure, increased eight basis points from 2 . 73 % to 2 . 81 % for the three months ended September 30 , 2025 . (1)
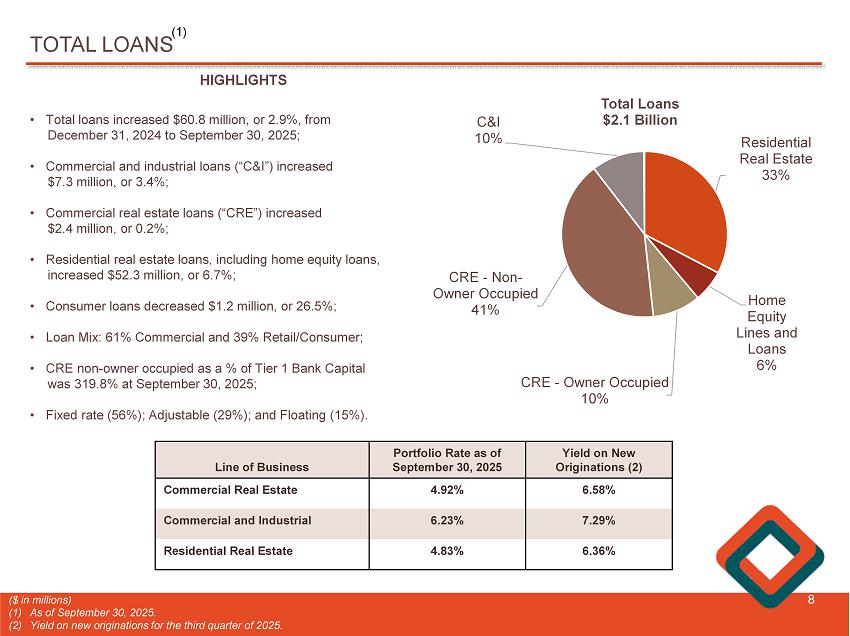
TOTAL LOANS 8 Residential Real Estate 33% Home Equity Lines and Loans 6% CRE - Owner Occupied 10% CRE - Non - Owner Occupied 41% C&I 10% Total Loans $2.1 Billion HIGHLIGHTS • Total loans increased $ 60 . 8 million, or 2 . 9 % , from December 31 , 2024 to September 30 , 2025 ; • Commercial and industrial loans (“C&I”) increased $ 7 . 3 million, or 3 . 4 % ; • Commercial real estate loans (“CRE”) increased $ 2 . 4 million, or 0 . 2 % ; • Residential real estate loans, including home equity loans, increased $ 52 . 3 million, or 6 . 7 % ; • Consumer loans decreased $ 1 . 2 million, or 26 . 5 % ; • Loan Mix : 61 % Commercial and 39 % Retail/Consumer ; • CRE non - owner occupied as a % of Tier 1 Bank Capital was 319 . 8 % at September 30 , 2025 ; • Fixed rate ( 56 % ) ; Adjustable ( 29 % ) ; and Floating ( 15 % ) . Yield on New Originations (2) Portfolio Rate as of September 30, 2025 Line of Business 6.58% 4.92% Commercial Real Estate 7.29% 6.23% Commercial and Industrial 6.36% 4.83% Residential Real Estate ($ in millions) (1) As of September 30, 2025. (2) Yield on new originations for the third quarter of 2025. (1)
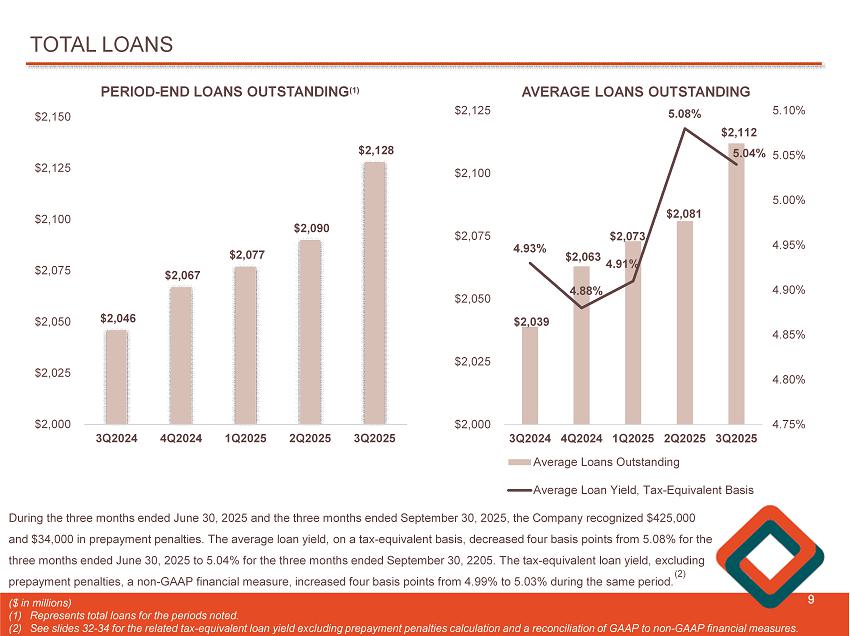
TOTAL LOANS 9 $2,039 $2,063 $2,073 $2,081 $2,112 4.93% 4.88% 4.91% 5.08% 5.04% 4.75% 4.80% 4.85% 4.90% 4.95% 5.00% 5.05% 5.10% 3Q2024 4Q2024 1Q2025 2Q2025 3Q2025 $2,000 $2,025 $2,050 $2,075 $2,100 $2,125 AVERAGE LOANS OUTSTANDING Average Loans Outstanding Average Loan Yield, Tax-Equivalent Basis ($ in millions) (1) Represents total loans for the periods noted. (2) See slides 32 - 34 for the related tax - equivalent loan yield excluding prepayment penalties calculation and a reconciliation of GA AP to non - GAAP financial measures. $2,046 $2,067 $2,077 $2,090 $2,128 3Q2024 4Q2024 1Q2025 2Q2025 3Q2025 $2,000 $2,025 $2,050 $2,075 $2,100 $2,125 $2,150 PERIOD - END LOANS OUTSTANDING (1) During the three months ended June 30, 2025 and the three months ended September 30, 2025, the Company recognized $425,000 and $34,000 in prepayment penalties. The average loan yield, on a tax - equivalent basis, decreased four basis points from 5.08% f or the three months ended June 30, 2025 to 5.04% for the three months ended September 30, 2205. The tax - equivalent loan yield, excludin g prepayment penalties, a non - GAAP financial measure, increased four basis points from 4.99% to 5.03% during the same period. (2)
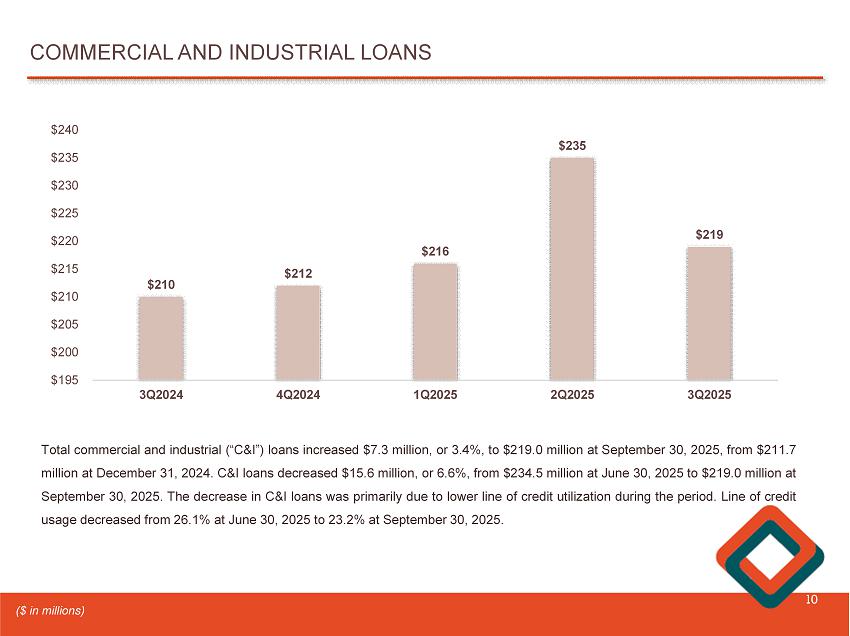
COMMERCIAL AND INDUSTRIAL LOANS 10 $210 $212 $216 $235 $219 3Q2024 4Q2024 1Q2025 2Q2025 3Q2025 $195 $200 $205 $210 $215 $220 $225 $230 $235 $240 Total commercial and industrial (“C&I”) loans increased $ 7 . 3 million, or 3 . 4 % , to $ 219 . 0 million at September 30 , 2025 , from $ 211 . 7 million at December 31 , 2024 . C&I loans decreased $ 15 . 6 million, or 6 . 6 % , from $ 234 . 5 million at June 30 , 2025 to $ 219 . 0 million at September 30 , 2025 . The decrease in C&I loans was primarily due to lower line of credit utilization during the period . Line of credit usage decreased from 26 . 1 % at June 30 , 2025 to 23 . 2 % at September 30 , 2025 . ($ in millions)
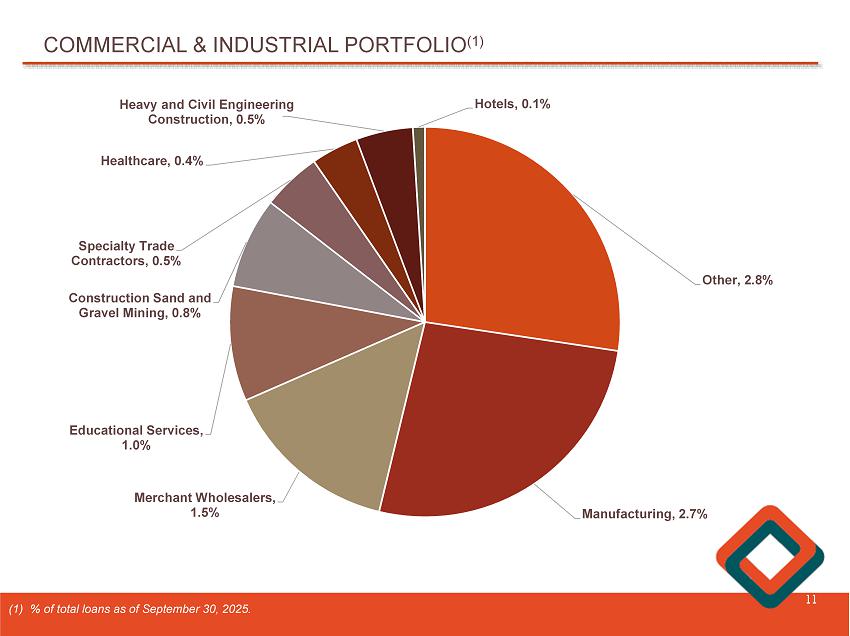
COMMERCIAL & INDUSTRIAL PORTFOLIO (1) 11 (1) % of total loans as of September 30, 2025. Other , 2.8% Manufacturing , 2.7% Merchant Wholesalers , 1.5% Educational Services , 1.0% Construction Sand and Gravel Mining , 0.8% Specialty Trade Contractors , 0.5% Healthcare , 0.4% Heavy and Civil Engineering Construction , 0.5% Hotels , 0.1%
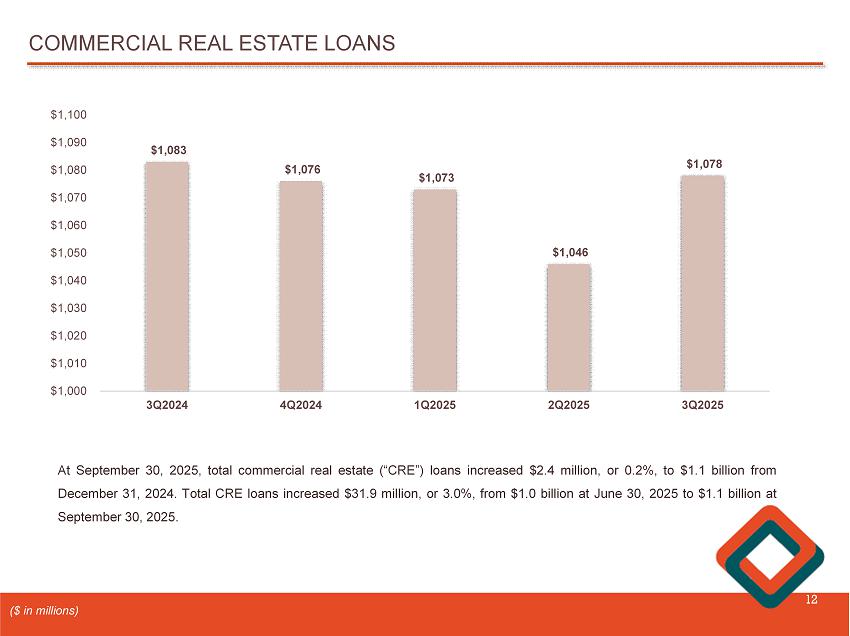
COMMERCIAL REAL ESTATE LOANS 12 $1,083 $1,076 $1,073 $1,046 $1,078 3Q2024 4Q2024 1Q2025 2Q2025 3Q2025 $1,000 $1,010 $1,020 $1,030 $1,040 $1,050 $1,060 $1,070 $1,080 $1,090 $1,100 At September 30 , 2025 , total commercial real estate (“CRE”) loans increased $ 2 . 4 million, or 0 . 2 % , to $ 1 . 1 billion from December 31 , 2024 . Total CRE loans increased $ 31 . 9 million, or 3 . 0 % , from $ 1 . 0 billion at June 30 , 2025 to $ 1 . 1 billion at September 30 , 2025 . ($ in millions)
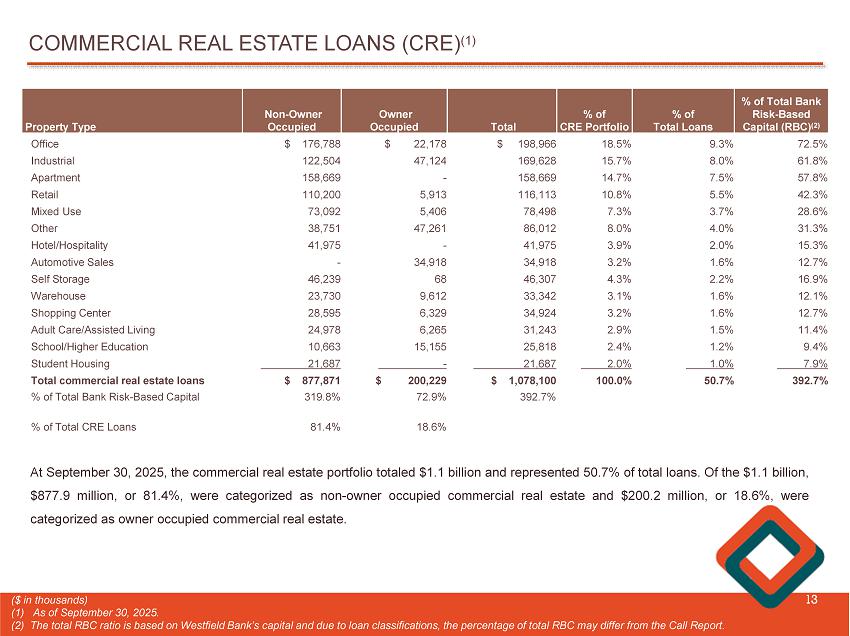
COMMERCIAL REAL ESTATE LOANS (CRE) (1) 13 ($ in thousands) (1) As of September 30, 2025. (2) The total RBC ratio is based on Westfield Bank’s capital and due to loan classifications, the percentage of total RBC ma y d iffer from the Call Report. At September 30 , 2025 , the commercial real estate portfolio totaled $ 1 . 1 billion and represented 50 . 7 % of total loans . Of the $ 1 . 1 billion, $ 877 . 9 million, or 81 . 4 % , were categorized as non - owner occupied commercial real estate and $ 200 . 2 million, or 18 . 6 % , were categorized as owner occupied commercial real estate . % of Total Bank Risk - Based Capital (RBC) (2) % of Total Loans % of CRE Portfolio Total Owner Occupied Non - Owner Occupied Property Type 72.5% 9.3% 18.5% $ 198,966 $ 22,178 $ 176,788 Office 61.8% 8.0% 15.7% 169,628 47,124 122,504 Industrial 57.8% 7.5% 14.7% 158,669 - 158,669 Apartment 42.3% 5.5% 10.8% 116,113 5,913 110,200 Retail 28.6% 3.7% 7.3% 78,498 5,406 73,092 Mixed Use 31.3% 4.0% 8.0% 86,012 47,261 38,751 Other 15.3% 2.0% 3.9% 41,975 - 41,975 Hotel/Hospitality 12.7% 1.6% 3.2% 34,918 34,918 - Automotive Sales 16.9% 2.2% 4.3% 46,307 68 46,239 Self Storage 12.1% 1.6% 3.1% 33,342 9,612 23,730 Warehouse 12.7% 1.6% 3.2% 34,924 6,329 28,595 Shopping Center 11.4% 1.5% 2.9% 31,243 6,265 24,978 Adult Care/Assisted Living 9.4% 1.2% 2.4% 25,818 15,155 10,663 School/Higher Education 7.9% 1.0% 2.0% 21,687 - 21,687 Student Housing 392.7% 50.7% 100.0% $ 1,078,100 $ 200,229 $ 877,871 Total commercial real estate loans 392.7% 72.9% 319.8% % of Total Bank Risk - Based Capital 18.6% 81.4% % of Total CRE Loans
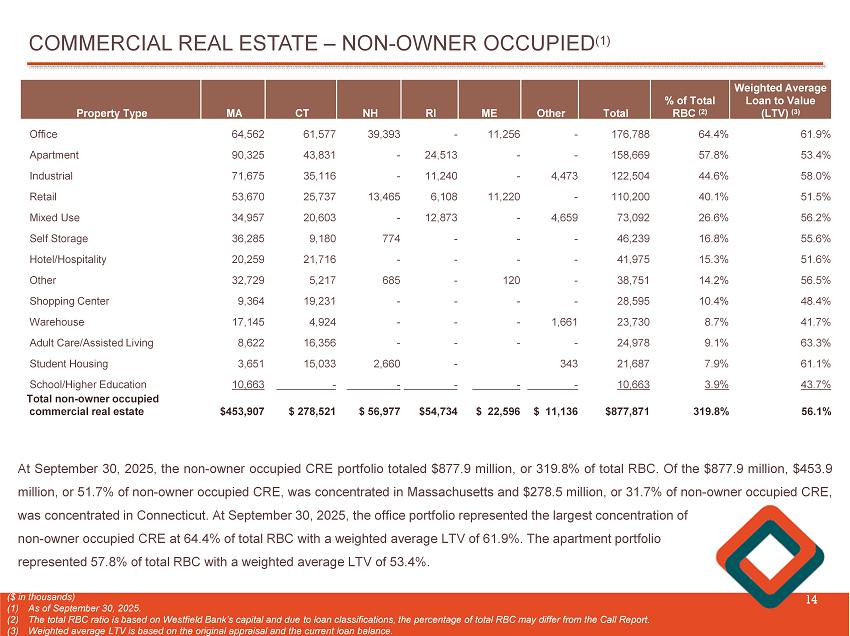
COMMERCIAL REAL ESTATE – NON - OWNER OCCUPIED (1) 14 At September 30 , 2025 , the non - owner occupied CRE portfolio totaled $ 877 . 9 million, or 319 . 8 % of total RBC . Of the $ 877 . 9 million, $ 453 . 9 million, or 51 . 7 % of non - owner occupied CRE, was concentrated in Massachusetts and $ 278 . 5 million, or 31 . 7 % of non - owner occupied CRE, was concentrated in Connecticut . At September 30 , 2025 , the office portfolio represented the largest concentration of non - owner occupied CRE at 64 . 4 % of total RBC with a weighted average LTV of 61 . 9 % . The apartment portfolio represented 57 . 8 % of total RBC with a weighted average LTV of 53 . 4 % . ($ in thousands) (1) As of September 30, 2025. (2) The total RBC ratio is based on Westfield Bank’s capital and due to loan classifications, the percentage of total RBC may dif fer from the Call Report. (3) Weighted average LTV is based on the original appraisal and the current loan balance. Weighted Average Loan to Value (LTV) (3) % of Total RBC (2) Total Other ME RI NH CT MA Property Type 61.9% 64.4% 176,788 - 11,256 - 39,393 61,577 64,562 Office 53.4% 57.8% 158,669 - - 24,513 - 43,831 90,325 Apartment 58.0% 44.6% 122,504 4,473 - 11,240 - 35,116 71,675 Industrial 51.5% 40.1% 110,200 - 11,220 6,108 13,465 25,737 53,670 Retail 56.2% 26.6% 73,092 4,659 - 12,873 - 20,603 34,957 Mixed Use 55.6% 16.8% 46,239 - - - 774 9,180 36,285 Self Storage 51.6% 15.3% 41,975 - - - - 21,716 20,259 Hotel/Hospitality 56.5% 14.2% 38,751 - 120 - 685 5,217 32,729 Other 48.4% 10.4% 28,595 - - - - 19,231 9,364 Shopping Center 41.7% 8.7% 23,730 1,661 - - - 4,924 17,145 Warehouse 63.3% 9.1% 24,978 - - - - 16,356 8,622 Adult Care/Assisted Living 61.1% 7.9% 21,687 343 - 2,660 15,033 3,651 Student Housing 43.7% 3.9% 10,663 - - - - - 10,663 School/Higher Education 56.1% 319.8% $877,871 $ 11,136 $ 22,596 $54,734 $ 56,977 $ 278,521 $453,907 Total non - owner occupied commercial real estate
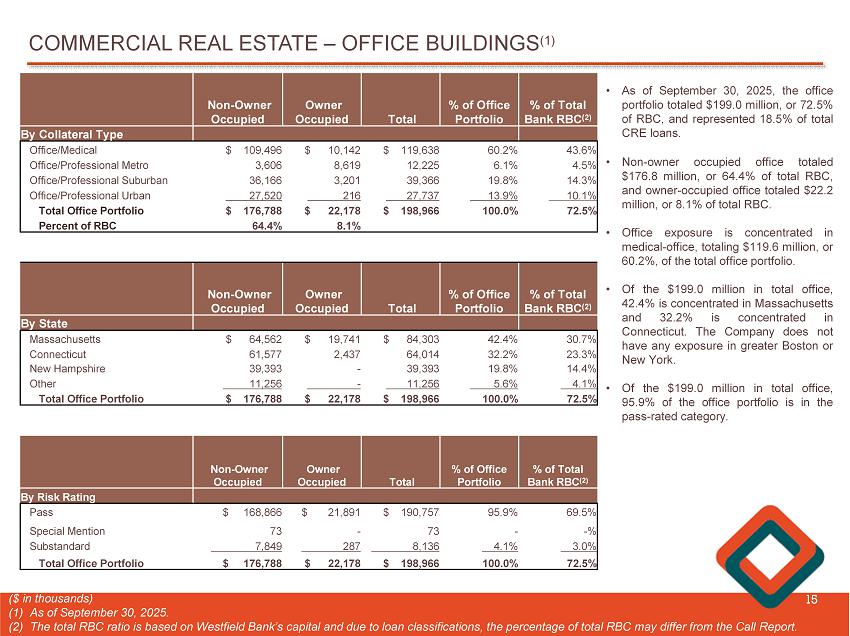
COMMERCIAL REAL ESTATE – OFFICE BUILDINGS (1) 15 ($ in thousands) (1) As of September 30, 2025. (2) The total RBC ratio is based on Westfield Bank’s capital and due to loan classifications, the percentage of total RBC may dif fer from the Call Report. % of Total Bank RBC (2) % of Office Portfolio Total Owner Occupied Non - Owner Occupied By Collateral Type 43.6% 60.2% $ 119,638 $ 10,142 $ 109,496 Office/Medical 4.5% 6.1% 12,225 8,619 3,606 Office/Professional Metro 14.3% 19.8% 39,366 3,201 36,166 Office/Professional Suburban 10.1% 13.9% 27,737 216 27,520 Office/Professional Urban 72.5% 100.0% $ 198,966 $ 22,178 $ 176,788 Total Office Portfolio 8.1% 64.4% Percent of RBC % of Total Bank RBC (2) % of Office Portfolio Total Owner Occupied Non - Owner Occupied By State 30.7% 42.4% $ 84,303 $ 19,741 $ 64,562 Massachusetts 23.3% 32.2% 64,014 2,437 61,577 Connecticut 14.4% 19.8% 39,393 - 39,393 New Hampshire 4.1% 5.6% 11,256 - 11,256 Other 72.5% 100.0% $ 198,966 $ 22,178 $ 176,788 Total Office Portfolio % of Total Bank RBC (2) % of Office Portfolio Total Owner Occupied Non - Owner Occupied By Risk Rating 69.5% 95.9% $ 190,757 $ 21,891 $ 168,866 Pass - % - 73 - 73 Special Mention 3.0% 4.1% 8,136 287 7,849 Substandard 72.5% 100.0% $ 198,966 $ 22,178 $ 176,788 Total Office Portfolio • As of September 30 , 2025 , the office portfolio totaled $ 199 . 0 million, or 72 . 5 % of RBC, and represented 18 . 5 % of total CRE loans . • Non - owner occupied office totaled $ 176 . 8 million, or 64 . 4 % of total RBC, and owner - occupied office totaled $ 22 . 2 million, or 8 . 1 % of total RBC . • Office exposure is concentrated in medical - office, totaling $ 119 . 6 million, or 60 . 2 % , of the total office portfolio . • Of the $ 199 . 0 million in total office, 42 . 4 % is concentrated in Massachusetts and 32 . 2 % is concentrated in Connecticut . The Company does not have any exposure in greater Boston or New York . • Of the $ 199 . 0 million in total office, 95 . 9 % of the office portfolio is in the pass - rated category .
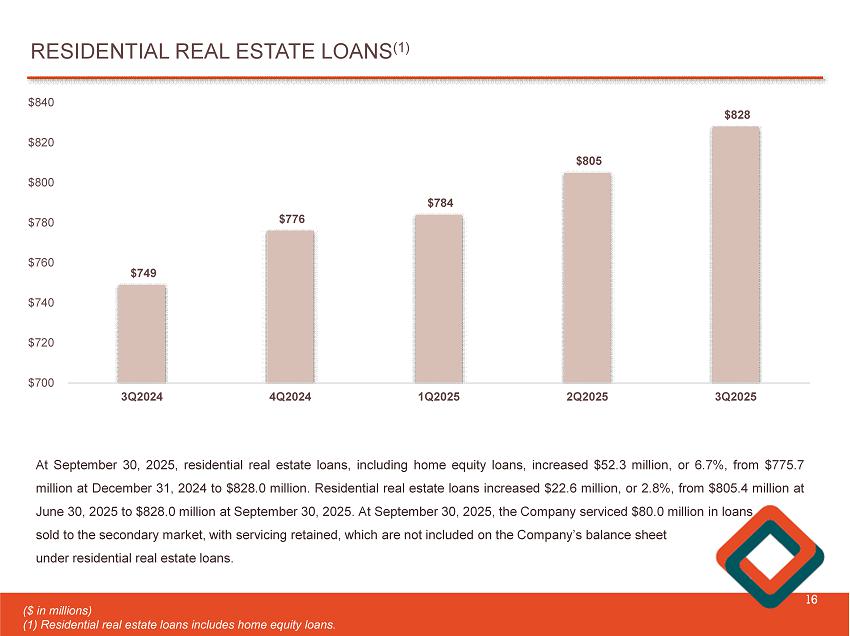
RESIDENTIAL REAL ESTATE LOANS (1) 16 $749 $776 $784 $805 $828 3Q2024 4Q2024 1Q2025 2Q2025 3Q2025 $700 $720 $740 $760 $780 $800 $820 $840 At September 30 , 2025 , residential real estate loans, including home equity loans, increased $ 52 . 3 million, or 6 . 7 % , from $ 775 . 7 million at December 31 , 2024 to $ 828 . 0 million . Residential real estate loans increased $ 22 . 6 million, or 2 . 8 % , from $ 805 . 4 million at June 30 , 2025 to $ 828 . 0 million at September 30 , 2025 . At September 30 , 2025 , the Company serviced $ 80 . 0 million in loans sold to the secondary market, with servicing retained, which are not included on the Company’s balance sheet under residential real estate loans . ($ in millions) (1) Residential real estate loans includes home equity loans.
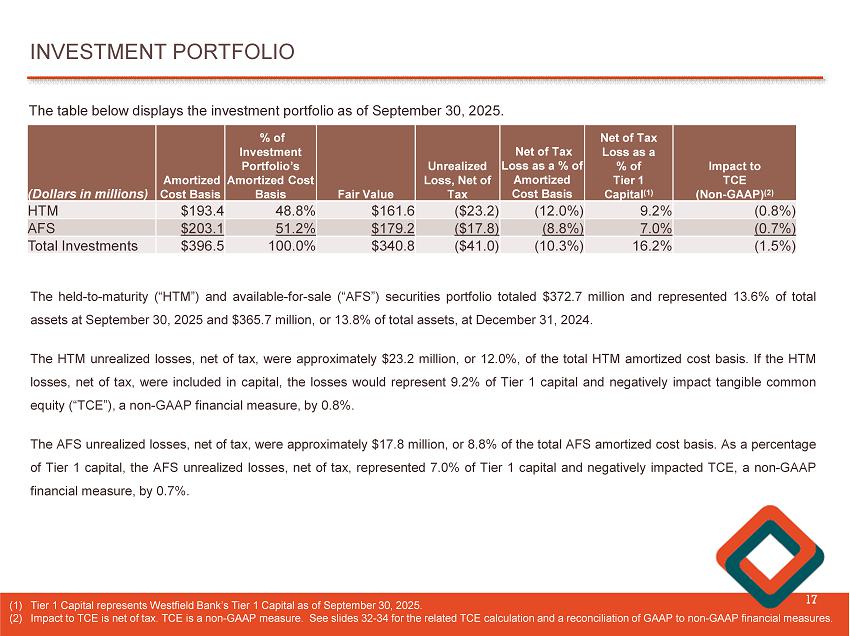
INVESTMENT PORTFOLIO 17 The held - to - maturity (“HTM”) and available - for - sale (“AFS”) securities portfolio totaled $ 372 . 7 million and represented 13 . 6 % of total assets at September 30 , 2025 and $ 365 . 7 million, or 13 . 8 % of total assets, at December 31 , 2024 . The HTM unrealized losses, net of tax, were approximately $ 23 . 2 million, or 12 . 0 % , of the total HTM amortized cost basis . If the HTM losses, net of tax, were included in capital, the losses would represent 9 . 2 % of Tier 1 capital and negatively impact tangible common equity (“TCE”), a non - GAAP financial measure, by 0 . 8 % . The AFS unrealized losses, net of tax, were approximately $ 17 . 8 million, or 8 . 8 % of the total AFS amortized cost basis . As a percentage of Tier 1 capital, the AFS unrealized losses, net of tax, represented 7 . 0 % of Tier 1 capital and negatively impacted TCE, a non - GAAP financial measure, by 0 . 7 % . (1) Tier 1 Capital represents Westfield Bank’s Tier 1 Capital as of September 30, 2025. (2) Impact to TCE is net of tax. TCE is a non - GAAP measure. See slides 32 - 34 for the related TCE calculation and a reconciliation o f GAAP to non - GAAP financial measures. The table below displays the investment portfolio as of September 30 , 2025 . Impact to TCE (Non - GAAP) (2) Net of Tax Loss as a % of Tier 1 Capital (1) Net of Tax Loss as a % of Amortized Cost Basis Unrealized Loss, Net of Tax Fair Value % of Investment Portfolio’s Amortized Cost Basis Amortized Cost Basis (Dollars in millions) (0.8%) 9.2% (12.0%) ($23.2) $161.6 48.8% $193.4 HTM (0.7%) 7.0% (8.8%) ($17.8) $179.2 51.2% $203.1 AFS (1.5%) 16.2% (10.3%) ($41.0) $340.8 100.0% $396.5 Total Investments
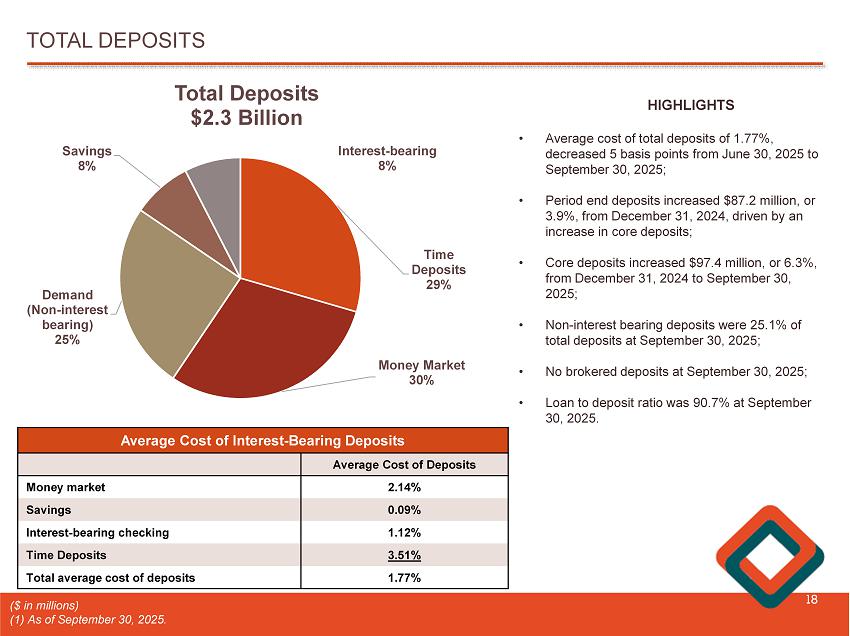
TOTAL DEPOSITS 18 ($ in millions) (1) As of September 30, 2025. Time Deposits 29% Money Market 30% Demand (Non - interest bearing) 25% Savings 8% Interest - bearing 8% Total Deposits $2.3 Billion HIGHLIGHTS • Average cost of total deposits of 1.77%, decreased 5 basis points from June 30, 2025 to September 30, 2025; • Period end deposits increased $87.2 million, or 3.9%, from December 31, 2024, driven by an increase in core deposits; • Core deposits increased $97.4 million, or 6.3%, from December 31, 2024 to September 30, 2025; • Non - interest bearing deposits were 25.1% of total deposits at September 30, 2025; • No brokered deposits at September 30, 2025; • Loan to deposit ratio was 90.7% at September 30, 2025. Average Cost of Interest - Bearing Deposits Average Cost of Deposits 2.14% Money market 0.09% Savings 1.12% Interest - bearing checking 3.51% Time Deposits 1.77% Total average cost of deposits
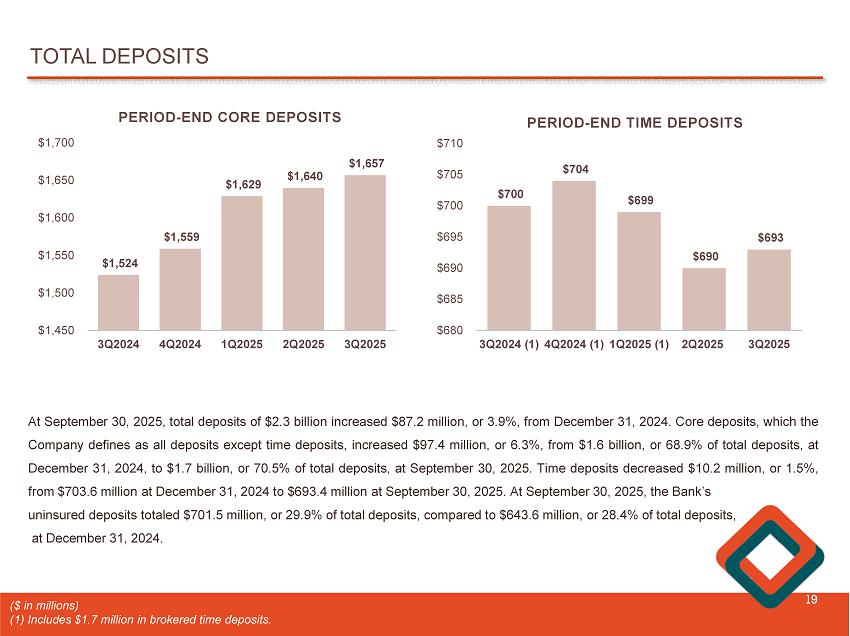
TOTAL DEPOSITS 19 $1,524 $1,559 $1,629 $1,640 $1,657 3Q2024 4Q2024 1Q2025 2Q2025 3Q2025 $1,450 $1,500 $1,550 $1,600 $1,650 $1,700 PERIOD - END CORE DEPOSITS At September 30 , 2025 , total deposits of $ 2 . 3 billion increased $ 87 . 2 million, or 3 . 9 % , from December 31 , 2024 . Core deposits, which the Company defines as all deposits except time deposits, increased $ 97 . 4 million, or 6 . 3 % , from $ 1 . 6 billion, or 68 . 9 % of total deposits, at December 31 , 2024 , to $ 1 . 7 billion, or 70 . 5 % of total deposits, at September 30 , 2025 . Time deposits decreased $ 10 . 2 million, or 1 . 5 % , from $ 703 . 6 million at December 31 , 2024 to $ 693 . 4 million at September 30 , 2025 . At September 30 , 2025 , the Bank’s uninsured deposits totaled $ 701 . 5 million, or 29 . 9 % of total deposits, compared to $ 643 . 6 million, or 28 . 4 % of total deposits, at December 31 , 2024 . $700 $704 $699 $690 $693 3Q2024 (1) 4Q2024 (1) 1Q2025 (1) 2Q2025 3Q2025 $680 $685 $690 $695 $700 $705 $710 PERIOD - END TIME DEPOSITS ($ in millions) (1) Includes $1.7 million in brokered time deposits.
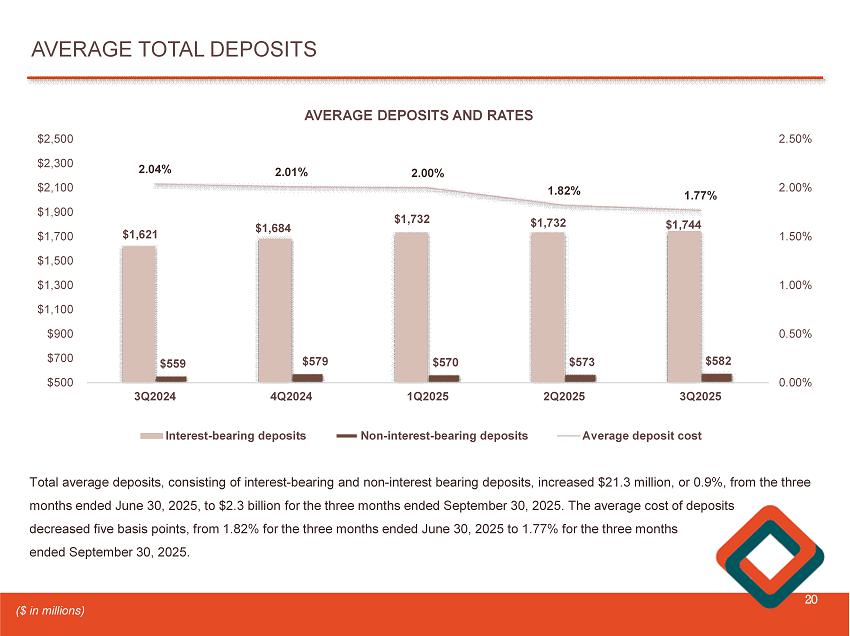
AVERAGE TOTAL DEPOSITS 20 $1,621 $1,684 $1,732 $1,732 $1,744 $559 $579 $570 $573 $582 2.04% 2.01% 2.00% 1.82% 1.77% 0.00% 0.50% 1.00% 1.50% 2.00% 2.50% 3Q2024 4Q2024 1Q2025 2Q2025 3Q2025 $500 $700 $900 $1,100 $1,300 $1,500 $1,700 $1,900 $2,100 $2,300 $2,500 AVERAGE DEPOSITS AND RATES Interest-bearing deposits Non-interest-bearing deposits Average deposit cost Total average deposits, consisting of interest - bearing and non - interest bearing deposits, increased $ 21 . 3 million, or 0 . 9 % , from the three months ended June 30 , 2025 , to $ 2 . 3 billion for the three months ended September 30 , 2025 . The average cost of deposits decreased five basis points, from 1 . 82 % for the three months ended June 30 , 2025 to 1 . 77 % for the three months ended September 30 , 2025 . ($ in millions)
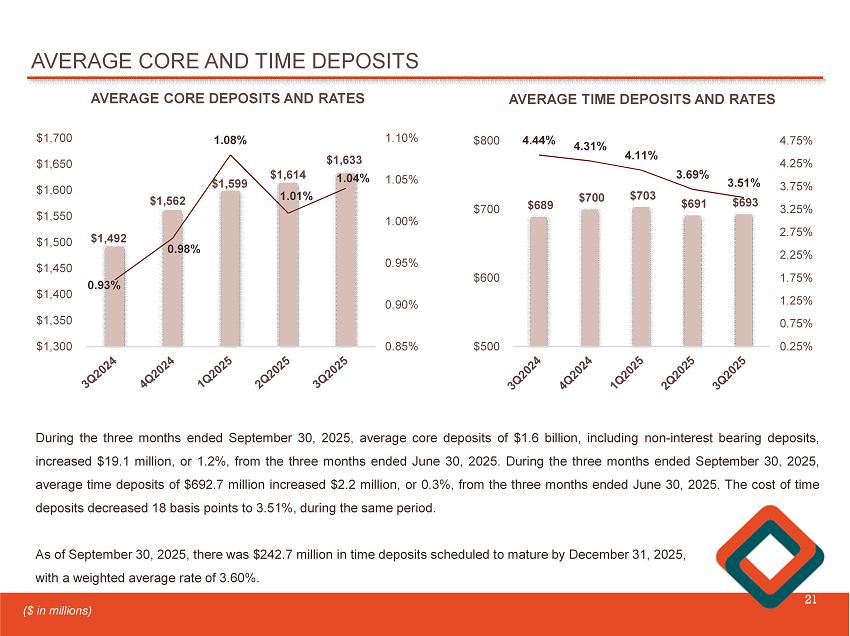
AVERAGE CORE AND TIME DEPOSITS 21 $1,492 $1,562 $1,599 $1,614 $1,633 0.93% 0.98% 1.08% 1.01% 1.04% 0.85% 0.90% 0.95% 1.00% 1.05% 1.10% $1,300 $1,350 $1,400 $1,450 $1,500 $1,550 $1,600 $1,650 $1,700 AVERAGE CORE DEPOSITS AND RATES During the three months ended September 30 , 2025 , average core deposits of $ 1 . 6 billion, including non - interest bearing deposits, increased $ 19 . 1 million, or 1 . 2 % , from the three months ended June 30 , 2025 . During the three months ended September 30 , 2025 , average time deposits of $ 692 . 7 million increased $ 2 . 2 million, or 0 . 3 % , from the three months ended June 30 , 2025 . The cost of time deposits decreased 18 basis points to 3 . 51 % , during the same period . As of September 30 , 2025 , there was $ 242 . 7 million in time deposits scheduled to mature by December 31 , 2025 , with a weighted average rate of 3 . 60 % . ($ in millions) $689 $700 $703 $691 $693 4.44% 4.31% 4.11% 3.69% 3.51% 0.25% 0.75% 1.25% 1.75% 2.25% 2.75% 3.25% 3.75% 4.25% 4.75% $500 $600 $700 $800 AVERAGE TIME DEPOSITS AND RATES
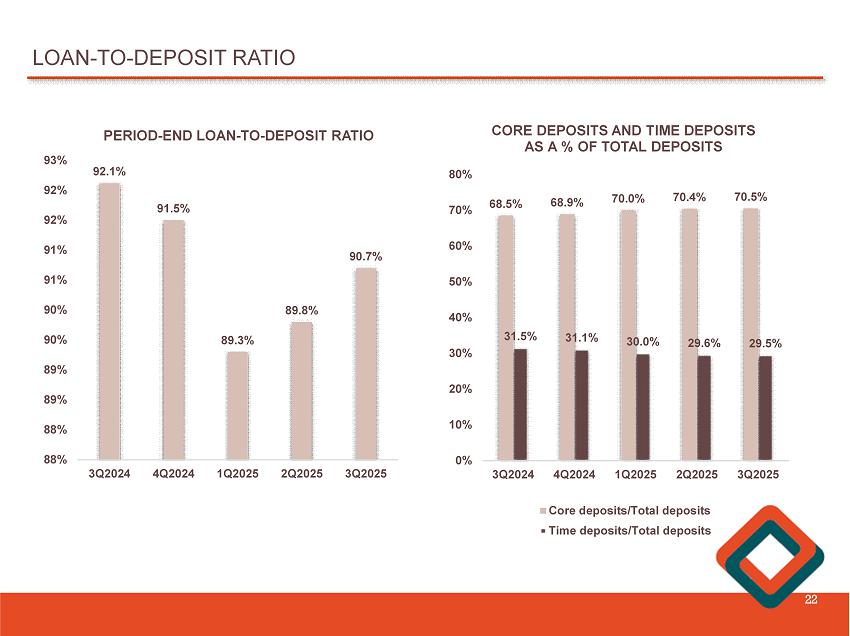
LOAN - TO - DEPOSIT RATIO 22 92.1% 91.5% 89.3% 89.8% 90.7% 3Q2024 4Q2024 1Q2025 2Q2025 3Q2025 88% 88% 89% 89% 90% 90% 91% 91% 92% 92% 93% PERIOD - END LOAN - TO - DEPOSIT RATIO 68.5% 68.9% 70.0% 70.4% 70.5% 31.5% 31.1% 30.0% 29.6% 29.5% 3Q2024 4Q2024 1Q2025 2Q2025 3Q2025 0% 10% 20% 30% 40% 50% 60% 70% 80% CORE DEPOSITS AND TIME DEPOSITS AS A % OF TOTAL DEPOSITS Core deposits/Total deposits Time deposits/Total deposits
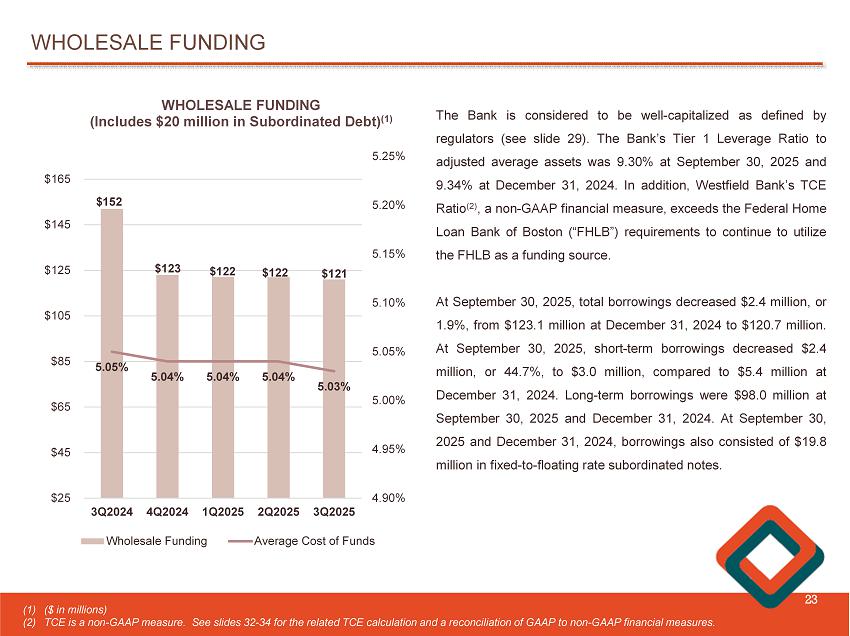
WHOLESALE FUNDING 23 $152 $123 $122 $122 $121 5.05% 5.04% 5.04% 5.04% 5.03% 4.90% 4.95% 5.00% 5.05% 5.10% 5.15% 5.20% 5.25% 3Q2024 4Q2024 1Q2025 2Q2025 3Q2025 $25 $45 $65 $85 $105 $125 $145 $165 WHOLESALE FUNDING (Includes $20 million in Subordinated Debt) (1) Wholesale Funding Average Cost of Funds The Bank is considered to be well - capitalized as defined by regulators (see slide 29 ) . The Bank’s Tier 1 Leverage Ratio to adjusted average assets was 9 . 30 % at September 30 , 2025 and 9 . 34 % at December 31 , 2024 . In addition, Westfield Bank’s TCE Ratio ( 2 ) , a non - GAAP financial measure, exceeds the Federal Home Loan Bank of Boston (“FHLB”) requirements to continue to utilize the FHLB as a funding source . At September 30 , 2025 , total borrowings decreased $ 2 . 4 million, or 1 . 9 % , from $ 123 . 1 million at December 31 , 2024 to $ 120 . 7 million . At September 30 , 2025 , short - term borrowings decreased $ 2 . 4 million, or 44 . 7 % , to $ 3 . 0 million, compared to $ 5 . 4 million at December 31 , 2024 . Long - term borrowings were $ 98 . 0 million at September 30 , 2025 and December 31 , 2024 . At September 30 , 2025 and December 31 , 2024 , borrowings also consisted of $ 19 . 8 million in fixed - to - floating rate subordinated notes . (1) ($ in millions) (2) TCE is a non - GAAP measure. See slides 32 - 34 for the related TCE calculation and a reconciliation of GAAP to non - GAAP financial measures.
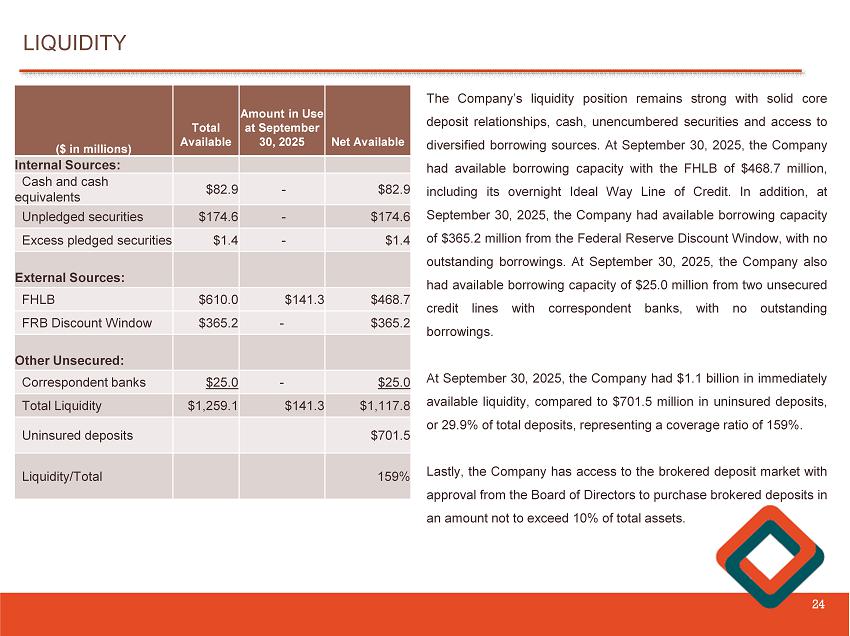
24 The Company’s liquidity position remains strong with solid core deposit relationships, cash, unencumbered securities and access to diversified borrowing sources . At September 30 , 2025 , the Company had available borrowing capacity with the FHLB of $ 468 . 7 million, including its overnight Ideal Way Line of Credit . In addition, at September 30 , 2025 , the Company had available borrowing capacity of $ 365 . 2 million from the Federal Reserve Discount Window, with no outstanding borrowings . At September 30 , 2025 , the Company also had available borrowing capacity of $ 25 . 0 million from two unsecured credit lines with correspondent banks, with no outstanding borrowings . At September 30 , 2025 , the Company had $ 1 . 1 billion in immediately available liquidity, compared to $ 701 . 5 million in uninsured deposits, or 29 . 9 % of total deposits, representing a coverage ratio of 159 % . Lastly, the Company has access to the brokered deposit market with approval from the Board of Directors to purchase brokered deposits in an amount not to exceed 10 % of total assets . LIQUIDITY Net Available Amount in Use at September 30, 2025 Total Available ($ in millions) Internal Sources: $82.9 - $82.9 Cash and cash equivalents $174.6 - $174.6 Unpledged securities $1.4 - $1.4 Excess pledged securities External Sources: $468.7 $141.3 $610.0 FHLB $365.2 - $365.2 FRB Discount Window Other Unsecured: $25.0 - $25.0 Correspondent banks $1,117.8 $141.3 $1,259.1 Total Liquidity $701.5 Uninsured deposits 159% Liquidity/Total
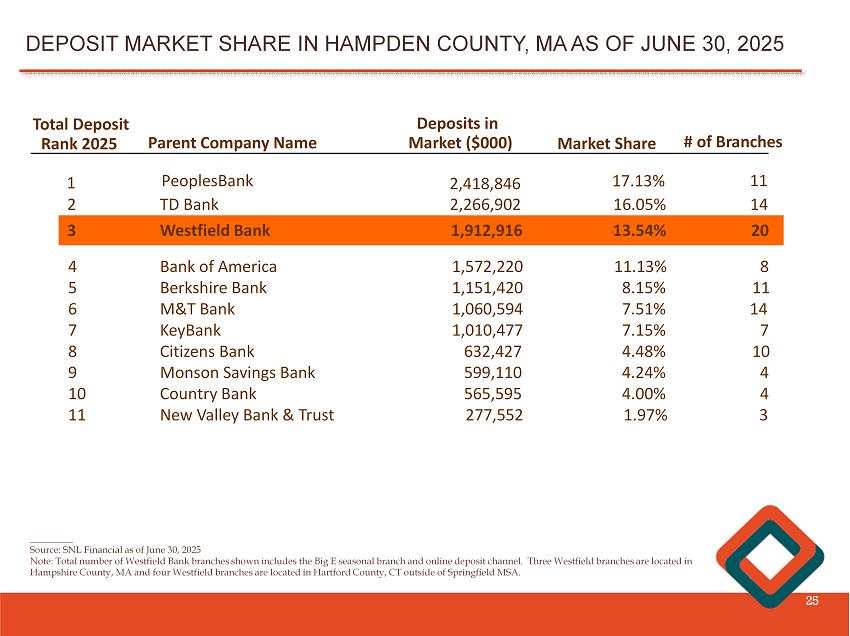
________ Source: SNL Financial as of June 30, 2025 Note: Total number of Westfield Bank branches shown includes the Big E seasonal branch and online deposit channel. Three Wes tfi eld branches are located in Hampshire County, MA and four Westfield branches are located in Hartford County, CT outside of Springfield MSA. DEPOSIT MARKET SHARE IN HAMPDEN COUNTY, MA AS OF JUNE 30, 2025 25 Total Deposit Rank 2025 Parent Company Name Deposits in Market ($000) Market Share # of Branches 1 PeoplesBank 2,418,846 17.13% 11 1,762,519 13.1% 20 3 Westfield Bank 1,912,916 13.54% 20 2 TD Bank 2,266,902 16.05% 14 4 Bank of America 1,572,220 11.13% 8 5 Berkshire Bank 1,151,420 8.15% 11 6 M&T Bank 1,060,594 7.51% 14 7 KeyBank 1,010,477 7.15% 7 8 Citizens Bank 632,427 4.48% 10 9 Monson Savings Bank 599,110 4.24% 4 10 Country Bank 565,595 4.00% 4 11 New Valley Bank & Trust 277,552 1.97% 3
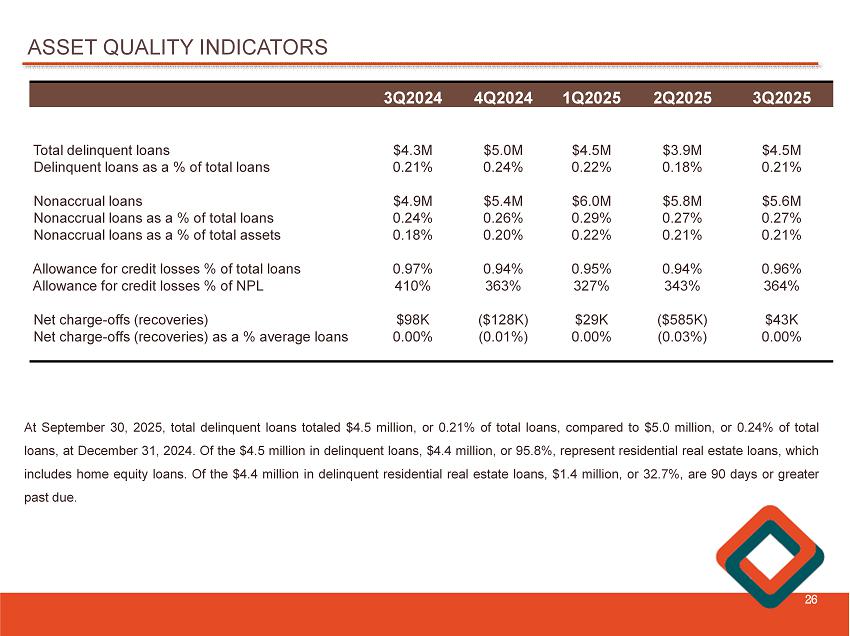
ASSET QUALITY INDICATORS 26 3Q2025 2Q2025 1Q2025 4Q2024 3Q2024 $4.5M $3.9M $4.5M $5.0M $4.3M Total delinquent loans 0.21% 0.18% 0.22% 0.24% 0.21% Delinquent loans as a % of total loans $5.6M $5.8M $6.0M $5.4M $4.9M Nonaccrual loans 0.27% 0.27% 0.29% 0.26% 0.24% Nonaccrual loans as a % of total loans 0.21% 0.21% 0.22% 0.20% 0.18% Nonaccrual loans as a % of total assets 0.96% 0.94% 0.95% 0.94% 0.97% Allowance for credit losses % of total loans 364% 343% 327% 363% 410% Allowance for credit losses % of NPL $43K ($585K) $29K ($128K) $98K Net charge - offs (recoveries) 0.00% (0.03%) 0.00% (0.01%) 0.00% Net charge - offs (recoveries) as a % average loans At September 30 , 2025 , total delinquent loans totaled $ 4 . 5 million, or 0 . 21 % of total loans, compared to $ 5 . 0 million, or 0 . 24 % of total loans, at December 31 , 2024 . Of the $ 4 . 5 million in delinquent loans, $ 4 . 4 million, or 95 . 8 % , represent residential real estate loans, which includes home equity loans . Of the $ 4 . 4 million in delinquent residential real estate loans, $ 1 . 4 million, or 32 . 7 % , are 90 days or greater past due .
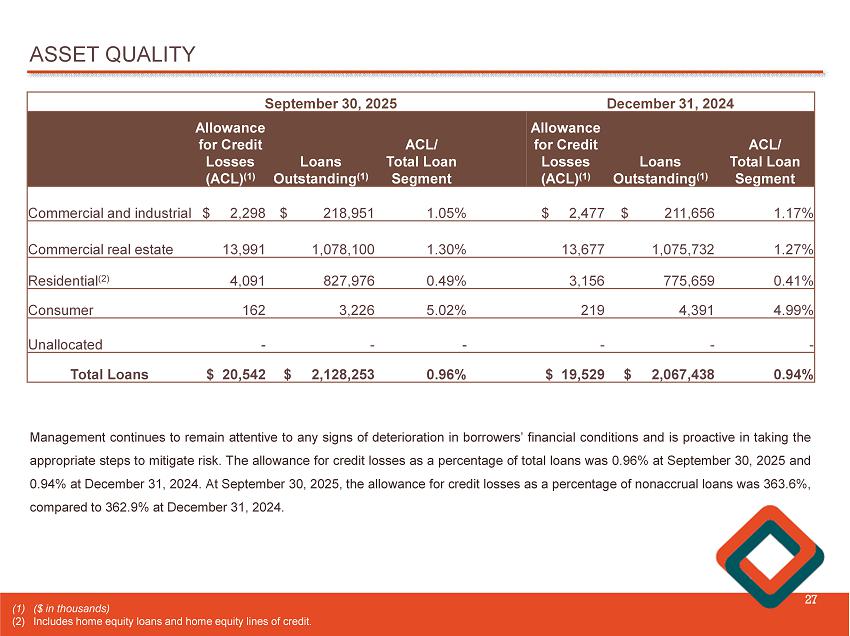
ASSET QUALITY 27 Management continues to remain attentive to any signs of deterioration in borrowers’ financial conditions and is proactive in taking the appropriate steps to mitigate risk . The allowance for credit losses as a percentage of total loans was 0 . 96 % at September 30 , 2025 and 0 . 94 % at December 31 , 2024 . At September 30 , 2025 , the allowance for credit losses as a percentage of nonaccrual loans was 363 . 6 % , compared to 362 . 9 % at December 31 , 2024 . December 31, 2024 September 30, 2025 ACL/ Total Loan Segment Loans Outstanding (1) Allowance for Credit Losses (ACL) (1) ACL/ Total Loan Segment Loans Outstanding (1) Allowance for Credit Losses (ACL) (1) 1.17% $ 211,656 $ 2,477 1.05% $ 218,951 $ 2,298 Commercial and industrial 1.27% 1,075,732 13,677 1.30% 1,078,100 13,991 Commercial real estate 0.41% 775,659 3,156 0.49% 827,976 4,091 Residential (2) 4.99% 4,391 219 5.02% 3,226 162 Consumer - - - - - - Unallocated 0.94% $ 2,067,438 $ 19,529 0.96% $ 2,128,253 $ 20,542 Total Loans (1) ( $ in thousands) (2) Includes home equity loans and home equity lines of credit .
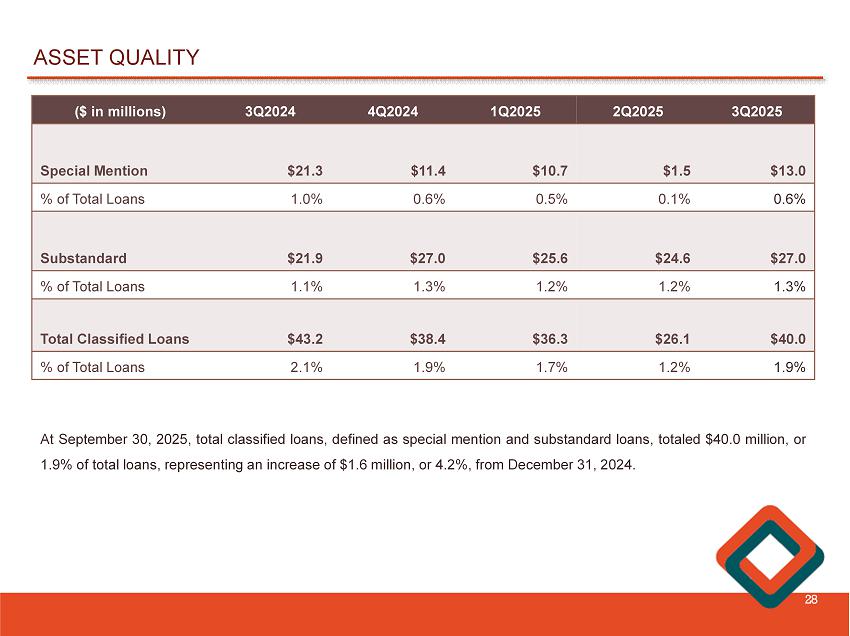
ASSET QUALITY 28 3Q2025 2Q2025 1Q2025 4Q2024 3Q2024 ($ in millions) $13.0 $1.5 $10.7 $11.4 $21.3 Special Mention 0.6% 0.1% 0.5% 0.6% 1.0% % of Total Loans $27.0 $24.6 $25.6 $27.0 $21.9 Substandard 1.3% 1.2% 1.2% 1.3% 1.1% % of Total Loans $40.0 $26.1 $36.3 $38.4 $43.2 Total Classified Loans 1.9% 1.2% 1.7% 1.9% 2.1% % of Total Loans At September 30 , 2025 , total classified loans, defined as special mention and substandard loans, totaled $ 40 . 0 million, or 1 . 9 % of total loans, representing an increase of $ 1 . 6 million, or 4 . 2 % , from December 31 , 2024 .
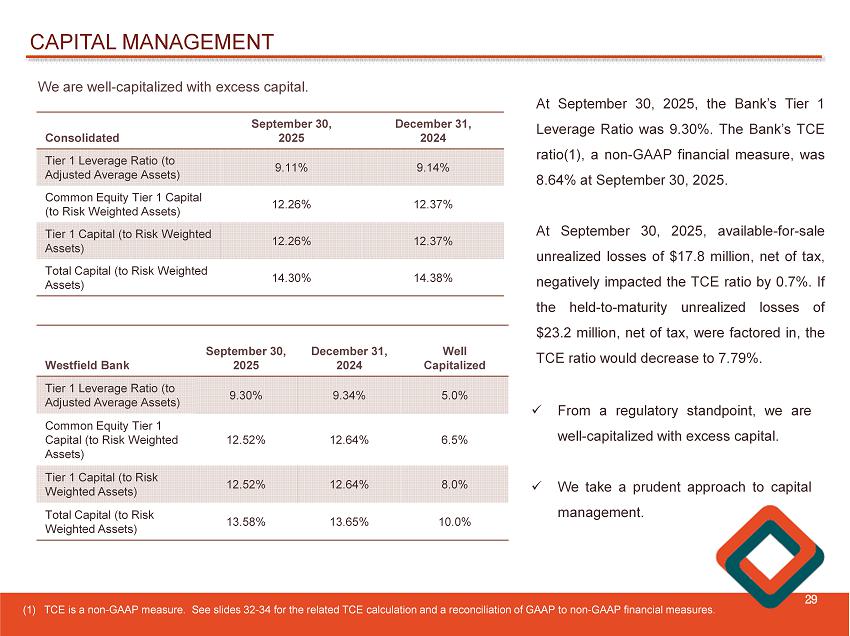
CAPITAL MANAGEMENT 29 We are well - capitalized with excess capital. December 31, 2024 September 30, 2025 Consolidated 9.14% 9.11% Tier 1 Leverage Ratio (to Adjusted Average Assets) 12.37% 12.26% Common Equity Tier 1 Capital (to Risk Weighted Assets) 12.37% 12.26% Tier 1 Capital (to Risk Weighted Assets) 14.38% 14.30% Total Capital (to Risk Weighted Assets) At September 30 , 2025 , the Bank’s Tier 1 Leverage Ratio was 9 . 30 % . The Bank’s TCE ratio( 1 ), a non - GAAP financial measure, was 8 . 64 % at September 30 , 2025 . At September 30 , 2025 , available - for - sale unrealized losses of $ 17 . 8 million, net of tax, negatively impacted the TCE ratio by 0 . 7 % . If the held - to - maturity unrealized losses of $ 23 . 2 million, net of tax, were factored in, the TCE ratio would decrease to 7 . 79 % . Well Capitalized December 31, 2024 September 30, 2025 Westfield Bank 5.0% 9.34% 9.30% Tier 1 Leverage Ratio (to Adjusted Average Assets) 6.5% 12.64% 12.52% Common Equity Tier 1 Capital (to Risk Weighted Assets) 8.0% 12.64% 12.52% Tier 1 Capital (to Risk Weighted Assets) 10.0% 13.65% 13.58% Total Capital (to Risk Weighted Assets) (1) TCE is a non - GAAP measure. See slides 32 - 34 for the related TCE calculation and a reconciliation of GAAP to non - GAAP financial measures. x From a regulatory standpoint, we are well - capitalized with excess capital . x We take a prudent approach to capital management .
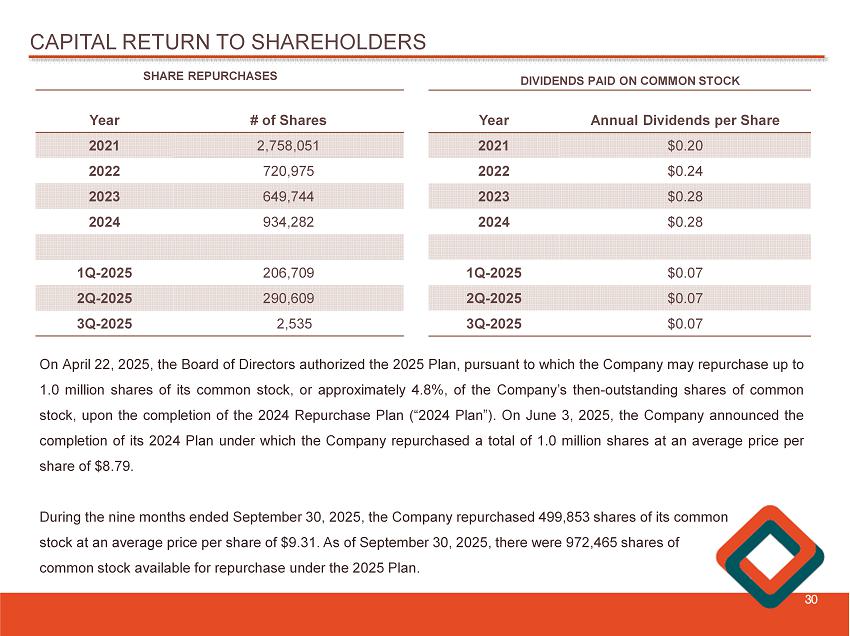
CAPITAL RETURN TO SHAREHOLDERS 30 # of Shares Year 2,758,051 2021 720,975 2022 649,744 2023 934,282 2024 206,709 1Q - 2025 290,609 2Q - 2025 2,535 3Q - 2025 Annual Dividends per Share Year $0.20 2021 $0.24 2022 $0.28 2023 $0.28 2024 $0.07 1Q - 2025 $0.07 2Q - 2025 $0.07 3Q - 2025 SHARE REPURCHASES DIVIDENDS PAID ON COMMON STOCK On April 22 , 2025 , the Board of Directors authorized the 2025 Plan, pursuant to which the Company may repurchase up to 1 . 0 million shares of its common stock, or approximately 4 . 8 % , of the Company’s then - outstanding shares of common stock, upon the completion of the 2024 Repurchase Plan (“ 2024 Plan”) . On June 3 , 2025 , the Company announced the completion of its 2024 Plan under which the Company repurchased a total of 1 . 0 million shares at an average price per share of $ 8 . 79 . During the nine months ended September 30 , 2025 , the Company repurchased 499 , 853 shares of its common stock at an average price per share of $ 9 . 31 . As of September 30 , 2025 , there were 972 , 465 shares of common stock available for repurchase under the 2025 Plan .
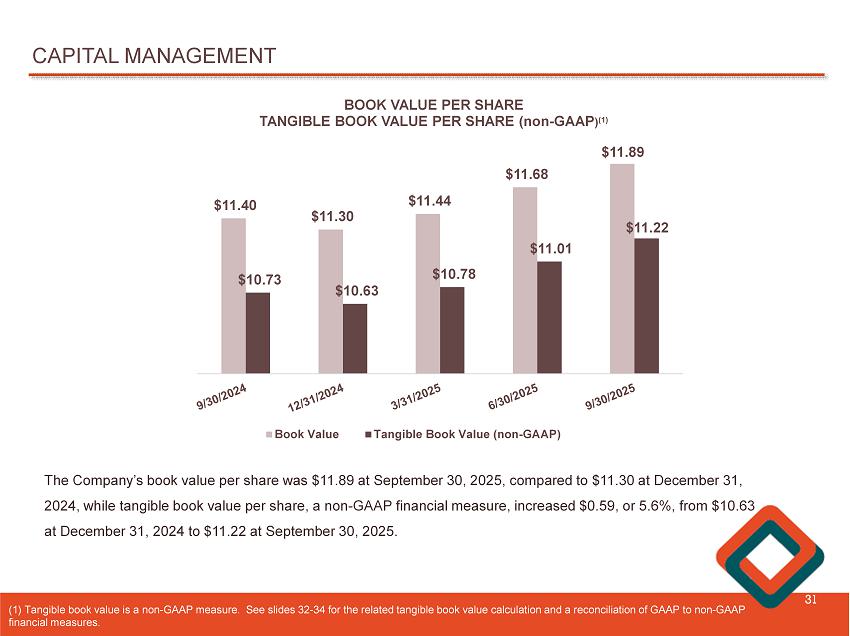
CAPITAL MANAGEMENT 31 $11.40 $11.30 $11.44 $11.68 $11.89 $10.73 $10.63 $10.78 $11.01 $11.22 BOOK VALUE PER SHARE TANGIBLE BOOK VALUE PER SHARE (non - GAAP ) (1) Book Value Tangible Book Value (non-GAAP) The Company’s book value per share was $11.89 at September 30, 2025, compared to $11.30 at December 31, 2024, while tangible book value per share, a non - GAAP financial measure, increased $0.59, or 5.6%, from $10.63 at December 31, 2024 to $11.22 at September 30, 2025. (1) Tangible book value is a non - GAAP measure. See slides 32 - 34 for the related tangible book value calculation and a reconcili ation of GAAP to non - GAAP financial measures.
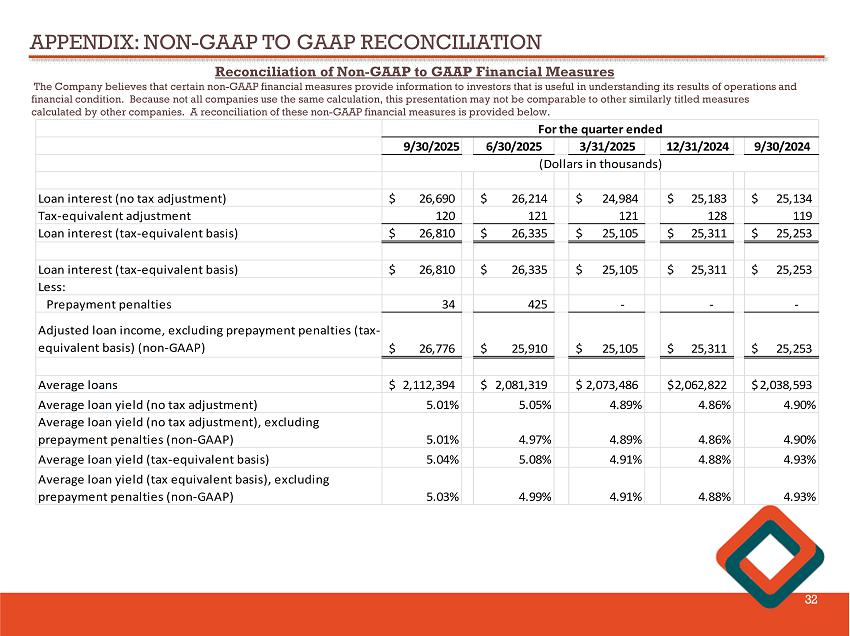
APPENDIX: NON - GAAP TO GAAP RECONCILIATION 32 Reconciliation of Non - GAAP to GAAP Financial Measures The Company believes that certain non - GAAP financial measures provide information to investors that is useful in understanding its results of operations and financial condition. Because not all companies use the same calculation, this presentation may not be comparable to other simil arly titled measures calculated by other companies. A reconciliation of these non - GAAP financial measures is provided below. 9/30/2025 6/30/2025 3/31/2025 12/31/2024 9/30/2024 Loan interest (no tax adjustment) 26,690$ 26,214$ 24,984$ 25,183$ 25,134$ Tax-equivalent adjustment 120 121 121 128 119 Loan interest (tax-equivalent basis) 26,810$ 26,335$ 25,105$ 25,311$ 25,253$ Loan interest (tax-equivalent basis) 26,810$ 26,335$ 25,105$ 25,311$ 25,253$ Less: Prepayment penalties 34 425 - - - Adjusted loan income, excluding prepayment penalties (tax- equivalent basis) (non-GAAP) 26,776$ 25,910$ 25,105$ 25,311$ 25,253$ Average loans 2,112,394$ 2,081,319$ 2,073,486$ 2,062,822$ 2,038,593$ Average loan yield (no tax adjustment) 5.01% 5.05% 4.89% 4.86% 4.90% Average loan yield (no tax adjustment), excluding prepayment penalties (non-GAAP) 5.01% 4.97% 4.89% 4.86% 4.90% Average loan yield (tax-equivalent basis) 5.04% 5.08% 4.91% 4.88% 4.93% Average loan yield (tax equivalent basis), excluding prepayment penalties (non-GAAP) 5.03% 4.99% 4.91% 4.88% 4.93% For the quarter ended (Dollars in thousands)
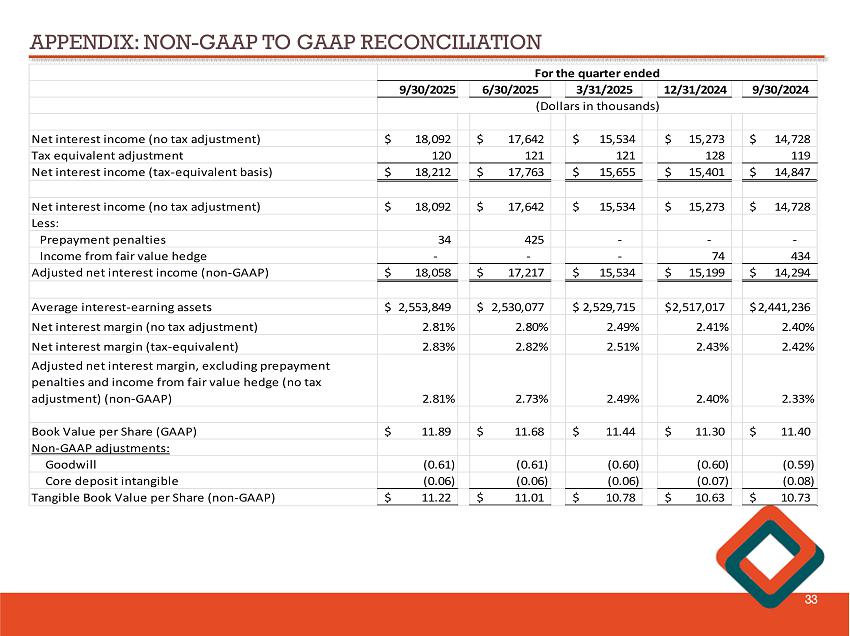
APPENDIX: NON - GAAP TO GAAP RECONCILIATION 33 9/30/2025 6/30/2025 3/31/2025 12/31/2024 9/30/2024 Net interest income (no tax adjustment) 18,092$ 17,642$ 15,534$ 15,273$ 14,728$ Tax equivalent adjustment 120 121 121 128 119 Net interest income (tax-equivalent basis) 18,212$ 17,763$ 15,655$ 15,401$ 14,847$ Net interest income (no tax adjustment) 18,092$ 17,642$ 15,534$ 15,273$ 14,728$ Less: Prepayment penalties 34 425 - - - Income from fair value hedge - - - 74 434 Adjusted net interest income (non-GAAP) 18,058$ 17,217$ 15,534$ 15,199$ 14,294$ Average interest-earning assets 2,553,849$ 2,530,077$ 2,529,715$ 2,517,017$ 2,441,236$ Net interest margin (no tax adjustment) 2.81% 2.80% 2.49% 2.41% 2.40% Net interest margin (tax-equivalent) 2.83% 2.82% 2.51% 2.43% 2.42% Adjusted net interest margin, excluding prepayment penalties and income from fair value hedge (no tax adjustment) (non-GAAP) 2.81% 2.73% 2.49% 2.40% 2.33% Book Value per Share (GAAP) 11.89$ 11.68$ 11.44$ 11.30$ 11.40$ Non-GAAP adjustments: Goodwill (0.61) (0.61) (0.60) (0.60) (0.59) Core deposit intangible (0.06) (0.06) (0.06) (0.07) (0.08) Tangible Book Value per Share (non-GAAP) 11.22$ 11.01$ 10.78$ 10.63$ 10.73$ For the quarter ended (Dollars in thousands)
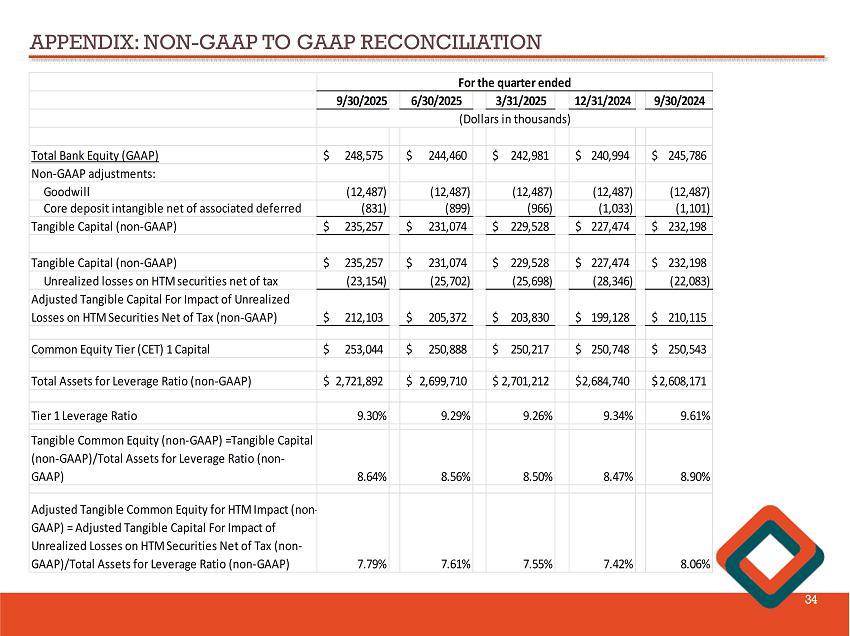
APPENDIX: NON - GAAP TO GAAP RECONCILIATION 34 9/30/2025 6/30/2025 3/31/2025 12/31/2024 9/30/2024 Total Bank Equity (GAAP) 248,575$ 244,460$ 242,981$ 240,994$ 245,786$ Non-GAAP adjustments: Goodwill (12,487) (12,487) (12,487) (12,487) (12,487) Core deposit intangible net of associated deferred (831) (899) (966) (1,033) (1,101) Tangible Capital (non-GAAP) 235,257$ 231,074$ 229,528$ 227,474$ 232,198$ Tangible Capital (non-GAAP) 235,257$ 231,074$ 229,528$ 227,474$ 232,198$ Unrealized losses on HTM securities net of tax (23,154) (25,702) (25,698) (28,346) (22,083) Adjusted Tangible Capital For Impact of Unrealized Losses on HTM Securities Net of Tax (non-GAAP) 212,103$ 205,372$ 203,830$ 199,128$ 210,115$ Common Equity Tier (CET) 1 Capital 253,044$ 250,888$ 250,217$ 250,748$ 250,543$ Total Assets for Leverage Ratio (non-GAAP) 2,721,892$ 2,699,710$ 2,701,212$ 2,684,740$ 2,608,171$ Tier 1 Leverage Ratio 9.30% 9.29% 9.26% 9.34% 9.61% Tangible Common Equity (non-GAAP) =Tangible Capital (non-GAAP)/Total Assets for Leverage Ratio (non- GAAP) 8.64% 8.56% 8.50% 8.47% 8.90% Adjusted Tangible Common Equity for HTM Impact (non- GAAP) = Adjusted Tangible Capital For Impact of Unrealized Losses on HTM Securities Net of Tax (non- GAAP)/Total Assets for Leverage Ratio (non-GAAP) 7.79% 7.61% 7.55% 7.42% 8.06% For the quarter ended (Dollars in thousands)
WESTFIELD BANK “WHAT BETTER BANKING’S ALL ABOUT” James C. Hagan , President and Chief Executive Officer Guida R. Sajdak , Executive Vice President and Chief Financial Officer Meghan Hibner , First Vice President and Investor Relations Officer 35 141 Elm Street, Westfield, MA