8-K
0001968487false00019684872025-09-242025-09-24


UNITED STATES
SECURITIES AND EXCHANGE COMMISSION
WASHINGTON, D.C. 20549


FORM 8-K


CURRENT REPORT

Pursuant to Section 13 or 15(d) of the Securities Exchange Act of 1934

Date of Report (Date of earliest event reported): September 24, 2025


WORTHINGTON STEEL, INC.

(Exact name of Registrant as Specified in Its Charter)


Ohio

001-41830

92-2632000

(State or Other Jurisdiction
of Incorporation)

(Commission File Number)

(IRS Employer
Identification No.)


100 W. Old Wilson Bridge Road


Columbus, Ohio


43085

(Address of Principal Executive Offices)


(Zip Code)


Registrant’s Telephone Number, Including Area Code: (614) 840-3462


(Former Name or Former Address, if Changed Since Last Report)


Check the appropriate box below if the Form 8-K filing is intended to simultaneously satisfy the filing obligation of the registrant under any of the following provisions:

Written communications pursuant to Rule 425 under the Securities Act (17 CFR 230.425)
Soliciting material pursuant to Rule 14a-12 under the Exchange Act (17 CFR 240.14a-12)
Pre-commencement communications pursuant to Rule 14d-2(b) under the Exchange Act (17 CFR 240.14d-2(b))
Pre-commencement communications pursuant to Rule 13e-4(c) under the Exchange Act (17 CFR 240.13e-4(c))

Securities registered pursuant to Section 12(b) of the Act:


Title of each class


Trading
Symbol(s)


Name of each exchange on which registered

Common Shares, without par value


WS


New York Stock Exchange

Indicate by check mark whether the registrant is an emerging growth company as defined in Rule 405 of the Securities Act of 1933 (§ 230.405 of this chapter) or Rule 12b-2 of the Securities Exchange Act of 1934 (§ 240.12b-2 of this chapter).

Emerging growth company

If an emerging growth company, indicate by check mark if the registrant has elected not to use the extended transition period for complying with any new or revised financial accounting standards provided pursuant to Section 13(a) of the Exchange Act.


Item 2.02 Results of Operations and Financial Condition.

On September 24, 2025, Worthington Steel, Inc. (“we,” “us,” “our” and “registrant”) issued a news release (the “Financial News Release”) reporting results for the three months ended August 31, 2025 (the first quarter of fiscal 2026). A copy of the Financial News Release is furnished herewith as Exhibit 99.1 and is incorporated herein by reference.


We conducted a conference call on September 25, 2025, to discuss our unaudited financial results for the first quarter of fiscal 2026 and address our outlook for the second quarter of fiscal 2026. A copy of the transcript of the conference call is included herewith as Exhibit 99.2 and is incorporated herein by reference. During the conference call, we referenced an investor presentation that was made available on our website throughout the conference call. The investor presentation is included herewith as Exhibit 99.3 and is incorporated herein by reference.


We have included both financial measures prepared in accordance with accounting principles generally accepted in the United States (“GAAP”) and non-GAAP financial measures in the Financial News Release, the investor presentation and the conference call to provide investors with additional information that we believe allows for increased comparability of the performance of our ongoing operations from period to period. Please see the Financial News Release and the investor presentation for further explanations of why we use the non-GAAP financial measures and the reconciliations to the most comparable GAAP financial measures.


The information contained in this Item 2.02, including Exhibit 99.1, Exhibit 99.2 and Exhibit 99.3, is being furnished pursuant to Item 2.02 and shall not be deemed to be “filed” for purposes of Section 18 of the Securities Exchange Act of 1934, as amended (the “Exchange Act”), or otherwise subject to the liabilities of that section, unless we specifically state that the information is to be considered “filed” under the Exchange Act or incorporate the information by reference into a filing under the Exchange Act or the Securities Act of 1933, as amended.

Item 5.07 Submission of Matters to a Vote of Security Holders.

On September 24, 2025, we held our 2025 Annual Meeting of Shareholders (the “Annual Meeting”). At the close of business on July 29, 2025, the record date for the Annual Meeting, there were a total of 50,870,805 common shares outstanding and entitled to vote. At the Annual Meeting, the holders of 45,234,278 (in excess of 88%) of our common shares were represented by proxy, constituting a quorum.

The results of the voting on the proposals presented to the shareholders at the Annual Meeting were as follows:


Proposal 1 — Election of Directors


Votes For


Votes Against


Abstentions


Broker Non-Votes

Jon J. Bowsher

35,619,116


6,235,543


38,206


3,341,413

Charles M. Chiappone

39,296,870


2,546,167


49,828


3,341,413

Mary Schiavo

32,653,766


9,047,388


191,711


3,341,413


At the Annual Meeting, our shareholders elected each of Mr. Bowsher, Mr. Chiappone and Ms. Schiavo as a director for a three-year term, expiring at the annual meeting of shareholders occurring in 2028.


Proposal 2 — Advisory Vote to Approve the Compensation of the NEOs


Votes For

Votes Against

Abstentions

Broker Non-Votes

40,379,527


1,245,153


268,185


3,341,413


At the Annual Meeting, our shareholders approved the advisory resolution to approve the compensation of our named executive officers, as described in our proxy statement for the Annual Meeting.

Proposal 3 — Ratification of the Selection of Independent Registered Public Accounting Firm


Votes For

Votes Against

Abstentions

44,923,177


267,429


43,672

At the Annual Meeting, our shareholders ratified the selection of KPMG LLP as our independent registered public accounting firm for the fiscal year ending May 31, 2026.

Item 8.01 Other Events.

On September 24, 2025, we issued a news release (the “Dividend Release”) reporting that our board of directors declared a quarterly cash dividend of $0.16 per common share. The dividend was declared on September 24, 2025, and is payable on December 26, 2025,


to our shareholders of record at the close of business on December 12, 2025. A copy of the Dividend Release is filed herewith as Exhibit 99.4.

Item 9.01 Financial Statements and Exhibits.

(d) Exhibits:


Exhibit No.


Description

99.1


News Release of Worthington Steel, Inc. issued on September 24, 2025 (Financial News Release)

99.2

Transcript of Worthington Steel, Inc. Earnings Conference Call held on September 25, 2025


99.3

Investor Presentation of Worthington Steel, Inc., dated September 24, 2025


99.4

News Release of Worthington Steel, Inc. issued on September 24, 2025 (Dividend Release)


104

Cover Page Interactive Data File (embedded within the Inline XBRL document)


SIGNATURES

Pursuant to the requirements of the Securities Exchange Act of 1934, the registrant has duly caused this report to be signed on its behalf by the undersigned hereunto duly authorized.


WORTHINGTON STEEL, INC.


Date:

September 29, 2025

By:

/s/ Joseph Y. Heuer


Joseph Y. Heuer
Vice President - General Counsel and Secretary


EXHIBIT 99.1


img239203593_0.jpg

Worthington Steel Reports First Quarter Fiscal 2026 Results


COLUMBUS, Ohio, September 24, 2025 – Worthington Steel, Inc. (NYSE: WS), a market-leading, value-added metals processing company, today reported financial results for the fiscal 2026 first quarter ended August 31, 2025.


First Quarter Highlights (all comparisons to the first quarter of fiscal 2025):

Net sales of $872.9 million increased 5% compared to $834.0 million.
Operating income of $48.3 million compared to $43.4 million.
Net earnings attributable to Worthington Steel of $36.8 million compared to $28.4 million.
Net earnings per diluted share attributable to Worthington Steel shareholders of $0.72 compared to $0.56; adjusted net earnings per diluted share attributable to Worthington Steel shareholders of $0.77 compared to $0.56.
Adjusted EBIT of $54.9 million compared to $39.4 million.
Declared a quarterly dividend of $0.16 per share payable on December 26, 2025, to shareholders of record at the close of business on December 12, 2025.
On June 3, 2025, the Company, through its wholly owned subsidiary Tempel Steel Company, LLC (“Tempel”), completed its acquisition of 52% of the issued and outstanding capital stock of S.I.T.E.M. S.p.A., a joint stock company incorporated under the laws of Italy (“Sitem” and, together with its subsidiaries, Stanzwerk AG, Decoup S.A.S. and Sitem Slovakia spol. s r.o., the “Sitem Group”).


“Worthington Steel is off to a strong start in fiscal 2026 driven by disciplined execution in a soft market, resulting in year-over-year volume growth,” said Geoff Gilmore, president and chief executive officer. “This quarter reflects the strength of our base business, our team’s ability to adapt in a dynamic market and the benefits of our transformation mindset. We are especially pleased to welcome the Sitem team into the Worthington Steel family this quarter. Together, we are building on 70 years of industrial heritage while positioning ourselves for long-term growth.”


Financial highlights for the fiscal 2026 period and the comparative period are as follows:

(In millions, except volume and per share amounts)


1Q 2026


1Q 2025


Volume (tons)


928,866


994,093


Net sales


$

872.9


$

834.0


Operating income


48.3


43.4


Net earnings attributable to Worthington Steel


36.8


28.4


Adjusted EBIT (Non-GAAP)(1)


54.9


39.4


Equity in net income of unconsolidated affiliate


6.4


1.3


Net earnings per diluted share attributable to Worthington Steel shareholders


$

0.72


$

0.56


Deemed dividend of redeemable noncontrolling interest (after-tax)


0.01


-


Restructuring and other (income), net per diluted share (after-tax)


(0.01

)


-


Acquisition completion bonus payment per diluted share (after-tax)


0.04


-


Deferred tax asset adjustment per diluted share (after-tax)


0.01


-


Adjusted net earnings per diluted share attributable to Worthington Steel shareholders (Non-GAAP)(1)


$

0.77


$

0.56


(1)
Results in both the current year period and prior year period were impacted by certain items, as further discussed in the Non-GAAP Financial Measures / Supplemental Data section later in this release.


Quarterly Results


Net sales for the first quarter of fiscal 2026 were $872.9 million, an increase of $38.9 million, or 5%, compared to the prior year quarter. The increase was driven primarily by higher direct volumes, and to a lesser extent, slightly higher average direct selling prices. The increases were partially offset by lower toll volumes as well as slightly lower average toll selling prices. Direct tons sold increased by 6%, of which the Sitem Group acquisition accounted for approximately 1% of the increase, and toll volumes decreased 22% in the first quarter of fiscal 2026 compared to the prior year quarter. The decrease in toll volumes was primarily related to softening demand from mill customers as well as lower volumes out of Worthington Samuel Coil Processing (“WSCP”) due to the closure of the toll processing manufacturing facility in Cleveland, Ohio. Direct selling prices increased 1% and toll selling prices decreased 3% in the first quarter of fiscal 2026 compared to the prior year quarter. The mix of direct tons versus toll tons processed was 63% to 37% in the first quarter of fiscal 2026 compared to 56% to 44% in the prior year quarter.


Gross margin increased by $14.8 million over the prior year quarter to $115.2 million. The increase was driven primarily by higher direct spreads and higher direct volumes, partially offset by lower toll margins. Direct spreads, up $23.0 million, were impacted by a $22.2 million favorable change from an estimated $16.6 million inventory holding loss in the prior year quarter to an estimated $5.6 million inventory holding gain in the first quarter of fiscal 2026. Higher direct volumes favorably impacted gross margin by $4.6 million. Toll margins, down $11.0 million, were impacted by an $8.1 million unfavorable impact due to lower volumes and a $2.9 million unfavorable change in toll mix.


Operating income increased $4.9 million from the prior year quarter to $48.3 million. The increase was driven primarily by a $14.8 million increase in gross margin and a $1.0 million gain within restructuring and other (income), net, partially offset by higher selling, general and administrative (“SG&A”) expense. The $10.9 million increase in SG&A expense was primarily due to the acquisition of Sitem Group, which reported $7.9 million of SG&A expenses in the first quarter of fiscal 2026, including a one-time bonus of $4.6 million that was paid to key individuals at the Sitem Group as a result of the successful closing. The incremental increase in SG&A expense was primarily attributable to an increase in compensation partially offset by a decrease in benefits expenses. The restructuring and other (income), net represents a gain on the sale of an asset that was reported within assets held for sale due to the previously announced closure of WSCP’s toll processing manufacturing facility in Cleveland, Ohio. The WSCP joint venture is consolidated with the equity owned by the other joint venture member shown as noncontrolling interest on the Company’s consolidated balance sheets.


Net earnings attributable to Worthington Steel of $36.8 million in the first quarter of fiscal 2026 compares to $28.4 million in the prior year quarter. Net earnings per diluted share attributable to Worthington Steel shareholders of $0.72 per diluted share for its fiscal 2026 first quarter compares to $0.56 per diluted share in the prior year quarter.


Adjusted net earnings attributable to Worthington Steel of $38.9 million in the first quarter of fiscal 2026 compares to $28.4 million in the prior year quarter. Adjusted net earnings per diluted share attributable to Worthington Steel shareholders of $0.77 per diluted share compares to $0.56 per diluted share in the prior year quarter. The first quarter of fiscal 2026 adjusted results exclude a $0.01 per diluted share adjustment due to a deemed dividend of redeemable noncontrolling interest, a $1.8 million after-tax acquisition completion bonus expense, or $0.04 per diluted share, and a $0.8 million deferred tax asset adjustment, or $0.01 per diluted share, offset by a $0.5 million after-tax sale on asset gain within restructuring and other (income), net, or $0.01 per diluted share. The adjustment in the prior year quarter did not have an impact on net earnings attributable to Worthington Steel shareholders.


Balance Sheet, Cash Flow and Capital Allocation


As of August 31, 2025, the Company had cash and cash equivalents of $78.3 million. During the first quarter of fiscal 2026, net cash used in operating activities was $5.0 million compared to net cash provided by operating activities of $54.6 million in the prior year quarter. Investment in property, plant and equipment during the first quarter of fiscal 2026 was $29.4 million compared to $21.5 million in the prior year quarter. Acquisitions, net of cash acquired, during the first quarter of fiscal 2026 was $1.6 million due to the acquisition of Sitem Group. The Company had negative free cash flow (as defined in the Non-GAAP Financial Measures / Supplemental Data section later in this release) of $34.4 million in the first quarter of fiscal 2026 compared to positive free cash flow of $33.1 million in the prior year quarter.


The Company ended the first quarter of fiscal 2026 with debt of $233.4 million and $78.3 million in cash and cash equivalents, resulting in a net debt (as defined in the Non-GAAP Financial Measures / Supplemental Data section later in this release) position of $155.1 million.


Beginning in the first quarter of fiscal 2026, the Sitem Group joint venture is consolidated within the Company’s financial statements. In connection with the Sitem Group acquisition, the Company recorded mezzanine equity on the consolidated balance sheet. Mezzanine equity is comprised of minority interest as well as the value associated with the net put option included within the purchase agreement.


The Company’s board of directors declared a quarterly dividend of $0.16 per common share. The dividend is payable on December 26, 2025, to shareholders of record at the close of business on December 12, 2025.


Conference Call


The Company will review fiscal 2026 first quarter results during its quarterly conference call on September 25, 2025, beginning at 8:30 a.m., Eastern Time. Conference call details are available in the investor section of the Company’s website at www.WorthingtonSteel.com.


About Worthington Steel


Worthington Steel (NYSE:WS) is a metals processor that partners with customers to deliver highly technical and customized solutions. Worthington Steel’s expertise in carbon flat-roll steel processing, electrical steel laminations and tailor welded solutions is driving steel toward a more sustainable future.


As one of the most trusted metals processors in North America, Worthington Steel and its approximately 6,000 employees harness the power of steel to advance our customers’ visions through value-added processing capabilities including galvanizing, pickling, configured blanking, specialty cold reduction, lightweighting and electrical lamination. Headquartered in Columbus, Ohio, Worthington Steel operates 37 facilities in seven states and 10 countries. Following a people-first Philosophy, commitment to sustainability and proven business system, Worthington Steel’s purpose is to generate positive returns by providing trusted and innovative solutions for customers, creating opportunities for employees and strengthening its communities.


Safe Harbor Statement

Selected statements contained in this release constitute “forward-looking statements,” as that term is used in the Private Securities Litigation Reform Act of 1995 (the “Act”). The Company wishes to take advantage of the safe harbor provisions included in the Act. Forward-looking statements reflect the Company’s current expectations, estimates or projections concerning future results or events. These statements are often identified by the use of forward-looking words or phrases such as “believe,” “anticipate,” “may,” “could,” “should,” “would,” “intend,” “plan,” “will,” “likely,” “expect,” “estimate,” “project,” “position,” “strategy,” “target,” “aim,” “seek,” “foresee” and similar words or phrases. These forward-looking statements include, without limitation, statements relating to: future or expected cash positions, liquidity and ability to access financial markets and capital; outlook, strategy or business plans; the anticipated benefits of the Company’s separation from Worthington Enterprises, Inc. (the “Separation”); the expected financial and operational performance of, and future opportunities for, the Company following the Separation; the tax treatment of the Separation transaction; the leadership of the Company following the Separation; future or expected growth, growth potential, forward momentum, performance, competitive position, sales, volumes, cash flows, earnings, margins, balance sheet strengths, debt, financial condition or other financial measures; pricing trends for raw materials and finished goods and the impact of pricing changes; the ability to improve or maintain margins; expected demand or demand trends for the Company or its markets; additions to product lines and opportunities to participate in new markets; expected benefits from transformation and innovation efforts; the ability to improve performance and competitive position at the Company’s operations; anticipated working capital needs, capital expenditures and asset sales; anticipated improvements and efficiencies in costs, operations, sales, inventory management, sourcing and the supply chain and the results thereof; projected profitability potential; the ability to make acquisitions and the projected timing, results, benefits, costs, charges and expenditures related to acquisitions, joint ventures, headcount reductions and facility dispositions, shutdowns and consolidations; projected capacity and the alignment of operations with demand; the ability to operate profitably and generate cash in down markets; the ability to capture and maintain market share and to develop or take advantage of future opportunities, customer initiatives, new businesses, new products and new markets; expectations for Company and customer inventories, jobs and orders; expectations for the economy and markets or improvements therein; expectations for generating improving and sustainable earnings, earnings potential, margins or shareholder value; effects of judicial rulings; the ever-changing effects of the novel coronavirus (“COVID-19”) pandemic and the various responses of governmental and nongovernmental authorities thereto on economies and markets, and on our customers, counterparties, employees and third-party service providers; and other non-historical matters.

Because they are based on beliefs, estimates and assumptions, forward-looking statements are inherently subject to risks and uncertainties that could cause actual results to differ materially from those projected. Any number of factors could affect actual results, including, without limitation, those that follow: our ability to successfully realize the anticipated benefits of the Separation; the effect of conditions in national and worldwide financial markets, including inflation, increases in interest rates and economic recession, and with respect to the ability of financial institutions to provide capital; the impact of tariffs, the adoption of trade restrictions affecting the Company’s products or suppliers, a United States withdrawal from or significant renegotiation of trade agreements, the occurrence of trade wars, the closing of border crossings, and other changes in trade regulations or relationships; changing oil prices and/or supply; product demand and pricing; changes in product mix, product substitution and market acceptance of the Company’s products; volatility or fluctuations in the pricing, quality or availability of raw materials (particularly steel), supplies, transportation, utilities, labor and other items required by operations (especially in light of Russia’s invasion of Ukraine); effects of sourcing and supply chain constraints; the outcome of adverse claims experience with respect to workers’ compensation, product recalls or product liability, casualty events or other matters; effects of facility closures and the consolidation of operations; the effect of financial difficulties, consolidation and other changes within the steel, automotive, construction and other industries in which the Company participates; failure to maintain appropriate levels of inventories; financial difficulties (including bankruptcy filings) of original equipment manufacturers, end-users


and customers, suppliers, joint venture partners and others with whom the Company does business; the ability to realize targeted expense reductions from headcount reductions, facility closures and other cost reduction efforts; the ability to realize cost savings and operational, sales and sourcing improvements and efficiencies, and other expected benefits from transformation initiatives, on a timely basis; the overall success of, and the ability to integrate, newly acquired businesses and joint ventures, maintain and develop their customers, and achieve synergies and other expected benefits and cost savings therefrom; the ability to realize expected benefits of strategically deployed capital expenditures; capacity levels and efficiencies, within facilities, within major product markets and within the industries in which the Company participates as a whole; the effect of disruption in the business of suppliers, customers, facilities and shipping operations due to adverse weather, casualty events, equipment breakdowns, labor shortages, interruption in utility services, civil unrest, international conflicts (especially in light of Russia’s invasion of Ukraine), terrorist activities or other causes; changes in customer demand, inventories, spending patterns, product choices, and supplier choices; risks associated with doing business internationally, including economic, political and social instability (especially in light of Russia’s invasion of Ukraine), foreign currency exchange rate exposure and the acceptance of the Company’s products in global markets; the ability to improve and maintain processes and business practices to keep pace with the economic, competitive and technological environment; the effect of inflation, interest rate increases and economic recession, as well as potential adverse impacts as a result of the Inflation Reduction Act of 2022, which may negatively impact the Company’s operations and financial results; deviation of actual results from estimates and/or assumptions used by the Company in the application of its significant accounting policies; the level of imports and import prices in the Company’s markets; the impact of environmental laws and regulations or the actions of the United States Environmental Protection Agency or similar regulators which increase costs or limit the Company’s ability to use or sell certain products; the impact of increasing environmental, greenhouse gas emission and sustainability regulations and considerations; the impact of judicial rulings and governmental regulations, both in the United States and abroad, including those adopted by the United States Securities and Exchange Commission (“SEC”) and other governmental agencies as contemplated by the Coronavirus Aid, Relief and Economic Security (CARES) Act, the Consolidated Appropriations Act, 2021, the American Rescue Plan Act of 2021, and the Dodd-Frank Wall Street Reform and Consumer Protection Act of 2010; the effect of healthcare laws in the United States and potential changes for such laws, which may increase the Company’s healthcare and other costs and negatively impact the Company’s operations and financial results; the effect of tax laws in the United States and potential changes for such laws, which may increase the Company's costs and negatively impact its operations and financial results; cyber security risks; risks associated with artificial intelligence technologies; the effects of privacy and information security laws and standards; the cyclical nature of the steel industry; the Company’s safety performance; the effects of competition and price pressures from competitors; and other risks described from time to time in the Company’s filings with the SEC, including those described in “Part I – Item 1A. – Risk Factors” of the Company’s Annual Report on Form 10-K for the fiscal year ended May 31, 2025.

Forward-looking statements should be construed in the light of such risks. The Company notes these factors for investors as contemplated by the Act. It is impossible to predict or identify all potential risk factors. Consequently, you should not consider the foregoing list to be a complete set of all potential risks and uncertainties. Readers are cautioned not to place undue reliance on any forward-looking statements, which speak only as of the date made. The Company does not undertake, and hereby disclaims, any obligation to update any forward-looking statements, whether as a result of new information, future developments or otherwise, except as required by applicable law.


WORTHINGTON STEEL, INC.
CONSOLIDATED STATEMENTS OF EARNINGS
(In millions, except per share amounts)

(Unaudited)


Three Months Ended


August 31,


2025


2024


Net sales


$

872.9


$

834.0


Cost of goods sold


757.7


733.6


Gross margin


115.2


100.4


Selling, general and administrative expense


67.9


57.0


Restructuring and other (income), net


(1.0

)


-


Operating income


48.3


43.4


 Other income (expense):


Miscellaneous income (expense), net


0.2


(5.9

)

Interest expense, net


(2.9

)


(2.6

)

Equity in net income of unconsolidated affiliate


6.4


1.3


Earnings before income taxes


52.0


36.2


Income tax expense


13.4


4.0


Net earnings


38.6


32.2


Net earnings attributable to noncontrolling interests


1.8


3.8


Net earnings attributable to Worthington Steel


$

36.8


$

28.4


Deemed dividend of redeemable noncontrolling interest


(0.5

)


-


Net earnings attributable to Worthington Steel shareholders


$

36.3


$

28.4


Basic


Weighted average common shares outstanding


49.6


49.4


Earnings per share attributable to Worthington Steel shareholders


$

0.73


$

0.57


Diluted


Weighted average common shares outstanding


50.6


50.4


Earnings per share attributable to Worthington Steel shareholders


$

0.72


$

0.56


Common shares outstanding at end of period


49.6


49.4


Cash dividends declared per share


$

0.16


$

0.16


WORTHINGTON STEEL, INC.
CONSOLIDATED BALANCE SHEETS
(In millions, except share amounts)

(Unaudited)


August 31,


May 31,


2025


2025


Assets


Current assets:


Cash and cash equivalents


$

78.3


$

38.0


Restricted cash


-


54.9


Receivables, less allowances of $0.4 and $3.8, respectively


490.3


438.7


Inventories


Raw materials


215.1


179.4


Work in process


169.5


165.6


Finished products


93.9


77.0


Total inventories


478.5


422.0


Income taxes receivable


1.6


0.1


Assets held for sale


11.2


11.5


Prepaid expenses and other current assets


88.6


83.3


Total current assets


1,148.5


1,048.5


Investment in unconsolidated affiliate


133.0


126.6


Operating lease right-of-use assets


87.3


72.6


Finance lease right-of-use assets, net of accumulated amortization of $0.5 and $–, respectively


8.4


-


Goodwill


101.7


79.6


Other intangible assets, net of accumulated amortization of $52.4 and $50.3, respectively


90.0


67.9


Deferred tax asset


10.4


11.4


Other assets


8.0


7.0


Property, plant and equipment:


Land


44.2


38.6


Buildings and improvements


217.8


190.4


Machinery and equipment


1,015.6


942.6


Construction in progress


151.7


132.7


Total property, plant and equipment


1,429.3


1,304.3


Less: accumulated depreciation


773.3


756.1


Total property, plant and equipment, net


656.0


548.2


Total assets


$

2,243.3


$

1,961.8


WORTHINGTON STEEL, INC.
CONSOLIDATED BALANCE SHEETS
(In millions, except share amounts)

(Unaudited)


August 31,


May 31,


2025


2025


Liabilities, mezzanine equity, and equity


Current liabilities:


Accounts payable


$

385.7


$

402.5


Short-term borrowings


160.0


149.2


Accrued compensation, contributions to employee benefit plans and related taxes


54.8


43.0


Dividends payable


9.1


9.3


Other accrued items


24.2


15.3


Current operating lease liabilities


10.6


7.7


Current finance lease liabilities


2.4


-


Income taxes payable


16.5


4.5


Current maturities of long-term debt


30.3


-


Total current liabilities


693.6


631.5


Other liabilities


48.8


32.8


Long-term debt


43.1


2.3


Noncurrent operating lease liabilities


80.9


68.7


Noncurrent finance lease liabilities


6.0


-


Deferred income taxes


40.0


28.6


Total liabilities


912.4


763.9


Mezzanine equity:


Redeemable noncontrolling interest


97.7


-


Total mezzanine equity


97.7


-


Shareholders’ equity - controlling interest:


Preferred shares, without par value; authorized – 1,000,000 shares; no shares issued or outstanding


-


-


Common shares, without par value; authorized – 150,000,000 shares; issued


and outstanding 49,635,244 shares and 49,548,895 shares, respectively


-


-


Additional Paid-in Capital


915.3


913.9


Retained Earnings


192.5


164.2


Accumulated other comprehensive loss, net of taxes of $(2.0) and $(2.0), respectively


(2.9

)


(4.0

)

Total Shareholders’ equity - controlling interest


1,104.9


1,074.1


Noncontrolling interests


128.3


123.8


Total equity


1,233.2


1,197.9


Total liabilities, mezzanine equity, and equity


$

2,243.3


$

1,961.8


WORTHINGTON STEEL, INC.
CONSOLIDATED STATEMENTS OF CASH FLOWS
(In millions)

(Unaudited)


Three Months Ended


August 31,


2025


2024


Operating activities:


Net earnings


$

38.6


$

32.2


Adjustment to reconcile net earnings to net cash provided by operating activities:


Depreciation and amortization


20.3


16.2


Provision for (benefit from) deferred income taxes


(1.4

)


(0.9

)


Bad debt income


(0.1

)


(0.2

)


Equity in net income of unconsolidated affiliate, net of distributions


(6.4

)


(1.3

)


Net (gain) loss on sale of assets


0.2


0.1


Stock-based compensation


7.4


2.4


Changes in assets and liabilities, net of impact of acquisitions:


Receivables


(15.9

)


28.5


Inventories


(16.4

)


13.2


Accounts payable


(46.7

)


(25.5

)


Accrued compensation and employee benefits


(0.2

)


(13.2

)


Other operating items, net


15.6


3.1


Net cash (used in) provided by operating activities


(5.0

)


54.6


Investing activities:


Investment in property, plant and equipment


(29.4

)


(21.5

)


Acquisitions, net of cash acquired


(1.6

)


-


Proceeds from sale of assets, net of selling costs


0.1


-


Net cash used in investing activities


(30.9

)


(21.5

)


Financing activities:


Proceeds from short-term borrowings, net


15.0


(15.0

)


Proceeds from revolving credit facility borrowings - swing loans


437.4


146.6


Repayments of revolving credit facility borrowings - swing loans


(441.6

)


(157.4

)


Proceeds from long-term debt, net of issuance costs


22.6


-


Principal payments on long-term debt


(2.7

)


-


Proceeds from issuance of common shares, net of tax withholdings


(1.6

)


(1.6

)


Payments to noncontrolling interests


-


(1.9

)


Dividends paid


(8.1

)


(8.0

)


Net cash provided by (used in) financing activities


21.0


(37.3

)


Effects of exchange rate changes on cash, cash equivalents, and restricted cash


0.3


-


Decrease in cash, cash equivalents, and restricted cash


(14.6

)


(4.2

)


Cash, cash equivalents, and restricted cash at beginning of period


92.9


40.2


Cash, cash equivalents, and restricted cash at end of period


$

78.3


$

36.0


WORTHINGTON STEEL, INC.
NON-GAAP FINANCIAL MEASURES / SUPPLEMENTAL DATA
(In millions, except volume and per share amounts)


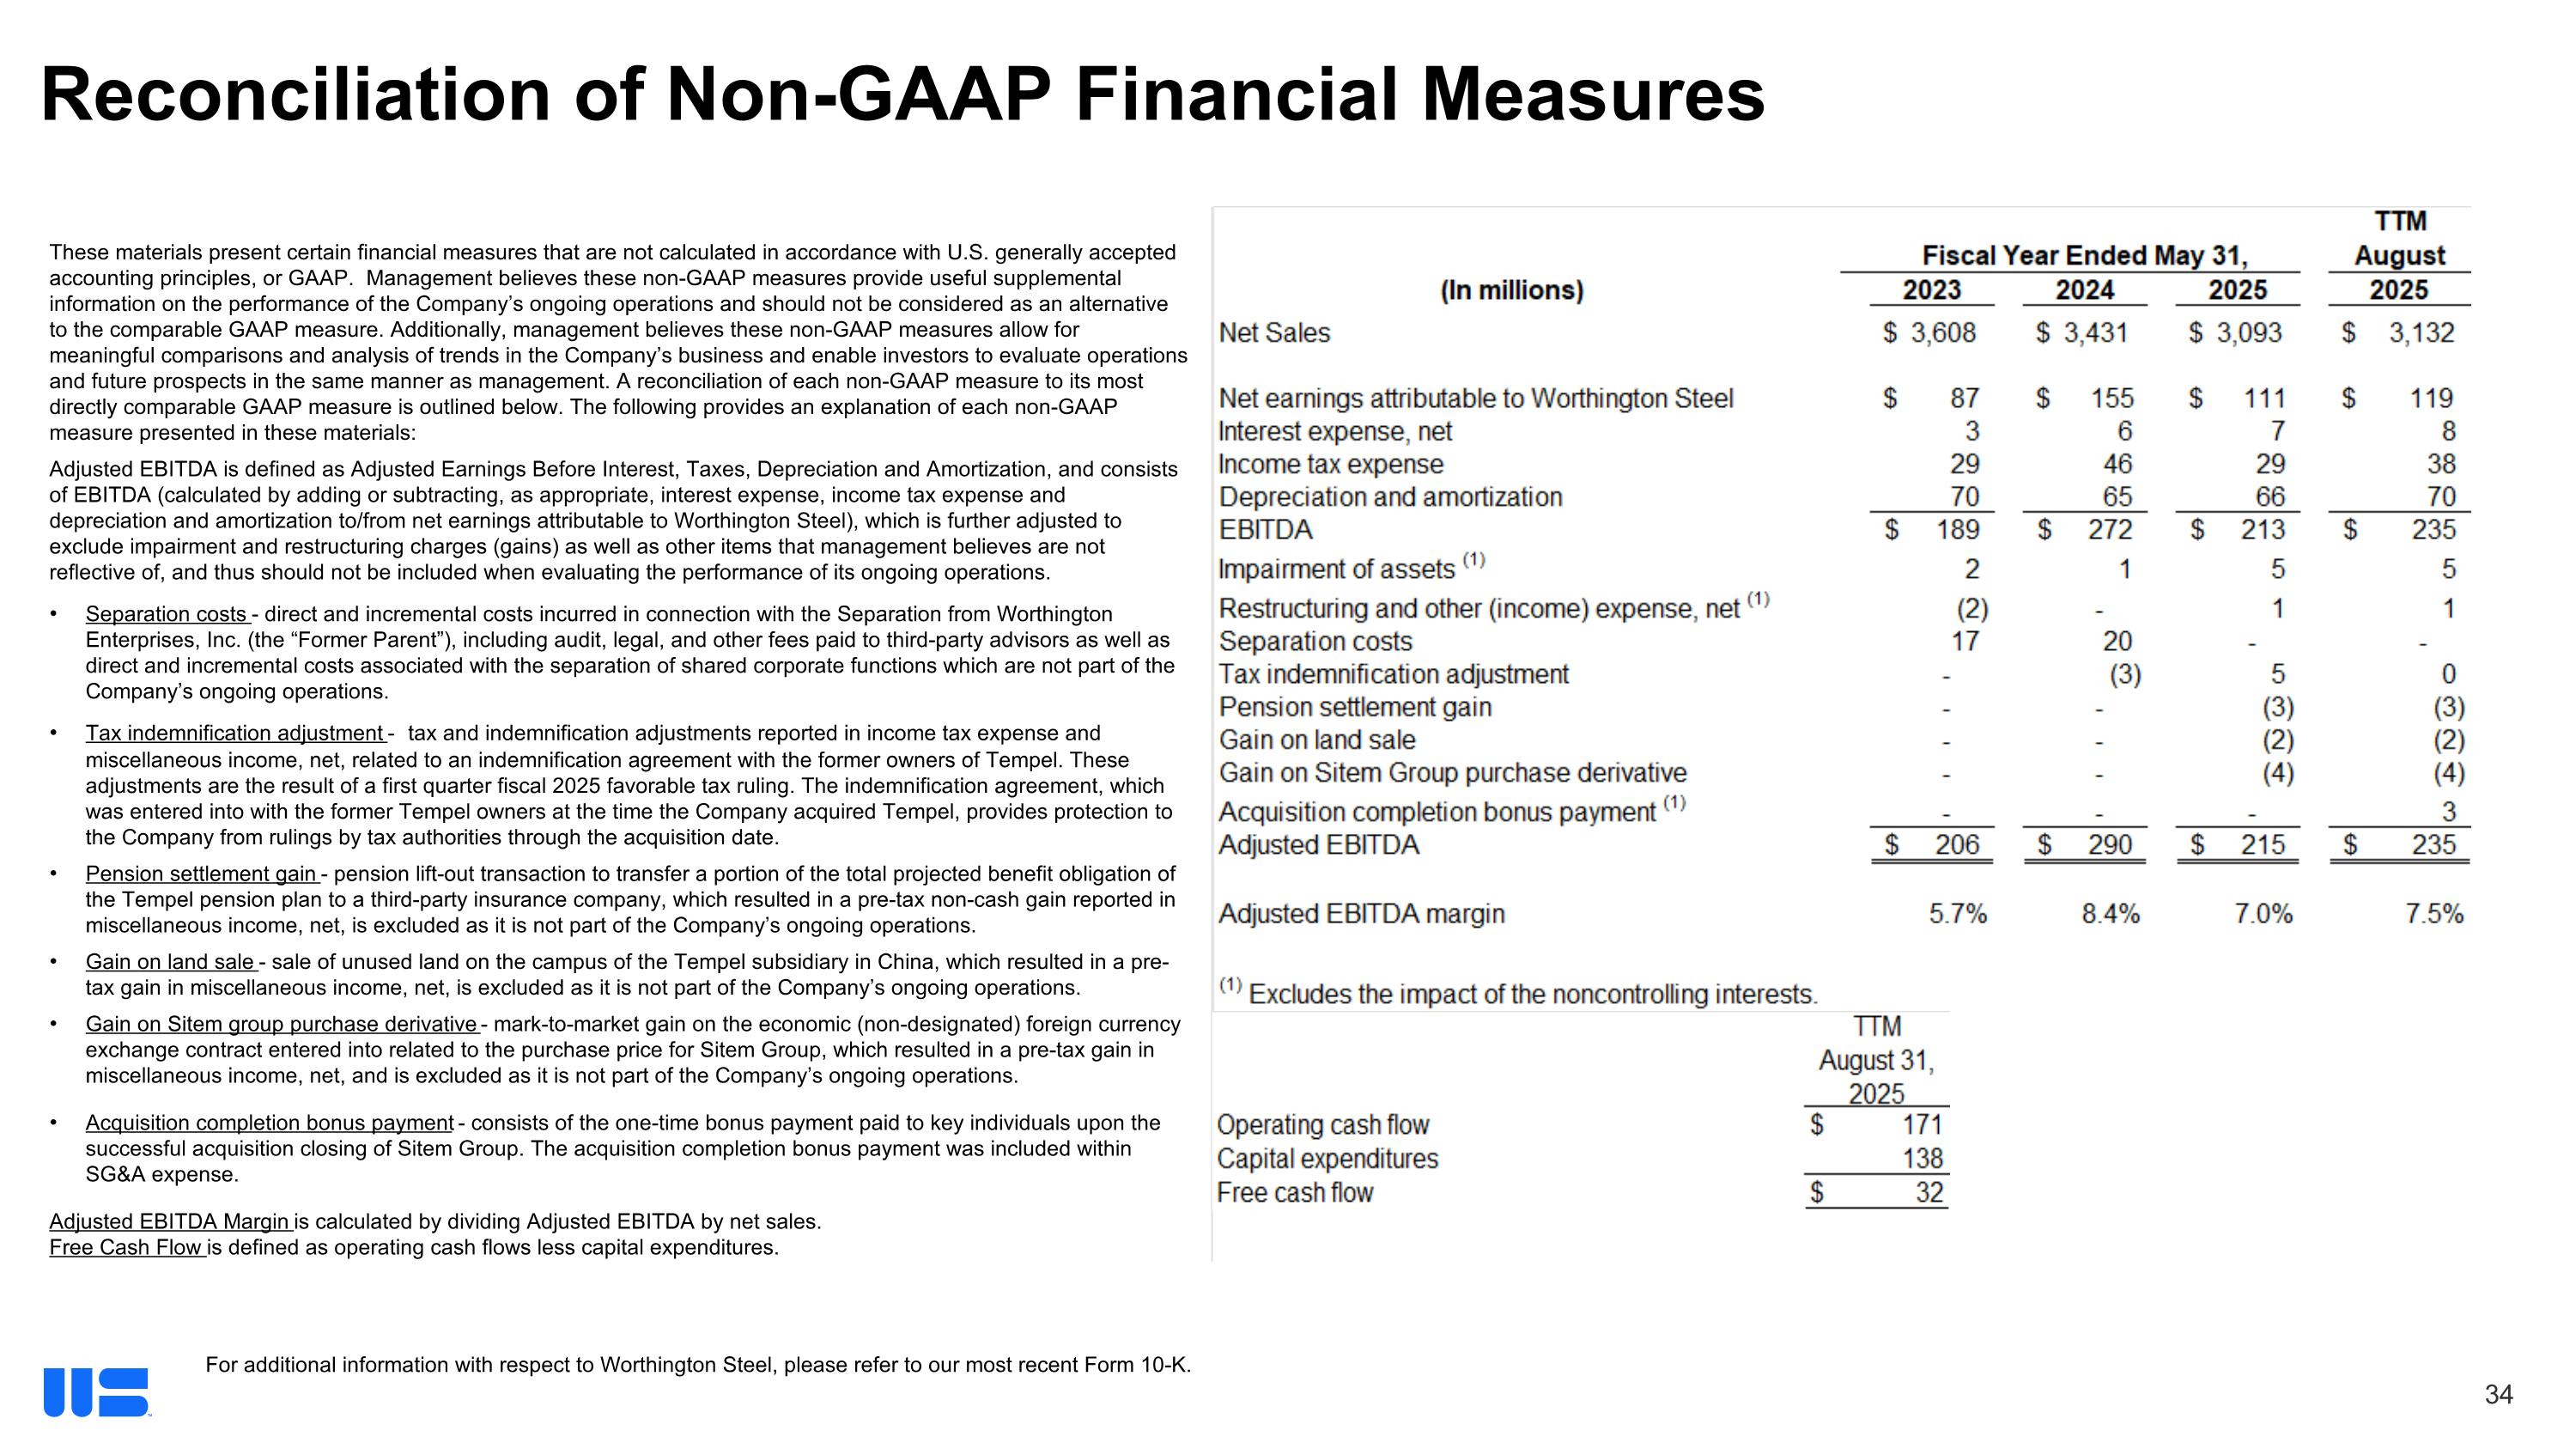
The Company reports its financial results in accordance with accounting principles generally accepted in the United States (“GAAP”). The Company also presents certain non-GAAP financial measures including (a) adjusted operating income, (b) adjusted earnings before income taxes, (c) adjusted income tax expense, (d) adjusted net earnings attributable to Worthington Steel, (e) adjusted net earnings per diluted share attributable to Worthington Steel shareholders, (f) net earnings before interest and taxes attributable to Worthington Steel (“EBIT”), (g) adjusted net earnings before interest and taxes attributable to Worthington Steel (“adjusted EBIT”), (h) net earnings before interest, taxes, depreciation and amortization attributable to Worthington Steel (“EBITDA”), (i) adjusted net earnings before interest, taxes, depreciation and amortization attributable to Worthington Steel (“adjusted EBITDA”), (j) free cash flow, and (k) total debt less cash and cash equivalents (“net debt”).


These non-GAAP financial measures typically exclude impairment and restructuring charges (gains) but may also exclude other items that management believes are not reflective of, and thus should not be included when evaluating the performance of, the Company’s ongoing operations. Management uses these non-GAAP financial measures to evaluate the Company’s performance, engage in financial and operational planning, and determine incentive compensation and believes these non-GAAP financial measures provide useful information to investors because they provide additional perspective on the performance of the Company’s ongoing operations. Additionally, management believes these non-GAAP financial measures provide useful information to investors because they allow for meaningful comparisons and analysis of trends in the Company’s business and enable investors to evaluate operations and future prospects in the same manner as management.


For the purposes of the subsequent tables, the non-GAAP measures have been adjusted for the items identified below:

Deemed dividend of redeemable noncontrolling interest – represents the accretion of the carrying value of the redeemable noncontrolling interest related to the Sitem Group acquisition.
Restructuring – restructuring activities consist of items that are not part of the Company's ongoing operations, such as divestitures, closing or consolidating facilities, employee severance (including rationalizing headcount or other significant changes in personnel), and realignment of existing operations (including changes to management structure in response to underlying performance and/or changing market conditions).
Tax indemnification adjustment – tax and indemnification adjustments reported in income tax expense and miscellaneous income, net, related to an indemnification agreement with the former owners of Tempel. These adjustments are the result of a first quarter fiscal 2025 favorable tax ruling. The indemnification agreement, which was entered into with the former Tempel owners at the time the Company acquired Tempel, provides protection to the Company from rulings by tax authorities through the acquisition date.
Acquisition completion bonus payment – consists of the one-time bonus payment paid to key individuals upon the successful acquisition closing of Sitem Group. The acquisition completion bonus payment was included within SG&A expense.
Deferred tax asset adjustment – Tempel’s electrical steel facility in Nagold, Germany, was included as part of the purchase consideration for the Sitem Group acquisition. The contribution resulted in the future disallowance of deferred tax assets located within certain foreign certain tax jurisdictions and resulted in the write-off of the deferred tax assets as well as the recognition of incremental income tax expense. As this impacts income tax, the adjustment does not impact EBIT, EBITDA, adjusted EBIT, or adjusted EBITDA.


The following provides a reconciliation to the non-GAAP financial measures adjusted operating income, adjusted earnings before income taxes, adjusted income tax expense, adjusted net earnings attributable to Worthington Steel and adjusted net earnings per diluted share attributable to Worthington Steel shareholders from the most comparable GAAP measures for the three-month periods ended August 31, 2025, and August 31, 2024.


Three Months Ended August 31, 2025


Operating
Income


Earnings Before Income Taxes


Income Tax Expense (Benefit)


Net Earnings Attributable to Worthington Steel(1)


Net Earnings per Diluted Share Attributable to Worthington Steel shareholders


GAAP


$

48.3


$

52.0


$

13.4


$

36.8


$

0.72


Deemed dividend of redeemable noncontrolling interest


-


-


-


-


0.01


Restructuring and other (income), net


(1.0

)


(1.0

)


(0.1

)


(0.5

)


(0.01

)

Acquisition completion bonus payment


4.6


4.6


0.6


1.8


0.04


Deferred tax asset adjustment


-


-


(0.8

)


0.8


0.01


Non-GAAP


$

51.9


$

55.6


$

13.1


$

38.9


$

0.77


Three Months Ended August 31, 2024


Operating
Income


Earnings Before Income Taxes


Income Tax Expense


Net Earnings Attributable to Worthington Steel(1)


Net Earnings per Diluted Share Attributable to Worthington Steel shareholders


GAAP


$

43.4


$

36.2


$

4.0


$

28.4


$

0.56


Tax indemnification adjustment


-


4.4


4.4


-


-


Non-GAAP


$

43.4


$

40.6


$

8.4


$

28.4


$

0.56


(1)
Excludes the impact of the noncontrolling interest.


To further assist in the analysis of results for the periods presented, the following volume and net sales information for the three-month periods ended August 31, 2025, and August 31, 2024, has been provided along with a reconciliation of the non-GAAP financial measures, EBIT, adjusted EBIT and adjusted EBITDA to the most comparable GAAP measure, which is net earnings attributable to Worthington Steel. Net earnings margin is calculated by dividing net earnings attributable to Worthington Steel by net sales. Adjusted EBIT margin is calculated by dividing adjusted EBIT by net sales. Adjusted EBITDA margin is calculated by dividing adjusted EBITDA by net sales.


Three Months Ended


August 31,


(In millions, except volume)

2025


2024


Volume (tons)


928,866


994,093


Net sales

$

872.9


$

834.0


Net earnings attributable to Worthington Steel

$

36.8


$

28.4


Interest expense, net


2.9


2.6


Income tax expense


13.4


4.0


EBIT


53.1


35.0


Restructuring and other (income), net(1)


(0.6

)


-


Tax indemnification adjustment


-


4.4


Acquisition completion bonus payment(2)


2.4


-


Adjusted EBIT


54.9


39.4


Depreciation and amortization


20.3


16.2


Adjusted EBITDA

$

75.2


$

55.6


Net earnings margin


4.2

%


3.4

%

Adjusted EBIT margin


6.3

%


4.7

%

Adjusted EBITDA margin


8.6

%


6.7

%


(1)
Excludes the noncontrolling interest portion of restructuring and other (income), net of $(0.4) million in the fiscal 2026 period.
(2)
Excludes the noncontrolling interest portion of the acquisition completion bonus payment of $2.2 million in the fiscal 2026 period.


The table below provides a reconciliation from net earnings attributable to Worthington Steel (the most comparable GAAP financial measure) to the non-GAAP financial measures, EBITDA and adjusted EBITDA, for each of the past five fiscal quarters, the 12 months ended August 31, 2025, and the 12 months ended May 31, 2025.


First


Fourth


Third


Second


First


Quarter


Quarter


Quarter


Quarter


Quarter


2026


2025


2025


2025


2025


Net earnings attributable to Worthington Steel


$

36.8


$

55.7


$

13.8


$

12.8


$

28.4


Interest expense, net


2.9


1.0


1.4


2.1


2.6


Income tax expense


13.4


16.2


5.0


3.6


4.0


Depreciation and amortization


20.3


16.9


16.6


16.3


16.2


EBITDA


73.4


89.8


36.8


34.8


51.2


Impairment of assets(1)


-


-


4.6


-


-


Restructuring and other (income) expense, net(2)


(0.6

)


1.0


0.5


-


-


Tax indemnification adjustment


-


0.2


-


-


4.4


Pension settlement gain


-


-


-


(2.7

)


-


Gain on land sale


-


-


-


(1.5

)


-


Gain on Sitem Group purchase derivative


-


(4.0

)


-


-


-


Acquisition completion bonus payment(3)


2.4


-


-


-


-


Adjusted EBITDA


$

75.2


$

87.0


$

41.9


$

30.6


$

55.6


Trailing 12 months adjusted EBITDA


$

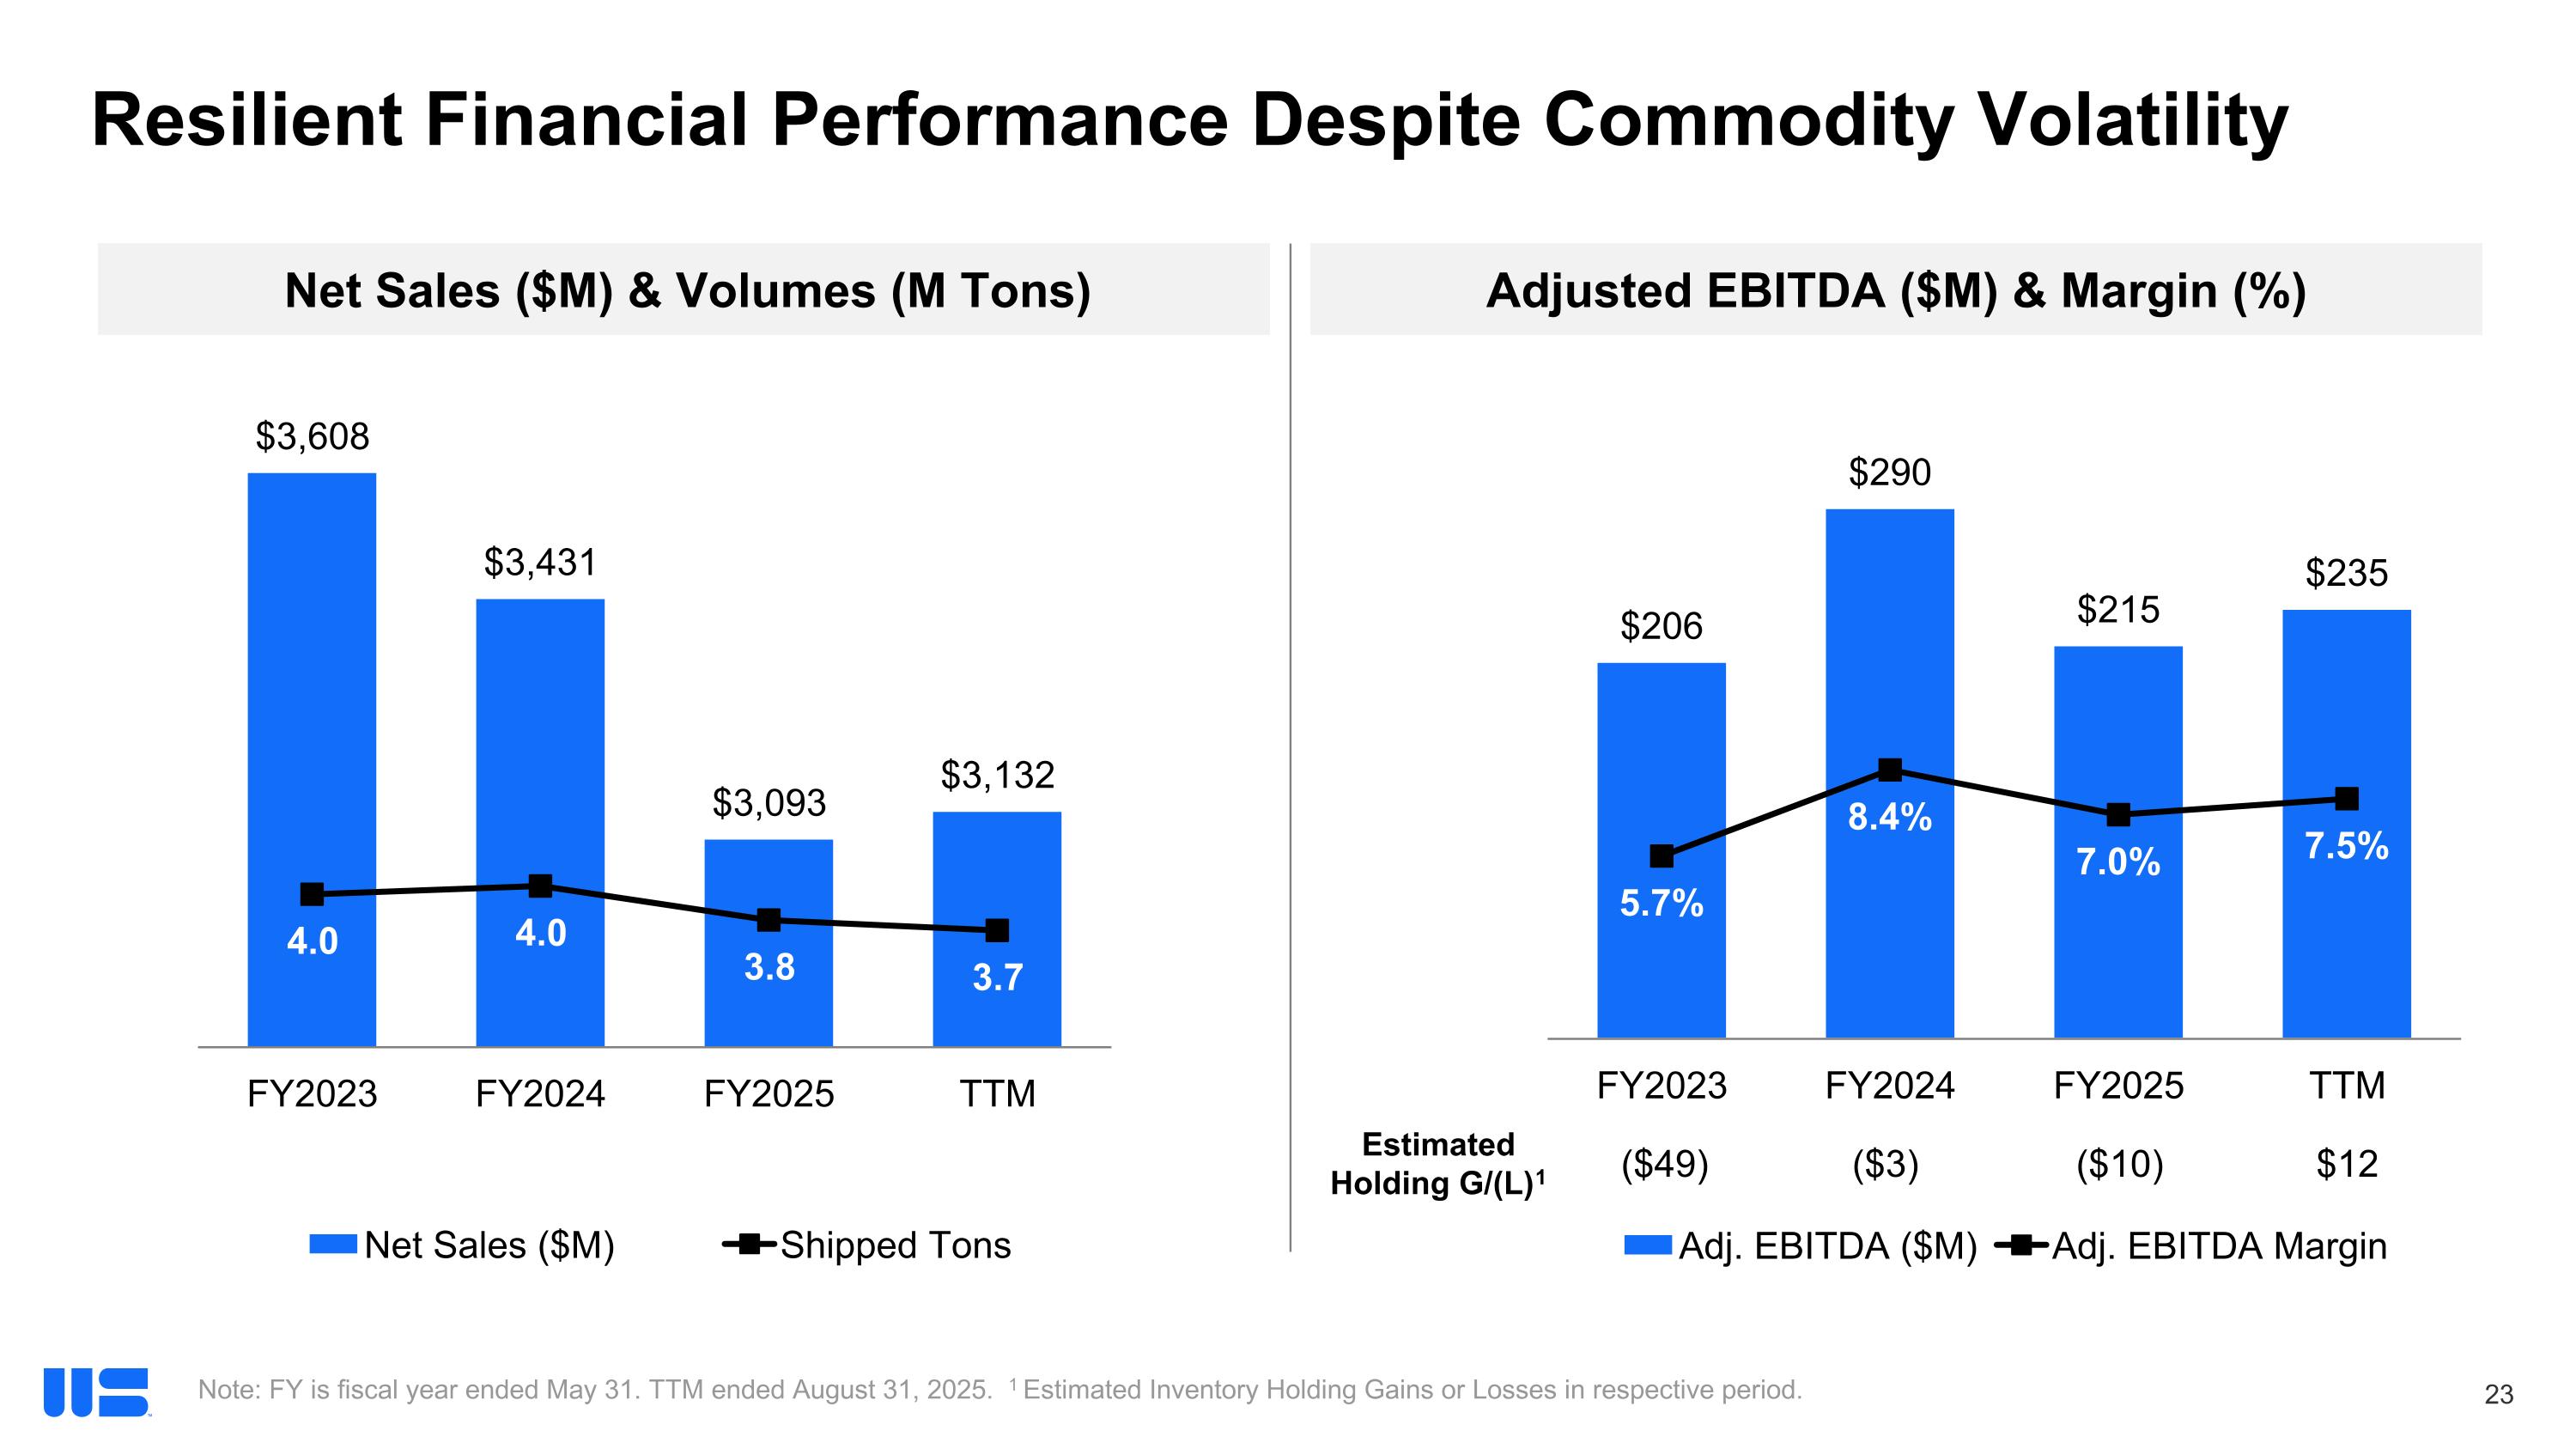
234.7


$

215.1


(1)
Excludes the noncontrolling interest portion of impairment of assets of $2.8 million in the third quarter of fiscal 2025.
(2)
Excludes the noncontrolling interest portion of restructuring and other (income) expense, net of $(0.4) million, $0.7 million, and $0.4 million in the first quarter of fiscal 2026, fourth quarter of fiscal 2025, and third quarter of fiscal 2025, respectively.
(3)
Excludes the noncontrolling interest portion of the acquisition completion bonus payment of $2.2 million in the fiscal 2026 period.


The following provides a reconciliation of net cash provided by operating activities (the most comparable GAAP financial measure) to free cash flow for each of the past five fiscal quarters and the 12 months ended August 31, 2025. Free cash flow is a non-GAAP financial measure that management believes measures the Company’s ability to generate cash beyond what is required for its business operations and capital expenditures.


First


Fourth


Third


Second


First


Quarter


Quarter


Quarter


Quarter


Quarter


2026


2025


2025


2025


2025


Net cash (used in) provided by operating activities


$

(5.0

)


$

53.9


$

53.8


$

68.0


$

54.6


Investment in property, plant and equipment


(29.4

)


(45.5

)


(28.6

)


(34.8

)


(21.5

)

Free cash flow


$

(34.4

)


$

8.4


$

25.2


$

33.2


$

33.1


Trailing 12 months free cash flow


$

32.4


The following provides a reconciliation of total debt (the most comparable GAAP financial measure) to the non-GAAP financial measure net debt. Net debt is calculated by subtracting cash and cash equivalents from total debt (defined as the aggregate of short-term borrowings, current maturities of long-term debt, and long-term debt). The calculation of net debt as of August 31, 2025, is outlined below.


August 31,


2025


Short-term borrowings


$

160.0


Current maturities of long-term debt


30.3


Long-term debt


43.1


Total debt


$

233.4


Less: cash and cash equivalents


(78.3

)

Net debt


$

155.1


###


EXHIBIT 99.2


Worthington Steel, Inc.

NYSE:WS

Earnings Call

Thursday, September 25, 2025 1:30 PM GMT

CALL PARTICIPANTS 2

PRESENTATION 3

QUESTION AND ANSWER 8


WORTHINGTON STEEL, INC. FQ1 2026 EARNINGS CALL SEP 25, 2025


Call Participants

....................................................................................................................................................................

EXECUTIVES


Geoffrey G. Gilmore

CEO, President & Director


Timothy A. Adams

VP & CFO


Melissa Dykstra

Vice President of Corporate Communication & Investor Relations


ANALYSTS


Martin John Englert

Seaport Research Partners


Philip Ross Gibbs

KeyBanc Capital Markets Inc., Research Division


John Charles Tumazos

John Tumazos Very Independent Research, LLC

2


WORTHINGTON STEEL, INC. FQ1 2026 EARNINGS CALL SEP 25, 2025


Presentation

....................................................................................................................................................................

Operator

Good morning, and welcome to Worthington Steel's First Quarter Fiscal Year 2026 Earnings Call. [Operator Instructions]

I will now turn the call over to Melissa Dykstra, Vice President of Corporate Communications and Investor Relations. Please go ahead.

Melissa Dykstra

Vice President of Corporate Communication & Investor Relations


Thank you, operator. Good morning, and welcome to Worthington Steel’s first quarter fiscal year 2026 earnings call.


On our call today, we have Geoff Gilmore, Worthington Steel’s President and Chief Executive Officer, and Tim Adams, Vice President and Chief Financial Officer. Before we begin, I'd like to remind everyone that certain statements made today are forward-looking within the meaning of the 1995 Private Securities Litigation Reform Act. These statements are subject to risks and uncertainties that could cause actual results to differ from those suggested. We issued our earnings release yesterday after the market closed. Please refer to it for more detail on the factors that could cause actual results to differ materially. Unless noted as reported, today’s discussion will reference non-GAAP financial measures, which adjust for certain items included in our GAAP results and which are presented on a stand-alone basis. You can find definitions of each non-GAAP measure and GAAP to non-GAAP reconciliations within our earnings release.


Today's call is being recorded, and a replay will be available later today on WorthingtonSteel.com.

Now I'll turn it over to Geoff Gilmore.

Geoffrey G. Gilmore

CEO, President & Director


Good morning and thank you for joining Worthington Steel’s first quarter fiscal year 2026 earnings call.

As always, I’ll begin by thanking the people of Worthington Steel. I’m incredibly proud of our team’s commitment to safety, quality, and our customers throughout the quarter.

I want to extend a warm welcome to the Sitem team. We completed our acquisition of 52 percent of Sitem in June. To our Sitem teammates who may be on the call, we are thrilled to have you join the Worthington family and I’m excited about what we’ll accomplish together. We’re off to a strong start in fiscal year 2026, driven by disciplined execution in a soft market, resulting in year-over-year volume growth. Adjusted EBITDA came in at 75.2 million dollars. Earnings per share were 72 cents. And net sales were 872.9 million dollars.


This performance reflects the strength of our base business, the advantages of our commercial and operational agility, and the benefits of our ongoing Transformation. An important highlight of our quarter was safety. Through training, continuous improvement and the commitment of every Worthington Steel employee, we achieved our safest quarter on record. But there is still work to do to ensure every employee goes home safely and we meet our goal of zero injuries. Congratulations to our environmental, health and safety team, our operations team and all Worthington Steel employees on this vitally important achievement.


Looking at our key end markets and business trends. The macro environments remain mixed – visibility is limited in several sectors, and we expect this to persist for the near term. That said, we are cautiously optimistic despite continued uncertainty in the market. At Worthington Steel, we’re not waiting for clarity to act. We’re focused on what we can control, and we are positioning ourselves to win in any environment.

3


WORTHINGTON STEEL, INC. FQ1 2026 EARNINGS CALL SEP 25, 2025


Uncertainty can create opportunity; and that’s where we lean in. When supply chains shift, we collaborate. When customers face complexity, we deliver solutions.


This quarter, we saw continued growth in automotive with new programs ramping up to drive volume. In fact, during the period, the Detroit 3 saw a 5 percent year-over-year production increase while our shipments increased by nearly 13 percent compared to the prior year. Our commercial teams are doing an outstanding job winning new business. We remain cautiously optimistic about the automotive market for the rest of CY2025. We also offset some of the slowness in the heavy truck market with an increase in market share during our first quarter. Construction, in the sub-sectors we serve, remains soft but steady. We are disciplined and efficient in how we serve this space. The Ag market continues to experience challenges, but we remain committed to our customers and ready to adapt. I’d like to commend our commercial team for their focus on proactively serving our customers. The strong relationships they build and cultivate help us capitalize on opportunities and gain new customers, new business and new market share.

Turning to our long-term strategy. Our team continues to make progress on electrical steel investments, margin-accretive growth, and base business transformation. In Canada, we remain on schedule to start production in early calendar year 2026, expanding our ability to support the ever-growing need for electricity in the United States with transformer cores. Transformers remain in short supply and the market is expected to grow by up to seven percent per year over the next decade. The expansion of our facility in Mexico will begin production in just a few months and trials are currently underway. This facility will supply electrical steel laminations for traction motors in hybrid and electric vehicles as the electrification of transportation continues. With the close of our Sitem acquisition, we’ve expanded our reach in the global EV market and are now integrating Sitem’s automation and toolmaking capabilities to strengthen our competitiveness across our electrical steel platform. Transformation at Worthington Steel is a daily discipline. It’s how we improve safety, productivity, and customer outcomes.


We now have the opportunity to fuel and accelerate that work with artificial intelligence. We are using AI to gain insight, assess strategies and automate low-value tasks. We are testing use cases like predictive maintenance and intelligent reporting and we are confident about the gains we will see over time. Adding AI to our transformation toolbox, both in operations and the back office, will allow our teams to focus on the critical 20 percent of their job that drives the most value for our business. At the same time, our employees will gain more fulfillment from their careers as the more repetitive tasks are cleared from their daily work. This quarter, we identified, launched and are advancing four critical AI-driven pilots. Demand forecasting to improve capacity planning and inventory management. Predictive inventory optimization to reduce inbound raw material inventory. Predictive maintenance to reduce downtime, and forecast and demand planning automation. All four of these are expected to provide cost savings and/or free up cash flow when fully implemented.


Additionally, we continue to see progress as we apply the transformation to our back-office functions. As examples. We launched a project to automate daily cash posting, reducing effort by more than 10 hours per month, and increasing reliability. We streamlined IT access provisioning, creating a more efficient process for adding software and system access for our employees, which saves our IT staff 20 hours per week. And, we applied process automation to significantly cut manual work in our back-office credit function, saving 80 hours per month. These are just a few samples of ongoing work, but these are real improvements –measurable, repeatable and aligned with our long-term goals. I believe our culture of continuous improvement through the Transformation, combined with our Golden Rule of treating people the way we want to be treated, is our secret weapon. Alongside that is our sound strategy and a disciplined approach to capital allocation. Our priorities are clear; generate strong free cash flow, invest in the high-return opportunities, and pursue M&A that creates strategic value. With a 70-year heritage, we are building a company that is stronger, more efficient, and more valuable year after year.


4


WORTHINGTON STEEL, INC. FQ1 2026 EARNINGS CALL SEP 25, 2025


To close, I want to thank our 6,000 employees, our customers, and our shareholders. Worthington Steel is operating with a clear strategy, a culture of execution and continuous improvement, and a deep bench of talent. That’s a powerful combination — and I believe it sets us apart. Thank you for your time today and for your continued interest in Worthington Steel.

Now I'll turn it over to Tim Adams to walk through our financials.


Timothy A. Adams

VP & CFO


Thank you, Geoff, and good morning everyone. 


 For the first quarter, we are reporting earnings of 36.8 million dollars or 72 cents per share as compared with earnings of 28.4 million dollars or 56 cents per share in the prior year quarter. We closed on the Sitem acquisition on June 3rd. Sitem is reported on a one-month lag and, as such, our first quarter includes two months of Sitem results. The minority interest associated with Sitem is reported as redeemable non-controlling interest in a new mezzanine equity section of our consolidated balance sheet as the Sitem purchase agreement includes put and call options, which are exercisable in Euros, several years from now. Mezzanine equity is presented at redeemable value in US dollars. Our earnings per share include a 1 cent negative impact, shown as a deemed dividend on the redeemable non-controlling interest, due to a change in the redeemable value primarily associated with the dollar to Euro exchange rate.


There were several other unique items that impacted our quarterly results. First, the current quarter results include 1 million dollars, or 1 cent per share, of pre-tax restructuring related to a gain on sale of an asset associated with our previously announced closure of the Worthington Samuel Coil Processing toll pickling facility in Cleveland. Additionally, in the current quarter, we recognized 4.6 million dollars, or 4 cents per share, of compensation expense within SG&A related to a one-time bonus paid to certain key Sitem employees upon closing of the Sitem acquisition. Finally, the current year quarter included an 800 thousand dollar, or 1 cent per share, tax expense associated with the disallowance of certain tax assets due to the contribution of Nagold as part of the Sitem acquisition. The prior year quarter included the recognition of a tax court ruling related to a Tempel pre-acquisition matter for which we were indemnified by the former owners of Tempel. The net impact to earnings of the tax court ruling was zero. However, we recognized 4.4 million dollars of miscellaneous expense related to the indemnity payable, offset by 4.4 million dollars of tax income associated with a refund in the prior year quarter.


Excluding these unique items and the deemed dividend on redeemable non-controlling interest on Sitem, we generated earnings of 77 cents per share in the current year quarter compared with 56 cents per share in the prior year quarter. In the first quarter we had estimated pre-tax inventory holding gains of 5.6 million dollars, or 8 cents per share, compared to estimated pre-tax inventory holding losses of 16.6 million dollars or 25 cents per share in the prior year quarter, a favorable pre-tax swing of 22.2 million dollars or 33 cents per share.  In the first quarter, we reported adjusted EBIT of 54.9 million dollars, which was up 15.5 million dollars from the prior year quarter adjusted EBIT of 39.4 million dollars.  The increase in adjusted EBIT is primarily due to higher gross margin and an increase in equity earnings at Serviacero, partially offset by higher SG&A expense. 


Gross margin increased 14.8 million dollars as compared with the prior year quarter, primarily due to higher direct material spreads combined with higher direct volumes partially offset by lower toll processing gross margin. Direct spreads were up 23 million dollars, primarily due to the year-over-year improvement in pre-tax inventory holding gains in the current year as compared with losses in the prior year. Higher year-over-year direct volume delivered an additional 4.6 million dollars of gross margin.


Offsetting these increases, our toll processing gross margin was down 11 million dollars from the prior year, primarily due to lower toll volumes and a tolling mix that was lower value added. Equity earnings

5


WORTHINGTON STEEL, INC. FQ1 2026 EARNINGS CALL SEP 25, 2025


from Serviacero increased due to higher direct spreads, inventory holding gains, as well as the favorable impact of exchange rate movements. The 10.9 million dollar increase in SG&A included a one-time 4.6-million-dollar bonus paid to certain key Sitem employees upon closing the acquisition I mentioned earlier. Excluding this one-time item, SG&A was up 6.3 million dollars compared to the prior year quarter, with the increase split equally between incremental Sitem expense and an increase in other SG&A, primarily due to increased compensation expense.


Next, I will provide some perspective on the market and our shipments.   The market pricing for hot rolled coil peaked at 950 dollars per ton in March and has generally experienced downward pressure due to softer volumes in many markets, despite an increase in tariffs on imported steel that was implemented in June. Current pricing for hot rolled coil is approximately 800 dollars per ton, again reflecting softer market demand. Given that many of our contracts use lagging index-based pricing mechanisms, we expect to generate inventory holding losses in the second quarter of Fiscal 2026. We estimate those losses could be approximately 5 to 10 million dollars as compared with the 5.6 million dollars of estimated holding gains in the current quarter. 

Net sales in the quarter were 873 million dollars, up 39 million dollars, or 5 percent from the prior year quarter, primarily due to the addition of Sitem and higher direct volume, partially offset by lower selling prices and, to a lesser extent, lower toll volumes and a toll processing mix that was unfavorable.  We shipped approximately 929 thousand tons during the quarter, down 7 percent compared with the prior year quarter, due to the decrease in toll volumes.  Direct sales volume made up 63 percent of our mix in the current year quarter as compared with 56 percent in the prior year quarter.  Direct sale volume increased 6 percent compared with the prior year quarter, with the vast majority of the volume increase coming from our existing facilities complemented by the addition of Sitem. We experienced pluses and minuses across various markets as customers continued to navigate uncertainty during the quarter.


Automotive was a bright spot during the current quarter. Our shipments to the automotive market were up 17 percent compared to the prior year quarter. As we noted in prior quarters, we have won share in the automotive market. The new programs continue to ramp up and volumes have increased across the board for our D3 OEM customers. We expect volume from the new programs to continue layering in over the next few quarters. Similar to the past few quarters, our year-over-year shipments to the D3 OEMs grew more than OEM unit production. We estimate production grew approximately 5 percent for the Detroit 3 on a year-over-year basis, while our D3 shipments increased nearly 13 percent. We continue to work closely with our automotive customers to provide solutions that create value for both sides. Our longstanding relationships and collaborative approach are driving incremental growth in this market. 

The volume increase in the automotive market was partially offset by reductions in the construction, Ag, service center and heavy truck markets while we saw some modest increases in the energy and container markets.  Our shipments to the construction market fell a modest 3 percent while our ag volumes were down nearly 50 percent compared with the prior-year quarter, primarily due to continued softness in the agricultural equipment market.


Our shipments to the heavy truck market were down 7 percent, however, we were able to offset some of the softness with new business in the heavy truck market.

Toll processing volumes were down 22 percent year-over-year, for several reasons. First, the overall market was softer in the current year, resulting in less toll processing from mills and service centers. Second, we closed the Cleveland-area Worthington Samuel Coil Processing facility in the fourth quarter of last fiscal year.


Finally, as we discussed last quarter, we were impacted by several customer decisions. For example, one customer changed a program from toll processing to direct sale while another customer elected to re-source a toll processing program to capture freight savings. When end-market demand picks back up, we expect our toll processing volumes to increase. However, as we discussed in prior quarters, in normal

6


WORTHINGTON STEEL, INC. FQ1 2026 EARNINGS CALL SEP 25, 2025


market conditions, we expect to see a decrease of approximately 100,000 annual toll processing tons primarily as a result of the WSCP consolidation from Cleveland to Twinsburg.


Turning to cash flows and the balance sheet. Cash flow from operations was a 5-million-dollar outflow and free cash flow was a 34-million-dollar outflow. Cash flows for the quarter were impacted by increases in working capital.   During the quarter, we spent 29 million dollars on capital expenditures related to a variety of projects, including the previously announced electrical steel expansions. Our cap ex forecast for Fiscal 2026 remains at 100 million dollars. Our disciplined approach to capital is aligned with long-term priorities to support growth and customer needs even in uncertain times. We may revise our capex estimate next quarter once we complete our review of Sitem’s capex priorities. On a trailing-12-month basis, we generated 34 million dollars of free cash flow.

Wednesday, we announced a quarterly dividend of 16 cents per share, payable on December 26, 2025.    

We ended the quarter with 78 million dollars of cash and our outstanding debt as of August 31st was 233 million dollars, resulting in net debt of 155 million dollars.  Net debt increased over the sequential quarter primarily due to increases in working capital.

Finally, I would like to thank everyone at Worthington Steel for making safety their highest priority and for driving results in a challenging market. With a strong balance sheet, a clear strategy, and an agile team, Worthington Steel is well-positioned to create value and move decisively when opportunities arise.

I want to express my sincere gratitude to our entire team for their hard work and for living Worthington’s Philosophy while delivering value to our shareholders.

At this point, we would be happy to take your questions.  


7


WORTHINGTON STEEL, INC. FQ1 2026 EARNINGS CALL SEP 25, 2025


Question and Answer

....................................................................................................................................................................

Operator

[Operator Instructions] Our first question comes from the line of Phil Gibbs with KeyBanc Capital Markets.

Philip Ross Gibbs

KeyBanc Capital Markets Inc., Research Division

Geoff and Tim, can you maybe give us a little bit more color on the Sitem transaction, particularly in terms of the mezzanine financing structure. It's certainly something pretty unique, particularly when foreign currency is involved. So I think we're just trying to get a feel for how much you actually paid for Sitem, the 52% stake this go around and maybe what could be the residual unclear to us how much cash went out the door initially here.

Timothy A. Adams

VP & CFO

Yes. I understand, Phil, it's Tim, good morning. Why don't we start with how we financed the acquisition, and then I'll pivot to this concept of mezzanine equity. So the Sitem purchase price was composed of $60 million in cash, and we disclosed that in the 10-K. So $60 million of cash combined with the contribution of the German facility. That was the Nagold facility we purchased a couple of years ago. So we financed the Sitem acquisition using the ABL. You can see that on last quarter's balance sheet. You may remember that we had a category called restricted cash, and that was the cash that was earmarked for the cash portion of the transaction.

When it comes to the mezzanine equity piece of this, so typically, minority interest of a majority-owned joint venture sits in equity as permanent capital. So in Sitem's case, our partners have a put option that's outside of our control, so we can't classify it as minority interest as part of permanent equity. So according to the accounting guidance, it's not truly really a liability either. So it sits between liabilities and equity

in its own category. The minority interest is denominated in euros, so we have to adjust it for changes in exchange rates. The EPS adjustments this quarter reflect the change in FX between the euros and the dollars. So it's not mezzanine debt, it's mezzanine equity.

Philip Ross Gibbs

KeyBanc Capital Markets Inc., Research Division

And regarding automotive, certainly some very strong share gains with the Big 3, as you mentioned, Geoff, in your prepared remarks. What do you see moving forward for automotive? And is there more opportunity to layer in more business or share in '26?

Geoffrey G. Gilmore

CEO, President & Director

Yes. Phil cautiously optimistic. I know you're very used to me saying that at this point. But we project we'll probably finish the year at like 15 million unit build rate, which honestly, we're pleased with. If you recall, just a couple of calls ago, forecasts were all over, they were as low as 13.5 million. So it's been a bit more resilient than we thought, and we would certainly hope into '26, there's an opportunity for a little bit more market recovery there, hopefully, with some tailwinds from a couple more interest rate cuts. However, regardless of the direction of the overall automotive market, yes, we've -- the commercial group has continued to do an excellent job gaining market share. You saw that layered in quite nicely last quarter and again this quarter.

And to answer your question specifically, are there further opportunities to gain market share? The answer to that question is yes. The group continues to find opportunities. I think you'll continue to see some

of that market share layered in, and we'll be coming up on contract season soon and I think we have some very good prospects there. So that would be looking at market share that could be filtering in next

8


WORTHINGTON STEEL, INC. FQ1 2026 EARNINGS CALL SEP 25, 2025


calendar year. So, we continue to see very good momentum there from our commercial team working with those customers.

Philip Ross Gibbs

KeyBanc Capital Markets Inc., Research Division

And the last question I have is just because I've been getting it from investors is the derivative Section 232 tariffs on electrical steel laminations -- certainly know you've got operations north and south of the border. And I think the crux of the question is how do you manage through that environment and continue to try to achieve your profitability goals and volume aspirations?

Geoffrey G. Gilmore

CEO, President & Director

Thanks, Phil. Still bullish on electrification and on both of those projects that you referenced in Canada and Mexico. As far as electrical steel laminations and transformer cores being included in the 232 derivatives, Phil, we've seen little impact. We don't think we're going to see any material impact going forward. The customers are paying or are willing to pay the tariffs. And then, Phil, we also have pretty significant chunk of our customer base that is USMCA compliant. So, it would not affect them. But we're in a good position. I mean those are -- they're robust markets. The demand is extremely strong. And just sticking to the facts, there's not the capacity or efficient enough supply chains in the U.S. to be able to supply those customers. So, we're positioned well even with those being included as derivatives -- part of the derivative products of 232.

Operator

Our next question comes from the line of John Tumazos with John Tumazos Very Independent Research.

John Charles Tumazos

John Tumazos Very Independent Research, LLC

The August 11 U.S. Steel coke accident took out 1.7 million tons of coke capacity for them, which I guess equates to 3 million to 4 million tons of slabs. Presumably, my first question is Worthington is a preferred customer, and you've had no disruption or interruption.

The second question, should we interpret that as taking 3 million to 4 million tons of crude capacity out of the market until fixed? Or would you expect U.S. Steel to pay extra to buy third-party coke to buy prime scrap $450, $500 a ton or buy slabs, which with tariffs are harder to get by too.

Geoffrey G. Gilmore

CEO, President & Director

John, the first part of that question, I can easily answer, and it's not going to have any impact on our business. Certainly, we have a great relationship with U.S. Steel, but we have equally good relationships with several other mill sources. So, we're not seeing -- would not anticipate any interruptions in our supply chains.

As far as the second question, I just honestly would have to say I don't know. I would rule out buying slabs for the very reason that you referenced. As far as the other 2 options, I'm not sure. I don't have an answer to that question.

9


WORTHINGTON STEEL, INC. FQ1 2026 EARNINGS CALL SEP 25, 2025


Operator

Our final question will come from the line of Martin Englert with Seaport Research Partners.

Martin John Englert

Seaport Research Partners

Question on the direct volumes were 63% of the mix, toll volumes down 22% year-on-year. How much of the toll decline was related to the closure of Worthington Samuel versus mill and other customers? Is that just that 100,000 that you cited earlier as far as the Worthington Samuel portion? Or is there something different going on there?

Timothy A. Adams

VP & CFO

There's a couple of things. So half of that reduction is due to market conditions, right? So the mills and service centers are a little bit slower. And then the vast majority of the other piece of that is related to the Worthington Samuel Coil Processing shutdown. There's some other things going on there. For example, we had a customer ask us to change their program from toll to direct. So that's in that number as well as we had a customer decide to move a program because they could generate some freight savings. But those are relatively small in comparison to the Worthington Samuel Coil Processing shutdown.

Martin John Englert

Seaport Research Partners

Okay. Would you generally expect to remain above that 60% level that we've been at for the past couple of quarters?

Timothy A. Adams

VP & CFO

Yes. I think going forward, Martin, I think our direct sale volume is probably going to be in that 60% to 65% range and toll will then be 35% to 40%.

Martin John Englert

Seaport Research Partners

Okay. Can you discuss what you're seeing so far with volumes in fiscal 2Q, including seasonal factors that we should be taking into consideration, I guess, kind of what I'm getting at things continue to trend like down overall around mid-single digits year-on-year?

Timothy A. Adams

VP & CFO

Well, I mean, from a seasonality perspective, Martin, remember that -- so Q1 is typically the average quarter and Q2 is usually 3% or 4% below that, and Q3 is usually 3% or 4% below Q1 as well. I think we would expect normal seasonality because Thanksgiving is not going away, right? You've got the holidays in there that typically don't go away. So we'll see that. And I think we talked a couple of weeks ago where we said demand was okay. And I think we don't see any big motivator or any big event that's going to trigger a giant increase in demand. So I think you're going to see markets kind of -- until there's more clarity and some of this uncertainty goes away on tariffs and other things, I think you're going to see these markets just kind of move along as they have been.

10


WORTHINGTON STEEL, INC. FQ1 2026 EARNINGS CALL SEP 25, 2025


Martin John Englert

Seaport Research Partners

With recent orders, are you seeing any change in upstream mill order books and lead times?

Geoffrey G. Gilmore

CEO, President & Director

No. We haven't seen any changes there at all at this point.

Operator

And I will now turn the call back over to Geoff Gilmore, President and CEO, for closing remarks.

Geoffrey G. Gilmore

CEO, President & Director

Thanks again for listening in. Again, very good quarter in a tough environment. And I think if you look at what we are able to control, it was a great quarter. The group is managing costs at a very high level. We are gaining market share, and we look forward to more interest rate cuts. We look forward to getting a continental agreement put in place. And I think if we're able to see those with how we've positioned the company, we can start to move our barometer from cautiously optimistic to optimistic. But right now, we're very focused on executing our strategy, and we will look forward to talking to you all next quarter and sharing our success. Thank you.

Operator

That concludes our call today. Thank you all for joining. You may now disconnect.


11


Slide 1

Worthington Steel Investor Presentation | September 2025 Exhibit 99.3

Slide 2

Safe Harbor Statement Selected statements contained in this release constitute “forward-looking statements,” as that term is used in the Private Securities Litigation Reform Act of 1995 (the “Act”).  The Company wishes to take advantage of the safe harbor provisions included in the Act.  Forward-looking statements reflect the Company’s current expectations, estimates or projections concerning future results or events.  These statements are often identified by the use of forward-looking words or phrases such as “believe,” “anticipate,” “may,” “could,” “should,” “would,” “intend,” “plan,” “will,” “likely,” “expect,” “estimate,” “project,” “position,” “strategy,” “target,” “aim,” “seek,” “foresee” and similar words or phrases. These forward-looking statements include, without limitation, statements relating to:  future or expected cash positions, liquidity and ability to access financial markets and capital; outlook, strategy or business plans; the anticipated benefits of the Company’s separation from Worthington Enterprises, Inc. (the “Separation”); the expected financial and operational performance of, and future opportunities for, the Company following the Separation; the tax treatment of the Separation transaction; the leadership of the Company following the Separation; future or expected growth, growth potential, forward momentum, performance, competitive position, sales, volumes, cash flows, earnings, margins, balance sheet strengths, debt, financial condition or other financial measures; pricing trends for raw materials and finished goods and the impact of pricing changes; the ability to improve or maintain margins; expected demand or demand trends for the Company or its markets; additions to product lines and opportunities to participate in new markets; expected benefits from transformation and innovation efforts; the ability to improve performance and competitive position at the Company’s operations; anticipated working capital needs, capital expenditures and asset sales; anticipated improvements and efficiencies in costs, operations, sales, inventory management, sourcing and the supply chain and the results thereof; projected profitability potential; the ability to make acquisitions and the projected timing, results, benefits, costs, charges and expenditures related to acquisitions, joint ventures, headcount reductions and facility dispositions, shutdowns and consolidations; projected capacity and the alignment of operations with demand; the ability to operate profitably and generate cash in down markets; the ability to capture and maintain market share and to develop or take advantage of future opportunities, customer initiatives, new businesses, new products and new markets; expectations for Company and customer inventories, jobs and orders; expectations for the economy and markets or improvements therein; expectations for generating improving and sustainable earnings, earnings potential, margins or shareholder value; effects of judicial rulings; the ever-changing effects of the novel coronavirus (“COVID-19”) pandemic and the various responses of governmental and nongovernmental authorities thereto on economies and markets, and on our customers, counterparties, employees and third-party service providers; and other non-historical matters.      Because they are based on beliefs, estimates and assumptions, forward-looking statements are inherently subject to risks and uncertainties that could cause actual results to differ materially from those projected. Any number of factors could affect actual results, including, without limitation, those that follow:  our ability to successfully realize the anticipated benefits of the Separation; the effect of conditions in national and worldwide financial markets, including inflation, increases in interest rates and economic recession, and with respect to the ability of financial institutions to provide capital; the impact of tariffs, the adoption of trade restrictions affecting the Company’s products or suppliers, a United States withdrawal from or significant renegotiation of trade agreements, the occurrence of trade wars, the closing of border crossings, and other changes in trade regulations or relationships; changing oil prices and/or supply; product demand and pricing; changes in product mix, product substitution and market acceptance of the Company’s products; volatility or fluctuations in the pricing, quality or availability of raw materials (particularly steel), supplies, transportation, utilities, labor and other items required by operations (especially in light of Russia’s invasion of Ukraine); effects of sourcing and supply chain constraints; the outcome of adverse claims experience with respect to workers’ compensation, product recalls or product liability, casualty events or other matters; effects of facility closures and the consolidation of operations; the effect of financial difficulties, consolidation and other changes within the steel, automotive, construction and other industries in which the Company participates; failure to maintain appropriate levels of inventories; financial difficulties (including bankruptcy filings) of original equipment manufacturers, end-users and customers, suppliers, joint venture partners and others with whom the Company does business; the ability to realize targeted expense reductions from headcount reductions, facility closures and other cost reduction efforts; the ability to realize cost savings and operational, sales and sourcing improvements and efficiencies, and other expected benefits from transformation initiatives, on a timely basis; the overall success of, and the ability to integrate, newly acquired businesses and joint ventures, maintain and develop their customers, and achieve synergies and other expected benefits and cost savings therefrom; capacity levels and efficiencies, within facilities, within major product markets and within the industries in which the Company participates as a whole; the effect of disruption in the business of suppliers, customers, facilities and shipping operations due to adverse weather, casualty events, equipment breakdowns, labor shortages, interruption in utility services, civil unrest, international conflicts (especially in light of Russia’s invasion of Ukraine), terrorist activities or other causes; changes in customer demand, inventories, spending patterns, product choices, and supplier choices; risks associated with doing business internationally, including economic, political and social instability (especially in light of Russia’s invasion of Ukraine), foreign currency exchange rate exposure and the acceptance of the Company’s products in global markets; the ability to improve and maintain processes and business practices to keep pace with the economic, competitive and technological environment; the effect of inflation, interest rate increases and economic recession, as well as potential adverse impacts as a result of the Inflation Reduction Act of 2022, which may negatively impact the Company’s operations and financial results; deviation of actual results from estimates and/or assumptions used by the Company in the application of its significant accounting policies; the level of imports and import prices in the Company’s markets; the impact of environmental laws and regulations or the actions of the United States Environmental Protection Agency or similar regulators which increase costs or limit the Company’s ability to use or sell certain products; the impact of increasing environmental, greenhouse gas emission and sustainability regulations and considerations; the impact of judicial rulings and governmental regulations, both in the United States and abroad, including those adopted by the United States Securities and Exchange Commission (“SEC”) and other governmental agencies as contemplated by the Coronavirus Aid, Relief and Economic Security (CARES) Act, the Consolidated Appropriations Act, 2021, the American Rescue Plan Act of 2021, and the Dodd-Frank Wall Street Reform and Consumer Protection Act of 2010; the effect of healthcare laws in the United States and potential changes for such laws, which may increase the Company’s healthcare and other costs and negatively impact the Company’s operations and financial results; the effect of tax laws in the United States and potential changes for such laws, which may increase the Company's costs and negatively impact its operations and financial results; cyber security risks; the effects of privacy and information security laws and standards; and other risks described from time to time in the Company’s filings with the SEC, including those described in “Part I – Item 1A. – Risk Factors” of the Company’s Annual Report on Form 10-K for the fiscal year ended May 31, 2024 and its subsequent filings with the SEC.    Forward-looking statements should be construed in the light of such risks. The Company notes these factors for investors as contemplated by the Act. It is impossible to predict or identify all potential risk factors. Consequently, you should not consider the foregoing list to be a complete set of all potential risks and uncertainties. Readers are cautioned not to place undue reliance on any forward-looking statements, which speak only as of the date made. The Company does not undertake, and hereby disclaims, any obligation to update any forward-looking statements, whether as a result of new information, future developments or otherwise, except as required by applicable law.  
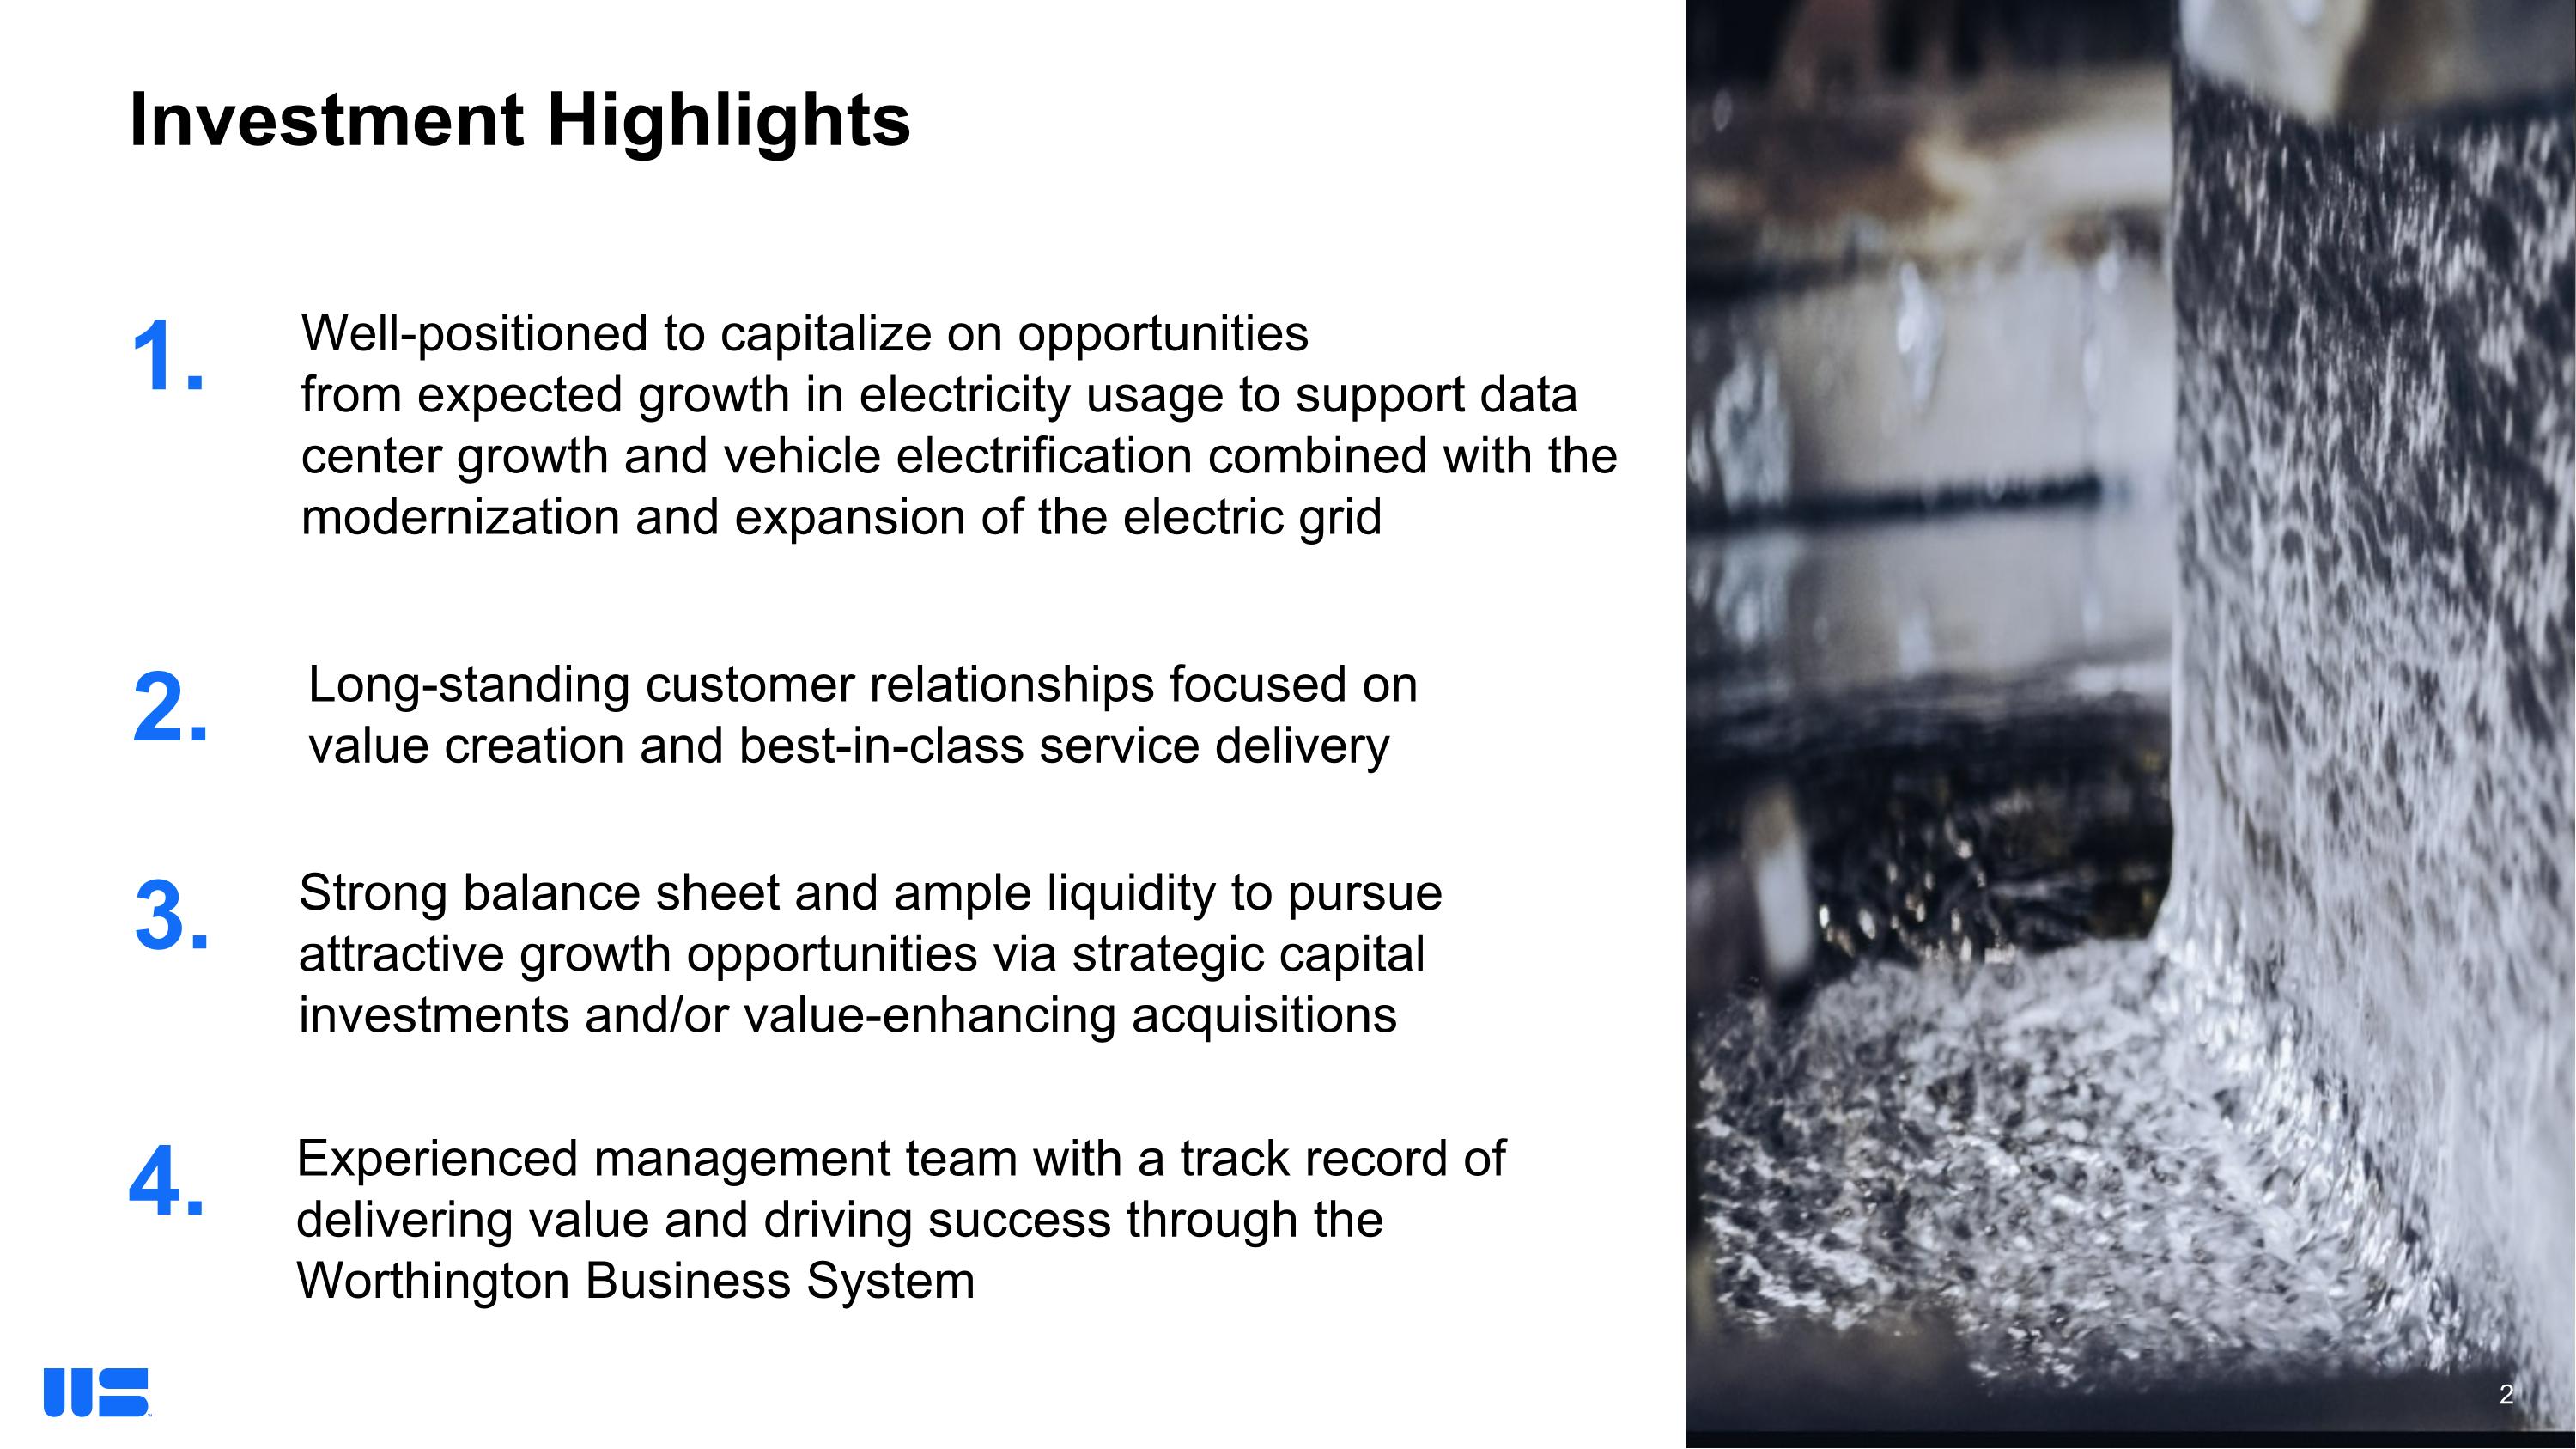

Slide 3

Investment Highlights 2. Long-standing customer relationships focused on value creation and best-in-class service delivery 1. Well-positioned to capitalize on opportunities from expected growth in electricity usage to support data center growth and vehicle electrification combined with the modernization and expansion of the electric grid 3. Strong balance sheet and ample liquidity to pursue attractive growth opportunities via strategic capital investments and/or value-enhancing acquisitions Experienced management team with a track record of delivering value and driving success through the Worthington Business System 4.
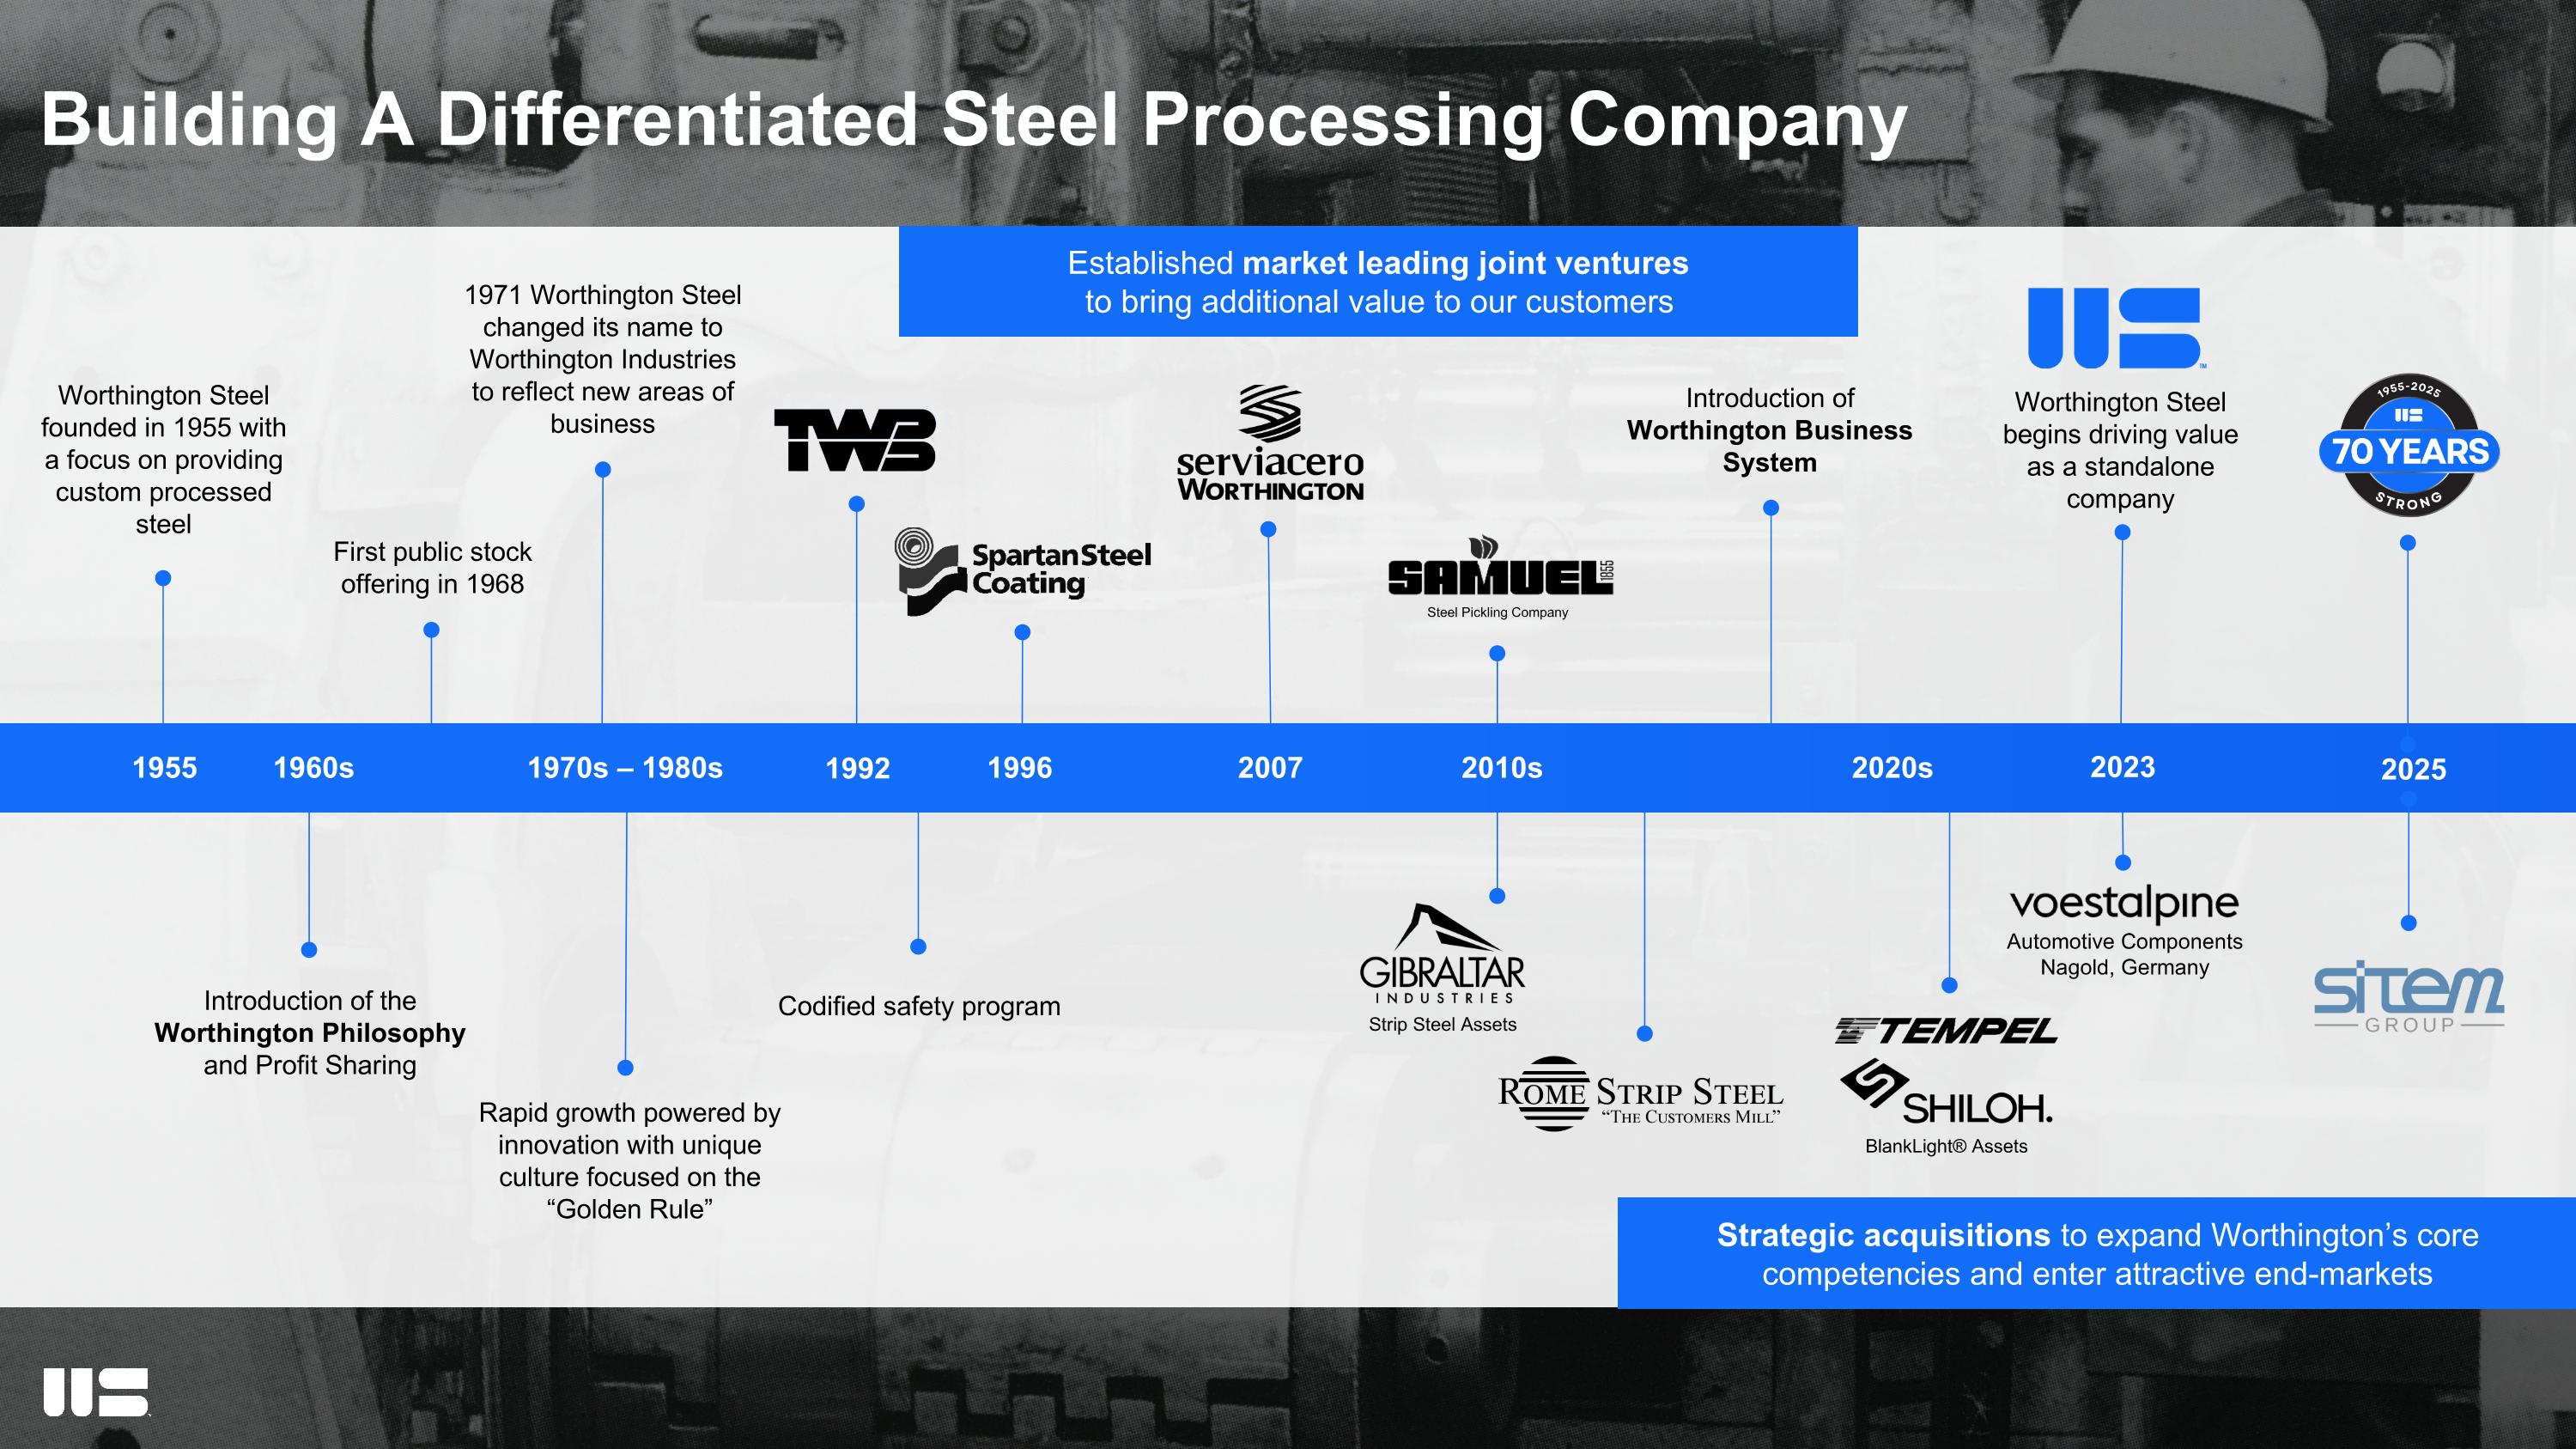

Slide 4

+ Building A Differentiated Steel Processing Company Worthington Steel founded in 1955 with a focus on providing custom processed steel First public stock offering in 1968 Established market leading joint ventures to bring additional value to our customers Steel Pickling Company Introduction of Worthington Business System Worthington Steel begins driving value as a standalone company Introduction of the Worthington Philosophy and Profit Sharing Rapid growth powered by innovation with unique culture focused on the “Golden Rule” Codified safety program Strategic acquisitions to expand Worthington’s core competencies and enter attractive end-markets BlankLight® Assets Strip Steel Assets 1955 1960s 1970s – 1980s 1992 1996 2007 2010s 2020s 2023 Automotive Components Nagold, Germany 1971 Worthington Steel changed its name to Worthington Industries to reflect new areas of business 2025
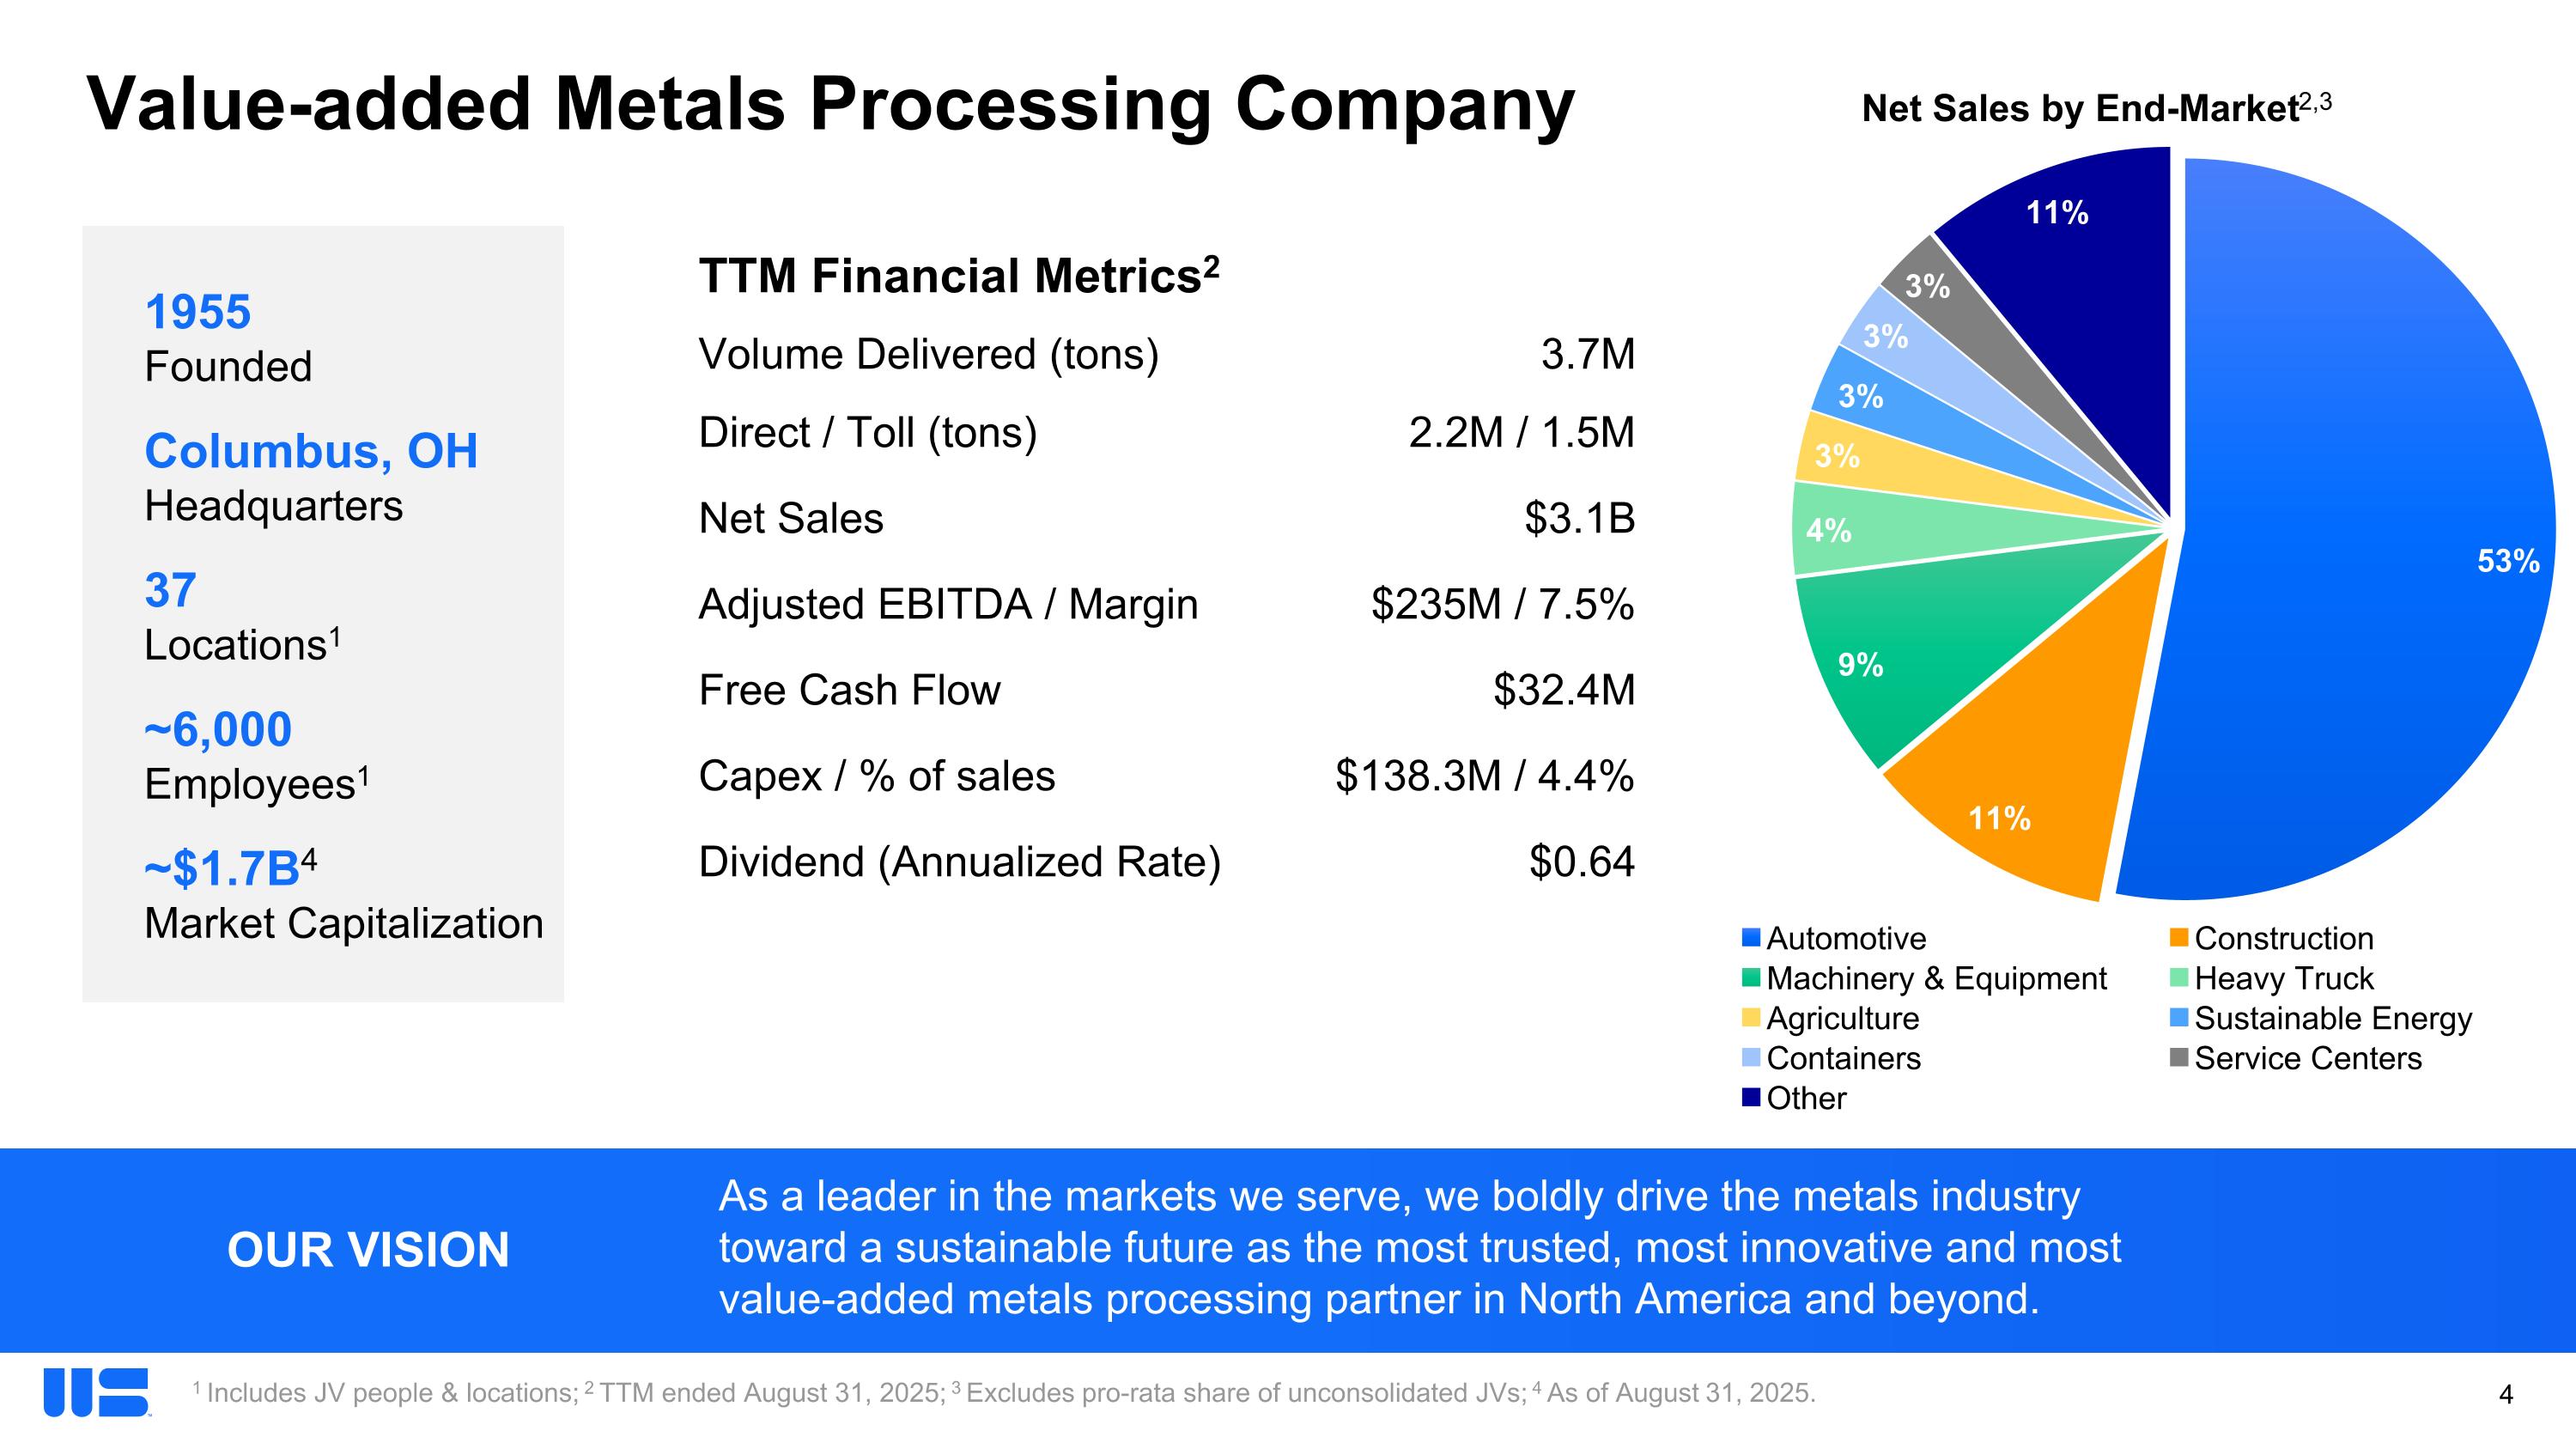

Slide 5

Value-added Metals Processing Company TTM Financial Metrics2 Volume Delivered (tons) 3.7M Direct / Toll (tons) 2.2M / 1.5M Net Sales $3.1B Adjusted EBITDA / Margin $235M / 7.5% Free Cash Flow $32.4M Capex / % of sales $138.3M / 4.4% Dividend (Annualized Rate) $0.64 1955 Founded Columbus, OH Headquarters 37 Locations1 ~6,000 Employees1 ~$1.7B4 Market Capitalization As a leader in the markets we serve, we boldly drive the metals industry toward a sustainable future as the most trusted, most innovative and most value-added metals processing partner in North America and beyond. OUR VISION 1 Includes JV people & locations; 2 TTM ended August 31, 2025; 3 Excludes pro-rata share of unconsolidated JVs; 4 As of August 31, 2025. Net Sales by End-Market2,3
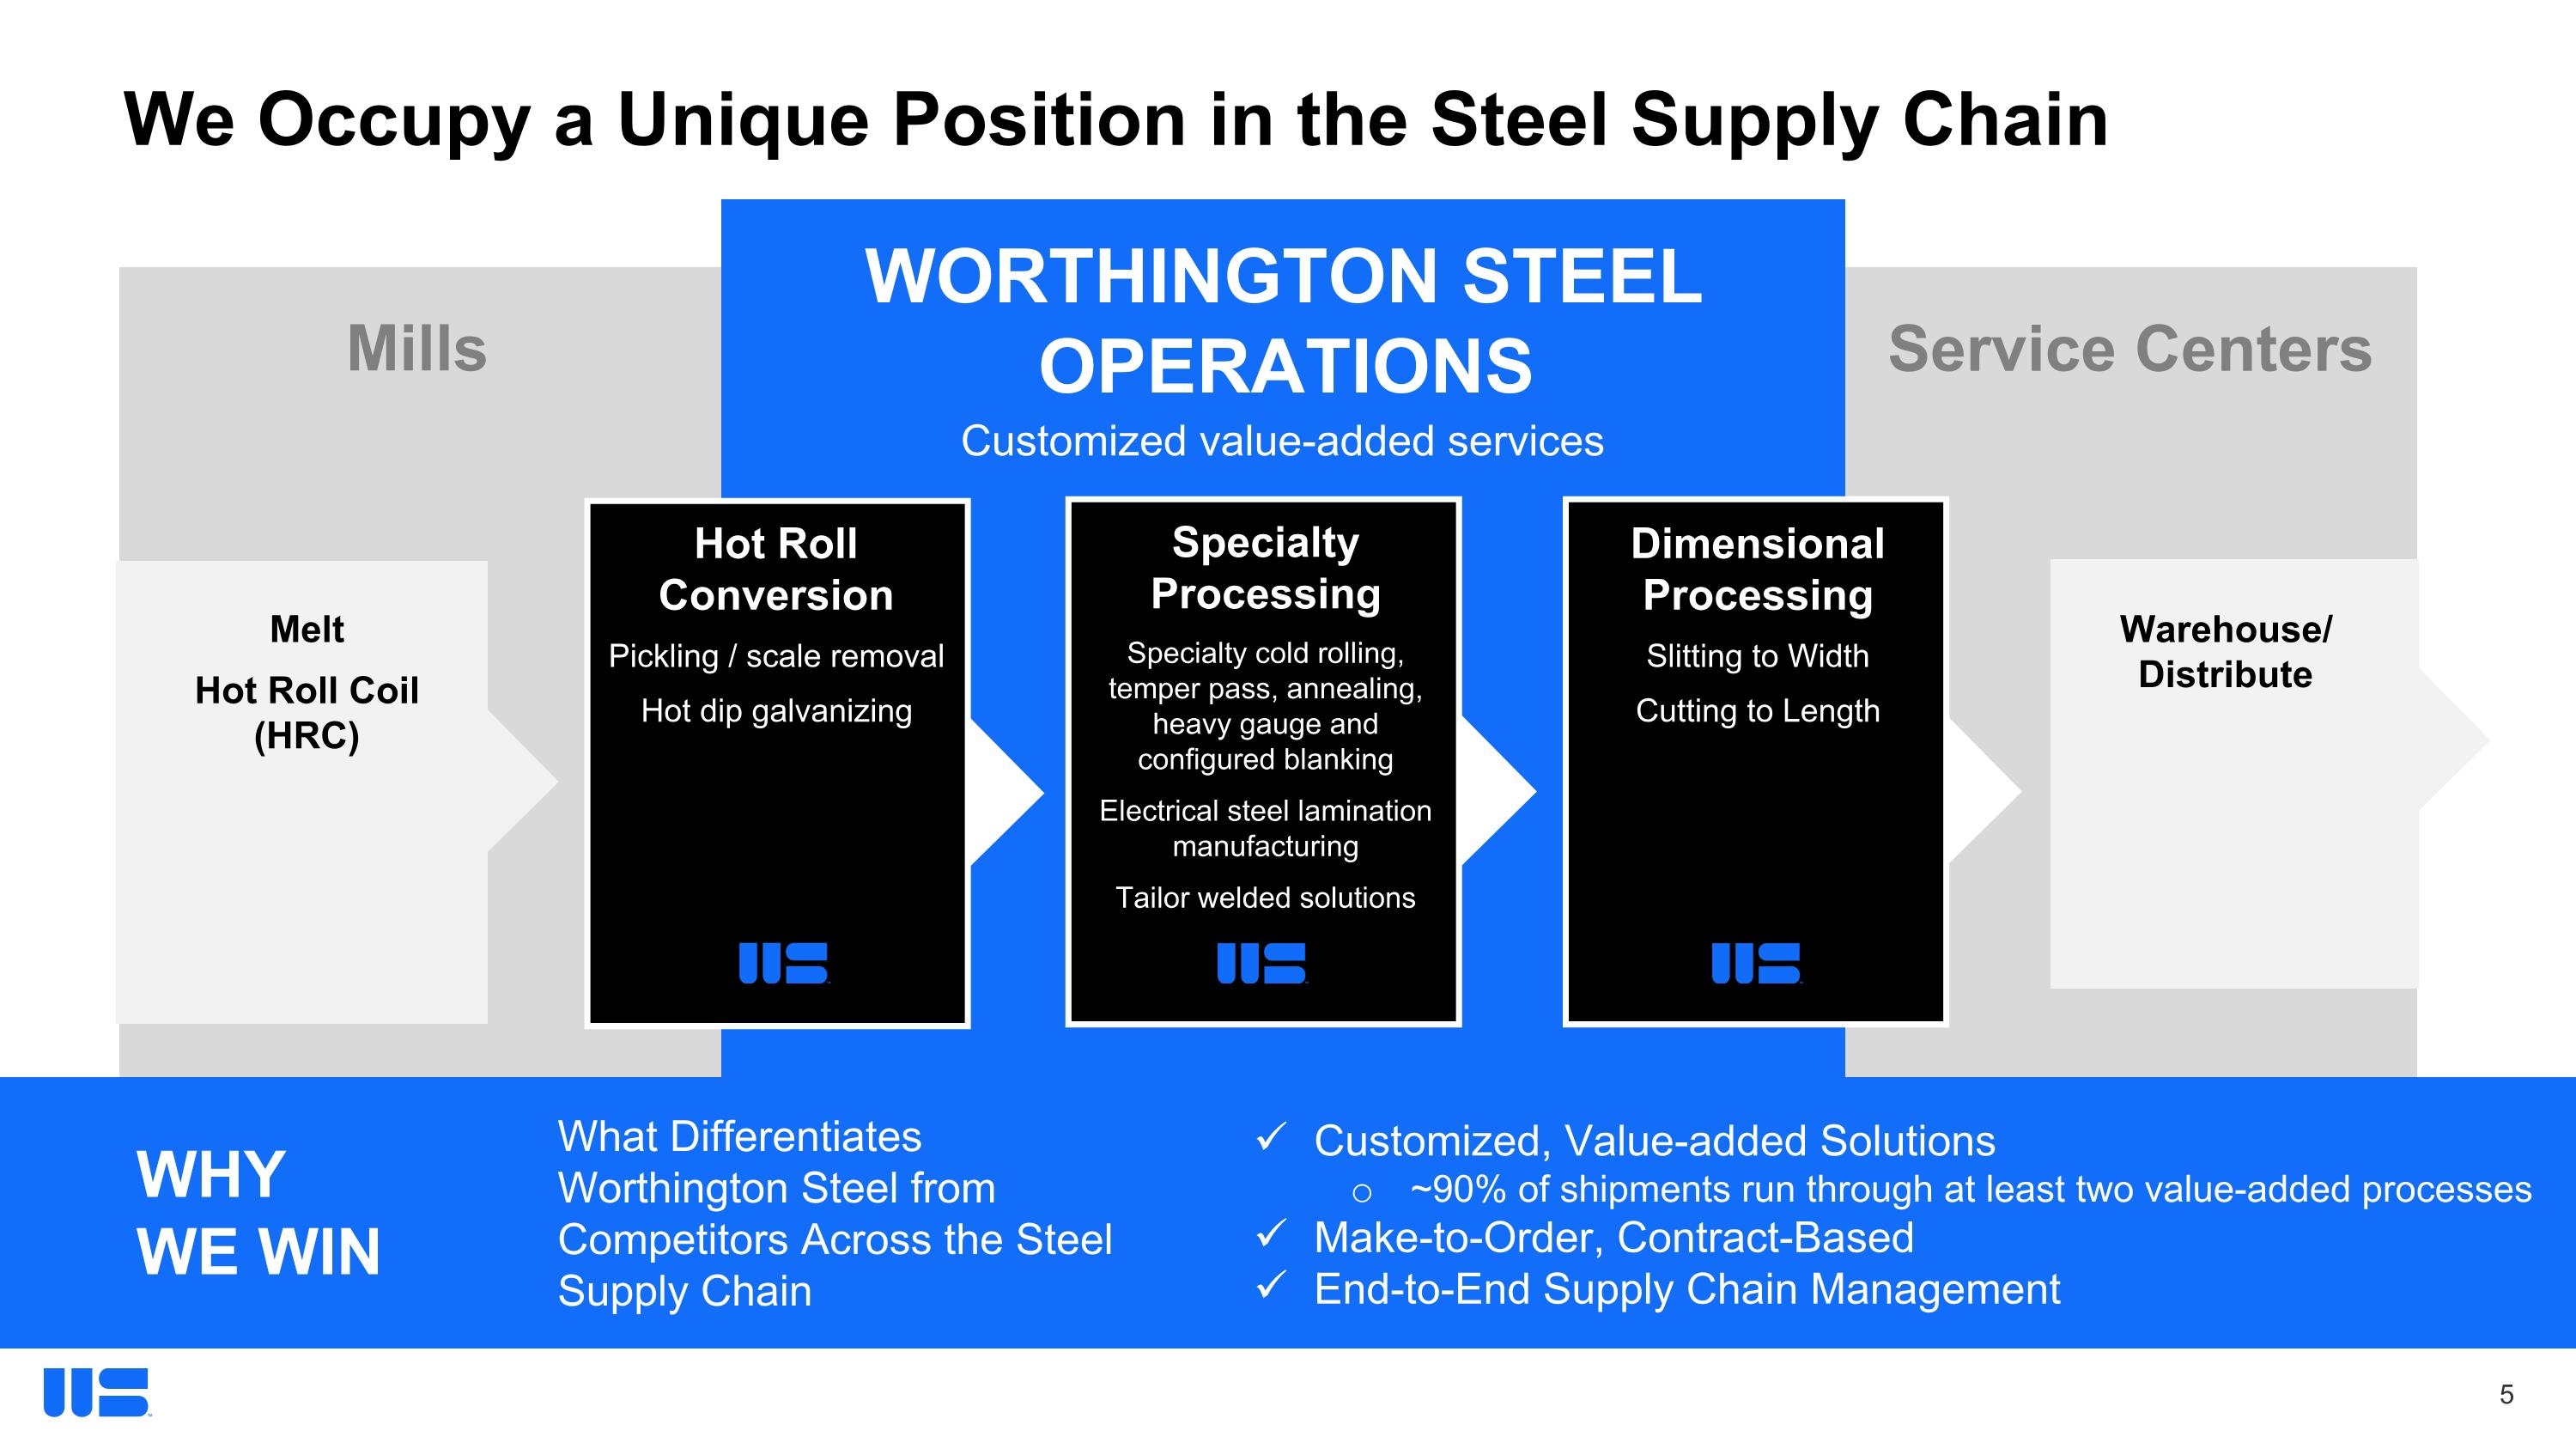

Slide 6

We Occupy a Unique Position in the Steel Supply Chain Worthington Steel Operations Mills Service Centers Melt Hot Roll Coil (HRC) Hot Roll Conversion Pickling / scale removal Hot dip galvanizing Specialty Processing Specialty cold rolling, temper pass, annealing, heavy gauge and configured blanking Electrical steel lamination manufacturing Tailor welded solutions Dimensional Processing Slitting to Width Cutting to Length Warehouse/ Distribute Customized, Value-added Solutions  ~90% of shipments run through at least two value-added processes Make-to-Order, Contract-Based End-to-End Supply Chain Management WHY WE WIN What Differentiates Worthington Steel from Competitors Across the Steel Supply Chain Customized value-added services
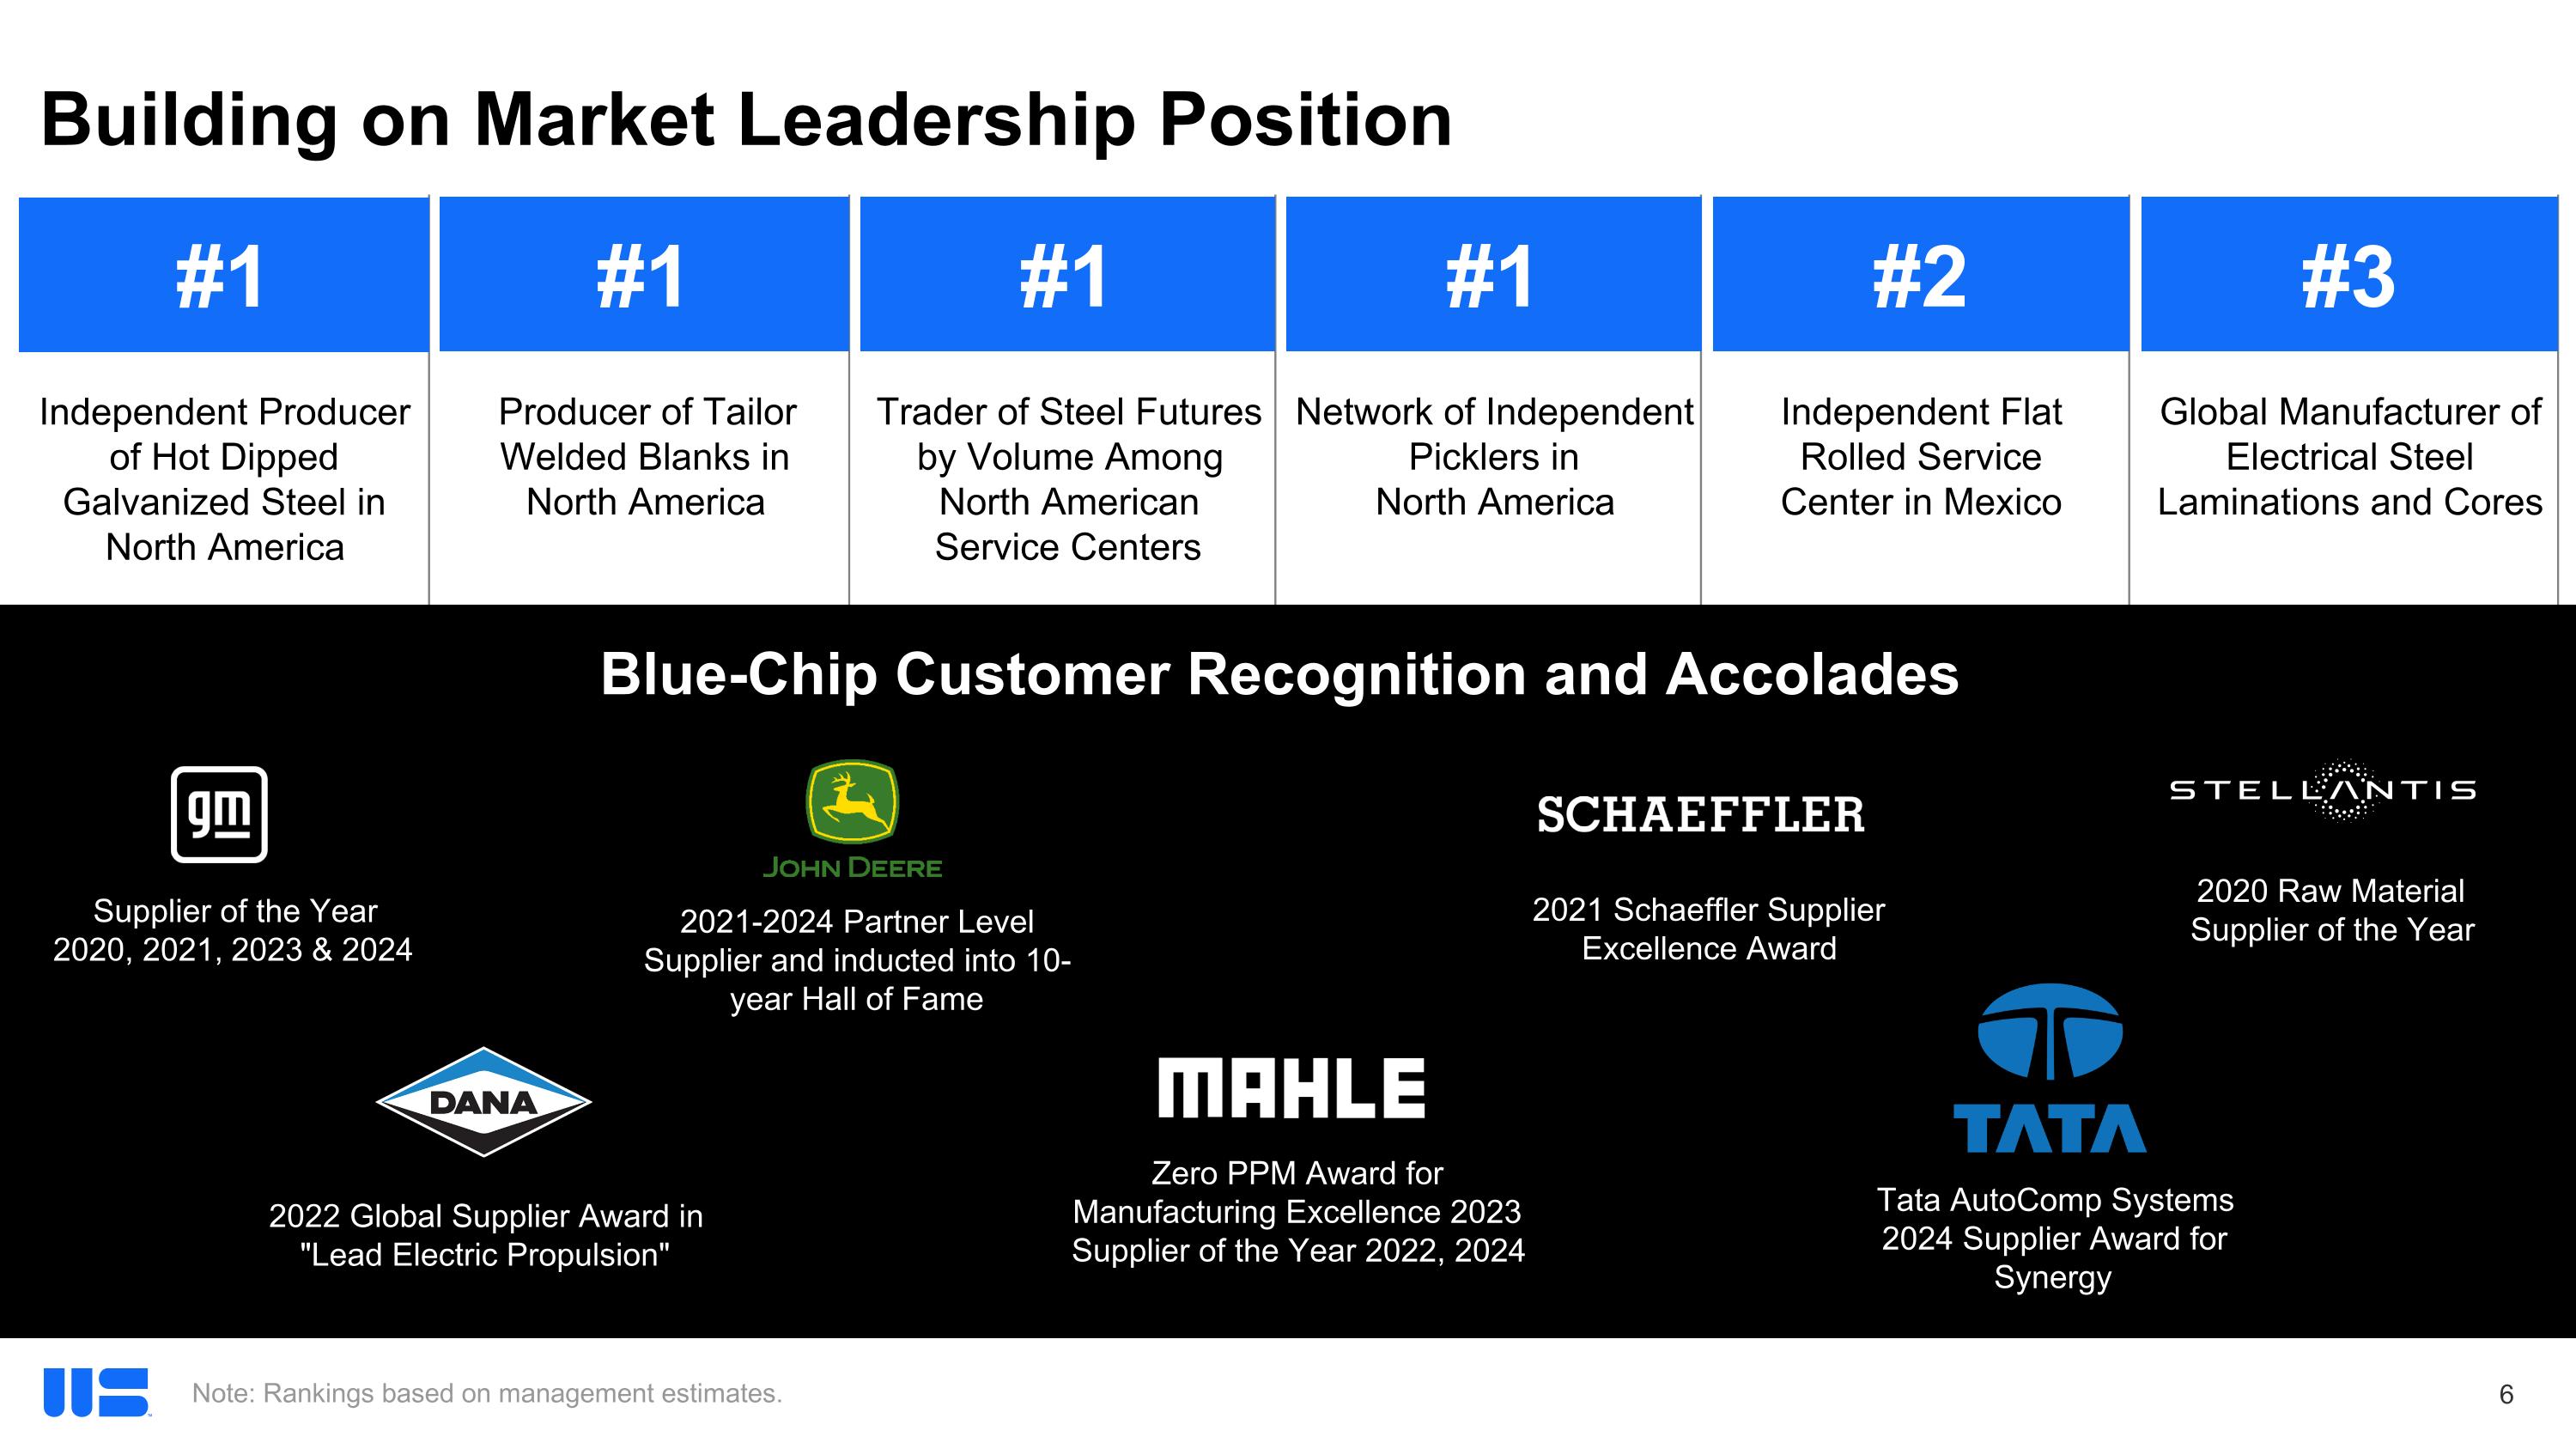

Slide 7

Building on Market Leadership Position Blue-Chip Customer Recognition and Accolades Note: Rankings based on management estimates. Global Manufacturer of Electrical Steel Laminations and Cores #3 #1 Producer of Tailor Welded Blanks in North America #1 Trader of Steel Futures by Volume Among North American Service Centers #1 Network of Independent Picklers in North America #1 Independent Producer of Hot Dipped Galvanized Steel in North America #2 Independent Flat Rolled Service Center in Mexico Supplier of the Year 2020, 2021, 2023 & 2024 2021 Schaeffler Supplier Excellence Award 2021-2024 Partner Level Supplier and inducted into 10-year Hall of Fame 2020 Raw Material Supplier of the Year 2022 Global Supplier Award in "Lead Electric Propulsion" Zero PPM Award for Manufacturing Excellence 2023 Supplier of the Year 2022, 2024 Tata AutoComp Systems 2024 Supplier Award for Synergy
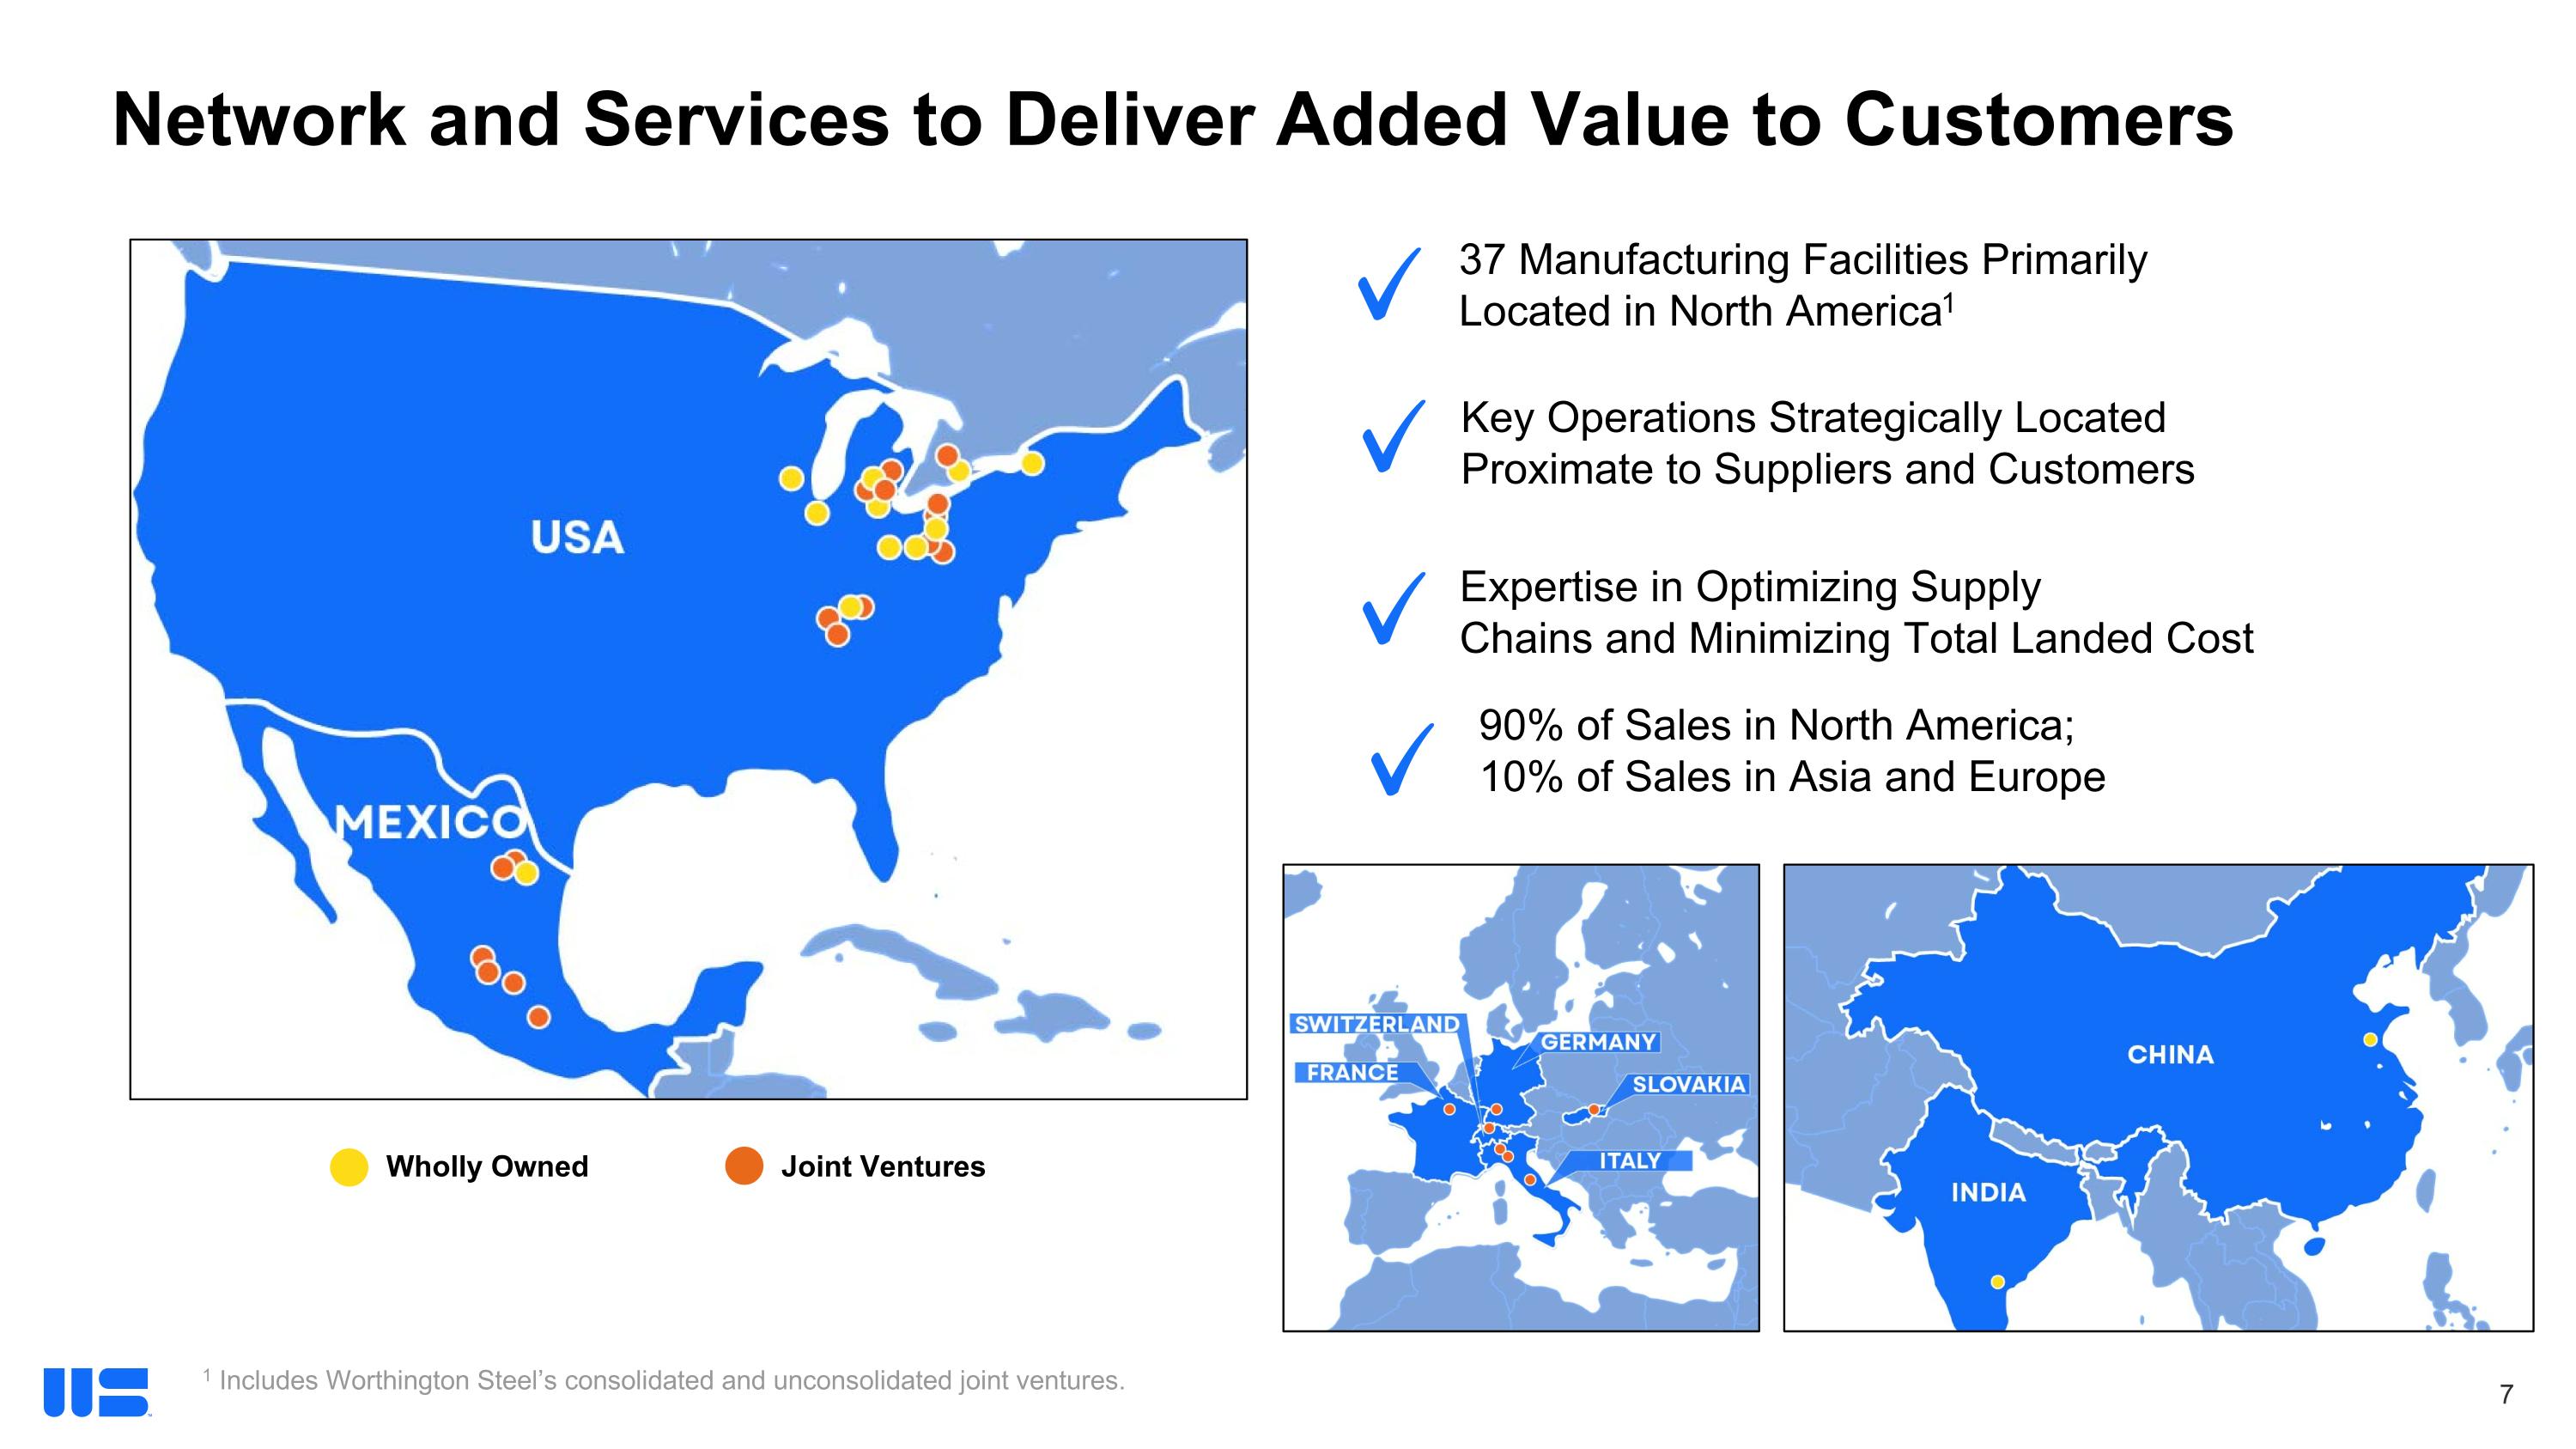

Slide 8

Joint Ventures Wholly Owned Network and Services to Deliver Added Value to Customers 1 Includes Worthington Steel’s consolidated and unconsolidated joint ventures. 37 Manufacturing Facilities Primarily Located in North America1 Key Operations Strategically Located Proximate to Suppliers and Customers Expertise in Optimizing Supply Chains and Minimizing Total Landed Cost 90% of Sales in North America; 10% of Sales in Asia and Europe


Slide 9

Joint Ventures Expand Our Processing Capabilities and Reach Note: Volumes shown are total tons shipped from the fiscal year ended May 31, 2025, presented on a 100% basis. 1 Worthington Samuel Coil Processing. TWB (55%) Partner: BaoSteel Tailor welded products for the automotive industry Operates 11 facilities in US, Canada, Mexico Growth Initiative - Adding ablation equipment to pursue new market in hot formed tailored blanks 250k Direct Tons 125k Toll Tons Partner: Serviacero Pickling, heavy gauge blanking, and slitting Operates 3 steel processing facilities in Mexico Growth Initiative - New slitter available January 2025 to process recent program wins Serviacero Worthington (50%) 400k Direct Tons 100k Toll Tons Partner: Cleveland-Cliffs A cold-rolled, hot-dipped coating line producing galvanized, galvannealed and aluminized products Single facility in Michigan Growth Initiative – Added Type 1 aluminized capability Spartan Steel Coating (52%) 425k Toll Tons Partner: Samuel, Son & Co. Pickling and slitting for the automotive, fabrication and appliance markets Operates 1 pickling facility in Ohio WSCP1 (63%) 450k Toll Tons
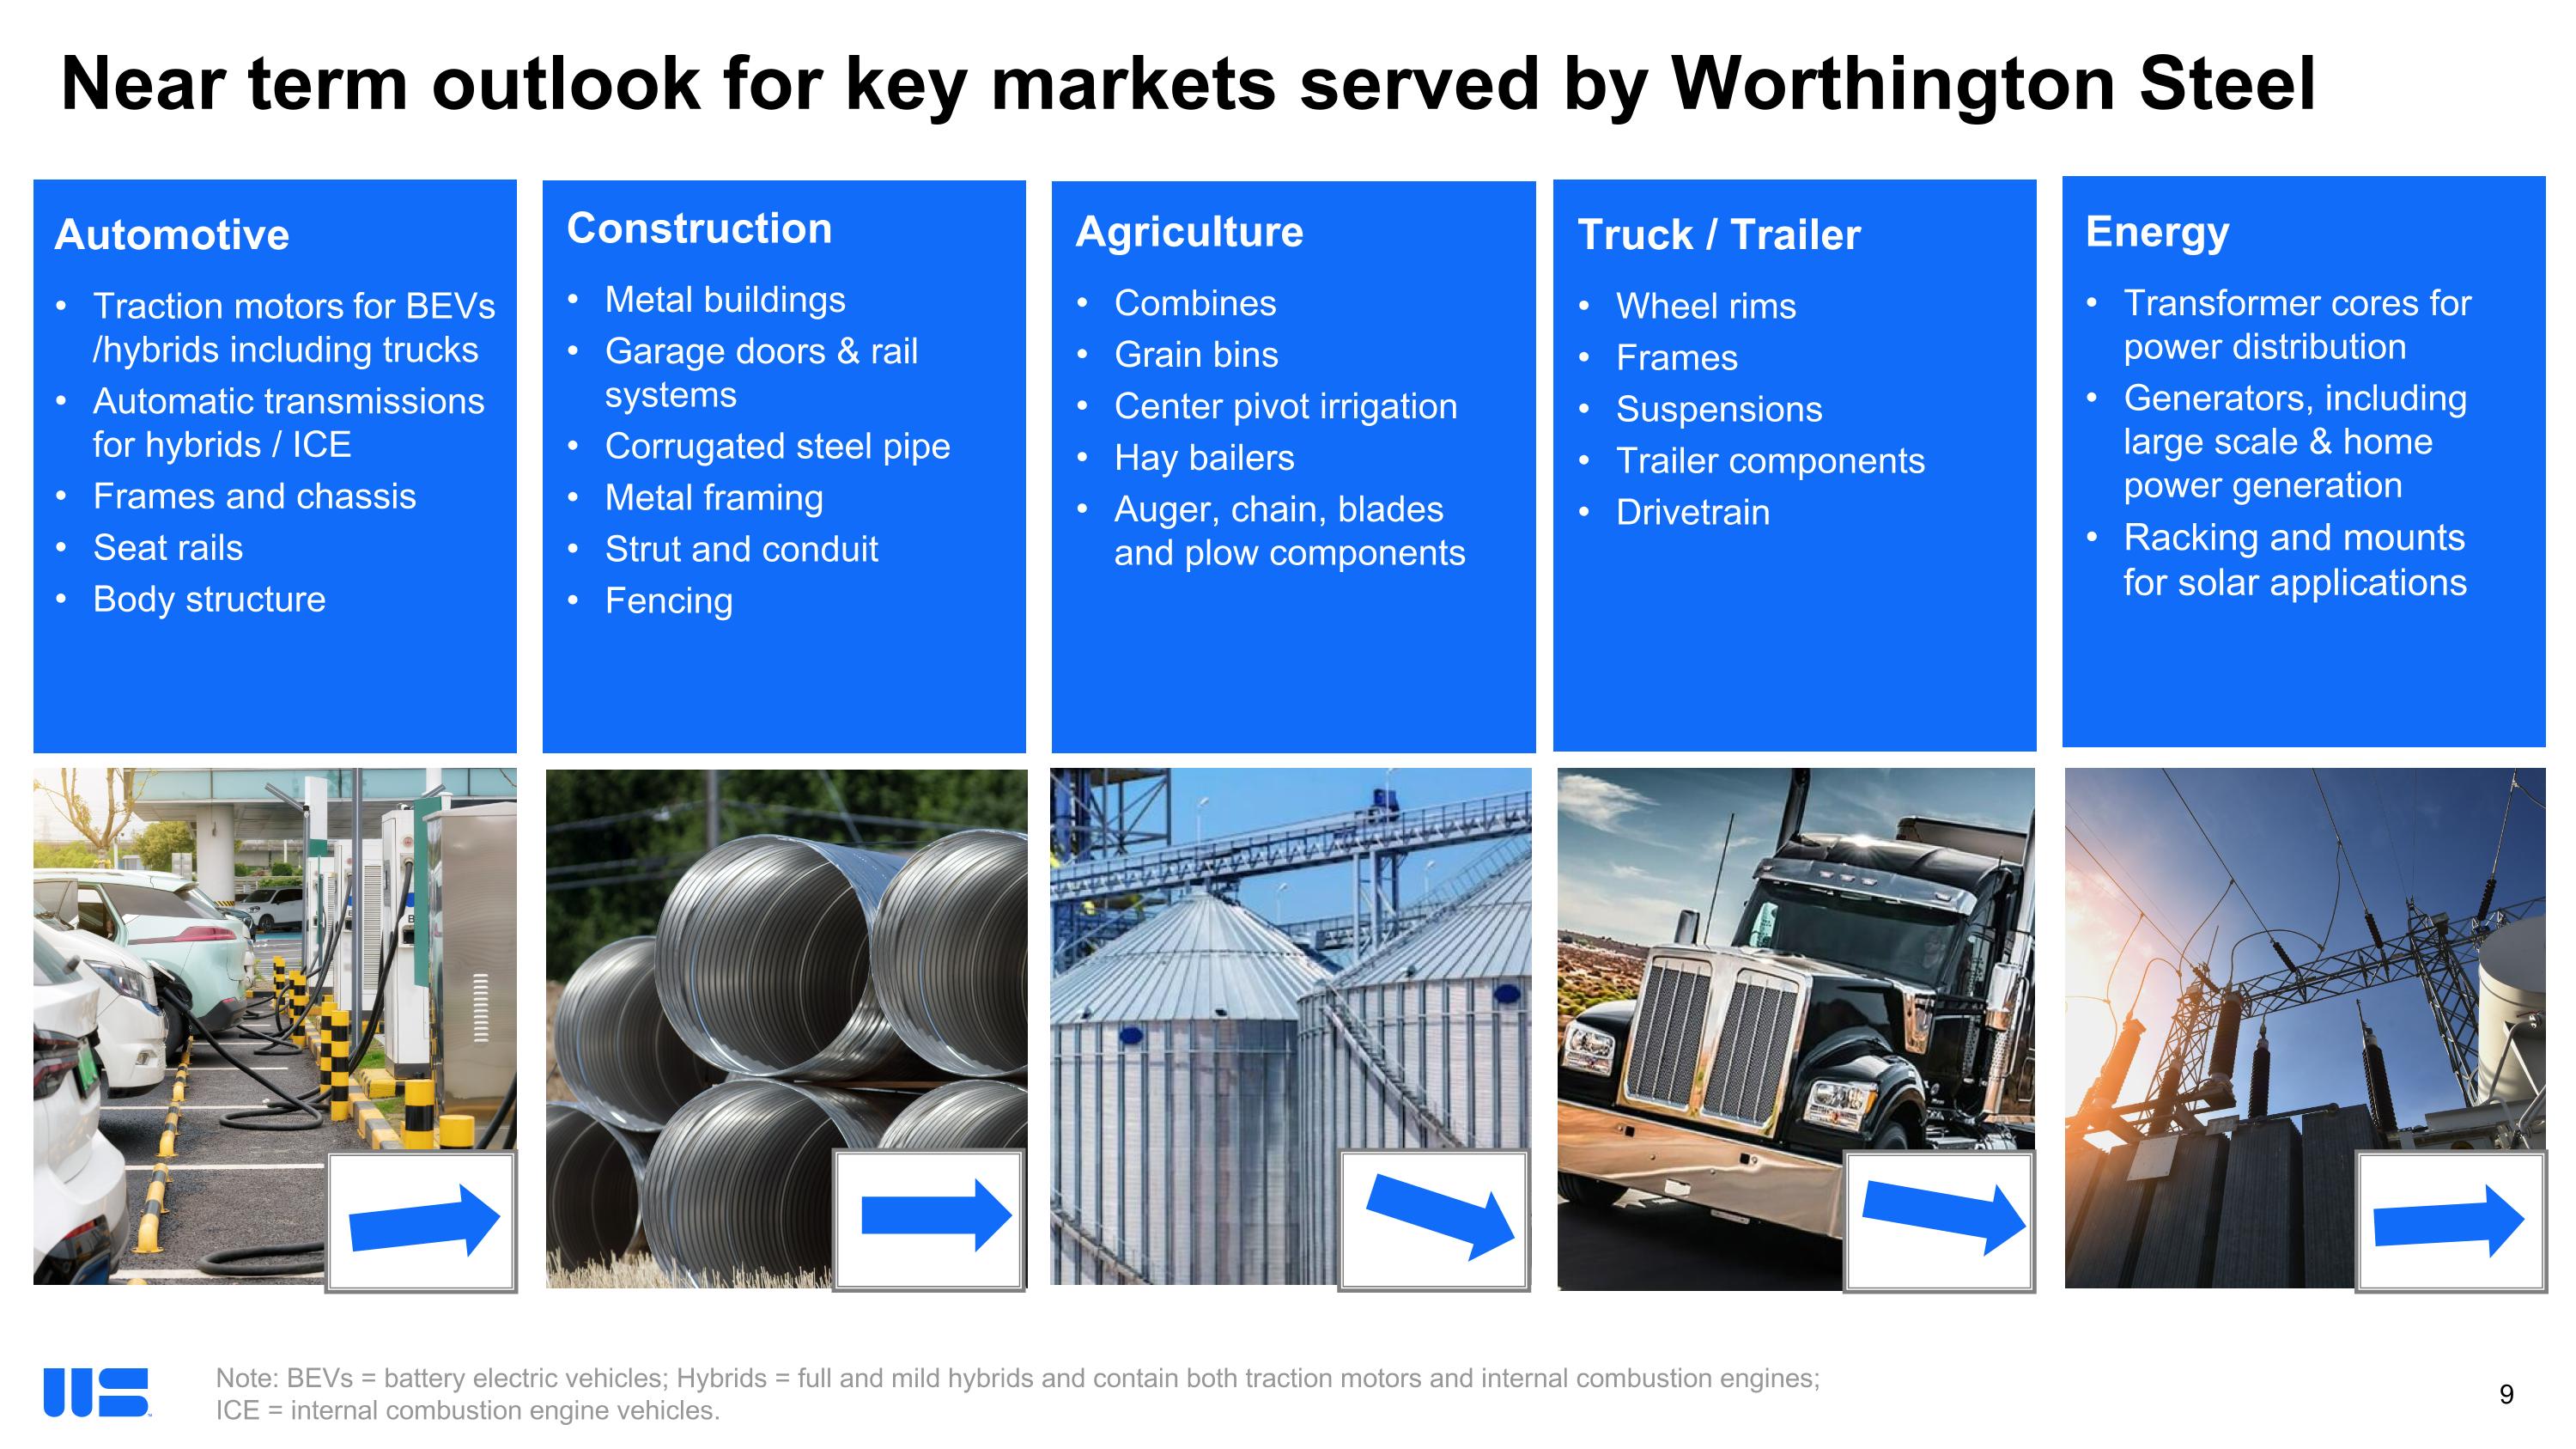

Slide 10

Agriculture Combines Grain bins Center pivot irrigation Hay bailers Auger, chain, blades and plow components Construction Metal buildings Garage doors & rail systems Corrugated steel pipe Metal framing Strut and conduit Fencing Energy Transformer cores for power distribution Generators, including large scale & home power generation Racking and mounts for solar applications Truck / Trailer Wheel rims Frames Suspensions Trailer components Drivetrain Automotive Traction motors for BEVs /hybrids including trucks Automatic transmissions for hybrids / ICE Frames and chassis Seat rails Body structure Near term outlook for key markets served by Worthington Steel Note: BEVs = battery electric vehicles; Hybrids = full and mild hybrids and contain both traction motors and internal combustion engines; ICE = internal combustion engine vehicles. Note: Market trend data sources include: Agriculture (TBD); Construction - AIA, Dodge and Government Sources; Heavy Truck - S&P Platts, FTR, ACT Research; Agriculture - Purde-CME Ag Barometer, AEM, Ag Commodity Markets, Government Sources.
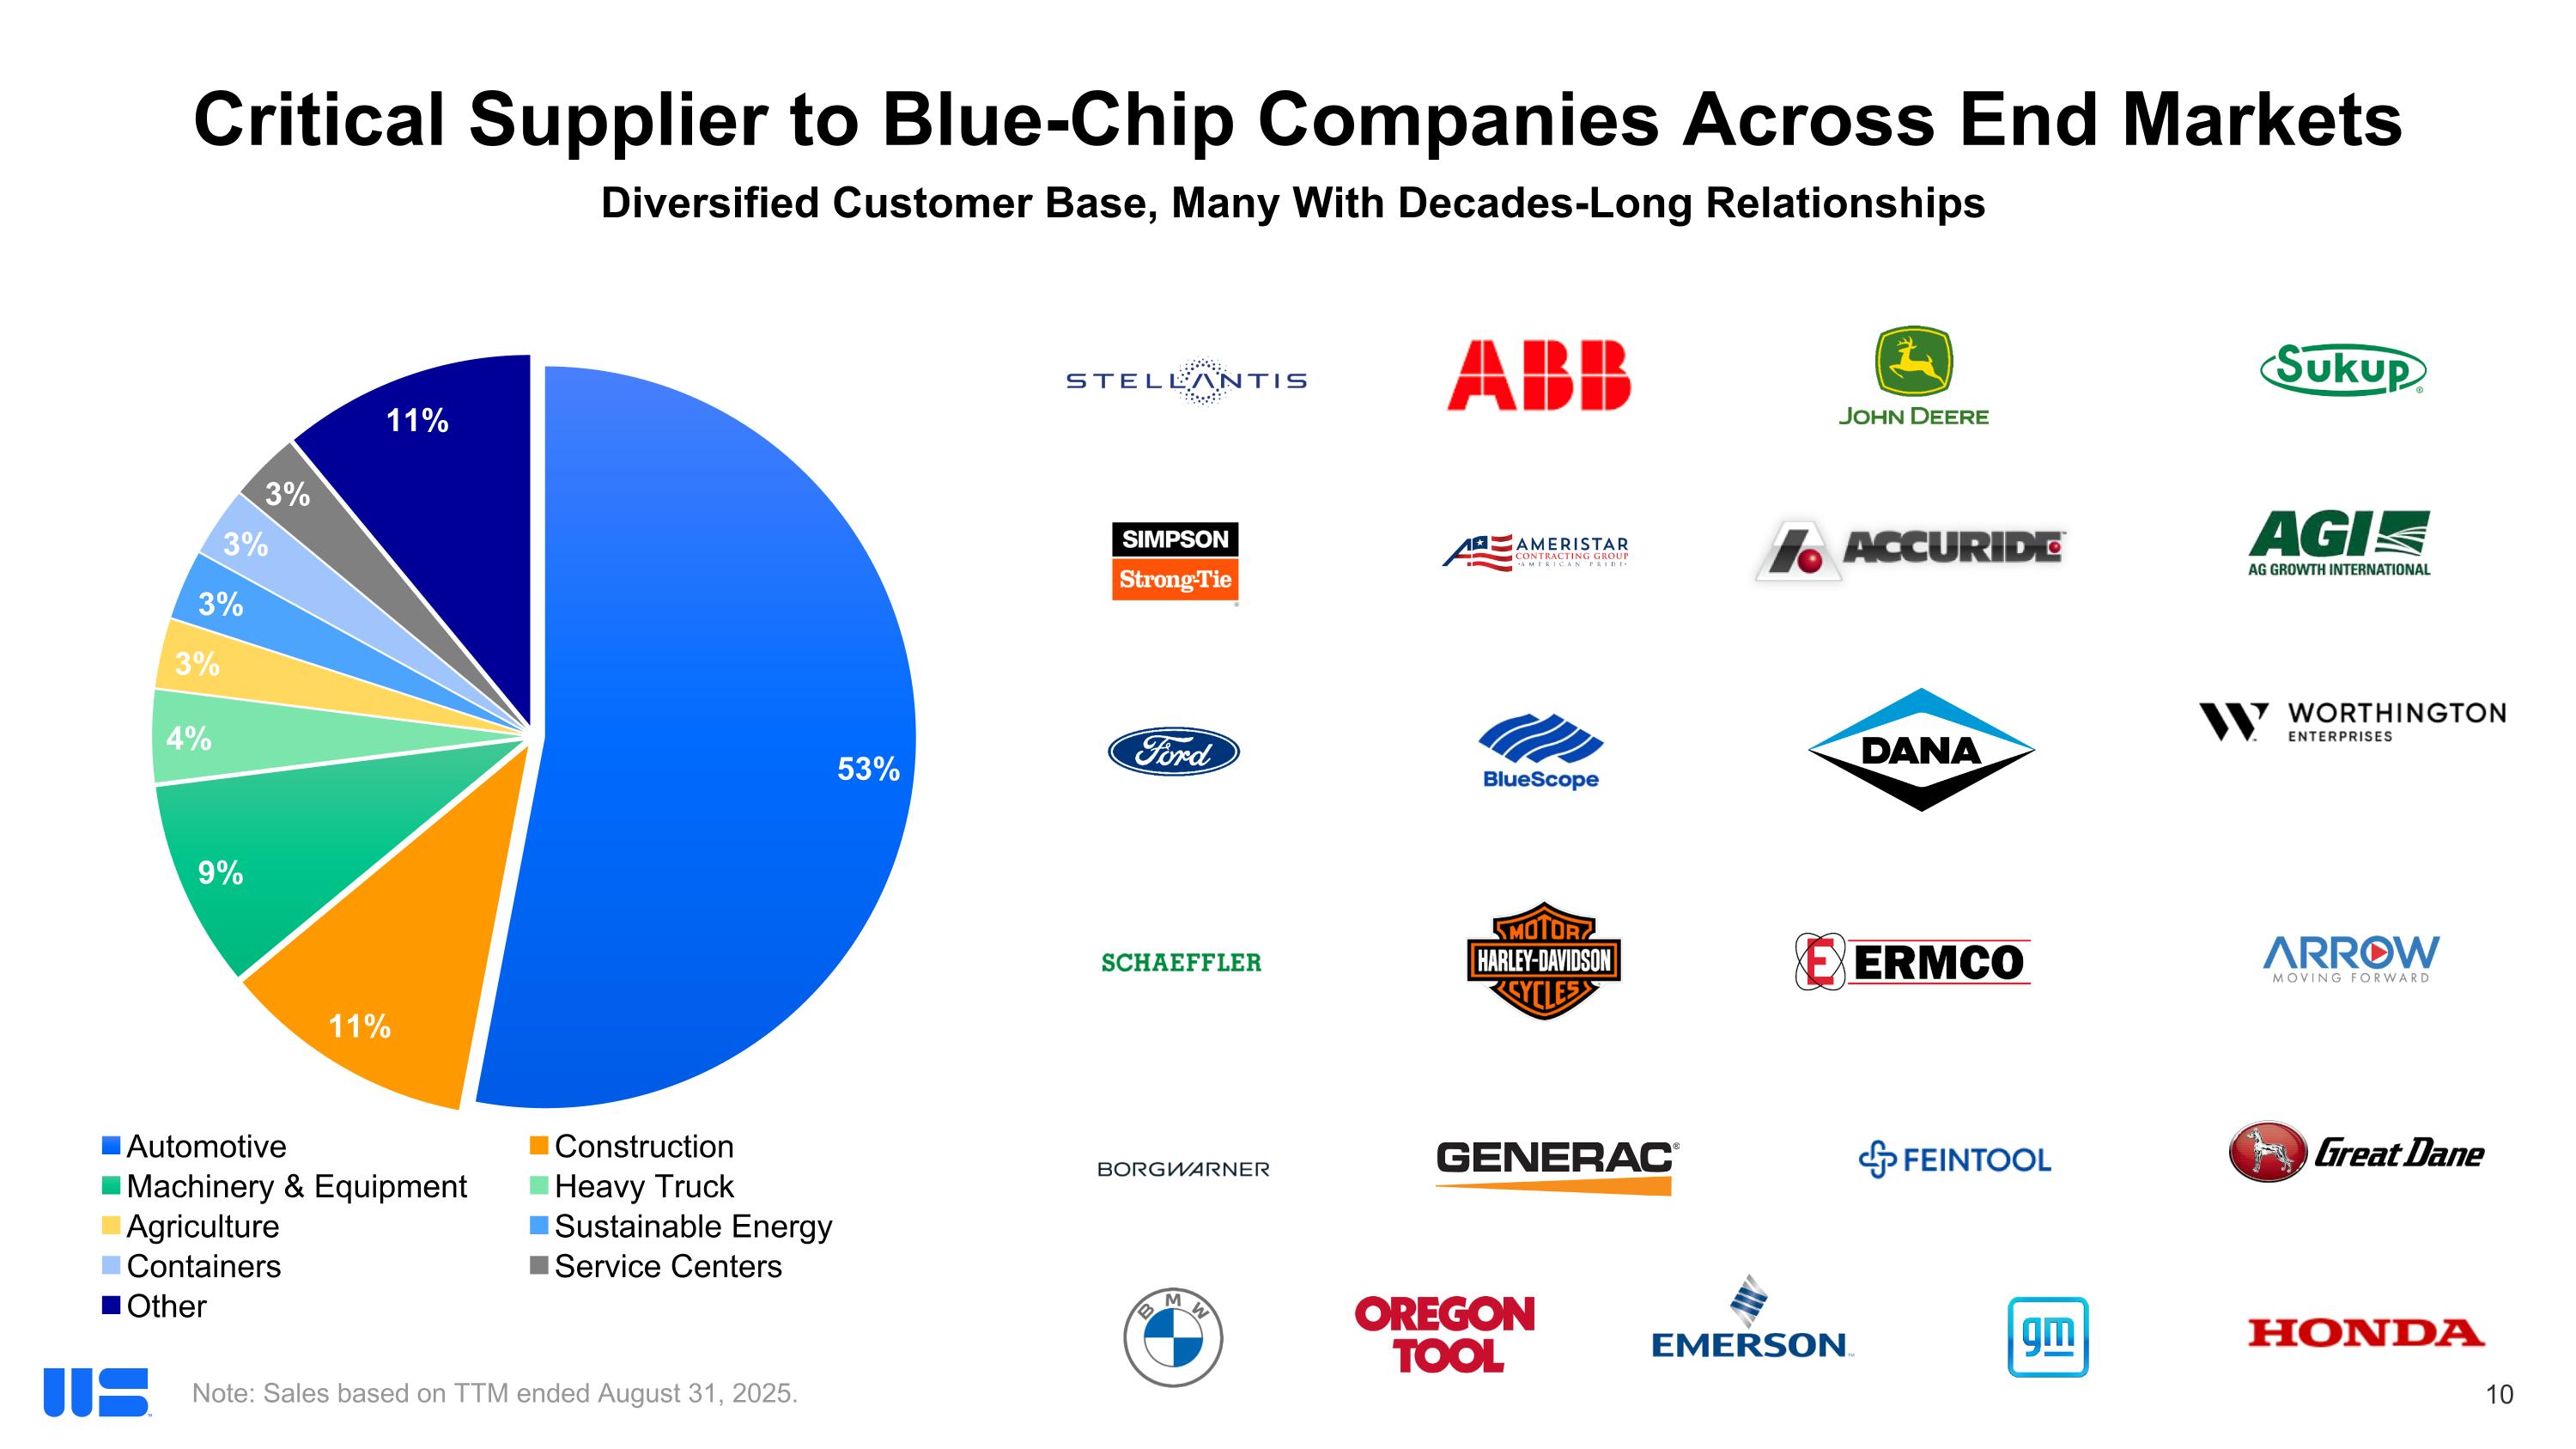

Slide 11

Diversified Customer Base, Many With Decades-Long Relationships Critical Supplier to Blue-Chip Companies Across End Markets Note: Sales based on TTM ended August 31, 2025.

Slide 12

Our Strategy and Operating Model


Slide 13

Proven Worthington Business System embedded in growth plans Executing on our investments in the rapidly growing electrical steel market Strategically expanding our capacity for highly technical electrical steel products to meet demand for infrastructure improvements and electric vehicles (including hybrid and battery electric vehicles) Growing through strategic initiatives/capex, new products and acquisitions Filling our existing capacity, meeting customer needs and capitalizing on attractive growth opportunities Optimizing our business utilizing proven transformation processes Improving our base business to increase margin, reduce working capital and maximize capacity
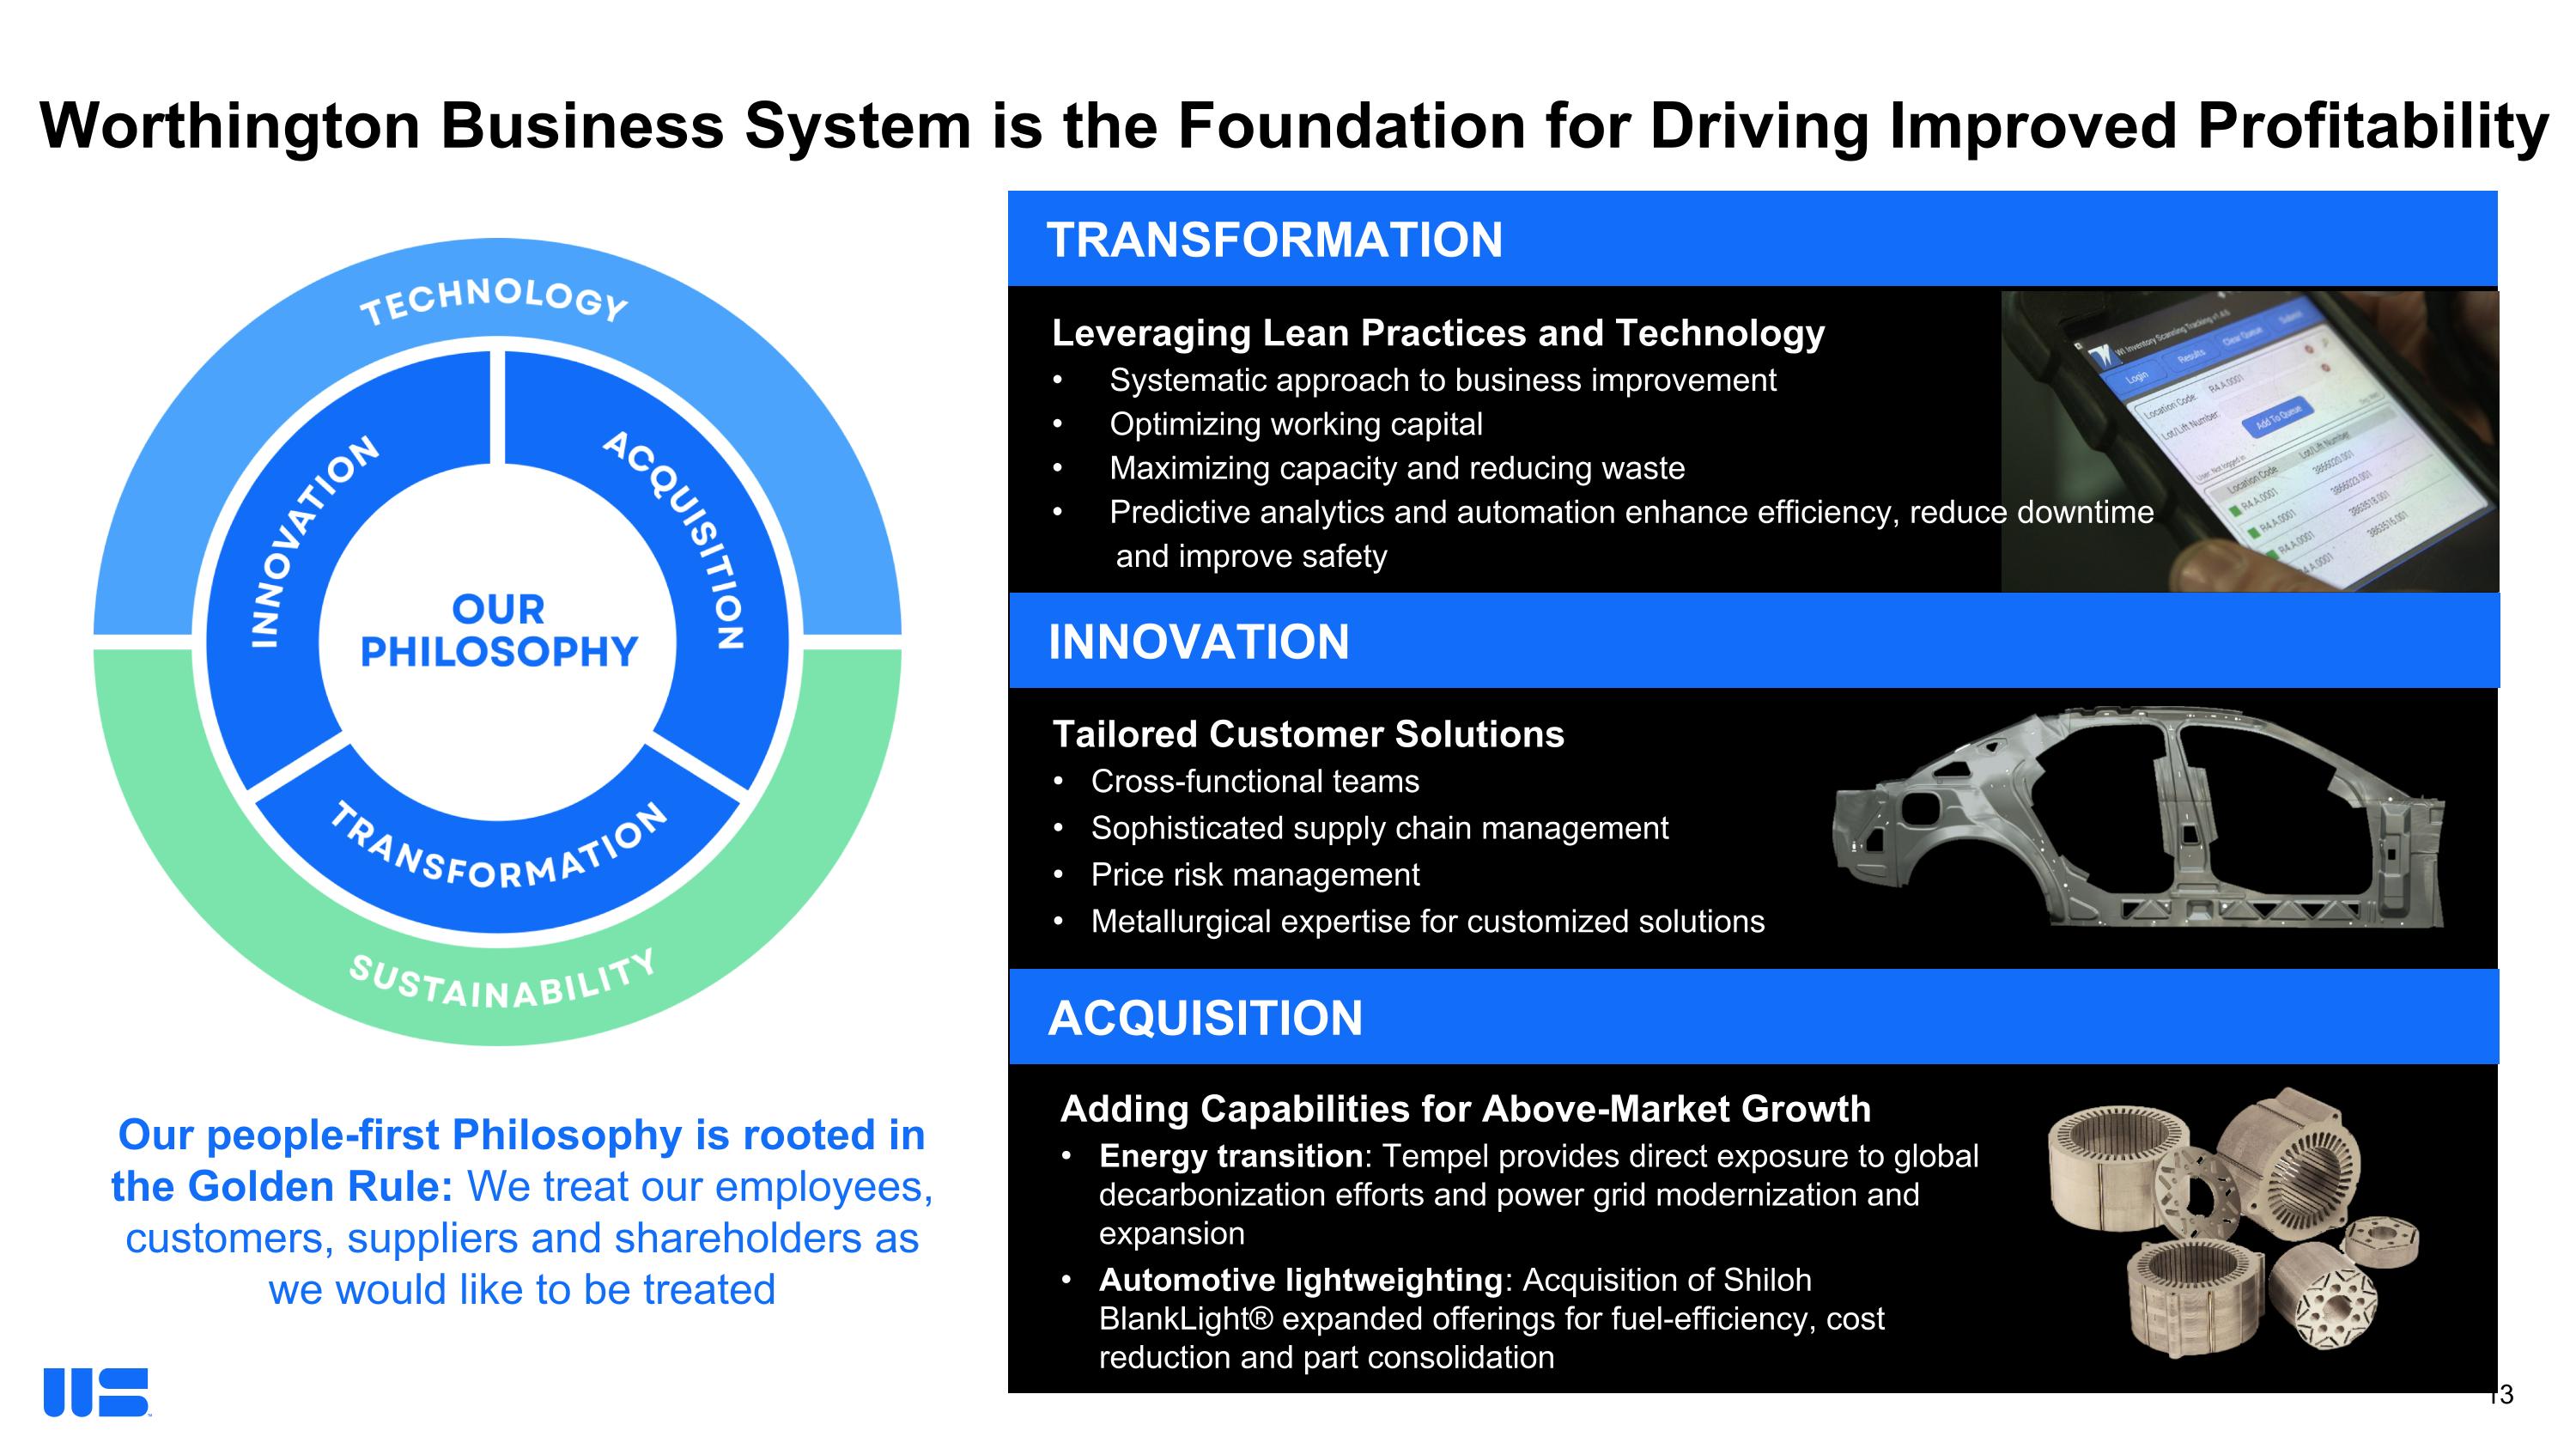

Slide 14

TRANSFORMATION Leveraging Lean Practices and Technology Systematic approach to business improvement  Optimizing working capital Maximizing capacity and reducing waste Predictive analytics and automation enhance efficiency, reduce downtime   and improve safety INNOVATION Tailored Customer Solutions Cross-functional teams Sophisticated supply chain management Price risk management Metallurgical expertise for customized solutions ACQUISITION Adding Capabilities for Above-Market Growth Energy transition: Tempel provides direct exposure to global decarbonization efforts and power grid modernization and expansion Automotive lightweighting: Acquisition of Shiloh BlankLight® expanded offerings for fuel-efficiency, cost reduction and part consolidation Worthington Business System is the Foundation for Driving Improved Profitability Our people-first Philosophy is rooted in the Golden Rule: We treat our employees, customers, suppliers and shareholders as we would like to be treated
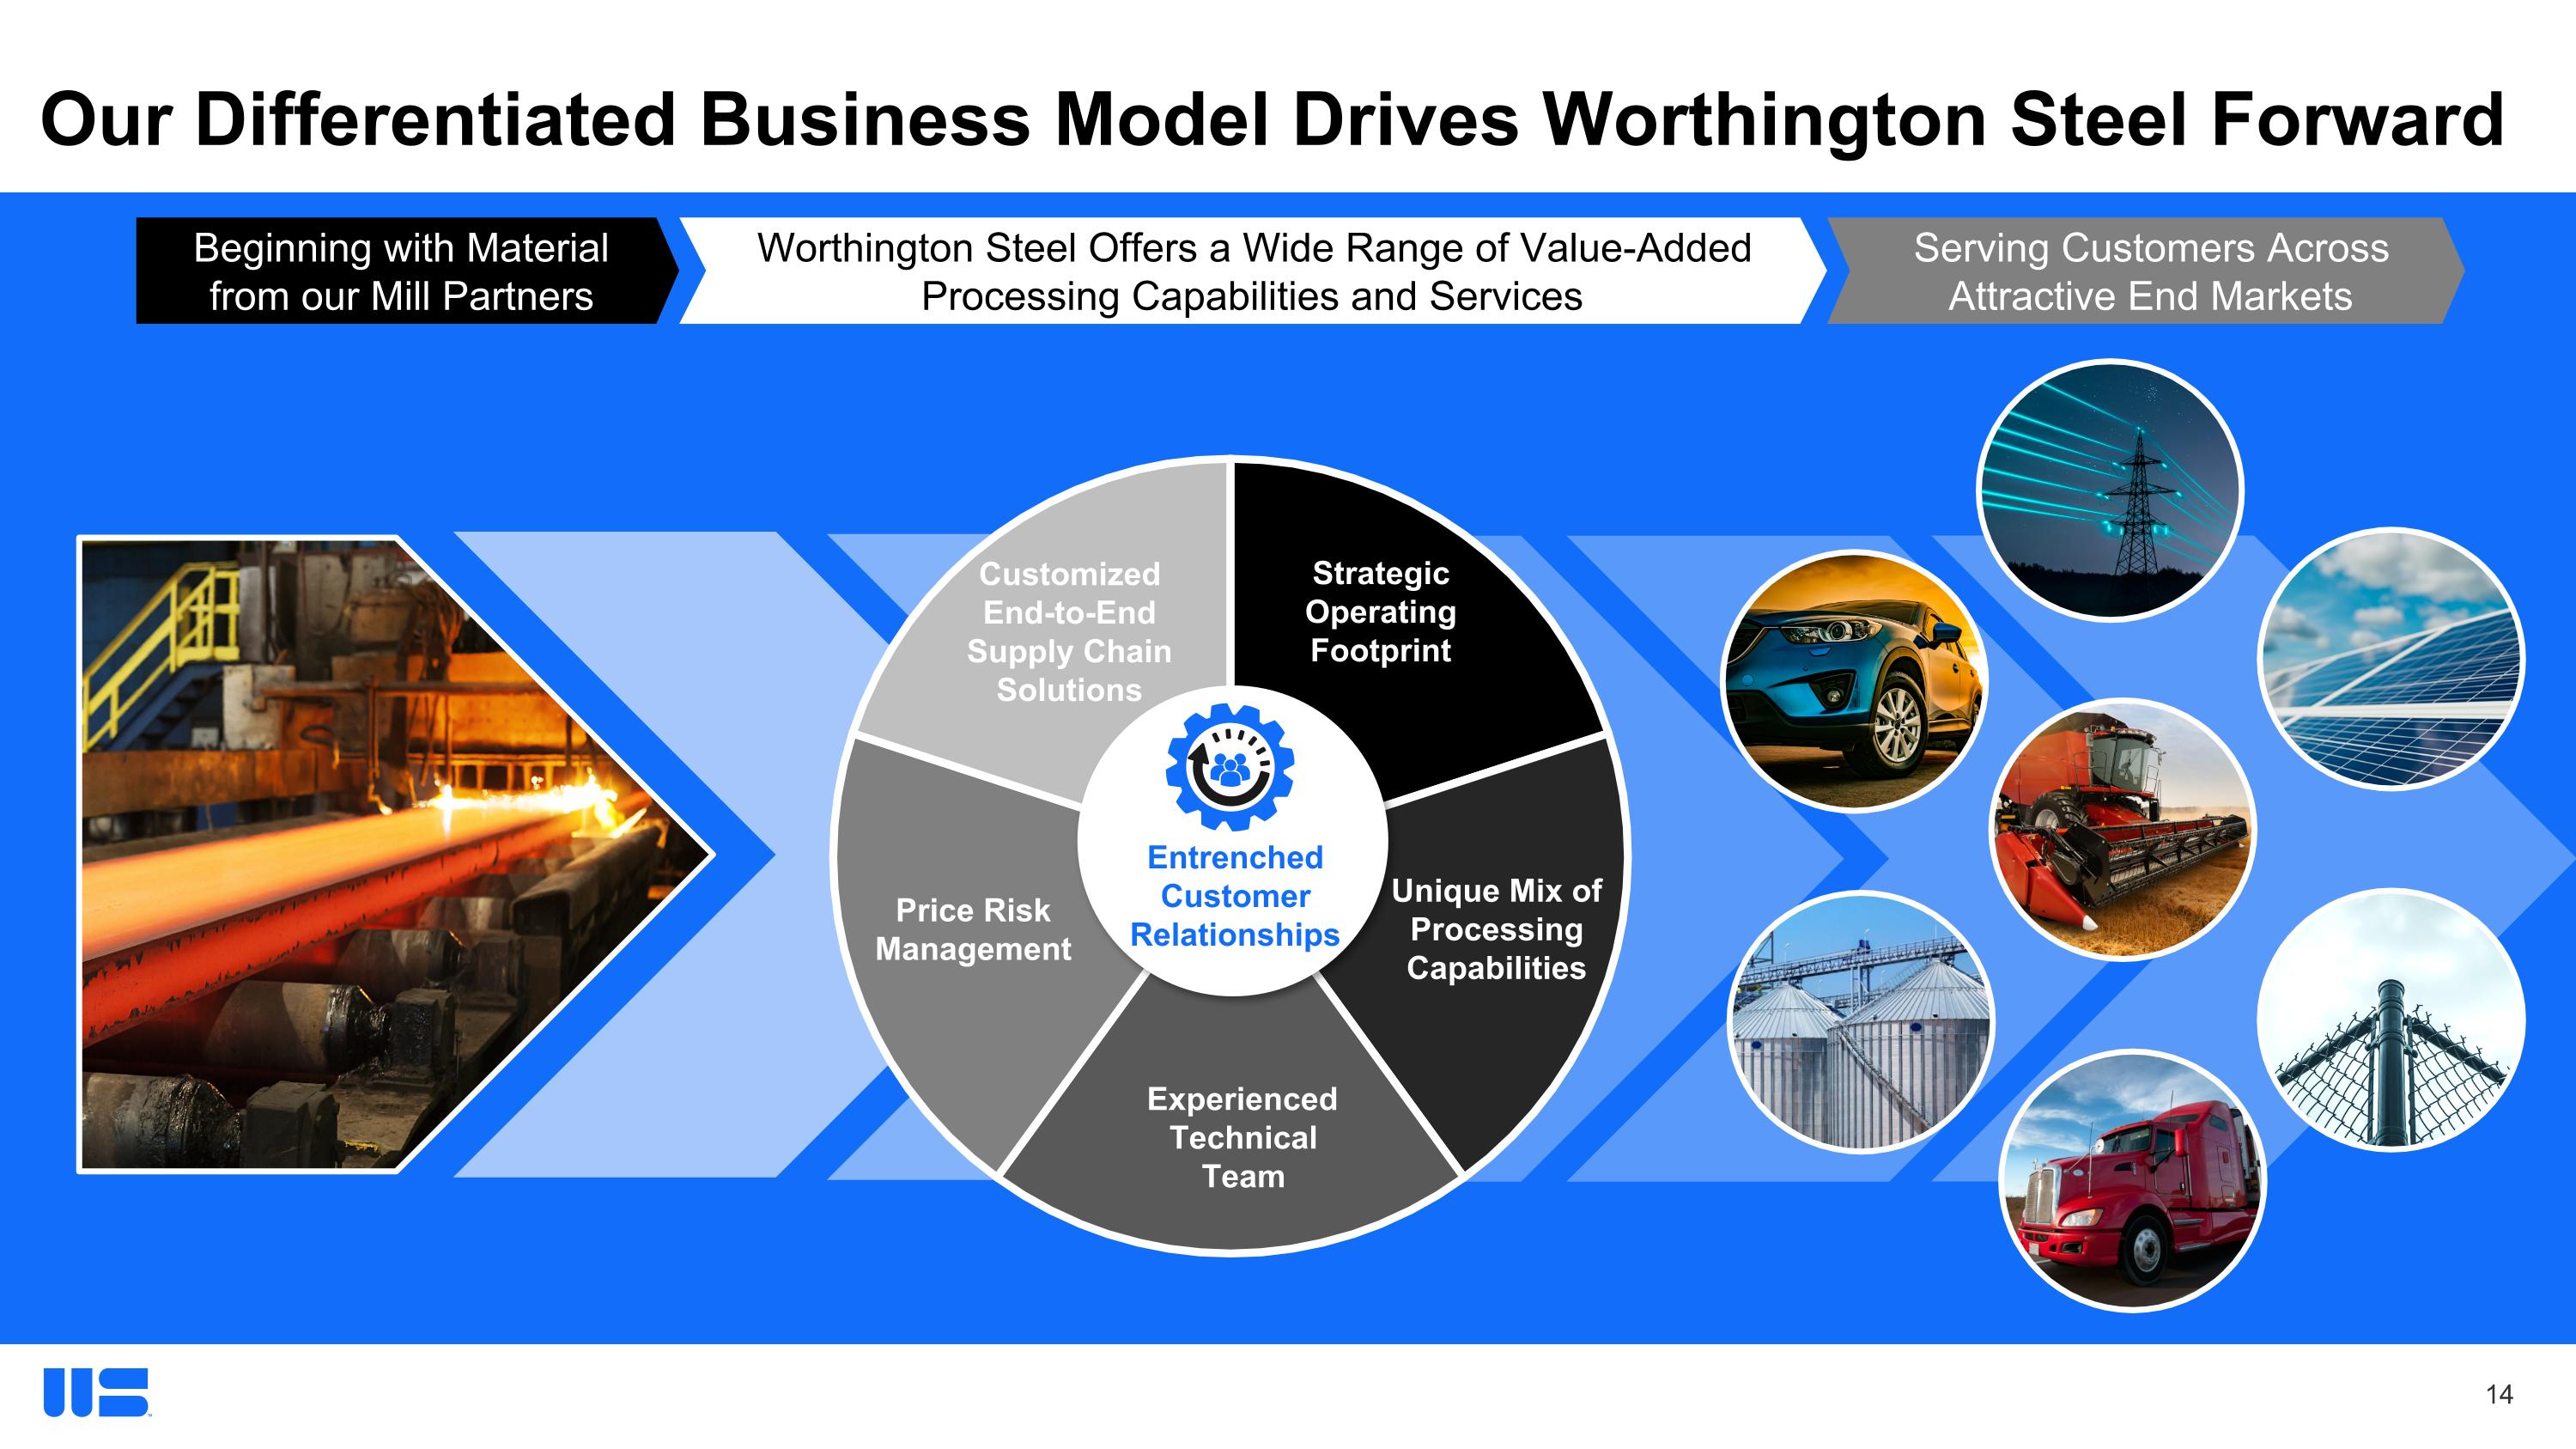

Slide 15

Customized End-to-End Supply Chain Solutions Strategic Operating Footprint Price Risk Management Experienced Technical Team Unique Mix of Processing Capabilities Entrenched Customer Relationships Beginning with Material from our Mill Partners Worthington Steel Offers a Wide Range of Value-Added Processing Capabilities and Services Serving Customers Across Attractive End Markets Our Differentiated Business Model Drives Worthington Steel Forward
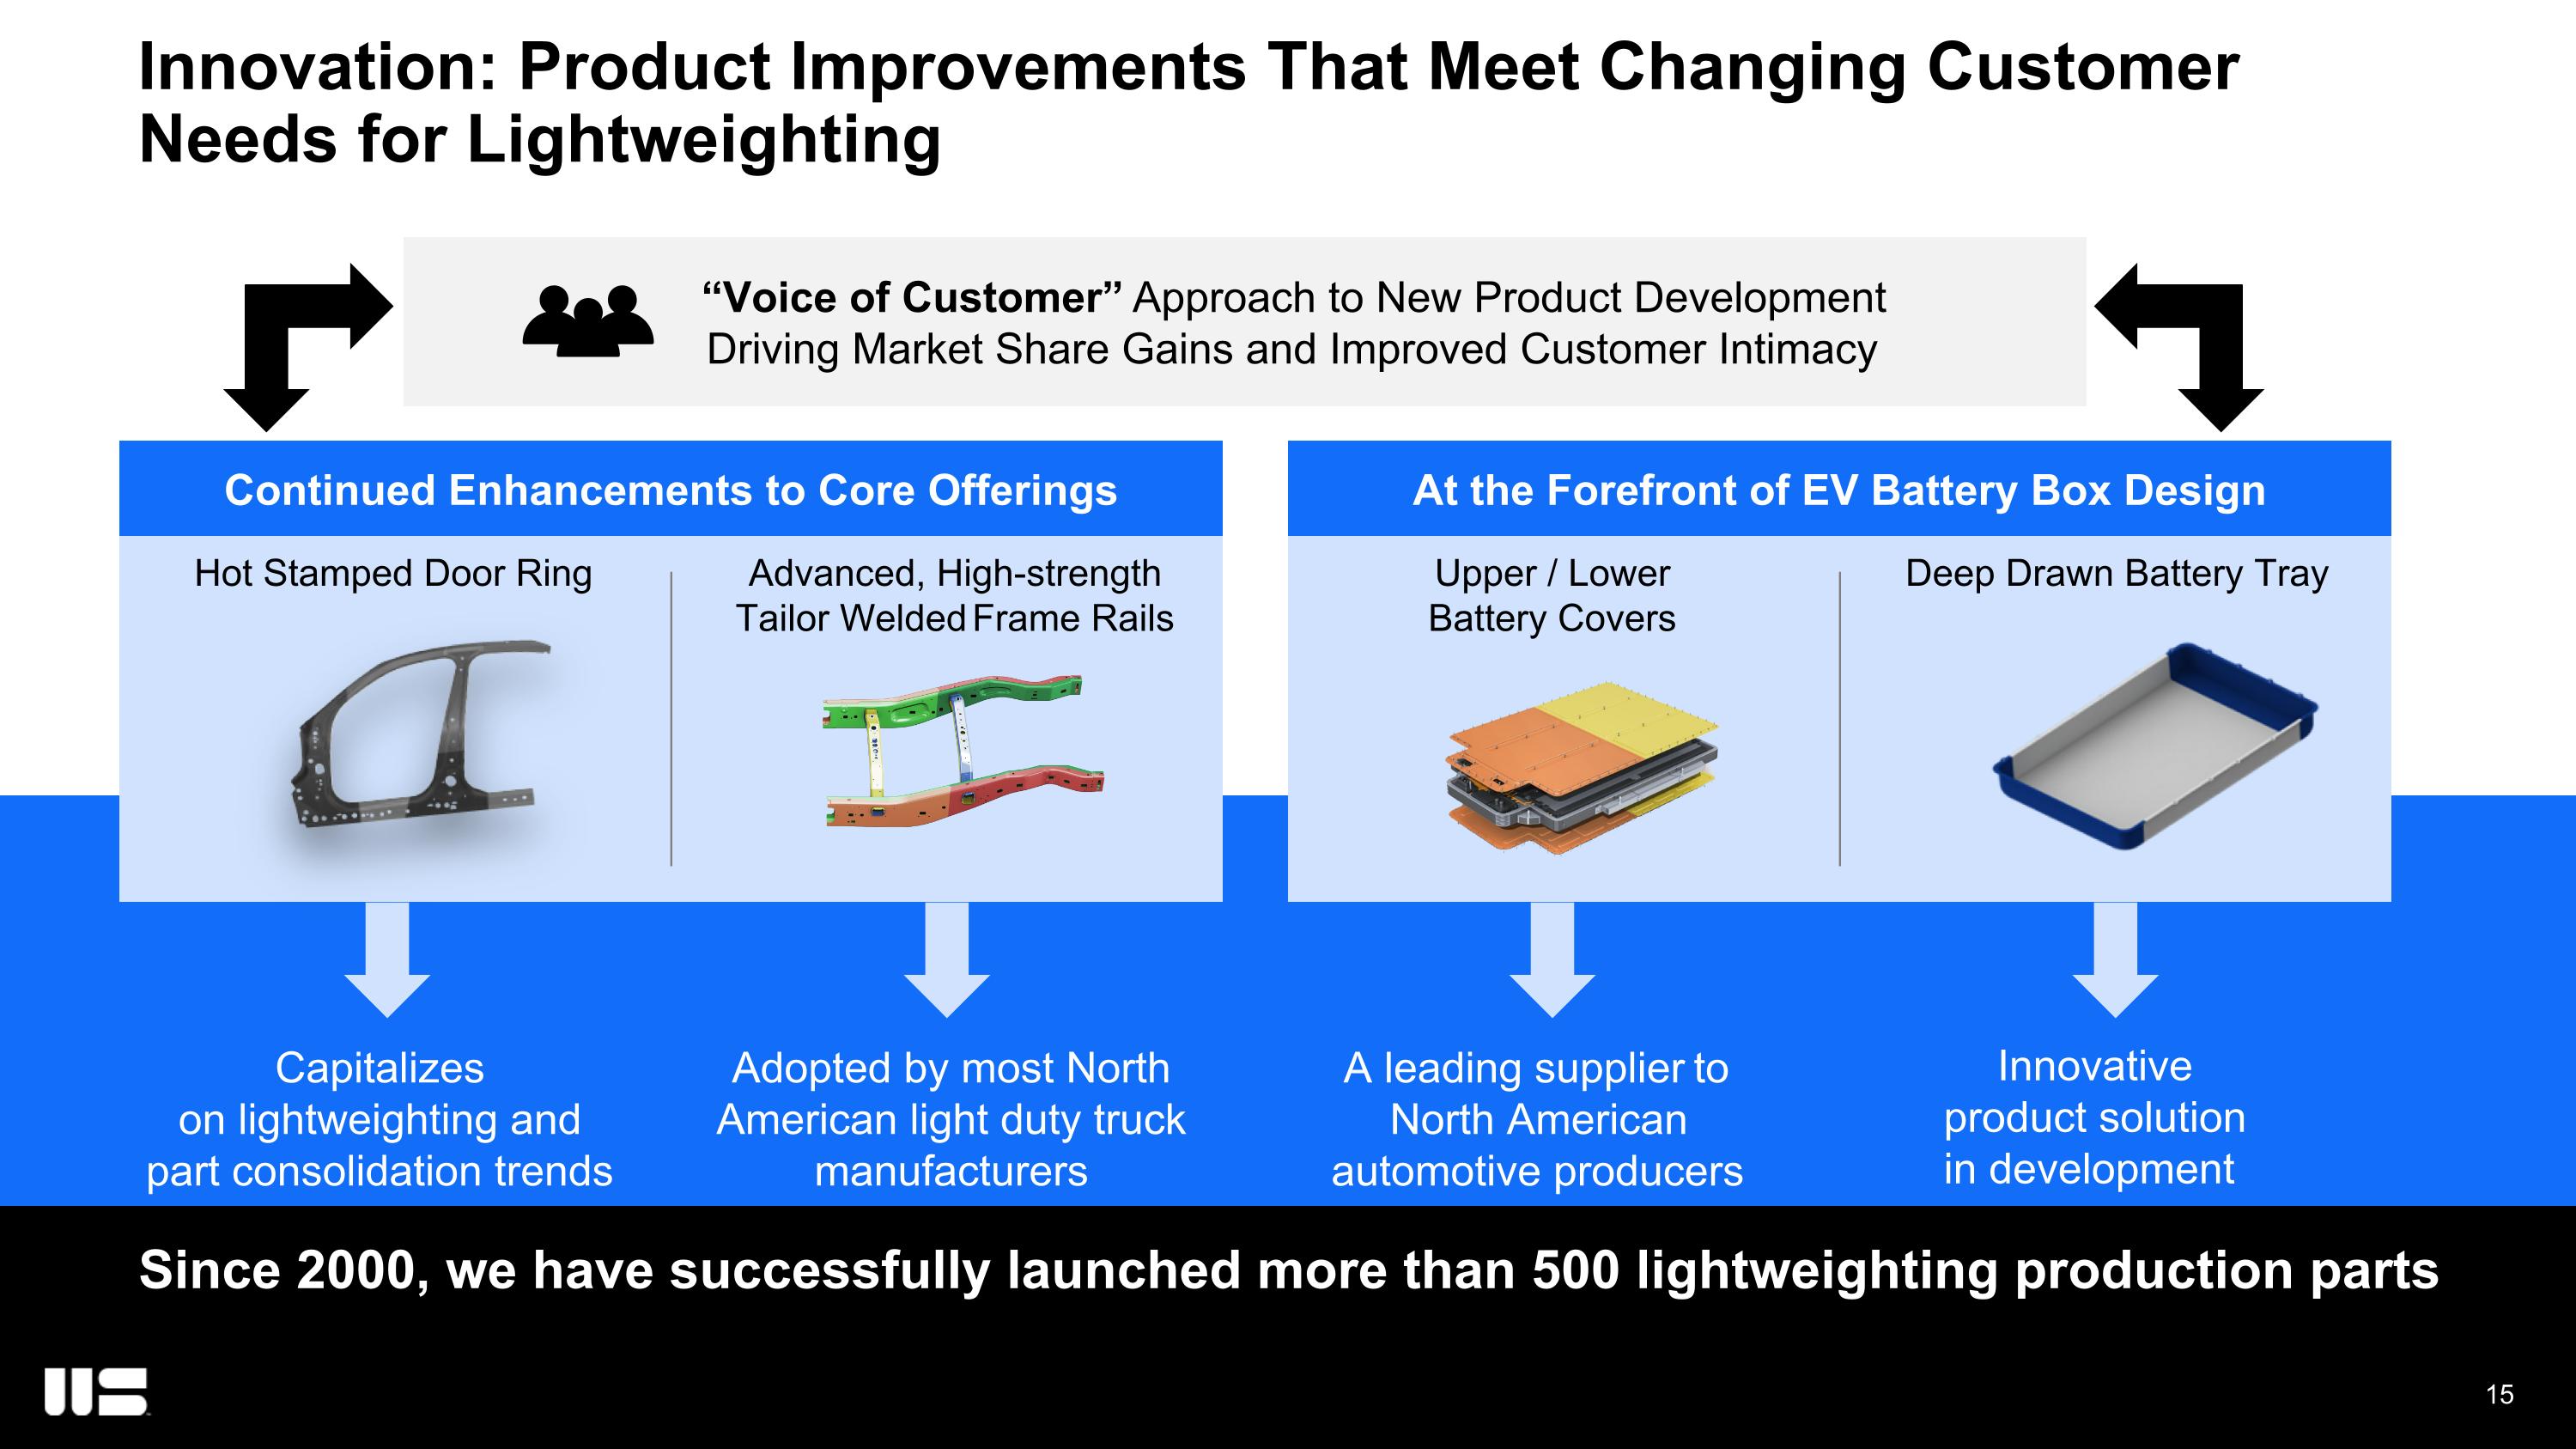

Slide 16

Results Innovation: Product Improvements That Meet Changing Customer Needs for Lightweighting Since 2000, we have successfully launched more than 500 lightweighting production parts “Voice of Customer” Approach to New Product Development Driving Market Share Gains and Improved Customer Intimacy Continued Enhancements to Core Offerings At the Forefront of EV Battery Box Design Hot Stamped Door Ring Advanced, High-strength Tailor Welded Frame Rails Capitalizes on lightweighting and part consolidation trends Adopted by most North American light duty truck manufacturers Upper / Lower Battery Covers Deep Drawn Battery Tray A leading supplier to North American automotive producers Innovative product solution in development 
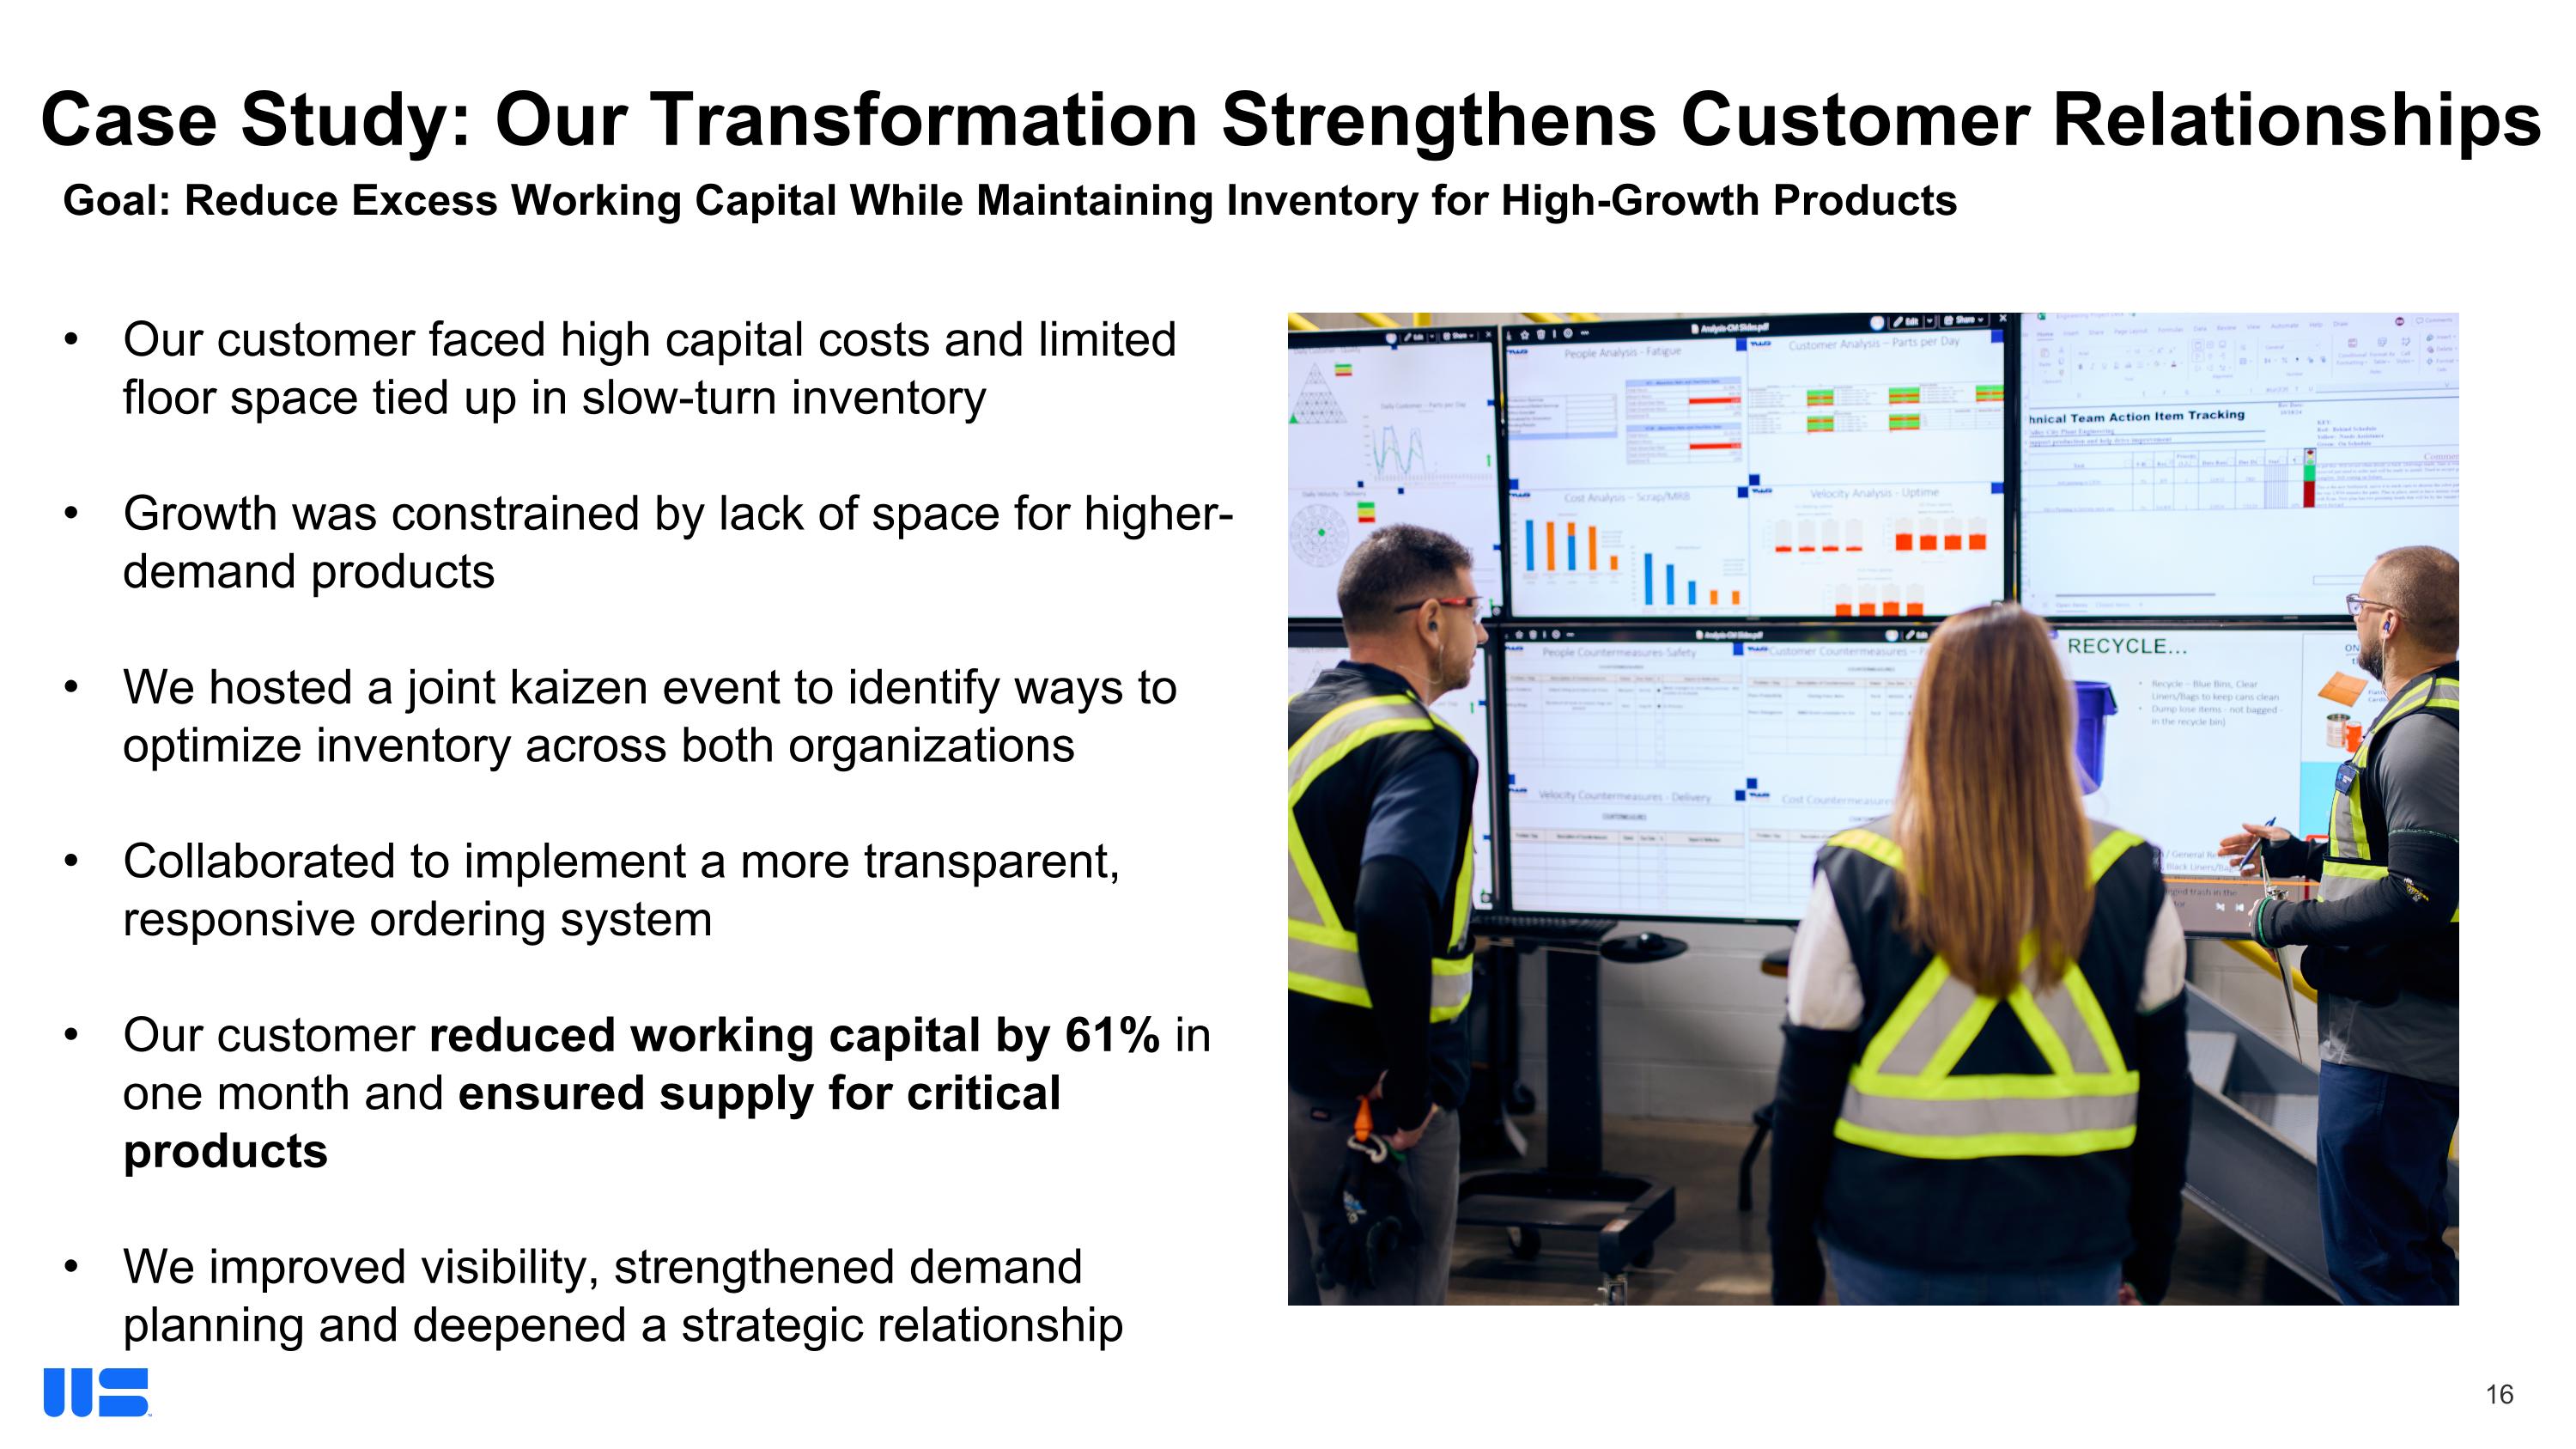

Slide 17

Goal: Reduce Excess Working Capital While Maintaining Inventory for High-Growth Products Case Study: Our Transformation Strengthens Customer Relationships Our customer faced high capital costs and limited floor space tied up in slow-turn inventory Growth was constrained by lack of space for higher-demand products We hosted a joint kaizen event to identify ways to optimize inventory across both organizations Collaborated to implement a more transparent, responsive ordering system Our customer reduced working capital by 61% in one month and ensured supply for critical products We improved visibility, strengthened demand planning and deepened a strategic relationship
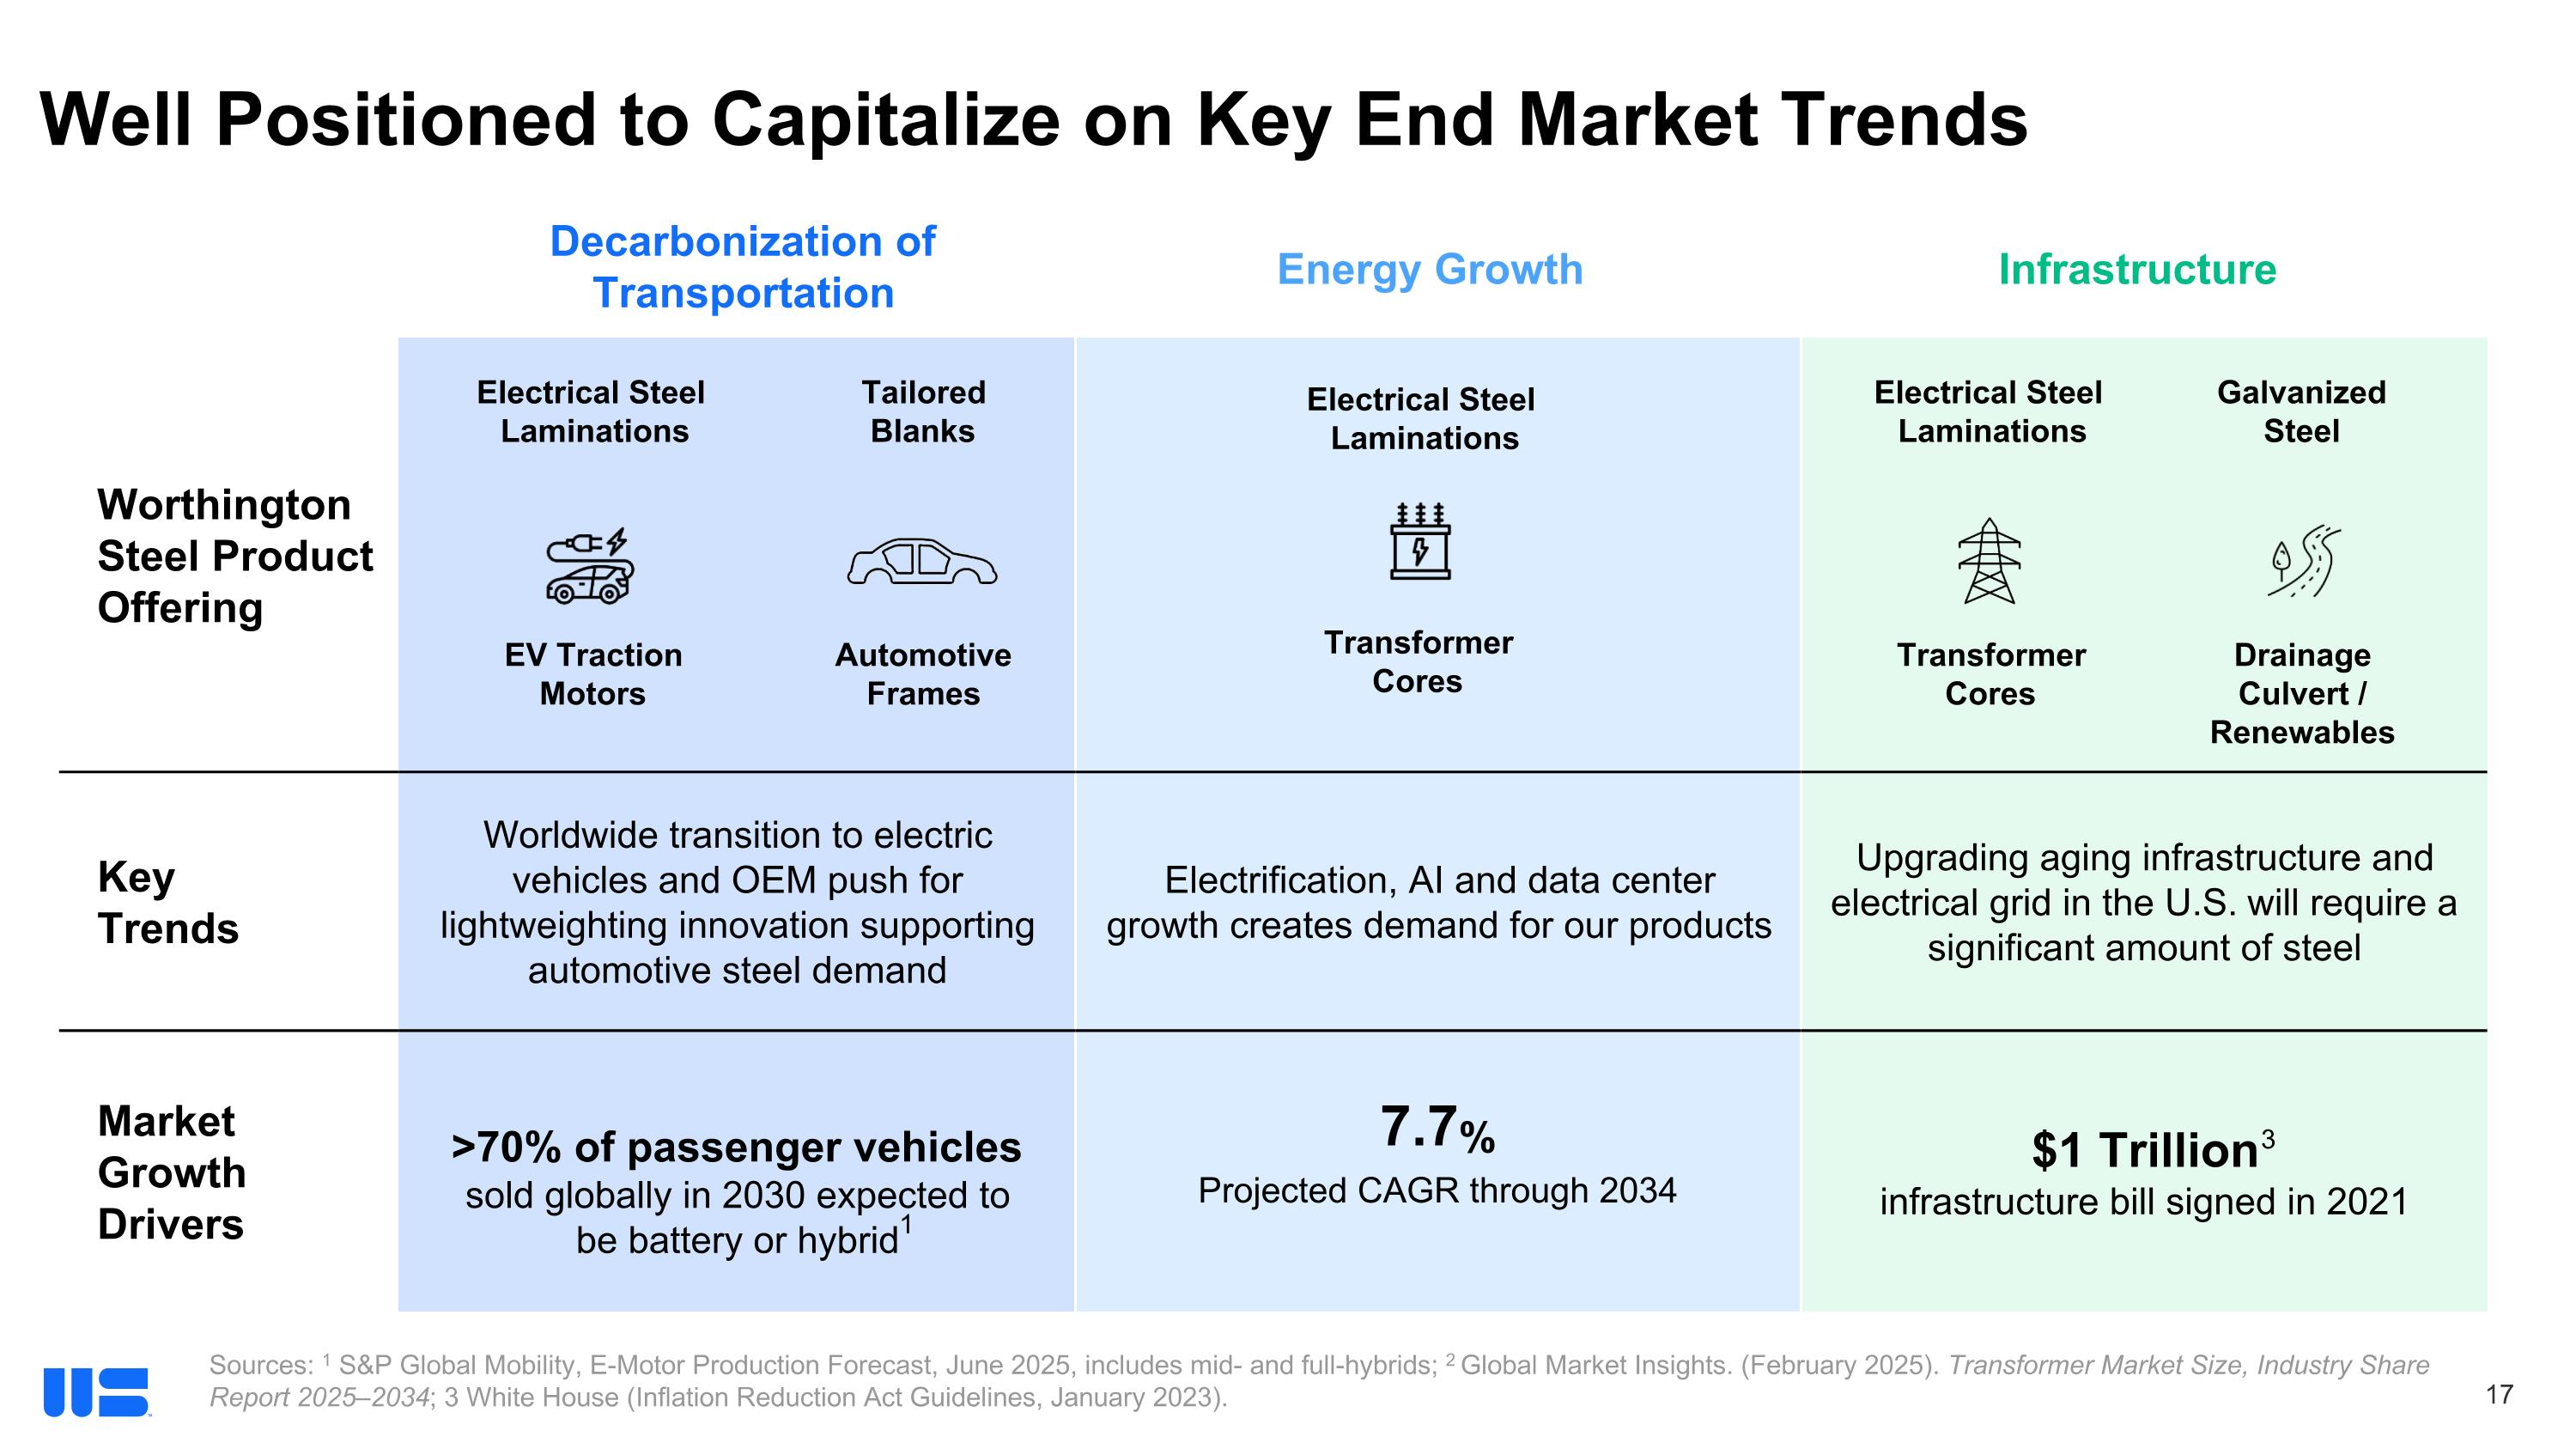

Slide 18

Well Positioned to Capitalize on Key End Market Trends Worthington Steel Product Offering Key Trends Worldwide transition to electric vehicles and OEM push for lightweighting innovation supporting automotive steel demand Electrification, AI and data center growth creates demand for our products Upgrading aging infrastructure and electrical grid in the U.S. will require a significant amount of steel Market Growth Drivers >70% of passenger vehicles sold globally in 2030 expected to be battery or hybrid 7.7% Projected CAGR through 2034 $1 Trillion infrastructure bill signed in 2021 Decarbonization of Transportation Energy Growth Infrastructure Tailored Blanks Electrical Steel Laminations EV Traction Motors Automotive Frames Electrical Steel Laminations Transformer Cores Galvanized Steel Electrical Steel Laminations Transformer Cores Drainage Culvert / Renewables Sources: 1 S&P Global Mobility, E-Motor Production Forecast, June 2025, includes mid- and full-hybrids; 2 Global Market Insights. (February 2025). Transformer Market Size, Industry Share Report 2025–2034; 3 White House (Inflation Reduction Act Guidelines, January 2023). 1 3
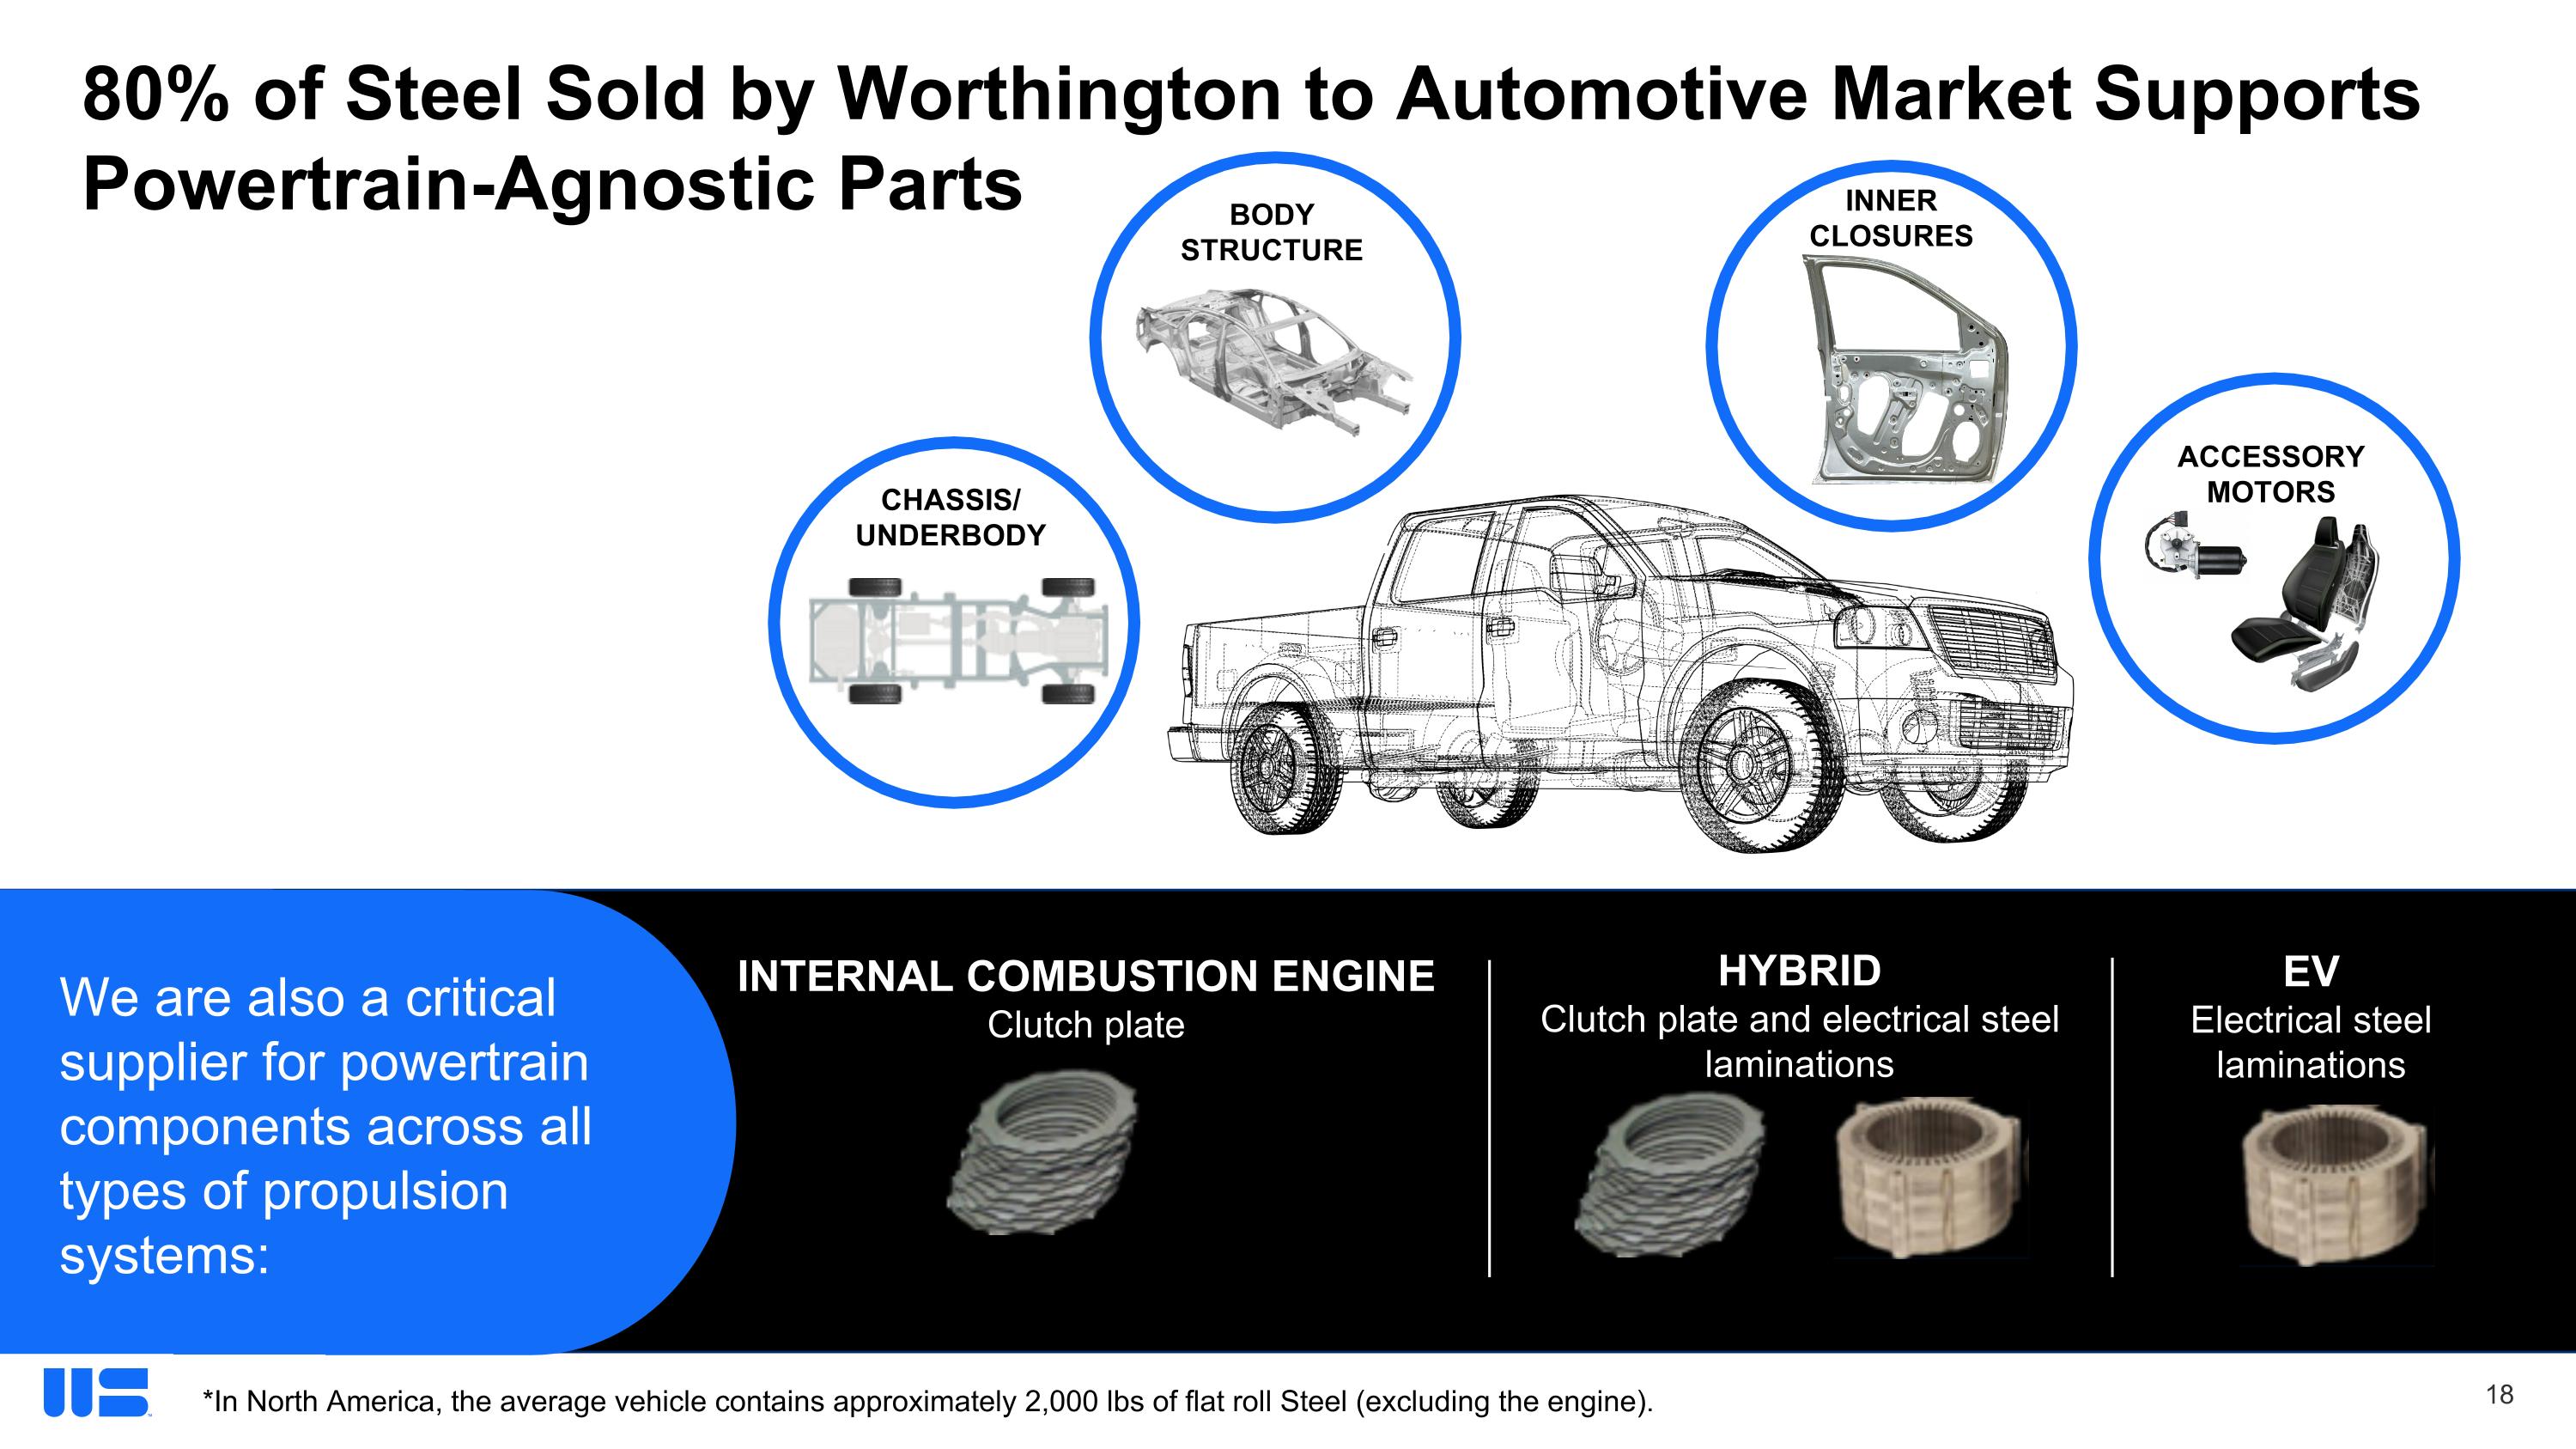

Slide 19

HYBRID Clutch plate and electrical steel laminations 80% of Steel Sold by Worthington to Automotive Market Supports Powertrain-Agnostic Parts *In North America, the average vehicle contains approximately 2,000 lbs of flat roll Steel (excluding the engine). ACCESSORY MOTORS CHASSIS/ UNDERBODY INNER CLOSURES BODY STRUCTURE INTERNAL COMBUSTION ENGINE Clutch plate EV Electrical steel laminations We are also a critical supplier for powertrain components across all types of propulsion systems:
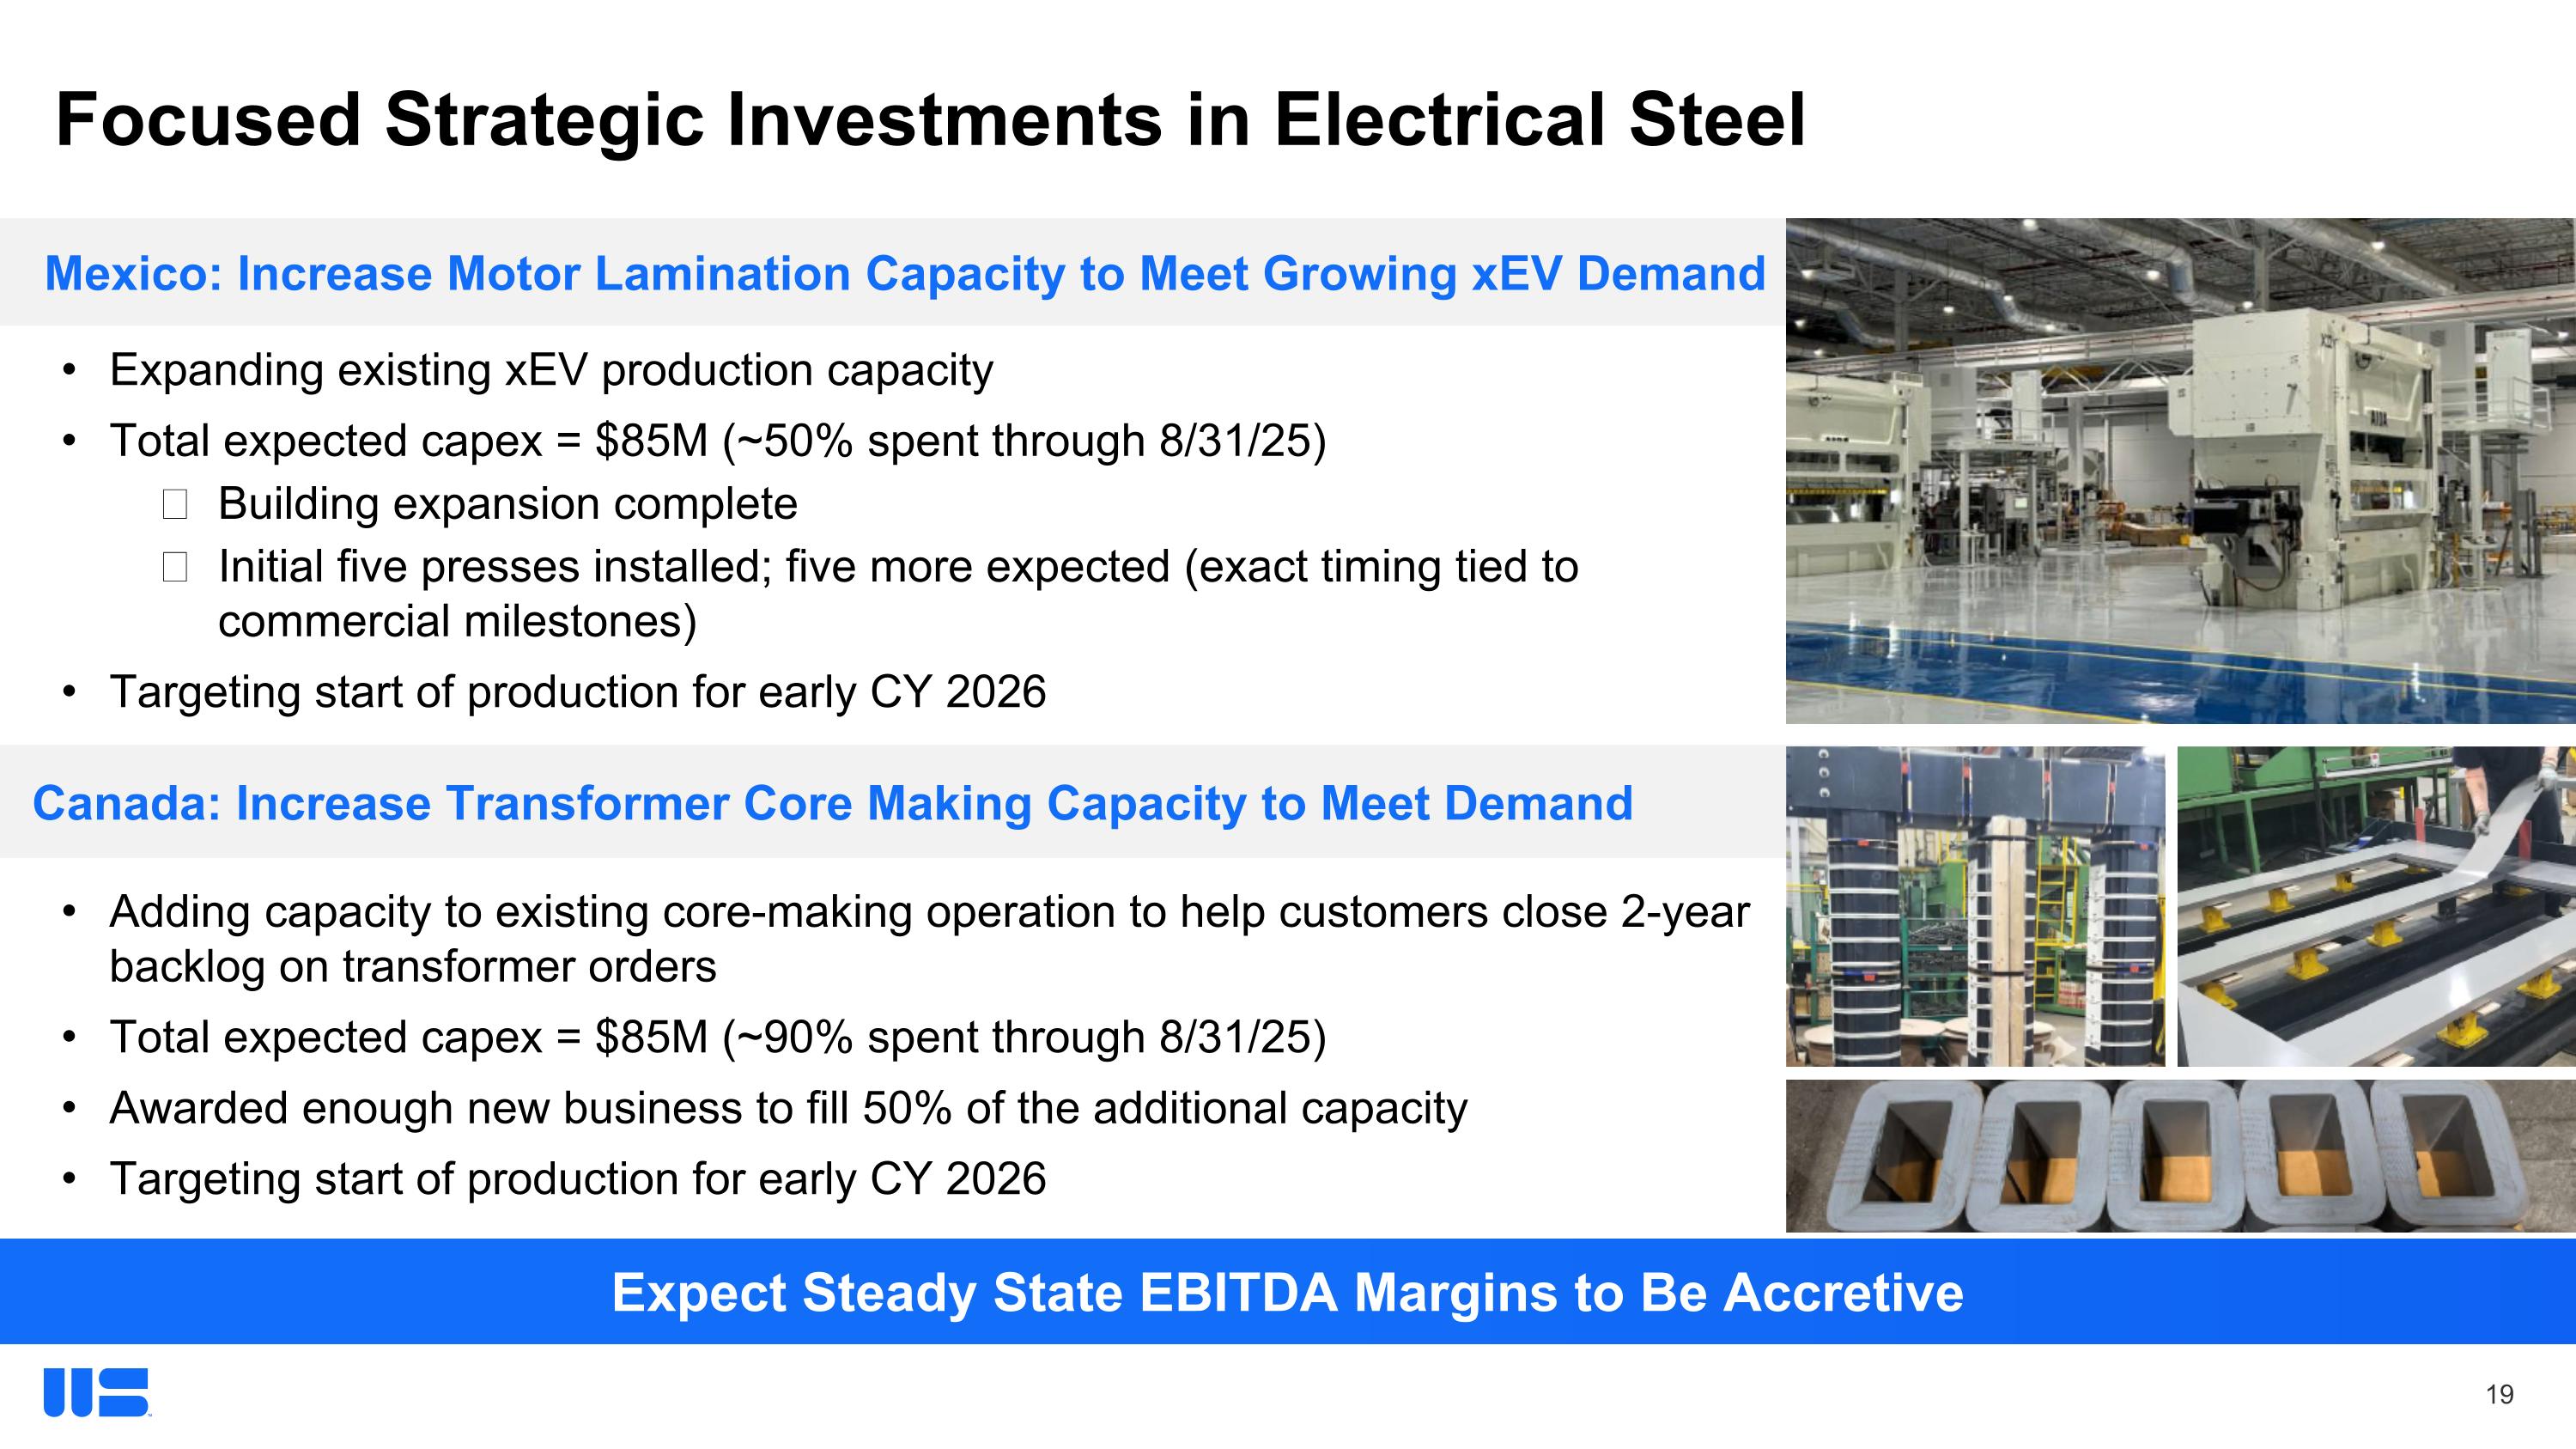

Slide 20

Focused Strategic Investments in Electrical Steel Expanding existing xEV production capacity Total expected capex = $85M (~50% spent through 8/31/25) Building expansion complete Initial five presses installed; five more expected (exact timing tied to commercial milestones) Targeting start of production for early CY 2026 Adding capacity to existing core-making operation to help customers close 2-year backlog on transformer orders Total expected capex = $85M (~90% spent through 8/31/25) Awarded enough new business to fill 50% of the additional capacity Targeting start of production for early CY 2026 Expect Steady State EBITDA Margins to Be Accretive Mexico: Increase Motor Lamination Capacity to Meet Growing xEV Demand Canada: Increase Transformer Core Making Capacity to Meet Demand

Slide 21

M&A Is a Key Part of Our Strategy BlankLight® Assets Strip Steel Assets Automotive Components Nagold, GER Select Acquisitions Investment Criteria Well-run, successful companies with strong management teams Culture aligns with Our Philosophy Accretive to earnings per share in a short period of time and increases overall EBITDA margin Opportunities to increase value through Transformation and synergy capture Strengthen our business in current markets or provide access to new, attractive and more niche markets
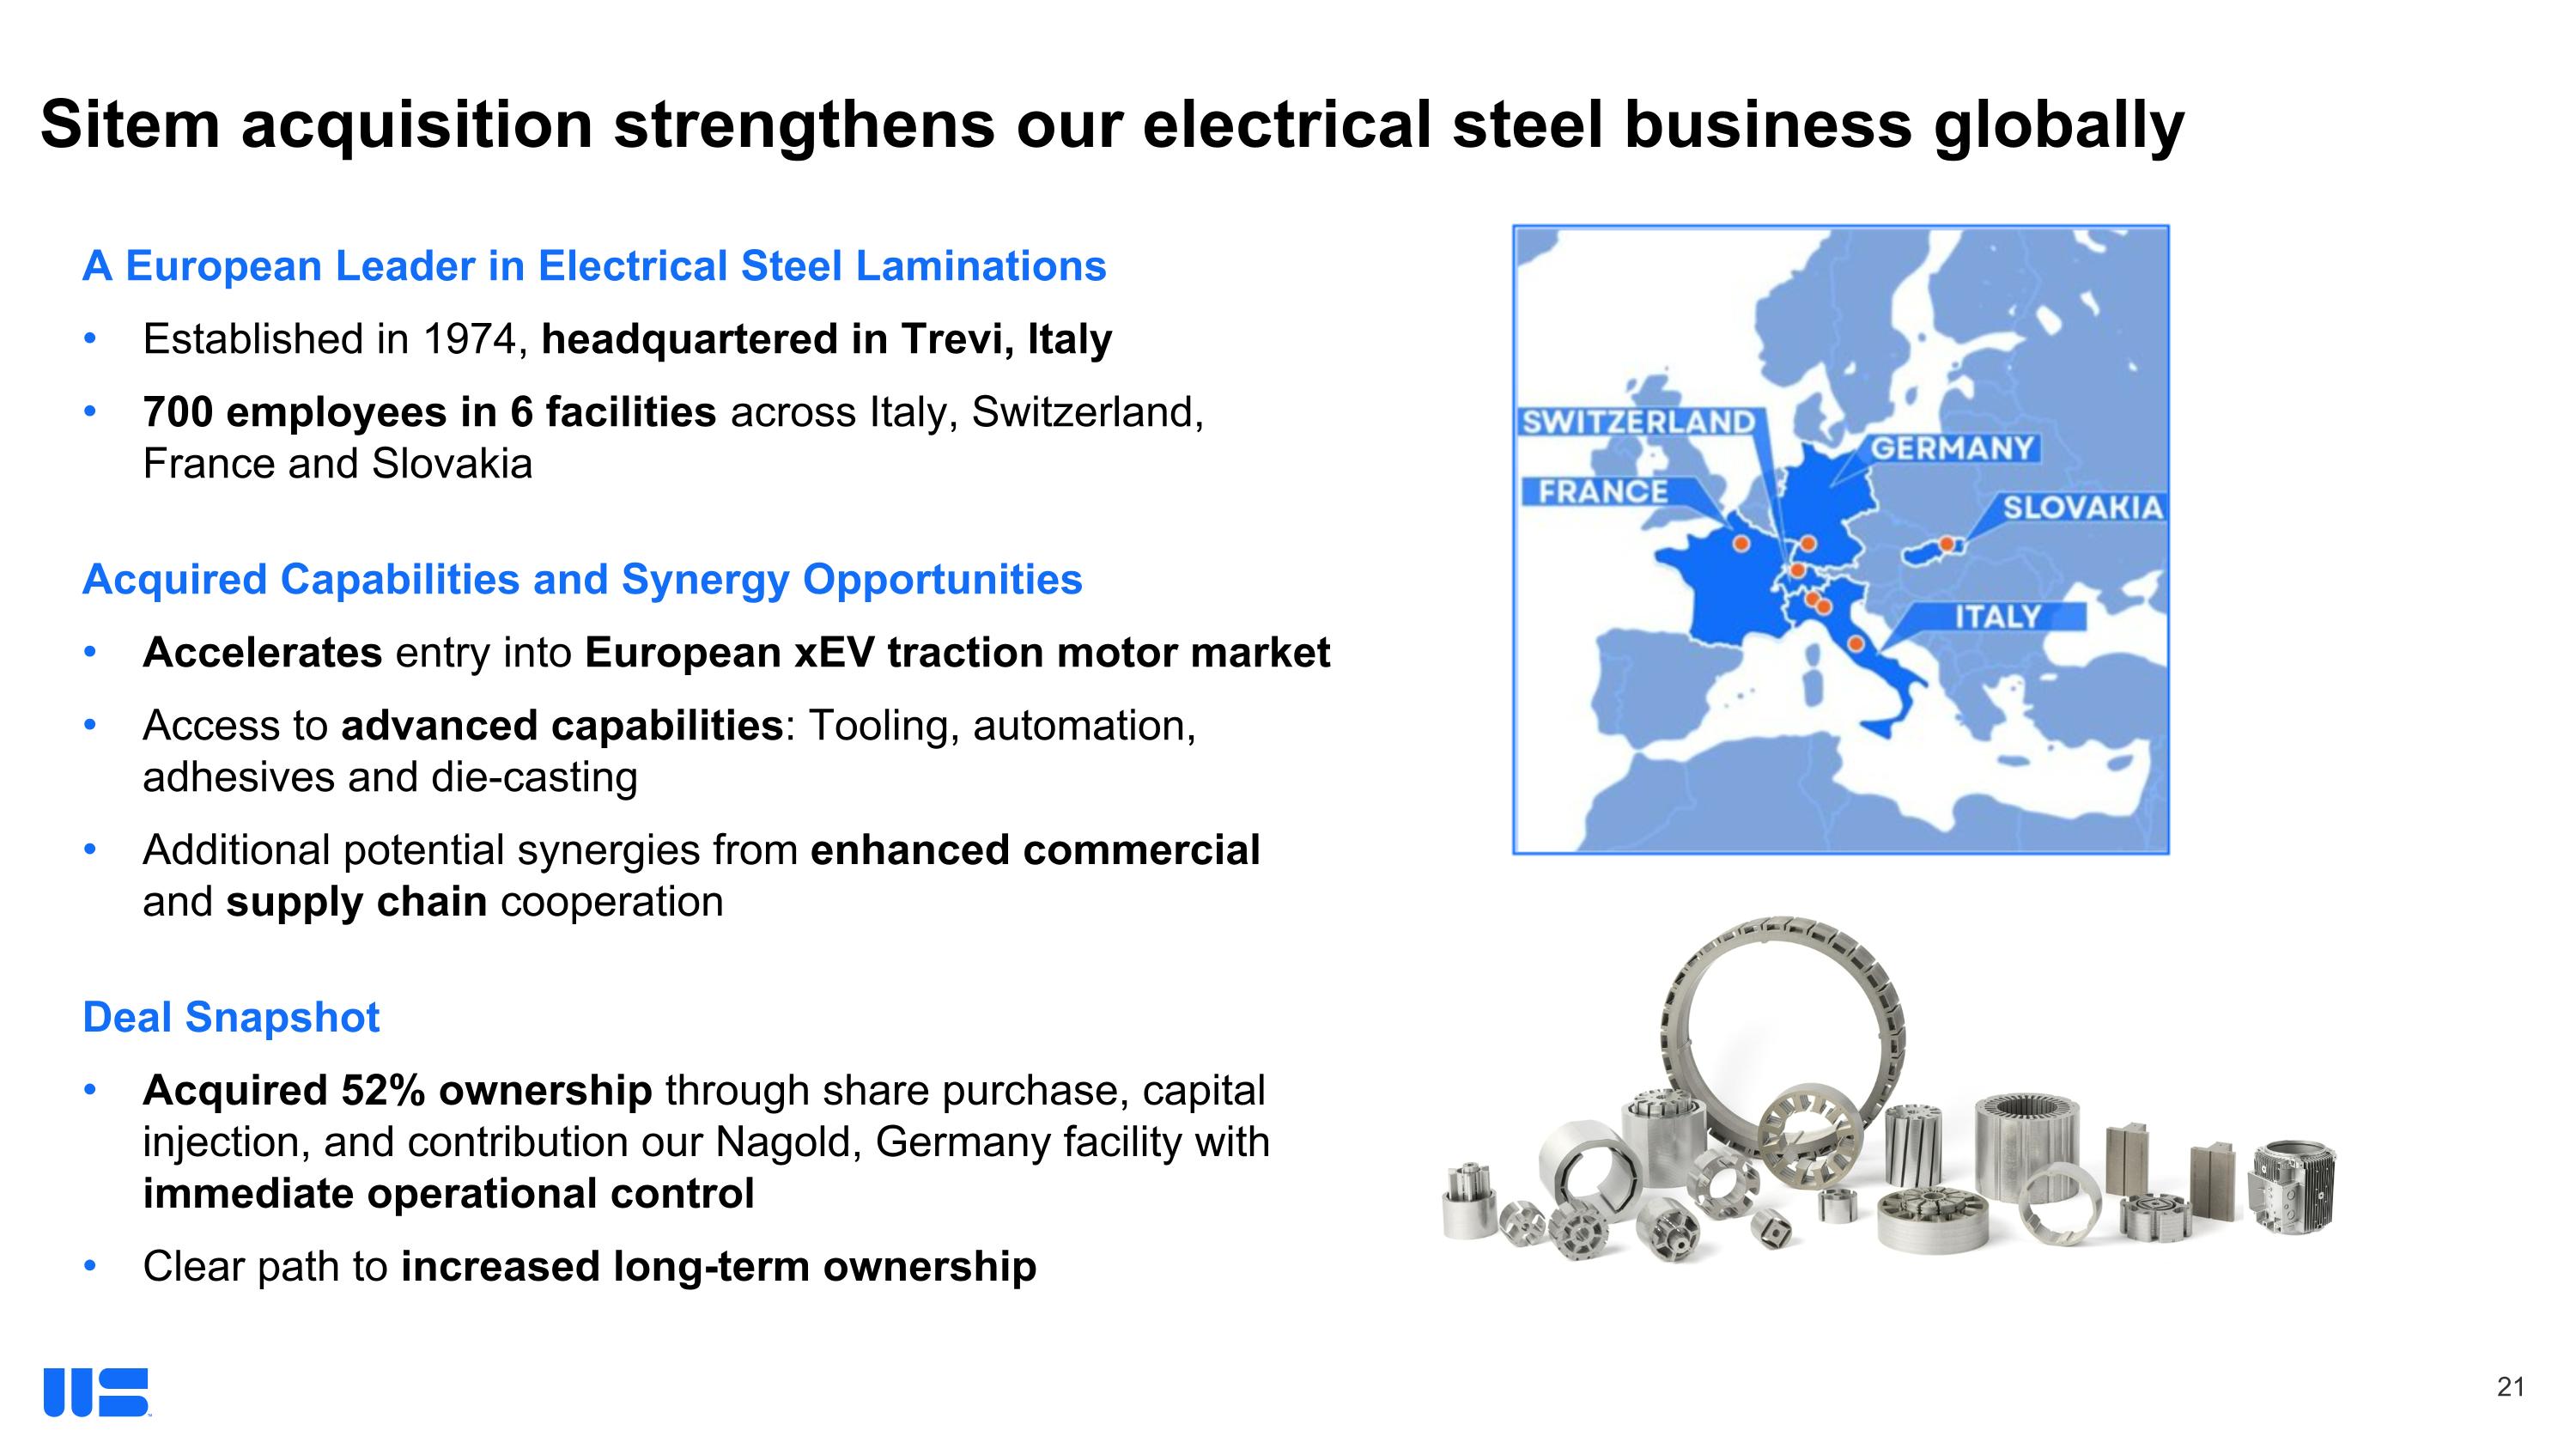

Slide 22

Sitem acquisition strengthens our electrical steel business globally A European Leader in Electrical Steel Laminations Established in 1974, headquartered in Trevi, Italy 700 employees in 6 facilities across Italy, Switzerland, France and Slovakia Acquired Capabilities and Synergy Opportunities Accelerates entry into European xEV traction motor market Access to advanced capabilities: Tooling, automation, adhesives and die-casting Additional potential synergies from enhanced commercial and supply chain cooperation Deal Snapshot Acquired 52% ownership through share purchase, capital injection, and contribution our Nagold, Germany facility with immediate operational control Clear path to increased long-term ownership

Slide 23

Key Financial Metrics


Slide 24

Resilient Financial Performance Despite Commodity Volatility Net Sales ($M) & Volumes (M Tons) Adjusted EBITDA ($M) & Margin (%) Estimated Holding G/(L)1 ($49) ($3) ($10) $12 Note: FY is fiscal year ended May 31. TTM ended August 31, 2025. 1 Estimated Inventory Holding Gains or Losses in respective period.
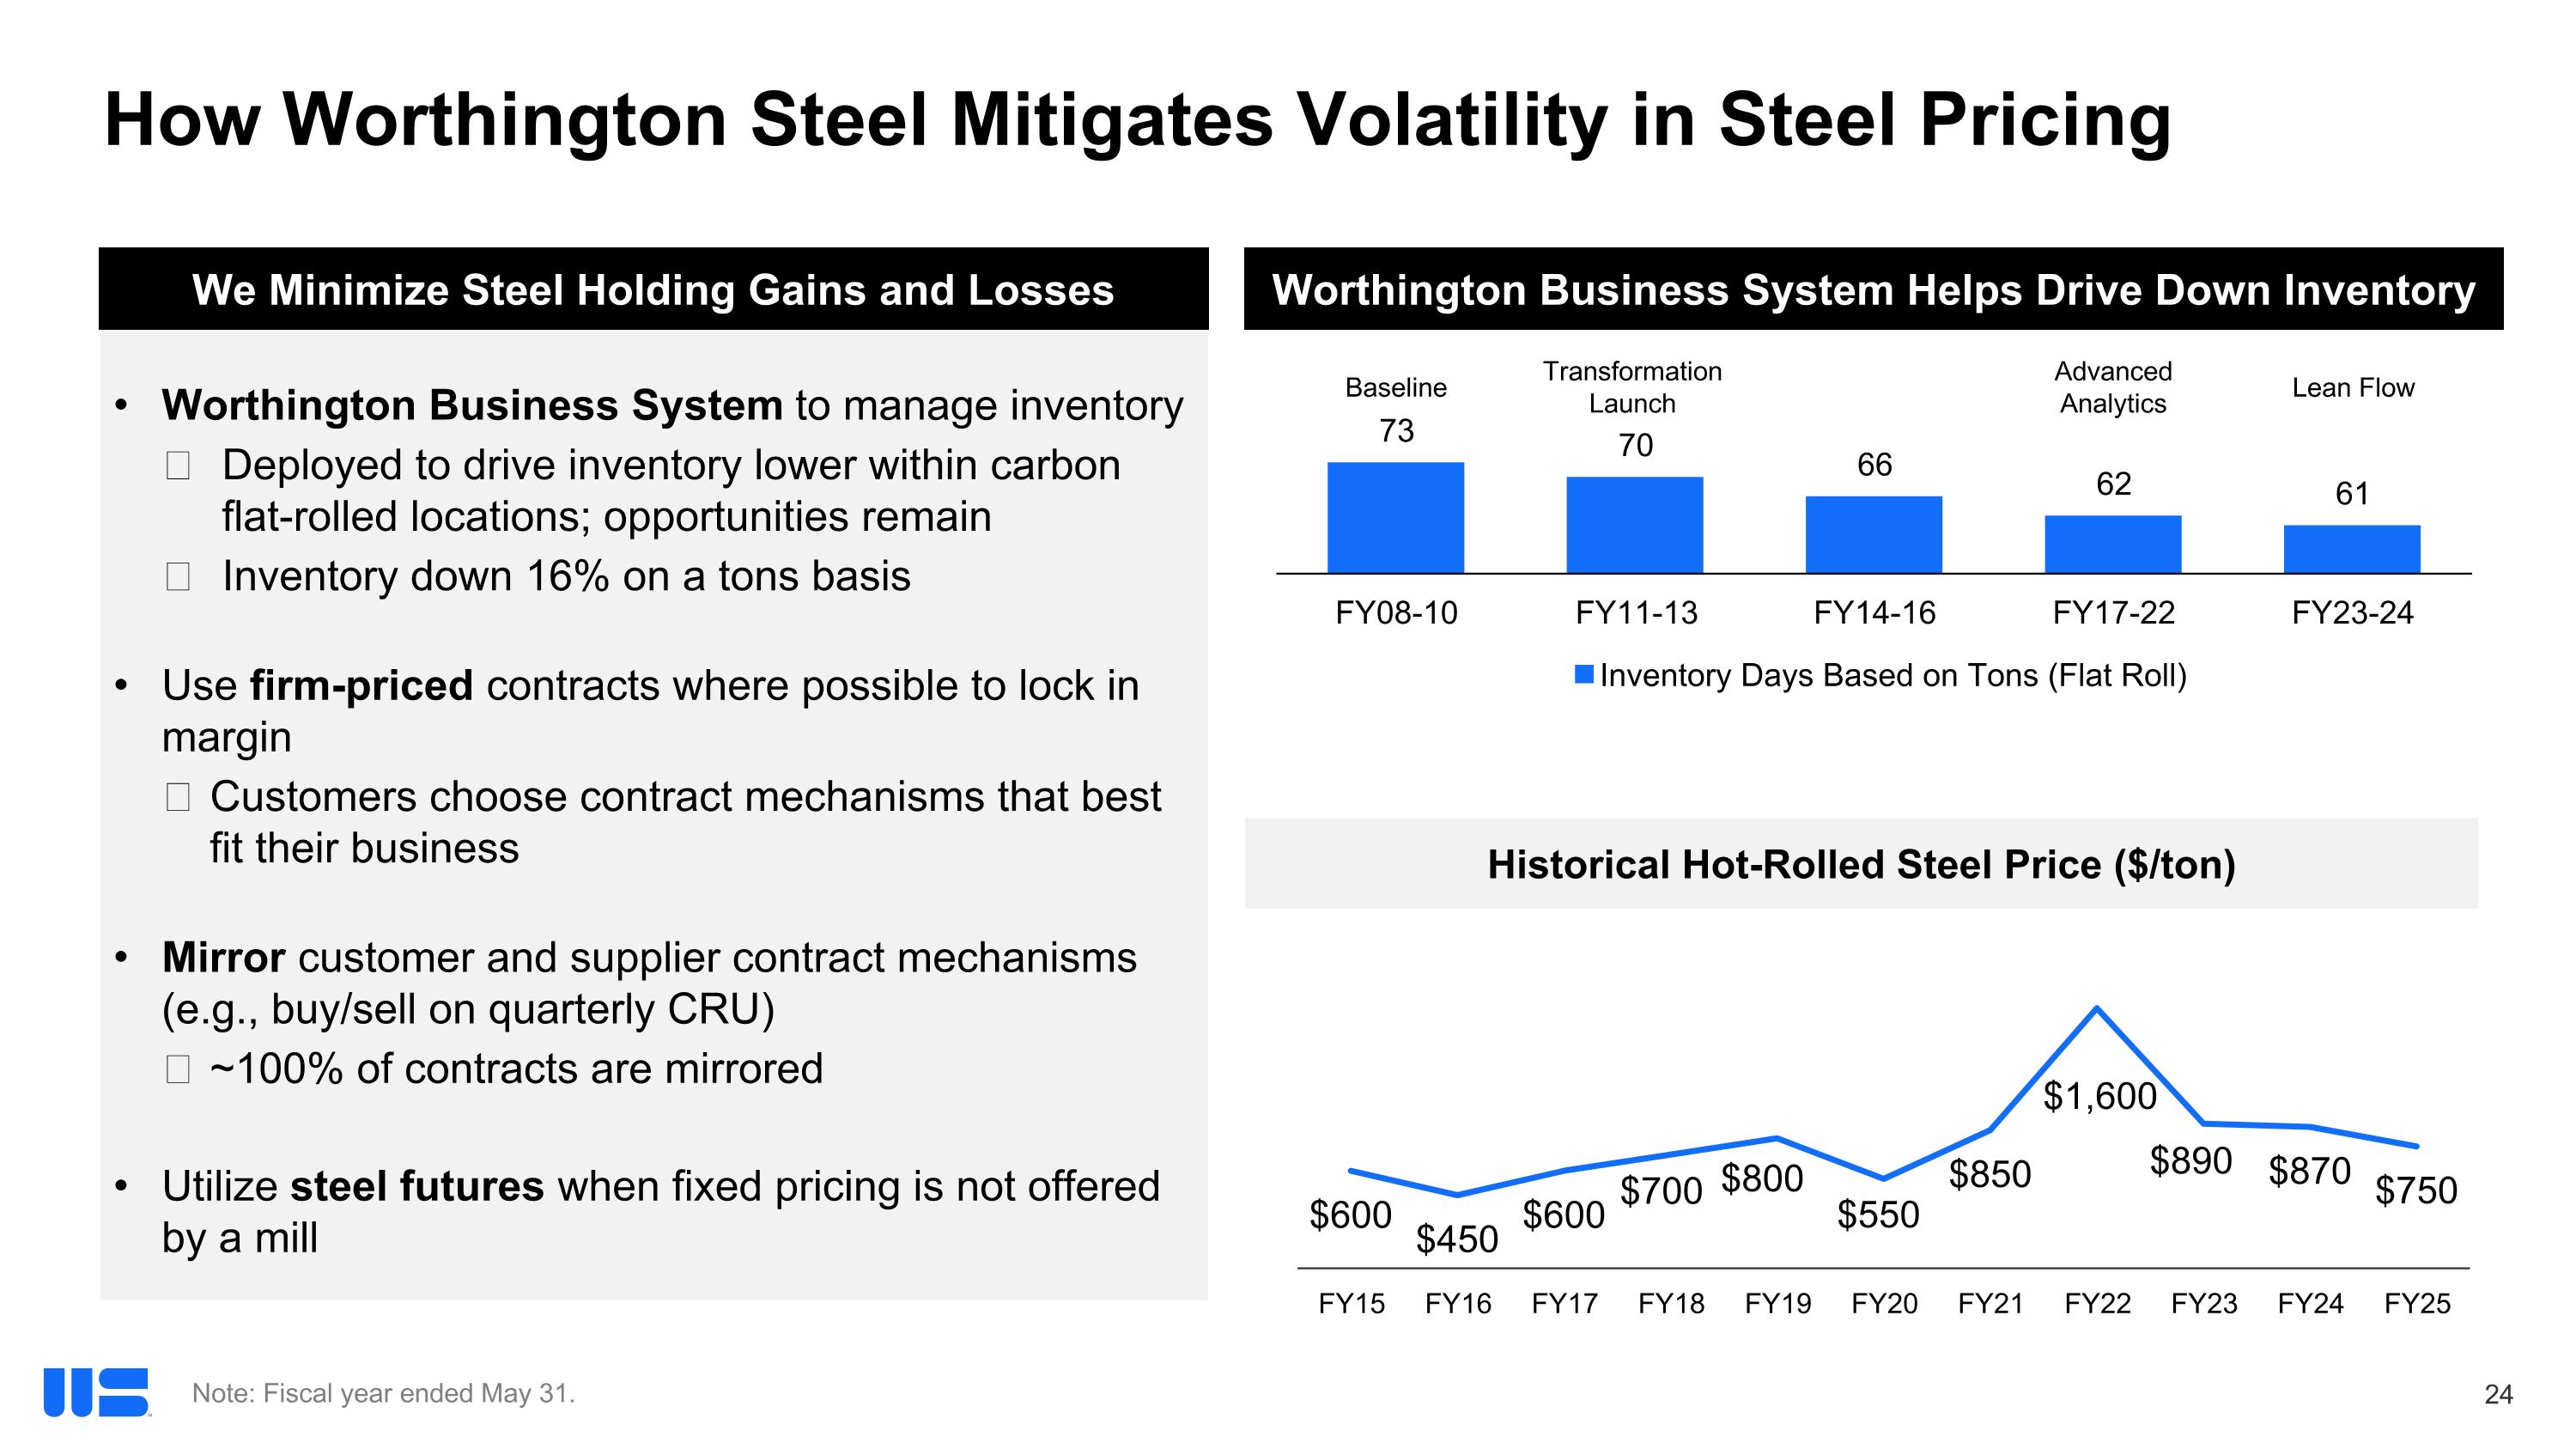

Slide 25

How Worthington Steel Mitigates Volatility in Steel Pricing Worthington Business System to manage inventory Deployed to drive inventory lower within carbon flat-rolled locations; opportunities remain Inventory down 16% on a tons basis Use firm-priced contracts where possible to lock in margin Customers choose contract mechanisms that best fit their business Mirror customer and supplier contract mechanisms (e.g., buy/sell on quarterly CRU) ~100% of contracts are mirrored Utilize steel futures when fixed pricing is not offered by a mill We Minimize Steel Holding Gains and Losses Note: Fiscal year ended May 31. Worthington Business System Helps Drive Down Inventory Transformation Launch Advanced Analytics Lean Flow Baseline Historical Hot-Rolled Steel Price ($/ton)
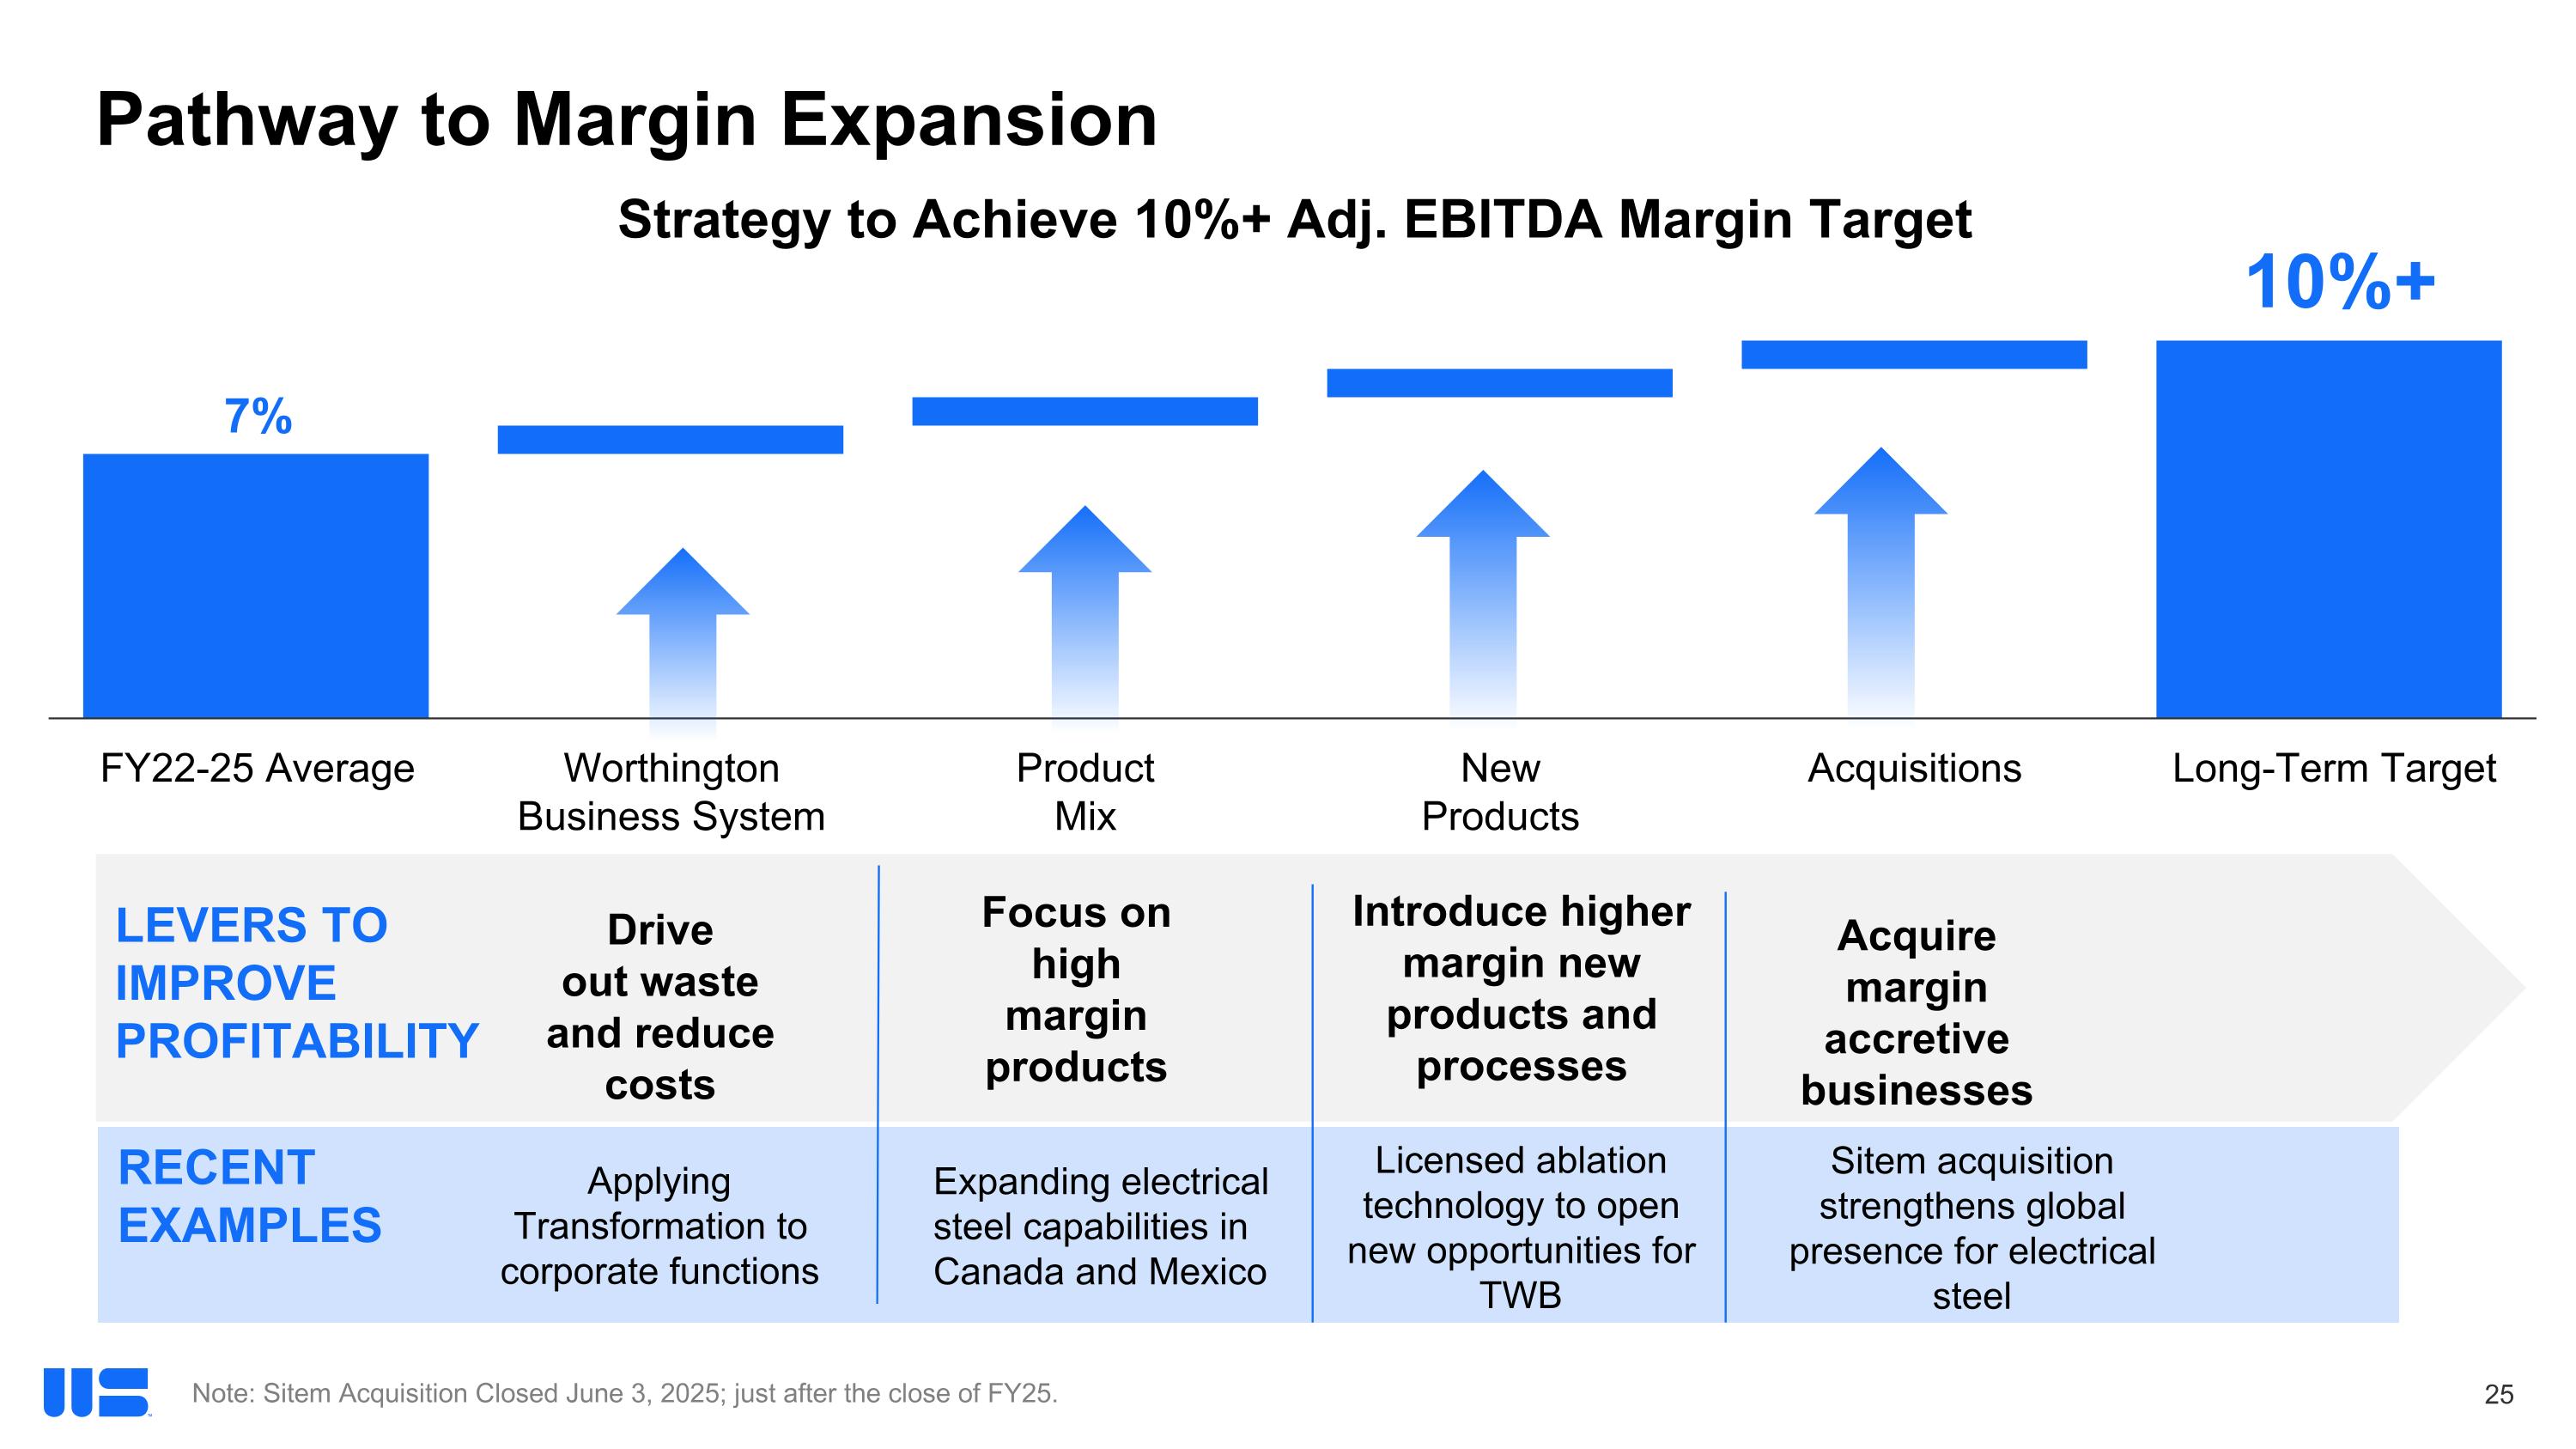

Slide 26

RECENT EXAMPLES Pathway to Margin Expansion Strategy to Achieve 10%+ Adj. EBITDA Margin Target Levers to Improve Profitability Focus on high margin products Drive out waste and reduce costs Introduce higher margin new products and processes Acquire margin accretive businesses 10%+ Note: Sitem Acquisition Closed June 3, 2025; just after the close of FY25. Applying Transformation to corporate functions Expanding electrical steel capabilities in Canada and Mexico Licensed ablation technology to open new opportunities for TWB Sitem acquisition strengthens global presence for electrical steel
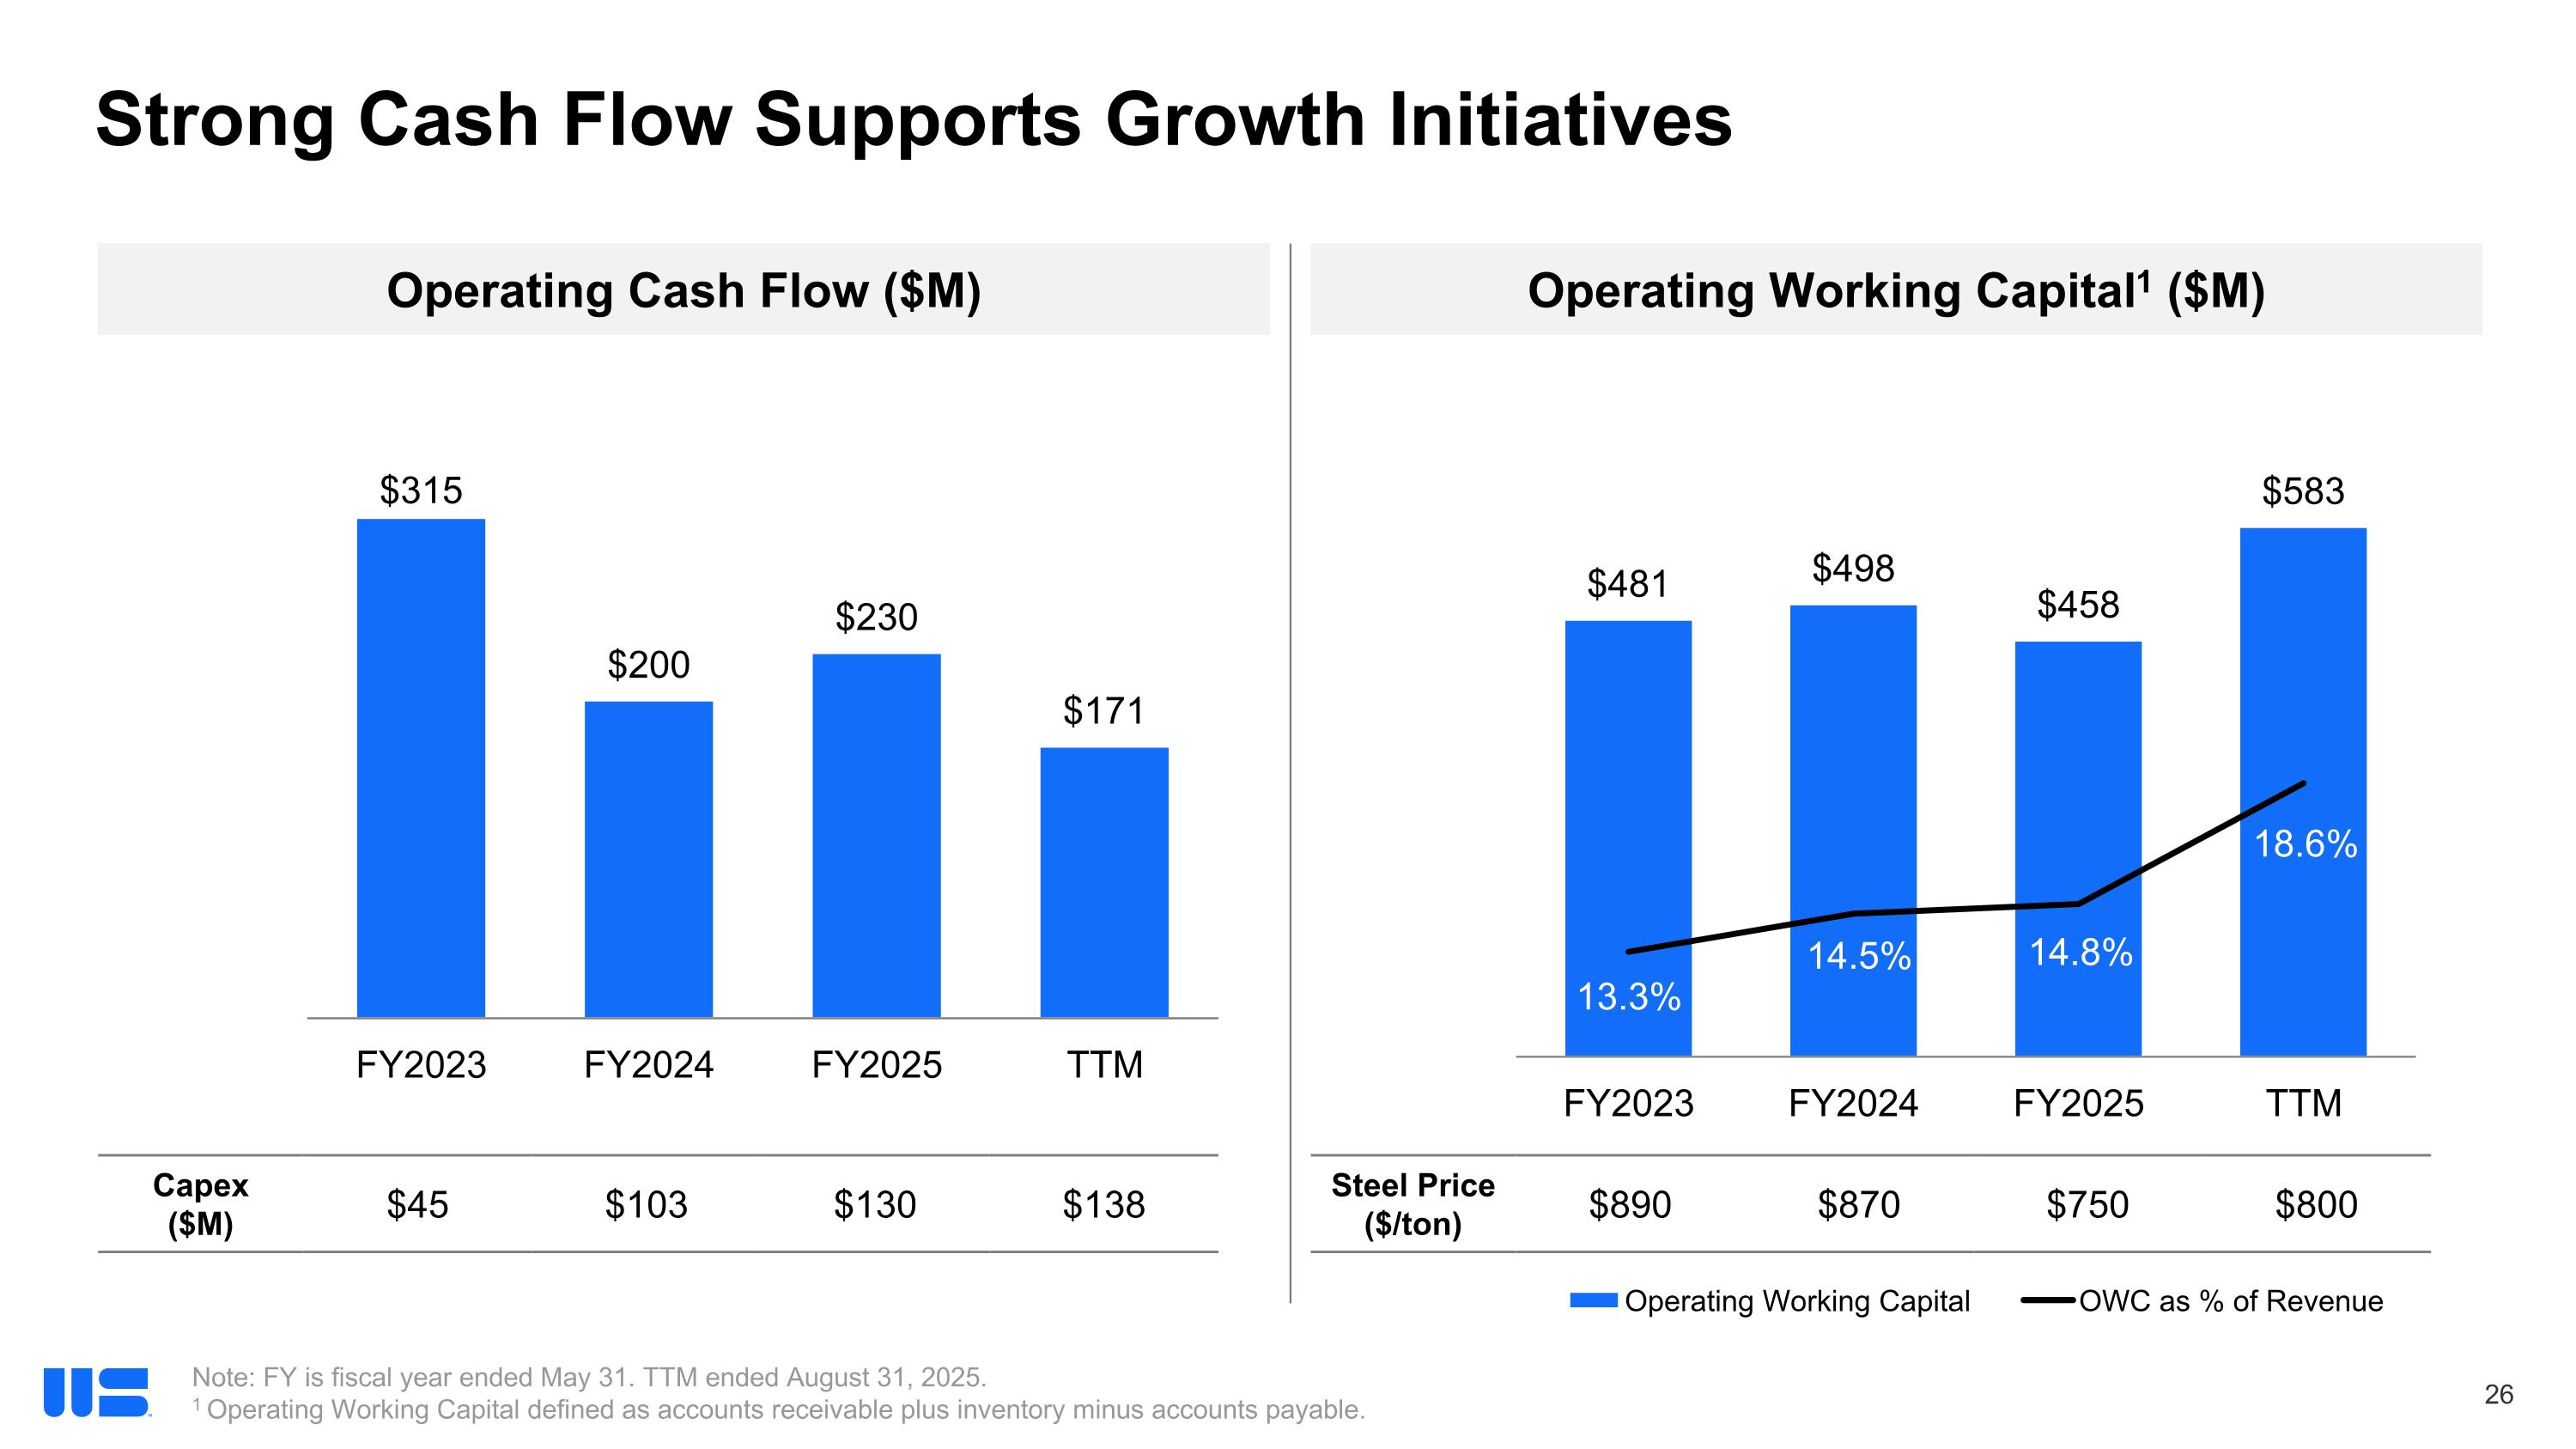

Slide 27

Strong Cash Flow Supports Growth Initiatives Note: FY is fiscal year ended May 31. TTM ended August 31, 2025. 1 Operating Working Capital defined as accounts receivable plus inventory minus accounts payable. Operating Cash Flow ($M) Operating Working Capital1 ($M) Capex ($M) $45 $103 $130 $138 Steel Price ($/ton) $890 $870 $750 $800
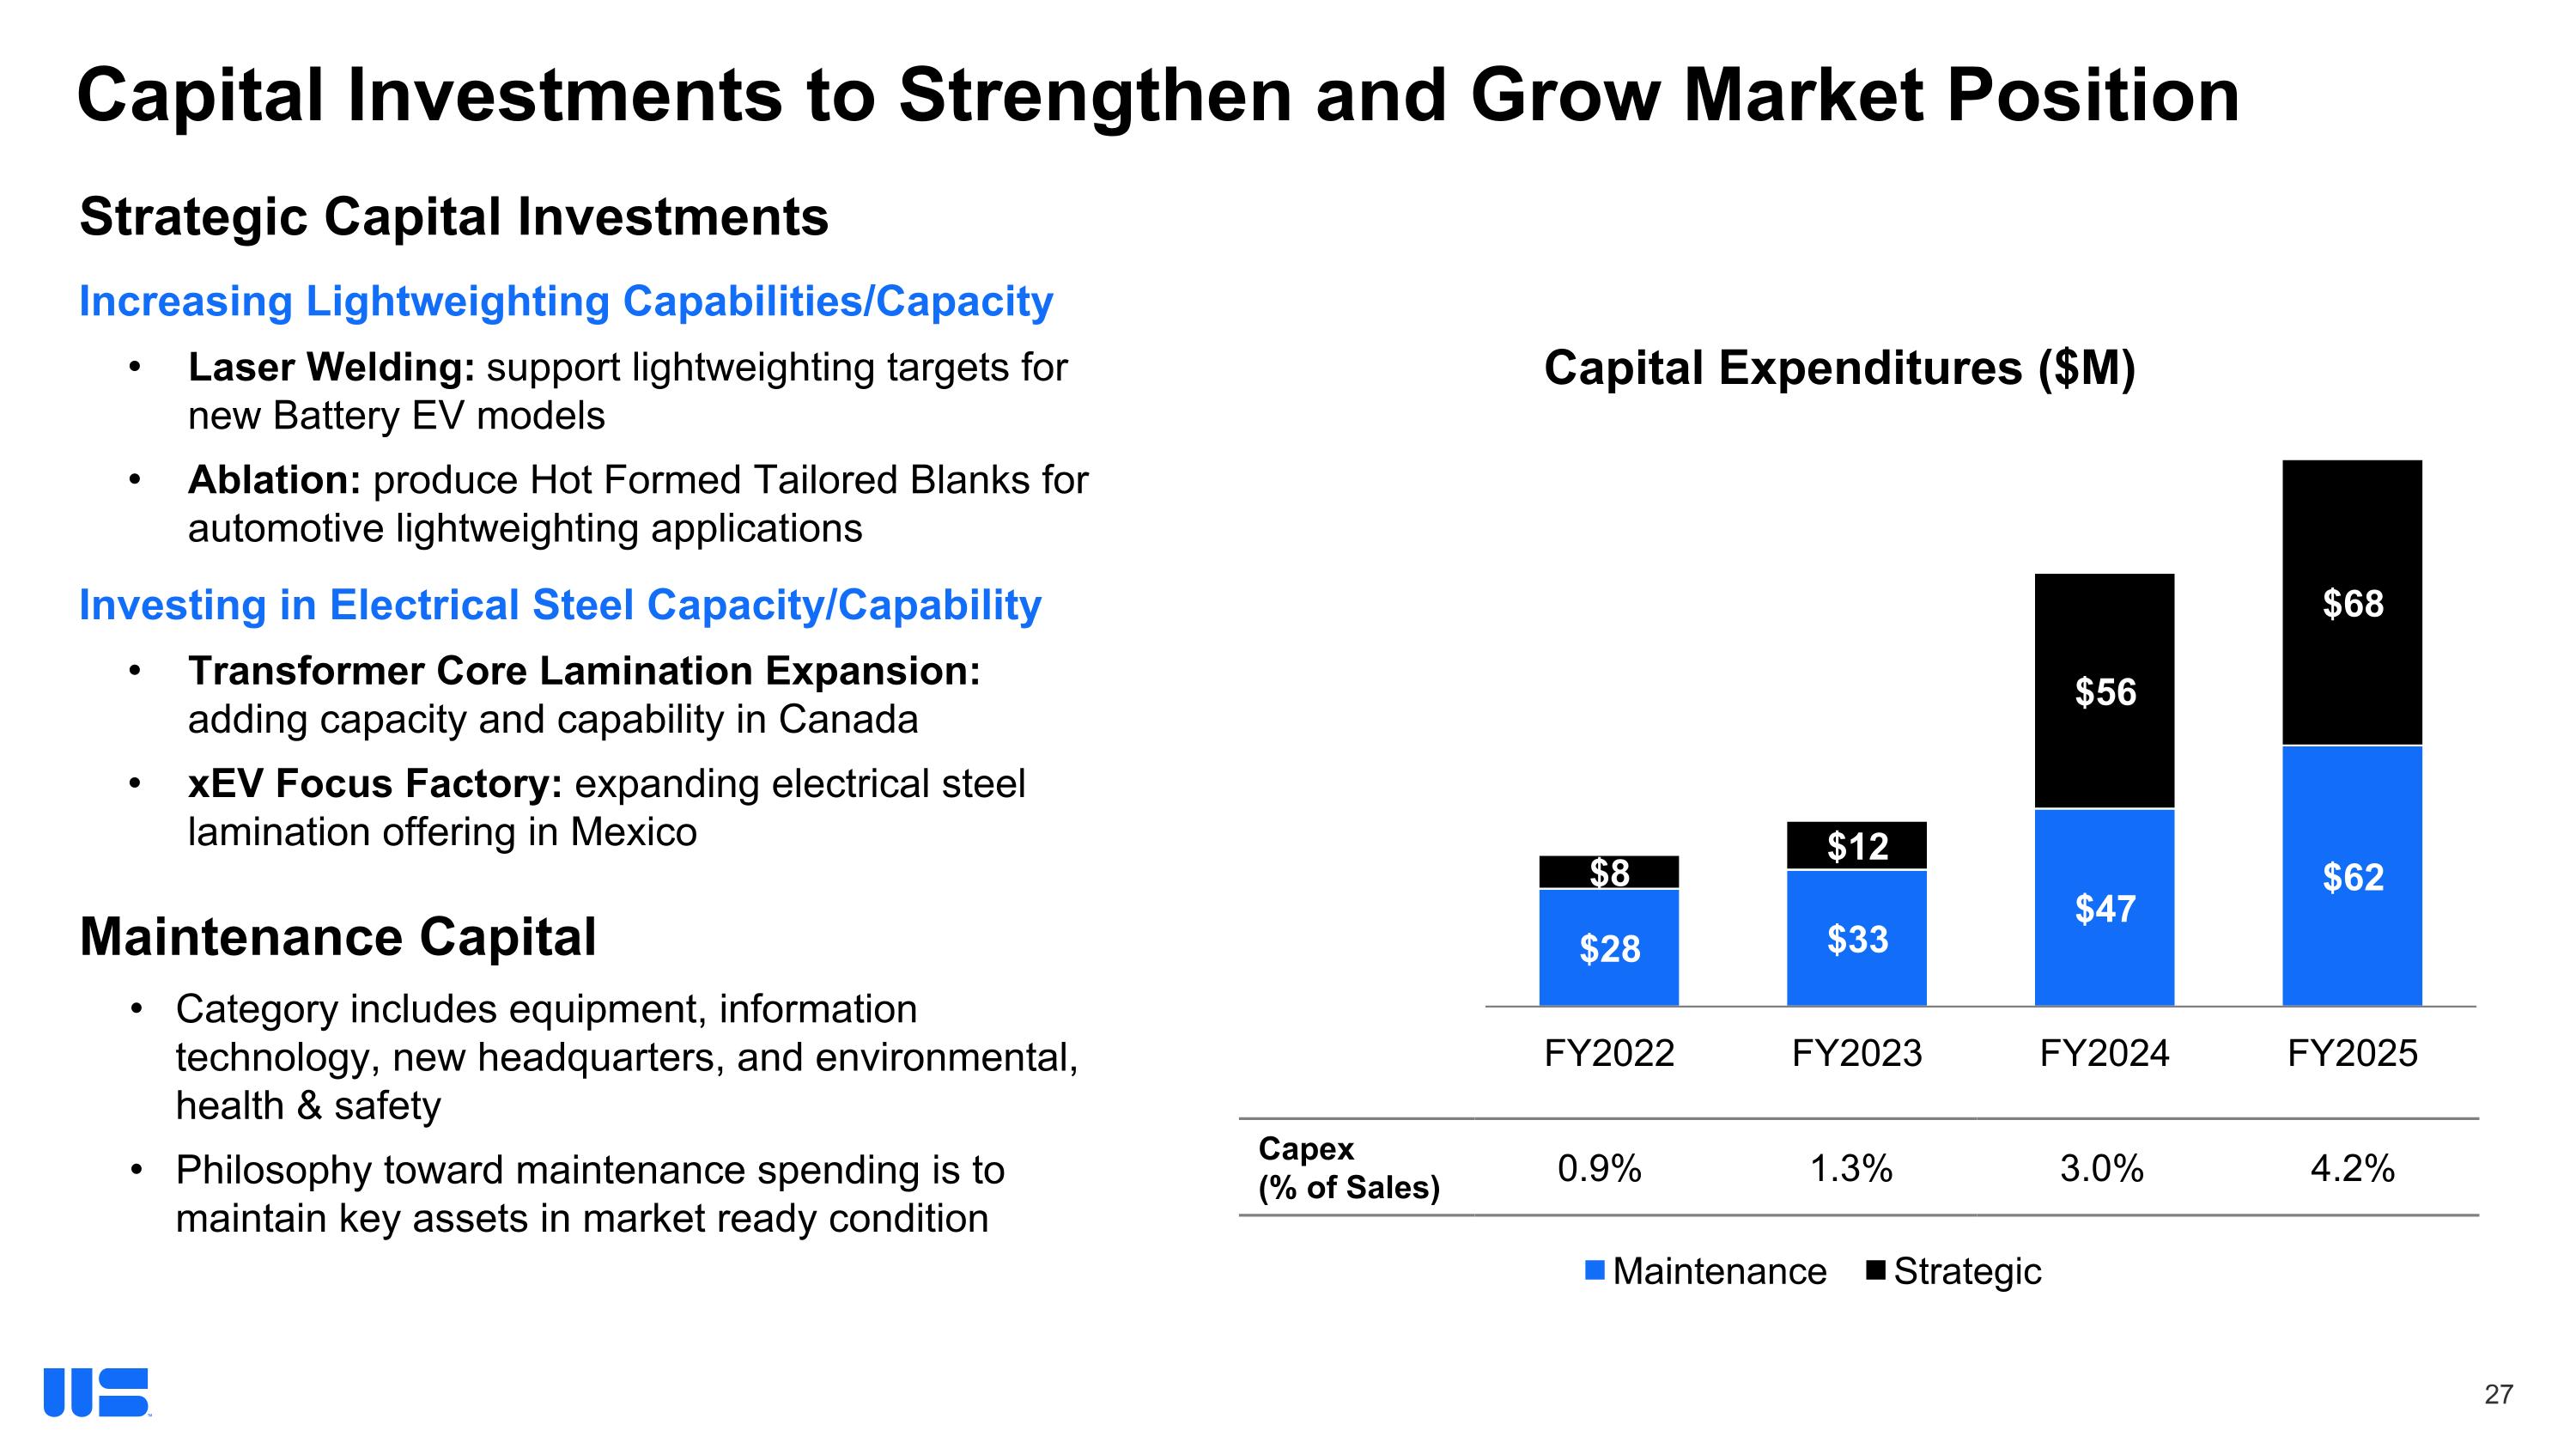

Slide 28

Capital Investments to Strengthen and Grow Market Position Capital Expenditures ($M) Capex (% of Sales) 0.9% 1.3% 3.0% 4.2% Strategic Capital Investments Increasing Lightweighting Capabilities/Capacity Laser Welding: support lightweighting targets for new Battery EV models Ablation: produce Hot Formed Tailored Blanks for automotive lightweighting applications Investing in Electrical Steel Capacity/Capability Transformer Core Lamination Expansion: adding capacity and capability in Canada xEV Focus Factory: expanding electrical steel lamination offering in Mexico Maintenance Capital Category includes equipment, information technology, new headquarters, and environmental, health & safety Philosophy toward maintenance spending is to maintain key assets in market ready condition
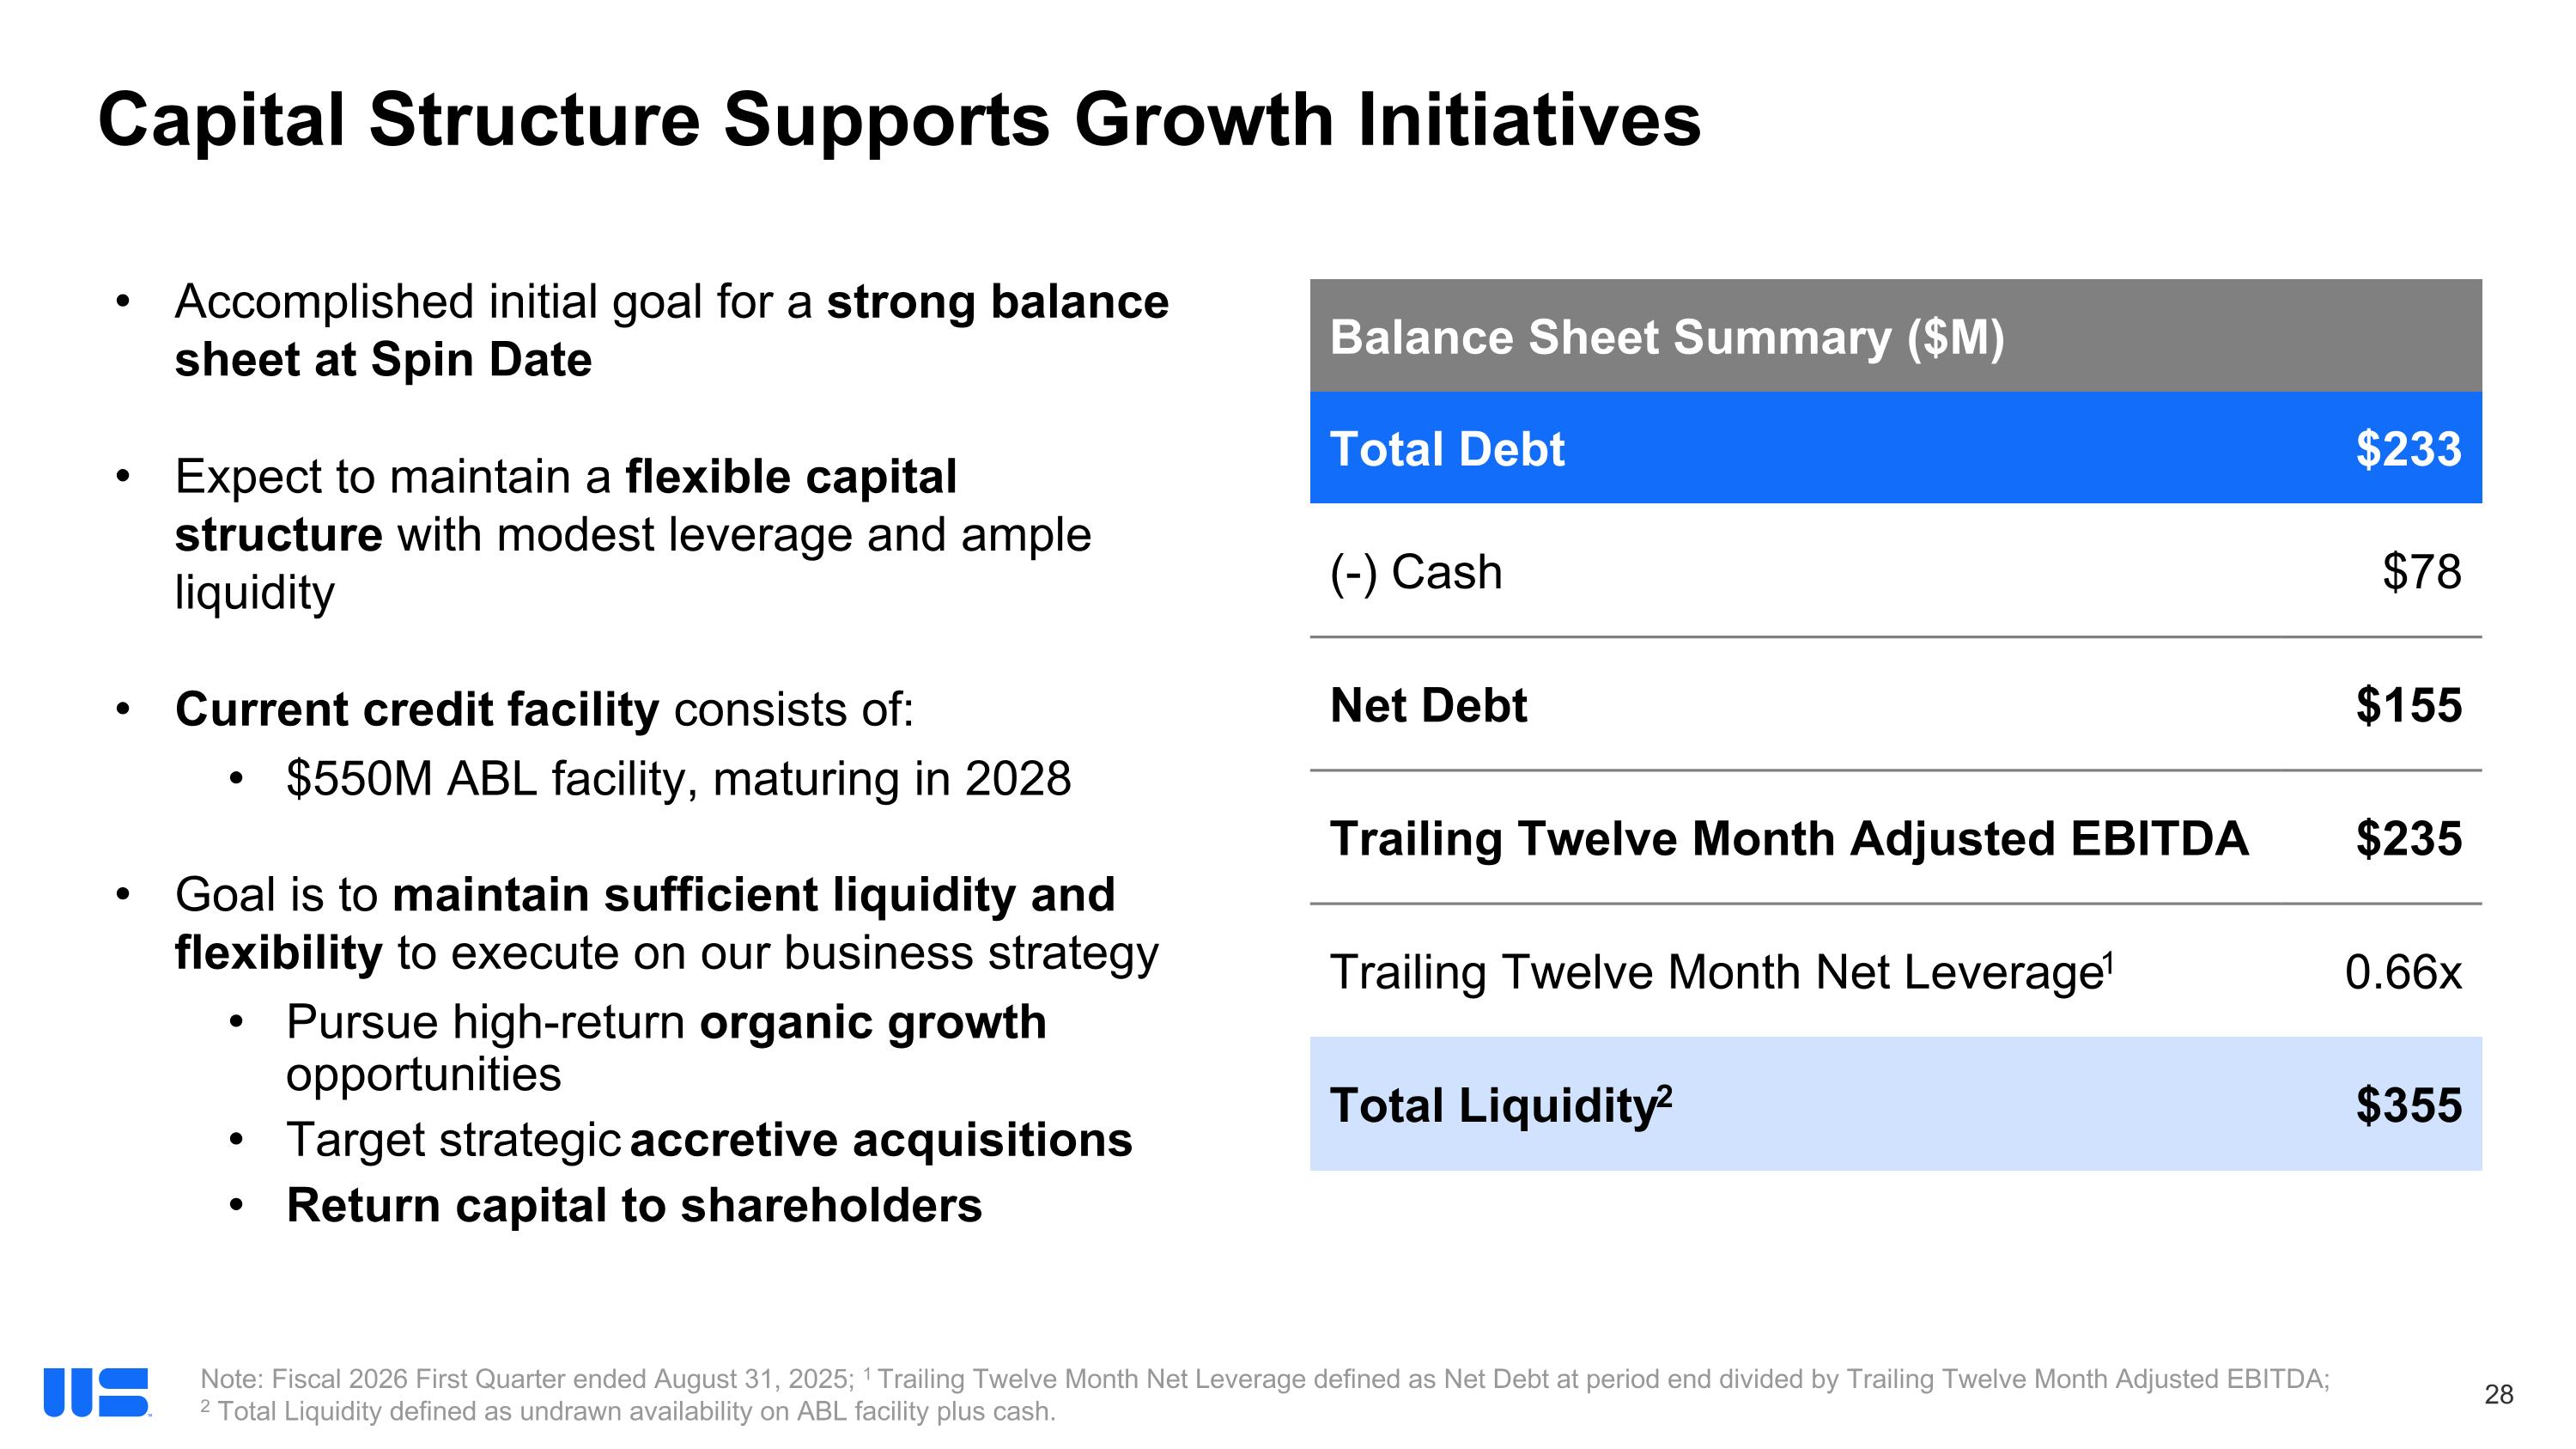

Slide 29

Capital Structure Supports Growth Initiatives Note: Fiscal 2026 First Quarter ended August 31, 2025; 1 Trailing Twelve Month Net Leverage defined as Net Debt at period end divided by Trailing Twelve Month Adjusted EBITDA; 2 Total Liquidity defined as undrawn availability on ABL facility plus cash. Balance Sheet Summary ($M) Total Debt $233 (-) Cash $78 Net Debt $155 Trailing Twelve Month Adjusted EBITDA $235 Trailing Twelve Month Net Leverage1 0.66x Total Liquidity2 $355 Accomplished initial goal for a strong balance sheet at Spin Date Expect to maintain a flexible capital structure with modest leverage and ample liquidity Current credit facility consists of: $550M ABL facility, maturing in 2028 Goal is to maintain sufficient liquidity and flexibility to execute on our business strategy Pursue high-return organic growth opportunities Target strategic accretive acquisitions Return capital to shareholders

Slide 30

How We Drive Shareholder Value


Slide 31

Disciplined Framework Designed to Drive Shareholder Value Organic Growth Strategic M&A Shareholder Return Maintain operations in market ready condition Grow capacity to meet electrical steel and lightweighting demand Pursue high IRR capacity additions Target acquisition opportunities that are expected to be immediately accretive to earnings Leverage track record and skill set to integrate bolt-on opportunities and realize synergies Focus on maximizing shareholder return Expect to pay a modest dividend Long-term intention to pursue opportunistic share buybacks …and Maintain Ample Liquidity and Financial Flexibility to Support Strategic Initiatives and Resiliency Through the Cycle
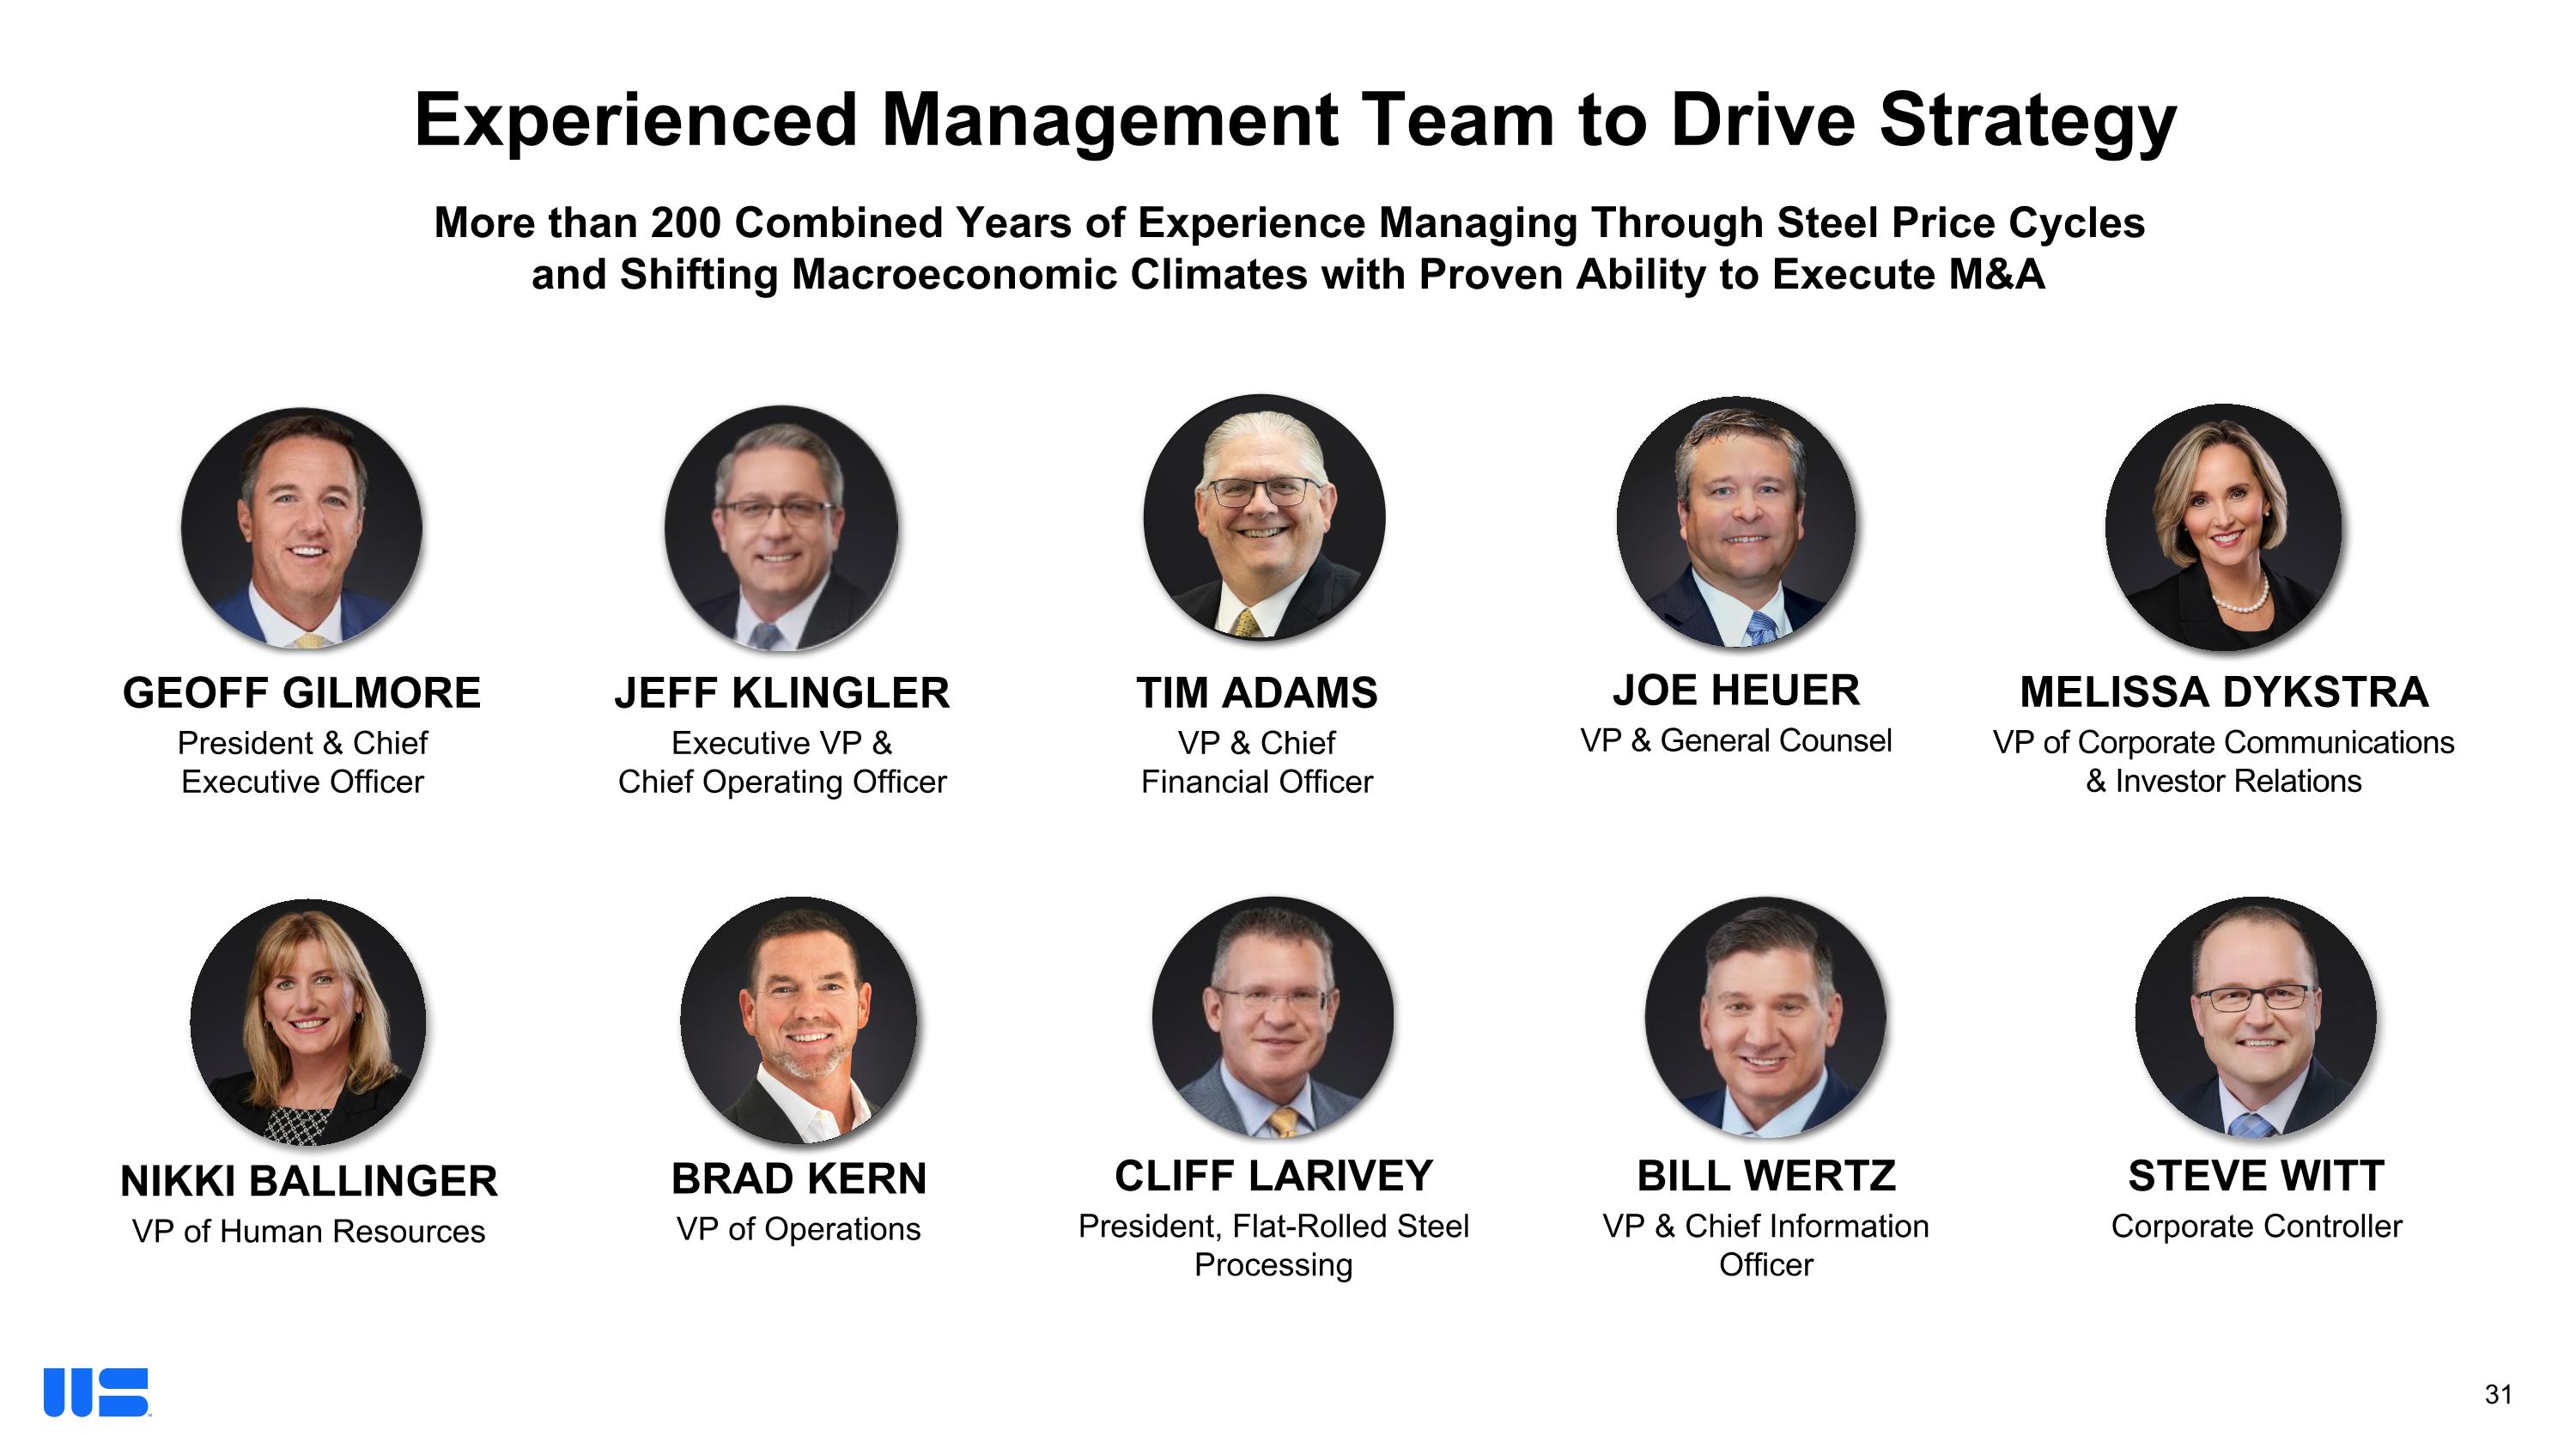

Slide 32

More than 200 Combined Years of Experience Managing Through Steel Price Cycles and Shifting Macroeconomic Climates with Proven Ability to Execute M&A Experienced Management Team to Drive Strategy CLIFF LARIVEY President, Flat-Rolled Steel Processing BILL WERTZ VP & Chief Information Officer GEOFF GILMORE President & Chief Executive Officer JEFF KLINGLER Executive VP & Chief Operating Officer TIM ADAMS VP & Chief Financial Officer JOE HEUER VP & General Counsel MELISSA DYKSTRA VP of Corporate Communications & Investor Relations BRAD KERN VP of Operations NIKKI BALLINGER VP of Human Resources STEVE WITT Corporate Controller

Slide 33

Investment Highlights 2. Long-standing customer relationships focused on value creation and best-in-class service delivery 1. Well-positioned to capitalize on opportunities from expected growth in electricity usage to support data center growth and vehicle electrification combined with the modernization and expansion of the electric grid 3. Strong balance sheet and ample liquidity to pursue attractive growth opportunities via strategic capital investments and/or value-enhancing acquisitions Experienced management team with a track record of delivering value and driving success through the Worthington Business System 4.

Slide 34

Appendix


Slide 35

Reconciliation of Non-GAAP Financial Measures These materials present certain financial measures that are not calculated in accordance with U.S. generally accepted accounting principles, or GAAP. Management believes these non-GAAP measures provide useful supplemental information on the performance of the Company’s ongoing operations and should not be considered as an alternative to the comparable GAAP measure. Additionally, management believes these non-GAAP measures allow for meaningful comparisons and analysis of trends in the Company’s business and enable investors to evaluate operations and future prospects in the same manner as management. A reconciliation of each non-GAAP measure to its most directly comparable GAAP measure is outlined below. The following provides an explanation of each non-GAAP measure presented in these materials: Adjusted EBITDA is defined as Adjusted Earnings Before Interest, Taxes, Depreciation and Amortization, and consists of EBITDA (calculated by adding or subtracting, as appropriate, interest expense, income tax expense and depreciation and amortization to/from net earnings attributable to Worthington Steel), which is further adjusted to exclude impairment and restructuring charges (gains) as well as other items that management believes are not reflective of, and thus should not be included when evaluating the performance of its ongoing operations. Separation costs - direct and incremental costs incurred in connection with the Separation from Worthington Enterprises, Inc. (the “Former Parent”), including audit, legal, and other fees paid to third-party advisors as well as direct and incremental costs associated with the separation of shared corporate functions which are not part of the Company’s ongoing operations. Tax indemnification adjustment -  tax and indemnification adjustments reported in income tax expense and miscellaneous income, net, related to an indemnification agreement with the former owners of Tempel. These adjustments are the result of a first quarter fiscal 2025 favorable tax ruling. The indemnification agreement, which was entered into with the former Tempel owners at the time the Company acquired Tempel, provides protection to the Company from rulings by tax authorities through the acquisition date. Pension settlement gain - pension lift-out transaction to transfer a portion of the total projected benefit obligation of the Tempel pension plan to a third-party insurance company, which resulted in a pre-tax non-cash gain reported in miscellaneous income, net, is excluded as it is not part of the Company’s ongoing operations. Gain on land sale - sale of unused land on the campus of the Tempel subsidiary in China, which resulted in a pre-tax gain in miscellaneous income, net, is excluded as it is not part of the Company’s ongoing operations. Gain on Sitem group purchase derivative - mark-to-market gain on the economic (non-designated) foreign currency exchange contract entered into related to the purchase price for Sitem Group, which resulted in a pre-tax gain in miscellaneous income, net, and is excluded as it is not part of the Company’s ongoing operations. Acquisition completion bonus payment - consists of the one-time bonus payment paid to key individuals upon the successful acquisition closing of Sitem Group. The acquisition completion bonus payment was included within SG&A expense. Adjusted EBITDA Margin is calculated by dividing Adjusted EBITDA by net sales. Free Cash Flow is defined as operating cash flows less capital expenditures. For additional information with respect to Worthington Steel, please refer to our most recent Form 10-K.



EXHIBIT 99.4


img241974156_0.jpg

Worthington Steel Declares Quarterly Dividend


09/24/2025


COLUMBUS, OHIO--(BUSINESS WIRE)-- The board of directors of Worthington Steel, Inc. (NYSE: WS) has declared a quarterly dividend of $0.16 per common share. The dividend is payable on December 26, 2025, to shareholders of record at the close of business on December 12, 2025.


Worthington Steel will host a conference call to discuss its fiscal 2026 first quarter results at 8:30 a.m. ET on Thursday, September 25, 2025. A live webcast of the call will be available on the Investor Relations section of the Company’s website at www.WorthingtonSteel.com and will be archived for one year.


Live Conference Call Schedule

Date:

Thursday, September 25, 2025

Start Time:

8:30 a.m. ET

Conference ID:

5714141

Toll-Free Dial-In Number:

888.510.2553


To automatically receive Worthington Steel financial news by email, please visit https://ir.worthingtonsteel.com and subscribe to email alerts.


About Worthington Steel


Worthington Steel (NYSE:WS) is a metals processor that partners with customers to deliver highly technical and customized solutions. Worthington Steel’s expertise in carbon flat-roll steel processing, electrical steel laminations and tailor welded solutions is driving steel toward a more sustainable future.

As one of the most trusted metals processors in North America, Worthington Steel and its approximately 6,000 employees harness the power of steel to advance our customers’ visions through value-added processing capabilities including galvanizing, pickling, configured blanking, specialty cold reduction, lightweighting and electrical lamination. Headquartered in Columbus, Ohio, Worthington Steel operates 37 facilities in seven states and 10 countries. Following a people-first Philosophy, commitment to sustainability and proven business system, Worthington Steel’s purpose is to generate positive returns by providing trusted and innovative solutions for customers, creating opportunities for employees and strengthening its communities.


Safe Harbor Statement


Worthington Steel wishes to take advantage of the safe harbor provisions included in the Private Securities Litigation Reform Act of 1995 (the “Act"). Statements by Worthington Steel which are not historical information constitute "forward looking statements" within the meaning of the Act. All forward-looking statements are subject to risks and uncertainties which could cause actual results to differ from those projected. Factors that could cause actual results to differ materially include risks, uncertainties and impacts described from time to time in Worthington Steel’s filings with the Securities and Exchange Commission.


###