wsbc-8k_20200427.htm
false
0000203596
0000203596
2020-04-27
2020-04-27
UNITED STATES
SECURITIES AND EXCHANGE COMMISSION
WASHINGTON, D.C. 20549
FORM 8-K
CURRENT REPORT
Pursuant to Section 13 or 15(d) of the Securities Exchange Act of 1934
Date of Report (Date of earliest event reported): April 27, 2020

Wesbanco, Inc.
(Exact name of Registrant as Specified in Its Charter)
|
West Virginia |
000-08467 |
55-0571723 |
|
(State or Other Jurisdiction
of Incorporation) |
(Commission File Number) |
(IRS Employer
Identification No.) |
|
|
|
|
|
1 Bank Plaza,
Wheeling, WV |
|
26003 |
|
(Address of Principal Executive Offices) |
|
(Zip Code) |
Registrant’s Telephone Number, Including Area Code: (304) 234-9000
Former Name or Former Address, if Changed Since Last Report: Not Applicable
Check the appropriate box below if the Form 8-K filing is intended to simultaneously satisfy the filing obligation of the registrant under any of the following provisions (see General Instructions A.2. below):
|
☐ |
Written communications pursuant to Rule 425 under the Securities Act (17 CFR 230.425) |
|
☐ |
Soliciting material pursuant to Rule 14a-12 under the Exchange Act (17 CFR 240.14a-12) |
|
☐ |
Pre-commencement communications pursuant to Rule 14d-2(b) under the Exchange Act (17 CFR 240.14d-2(b)) |
|
☐ |
Pre-commencement communications pursuant to Rule 13e-4(c) under the Exchange Act (17 CFR 240.13e-4(c)) |
Securities registered pursuant to Section 12(b) of the Act:
|
Title of each class |
|
Trading
Symbol |
|
Name of each exchange on which registered |
|
Common Stock $2.0833 Par Value |
|
WSBC |
|
NASDAQ Global Select Market |
Indicate by check mark whether the registrant is an emerging growth company as defined in Rule 405 of the Securities Act of 1933 (§ 230.405 of this chapter) or Rule 12b-2 of the Securities Exchange Act of 1934 (§ 240.12b-2 of this chapter).
Emerging growth company ☐
If an emerging growth company, indicate by check mark if the registrant has elected not to use the extended transition period for complying with any new or revised financial accounting standards provided pursuant to Section 13(a) of the Exchange Act. ☐
Item 2.02 Results of Operations and Financial Condition
Wesbanco, Inc. issued a press release today announcing earnings for the three months ended March 31, 2020. The press release is attached as Exhibit 99.1 to this report.
Wesbanco, Inc. will host a conference call to discuss the Company's financial results for the first quarter of 2020 on Tuesday, April 28, 2020 at 10:00 a.m. ET.
Interested parties can access the live webcast of the conference call through the Investor Relations section of the Company's website, www.wesbanco.com. Participants can also listen to the conference call by dialing 888-347-6607, 855-669-9657 for Canadian callers, or 412-902-4290 for international callers, and asking to be joined into the WesBanco call. Please log in or dial in at least 10 minutes prior to the start time to ensure a connection.
A replay of the conference call will be available by dialing 877-344-7529, 855-669-9658 for Canadian callers, or 412-317-0088 for international callers, and providing the access code of 10136709. The replay will begin at approximately 12:00 p.m. ET on April 28, and end at 12 a.m. ET on May 13. An archive of the webcast will be available for one year on the Investor Relations section of the Company’s website (www.wesbanco.com).
Item 8.01 Other Events
In light of recent developments relating to COVID-19, Wesbanco is supplementing its risk factors contained in Item 1A of its Annual Report on Form 10-K for the year ended December 31, 2019, as filed with the Securities and Exchange Commission on February 28, 2020 (“Annual Report”). The following risk factors should be read in conjunction with the risk factors contained in our Annual Report on Form 10-K. Any of the risks described in our Annual Report on Form 10-K, as well as any of the risks described below, could materially adversely affect our business, financial condition and results of operations. Additional risks and uncertainties that are not presently known to us or that we deem immaterial may also adversely impact our business or financial results. Moreover, the effects of the COVID-19 pandemic may heighten many of the other risk factors in our Annual Report and any subsequent Quarterly Report on Form 10-Q or Current Report on Form 8-K including, but not limited to, risks of credit deterioration, interest rate changes, rating agency actions, governmental actions, market volatility, theft, fraud, security breaches and technology interruptions. Except as set forth below, there are no material changes related to risk factors from the risk factors described in Item 1A of our Annual Report on Form 10-K for the year ended December 31, 2019.
THE COVID-19 PANDEMIC IS ADVERSELY AFFECTING THE OPERATIONS OF US AND OUR CUSTOMERS.
The spread of COVID-19 has created a global public-health crisis that has resulted in widespread volatility and deteriorations in household, business, economic, and market conditions. This pandemic has caused many state governments to enact “shelter in place” orders and the institution of social distancing requirements, which have adversely impacted the economy due to the vast restrictions and forced closures of non-essential businesses during the quarantine period. As a result, many of our customers have been adversely affected by business closures. Accordingly, COVID-19 may result in a significant decrease in our customer’ business and/or cause our customers to be unable to meet existing payment or other obligations to us. These adverse impacts on the businesses of our customers could cause a material adverse effect to our business, financial condition, and results of operations.
NEGATIVE ECONOMIC FACTORS MAY ADVERSELY AFFECT WESBANCO’S FINANCIAL PERFORMANCE.
Negative economic conditions in our markets may adversely affect Wesbanco’s financial performance. Current shelter-in-place orders in many of Wesbanco’s markets of West Virginia, Ohio, western Pennsylvania, Kentucky, southern Indiana and Maryland, will result in negative economic factors depending on the length of such government restrictions. Negative changes in economic and financial market conditions could result in additional deceases in market value of financial instruments, impairment of goodwill and intangible assets and decreases in interest income. A rise in unemployment from the forced closures of non-essential businesses, could have a negative impact on our customers’ ability to repay their loans as well as a decrease in the customer deposit base as they use their savings to pay current expenses. This could result in increased risk of delinquencies, defaults, foreclosures and losses on our loans, negatively impact regional economic conditions, result in a decline in local loan demand, loan originations and deposit availability. Any one or more of these developments could have a material adverse effect on our business, financial condition and results of operations.
Additionally, the COVID-19 pandemic has significantly affected the financial markets and has resulted in a number of Federal Reserve actions. Market interest rates have declined significantly. On March 3, 2020, the 10-year Treasury yield fell below 1.00% for the first
time, and the Federal Reserve reduced the target federal funds rate by 50 basis points to 1.00% to 1.25%. On March 15, 2020, the Federal Reserve further reduced the target federal funds rate by 100 basis points to 0.00% to 0.25% and announced a $700 billion quantitative easing program in response to the expected economic downturn caused by the COVID-19 pandemic. The Federal Reserve reduced the interest that it pays on excess reserves from 1.60% to 1.10% on March 3, 2020, and then to 0.10% on March 15, 2020. We expect that these reductions in interest rates, especially if prolonged, could adversely affect our net interest income and margins and our profitability.
MARKET VOLATILITY AND PROLONGED PERIODS OF ECONOMIC STRESS MAY AFFECT WESBANCO’S CAPITAL AND LIQUIDITY.
The COVID-19 pandemic has caused volatility in financial markets and could potentially cause prolonged periods of economic stress. This may result in decreased capital and liquidity. In addition to the potential affects from negative economic conditions noted above, Wesbanco instituted a program to help COVID-19 impacted customers. This program allows a 90 day deferral of loan principal and/or interest payments as long as the customer meets certain requirements. Depending on how many customers apply for this program, Wesbanco’s liquidity could be negatively impacted if a significant number of customers apply and are approved for the deferral of payments. In addition, if these deferrals are not effective in mitigating the effect of COVID-19 on our customers, it may adversely affect our business and results of operations more substantially over a longer period of time. If the economic situation deteriorates, federal and state regulators may also consider taking actions such as suspension of dividends and other capital distributions in order to conserve capital and retain capacity, any of which could adversely impact our business.
The extent to which the COVID-19 pandemic impacts our business, financial condition and results of operation, as well as our regulatory capital and liquidity ratios, will depend on future developments, which are highly uncertain and cannot be predicted, including the scope and duration of the pandemic and the efficacy of actions taken by governmental authorities and other third parties in response to the pandemic.
Item 9.01 Financial Statements and Exhibits
(d) Exhibits:
99.1 - Press release dated April 27, 2020 announcing earnings for the three months ended March 31, 2020.
99.2 – First quarter 2020 earnings conference call presentation.
104 - Cover Page Interactive Data File (embedded within the Inline XBRL document).
SIGNATURE
Pursuant to the requirements of the Securities Exchange Act of 1934, the registrant has duly caused this report to be signed on its behalf by the undersigned hereunto duly authorized.
|
|
|
|
Wesbanco, Inc. |
|
|
(Registrant) |
|
|
|
|
Date: April 27, 2020 |
/s/ Robert H. Young |
|
|
Robert H. Young |
|
|
Senior Executive Vice President and |
|
|
Chief Financial Officer |
|
|
|
|
|
|
Exhibit 99.1

WesBanco Announces First Quarter 2020 Financial Results
Wheeling, WV, April 27, 2020 – WesBanco, Inc. (“WesBanco”) (Nasdaq: WSBC), a diversified, multi-state bank holding company, today announced net income and related earnings per share for the three months ended March 31, 2020.
“While we are all experiencing unusual times, WesBanco is supporting its customers and its communities in many ways,” said Todd F. Clossin, President and Chief Executive Officer of WesBanco. “Early on, we committed $350,000 to fund various non-profit agencies, throughout our footprint, who were impacted by the coronavirus. Our employees also made the decision to cancel our company's 150th anniversary celebration activities and reallocate those funds to provide an additional $200,000 in support to those same charities. I am proud to say that the WesBanco team, as of April 24, 2020, has deferred loan payments on more than 2,800 customer loans to help our customers make ends meet and to help support their families and businesses cash flow needs. Our employees have also made more than 2,300 loans, totaling approximately $570 million, under the Small Business Administration's Paycheck Protection Program. We are fortunate to be in a strong position to provide support to others during this unprecedented time. Our thoughts are with essential service providers across all industries and with the many people and families suffering from this virus.”
Net income for the three months ended March 31, 2020 was $23.4 million, with diluted earnings per share of $0.35, compared to $40.3 million and $0.74 per diluted share, respectively, for the first quarter of 2019. Net income excluding after-tax merger-related expenses for the three months ended March 31, 2020, was $27.5 million, or $0.41 per diluted share, as compared to $42.8 million and $0.78 per diluted share, respectively, in the prior year quarter (non-GAAP measures).
|
|
|
For the Three Months Ended March 31, |
|
|
|
|
2020 |
|
|
2019 |
|
|
(unaudited, dollars in thousands,
except per share amounts) |
|
Net
Income |
|
|
Diluted
Earnings
Per Share |
|
|
Net
Income |
|
|
Diluted
Earnings
Per Share |
|
|
Net income (Non-GAAP)(1) |
|
$ |
27,476 |
|
|
$ |
0.41 |
|
|
$ |
42,791 |
|
|
$ |
0.78 |
|
|
Less: After tax merger-related expenses |
|
|
(4,080 |
) |
|
|
(0.06 |
) |
|
|
(2,454 |
) |
|
|
(0.04 |
) |
|
Net income (GAAP) |
|
$ |
23,396 |
|
|
$ |
0.35 |
|
|
$ |
40,337 |
|
|
$ |
0.74 |
|
|
(1) |
See non-GAAP financial measures for additional information relating to the calculation of these items. |
On November 22, 2019, WesBanco consummated the merger with Old Line Bancshares, Inc. (“OLBK”), a bank holding company headquartered in Bowie, MD with approximately $3.0 billion in assets, excluding goodwill. Financial results for OLBK have been included in WesBanco’s results from the merger consummation date.
Financial and operational highlights during the quarter ended March 31, 2020:
|
|
• |
Successfully completed signage and systems conversion of Old Line Bancshares in February |
|
|
o |
Anticipated 2020 cost saves are on track |
|
|
• |
Strong mortgage banking income, increasing 20.8% year-over-year |
|
|
• |
Organic loan growth was 2.0% year-over-year, driven by the C&I loan category |
|
|
o |
Sequential quarter total loan growth, which includes our Mid-Atlantic franchise, was 3.2% annualized |
|
|
o |
When excluding the sale of certain OLBK commercial loans, sequential quarter total loan growth would have been 5.6% annualized |
|
|
• |
Organic deposit growth, excluding certificates of deposit, was 0.7% year-over-year, driven by demand deposit growth |
|
|
o |
Sequential quarter deposit growth, excluding certificates of deposit, was 7.0% annualized |
|
|
• |
Key credit quality metrics such as non-performing assets, past due loans, criticized & classified loans, and net loan charge-offs, as percentages of total portfolio loans, remained at low levels and favorable to peer bank averages, those with total assets between $10 billion and $25 billion |
|
|
• |
Adopted the new Current Expected Credit Losses (“CECL”) accounting standard. Deterioration in the macroeconomic forecast drove the increases in allowance for credit losses and provision for credit losses on both a year-over-year and quarter-over-quarter basis |
|
|
• |
WesBanco remains a well-capitalized financial institution with solid liquidity and strong credit quality |
Mr. Clossin added, “For 150 years, we have been a source of stability, strength, and trust for all of our communities. While no one anticipated the current operating environment, we believe we positioned the company well as we had proactively taken risk out of our loan portfolios during the last few years, developed appropriate long-term strategies to allow us to succeed regardless of the operating environment, and implemented initiatives during the early stages of the pandemic to help our customers, communities, and employees. As we all work together in this current environment, we believe our sound credit and risk culture, combined with our community-first focus, will help us, our customers, and our communities to navigate these extraordinary times.”
COVID-19 Responses
As a responsible, community-based financial institution, we believe it is our duty to assist and help protect our communities, customers, and employees. Thus, on March 18th, we were one of the first banks to launch a number of initiatives and precautionary measures intended to mitigate the impact of the COVID-19 virus outbreak by offering payment relief to affected borrowers through loan modifications, payment deferrals, and working capital facilities; adjusting branch operations to help protect the health and safety of our customers and employees while maintaining access to our services; and supporting local non-profit organizations through our grant programs. Through April 24, we have assisted our residential mortgage customers with 532 loan modifications totaling $137 million, our consumer and home equity loan customers with 712 loan modifications totaling $28 million, and our commercial and business customers with more than 1,600 loan modifications totaling $1.8 billion, including most customers in our hotel loan portfolio. In addition, we have been an active participant in the Small Business Administration’s Paycheck Protection Program, as established by the CARES Act.
Balance Sheet
Portfolio loans of $10.3 billion as of March 31, 2020 increased 35.0% when compared to the prior year period due to the OLBK acquisition. Total organic loan growth was 2.0% year-over-year, driven by the C&I and residential real estate loan categories, which were partially offset by elevated levels of commercial real estate loans going to the secondary market. Total deposits increased 23.9% year-over-year to $11.0 billion due primarily to the OLBK acquisition. Total deposits, excluding the OLBK acquisition, decreased $291.9 million, or 3.3%, year-over-year due to a $346.0 million reduction in certificates of deposit, as higher cost CDs were allowed to runoff. When excluding the impact of CD runoff, total deposit organic growth was 0.7% year-over-year driven by growth in demand deposits.
Credit Quality
Overall, we believe our credit quality ratios remained strong as we balanced disciplined loan origination in the current environment with prudent lending standards. As of March 31, 2020, both non-performing loans and non-performing assets as percentages of the portfolio and total assets have remained relatively low and consistent throughout the last five quarters. Criticized and classified loan balances decreased to 2.09% of total portfolio loans, as compared to 2.24% and 2.17% during the third and fourth quarters of 2019, respectively. Reflecting the implementation of CECL during the first quarter of 2020, the provision for credit losses increased to $29.8 million and the allowance for loan losses increased to $114.3 million.
WesBanco adopted CECL on January 1, 2020, resulting in an initial adjustment to retained earnings of $26.6 million, and a corresponding increase in the allowance for credit losses specific to loans of $38.4 million, representing an allowance to total loans coverage ratio of 0.88%, or $90.8 million, upon adoption, compared to 0.51%, or $52.4 million, at December 31, 2019 under the incurred method. The allowance for credit losses specific to loans at March 31, 2020 was $114.3 million, or 1.10% of total loans. Excluded from the allowance for credit losses and related coverage ratio are fair market value adjustments on previously acquired loans representing 0.49% of total loans. The increase in the allowance and related provision for credit losses was related to the significant deterioration in the macroeconomic forecast in late-March, primarily driven by the negative forecasted economic impacts of COVID-19. The forecast, based upon nationally-recognized published economic data through March 31, 2020, is primarily driven by national unemployment and interest rate spreads. Other factors such as prepayment speeds, loan risk grades, portfolio mix, industry and property type concentrations, loan growth by class, and various other qualitative factors that are both mathematically and judgmentally determined also impact the CECL model’s calculated results .
Net Interest Margin and Income
The net interest margin of 3.54% for the first quarter of 2020 decreased 14 basis points year-over-year and 1 basis point from the fourth quarter of 2019. Year-over-year, the net interest margin decreased primarily due to the lower interest rate environment from the five decreases in the Federal Reserve Board’s target federal funds rate, totaling 225 basis points, from July 2019 through March 2020, as well as a flattening of the yield curve. Reflecting the significantly lower interest rate environment, we aggressively reduced our deposit rates during the second half of March, which helped to lower deposit funding costs 10 basis points year-over-year to 55 basis points for the first quarter of 2020. In addition, we shortened the maturities and experienced lower rates, in our first quarter FHLB borrowings as compared to the prior year which helped to lower the cost of borrowings 19 basis points year-over-year. Lastly, accretion from acquisitions benefited the first quarter net interest margin by 22 basis points, as compared to 19 basis points in the prior year period and 22 basis points during the fourth quarter of 2019.
Net interest income increased $21.8 million, or 22.2%, during the first quarter of 2020, as compared to the same quarter of 2019, due to a 26.0% increase in average total earning assets, primarily driven by the OLBK acquisition and related accretion from purchase
accounting, partially offset by the lower loan yields, reflecting repricing of existing loans and lower new offered rates in the current market environment.
Non-Interest Income
For the first quarter of 2020, non-interest income of $28.0 million increased $0.2 million, or 0.8%, from the first quarter of 2019, driven by organic growth and the OLBK acquisition, which was partially offset by the limitation on interchange fees for debit card processing that resulted from the Durbin amendment in the 2010 Dodd-Frank Wall Street Reform and Consumer Protection Act (“Dodd-Frank Act”), which took effect for WesBanco during the third quarter of 2019. Net securities gains increased $0.8 million, or 126.9%, due to the sale of approximately $218 million of securities in March 2020 in order to take advantage of market conditions at the time and create additional liquidity for potential COVID-19 related needs, such as meeting demand for increased draws on commercial and home equity lines of credit. Such gains were partially offset by a negative $1.3 million market adjustment in the deferred compensation plan, which had an offsetting reduction in employee benefits expense. Other income increased $0.6 million, or 19.2%, primarily due to debit card sponsorship fees inherited from the OLBK acquisition. Electronic banking fees decreased $1.6 million as compared to the prior year period reflecting an approximate $2.7 million impact from the limitation on interchange fees for debit card processing, partially offset by higher point-of-sale and ATM transactions by both legacy WesBanco and our new OLBK customers. Fair value adjustments on loans held for sale and derivatives negatively impacted mortgage banking income, despite higher volumes, and loan swap fee income, accounted for in other income.
Non-Interest Expense
We believe that total operating expenses continued to be well-controlled during the three-month period ending March 31, 2020, as demonstrated by an efficiency ratio of 57.69%. Excluding merger-related expenses, non-interest expense for the three months ended March 31, 2019 increased $14.8 million, or 20.8%, to $86.2 million compared to the prior year period, primarily reflecting the OLBK acquisition. As previously disclosed, the anticipated cost savings associated with the OLBK acquisition began to be realized later in the first quarter, primarily reflecting the planned staff reductions after the February 21, 2020 signage and systems conversions. This year-over-year increase is primarily due to higher salaries and wages, employee benefits, net occupancy, equipment, and other operating costs associated with additional staffing and financial center locations from the OLBK acquisition. In addition, salaries and wages reflect the mid-2019 annual salary increases. Employee benefits were positively impacted by the $1.3 million reduction in the deferred compensation plan obligations due to market declines and lower pension expense. Lastly, FDIC insurance expense increased $0.8 million, or 56.2%, due to a higher assessment rate associated with our larger asset level.
Capital
WesBanco continues to maintain what we believe are strong regulatory capital ratios as both consolidated and bank-level regulatory capital ratios are well above the applicable “well-capitalized” standards promulgated by bank regulators and the BASEL III capital standards. At March 31, 2020, Tier I leverage was 9.64%, Tier I risk-based capital was 12.51%, total risk-based capital was 14.83%, and the common equity Tier 1 capital ratio (“CET 1”) was 12.51%. As compared to the prior year period, Tier 1 leverage and Tier 1 risk-based capital ratios were adversely impacted by the movement of $136.5 million of trust preferred securities (TruPS), during the fourth quarter of 2019, from Tier 1 to Tier 2 risk-based capital, as required by the Dodd-Frank Act for financial institutions with total assets greater than $15 billion. Tangible common equity increased to 9.65% at period-end from 9.57% as of March 31, 2019, as an increase in other comprehensive income from the mark-to-market of the available-for-sale portion of the investment portfolio benefited this ratio, as well as increased retained earnings. WesBanco has elected to defer the CECL impact on capital ratios two years and then transition the adjustment over the three-year period allowed for by the federal joint regulatory agencies. The impact on regulatory capital ratios approximated 30 basis points for this adjustment for three of the four regulatory ratios, while total risk-based capital would be slightly higher without the transition.
During the first quarter of 2020, WesBanco repurchased 786,012 shares of its outstanding common stock on the open market at a total cost of $25.0 million, or $31.77 per share, before suspending its share buyback program in early-March, in an abundance of caution related to the growing COVID-19 pandemic. As of March 31, 2020, approximately 1.7 million shares remained under the previously announced plan.
Conference Call and Webcast
WesBanco will host a conference call to discuss the Company's financial results for the first quarter of 2020 at 10:00 a.m. ET on Tuesday, April 28, 2020. Interested parties can access the live webcast of the conference call through the Investor Relations section of the Company's website, www.wesbanco.com. Participants can also listen to the conference call by dialing 888-347-6607, 855-669-9657 for Canadian callers, or 412-902-4290 for international callers, and asking to be joined into the WesBanco call. Please log in or dial in at least 10 minutes prior to the start time to ensure a connection.
A replay of the conference call will be available by dialing 877-344-7529, 855-669-9658 for Canadian callers, or 412-317-0088 for international callers, and providing the access code of 10136709. The replay will begin at approximately 12:00 p.m. ET on April 28, and end at 12 a.m. ET on May 13. An archive of the webcast will be available for one year on the Investor Relations section of the Company’s website (www.wesbanco.com).
Forward-Looking Statements
Forward-looking statements in this report relating to WesBanco’s plans, strategies, objectives, expectations, intentions and adequacy of resources, are made pursuant to the safe harbor provisions of the Private Securities Litigation Reform Act of 1995. The information contained in this report should be read in conjunction with WesBanco’s Form 10-K for the year ended December 31, 2019 and documents subsequently filed by WesBanco with the Securities and Exchange Commission (“SEC), which are available at the SEC’s website, www.sec.gov or at WesBanco’s website, www.WesBanco.com. Investors are cautioned that forward-looking statements, which are not historical fact, involve risks and uncertainties, including those detailed in WesBanco’s most recent Annual Report on Form 10-K filed with the SEC under “Risk Factors” in Part I, Item 1A. Such statements are subject to important factors that could cause actual results to differ materially from those contemplated by such statements, including, without limitation, the effects of changing regional and national economic conditions including the effects of the COVID-19 pandemic; changes in interest rates, spreads on earning assets and interest-bearing liabilities, and associated interest rate sensitivity; sources of liquidity available to WesBanco and its related subsidiary operations; potential future credit losses and the credit risk of commercial, real estate, and consumer loan customers and their borrowing activities; actions of the Federal Reserve Board, the Federal Deposit Insurance Corporation, the SEC, the Financial Institution Regulatory Authority, the Municipal Securities Rulemaking Board, the Securities Investors Protection Corporation, and other regulatory bodies; potential legislative and federal and state regulatory actions and reform, including, without limitation, the impact of the implementation of the Dodd-Frank Act; adverse decisions of federal and state courts; fraud, scams and schemes of third parties; cyber-security breaches; competitive conditions in the financial services industry; rapidly changing technology affecting financial services; marketability of debt instruments and corresponding impact on fair value adjustments; and/or other external developments materially impacting WesBanco’s operational and financial performance. WesBanco does not assume any duty to update forward-looking statements.
About WesBanco, Inc.
Founded in 1870, WesBanco, Inc. (www.wesbanco.com) is a diversified and balanced financial services company that delivers large bank capabilities with a community bank feel. Our distinct long-term growth strategies are built upon unique sustainable advantages permitting us to span six states with meaningful market share. Built upon our ‘Better Banking Pledge’, our customer-centric service culture is focused on growing long-term relationships by pledging to serve all personal and business customer needs efficiently and effectively. In addition to a full range of online and mobile banking options and a full-suite of commercial products and services, WesBanco provides trust, wealth management, securities brokerage, and private banking services through our century-old Trust and Investment Services department, with approximately $4.1 billion of assets under management (as of March 31, 2020). WesBanco's banking subsidiary, WesBanco Bank, Inc., operates 236 financial centers in the states of Indiana, Kentucky, Maryland, Ohio, Pennsylvania, and West Virginia. Additionally, WesBanco operates an insurance agency, WesBanco Insurance Services, Inc., and a full service broker/dealer, WesBanco Securities, Inc.
SOURCE: WesBanco, Inc.
WesBanco Company Contact:
John H. Iannone
Senior Vice President, Investor and Public Relations
304-905-70
|
WESBANCO, INC. |
|
|
Consolidated Selected Financial Highlights |
|
|
(unaudited, dollars in thousands, except shares and per share amounts) |
|
|
|
|
For the Three Months Ended |
|
|
STATEMENT OF INCOME |
|
March 31, |
|
|
|
|
2020 |
|
|
2019 |
|
|
% Change |
|
|
Interest and dividend income |
|
|
|
|
|
|
|
|
|
|
|
|
|
Loans, including fees |
|
$ |
119,503 |
|
|
$ |
95,502 |
|
|
|
25.1 |
|
|
Interest and dividends on securities: |
|
|
|
|
|
|
|
|
|
|
|
|
|
Taxable |
|
|
16,986 |
|
|
|
16,733 |
|
|
|
1.5 |
|
|
Tax-exempt |
|
|
4,456 |
|
|
|
5,541 |
|
|
|
(19.6 |
) |
|
Total interest and dividends on securities |
|
|
21,442 |
|
|
|
22,274 |
|
|
|
(3.7 |
) |
|
Other interest income |
|
|
1,503 |
|
|
|
1,277 |
|
|
|
17.7 |
|
|
Total interest and dividend income |
|
|
142,448 |
|
|
|
119,053 |
|
|
|
19.7 |
|
|
Interest expense |
|
|
|
|
|
|
|
|
|
|
|
|
|
Interest bearing demand deposits |
|
|
3,394 |
|
|
|
3,946 |
|
|
|
(14.0 |
) |
|
Money market deposits |
|
|
2,352 |
|
|
|
1,899 |
|
|
|
23.9 |
|
|
Savings deposits |
|
|
923 |
|
|
|
522 |
|
|
|
76.8 |
|
|
Certificates of deposit |
|
|
4,054 |
|
|
|
3,903 |
|
|
|
3.9 |
|
|
Total interest expense on deposits |
|
|
10,723 |
|
|
|
10,270 |
|
|
|
4.4 |
|
|
Federal Home Loan Bank borrowings |
|
|
8,232 |
|
|
|
6,337 |
|
|
|
29.9 |
|
|
Other short-term borrowings |
|
|
870 |
|
|
|
1,556 |
|
|
|
(44.1 |
) |
|
Subordinated debt and junior subordinated debt |
|
|
2,461 |
|
|
|
2,529 |
|
|
|
(2.7 |
) |
|
Total interest expense |
|
|
22,286 |
|
|
|
20,692 |
|
|
|
7.7 |
|
|
Net interest income |
|
|
120,162 |
|
|
|
98,361 |
|
|
|
22.2 |
|
|
Provision for credit losses |
|
|
29,821 |
|
|
|
2,507 |
|
|
|
1,089.5 |
|
|
Net interest income after provision for credit losses |
|
|
90,341 |
|
|
|
95,854 |
|
|
|
(5.8 |
) |
|
Non-interest income |
|
|
|
|
|
|
|
|
|
|
|
|
|
Trust fees |
|
|
6,952 |
|
|
|
7,115 |
|
|
|
(2.3 |
) |
|
Service charges on deposits |
|
|
6,617 |
|
|
|
6,549 |
|
|
|
1.0 |
|
|
Electronic banking fees |
|
|
4,254 |
|
|
|
5,892 |
|
|
|
(27.8 |
) |
|
Net securities brokerage revenue |
|
|
1,679 |
|
|
|
1,860 |
|
|
|
(9.7 |
) |
|
Bank-owned life insurance |
|
|
1,769 |
|
|
|
1,319 |
|
|
|
34.1 |
|
|
Mortgage banking income |
|
|
1,276 |
|
|
|
1,056 |
|
|
|
20.8 |
|
|
Net securities gains |
|
|
1,491 |
|
|
|
657 |
|
|
|
126.9 |
|
|
Net gain on other real estate owned and other assets |
|
|
169 |
|
|
|
136 |
|
|
|
24.3 |
|
|
Other income |
|
|
3,802 |
|
|
|
3,189 |
|
|
|
19.2 |
|
|
Total non-interest income |
|
|
28,009 |
|
|
|
27,773 |
|
|
|
0.8 |
|
|
Non-interest expense |
|
|
|
|
|
|
|
|
|
|
|
|
|
Salaries and wages |
|
|
38,910 |
|
|
|
30,940 |
|
|
|
25.8 |
|
|
Employee benefits |
|
|
10,373 |
|
|
|
9,989 |
|
|
|
3.8 |
|
|
Net occupancy |
|
|
7,084 |
|
|
|
5,566 |
|
|
|
27.3 |
|
|
Equipment |
|
|
6,039 |
|
|
|
4,833 |
|
|
|
25.0 |
|
|
Marketing |
|
|
1,138 |
|
|
|
1,243 |
|
|
|
(8.4 |
) |
|
FDIC insurance |
|
|
2,113 |
|
|
|
1,353 |
|
|
|
56.2 |
|
|
Amortization of intangible assets |
|
|
3,374 |
|
|
|
2,514 |
|
|
|
34.2 |
|
|
Restructuring and merger-related expense |
|
|
5,164 |
|
|
|
3,107 |
|
|
|
66.2 |
|
|
Other operating expenses |
|
|
17,138 |
|
|
|
14,887 |
|
|
|
15.1 |
|
|
Total non-interest expense |
|
|
91,333 |
|
|
|
74,432 |
|
|
|
22.7 |
|
|
Income before provision for income taxes |
|
|
27,017 |
|
|
|
49,195 |
|
|
|
(45.1 |
) |
|
Provision for income taxes |
|
|
3,621 |
|
|
|
8,858 |
|
|
|
(59.1 |
) |
|
Net Income |
|
$ |
23,396 |
|
|
$ |
40,337 |
|
|
|
(42.0 |
) |
|
|
|
|
|
|
|
|
|
|
|
|
|
|
|
Taxable equivalent net interest income |
|
$ |
121,346 |
|
|
$ |
99,834 |
|
|
|
21.5 |
|
|
|
|
|
|
|
|
|
|
|
|
|
|
|
|
Per common share data |
|
|
|
|
|
|
|
|
|
|
|
|
|
Net income per common share - basic |
|
$ |
0.35 |
|
|
$ |
0.74 |
|
|
|
(52.7 |
) |
|
Net income per common share - diluted |
|
|
0.35 |
|
|
|
0.74 |
|
|
|
(52.7 |
) |
|
Net income per common share - diluted, excluding certain items (1)(2) |
|
|
0.41 |
|
|
|
0.78 |
|
|
|
(47.4 |
) |
|
Dividends declared |
|
|
0.32 |
|
|
|
0.31 |
|
|
|
3.2 |
|
|
Book value (period end) |
|
|
38.56 |
|
|
|
37.05 |
|
|
|
4.1 |
|
|
Tangible book value (period end) (1) |
|
|
21.36 |
|
|
|
20.49 |
|
|
|
4.2 |
|
|
Average common shares outstanding - basic |
|
|
67,486,550 |
|
|
|
54,598,499 |
|
|
|
23.6 |
|
|
Average common shares outstanding - diluted |
|
|
67,587,446 |
|
|
|
54,706,337 |
|
|
|
23.5 |
|
|
Period end common shares outstanding |
|
|
67,058,155 |
|
|
|
54,599,127 |
|
|
|
22.8 |
|
(1) See non-GAAP financial measures for additional information relating to the calculation of this item.
(2) Certain items excluded from the calculation consist of after-tax merger-related expenses.
|
WESBANCO, INC. |
|
|
Consolidated Selected Financial Highlights |
|
|
(unaudited, dollars in thousands) |
|
Selected ratios
|
|
|
For the Three Months Ended |
|
|
|
|
|
March 31, |
|
|
|
|
|
2020 |
|
|
2019 |
|
|
% Change |
|
|
|
Return on average assets |
|
|
0.60 |
|
% |
|
1.31 |
|
% |
|
(54.20 |
) |
% |
|
Return on average assets, excluding |
|
|
|
|
|
|
|
|
|
|
|
|
|
|
after-tax merger-related expenses (1) |
|
|
0.70 |
|
|
|
1.39 |
|
|
|
(49.64 |
) |
|
|
Return on average equity |
|
|
3.63 |
|
|
|
8.17 |
|
|
|
(55.57 |
) |
|
|
Return on average equity, excluding |
|
|
|
|
|
|
|
|
|
|
|
|
|
|
after-tax merger-related expenses (1) |
|
|
4.26 |
|
|
|
8.67 |
|
|
|
(50.87 |
) |
|
|
Return on average tangible equity (1) |
|
|
7.07 |
|
|
|
15.65 |
|
|
|
(54.82 |
) |
|
|
Return on average tangible equity, excluding |
|
|
|
|
|
|
|
|
|
|
|
|
|
|
after-tax merger-related expenses (1) |
|
|
8.18 |
|
|
|
16.56 |
|
|
|
(50.60 |
) |
|
|
Yield on earning assets (2) |
|
|
4.19 |
|
|
|
4.45 |
|
|
|
(5.84 |
) |
|
|
Cost of interest bearing liabilities |
|
|
0.91 |
|
|
|
1.06 |
|
|
|
(14.15 |
) |
|
|
Net interest spread (2) |
|
|
3.28 |
|
|
|
3.39 |
|
|
|
(3.24 |
) |
|
|
Net interest margin (2) |
|
|
3.54 |
|
|
|
3.68 |
|
|
|
(3.80 |
) |
|
|
Efficiency (1) (2) |
|
|
57.69 |
|
|
|
55.89 |
|
|
|
3.22 |
|
|
|
Average loans to average deposits |
|
|
94.61 |
|
|
|
87.01 |
|
|
|
8.73 |
|
|
|
Annualized net loan charge-offs/average loans |
|
|
0.18 |
|
|
|
0.07 |
|
|
|
157.14 |
|
|
|
Effective income tax rate |
|
|
13.40 |
|
|
|
18.01 |
|
|
|
(25.60 |
) |
|
|
|
|
For the Quarter Ended |
|
|
|
|
|
Mar. 31, |
|
|
Dec. 31, |
|
|
Sept. 30, |
|
|
June 30, |
|
|
Mar. 31, |
|
|
|
|
|
2020 |
|
|
2019 |
|
|
2019 |
|
|
2019 |
|
|
2019 |
|
|
|
Return on average assets |
|
|
0.60 |
|
% |
|
1.04 |
|
% |
|
1.19 |
|
% |
|
1.44 |
|
% |
|
1.31 |
|
% |
|
Return on average assets, excluding |
|
|
|
|
|
|
|
|
|
|
|
|
|
|
|
|
|
|
|
|
|
|
after-tax merger-related expenses (1) |
|
|
0.70 |
|
|
|
1.30 |
|
|
|
1.23 |
|
|
|
1.44 |
|
|
|
1.39 |
|
|
|
Return on average equity |
|
|
3.63 |
|
|
|
6.20 |
|
|
|
7.06 |
|
|
|
8.77 |
|
|
|
8.17 |
|
|
|
Return on average equity, excluding |
|
|
|
|
|
|
|
|
|
|
|
|
|
|
|
|
|
|
|
|
|
|
after-tax merger-related expenses (1) |
|
|
4.26 |
|
|
|
7.75 |
|
|
|
7.32 |
|
|
|
8.78 |
|
|
|
8.67 |
|
|
|
Return on average tangible equity (1) |
|
|
7.07 |
|
|
|
11.53 |
|
|
|
13.06 |
|
|
|
16.35 |
|
|
|
15.65 |
|
|
|
Return on average tangible equity, excluding |
|
|
|
|
|
|
|
|
|
|
|
|
|
|
|
|
|
|
|
|
|
|
after-tax merger-related expenses (1) |
|
|
8.18 |
|
|
|
14.24 |
|
|
|
13.50 |
|
|
|
16.38 |
|
|
|
16.56 |
|
|
|
Yield on earning assets (2) |
|
|
4.19 |
|
|
|
4.25 |
|
|
|
4.34 |
|
|
|
4.45 |
|
|
|
4.45 |
|
|
|
Cost of interest bearing liabilities |
|
|
0.91 |
|
|
|
0.99 |
|
|
|
1.09 |
|
|
|
1.08 |
|
|
|
1.06 |
|
|
|
Net interest spread (2) |
|
|
3.28 |
|
|
|
3.26 |
|
|
|
3.25 |
|
|
|
3.37 |
|
|
|
3.39 |
|
|
|
Net interest margin (2) |
|
|
3.54 |
|
|
|
3.55 |
|
|
|
3.56 |
|
|
|
3.67 |
|
|
|
3.68 |
|
|
|
Efficiency (1) (2) |
|
|
57.69 |
|
|
|
58.29 |
|
|
|
57.57 |
|
|
|
54.87 |
|
|
|
55.89 |
|
|
|
Average loans to average deposits |
|
|
94.61 |
|
|
|
90.78 |
|
|
|
88.96 |
|
|
|
87.35 |
|
|
|
87.01 |
|
|
|
Annualized net loan charge-offs /average loans |
|
|
0.18 |
|
|
|
0.20 |
|
|
|
0.04 |
|
|
|
0.05 |
|
|
|
0.07 |
|
|
|
Effective income tax rate |
|
|
13.40 |
|
|
|
16.23 |
|
|
|
18.24 |
|
|
|
18.40 |
|
|
|
18.01 |
|
|
|
Trust assets, market value at period end |
|
$ |
4,082,141 |
|
|
$ |
4,719,966 |
|
|
$ |
4,443,430 |
|
|
$ |
4,544,103 |
|
|
$ |
4,514,013 |
|
|
|
|
|
|
|
|
|
|
|
|
|
|
|
|
|
|
|
|
|
|
|
|
|
|
(1) See non-GAAP financial measures for additional information relating to the calculation of this item. |
|
(2) The yield on earning assets, net interest margin, net interest spread and efficiency ratios are presented on a fully taxable-equivalent (FTE) and annualized basis. The FTE basis adjusts for the tax benefit of income on certain tax-exempt loans and investments. WesBanco believes this measure to be the preferred industry measurement of net interest income and provides a relevant comparison between taxable and non-taxable amounts. |
|
WESBANCO, INC. |
|
|
Consolidated Selected Financial Highlights |
|
|
(unaudited, dollars in thousands, except shares) |
|
|
|
|
|
|
|
|
|
|
|
|
|
|
|
|
|
|
% Change |
|
|
|
|
March 31, |
|
|
|
|
|
December 31, |
|
December 31, 2019 |
|
|
Balance sheets |
|
2020 |
|
|
2019 |
|
|
% Change |
|
2019 |
|
to March 31, 2020 |
|
|
Assets |
|
|
|
|
|
|
|
|
|
|
|
|
|
|
|
|
|
|
|
Cash and due from banks |
|
$ |
183,138 |
|
|
$ |
159,097 |
|
|
|
15.1 |
|
$ |
182,905 |
|
|
0.1 |
|
|
Due from banks - interest bearing |
|
|
410,734 |
|
|
|
177,797 |
|
|
|
131.0 |
|
|
51,891 |
|
|
691.5 |
|
|
Securities: |
|
|
|
|
|
|
|
|
|
|
|
|
|
|
|
|
|
|
|
Equity securities, at fair value |
|
|
11,230 |
|
|
|
11,978 |
|
|
|
(6.2 |
) |
|
12,343 |
|
|
(9.0 |
) |
|
Available-for-sale debt securities, at fair value |
|
|
2,262,082 |
|
|
|
2,145,089 |
|
|
|
5.5 |
|
|
2,393,558 |
|
|
(5.5 |
) |
|
Held-to-maturity debt securities (fair values of $841,120;
$948,641 and $874,523, respectively) |
|
|
814,414 |
|
|
|
936,484 |
|
|
|
(13.0 |
) |
|
851,753 |
|
|
(4.4 |
) |
|
Allowance for credit losses, held-to-maturity debt securities |
|
|
(236 |
) |
|
|
- |
|
|
|
(100.0 |
) |
|
- |
|
|
(100.0 |
) |
|
Net held-to-maturity debt securities |
|
|
814,178 |
|
|
|
936,484 |
|
|
|
(13.1 |
) |
|
851,753 |
|
|
(4.4 |
) |
|
Total securities |
|
|
3,087,490 |
|
|
|
3,093,551 |
|
|
|
(0.2 |
) |
|
3,257,654 |
|
|
(5.2 |
) |
|
Loans held for sale |
|
|
48,021 |
|
|
|
8,358 |
|
|
|
474.6 |
|
|
43,013 |
|
|
11.6 |
|
|
Portfolio loans: |
|
|
|
|
|
|
|
|
|
|
|
|
|
|
|
|
|
|
|
Commercial real estate |
|
|
5,604,405 |
|
|
|
3,842,408 |
|
|
|
45.9 |
|
|
5,725,008 |
|
|
(2.1 |
) |
|
Commercial and industrial |
|
|
1,801,751 |
|
|
|
1,274,992 |
|
|
|
41.3 |
|
|
1,644,699 |
|
|
9.5 |
|
|
Residential real estate |
|
|
1,929,590 |
|
|
|
1,628,067 |
|
|
|
18.5 |
|
|
1,873,647 |
|
|
3.0 |
|
|
Home equity |
|
|
650,754 |
|
|
|
590,462 |
|
|
|
10.2 |
|
|
649,678 |
|
|
0.2 |
|
|
Consumer |
|
|
363,096 |
|
|
|
330,152 |
|
|
|
10.0 |
|
|
374,953 |
|
|
(3.2 |
) |
|
Total portfolio loans, net of unearned income |
|
|
10,349,596 |
|
|
|
7,666,081 |
|
|
|
35.0 |
|
|
10,267,985 |
|
|
0.8 |
|
|
Allowance for credit losses - loans (1) |
|
|
(114,272 |
) |
|
|
(48,866 |
) |
|
|
(133.8 |
) |
|
(52,429 |
) |
|
(118.0 |
) |
|
Net portfolio loans |
|
|
10,235,324 |
|
|
|
7,617,215 |
|
|
|
34.4 |
|
|
10,215,556 |
|
|
0.2 |
|
|
Premises and equipment, net |
|
|
258,200 |
|
|
|
180,651 |
|
|
|
42.9 |
|
|
261,014 |
|
|
(1.1 |
) |
|
Accrued interest receivable |
|
|
43,960 |
|
|
|
39,662 |
|
|
|
10.8 |
|
|
43,648 |
|
|
0.7 |
|
|
Goodwill and other intangible assets, net |
|
|
1,170,070 |
|
|
|
915,597 |
|
|
|
27.8 |
|
|
1,149,153 |
|
|
1.8 |
|
|
Bank-owned life insurance |
|
|
301,270 |
|
|
|
226,636 |
|
|
|
32.9 |
|
|
299,516 |
|
|
0.6 |
|
|
Other assets |
|
|
257,365 |
|
|
|
182,844 |
|
|
|
40.8 |
|
|
215,762 |
|
|
19.3 |
|
|
Total Assets |
|
$ |
15,995,572 |
|
|
$ |
12,601,408 |
|
|
|
26.9 |
|
$ |
15,720,112 |
|
|
1.8 |
|
|
Liabilities |
|
|
|
|
|
|
|
|
|
|
|
|
|
|
|
|
|
|
|
Deposits: |
|
|
|
|
|
|
|
|
|
|
|
|
|
|
|
|
|
|
|
Non-interest bearing demand |
|
$ |
3,191,713 |
|
|
$ |
2,511,140 |
|
|
|
27.1 |
|
$ |
3,178,270 |
|
|
0.4 |
|
|
Interest bearing demand |
|
|
2,388,406 |
|
|
|
2,159,654 |
|
|
|
10.6 |
|
|
2,316,855 |
|
|
3.1 |
|
|
Money market |
|
|
1,539,835 |
|
|
|
1,148,295 |
|
|
|
34.1 |
|
|
1,518,314 |
|
|
1.4 |
|
|
Savings deposits |
|
|
1,984,057 |
|
|
|
1,672,967 |
|
|
|
18.6 |
|
|
1,934,647 |
|
|
2.6 |
|
|
Certificates of deposit |
|
|
1,939,321 |
|
|
|
1,424,275 |
|
|
|
36.2 |
|
|
2,055,920 |
|
|
(5.7 |
) |
|
Total deposits |
|
|
11,043,332 |
|
|
|
8,916,331 |
|
|
|
23.9 |
|
|
11,004,006 |
|
|
0.4 |
|
|
Federal Home Loan Bank borrowings |
|
|
1,585,608 |
|
|
|
1,031,796 |
|
|
|
53.7 |
|
|
1,415,615 |
|
|
12.0 |
|
|
Other short-term borrowings |
|
|
333,966 |
|
|
|
301,547 |
|
|
|
10.8 |
|
|
282,362 |
|
|
18.3 |
|
|
Subordinated debt and junior subordinated debt |
|
|
192,008 |
|
|
|
179,632 |
|
|
|
6.9 |
|
|
199,869 |
|
|
(3.9 |
) |
|
Total borrowings |
|
|
2,111,582 |
|
|
|
1,512,975 |
|
|
|
39.6 |
|
|
1,897,846 |
|
|
11.3 |
|
|
Accrued interest payable |
|
|
7,667 |
|
|
|
6,030 |
|
|
|
27.1 |
|
|
8,077 |
|
|
(5.1 |
) |
|
Other liabilities |
|
|
246,931 |
|
|
|
142,933 |
|
|
|
72.8 |
|
|
216,262 |
|
|
14.2 |
|
|
Total Liabilities |
|
|
13,409,512 |
|
|
|
10,578,269 |
|
|
|
26.8 |
|
|
13,126,191 |
|
|
2.2 |
|
|
Shareholders' Equity |
|
|
|
|
|
|
|
|
|
|
|
|
|
|
|
|
|
|
|
Preferred stock, no par value; 1,000,000 shares authorized;
none outstanding |
|
|
- |
|
|
|
- |
|
|
|
- |
|
|
- |
|
|
- |
|
|
Common stock, $2.0833 par value; 100,000,000 shares
authorized in 2020 and 2019, respectively; 68,078,116,
54,604,294 and 68,078,116 shares issued, respectively;
67,058,155, 54,599,127 and 67,824,428 shares outstanding,
respectively |
|
|
141,827 |
|
|
|
113,758 |
|
|
|
24.7 |
|
|
141,827 |
|
|
- |
|
|
Capital surplus |
|
|
1,638,122 |
|
|
|
1,167,761 |
|
|
|
40.3 |
|
|
1,636,966 |
|
|
0.1 |
|
|
Retained earnings |
|
|
800,064 |
|
|
|
761,002 |
|
|
|
5.1 |
|
|
824,694 |
|
|
(3.0 |
) |
|
Treasury stock (1,019,961, 5,167 and 253,688 shares - at cost, respectively) |
|
|
(33,714 |
) |
|
|
(229 |
) |
|
|
(14,622.3 |
) |
|
(9,463 |
) |
|
(256.3 |
) |
|
Accumulated other comprehensive income (loss) |
|
|
41,141 |
|
|
|
(18,098 |
) |
|
|
327.3 |
|
|
1,201 |
|
|
3,325.6 |
|
|
Deferred benefits for directors |
|
|
(1,380 |
) |
|
|
(1,055 |
) |
|
|
(30.8 |
) |
|
(1,304 |
) |
|
(5.8 |
) |
|
Total Shareholders' Equity |
|
|
2,586,060 |
|
|
|
2,023,139 |
|
|
|
27.8 |
|
|
2,593,921 |
|
|
(0.3 |
) |
|
Total Liabilities and Shareholders' Equity |
|
$ |
15,995,572 |
|
|
$ |
12,601,408 |
|
|
|
26.9 |
|
$ |
15,720,112 |
|
|
1.8 |
|
|
|
|
|
|
|
|
|
|
|
|
|
|
|
|
|
|
|
|
|
|
(1) Allowance for credit losses - loans as of March 31, 2020 includes a day 1 adjustment of $41.4 million due to the adoption of ASU 2016-13. |
|
|
WESBANCO, INC. |
|
|
Consolidated Selected Financial Highlights |
|
|
(unaudited, dollars in thousands) |
|
|
|
|
Three Months Ended March 31, |
|
|
|
|
|
2020 |
|
|
|
2019 |
|
|
|
Average balance sheet and net interest margin |
|
Average |
|
Average |
|
|
|
Average |
|
Average |
|
|
|
analysis |
|
Balance |
|
Rate |
|
|
|
Balance |
|
Rate |
|
|
|
Assets |
|
|
|
|
|
|
|
|
|
|
|
|
|
|
|
|
|
Due from banks - interest bearing |
|
$ |
133,532 |
|
|
1.21 |
|
% |
|
$ |
76,731 |
|
|
1.70 |
|
% |
|
Loans, net of unearned income (1) |
|
|
10,375,187 |
|
|
4.63 |
|
|
|
|
7,659,542 |
|
|
5.06 |
|
|
|
Securities: (2) |
|
|
|
|
|
|
|
|
|
|
|
|
|
|
|
|
|
Taxable |
|
|
2,576,668 |
|
|
2.65 |
|
|
|
|
2,353,856 |
|
|
2.84 |
|
|
|
Tax-exempt (3) |
|
|
646,587 |
|
|
3.51 |
|
|
|
|
810,702 |
|
|
3.46 |
|
|
|
Total securities |
|
|
3,223,255 |
|
|
2.82 |
|
|
|
|
3,164,558 |
|
|
3.00 |
|
|
|
Other earning assets |
|
|
69,581 |
|
|
6.37 |
|
|
|
|
52,114 |
|
|
7.30 |
|
|
|
Total earning assets (3) |
|
|
13,801,555 |
|
|
4.19 |
|
% |
|
|
10,952,945 |
|
|
4.45 |
|
% |
|
Other assets |
|
|
1,983,384 |
|
|
|
|
|
|
|
1,557,087 |
|
|
|
|
|
|
Total Assets |
|
$ |
15,784,939 |
|
|
|
|
|
|
$ |
12,510,032 |
|
|
|
|
|
|
|
|
|
|
|
|
|
|
|
|
|
|
|
|
|
|
|
|
Liabilities and Shareholders' Equity |
|
|
|
|
|
|
|
|
|
|
|
|
|
|
|
|
|
Interest bearing demand deposits |
|
$ |
2,342,441 |
|
|
0.58 |
|
% |
|
$ |
2,129,601 |
|
|
0.75 |
|
% |
|
Money market accounts |
|
|
1,543,763 |
|
|
0.61 |
|
|
|
|
1,154,563 |
|
|
0.67 |
|
|
|
Savings deposits |
|
|
1,953,487 |
|
|
0.19 |
|
|
|
|
1,659,751 |
|
|
0.13 |
|
|
|
Certificates of deposit |
|
|
1,989,450 |
|
|
0.82 |
|
|
|
|
1,438,468 |
|
|
1.10 |
|
|
|
Total interest bearing deposits |
|
|
7,829,141 |
|
|
0.55 |
|
|
|
|
6,382,383 |
|
|
0.65 |
|
|
|
Federal Home Loan Bank borrowings |
|
|
1,471,175 |
|
|
2.25 |
|
|
|
|
1,053,014 |
|
|
2.44 |
|
|
|
Other borrowings |
|
|
336,042 |
|
|
1.04 |
|
|
|
|
327,839 |
|
|
1.92 |
|
|
|
Subordinated debt and junior subordinated debt |
|
|
198,494 |
|
|
4.99 |
|
|
|
|
189,524 |
|
|
5.41 |
|
|
|
Total interest bearing liabilities |
|
|
9,834,852 |
|
|
0.91 |
|
% |
|
|
7,952,760 |
|
|
1.06 |
|
% |
|
Non-interest bearing demand deposits |
|
|
3,137,279 |
|
|
|
|
|
|
|
2,420,462 |
|
|
|
|
|
|
Other liabilities |
|
|
218,739 |
|
|
|
|
|
|
|
134,100 |
|
|
|
|
|
|
Shareholders' equity |
|
|
2,594,069 |
|
|
|
|
|
|
|
2,002,710 |
|
|
|
|
|
|
Total Liabilities and Shareholders' Equity |
|
$ |
15,784,939 |
|
|
|
|
|
|
$ |
12,510,032 |
|
|
|
|
|
|
Taxable equivalent net interest spread |
|
|
|
|
|
3.28 |
|
% |
|
|
|
|
|
3.39 |
|
% |
|
Taxable equivalent net interest margin |
|
|
|
|
|
3.54 |
|
% |
|
|
|
|
|
3.68 |
|
% |
|
(1) |
Gross of allowance for loan losses and net of unearned income. Includes non-accrual and loans held for sale. |
Loan fees included in interest income on loans are $0.5 million and $0.9 million for the three months ended December 31, 2019 and 2018 and $1.8 million and $3.4 million for the year ended December 31, 2019 and 2018, respectively.
Additionally, loan accretion included in interest income on loans acquired from prior acquisitions was $4.9 million and $8.1 million for the three months ended December 31, 2019 and 2018 and $17.9 million and $11.7 million for the year ended December 31, 2019 and 2018, respectively.
Accretion on interest bearing liabilities acquired from the prior acquisitions was $1.9 million and $0.5 million for the three months ended December 31, 2019 and 2018, respectively, and $2.8 million and $2.0 million for the year ended December 31, 2019 and 2018, respectively.
|
(2) |
Average yields on available-for-sale securities are calculated based on amortized cost. |
|
(3) |
Taxable equivalent basis is calculated on tax-exempt securities using a rate of 21% for each period presented. |
|
WESBANCO, INC. |
|
|
Consolidated Selected Financial Highlights |
|
|
(unaudited, dollars in thousands) |
|
|
|
|
Quarter Ended |
|
|
|
|
Mar. 31, |
|
|
Dec. 31, |
|
|
Sept. 30, |
|
|
June 30, |
|
|
Mar. 31, |
|
|
Statement of Income |
|
2020 |
|
|
2019 |
|
|
2019 |
|
|
2019 |
|
|
2019 |
|
|
Interest and dividend income |
|
|
|
|
|
|
|
|
|
|
|
|
|
|
|
|
|
|
|
|
|
Loans, including fees |
|
$ |
119,503 |
|
|
$ |
105,879 |
|
|
$ |
95,369 |
|
|
$ |
96,415 |
|
|
$ |
95,502 |
|
|
Interest and dividends on securities: |
|
|
|
|
|
|
|
|
|
|
|
|
|
|
|
|
|
|
|
|
|
Taxable |
|
|
16,986 |
|
|
|
16,586 |
|
|
|
15,887 |
|
|
|
16,444 |
|
|
|
16,733 |
|
|
Tax-exempt |
|
|
4,456 |
|
|
|
4,563 |
|
|
|
4,759 |
|
|
|
5,142 |
|
|
|
5,541 |
|
|
Total interest and dividends on securities |
|
|
21,442 |
|
|
|
21,149 |
|
|
|
20,646 |
|
|
|
21,586 |
|
|
|
22,274 |
|
|
Other interest income |
|
|
1,503 |
|
|
|
1,281 |
|
|
|
1,333 |
|
|
|
1,542 |
|
|
|
1,277 |
|
|
Total interest and dividend income |
|
|
142,448 |
|
|
|
128,309 |
|
|
|
117,348 |
|
|
|
119,543 |
|
|
|
119,053 |
|
|
Interest expense |
|
|
|
|
|
|
|
|
|
|
|
|
|
|
|
|
|
|
|
|
|
Interest bearing demand deposits |
|
|
3,394 |
|
|
|
4,054 |
|
|
|
4,489 |
|
|
|
4,314 |
|
|
|
3,946 |
|
|
Money market deposits |
|
|
2,352 |
|
|
|
2,143 |
|
|
|
1,973 |
|
|
|
2,009 |
|
|
|
1,899 |
|
|
Savings deposits |
|
|
923 |
|
|
|
935 |
|
|
|
861 |
|
|
|
678 |
|
|
|
522 |
|
|
Certificates of deposit |
|
|
4,054 |
|
|
|
3,800 |
|
|
|
3,830 |
|
|
|
4,098 |
|
|
|
3,903 |
|
|
Total interest expense on deposits |
|
|
10,723 |
|
|
|
10,932 |
|
|
|
11,153 |
|
|
|
11,099 |
|
|
|
10,270 |
|
|
Federal Home Loan Bank borrowings |
|
|
8,232 |
|
|
|
7,279 |
|
|
|
6,645 |
|
|
|
6,287 |
|
|
|
6,337 |
|
|
Other short-term borrowings |
|
|
870 |
|
|
|
1,009 |
|
|
|
1,353 |
|
|
|
1,483 |
|
|
|
1,556 |
|
|
Subordinated debt and junior subordinated debt |
|
|
2,461 |
|
|
|
2,125 |
|
|
|
2,077 |
|
|
|
2,214 |
|
|
|
2,529 |
|
|
Total interest expense |
|
|
22,286 |
|
|
|
21,345 |
|
|
|
21,228 |
|
|
|
21,083 |
|
|
|
20,692 |
|
|
Net interest income |
|
|
120,162 |
|
|
|
106,964 |
|
|
|
96,120 |
|
|
|
98,460 |
|
|
|
98,361 |
|
|
Provision for credit losses |
|
|
29,821 |
|
|
|
1,824 |
|
|
|
4,121 |
|
|
|
2,747 |
|
|
|
2,507 |
|
|
Net interest income after provision for credit losses |
|
|
90,341 |
|
|
|
105,140 |
|
|
|
91,999 |
|
|
|
95,713 |
|
|
|
95,854 |
|
|
Non-interest income |
|
|
|
|
|
|
|
|
|
|
|
|
|
|
|
|
|
|
|
|
|
Trust fees |
|
|
6,952 |
|
|
|
6,699 |
|
|
|
6,425 |
|
|
|
6,339 |
|
|
|
7,115 |
|
|
Service charges on deposits |
|
|
6,617 |
|
|
|
7,171 |
|
|
|
7,056 |
|
|
|
6,197 |
|
|
|
6,549 |
|
|
Electronic banking fees |
|
|
4,254 |
|
|
|
4,336 |
|
|
|
5,253 |
|
|
|
7,154 |
|
|
|
5,892 |
|
|
Net securities brokerage revenue |
|
|
1,679 |
|
|
|
1,393 |
|
|
|
1,765 |
|
|
|
1,973 |
|
|
|
1,860 |
|
|
Bank-owned life insurance |
|
|
1,769 |
|
|
|
1,882 |
|
|
|
1,373 |
|
|
|
1,340 |
|
|
|
1,319 |
|
|
Mortgage banking income |
|
|
1,276 |
|
|
|
2,957 |
|
|
|
2,588 |
|
|
|
1,618 |
|
|
|
1,056 |
|
|
Net securities gains |
|
|
1,491 |
|
|
|
520 |
|
|
|
235 |
|
|
|
2,909 |
|
|
|
657 |
|
|
Net gain on other real estate owned and other assets |
|
|
169 |
|
|
|
61 |
|
|
|
158 |
|
|
|
376 |
|
|
|
136 |
|
|
Other income |
|
|
3,802 |
|
|
|
5,819 |
|
|
|
2,097 |
|
|
|
3,250 |
|
|
|
3,189 |
|
|
Total non-interest income |
|
|
28,009 |
|
|
|
30,838 |
|
|
|
26,950 |
|
|
|
31,156 |
|
|
|
27,773 |
|
|
Non-interest expense |
|
|
|
|
|
|
|
|
|
|
|
|
|
|
|
|
|
|
|
|
|
Salaries and wages |
|
|
38,910 |
|
|
|
36,984 |
|
|
|
32,915 |
|
|
|
31,646 |
|
|
|
30,940 |
|
|
Employee benefits |
|
|
10,373 |
|
|
|
9,894 |
|
|
|
9,726 |
|
|
|
9,705 |
|
|
|
9,989 |
|
|
Net occupancy |
|
|
7,084 |
|
|
|
6,162 |
|
|
|
5,392 |
|
|
|
5,385 |
|
|
|
5,566 |
|
|
Equipment |
|
|
6,039 |
|
|
|
5,570 |
|
|
|
5,273 |
|
|
|
4,818 |
|
|
|
4,833 |
|
|
Marketing |
|
|
1,138 |
|
|
|
2,059 |
|
|
|
1,505 |
|
|
|
1,254 |
|
|
|
1,243 |
|
|
FDIC insurance |
|
|
2,113 |
|
|
|
668 |
|
|
|
(1,221 |
) |
|
|
1,155 |
|
|
|
1,353 |
|
|
Amortization of intangible assets |
|
|
3,374 |
|
|
|
2,916 |
|
|
|
2,446 |
|
|
|
2,465 |
|
|
|
2,514 |
|
|
Restructuring and merger-related expense |
|
|
5,164 |
|
|
|
11,522 |
|
|
|
1,688 |
|
|
|
81 |
|
|
|
3,107 |
|
|
Other operating expenses |
|
|
17,138 |
|
|
|
16,781 |
|
|
|
15,544 |
|
|
|
15,443 |
|
|
|
14,887 |
|
|
Total non-interest expense |
|
|
91,333 |
|
|
|
92,556 |
|
|
|
73,268 |
|
|
|
71,952 |
|
|
|
74,432 |
|
|
Income before provision for income taxes |
|
|
27,017 |
|
|
|
43,422 |
|
|
|
45,681 |
|
|
|
54,917 |
|
|
|
49,195 |
|
|
Provision for income taxes |
|
|
3,621 |
|
|
|
7,046 |
|
|
|
8,334 |
|
|
|
10,103 |
|
|
|
8,858 |
|
|
Net Income |
|
$ |
23,396 |
|
|
$ |
36,376 |
|
|
$ |
37,347 |
|
|
$ |
44,814 |
|
|
$ |
40,337 |
|
|
|
|
|
|
|
|
|
|
|
|
|
|
|
|
|
|
|
|
|
|
|
|
Taxable equivalent net interest income |
|
$ |
121,346 |
|
|
$ |
108,177 |
|
|
$ |
97,385 |
|
|
$ |
99,827 |
|
|
$ |
99,834 |
|
|
|
|
|
|
|
|
|
|
|
|
|
|
|
|
|
|
|
|
|
|
|
|
Per common share data |
|
|
|
|
|
|
|
|
|
|
|
|
|
|
|
|
|
|
|
|
|
Net income per common share - basic |
|
|
0.35 |
|
|
|
0.60 |
|
|
|
0.68 |
|
|
|
0.82 |
|
|
|
0.74 |
|
|
Net income per common share - diluted |
|
|
0.35 |
|
|
|
0.60 |
|
|
|
0.68 |
|
|
|
0.82 |
|
|
|
0.74 |
|
|
Net income per common share - diluted, excluding
certain items (1)(2) |
|
|
0.41 |
|
|
|
0.75 |
|
|
|
0.71 |
|
|
|
0.82 |
|
|
|
0.78 |
|
|
Dividends declared |
|
|
0.32 |
|
|
|
0.31 |
|
|
|
0.31 |
|
|
|
0.31 |
|
|
|
0.31 |
|
|
Book value (period end) |
|
|
38.56 |
|
|
|
38.24 |
|
|
|
38.42 |
|
|
|
37.92 |
|
|
|
37.05 |
|
|
Tangible book value (period end) (1) |
|
|
21.36 |
|
|
|
21.55 |
|
|
|
21.89 |
|
|
|
21.40 |
|
|
|
20.49 |
|
|
Average common shares outstanding - basic |
|
|
67,486,550 |
|
|
|
60,461,325 |
|
|
|
54,695,578 |
|
|
|
54,628,029 |
|
|
|
54,598,499 |
|
|
Average common shares outstanding - diluted |
|
|
67,587,446 |
|
|
|
60,562,366 |
|
|
|
54,751,344 |
|
|
|
54,773,521 |
|
|
|
54,706,337 |
|
|
Period end common shares outstanding |
|
|
67,058,155 |
|
|
|
67,824,428 |
|
|
|
54,691,225 |
|
|
|
54,697,199 |
|
|
|
54,599,127 |
|
|
Full time equivalent employees |
|
|
2,703 |
|
|
|
2,705 |
|
|
|
2,330 |
|
|
|
2,353 |
|
|
|
2,329 |
|
|
|
|
|
|
|
|
|
|
|
|
|
|
|
|
|
|
|
|
|
|
|
|
(1) See non-GAAP financial measures for additional information relating to the calculation of this item. |
|
|
(2) Certain items excluded from the calculation consist of after-tax merger-related expenses. |
|
|
WESBANCO, INC. |
|
Consolidated Selected Financial Highlights |
|
(unaudited, dollars in thousands) |
|
|
|
Quarter Ended |
|
|
|
|
|
Mar. 31, |
|
|
Dec. 31, |
|
|
Sept. 30, |
|
|
June 30, |
|
|
Mar. 31, |
|
|
|
Asset quality data |
|
2020 |
|
|
2019 |
|
|
2019 |
|
|
2019 |
|
|
2019 |
|
|
|
Non-performing assets: |
|
|
|
|
|
|
|
|
|
|
|
|
|
|
|
|
|
|
|
|
|
|
Troubled debt restructurings - accruing |
|
$ |
5,434 |
|
|
$ |
5,431 |
|
|
$ |
5,840 |
|
|
$ |
5,487 |
|
|
$ |
5,481 |
|
|
|
Non-accrual loans: |
|
|
|
|
|
|
|
|
|
|
|
|
|
|
|
|
|
|
|
|
|
|
Troubled debt restructurings |
|
|
1,571 |
|
|
|
1,422 |
|
|
|
1,345 |
|
|
|
1,924 |
|
|
|
2,936 |
|
|
|
Other non-accrual loans (1) |
|
|
32,796 |
|
|
|
43,491 |
|
|
|
33,456 |
|
|
|
30,974 |
|
|
|
27,291 |
|
|
|
Total non-accrual loans |
|
|
34,367 |
|
|
|
44,913 |
|
|
|
34,801 |
|
|
|
32,898 |
|
|
|
30,227 |
|
|
|
Total non-performing loans |
|
|
39,801 |
|
|
|
50,344 |
|
|
|
40,641 |
|
|
|
38,385 |
|
|
|
35,708 |
|
|
|
Other real estate and repossessed assets |
|
|
1,083 |
|
|
|
4,178 |
|
|
|
3,678 |
|
|
|
4,973 |
|
|
|
6,001 |
|
|
|
Total non-performing assets |
|
$ |
40,884 |
|
|
$ |
54,522 |
|
|
$ |
44,319 |
|
|
$ |
43,358 |
|
|
$ |
41,709 |
|
|
|
|
|
|
|
|
|
|
|
|
|
|
|
|
|
|
|
|
|
|
|
|
|
|
Past due loans (2): |
|
|
|
|
|
|
|
|
|
|
|
|
|
|
|
|
|
|
|
|
|
|
Loans past due 30-89 days |
|
$ |
32,805 |
|
|
$ |
36,330 |
|
|
$ |
17,906 |
|
|
$ |
15,446 |
|
|
$ |
21,433 |
|
|
|
Loans past due 90 days or more |
|
|
14,287 |
|
|
|
11,613 |
|
|
|
5,425 |
|
|
|
2,634 |
|
|
|
2,740 |
|
|
|
Total past due loans |
|
$ |
47,092 |
|
|
$ |
47,943 |
|
|
$ |
23,331 |
|
|
$ |
18,080 |
|
|
$ |
24,173 |
|
|
|
|
|
|
|
|
|
|
|
|
|
|
|
|
|
|
|
|
|
|
|
|
|
|
Criticized and classified loans (3): |
|
|
|
|
|
|
|
|
|
|
|
|
|
|
|
|
|
|
|
|
|
|
Criticized loans (1) |
|
$ |
120,801 |
|
|
$ |
118,959 |
|
|
$ |
78,880 |
|
|
$ |
73,236 |
|
|
$ |
69,691 |
|
|
|
Classified loans (1) |
|
|
95,162 |
|
|
|
103,519 |
|
|
|
95,071 |
|
|
|
41,004 |
|
|
|
39,412 |
|
|
|
Total criticized and classified loans |
|
$ |
215,963 |
|
|
$ |
222,478 |
|
|
$ |
173,951 |
|
|
$ |
114,240 |
|
|
$ |
109,103 |
|
|
|
|
|
|
|
|
|
|
|
|
|
|
|
|
|
|
|
|
|
|
|
|
|
|
Loans past due 30-89 days / total portfolio loans |
|
|
0.32 |
|
% |
|
0.35 |
|
% |
|
0.23 |
|
% |
|
0.20 |
|
% |
|
0.28 |
|
% |
|
Loans past due 90 days or more / total portfolio loans |
|
|
0.14 |
|
|
|
0.11 |
|
|
|
0.07 |
|
|
|
0.03 |
|
|
|
0.04 |
|
|
|
Non-performing loans / total portfolio loans |
|
|
0.38 |
|
|
|
0.49 |
|
|
|
0.52 |
|
|
|
0.50 |
|
|
|
0.47 |
|
|
|
Non-performing assets/total portfolio loans, other
real estate and repossessed assets |
|
|
0.39 |
|
|
|
0.53 |
|
|
|
0.57 |
|
|
|
0.56 |
|
|
|
0.54 |
|
|
|
Non-performing assets / total assets |
|
|
0.26 |
|
|
|
0.35 |
|
|
|
0.35 |
|
|
|
0.35 |
|
|
|
0.33 |
|
|
|
Criticized and classified loans / total portfolio loans |
|
|
2.09 |
|
|
|
2.17 |
|
|
|
2.24 |
|
|
|
1.48 |
|
|
|
1.42 |
|
|
|
|
|
|
|
|
|
|
|
|
|
|
|
|
|
|
|
|
|
|
|
|
|
|
Allowance for loan losses |
|
|
|
|
|
|
|
|
|
|
|
|
|
|
|
|
|
|
|
|
|
|
Allowance for loan losses |
|
$ |
114,272 |
|
|
$ |
52,429 |
|
|
$ |
54,317 |
|
|
$ |
50,859 |
|
|
$ |
48,866 |
|
|
|
Provision for credit losses |
|
|
29,821 |
|
|
|
1,824 |
|
|
|
4,121 |
|
|
|
2,747 |
|
|
|
2,507 |
|
|
|
Net loan and deposit account overdraft charge-offs |
|
|
4,716 |
|
|
|
4,476 |
|
|
|
791 |
|
|
|
947 |
|
|
|
1,370 |
|
|
|
Annualized net loan charge-offs /average loans |
|
|
0.18 |
|
% |
|
0.20 |
|
% |
|
0.04 |
|
% |
|
0.05 |
|
% |
|
0.07 |
|
% |
|
Allowance for loan losses / total portfolio loans |
|
|
1.10 |
|
% |
|
0.51 |
|
% |
|
0.70 |
|
% |
|
0.66 |
|
% |
|
0.64 |
|
% |
|
Allowance for loan losses / non-performing loans |
|
|
2.87 |
|
x |
|
1.04 |
|
x |
|
1.34 |
|
x |
|
1.32 |
|
x |
|
1.37 |
|
x |
|
Allowance for loan losses / non-performing loans
and loans past due |
|
|
1.32 |
|
x |
|
0.53 |
|
x |
|
0.85 |
|
x |
|
0.90 |
|
x |
|
0.82 |
|
x |
|
|
|
|
|
|
|
|
|
|
|
|
|
|
|
|
|
|
|
|
|
|
|
|
|
|
Quarter Ended |
|
|
|
|
|
Mar. 31, |
|
|
Dec, 31, |
|
|
Sept. 30, |
|
|
June 30, |
|
|
Mar. 31, |
|
|
|
|
|
2020 |
|
|
2019 |
|
|
2019 |
|
|
2019 |
|
|
2019 |
|
|
|
Capital ratios |
|
|
|
|
|
|
|
|
|
|
|
|
|
|
|
|
|
|
|
|
|
|
Tier I leverage capital |
|
|
9.64 |
|
% |
|
11.30 |
|
% |
|
11.30 |
|
% |
|
11.09 |
|
% |
|
10.98 |
|
% |
|
Tier I risk-based capital |
|
|
12.51 |
|
|
|
12.89 |
|
|
|
15.40 |
|
|
|
15.39 |
|
|
|
15.31 |
|
|
|
Total risk-based capital |
|
|
14.83 |
|
|
|
15.12 |
|
|
|
16.36 |
|
|
|
16.32 |
|
|
|
16.22 |
|
|
|
Common equity tier 1 capital ratio (CET 1) |
|
|
12.51 |
|
|
|
12.89 |
|
|
|
13.87 |
|
|
|
13.83 |
|
|
|
13.48 |
|
|
|
Average shareholders' equity to average assets |
|
|
16.43 |
|
|
|
16.73 |
|
|
|
16.80 |
|
|
|
16.42 |
|
|
|
16.01 |
|
|
|
Tangible equity to tangible assets (4) |
|
|
9.65 |
|
|
|
10.02 |
|
|
|
10.24 |
|
|
|
10.10 |
|
|
|
9.57 |
|
|
|
|
|
|
|
|
|
|
|
|
|
|
|
|
|
|
|
|
|
|
|
|
|
|
(1) Excludes non-performing loans. |
|
|
|
(2) Criticized and classified commercial loans may include loans that are also reported as non-performing or past due. |
|
|
|
(3) The provision for credit losses includes $1.7 million for loan commitments, and the allowance for credit losses - loan commitments is $5.6 million as of March 31, 2020. |
|
|
|
(4) See non-GAAP financial measures for additional information relating to the calculation of this ratio. |
|
|
|
WESBANCO, INC.
Consolidated Selected Financial Highlights |
|
(unaudited, dollars in thousands)
|
NON-GAAP FINANCIAL MEASURES |
|
|
The following non-GAAP financial measures used by WesBanco provide information useful to investors in understanding WesBanco’s operating performance and trends, and facilitate comparisons with the performance of WesBanco’s peers. The following tables summarize the non-GAAP financial measures derived from amounts reported in WesBanco’s financial statements. |
|
|
|
|
|
|
Three Months Ended |
|
|
|
|
|
|
Mar. 31, |
|
|
Dec. 31, |
|
|
Sept. 30, |
|
|
June 30, |
|
|
Mar. 31, |
|
|
|
|
(unaudited, dollars in thousands, except shares and per share amounts) |
|
2020 |
|
|
2019 |
|
|
2019 |
|
|
2019 |
|
|
2019 |
|
|
|
|
Return on average assets, excluding after-tax merger-related expenses: |
|
|
|
|
|
|
|
|
|
|
|
|
|
|
|
|
|
|
|
|
|
|
|
Net income |
|
$ |
23,396 |
|
|
$ |
36,376 |
|
|
$ |
37,347 |
|
|
$ |
44,814 |
|
|
$ |
40,337 |
|
|
|
|
Plus: after-tax merger-related expenses (1) |
|
|
4,080 |
|
|
|
9,102 |
|
|
|
1,334 |
|
|
|
64 |
|
|
|
2,454 |
|
|
|
|
Net income excluding after-tax merger-related expenses |
|
|
27,476 |
|
|
|
45,478 |
|
|
|
38,681 |
|
|
|
44,878 |
|
|
|
42,791 |
|
|
|
|
|
|
|
|
|
|
|
|
|
|
|
|
|
|
|
|
|
|
|
|
|
|
|
|
Average total assets |
|
$ |
15,784,939 |
|
|
$ |
13,919,430 |
|
|
$ |
12,488,153 |
|
|
$ |
12,489,663 |
|
|
$ |
12,510,032 |
|
|
|
|
|
|
|
|
|
|
|
|
|
|
|
|
|
|
|
|
|
|
|
|
|
|
|
|
Return on average tangible assets, excluding after-tax merger-related expenses (annualized) (2) |
|
|
0.70 |
% |
|
|
1.30 |
% |
|
|
1.23 |
% |
|
|
1.44 |
% |
|
|
1.39 |
% |
|
|
|
|
|
|
|
|
|
|
|
|
|
|
|
|
|
|
|
|
|
|
|
|
|
|
|
Return on average equity, excluding after-tax merger-related expenses: |
|
|
|
|
|
|
|
|
|
|
|
|
|
|
|
|
|
|
|
|
|
|
|
Net income |
|
$ |
23,396 |
|
|
$ |
36,376 |
|
|
$ |
37,347 |
|
|
$ |
44,814 |
|
|
$ |
40,337 |
|
|
|
|
Plus: after-tax merger-related expenses (1) |
|
|
4,080 |
|
|
|
9,102 |
|
|
|
1,334 |
|
|
|
64 |
|
|
|
2,454 |
|
|
|
|
Net income excluding after-tax merger-related expenses |
|
|
27,476 |
|
|
|
45,478 |
|
|
|
38,681 |
|
|
|
44,878 |
|
|
|
42,791 |
|
|
|
|
|
|
|
|
|
|
|
|
|
|
|
|
|
|
|
|
|
|
|
|
|
|
|
|
Average total shareholders' equity |
|
|
2,594,069 |
|
|
|
2,329,121 |
|
|
|
2,097,534 |
|
|
|
2,050,190 |
|
|
|
2,002,710 |
|
|
|
|
|
|
|
|
|
|
|
|
|
|
|
|
|
|
|
|
|
|
|
|
|
|
|
|
Return on average tangible equity, excluding after-tax merger-related expenses (annualized) (2) |
|
|
4.26 |
% |
|
|
7.75 |
% |
|
|
7.32 |
% |
|
|
8.78 |
% |
|
|
8.67 |
% |
|
|
|
|
|
|
|
|
|
|
|
|
|
|
|
|
|
|
|
|
|
|
|
|
|
|
|
Return on average tangible equity: |
|
|
|
|
|
|
|
|
|
|
|
|
|
|
|
|
|
|
|
|
|
|
|
Net income |
|
$ |
23,396 |
|
|
$ |
36,376 |
|
|
$ |
37,347 |
|
|
$ |
44,814 |
|
|
$ |
40,337 |
|
|
|
|
Plus: amortization of intangibles (1) |
|
|
2,665 |
|
|
|
2,304 |
|
|
|
1,932 |
|
|
|
1,947 |
|
|
|
1,986 |
|
|
|
|
Net income before amortization of intangibles |
|
|
26,061 |
|
|
|
38,680 |
|
|
|
39,279 |
|
|
|
46,761 |
|
|
|
42,323 |
|
|
|
|
|
|
|
|
|
|
|
|
|
|
|
|
|
|
|
|
|
|
|
|
|
|
|
|
Average total shareholders' equity |
|
|
2,594,069 |
|
|
|
2,329,121 |
|
|
|
2,097,534 |
|
|
|
2,050,190 |
|
|
|
2,002,710 |
|
|
|
|
Less: average goodwill and other intangibles, net of def. tax liability |
|
|
(1,112,327 |
) |
|
|
(997,658 |
) |
|
|
(904,204 |
) |
|
|
(903,243 |
) |
|
|
(906,041 |
) |
|
|
|
Average tangible equity |
|
$ |
1,481,742 |
|
|
$ |
1,331,463 |
|
|
$ |
1,193,330 |
|
|
$ |
1,146,947 |
|
|
$ |
1,096,669 |
|
|
|
|
|
|
|
|
|
|
|
|
|
|
|
|
|
|
|
|
|
|
|
|
|
|
|
|
Return on average tangible equity (annualized) (2) |
|
|
7.07 |
% |
|
|
11.53 |
% |
|
|
13.06 |
% |
|
|
16.35 |
% |
|
|
15.65 |
% |
|
|
|
|
|
|
|
|
|
|
|
|
|
|
|
|
|
|
|
|
|
|
|
|
|
|
|
Return on average tangible equity, excluding after-tax merger-related expenses: |
|
|
|
|
|
|
|
|
|
|
|
|
|
|
|
|
|
|
|
|
|
|
|
Net income |
|
$ |
23,396 |
|
|
$ |
36,376 |
|
|
$ |
37,347 |
|
|
$ |
44,814 |
|
|
$ |
40,337 |
|
|
|
|
Plus: after-tax merger-related expenses (1) |
|
|
4,080 |
|
|
|
9,102 |
|
|
|
1,334 |
|
|
|
64 |
|
|
|
2,454 |
|
|
|
|
Plus: amortization of intangibles (1) |
|
|
2,665 |
|
|
|
2,304 |
|
|
|
1,932 |
|
|
|
1,947 |
|
|
|
1,986 |
|
|
WESBANCO, INC. |
|
Consolidated Selected Financial Highlights |
|
(unaudited, dollars in thousands) |
|
|
|
Net income before amortization of intangibles and
excluding after-tax merger-related expenses |
|
|
30,141 |
|
|
|
47,782 |
|
|
|
40,613 |
|
|
|
46,825 |
|
|
|
44,777 |
|
|
|
|
|
|
|
|
|
|
|
|
|
|
|
|
|
|
|
|
|
|
|
|
|
|
|
|
Average total shareholders' equity |
|
|
2,594,069 |
|
|
|
2,329,121 |
|
|
|
2,097,534 |
|
|
|
2,050,190 |
|
|
|
2,002,710 |
|
|
|
|
Less: average goodwill and other intangibles, net of def. tax liability |
|
|
(1,112,327 |
) |
|
|
(997,658 |
) |
|
|
(904,204 |
) |
|
|
(903,243 |
) |
|
|
(906,041 |
) |
|
|
|
Average tangible equity |
|
$ |
1,481,742 |
|
|
$ |
1,331,463 |
|
|
$ |
1,193,330 |
|
|
$ |
1,146,947 |
|
|
$ |
1,096,669 |
|
|
|
|
|
|
|
|
|
|
|
|
|
|
|
|
|
|
|
|
|
|
|
|
|
|
|
|
Return on average tangible equity, excluding after-tax merger-related expenses (annualized) (2) |
|
|
8.18 |
% |
|
|
14.24 |
% |
|
|
13.50 |
% |
|
|
16.38 |
% |
|
|
16.56 |
% |
|
|
|
|
|
|
|
|
|
|
|
|
|
|
|
|
|
|
|
|
|
|
|
|
|
|
|
Efficiency ratio: |
|
|
|
|
|
|
|
|
|
|
|
|
|
|
|
|
|
|
|
|
|
|
|
Non-interest expense |
|
$ |
91,333 |
|
|
$ |
92,556 |
|
|
$ |
73,268 |
|
|
$ |
71,952 |
|
|
$ |
74,432 |
|
|
|
|
Less: restructuring and merger-related expense |
|
|
(5,164 |
) |
|
|
(11,522 |
) |
|
|
(1,688 |
) |
|
|
(81 |
) |
|
|
(3,107 |
) |
|
|
|
Non-interest expense excluding restructuring and merger-related expense |
|
|
86,169 |
|
|
|
81,034 |
|
|
|
71,580 |
|
|
|
71,871 |
|
|
|
71,325 |
|
|
|
|
|
|
|
|
|
|
|
|
|
|
|
|
|
|
|
|
|
|
|
|
|
|
|
|
Net interest income on a fully taxable equivalent basis |
|
|
121,346 |
|
|
|
108,177 |
|
|
|
97,385 |
|
|
|
99,827 |
|
|
|
99,834 |
|
|
|
|
Non-interest income |
|
|
28,009 |
|
|
|
30,838 |
|
|
|
26,950 |
|
|
|
31,156 |
|
|
|
27,773 |
|
|
|
|
Net interest income on a fully taxable equivalent basis plus non-interest income |
|
$ |
149,355 |
|
|
$ |
139,015 |
|
|
$ |
124,335 |
|
|
$ |
130,983 |
|
|
$ |
127,607 |
|
|
|
|
Efficiency Ratio |
|
|
57.69 |
% |
|
|
58.29 |
% |
|
|
57.57 |
% |
|
|
54.87 |
% |
|
|
55.89 |
% |
|
|
|
|
|
|
|
|
|
|
|
|
|
|
|
|
|
|
|
|
|
|
|
|
|
|
|
Net income, excluding after-tax merger-related expenses: |
|
|
|
|
|
|
|
|
|
|
|
|
|
|
|
|
|
|
|
|
|
|
|
Net income |
|
$ |
23,396 |
|
|
$ |
36,376 |
|
|
$ |
37,347 |
|
|
$ |
44,814 |
|
|
$ |
40,337 |
|
|
|
|
Add: After-tax merger-related expenses (1) |
|
|
4,080 |
|
|
|
9,102 |
|
|
|
1,334 |
|
|
|
64 |
|
|
|
2,454 |
|
|
|
|
Net income, excluding after-tax merger-related expenses |
|
$ |
27,476 |
|
|
$ |
45,478 |
|
|
$ |
38,681 |
|
|
$ |
44,878 |
|
|
$ |
42,791 |
|
|
|
|
|
|
|
|
|
|
|
|
|
|
|
|
|
|
|
|
|
|
|
|
|
|
|
|
Net Income, excluding after-tax merger-related expenses per diluted share: |
|
|
|
|
|
|
|
|
|
|
|
|
|
|
|
|
|
|
|
|
|
|
|
Net income per diluted share |
|
$ |
0.35 |
|
|
$ |
0.60 |
|
|
$ |
0.68 |
|
|
$ |
0.82 |
|
|
$ |
0.74 |
|
|
|
|
Add: After-tax merger-related expenses per diluted share (1) |
|
|
0.06 |
|
|
|
0.15 |
|
|
|
0.03 |
|
|
|
0.00 |
|
|
|
0.04 |
|
|
|
|
Net income, excluding after-tax merger-related expenses per diluted share |
|
$ |
0.41 |
|
|
$ |
0.75 |
|
|
$ |
0.71 |
|
|
$ |
0.82 |
|
|
$ |
0.78 |
|
|
WESBANCO, INC. |
|
Consolidated Selected Financial Highlights |
|
(unaudited, dollars in thousands) |
|
|
|
Period End |
|
|
|
|
Mar. 31, |
|
|
Dec. 31, |
|
|
Sept. 30, |
|
|
June 30, |
|
|
Mar. 31, |
|
|
|
|
2020 |
|
|
2019 |
|
|
2019 |
|
|
2019 |
|
|
2019 |
|
|
Tangible book value per share: |
|
|
|
|
|
|
|
|
|
|
|
|
|
|
|
|
|
|
|
|
|
Total shareholders' equity |
|
$ |
2,586,060 |
|
|
$ |
2,593,921 |
|
|
$ |
2,101,269 |
|
|
$ |
2,074,116 |
|
|
$ |
2,023,139 |
|
|
Less: goodwill and other intangible assets, net of def. tax liability |
|
|
(1,154,033 |
) |
|
|
(1,132,262 |
) |
|
|
(904,256 |
) |
|
|
(903,729 |
) |
|
|
(904,144 |
) |
|
Tangible equity |
|
|
1,432,027 |
|
|
|
1,461,659 |
|
|
|
1,197,013 |
|
|
|
1,170,387 |
|
|
|
1,118,995 |
|
|
|
|
|
|
|
|
|
|
|
|
|
|
|
|
|
|
|
|
|
|
|
|
Common shares outstanding |
|
|
67,058,155 |
|
|
|
67,824,428 |
|
|
|
54,691,225 |
|
|
|
54,697,199 |
|
|
|
54,599,127 |
|
|
|
|
|
|
|
|
|
|
|
|
|
|
|
|
|
|
|
|
|
|
|
|
Tangible book value per share |
|
$ |
21.36 |
|
|
$ |
21.55 |
|
|
$ |
21.89 |
|
|
$ |
21.40 |
|
|
$ |
20.49 |
|
|
|
|
|
|
|
|
|
|
|
|
|
|
|
|
|
|
|
|
|
|
|
|
Tangible equity to tangible assets: |
|
|
|
|
|
|
|
|
|
|
|
|
|
|
|
|
|
|
|
|
|
Total shareholders' equity |
|
$ |
2,586,060 |
|
|
$ |
2,593,921 |
|
|
$ |
2,101,269 |
|
|
$ |
2,074,116 |
|
|
$ |
2,023,139 |
|
|
Less: goodwill and other intangible assets, net of def. tax liability |
|
|
(1,154,033 |
) |
|
|
(1,132,262 |
) |
|
|
(904,256 |
) |
|
|
(903,729 |
) |
|
|
(904,144 |
) |
|
Tangible equity |
|
|
1,432,027 |
|
|
|
1,461,659 |
|
|
|
1,197,013 |
|
|
|
1,170,387 |
|
|
|
1,118,995 |
|
|
|
|
|
|
|
|
|
|
|
|
|
|
|
|
|
|
|
|
|
|
|
|
Total assets |
|
|
15,995,572 |
|
|
|
15,720,112 |
|
|
|
12,593,887 |
|
|
|
12,494,653 |
|
|
|
12,601,408 |
|
|
Less: goodwill and other intangible assets, net of def. tax liability |
|
|
(1,154,033 |
) |
|
|
(1,132,262 |
) |
|
|
(904,256 |
) |
|
|
(903,729 |
) |
|
|
(904,144 |
) |
|
Tangible assets |
|
$ |
14,841,539 |
|
|
$ |
14,587,850 |
|
|
$ |
11,689,631 |
|
|
$ |
11,590,924 |
|
|
$ |
11,697,264 |
|
|
|
|
|
|
|
|
|
|
|
|
|
|
|
|
|
|
|
|
|
|
|
|
Tangible equity to tangible assets |
|
|
9.65 |
% |
|
|
10.02 |
% |
|
|
10.24 |
% |
|
|
10.10 |
% |
|
|
9.57 |
% |
|
|
|
|
|
|
|
|
|
|
|
|
|
|
|
|
|
|
|
|
|
|
|
(1) Tax effected at 21% for all periods presented. |
|
|
|
|
|
|
|
|
|
|
|
|
|
|
|
|
|
|
|
|
|
(2) The ratios are annualized by utilizing actual number of days in the quarter versus the year. |
|
|
|
|
|
|
|
|
|
|
|
|
|
|
|
|
|
|
|
|
28 April 2020 First Quarter 2020 Earnings Conference Call
Forward-Looking Statements and Non-GAAP Financial Measures Forward-looking statements in this report relating to WesBanco’s plans, strategies, objectives, expectations, intentions and adequacy of resources, are made pursuant to the safe harbor provisions of the Private Securities Litigation Reform Act of 1995. The information contained in this report should be read in conjunction with WesBanco’s Form 10-K for the year ended December 31, 2019 and documents subsequently filed by WesBanco with the Securities and Exchange Commission (“SEC), which are available at the SEC’s website, www.sec.gov or at WesBanco’s website, www.WesBanco.com. Investors are cautioned that forward-looking statements, which are not historical fact, involve risks and uncertainties, including those detailed in WesBanco’s most recent Annual Report on Form 10-K filed with the SEC under “Risk Factors” in Part I, Item 1A. Such statements are subject to important factors that could cause actual results to differ materially from those contemplated by such statements, including, without limitation, the effects of changing regional and national economic conditions including the effects of the COVID-19 pandemic; changes in interest rates, spreads on earning assets and interest-bearing liabilities, and associated interest rate sensitivity; sources of liquidity available to WesBanco and its related subsidiary operations; potential future credit losses and the credit risk of commercial, real estate, and consumer loan customers and their borrowing activities; actions of the Federal Reserve Board, the Federal Deposit Insurance Corporation, the SEC, the Financial Institution Regulatory Authority, the Municipal Securities Rulemaking Board, the Securities Investors Protection Corporation, and other regulatory bodies; potential legislative and federal and state regulatory actions and reform, including, without limitation, the impact of the implementation of the Dodd-Frank Act; adverse decisions of federal and state courts; fraud, scams and schemes of third parties; cyber-security breaches; competitive conditions in the financial services industry; rapidly changing technology affecting financial services; marketability of debt instruments and corresponding impact on fair value adjustments; and/or other external developments materially impacting WesBanco’s operational and financial performance. WesBanco does not assume any duty to update forward-looking statements. In addition to the results of operations presented in accordance with Generally Accepted Accounting Principles (GAAP), WesBanco's management uses, and this presentation contains or references, certain non-GAAP financial measures, such as tangible common equity/tangible assets; net income excluding after-tax merger-related expenses; efficiency ratio; return on average assets; and return on average tangible equity. WesBanco believes these financial measures provide information useful to investors in understanding our operational performance and business and performance trends which facilitate comparisons with the performance of others in the financial services industry. Although WesBanco believes that these non-GAAP financial measures enhance investors' understanding of WesBanco's business and performance, these non-GAAP financial measures should not be considered an alternative to GAAP. The non-GAAP financial measures contained therein should be read in conjunction with the audited financial statements and analysis as presented in the Annual Report on Form 10-K as well as the unaudited financial statements and analyses as presented in the Quarterly Reports on Forms 10-Q for WesBanco and its subsidiaries, as well as other filings that the company has made with the SEC.
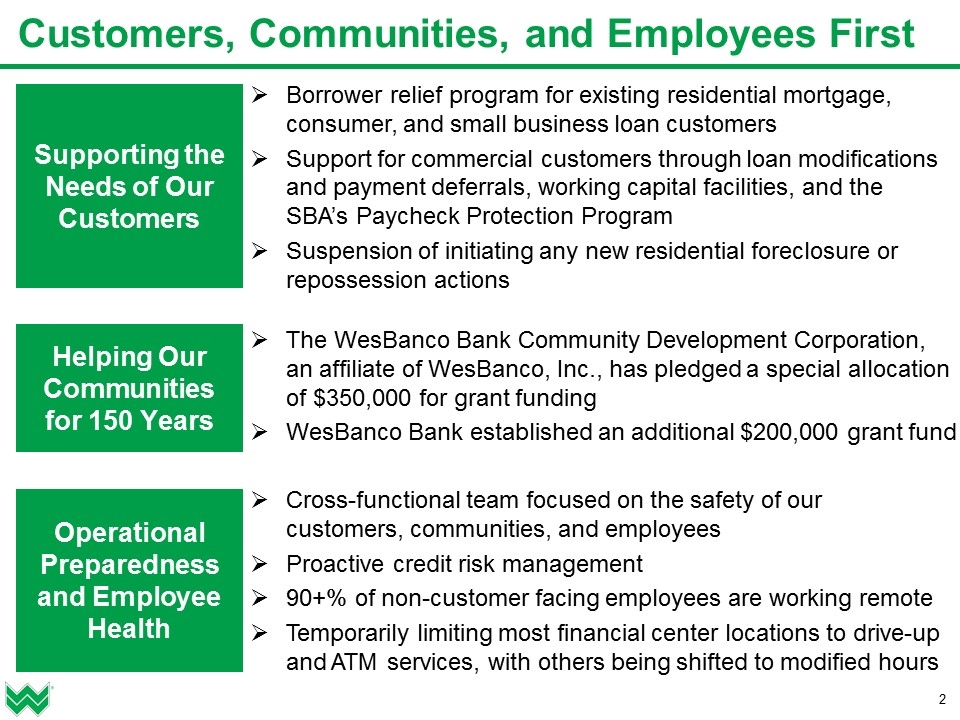
Customers, Communities, and Employees First Cross-functional team focused on the safety of our customers, communities, and employees Proactive credit risk management 90+% of non-customer facing employees are working remote Temporarily limiting most financial center locations to drive-up and ATM services, with others being shifted to modified hours Operational Preparedness and Employee Health Borrower relief program for existing residential mortgage, consumer, and small business loan customers Support for commercial customers through loan modifications and payment deferrals, working capital facilities, and the SBA’s Paycheck Protection Program Suspension of initiating any new residential foreclosure or repossession actions Supporting the Needs of Our Customers The WesBanco Bank Community Development Corporation, an affiliate of WesBanco, Inc., has pledged a special allocation of $350,000 for grant funding WesBanco Bank established an additional $200,000 grant fund Helping Our Communities for 150 Years
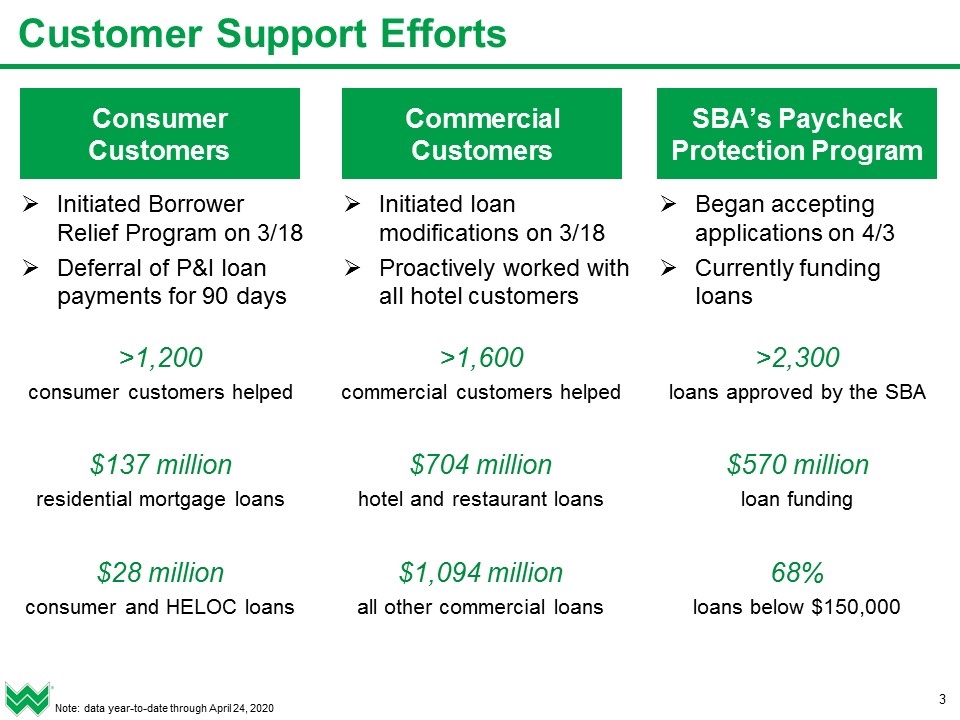
>1,200 consumer customers helped $137 million residential mortgage loans $28 million consumer and HELOC loans >2,300 loans approved by the SBA $570 million loan funding 68% loans below $150,000 Customer Support Efforts Consumer Customers Commercial Customers SBA’s Paycheck Protection Program Note: data year-to-date through April 24, 2020 Initiated Borrower Relief Program on 3/18 Deferral of P&I loan payments for 90 days Initiated loan modifications on 3/18 Proactively worked with all hotel customers Began accepting applications on 4/3 Currently funding loans >1,600 commercial customers helped $704 million hotel and restaurant loans $1,094 million all other commercial loans
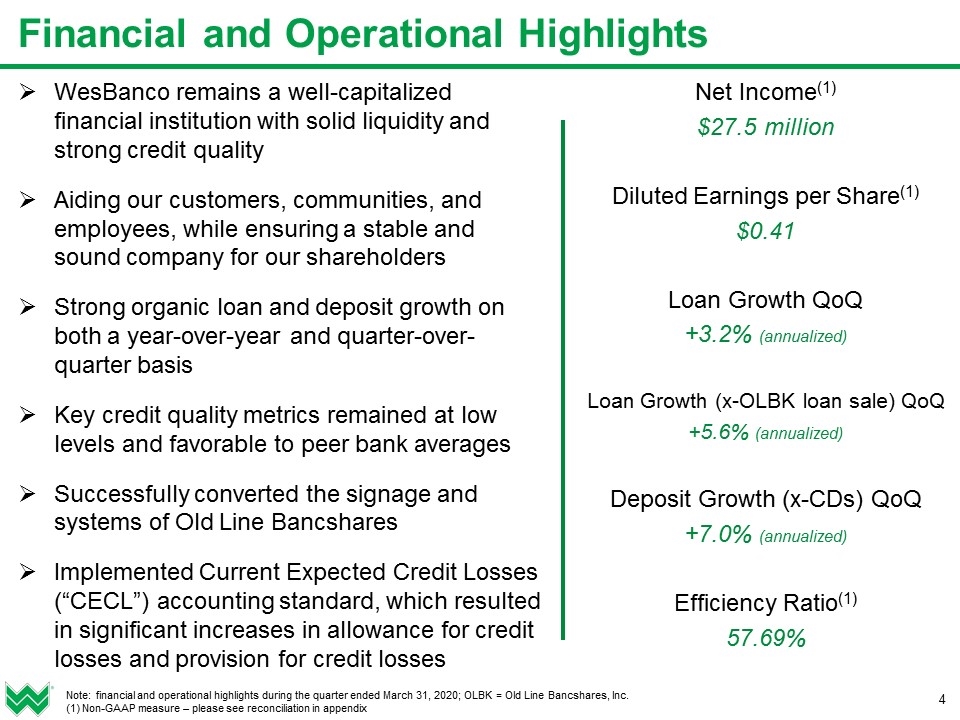
Financial and Operational Highlights Note: financial and operational highlights during the quarter ended March 31, 2020; OLBK = Old Line Bancshares, Inc. (1) Non-GAAP measure – please see reconciliation in appendix WesBanco remains a well-capitalized financial institution with solid liquidity and strong credit quality Aiding our customers, communities, and employees, while ensuring a stable and sound company for our shareholders Strong organic loan and deposit growth on both a year-over-year and quarter-over-quarter basis Key credit quality metrics remained at low levels and favorable to peer bank averages Successfully converted the signage and systems of Old Line Bancshares Implemented Current Expected Credit Losses (“CECL”) accounting standard, which resulted in significant increases in allowance for credit losses and provision for credit losses Net Income(1) $27.5 million Diluted Earnings per Share(1) $0.41 Loan Growth QoQ +3.2% (annualized) Loan Growth (x-OLBK loan sale) QoQ +5.6% (annualized) Deposit Growth (x-CDs) QoQ +7.0% (annualized) Efficiency Ratio(1) 57.69%
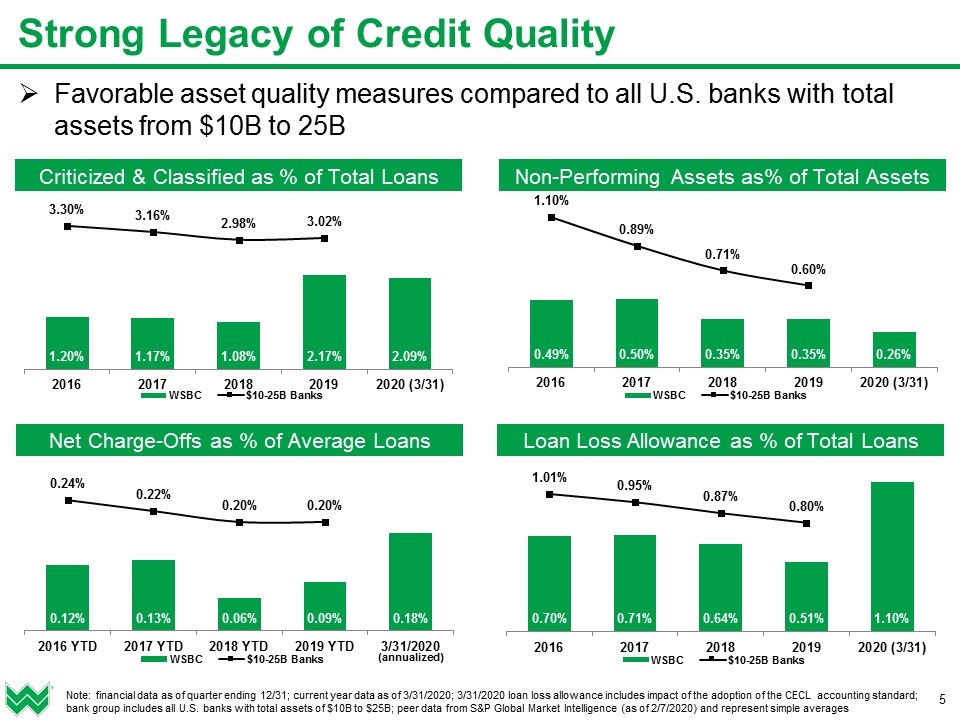
Non-Performing Assets as% of Total Assets Net Charge-Offs as % of Average Loans (annualized) Loan Loss Allowance as % of Total Loans Criticized & Classified as % of Total Loans Favorable asset quality measures compared to all U.S. banks with total assets from $10B to 25B Strong Legacy of Credit Quality Note: financial data as of quarter ending 12/31; current year data as of 3/31/2020; 3/31/2020 loan loss allowance includes impact of the adoption of the CECL accounting standard; bank group includes all U.S. banks with total assets of $10B to $25B; peer data from S&P Global Market Intelligence (as of 2/7/2020) and represent simple averages
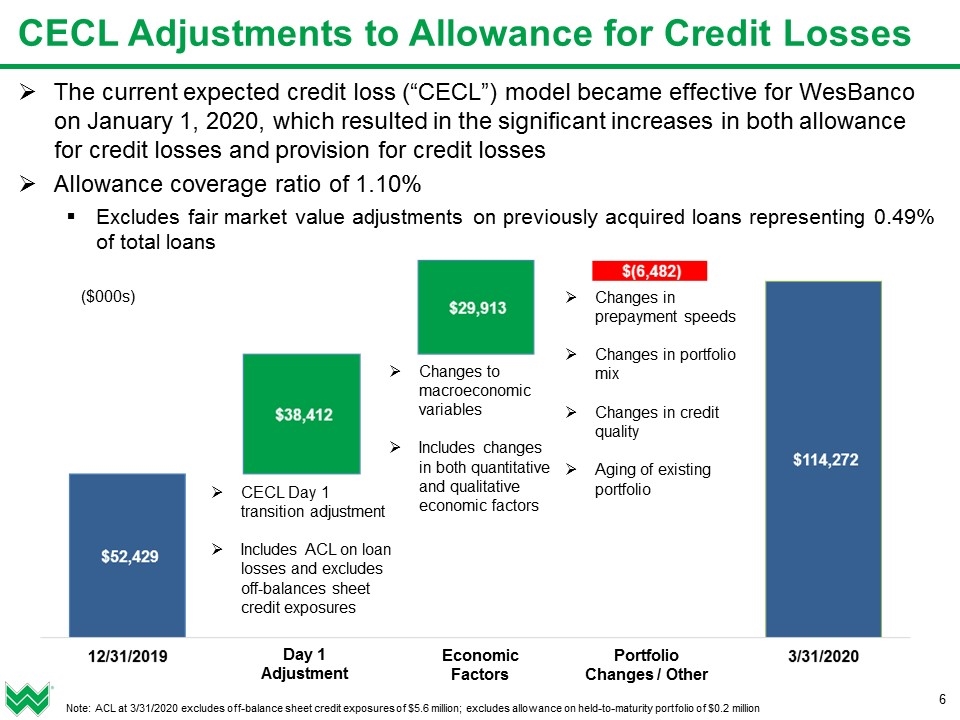
CECL Adjustments to Allowance for Credit Losses The current expected credit loss (“CECL”) model became effective for WesBanco on January 1, 2020, which resulted in the significant increases in both allowance for credit losses and provision for credit losses Allowance coverage ratio of 1.10% Excludes fair market value adjustments on previously acquired loans representing 0.49% of total loans Note: ACL at 3/31/2020 excludes off-balance sheet credit exposures of $5.6 million; excludes allowance on held-to-maturity portfolio of $0.2 million Day 1 Adjustment Portfolio Changes / Other Economic Factors CECL Day 1 transition adjustment Includes ACL on loan losses and excludes off-balances sheet credit exposures Changes to macroeconomic variables Includes changes in both quantitative and qualitative economic factors Changes in prepayment speeds Changes in portfolio mix Changes in credit quality Aging of existing portfolio ($000s)
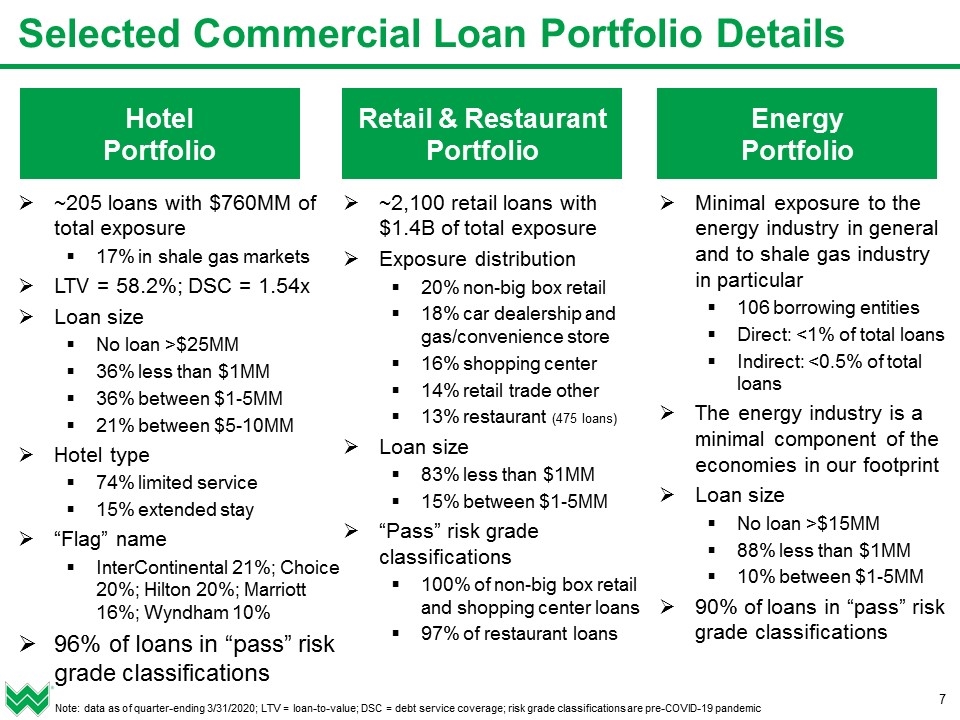
Selected Commercial Loan Portfolio Details Hotel Portfolio Retail & Restaurant Portfolio Energy Portfolio ~205 loans with $760MM of total exposure 17% in shale gas markets LTV = 58.2%; DSC = 1.54x Loan size No loan >$25MM 36% less than $1MM 36% between $1-5MM 21% between $5-10MM Hotel type 74% limited service 15% extended stay “Flag” name InterContinental 21%; Choice 20%; Hilton 20%; Marriott 16%; Wyndham 10% 96% of loans in “pass” risk grade classifications ~2,100 retail loans with $1.4B of total exposure Exposure distribution 20% non-big box retail 18% car dealership and gas/convenience store 16% shopping center 14% retail trade other 13% restaurant (475 loans) Loan size 83% less than $1MM 15% between $1-5MM “Pass” risk grade classifications 100% of non-big box retail and shopping center loans 97% of restaurant loans Minimal exposure to the energy industry in general and to shale gas industry in particular 106 borrowing entities Direct: <1% of total loans Indirect: <0.5% of total loans The energy industry is a minimal component of the economies in our footprint Loan size No loan >$15MM 88% less than $1MM 10% between $1-5MM 90% of loans in “pass” risk grade classifications Note: data as of quarter-ending 3/31/2020; LTV = loan-to-value; DSC = debt service coverage; risk grade classifications are pre-COVID-19 pandemic
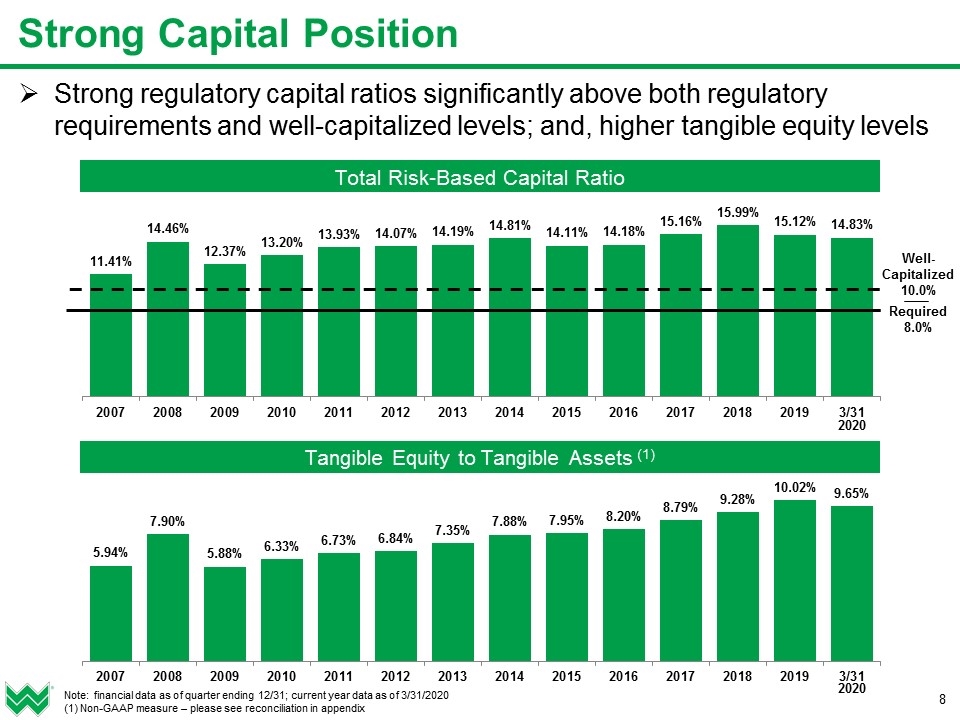
Strong Capital Position Strong regulatory capital ratios significantly above both regulatory requirements and well-capitalized levels; and, higher tangible equity levels Note: financial data as of quarter ending 12/31; current year data as of 3/31/2020 (1) Non-GAAP measure – please see reconciliation in appendix Tangible Equity to Tangible Assets (1) Total Risk-Based Capital Ratio Well-Capitalized 10.0% Required 8.0% 2020 2020
Appendix
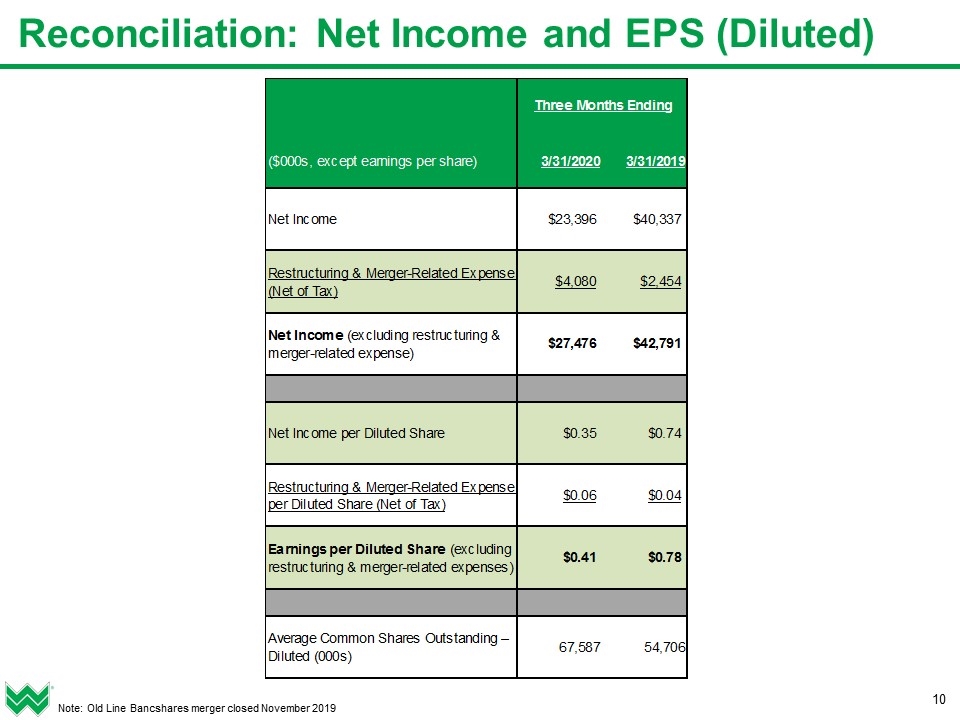
Reconciliation: Net Income and EPS (Diluted) Note: Old Line Bancshares merger closed November 2019
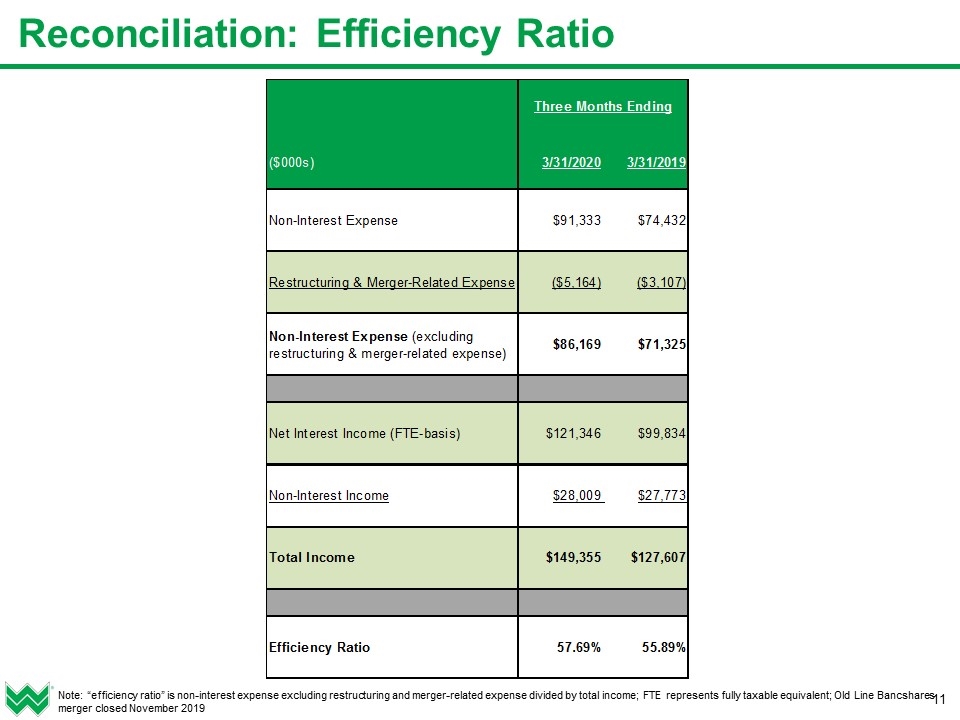
Reconciliation: Efficiency Ratio Note: “efficiency ratio” is non-interest expense excluding restructuring and merger-related expense divided by total income; FTE represents fully taxable equivalent; Old Line Bancshares merger closed November 2019
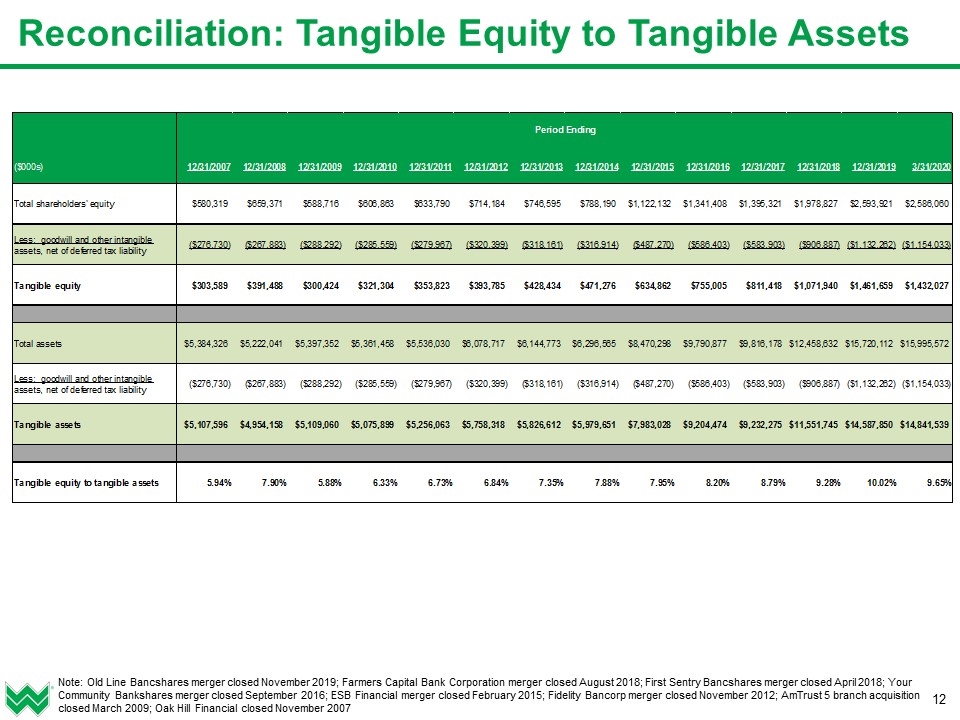
Reconciliation: Tangible Equity to Tangible Assets Note: Old Line Bancshares merger closed November 2019; Farmers Capital Bank Corporation merger closed August 2018; First Sentry Bancshares merger closed April 2018; Your Community Bankshares merger closed September 2016; ESB Financial merger closed February 2015; Fidelity Bancorp merger closed November 2012; AmTrust 5 branch acquisition closed March 2009; Oak Hill Financial closed November 2007