Exhibit 99.1
Wintrust Financial Corporation
9700 W. Higgins Road, Suite 800, Rosemont, Illinois 60018
News Release
FOR IMMEDIATE RELEASE | July 21, 2020 | |
FOR MORE INFORMATION CONTACT:
Edward J. Wehmer, Founder & Chief Executive Officer
David A. Dykstra, Vice Chairman & Chief Operating Officer
(847) 939-9000
Web site address: www.wintrust.com
Wintrust Financial Corporation Reports Second Quarter 2020 Net Income of $21.7 million and Year-to-Date Net Income of $84.5 million
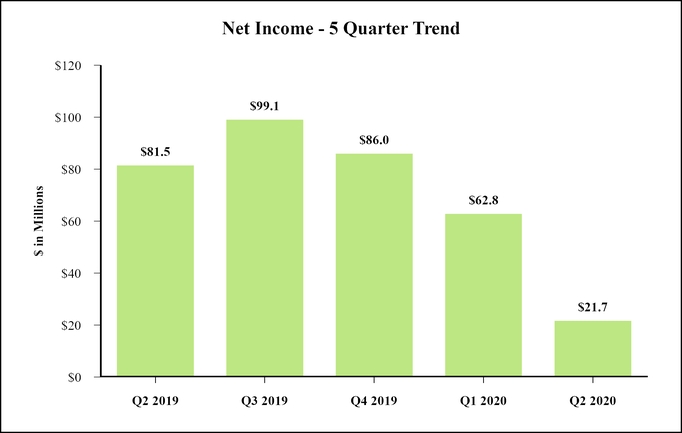
ROSEMONT, ILLINOIS – Wintrust Financial Corporation (“Wintrust” or “the Company”) (Nasdaq: WTFC) announced net income of $21.7 million or $0.34 per diluted common share for the second quarter of 2020, a decrease in diluted earnings per common share of 67.3% compared to the prior quarter and a decrease of 75.4% compared to the second quarter of 2019. The Company recorded net income of $84.5 million or $1.38 per diluted common share for the first six months of 2020 compared to net income of $170.6 million or $2.91 per diluted common share for the same period of 2019.
Highlights of the Second Quarter of 2020:
Comparative information to the first quarter of 2020
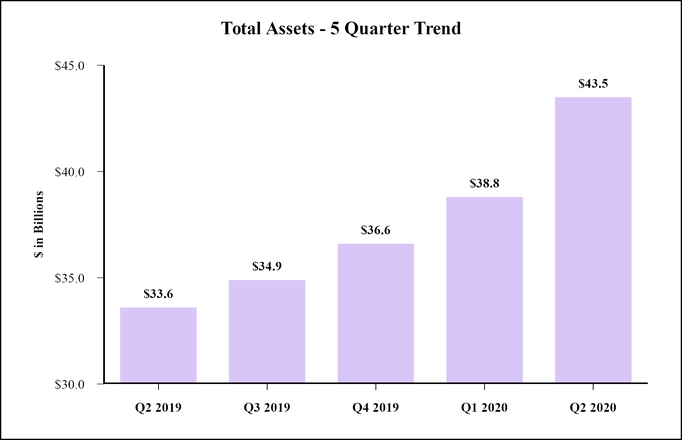
• | Total assets increased by $4.7 billion, including $3.3 billion of Paycheck Protection Program ("PPP") loans, net of fees. |
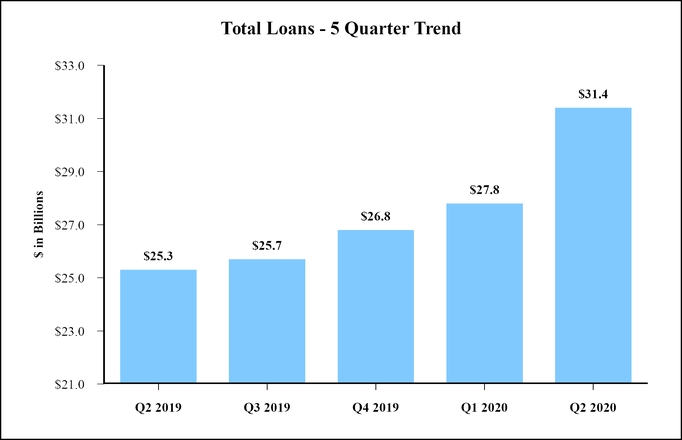
• | Total loans increased by $3.6 billion, including $3.3 billion of PPP loans, net of fees. |
◦ | Lines of credit utilization declined to approximately 49% at June 30, 2020 as compared to approximately 56% at March 31, 2020. |
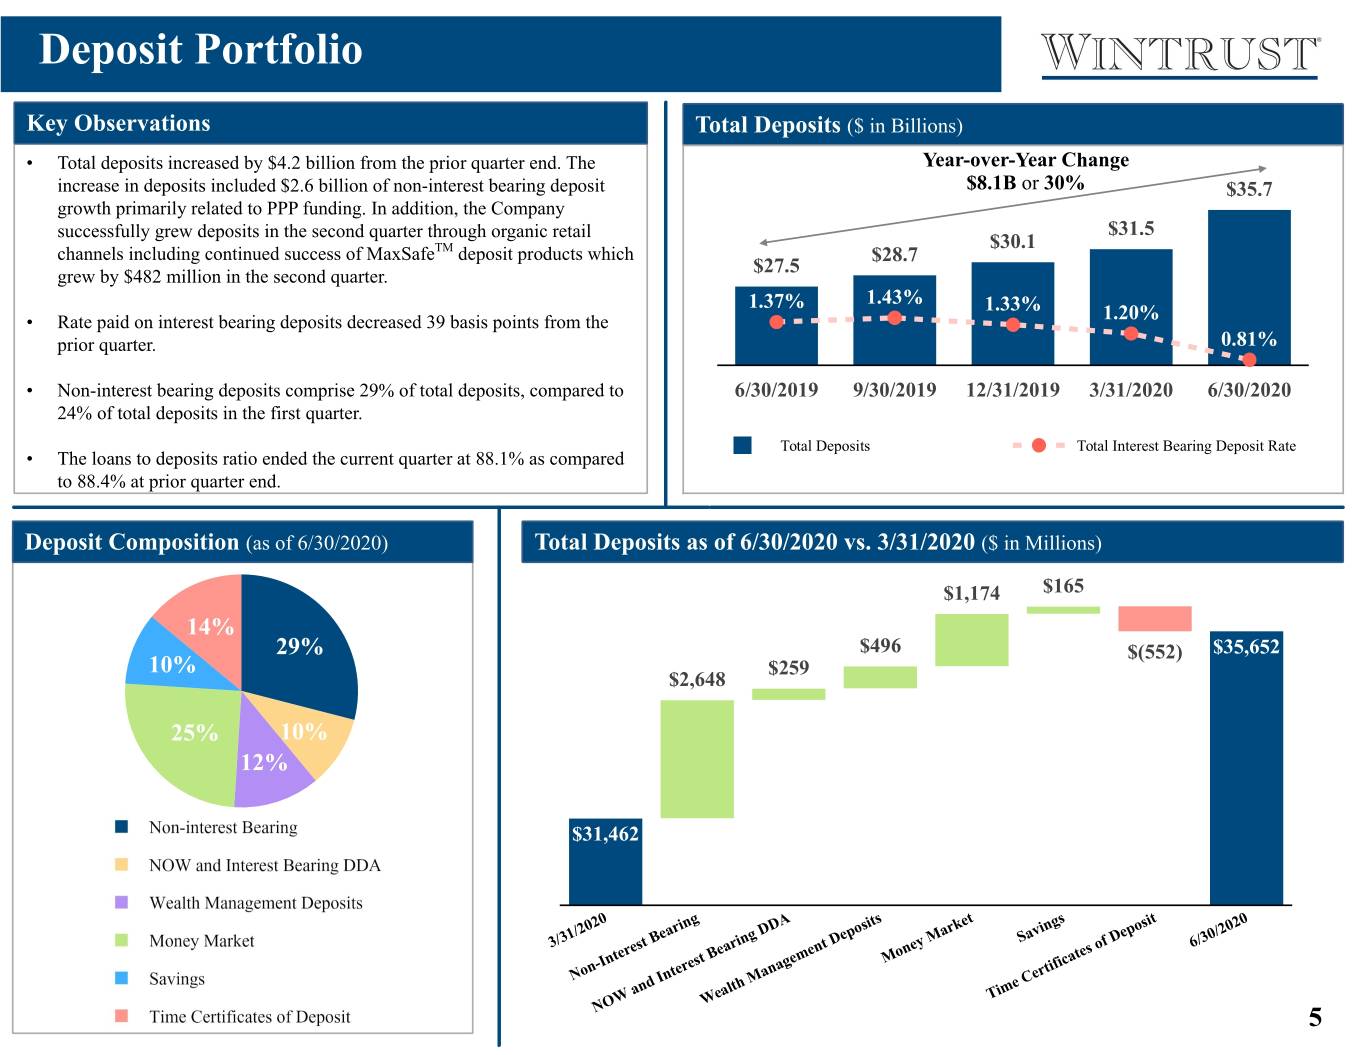
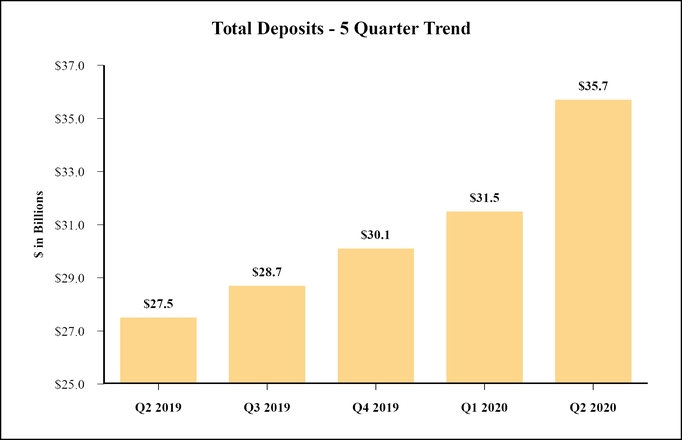
• | Total deposits increased by $4.2 billion, primarily related to both PPP lending and organic growth of retail deposits. |
• | Net interest income increased by $1.7 million as the impact of a $5.1 billion increase in average earning assets was partially offset by a 39 basis point decline in net interest margin. The decline in net interest margin was largely due to declining interest rates and excess short–term liquidity on the balance sheet. |
• | The loans to deposits ratio ended the second quarter of 2020 at 88.1% as compared to 88.4% at prior quarter end. Excluding PPP loans, the loans to deposits ratio ended the second quarter of 2020 at 78.7%. |
• | Mortgage banking revenue increased by $54.0 million to $102.3 million for the second quarter of 2020 as compared to $48.3 million in the prior quarter. |
◦ | Loans originated for sale in the second quarter of 2020 totaled $2.2 billion as compared to $1.2 billion in the prior quarter. |
◦ | Recorded a decrease in the value of mortgage servicing rights related to changes in fair value model assumptions, net of derivative contract activity held as an economic hedge, of $7.4 million in the second quarter of 2020 as compared to a decline of $10.4 million in the prior quarter. |
◦ | Accrued $7.2 million of additional contingent consideration expense related to the previous acquisitions of mortgage operations in the second quarter of 2020 as compared to $329,000 in the prior quarter, which was recorded in other non-interest expense. |
• | Provision for credit losses of $135.1 million in the second quarter of 2020. Provision for credit losses increased by $82.1 million from $53.0 million in the first quarter of 2020. The increased provision for credit losses expense in the second quarter of 2020 was primarily related to generally deteriorating forecasted economic conditions impacted by the COVID-19 pandemic which are an input in the Company's Current Expected Credit Loss ("CECL") models. |
• | Recorded net charge-offs of $15.4 million in the second quarter of 2020, of which $9.5 million were previously reserved for, as compared to net charge-offs of $5.3 million in the first quarter of 2020. |
• | Non-performing assets totaled $198.5 million as of June 30, 2020, or 0.46% of total assets, as compared to $190.4 million, or 0.49% of total assets, as of the prior quarter end. |
• | The allowance for credit losses on our core loan portfolio is approximately 1.85% of the outstanding balance as of June 30, 2020, up from 1.26% as of the prior quarter end. |
• | Incurred acquisition related costs of $4.9 million in the second quarter of 2020 as compared to $1.7 million in the first quarter of 2020. |
Other highlights of the second quarter of 2020
• | Paid $2.6 million of COVID-19 related salary incentives to non-executive personnel. |
• | Originated $3.4 billion of PPP loans which generated net fees of $91.0 million to be recognized over the estimated life of the PPP loans. Fees are recognized on a level yield basis which incorporates estimates of the timing of customer requested forgiveness, Small Business Administration ("SBA") approval of forgiveness and the repayment timing from the SBA. |
• | Recorded COVID-19 related loan modifications for customers with aggregate outstanding balances of approximately $1.7 billion or 9% of total loans, excluding PPP loans and premium finance receivables. The modifications primarily changed terms to interest-only payments or full payment deferrals. |
• | Completed a preferred stock issuance which generated proceeds of $278.4 million, net of the underwriting discount, which contributed to increasing estimated Tier 1 and Total Capital ratios to 10.1% and 12.8%, respectively. |
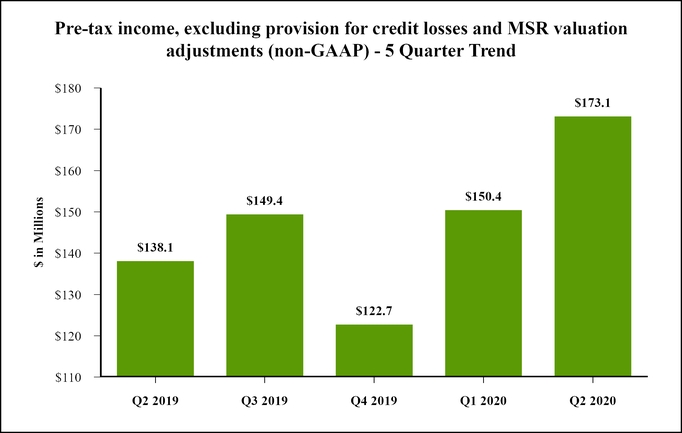
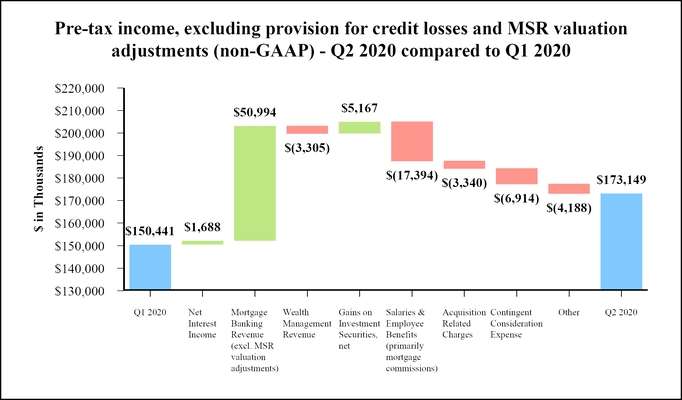
Edward J. Wehmer, Founder and Chief Executive Officer, commented, "I am very proud of the extraordinary effort put forth by our employees to support our customers and our communities amid the challenges of COVID-19. Wintrust reported net income of $21.7 million for the second quarter of 2020, down from $62.8 million in the first quarter of 2020. However, pre-tax income, excluding provision for credit losses and MSR valuation adjustments (non-GAAP), increased by $22.7 million over the previous quarter and $35.0 million over the second quarter of 2019. The Company experienced strong balance sheet growth as total assets were $4.7 billion higher than the prior quarter end and $9.9 billion higher than the end of the second quarter of 2019. The second quarter of 2020 was characterized by significant balance sheet growth, declining net interest margin, strong mortgage banking revenue, increased provision for credit losses and a continued focus to increase franchise value in our market area."
Mr. Wehmer continued, "The Company grew total loans by $3.6 billion in the second quarter of 2020 including $3.3 billion related to PPP lending. The Company experienced significant growth in its commercial insurance premium finance and life insurance premium finance receivable portfolios partially offset by a decline in its commercial portfolio. Growth in the commercial insurance premium finance portfolio was in part due to hardening insurance market conditions driving the average size of new commercial insurance premium finance receivables to approximately $38,000 in the second quarter as compared to $31,000 in the first quarter of 2020. The decline in the commercial loan portfolio is primarily attributed to paydowns in the second quarter of 2020 related to both existing customers receiving PPP loans and repayment of balances that were drawn in the first quarter of 2020. As a result, credit line utilization was approximately 49% at June 30, 2020 as compared to approximately 56% at March 31, 2020. Total deposits increased by $4.2 billion as compared to the first quarter of 2020 including $2.6 billion of non-interest bearing deposit growth primarily related to PPP lending. In addition, the Company continued to grow organic retail deposits including its MaxSafeTM deposit products which grew by $482 million in the second quarter of 2020. Our loans to deposits ratio ended the quarter at 88.1% and we are confident that we have sufficient liquidity to meet customer loan demand."
Mr. Wehmer commented, "Net interest income increased in the second quarter of 2020 primarily due to earning asset growth but was partially offset by a 39 basis point decline in the net interest margin. The decline in net interest margin was primarily due to downward repricing of variable rate loans and an increase in interest bearing cash balances, partially offset by favorable repricing of interest bearing deposits and accretion of PPP fees. At this point, the majority of our variable rate loan portfolio has repriced to reflect the low interest rate environment. As such, excluding the impact of PPP fees, we expect to be able to mitigate potential future loan yield compression with improvement in pricing on interest bearing deposits. Further, to the extent we identify prudent opportunities to deploy excess liquidity, we may be able to improve net interest margin."
Mr. Wehmer noted, “Our mortgage banking business delivered a record quarter of mortgage banking revenue in light of the demand associated with historically low long-term interest rates. Loan volumes originated for sale in the second quarter of 2020 were $2.2 billion, as compared to $1.2 billion in the first quarter of 2020. As a result of increases in both current and forecasted revenues given the favorable mortgage banking environment, the Company recorded increased contingent consideration expense related to the previous acquisitions of mortgage operations. Additionally, the Company recorded a $7.4 million decrease in the value of mortgage servicing rights related to changes in fair value model assumptions, net of derivative contract activity held as an economic hedge. We are leveraging efficiencies in our delivery channels and staffing strategies to keep pace with unprecedented demand. The strong quarter of mortgage performance contributed to reporting a 0.93% net overhead ratio for the second quarter of 2020. We believe the third quarter of 2020 will provide another strong quarter for mortgage banking production."
Commenting on credit quality, Mr. Wehmer stated, "The Company recorded provision for credit losses of $135.1 million in the second quarter primarily related to generally deteriorating forecasted economic conditions impacted by the COVID-19 pandemic. Net charge-offs totaled $15.4 million in the second quarter of 2020, of which $9.5 million were previously reserved for, as compared to $5.3 million in the first quarter of 2020. The level of non-performing assets increased by $8.1 million to $198.5 million. The
2
allowance for credit losses on our core loan portfolio is approximately 1.85% of the outstanding balance. We believe that the Company’s reserves remain appropriate and we remain diligent in our review of credit."
Mindful of the challenges ahead, Mr. Wehmer noted, "We leverage robust capital and liquidity management frameworks, which include stress testing processes, to assess and monitor risk and inform decision making. In the second quarter of 2020, we completed a preferred stock issuance to bolster our capital position. We believe the Company has adequate liquidity and capital to effectively manage through the COVID-19 pandemic."
Mr. Wehmer concluded, "We remain committed to supporting our community, including the well-being and safety of our customers and employees. We believe that our opportunities for both internal and external growth remain consistently strong and were particularly enhanced as a result of our successful participation in PPP lending. However, we continue to carefully monitor the COVID-19 pandemic and evaluate the impact that it could have on the economy, our customers and our business. We remain focused on navigating the current environment by actively monitoring and managing our credit portfolio."
3
The graphs below illustrate certain financial highlights of the second quarter of 2020. See "Supplemental Non-GAAP Financial Measures/Ratios" at Table 18 for additional information with respect to non-GAAP financial measures/ratios, including the reconciliations to the corresponding GAAP financial measures/ratios.
4

5
6

7
SUMMARY OF RESULTS:
BALANCE SHEET
Total asset growth of $4.7 billion in the second quarter of 2020 was primarily comprised of a $3.6 billion increase in loans and a $2.1 billion increase in interest bearing deposits with banks, partially offset by a $513 million decrease in investment securities and a $502 million decrease in trade date securities receivables. The Company believes that the $4.0 billion of interest bearing deposits with banks held as of June 30, 2020 provides more than sufficient liquidity to operate its business plan.
Total liabilities grew by $4.5 billion in the second quarter of 2020 resulting primarily from a $4.2 billion increase in total deposits. The increase in deposits included $2.6 billion of non-interest bearing deposit growth primarily related to PPP funding. In addition, the Company successfully grew deposits in the second quarter through organic retail channels including continued success of MaxSafeTM deposit products which grew by $482 million in the second quarter. Our loans to deposits ratio ended the quarter at 88.1%. Management believes in substantially funding the Company's balance sheet with core deposits and utilizes brokered or wholesale funding sources as appropriate to manage its liquidity position as well as for interest rate risk management purposes.
For more information regarding changes in the Company’s balance sheet, see Consolidated Statements of Condition and Tables 1 through 3 in this report.
NET INTEREST INCOME
For the second quarter of 2020, net interest income totaled $263.1 million, an increase of $1.7 million as compared to the first quarter of 2020 and a decrease of $3.1 million as compared to the second quarter of 2019. The $1.7 million increase in net interest income in the second quarter of 2020 compared to the first quarter of 2020 was attributable to the impact of a $5.1 billion increase in average earning assets. This impact was partially offset by a 39 basis point decline in net interest margin.
Net interest margin was 2.73% (2.74% on a fully taxable-equivalent basis, non-GAAP) during the second quarter of 2020 compared to 3.12% (3.14% on a fully taxable-equivalent basis, non-GAAP) during the first quarter of 2020 and 3.62% (3.64% on a fully taxable-equivalent basis, non-GAAP) during the second quarter of 2019. The 39 basis point decrease in net interest margin in the second quarter of 2020 as compared to the first quarter of 2020 was attributable to a 68 basis point decline in the yield on earnings assets and a seven basis point decrease in the net free funds contribution partially offset by a 36 basis point decrease in the rate paid on interest bearing liabilities. The 68 basis point decline in the yield on earning assets in the second quarter as compared to the first quarter of 2020 was primarily due to a 60 basis point decline in the yield on loans along with an increased balance and reduced yield on interest bearing cash. The 36 basis point decrease in the rate paid on interest bearing liabilities in the second quarter as compared to the prior quarter is primarily due to a 39 basis point decrease in the rate paid on interest bearing deposits as management initiated various deposit rate reductions given the decreased interest rate environment.
For more information regarding net interest income, see Tables 4 through 8 in this report.
ASSET QUALITY
The allowance for credit losses totaled $373.2 million as of June 30, 2020 an increase of $119.7 million as compared to $253.5 million as of March 31, 2020. A summary of the allowance for loan losses calculated for the loan components in the core loan portfolio, the niche and consumer loan portfolio and purchased loan portfolio as of June 30, 2020 and March 31, 2020 is shown on Table 12 of this report.
The provision for credit losses totaled $135.1 million for the second quarter of 2020 compared to $53.0 million for the first quarter of 2020 and $24.6 million for the second quarter of 2019. The increased provision for credit losses expense in the second quarter was primarily related to generally deteriorating forecasted economic conditions impacted by the COVID-19 pandemic. Specifically, the negative impact of the COVID-19 pandemic on the projected commercial real-estate price index materially impacted the modeled losses from the commercial real-estate portfolio. Management believes the allowance for credit losses is appropriate to account for expected credit losses. The CECL standard requires the Company to estimate expected credit losses over the life of the Company’s financial assets at a certain point in time. There can be no assurances, however, that future losses will not significantly exceed the amounts provided for, thereby affecting future results of operations. For more information regarding the provision for credit losses, see Table 11 in this report.
Net charge-offs totaled $15.4 million in the second quarter of 2020, a $10.1 million increase from $5.3 million in the first quarter of 2020 and a $6.9 million decrease from $22.3 million in the second quarter of 2019. Net charge-offs as a percentage of average total loans, in the second quarter of 2020 totaled 20 basis points on an annualized basis compared to eight basis points on an
8
annualized basis in the first quarter of 2020 and 36 basis points on an annualized basis in the second quarter of 2019. For more information regarding net charge-offs, see Table 10 in this report.
As of June 30, 2020, $79.3 million of all loans, or 0.3%, were 60 to 89 days past due and $166.4 million, or 0.5%, were 30 to 59 days (or one payment) past due. As of March 31, 2020, $33.0 million of all loans, or 0.1%, were 60 to 89 days past due and $262.7 million, or 0.9%, were 30 to 59 days (or one payment) past due. Many of the commercial and commercial real-estate loans shown as 60 to 89 days and 30 to 59 days past due are included on the Company’s internal problem loan reporting system. Loans on this system are closely monitored by management on a monthly basis.
The Company’s home equity and residential loan portfolios continue to exhibit low delinquency rates as of June 30, 2020. Home equity loans at June 30, 2020 that are current with regard to the contractual terms of the loan agreement represent 98.2% of the total home equity portfolio. Residential real estate loans at June 30, 2020 that are current with regards to the contractual terms of the loan agreements comprised 98.2% of total residential real estate loans outstanding. For more information regarding past due loans, see Table 13 in this report.
In the second quarter of 2020, the Company recorded $1.7 billion of COVID-19 related loan modifications. These loan modifications were comprised primarily of $882.1 million commercial loans and $822.6 million commercial real-estate loans. The modifications primarily changed terms to interest-only payments or full payment deferrals.
Prior to January 1, 2020, purchased credit impaired ("PCI") loans were aggregated into pools by common risk characteristics for accounting purposes, including recognition of interest income on a pool basis. Measurement of any allowance for loan losses on these loans were offset by the remaining credit discount related to the pool. As a result of the implementation of CECL, beginning in the first quarter of 2020, PCI loans transitioned to a classification of purchased financial assets with credit deterioration ("PCD"), which no longer maintains the prior pools and related accounting concepts. Measurement of any allowance for loan losses on PCD loans is no longer offset by the remaining discount, resulting in additional allowance being recognized at January 1, 2020 through a cumulative effect adjustment to retained earnings. See Table 10 for information on this increase at transition. Additionally, recognition of interest income on PCD loans is considered at the individual asset level following the Company's accrual policies, instead of based upon the entire pool of loans. Due to the first quarter of 2020 adoption of CECL, the Company included $30.3 million in non-performing PCD loans in total non-performing loans as of June 30, 2020.
The ratio of non-performing assets to total assets was 0.46% as of June 30, 2020, compared to 0.49% at March 31, 2020, and 0.40% at June 30, 2019. Non-performing assets totaled $198.5 million at June 30, 2020, compared to $190.4 million at March 31, 2020 and $133.5 million at June 30, 2019. Non-performing loans totaled $188.3 million, or 0.60% of total loans, at June 30, 2020 compared to $179.4 million, or 0.65% of total loans, at March 31, 2020 and $113.4 million, or 0.45% of total loans, at June 30, 2019. The increase in non-performing loans in the second quarter of 2020 as compared to the prior quarter is primarily due to a $14.5 million increase in total non-performing premium finance receivable balances. State emergency orders and pandemic delays on processing of return premiums, which serve as our collateral, contributed to the increase in 90 day past due premium finance receivables. Other real estate owned ("OREO") of $10.2 million at June 30, 2020 decreased by $829,000 compared to $11.0 million at March 31, 2020 and decreased $9.6 million compared to $19.8 million at June 30, 2019. Management is pursuing the resolution of all non-performing assets. At this time, management believes OREO is appropriately valued at the lower of carrying value or fair value less estimated costs to sell. For more information regarding non-performing assets, see Table 14 in this report.
NON-INTEREST INCOME
Wealth management revenue decreased by $3.3 million during the second quarter of 2020 as compared to the first quarter of 2020 primarily due to decreased asset management fees, trust fees and brokerage commissions. Declines in asset management and trust fees are primarily due to volatile equity markets since year end. Brokerage commissions were negatively impacted in the second quarter of 2020 due to lower transactional volume as compared to the prior quarter. Wealth management revenue is comprised of the trust and asset management revenue of The Chicago Trust Company and Great Lakes Advisors, the brokerage commissions, managed money fees and insurance product commissions at Wintrust Investments and fees from tax-deferred like-kind exchange services provided by the Chicago Deferred Exchange Company.
Mortgage banking revenue increased by $54.0 million in the second quarter of 2020 as compared to the first quarter of 2020, primarily as a result of a $1.0 billion increase in loans originated for sale. Loans originated for sale were $2.2 billion in the second quarter of 2020 as compared to $1.2 billion in the first quarter of 2020. The percentage of origination volume from refinancing activities was 70% in the second quarter of 2020 as compared to 63% in the first quarter of 2020. Mortgage banking revenue includes revenue from activities related to originating, selling and servicing residential real estate loans for the secondary market.
9
During the second quarter of 2020, the fair value of the mortgage servicing rights portfolio increased primarily due to increased capitalization of $20.4 million during the second quarter. This increase was partially offset by a negative fair value adjustment of $8.0 million as well as a reduction in value of $8.7 million due to payoffs and paydowns of the existing portfolio. The Company entered into interest rate swaps at the beginning of the fourth quarter of 2019 to economically hedge a portion of the potential negative fair value changes recorded in earnings related to its mortgage servicing rights portfolio. The Company recorded a gain of $589,000 on the interest rate swaps held as economic hedges against the mortgage servicing rights primarily related to the mark to market valuation adjustment which was recorded in mortgage banking revenue. During the second quarter of 2020, the Company terminated the interest rate swaps. No economic hedges were outstanding relative to the mortgage servicing rights portfolio at the end of the second quarter of 2020.
The net gains recognized on investment securities in the second quarter of 2020 were $808,000 as compared to a net loss of $4.4 million in the first quarter of 2020. The gains recorded in the second quarter of 2020 primarily relate to unrealized gains on market sensitive securities held by the Company.
Other non-interest income decreased by $3.6 million in the second quarter of 2020 as compared to the first quarter of 2020 primarily due to lower card and merchant services based fees, gains realized on the sales of loan and leases in the first quarter of 2020 and losses on investment partnerships in the second quarter. These decreases were partially offset by market gains on BOLI investments related to non-qualified deferred compensation accounts recorded in BOLI income.
For more information regarding non-interest income, see Tables 15 and 16 in this report.
NON-INTEREST EXPENSE
Salaries and employee benefits expense increased by $17.4 million in the second quarter of 2020 as compared to the first quarter of 2020. The $17.4 million increase is comprised of an increase of $14.6 million in commissions and incentive compensation and an increase of $5.8 million in salaries expense partially offset by a $3.0 million decrease in employee benefits expense. The increase in commissions and incentive compensation is primarily due to increased origination volume associated with the Company's mortgage business. The increase in salaries expense is primarily related to COVID-19 related salary incentives, the impact of a full quarter of annual merit increases, increased staffing to support mortgage origination and an increase in costs related to deferred compensation plans impacted by market returns of related BOLI investments.
Data processing expenses totaled $10.4 million in the second quarter of 2020, an increase of $2.0 million as compared to the first quarter of 2020. The increase in the second quarter relates primarily to conversion costs of $4.5 million associated with the Countryside Bank acquisition as compared to $1.4 million of acquisition related conversion costs in the prior quarter. No additional material conversion charges are anticipated related to any completed acquisitions.
Advertising and marketing expenses in the second quarter of 2020 decreased by $3.2 million as compared to the first quarter of 2020 primarily related to lower sports sponsorship costs due to shortened or canceled seasons. Marketing costs are incurred to promote the Company's brand, commercial banking capabilities, the Company's various products, to attract loans and deposits and to announce new branch openings as well as the expansion of the Company's non-bank businesses. The level of marketing expenditures depends on the timing of sponsorship programs utilized which are determined based on the market area, targeted audience, competition and various other factors.
FDIC insurance expense totaled $7.1 million in the second quarter of 2020, an increase of $2.9 million as compared to the first quarter of 2020. This increase is primarily due to higher assessment rates impacted by declines in the Tier 1 Leverage Ratio at the Company's bank affiliates as a result of asset growth, including PPP loans.
Miscellaneous expense in the second quarter of 2020 increased $3.6 million as compared to the first quarter of 2020. The increase in the second quarter is primarily due to $7.2 million of contingent consideration expense accrued in the second quarter, as compared to $329,000 in the prior quarter, related to the previous acquisitions of mortgage operations. The increase in the contingent consideration accrual is a result of higher anticipated payments resulting from increases in both current and forecasted revenues related to the acquired businesses due to the favorable mortgage banking environment. Miscellaneous expense includes ATM expenses, correspondent bank charges, directors fees, telephone, travel and entertainment, corporate insurance, dues and subscriptions, problem loan expenses and lending origination costs that are not deferred.
For more information regarding non-interest expense, see Table 17 in this report.
10
INCOME TAXES
The Company recorded income tax expense of $9.0 million in the second quarter of 2020 compared to $24.3 million in the first quarter of 2020 and $28.7 million in the second quarter of 2019. The effective tax rates were 29.46% in the second quarter of 2020 compared to 27.87% in the first quarter of 2020 and 26.06% in the second quarter of 2019.
BUSINESS UNIT SUMMARY
Community Banking
Through its community banking unit, the Company provides banking and financial services primarily to individuals, small to mid-sized businesses, local governmental units and institutional clients residing primarily in the local areas the Company services. In the second quarter of 2020, this unit expanded its loan and deposit portfolios. However, the banking segment also experienced net interest margin compression in part due to low and declining interest rates and possession of excess short-term liquidity.
Mortgage banking revenue was $102.3 million for the second quarter of 2020 an increase of $54.0 million as compared to the first quarter of 2020 primarily due to increased mortgage demand associated with historically low long-term interest rates. Services charges on deposit accounts totaled $10.4 million in the second quarter of 2020 a decrease of $845,000 as compared to the first quarter of 2020 primarily due to lower overdraft fees. The Company's gross commercial and commercial real estate loan pipelines remained strong as of June 30, 2020. Before the impact of scheduled payments and prepayments, gross commercial and commercial real estate loan pipelines were estimated to be approximately $1.1 billion to $1.2 billion at June 30, 2020. When adjusted for the probability of closing, the pipelines were estimated to be approximately $700 million to $800 million at June 30, 2020.
Specialty Finance
Through its specialty finance unit, the Company offers financing of insurance premiums for businesses and individuals, equipment financing through structured loans and lease products to customers in a variety of industries and accounts receivable financing, as well as value-added, out-sourced administrative services and other services. Originations within the insurance premium financing receivables portfolio were $3.1 billion during the second quarter of 2020 and average balances increased by $422.7 million as compared to the first quarter of 2020. Growth in the commercial insurance premium finance portfolio was in part due to hardening insurance market conditions driving the average size of new commercial insurance premium finance receivables to approximately $38,000 in the second quarter as compared to $31,000 in the first quarter of 2020. The increase in average balances was more than offset by margin compression in this portfolio resulting in a $4.2 million decrease in interest income attributed to the lower market rates of interest associated with the insurance premium finance receivables portfolio. The Company's leasing business grew during the second quarter of 2020, with its portfolio of assets, including capital leases, loans and equipment on operating leases, increasing by $231.2 million to $2.0 billion at the end of the second quarter of 2020. Revenues from the Company's out-sourced administrative services business were $933,000 in the second quarter of 2020, a decrease of $179,000 from the first quarter of 2020.
Wealth Management
Through four separate subsidiaries within its wealth management unit, the Company offers a full range of wealth management services, including trust and investment services, tax-deferred like-kind exchange services, asset management, securities brokerage services and 401(k) and retirement plan services. Wealth management revenue decreased by $3.3 million in the second quarter of 2020 compared to the first quarter of 2020, totaling $22.6 million in the second period. Declines in asset management and trust fees are primarily due to volatile equity markets since year end. Brokerage commissions were negatively impacted in the second quarter of 2020 due to lower transactional volume as compared to the prior quarter. At June 30, 2020, the Company’s wealth management subsidiaries had approximately $27.0 billion of assets under administration, which included $3.9 billion of assets owned by the Company and its subsidiary banks, representing a $2.0 billion increase from the $25.0 billion of assets under administration at March 31, 2020.
11
ITEMS IMPACTING COMPARATIVE FINANCIAL RESULTS
Paycheck Protection Program
On March 27, 2020, the President of the United States signed the CARES Act which authorized the SBA to guarantee loans under the PPP for small businesses who meet the necessary eligibility requirements in order to keep their workers on the payroll. The Company began accepting applications on April 3, 2020. As of June 30, 2020, the Company secured authorization from the SBA and funded over 11,000 PPP loans with a carrying balance of approximately $3.3 billion.
Acquisitions
On November 1, 2019, the Company completed its acquisition of SBC, Incorporated (“SBC”). SBC was the parent company of Countryside Bank. Through this business combination, the Company acquired Countryside Bank's six banking offices located in Countryside, Burbank, Darien, Homer Glen, Oak Brook and Chicago, Illinois. As of the acquisition date, the Company acquired approximately $620 million in assets, including approximately $423 million in loans, and approximately $508 million in deposits. The Company recorded goodwill of approximately $40 million on the acquisition.
On October 7, 2019, the Company completed its acquisition of STC Bancshares Corp. (“STC”). STC was the parent company of STC Capital Bank. Through this business combination, the Company acquired STC Capital Bank's five banking offices located in the communities of St. Charles, Geneva and South Elgin, Illinois. As of the acquisition date, the Company acquired approximately $250 million in assets, including approximately $174 million in loans, and approximately $201 million in deposits. The Company recorded goodwill of approximately $19 million on the acquisition.
On May 24, 2019, the Company completed its acquisition of Rush-Oak Corporation ("ROC"). ROC was the parent company of Oak Bank. Through this business combination, the Company acquired Oak Bank's one banking location in Chicago, Illinois. As of the acquisition date, the Company acquired approximately $223 million in assets, including approximately $125 million in loans, and approximately $161 million in deposits. The Company recorded goodwill of approximately $12 million on the acquisition.
Adoption of New Credit Losses Accounting Standard
Beginning in 2020, the Company adopted the new current expected credit losses standard, or CECL, which impacted the measurement of the Company’s allowance for credit losses (including the allowance for unfunded lending-related commitments). CECL replaced the previous incurred loss methodology, which delayed recognition until such loss was probable, with a methodology that reflects an estimate of lifetime expected credit losses considering current economic condition and forecasts. Though other assets, including investment securities and other receivables, were considered in-scope of the standard and required a measurement of the allowance for credit loss, the most significant impact of CECL remains within the Company’s loan portfolios and related lending commitments. For more information regarding the adoption of CECL, see the "Asset Quality" section and the asset quality Tables 10-14 in this report.
12
WINTRUST FINANCIAL CORPORATION
Key Operating Measures
Wintrust’s key operating measures and growth rates for the second quarter of 2020, as compared to the first quarter of 2020 (sequential quarter) and second quarter of 2019 (linked quarter), are shown in the table below:
% or(4) basis point (bp) change from 1st Quarter 2020 | % or basis point (bp) change from 2nd Quarter 2019 | ||||||||||||||||||
Three Months Ended | |||||||||||||||||||
(Dollars in thousands, except per share data) | Jun 30, 2020 | Mar 31, 2020 | Jun 30, 2019 | ||||||||||||||||
Net income | $ | 21,659 | $ | 62,812 | $ | 81,466 | (66 | ) | % | (73 | ) | % | |||||||
Pre-tax income, excluding provision for credit losses (non-GAAP) (2) | 165,756 | 140,044 | 134,753 | 18 | 23 | ||||||||||||||
Pre-tax income, excluding provision for credit losses and MSR valuation adjustments (non-GAAP) (2) | 173,149 | 150,441 | 138,138 | 15 | 25 | ||||||||||||||
Net income per common share – diluted | 0.34 | 1.04 | 1.38 | (67 | ) | (75 | ) | ||||||||||||
Net revenue (1) | 425,124 | 374,685 | 364,360 | 13 | 17 | ||||||||||||||
Net interest income | 263,131 | 261,443 | 266,202 | 1 | (1 | ) | |||||||||||||
Net interest margin | 2.73 | % | 3.12 | % | 3.62 | % | (39 | ) | bp | (89 | ) | bp | |||||||
Net interest margin - fully taxable equivalent (non-GAAP) (2) | 2.74 | 3.14 | 3.64 | (40 | ) | (90 | ) | ||||||||||||
Net overhead ratio (3) | 0.93 | 1.33 | 1.64 | (40 | ) | (71 | ) | ||||||||||||
Return on average assets | 0.21 | 0.69 | 1.02 | (48 | ) | (81 | ) | ||||||||||||
Return on average common equity | 2.17 | 6.82 | 9.68 | (465 | ) | (751 | ) | ||||||||||||
Return on average tangible common equity (non-GAAP) (2) | 2.95 | 8.73 | 12.28 | (578 | ) | (933 | ) | ||||||||||||
At end of period | |||||||||||||||||||
Total assets | $ | 43,540,017 | $ | 38,799,847 | $ | 33,641,769 | 49 | % | 29 | % | |||||||||
Total loans (5) | 31,402,903 | 27,807,321 | 25,304,659 | 52 | 24 | ||||||||||||||
Total deposits | 35,651,874 | 31,461,660 | 27,518,815 | 54 | 30 | ||||||||||||||
Total shareholders’ equity | 3,990,218 | 3,700,393 | 3,446,950 | 32 | 16 | ||||||||||||||
(1) | Net revenue is net interest income plus non-interest income. |
(2) | See "Supplemental Non-GAAP Financial Measures/Ratios" at Table 18 for additional information on this performance measure/ratio. |
(3) | The net overhead ratio is calculated by netting total non-interest expense and total non-interest income, annualizing this amount, and dividing by that period's average total assets. A lower ratio indicates a higher degree of efficiency. |
(4) | Period-end balance sheet percentage changes are annualized. |
(5) | Excludes mortgage loans held-for-sale. |
Certain returns, yields, performance ratios, or quarterly growth rates are “annualized” in this presentation to represent an annual time period. This is done for analytical purposes to better discern for decision-making purposes underlying performance trends when compared to full-year or year-over-year amounts. For example, a 5% growth rate for a quarter would represent an annualized 20% growth rate. Additional supplemental financial information showing quarterly trends can be found on the Company’s website at www.wintrust.com by choosing “Financial Reports” under the “Investor Relations” heading, and then choosing “Financial Highlights.”
13
WINTRUST FINANCIAL CORPORATION
Selected Financial Highlights
Three Months Ended | Six Months Ended | ||||||||||||||||||||||||||
(Dollars in thousands, except per share data) | Jun 30, 2020 | Mar 31, 2020 | Dec 31, 2019 | Sep 30, 2019 | Jun 30, 2019 | Jun 30, 2020 | Jun 30, 2019 | ||||||||||||||||||||
Selected Financial Condition Data (at end of period): | |||||||||||||||||||||||||||
Total assets | $ | 43,540,017 | $ | 38,799,847 | $ | 36,620,583 | $ | 34,911,902 | $ | 33,641,769 | |||||||||||||||||
Total loans (1) | 31,402,903 | 27,807,321 | 26,800,290 | 25,710,171 | 25,304,659 | ||||||||||||||||||||||
Total deposits | 35,651,874 | 31,461,660 | 30,107,138 | 28,710,379 | 27,518,815 | ||||||||||||||||||||||
Junior subordinated debentures | 253,566 | 253,566 | 253,566 | 253,566 | 253,566 | ||||||||||||||||||||||
Total shareholders’ equity | 3,990,218 | 3,700,393 | 3,691,250 | 3,540,325 | 3,446,950 | ||||||||||||||||||||||
Selected Statements of Income Data: | |||||||||||||||||||||||||||
Net interest income | $ | 263,131 | $ | 261,443 | $ | 261,879 | $ | 264,852 | $ | 266,202 | $ | 524,574 | $ | 528,188 | |||||||||||||
Net revenue (2) | 425,124 | 374,685 | 374,099 | 379,989 | 364,360 | 799,809 | 708,003 | ||||||||||||||||||||
Net income | 21,659 | 62,812 | 85,964 | 99,121 | 81,466 | 84,471 | 170,612 | ||||||||||||||||||||
Pre-tax income, excluding provision for credit losses (non-GAAP) (3) | 165,756 | 140,044 | 124,508 | 145,435 | 134,753 | 305,800 | 264,022 | ||||||||||||||||||||
Pre-tax income, excluding provision for credit losses and MSR valuation adjustments (non-GAAP) (3) | 173,149 | 150,441 | 122,662 | 149,411 | 138,138 | 323,590 | 276,151 | ||||||||||||||||||||
Net income per common share – Basic | 0.34 | 1.05 | 1.46 | 1.71 | 1.40 | 1.40 | 2.94 | ||||||||||||||||||||
Net income per common share – Diluted | 0.34 | 1.04 | 1.44 | 1.69 | 1.38 | 1.38 | 2.91 | ||||||||||||||||||||
Selected Financial Ratios and Other Data: | |||||||||||||||||||||||||||
Performance Ratios: | |||||||||||||||||||||||||||
Net interest margin | 2.73 | % | 3.12 | % | 3.17 | % | 3.37 | % | 3.62 | % | 2.91 | % | 3.66 | % | |||||||||||||
Net interest margin - fully taxable equivalent (non-GAAP) (3) | 2.74 | 3.14 | 3.19 | 3.39 | 3.64 | 2.93 | 3.68 | ||||||||||||||||||||
Non-interest income to average assets | 1.55 | 1.24 | 1.25 | 1.35 | 1.23 | 1.41 | 1.15 | ||||||||||||||||||||
Non-interest expense to average assets | 2.48 | 2.58 | 2.78 | 2.74 | 2.87 | 2.53 | 2.83 | ||||||||||||||||||||
Net overhead ratio (4) | 0.93 | 1.33 | 1.53 | 1.40 | 1.64 | 1.12 | 1.68 | ||||||||||||||||||||
Return on average assets | 0.21 | 0.69 | 0.96 | 1.16 | 1.02 | 0.43 | 1.09 | ||||||||||||||||||||
Return on average common equity | 2.17 | 6.82 | 9.52 | 11.42 | 9.68 | 4.48 | 10.37 | ||||||||||||||||||||
Return on average tangible common equity (non-GAAP) (3) | 2.95 | 8.73 | 12.17 | 14.36 | 12.28 | 5.81 | 13.19 | ||||||||||||||||||||
Average total assets | $ | 42,042,729 | $ | 36,625,490 | $ | 35,645,190 | $ | 33,954,592 | $ | 32,055,769 | $ | 39,334,109 | $ | 31,638,289 | |||||||||||||
Average total shareholders’ equity | 3,908,846 | 3,710,169 | 3,622,184 | 3,496,714 | 3,414,340 | 3,809,508 | 3,362,000 | ||||||||||||||||||||
Average loans to average deposits ratio | 87.8 | % | 90.1 | % | 88.8 | % | 90.6 | % | 93.9 | % | 88.9 | % | 93.3 | % | |||||||||||||
Period-end loans to deposits ratio | 88.1 | 88.4 | 89.0 | 89.6 | 92.0 | ||||||||||||||||||||||
Common Share Data at end of period: | |||||||||||||||||||||||||||
Market price per common share | $ | 43.62 | $ | 32.86 | $ | 70.90 | $ | 64.63 | $ | 73.16 | |||||||||||||||||
Book value per common share | 62.14 | 62.13 | 61.68 | 60.24 | 58.62 | ||||||||||||||||||||||
Tangible book value per common share (non-GAAP) (3) | 50.23 | 50.18 | 49.70 | 49.16 | 47.48 | ||||||||||||||||||||||
Common shares outstanding | 57,573,672 | 57,545,352 | 57,821,891 | 56,698,429 | 56,667,846 | ||||||||||||||||||||||
Other Data at end of period: | |||||||||||||||||||||||||||
Tier 1 leverage ratio (5) | 8.1 | % | 8.5 | % | 8.7 | % | 8.8 | % | 9.1 | % | |||||||||||||||||
Risk-based capital ratios: | |||||||||||||||||||||||||||
Tier 1 capital ratio (5) | 10.1 | 9.3 | 9.6 | 9.7 | 9.6 | ||||||||||||||||||||||
Common equity tier 1 capital ratio(5) | 8.8 | 8.9 | 9.2 | 9.3 | 9.2 | ||||||||||||||||||||||
Total capital ratio (5) | 12.8 | 11.9 | 12.2 | 12.4 | 12.4 | ||||||||||||||||||||||
Allowance for credit losses (6) | $ | 373,174 | $ | 253,482 | $ | 158,461 | $ | 163,273 | $ | 161,901 | |||||||||||||||||
Allowance for loan and unfunded lending-related commitment losses to total loans | 1.19 | % | 0.91 | % | 0.59 | % | 0.64 | % | 0.64 | % | |||||||||||||||||
Number of: | |||||||||||||||||||||||||||
Bank subsidiaries | 15 | 15 | 15 | 15 | 15 | ||||||||||||||||||||||
Banking offices | 186 | 187 | 187 | 174 | 172 | ||||||||||||||||||||||
(1) | Excludes mortgage loans held-for-sale. |
(2) | Net revenue includes net interest income and non-interest income. |
(3) | See “Supplemental Non-GAAP Financial Measures/Ratios” at Table 18 for additional information on this performance measure/ratio. |
(4) | The net overhead ratio is calculated by netting total non-interest expense and total non-interest income, annualizing this amount, and dividing by that period’s total average assets. A lower ratio indicates a higher degree of efficiency. |
(5) | Capital ratios for current quarter-end are estimated. |
(6) | The allowance for credit losses includes both the allowance for loan losses and the allowance for unfunded lending-related commitments. Effective January 1, 2020, the allowance for credit losses also includes the allowance for investment securities as a result of the adoption of Accounting Standard Update ("ASU") 2016-13, Financial Instruments - Credit Losses. |
14
WINTRUST FINANCIAL CORPORATION AND SUBSIDIARIES
CONSOLIDATED STATEMENTS OF CONDITION
(Unaudited) | (Unaudited) | (Unaudited) | (Unaudited) | |||||||||||||||||
Jun 30, | Mar 31, | Dec 31, | Sep 30, | Jun 30, | ||||||||||||||||
(In thousands) | 2020 | 2020 | 2019 | 2019 | 2019 | |||||||||||||||
Assets | ||||||||||||||||||||
Cash and due from banks | $ | 344,999 | $ | 349,118 | $ | 286,167 | $ | 448,755 | $ | 300,934 | ||||||||||
Federal funds sold and securities purchased under resale agreements | 58 | 309 | 309 | 59 | 58 | |||||||||||||||
Interest bearing deposits with banks | 4,015,072 | 1,943,743 | 2,164,560 | 2,260,806 | 1,437,105 | |||||||||||||||
Available-for-sale securities, at fair value | 3,194,961 | 3,570,959 | 3,106,214 | 2,270,059 | 2,186,154 | |||||||||||||||
Held-to-maturity securities, at amortized cost | 728,465 | 865,376 | 1,134,400 | 1,095,802 | 1,191,634 | |||||||||||||||
Trading account securities | 890 | 2,257 | 1,068 | 3,204 | 2,430 | |||||||||||||||
Equity securities with readily determinable fair value | 52,460 | 47,310 | 50,840 | 46,086 | 44,319 | |||||||||||||||
Federal Home Loan Bank and Federal Reserve Bank stock | 135,571 | 134,546 | 100,739 | 92,714 | 92,026 | |||||||||||||||
Brokerage customer receivables | 14,623 | 16,293 | 16,573 | 14,943 | 13,569 | |||||||||||||||
Mortgage loans held-for-sale | 833,163 | 656,934 | 377,313 | 464,727 | 394,975 | |||||||||||||||
Loans, net of unearned income | 31,402,903 | 27,807,321 | 26,800,290 | 25,710,171 | 25,304,659 | |||||||||||||||
Allowance for loan losses | (313,510 | ) | (216,050 | ) | (156,828 | ) | (161,763 | ) | (160,421 | ) | ||||||||||
Net loans | 31,089,393 | 27,591,271 | 26,643,462 | 25,548,408 | 25,144,238 | |||||||||||||||
Premises and equipment, net | 769,909 | 764,583 | 754,328 | 721,856 | 711,214 | |||||||||||||||
Lease investments, net | 237,040 | 207,147 | 231,192 | 228,647 | 230,111 | |||||||||||||||
Accrued interest receivable and other assets | 1,437,832 | 1,460,168 | 1,061,141 | 1,087,864 | 1,023,896 | |||||||||||||||
Trade date securities receivable | — | 502,207 | — | — | 237,607 | |||||||||||||||
Goodwill | 644,213 | 643,441 | 645,220 | 584,315 | 584,911 | |||||||||||||||
Other intangible assets | 41,368 | 44,185 | 47,057 | 43,657 | 46,588 | |||||||||||||||
Total assets | $ | 43,540,017 | $ | 38,799,847 | $ | 36,620,583 | $ | 34,911,902 | $ | 33,641,769 | ||||||||||
Liabilities and Shareholders’ Equity | ||||||||||||||||||||
Deposits: | ||||||||||||||||||||
Non-interest bearing | $ | 10,204,791 | $ | 7,556,755 | $ | 7,216,758 | $ | 7,067,960 | $ | 6,719,958 | ||||||||||
Interest bearing | 25,447,083 | 23,904,905 | 22,890,380 | 21,642,419 | 20,798,857 | |||||||||||||||
Total deposits | 35,651,874 | 31,461,660 | 30,107,138 | 28,710,379 | 27,518,815 | |||||||||||||||
Federal Home Loan Bank advances | 1,228,416 | 1,174,894 | 674,870 | 574,847 | 574,823 | |||||||||||||||
Other borrowings | 508,535 | 487,503 | 418,174 | 410,488 | 418,057 | |||||||||||||||
Subordinated notes | 436,298 | 436,179 | 436,095 | 435,979 | 436,021 | |||||||||||||||
Junior subordinated debentures | 253,566 | 253,566 | 253,566 | 253,566 | 253,566 | |||||||||||||||
Trade date securities payable | — | — | — | 226 | — | |||||||||||||||
Accrued interest payable and other liabilities | 1,471,110 | 1,285,652 | 1,039,490 | 986,092 | 993,537 | |||||||||||||||
Total liabilities | 39,549,799 | 35,099,454 | 32,929,333 | 31,371,577 | 30,194,819 | |||||||||||||||
Shareholders’ Equity: | ||||||||||||||||||||
Preferred stock | 412,500 | 125,000 | 125,000 | 125,000 | 125,000 | |||||||||||||||
Common stock | 58,294 | 58,266 | 57,951 | 56,825 | 56,794 | |||||||||||||||
Surplus | 1,643,864 | 1,652,063 | 1,650,278 | 1,574,011 | 1,569,969 | |||||||||||||||
Treasury stock | (44,891 | ) | (44,891 | ) | (6,931 | ) | (6,799 | ) | (6,650 | ) | ||||||||||
Retained earnings | 1,921,048 | 1,917,558 | 1,899,630 | 1,830,165 | 1,747,266 | |||||||||||||||
Accumulated other comprehensive loss | (597 | ) | (7,603 | ) | (34,678 | ) | (38,877 | ) | (45,429 | ) | ||||||||||
Total shareholders’ equity | 3,990,218 | 3,700,393 | 3,691,250 | 3,540,325 | 3,446,950 | |||||||||||||||
Total liabilities and shareholders’ equity | $ | 43,540,017 | $ | 38,799,847 | $ | 36,620,583 | $ | 34,911,902 | $ | 33,641,769 | ||||||||||
15
WINTRUST FINANCIAL CORPORATION AND SUBSIDIARIES
CONSOLIDATED STATEMENTS OF INCOME (UNAUDITED)
Three Months Ended | Six Months Ended | |||||||||||||||||||||||||
(In thousands, except per share data) | Jun 30, 2020 | Mar 31, 2020 | Dec 31, 2019 | Sep 30, 2019 | Jun 30, 2019 | Jun 30, 2020 | Jun 30, 2019 | |||||||||||||||||||
Interest income | ||||||||||||||||||||||||||
Interest and fees on loans | $ | 294,746 | $ | 301,839 | $ | 308,055 | $ | 314,277 | $ | 309,161 | $ | 596,585 | $ | 606,148 | ||||||||||||
Mortgage loans held-for-sale | 4,764 | 3,165 | 3,201 | 3,478 | 3,104 | 7,929 | 5,313 | |||||||||||||||||||
Interest bearing deposits with banks | 1,310 | 4,768 | 8,971 | 10,326 | 5,206 | 6,078 | 10,506 | |||||||||||||||||||
Federal funds sold and securities purchased under resale agreements | 16 | 86 | 390 | 310 | — | 102 | — | |||||||||||||||||||
Investment securities | 27,105 | 32,467 | 27,611 | 24,758 | 27,721 | 59,572 | 55,677 | |||||||||||||||||||
Trading account securities | 13 | 7 | 6 | 20 | 5 | 20 | 13 | |||||||||||||||||||
Federal Home Loan Bank and Federal Reserve Bank stock | 1,765 | 1,577 | 1,328 | 1,294 | 1,439 | 3,342 | 2,794 | |||||||||||||||||||
Brokerage customer receivables | 97 | 158 | 169 | 164 | 178 | 255 | 333 | |||||||||||||||||||
Total interest income | 329,816 | 344,067 | 349,731 | 354,627 | 346,814 | 673,883 | 680,784 | |||||||||||||||||||
Interest expense | ||||||||||||||||||||||||||
Interest on deposits | 50,057 | 67,435 | 74,724 | 76,168 | 67,024 | 117,492 | 128,000 | |||||||||||||||||||
Interest on Federal Home Loan Bank advances | 4,934 | 3,360 | 1,461 | 1,774 | 4,193 | 8,294 | 6,643 | |||||||||||||||||||
Interest on other borrowings | 3,436 | 3,546 | 3,273 | 3,466 | 3,525 | 6,982 | 7,158 | |||||||||||||||||||
Interest on subordinated notes | 5,506 | 5,472 | 5,504 | 5,470 | 2,806 | 10,978 | 4,581 | |||||||||||||||||||
Interest on junior subordinated debentures | 2,752 | 2,811 | 2,890 | 2,897 | 3,064 | 5,563 | 6,214 | |||||||||||||||||||
Total interest expense | 66,685 | 82,624 | 87,852 | 89,775 | 80,612 | 149,309 | 152,596 | |||||||||||||||||||
Net interest income | 263,131 | 261,443 | 261,879 | 264,852 | 266,202 | 524,574 | 528,188 | |||||||||||||||||||
Provision for credit losses | 135,053 | 52,961 | 7,826 | 10,834 | 24,580 | 188,014 | 35,204 | |||||||||||||||||||
Net interest income after provision for credit losses | 128,078 | 208,482 | 254,053 | 254,018 | 241,622 | 336,560 | 492,984 | |||||||||||||||||||
Non-interest income | ||||||||||||||||||||||||||
Wealth management | 22,636 | 25,941 | 24,999 | 23,999 | 24,139 | 48,577 | 48,116 | |||||||||||||||||||
Mortgage banking | 102,324 | 48,326 | 47,860 | 50,864 | 37,411 | 150,650 | 55,569 | |||||||||||||||||||
Service charges on deposit accounts | 10,420 | 11,265 | 10,973 | 9,972 | 9,277 | 21,685 | 18,125 | |||||||||||||||||||
Gains (losses) on investment securities, net | 808 | (4,359 | ) | 587 | 710 | 864 | (3,551 | ) | 2,228 | |||||||||||||||||
Fees from covered call options | — | 2,292 | 1,243 | — | 643 | 2,292 | 2,427 | |||||||||||||||||||
Trading (losses) gains, net | (634 | ) | (451 | ) | 46 | 11 | (44 | ) | (1,085 | ) | (215 | ) | ||||||||||||||
Operating lease income, net | 11,785 | 11,984 | 12,487 | 12,025 | 11,733 | 23,769 | 22,529 | |||||||||||||||||||
Other | 14,654 | 18,244 | 14,025 | 17,556 | 14,135 | 32,898 | 31,036 | |||||||||||||||||||
Total non-interest income | 161,993 | 113,242 | 112,220 | 115,137 | 98,158 | 275,235 | 179,815 | |||||||||||||||||||
Non-interest expense | ||||||||||||||||||||||||||
Salaries and employee benefits | 154,156 | 136,762 | 145,941 | 141,024 | 133,732 | 290,918 | 259,455 | |||||||||||||||||||
Equipment | 15,846 | 14,834 | 14,485 | 13,314 | 12,759 | 30,680 | 24,529 | |||||||||||||||||||
Operating lease equipment | 9,292 | 9,260 | 9,766 | 8,907 | 8,768 | 18,552 | 17,087 | |||||||||||||||||||
Occupancy, net | 16,893 | 17,547 | 17,132 | 14,991 | 15,921 | 34,440 | 32,166 | |||||||||||||||||||
Data processing | 10,406 | 8,373 | 7,569 | 6,522 | 6,204 | 18,779 | 13,729 | |||||||||||||||||||
Advertising and marketing | 7,704 | 10,862 | 12,517 | 13,375 | 12,845 | 18,566 | 22,703 | |||||||||||||||||||
Professional fees | 7,687 | 6,721 | 7,650 | 8,037 | 6,228 | 14,408 | 11,784 | |||||||||||||||||||
Amortization of other intangible assets | 2,820 | 2,863 | 3,017 | 2,928 | 2,957 | 5,683 | 5,899 | |||||||||||||||||||
FDIC insurance | 7,081 | 4,135 | 1,348 | 148 | 4,127 | 11,216 | 7,703 | |||||||||||||||||||
OREO expense, net | 237 | (876 | ) | 536 | 1,170 | 1,290 | (639 | ) | 1,922 | |||||||||||||||||
Other | 27,246 | 24,160 | 29,630 | 24,138 | 24,776 | 51,406 | 47,004 | |||||||||||||||||||
Total non-interest expense | 259,368 | 234,641 | 249,591 | 234,554 | 229,607 | 494,009 | 443,981 | |||||||||||||||||||
Income before taxes | 30,703 | 87,083 | 116,682 | 134,601 | 110,173 | 117,786 | 228,818 | |||||||||||||||||||
Income tax expense | 9,044 | 24,271 | 30,718 | 35,480 | 28,707 | 33,315 | 58,206 | |||||||||||||||||||
Net income | $ | 21,659 | $ | 62,812 | $ | 85,964 | $ | 99,121 | $ | 81,466 | $ | 84,471 | $ | 170,612 | ||||||||||||
Preferred stock dividends | 2,050 | 2,050 | 2,050 | 2,050 | 2,050 | 4,100 | 4,100 | |||||||||||||||||||
Net income applicable to common shares | $ | 19,609 | $ | 60,762 | $ | 83,914 | $ | 97,071 | $ | 79,416 | $ | 80,371 | $ | 166,512 | ||||||||||||
Net income per common share - Basic | $ | 0.34 | $ | 1.05 | $ | 1.46 | $ | 1.71 | $ | 1.40 | $ | 1.40 | $ | 2.94 | ||||||||||||
Net income per common share - Diluted | $ | 0.34 | $ | 1.04 | $ | 1.44 | $ | 1.69 | $ | 1.38 | $ | 1.38 | $ | 2.91 | ||||||||||||
Cash dividends declared per common share | $ | 0.28 | $ | 0.28 | $ | 0.25 | $ | 0.25 | $ | 0.25 | $ | 0.56 | $ | 0.50 | ||||||||||||
Weighted average common shares outstanding | 57,567 | 57,620 | 57,538 | 56,690 | 56,662 | 57,593 | 56,596 | |||||||||||||||||||
Dilutive potential common shares | 414 | 575 | 874 | 773 | 699 | 481 | 700 | |||||||||||||||||||
Average common shares and dilutive common shares | 57,981 | 58,195 | 58,412 | 57,463 | 57,361 | 58,074 | 57,296 | |||||||||||||||||||
16
TABLE 1: LOAN PORTFOLIO MIX AND GROWTH RATES AND COMMERCIAL REAL ESTATE BY STATE
% Growth From | ||||||||||||||||||||||||
(Dollars in thousands) | Jun 30, 2020 | Mar 31, 2020 | Dec 31, 2019 | Sep 30, 2019 | Jun 30, 2019 | Dec 31, 2019 (1) | Jun 30, 2019 | |||||||||||||||||
Balance: | ||||||||||||||||||||||||
Commercial | ||||||||||||||||||||||||
Commercial, industrial, and other | $ | 8,498,931 | $ | 8,999,728 | $ | 8,257,614 | $ | 8,180,070 | $ | 8,246,449 | 6 | % | 3 | % | ||||||||||
Commercial PPP loans | 3,335,368 | — | — | — | — | 100 | 100 | |||||||||||||||||
Commercial, industrial, and other - PCD (2) | 24,933 | 26,158 | 28,306 | 15,532 | 24,325 | (24 | ) | 2 | ||||||||||||||||
Commercial real estate | ||||||||||||||||||||||||
Construction and development | 1,285,282 | 1,237,274 | 1,200,783 | 1,025,961 | 984,138 | 14 | 31 | |||||||||||||||||
Non-construction | 6,722,438 | 6,736,706 | 6,582,053 | 6,305,423 | 6,165,115 | 4 | 9 | |||||||||||||||||
Commercial real estate - PCD (2) | 193,025 | 211,551 | 237,440 | 117,283 | 126,991 | (38 | ) | 52 | ||||||||||||||||
Home equity | 466,596 | 494,655 | 513,066 | 512,303 | 527,370 | (18 | ) | (12 | ) | |||||||||||||||
Home equity - PCD (2) | — | — | — | — | — | — | — | |||||||||||||||||
Residential real estate | 1,410,798 | 1,359,971 | 1,336,093 | 1,208,706 | 1,107,911 | 11 | 27 | |||||||||||||||||
Residential real estate - PCD (2) | 16,631 | 17,418 | 18,128 | 9,960 | 10,267 | (17 | ) | 62 | ||||||||||||||||
Premium Finance receivables | ||||||||||||||||||||||||
Commercial insurance | 3,999,774 | 3,465,055 | 3,442,027 | 3,449,950 | 3,368,423 | 33 | 19 | |||||||||||||||||
Life insurance | 5,277,126 | 5,084,695 | 4,935,320 | 4,654,588 | 4,487,921 | 14 | 18 | |||||||||||||||||
Premium finance receivables - PCD (2) | 123,676 | 136,944 | 139,282 | 140,908 | 146,557 | (23 | ) | (16 | ) | |||||||||||||||
Consumer and other | 46,855 | 35,546 | 107,962 | 87,161 | 106,547 | NM | (56 | ) | ||||||||||||||||
Consumer and other - PCD (2) | 1,470 | 1,620 | 2,216 | 2,326 | 2,645 | (68 | ) | (44 | ) | |||||||||||||||
Total loans, net of unearned income | $ | 31,402,903 | $ | 27,807,321 | $ | 26,800,290 | $ | 25,710,171 | $ | 25,304,659 | 35 | % | 24 | % | ||||||||||
Mix: | ||||||||||||||||||||||||
Commercial | ||||||||||||||||||||||||
Commercial, industrial, and other | 28 | % | 32 | % | 31 | % | 32 | % | 33 | % | ||||||||||||||
Commercial PPP loans | 11 | — | — | — | — | |||||||||||||||||||
Commercial, industrial, and other - PCD (2) | 0 | 0 | 0 | 0 | 0 | |||||||||||||||||||
Commercial real estate | ||||||||||||||||||||||||
Construction and development | 4 | 4 | 4 | 4 | 4 | |||||||||||||||||||
Non-construction | 21 | 24 | 25 | 25 | 24 | |||||||||||||||||||
Commercial real estate - PCD (2) | 1 | 1 | 1 | 0 | 1 | |||||||||||||||||||
Home equity | 1 | 2 | 2 | 2 | 2 | |||||||||||||||||||
Home equity - PCD (2) | — | — | — | — | — | |||||||||||||||||||
Residential real estate | 4 | 5 | 5 | 5 | 4 | |||||||||||||||||||
Residential real estate - PCD (2) | 0 | 0 | 0 | 0 | 0 | |||||||||||||||||||
Premium Finance receivables | ||||||||||||||||||||||||
Commercial insurance | 13 | 13 | 13 | 13 | 13 | |||||||||||||||||||
Life insurance | 17 | 18 | 18 | 18 | 18 | |||||||||||||||||||
Premium finance receivables - PCD (2) | 0 | 1 | 1 | 1 | 1 | |||||||||||||||||||
Consumer and other | 0 | 0 | 0 | 0 | 0 | |||||||||||||||||||
Consumer and other - PCD (2) | 0 | 0 | 0 | 0 | 0 | |||||||||||||||||||
Total loans, net of unearned income | 100 | % | 100 | % | 100 | % | 100 | % | 100 | % | ||||||||||||||
(1) | Annualized. |
(2) | As a result of the adoption of ASU 2016-13, the Company transitioned all previously classified purchase credit impaired ("PCI") loans to purchased credit deteriorated ("PCD") loans effective January 1, 2020. For prior periods presented, the previously classified PCI loans are presented with the PCD loans in their respective class. |
Jun 30, 2020 | Mar 31, 2020 | Dec 31, 2019 | Sep 30, 2019 | Jun 30, 2019 | |||||||||||||||||||||||||
% of Total Balance | % of Total Balance | % of Total Balance | % of Total Balance | % of Total Balance | |||||||||||||||||||||||||
(Dollars in thousands) | Balance | Balance | Balance | Balance | Balance | ||||||||||||||||||||||||
Commercial real estate - collateral location by state: | |||||||||||||||||||||||||||||
Illinois | $ | 6,198,486 | 75.6 | % | $ | 6,171,606 | 75.4 | % | $ | 6,176,353 | 77.0 | % | $ | 5,654,827 | 75.9 | % | $ | 5,505,290 | 75.7 | % | |||||||||
Wisconsin | 760,839 | 9.3 | 793,145 | 9.7 | 744,975 | 9.3 | 744,577 | 10.0 | 740,288 | 10.2 | |||||||||||||||||||
Total primary markets | $ | 6,959,325 | 84.9 | % | $ | 6,964,751 | 85.1 | % | $ | 6,921,328 | 86.3 | % | $ | 6,399,404 | 85.9 | % | $ | 6,245,578 | 85.9 | % | |||||||||
Indiana | 249,423 | 3.0 | 249,680 | 3.1 | 218,963 | 2.7 | 193,350 | 2.6 | 179,977 | 2.5 | |||||||||||||||||||
Florida | 133,810 | 1.6 | 126,786 | 1.5 | 114,629 | 1.4 | 80,120 | 1.1 | 60,343 | 0.8 | |||||||||||||||||||
Arizona | 78,135 | 1.0 | 72,214 | 0.9 | 64,022 | 0.8 | 62,657 | 0.8 | 62,607 | 0.9 | |||||||||||||||||||
California | 81,634 | 1.0 | 63,883 | 0.8 | 64,345 | 0.8 | 67,999 | 0.9 | 68,497 | 0.9 | |||||||||||||||||||
Other | 698,418 | 8.5 | 708,217 | 8.6 | 636,989 | 8.0 | 645,137 | 8.7 | 659,242 | 9.0 | |||||||||||||||||||
Total commercial real estate | $ | 8,200,745 | 100 | % | $ | 8,185,531 | 100 | % | $ | 8,020,276 | 100 | % | $ | 7,448,667 | 100 | % | $ | 7,276,244 | 100 | % | |||||||||
17
TABLE 2: DEPOSIT PORTFOLIO MIX AND GROWTH RATES
% Growth From | ||||||||||||||||||||||||
(Dollars in thousands) | Jun 30, 2020 | Mar 31, 2020 | Dec 31, 2019 | Sep 30, 2019 | Jun 30, 2019 | Dec 31, 2019 (1) | Jun 30, 2019 | |||||||||||||||||
Balance: | ||||||||||||||||||||||||
Non-interest bearing | $ | 10,204,791 | $ | 7,556,755 | $ | 7,216,758 | $ | 7,067,960 | $ | 6,719,958 | 83 | % | 52 | % | ||||||||||
NOW and interest bearing demand deposits | 3,440,348 | 3,181,159 | 3,093,159 | 2,966,098 | 2,788,976 | 23 | 23 | |||||||||||||||||
Wealth management deposits (2) | 4,433,020 | 3,936,968 | 3,123,063 | 2,795,838 | 3,220,256 | 84 | 38 | |||||||||||||||||
Money market | 9,288,976 | 8,114,659 | 7,854,189 | 7,326,899 | 6,460,098 | 37 | 44 | |||||||||||||||||
Savings | 3,447,352 | 3,282,340 | 3,196,698 | 2,934,348 | 2,823,904 | 16 | 22 | |||||||||||||||||
Time certificates of deposit | 4,837,387 | 5,389,779 | 5,623,271 | 5,619,236 | 5,505,623 | (28 | ) | (12 | ) | |||||||||||||||
Total deposits | $ | 35,651,874 | $ | 31,461,660 | $ | 30,107,138 | $ | 28,710,379 | $ | 27,518,815 | 37 | % | 30 | % | ||||||||||
Mix: | ||||||||||||||||||||||||
Non-interest bearing | 29 | % | 24 | % | 24 | % | 25 | % | 24 | % | ||||||||||||||
NOW and interest bearing demand deposits | 10 | 10 | 10 | 10 | 10 | |||||||||||||||||||
Wealth management deposits (2) | 12 | 13 | 10 | 10 | 12 | |||||||||||||||||||
Money market | 25 | 26 | 26 | 25 | 24 | |||||||||||||||||||
Savings | 10 | 10 | 11 | 10 | 10 | |||||||||||||||||||
Time certificates of deposit | 14 | 17 | 19 | 20 | 20 | |||||||||||||||||||
Total deposits | 100 | % | 100 | % | 100 | % | 100 | % | 100 | % | ||||||||||||||
(1) | Annualized. |
(2) | Represents deposit balances of the Company’s subsidiary banks from brokerage customers of Wintrust Investments, CDEC, trust and asset management customers of the Company and brokerage customers from unaffiliated companies which have been placed into deposit accounts. |
TABLE 3: TIME CERTIFICATES OF DEPOSIT MATURITY/RE-PRICING ANALYSIS
As of June 30, 2020
(Dollars in thousands) | CDARs & Brokered Certificates of Deposit (1) | MaxSafe Certificates of Deposit (1) | Variable Rate Certificates of Deposit (2) | Other Fixed Rate Certificates of Deposit (1) | Total Time Certificates of Deposit | Weighted-Average Rate of Maturing Time Certificates of Deposit (3) | ||||||||||||||||
1-3 months | $ | 1,690 | $ | 33,600 | $ | 59,988 | $ | 651,964 | $ | 747,242 | 1.65 | % | ||||||||||
4-6 months | 609 | 31,127 | — | 561,696 | 593,432 | 1.53 | ||||||||||||||||
7-9 months | — | 9,547 | — | 802,262 | 811,809 | 1.91 | ||||||||||||||||
10-12 months | — | 14,830 | — | 1,223,365 | 1,238,195 | 1.93 | ||||||||||||||||
13-18 months | 1,401 | 15,049 | — | 1,012,797 | 1,029,247 | 1.99 | ||||||||||||||||
19-24 months | — | 4,580 | — | 200,078 | 204,658 | 1.19 | ||||||||||||||||
24+ months | 88 | 4,395 | — | 208,321 | 212,804 | 1.38 | ||||||||||||||||
Total | $ | 3,788 | $ | 113,128 | $ | 59,988 | $ | 4,660,483 | $ | 4,837,387 | 1.79 | % | ||||||||||
(1) | This category of certificates of deposit is shown by contractual maturity date. |
(2) | This category includes variable rate certificates of deposit and savings certificates with the majority repricing on at least a monthly basis. |
(3) | Weighted-average rate excludes the impact of purchase accounting fair value adjustments. |
18
TABLE 4: QUARTERLY AVERAGE BALANCES
Average Balance for three months ended, | ||||||||||||||||||||
Jun 30, | Mar 31, | Dec 31, | Sep 30, | Jun 30, | ||||||||||||||||
(In thousands) | 2020 | 2020 | 2019 | 2019 | 2019 | |||||||||||||||
Interest-bearing deposits with banks and cash equivalents (1) | $ | 3,240,167 | $ | 1,418,809 | $ | 2,206,251 | $ | 1,960,898 | $ | 893,332 | ||||||||||
Investment securities (2) | 4,309,471 | 4,780,709 | 3,909,699 | 3,410,090 | 3,653,580 | |||||||||||||||
FHLB and FRB stock | 135,360 | 114,829 | 94,843 | 92,583 | 105,491 | |||||||||||||||
Liquidity management assets (6) | 7,684,998 | 6,314,347 | 6,210,793 | 5,463,571 | 4,652,403 | |||||||||||||||
Other earning assets (3)(6) | 16,917 | 19,166 | 18,353 | 17,809 | 15,719 | |||||||||||||||
Mortgage loans held-for-sale | 705,702 | 403,262 | 381,878 | 379,870 | 281,732 | |||||||||||||||
Loans, net of unearned income (4)(6) | 30,336,626 | 26,936,728 | 26,137,722 | 25,346,290 | 24,553,263 | |||||||||||||||
Total earning assets (6) | 38,744,243 | 33,673,503 | 32,748,746 | 31,207,540 | 29,503,117 | |||||||||||||||
Allowance for loan and investment security losses (7) | (222,485 | ) | (176,291 | ) | (167,759 | ) | (168,423 | ) | (164,231 | ) | ||||||||||
Cash and due from banks | 352,423 | 321,982 | 316,631 | 297,475 | 273,679 | |||||||||||||||
Other assets | 3,168,548 | 2,806,296 | 2,747,572 | 2,618,000 | 2,443,204 | |||||||||||||||
Total assets | $ | 42,042,729 | $ | 36,625,490 | $ | 35,645,190 | $ | 33,954,592 | $ | 32,055,769 | ||||||||||
NOW and interest bearing demand deposits | $ | 3,323,124 | $ | 3,113,733 | $ | 3,016,991 | $ | 2,912,961 | $ | 2,878,021 | ||||||||||
Wealth management deposits | 4,380,996 | 2,838,719 | 2,934,292 | 2,888,817 | 2,605,690 | |||||||||||||||
Money market accounts | 8,727,966 | 7,990,775 | 7,647,635 | 6,956,755 | 6,095,285 | |||||||||||||||
Savings accounts | 3,394,480 | 3,189,835 | 3,028,763 | 2,837,039 | 2,752,828 | |||||||||||||||
Time deposits | 5,104,701 | 5,526,407 | 5,682,449 | 5,590,228 | 5,322,384 | |||||||||||||||
Interest-bearing deposits | 24,931,267 | 22,659,469 | 22,310,130 | 21,185,800 | 19,654,208 | |||||||||||||||
Federal Home Loan Bank advances | 1,214,375 | 951,613 | 596,594 | 574,833 | 869,812 | |||||||||||||||
Other borrowings | 493,350 | 469,577 | 415,092 | 416,300 | 419,064 | |||||||||||||||
Subordinated notes | 436,226 | 436,119 | 436,025 | 436,041 | 220,771 | |||||||||||||||
Junior subordinated debentures | 253,566 | 253,566 | 253,566 | 253,566 | 253,566 | |||||||||||||||
Total interest-bearing liabilities | 27,328,784 | 24,770,344 | 24,011,407 | 22,866,540 | 21,417,421 | |||||||||||||||
Non-interest bearing deposits | 9,607,528 | 7,235,177 | 7,128,166 | 6,776,786 | 6,487,627 | |||||||||||||||
Other liabilities | 1,197,571 | 909,800 | 883,433 | 814,552 | 736,381 | |||||||||||||||
Equity | 3,908,846 | 3,710,169 | 3,622,184 | 3,496,714 | 3,414,340 | |||||||||||||||
Total liabilities and shareholders’ equity | $ | 42,042,729 | $ | 36,625,490 | $ | 35,645,190 | $ | 33,954,592 | $ | 32,055,769 | ||||||||||
Net free funds/contribution (5) | $ | 11,415,459 | $ | 8,903,159 | $ | 8,737,339 | $ | 8,341,000 | $ | 8,085,696 | ||||||||||
(1) | Includes interest-bearing deposits from banks, federal funds sold and securities purchased under resale agreements. |
(2) | Investment securities includes investment securities classified as available-for-sale and held-to-maturity, and equity securities with readily determinable fair values. Equity securities without readily determinable fair values are included within other assets. |
(3) | Other earning assets include brokerage customer receivables and trading account securities. |
(4) | Loans, net of unearned income, include non-accrual loans. |
(5) | Net free funds are the difference between total average earning assets and total average interest-bearing liabilities. The estimated contribution to net interest margin from net free funds is calculated using the rate paid for total interest-bearing liabilities. |
(6) | See "Supplemental Non-GAAP Financial Measures/Ratios" at Table 18 for additional information on this performance measure/ratio. |
(7) | Effective January 1, 2020 this includes the allowance for investment security losses as a result of the adoption of ASU 2016-13, Financial Instruments - Credit Losses. |
19
TABLE 5: QUARTERLY NET INTEREST INCOME
Net Interest Income for three months ended, | ||||||||||||||||||||
Jun 30, | Mar 31, | Dec 31, | Sep 30, | Jun 30, | ||||||||||||||||
(In thousands) | 2020 | 2020 | 2019 | 2019 | 2019 | |||||||||||||||
Interest income: | ||||||||||||||||||||
Interest-bearing deposits with banks and cash equivalents | $ | 1,326 | $ | 4,854 | $ | 9,361 | $ | 10,636 | $ | 5,206 | ||||||||||
Investment securities | 27,643 | 33,018 | 28,184 | 25,332 | 28,290 | |||||||||||||||
FHLB and FRB stock | 1,765 | 1,577 | 1,328 | 1,294 | 1,439 | |||||||||||||||
Liquidity management assets (2) | 30,734 | 39,449 | 38,873 | 37,262 | 34,935 | |||||||||||||||
Other earning assets (2) | 113 | 167 | 176 | 189 | 184 | |||||||||||||||
Mortgage loans held-for-sale | 4,764 | 3,165 | 3,201 | 3,478 | 3,104 | |||||||||||||||
Loans, net of unearned income (2) | 295,322 | 302,699 | 308,947 | 315,255 | 310,191 | |||||||||||||||
Total interest income | $ | 330,933 | $ | 345,480 | $ | 351,197 | $ | 356,184 | $ | 348,414 | ||||||||||
Interest expense: | ||||||||||||||||||||
NOW and interest bearing demand deposits | $ | 1,561 | $ | 3,665 | $ | 4,622 | $ | 5,291 | $ | 5,553 | ||||||||||
Wealth management deposits | 7,244 | 6,935 | 7,867 | 9,163 | 7,091 | |||||||||||||||
Money market accounts | 13,140 | 22,363 | 25,603 | 25,426 | 21,451 | |||||||||||||||
Savings accounts | 3,840 | 5,790 | 6,145 | 5,622 | 4,959 | |||||||||||||||
Time deposits | 24,272 | 28,682 | 30,487 | 30,666 | 27,970 | |||||||||||||||
Interest-bearing deposits | 50,057 | 67,435 | 74,724 | 76,168 | 67,024 | |||||||||||||||
Federal Home Loan Bank advances | 4,934 | 3,360 | 1,461 | 1,774 | 4,193 | |||||||||||||||
Other borrowings | 3,436 | 3,546 | 3,273 | 3,466 | 3,525 | |||||||||||||||
Subordinated notes | 5,506 | 5,472 | 5,504 | 5,470 | 2,806 | |||||||||||||||
Junior subordinated debentures | 2,752 | 2,811 | 2,890 | 2,897 | 3,064 | |||||||||||||||
Total interest expense | $ | 66,685 | $ | 82,624 | $ | 87,852 | $ | 89,775 | $ | 80,612 | ||||||||||
Less: Fully taxable-equivalent adjustment | (1,117 | ) | (1,413 | ) | (1,466 | ) | (1,557 | ) | (1,600 | ) | ||||||||||
Net interest income (GAAP) (1) | 263,131 | 261,443 | 261,879 | 264,852 | 266,202 | |||||||||||||||
Fully taxable-equivalent adjustment | 1,117 | 1,413 | 1,466 | 1,557 | 1,600 | |||||||||||||||
Net interest income, fully taxable-equivalent (non-GAAP) (1) | $ | 264,248 | $ | 262,856 | $ | 263,345 | $ | 266,409 | $ | 267,802 | ||||||||||
(1) | See "Supplemental Non-GAAP Financial Measures/Ratios" at Table 18 for additional information on this performance measure/ratio. |
(2) | Interest income on tax-advantaged loans, trading securities and investment securities reflects a taxable-equivalent adjustment based on the marginal federal corporate tax rate in effect as of the applicable period. |
20
TABLE 6: QUARTERLY NET INTEREST MARGIN
Net Interest Margin for three months ended, | |||||||||||||||
Jun 30, 2020 | Mar 31, 2020 | Dec 31, 2019 | Sep 30, 2019 | Jun 30, 2019 | |||||||||||
Yield earned on: | |||||||||||||||
Interest-bearing deposits with banks and cash equivalents | 0.16 | % | 1.38 | % | 1.68 | % | 2.15 | % | 2.34 | % | |||||
Investment securities | 2.58 | 2.78 | 2.86 | 2.95 | 3.11 | ||||||||||
FHLB and FRB stock | 5.24 | 5.52 | 5.55 | 5.55 | 5.47 | ||||||||||
Liquidity management assets | 1.61 | 2.51 | 2.48 | 2.71 | 3.01 | ||||||||||
Other earning assets | 2.71 | 3.50 | 3.83 | 4.20 | 4.68 | ||||||||||
Mortgage loans held-for-sale | 2.72 | 3.16 | 3.33 | 3.63 | 4.42 | ||||||||||
Loans, net of unearned income | 3.92 | 4.52 | 4.69 | 4.93 | 5.07 | ||||||||||
Total earning assets | 3.44 | % | 4.13 | % | 4.25 | % | 4.53 | % | 4.74 | % | |||||
Rate paid on: | |||||||||||||||
NOW and interest bearing demand deposits | 0.19 | % | 0.47 | % | 0.61 | % | 0.72 | % | 0.77 | % | |||||
Wealth management deposits | 0.67 | 0.98 | 1.06 | 1.26 | 1.09 | ||||||||||
Money market accounts | 0.61 | 1.13 | 1.33 | 1.45 | 1.41 | ||||||||||
Savings accounts | 0.45 | 0.73 | 0.80 | 0.79 | 0.72 | ||||||||||
Time deposits | 1.91 | 2.09 | 2.13 | 2.18 | 2.11 | ||||||||||
Interest-bearing deposits | 0.81 | 1.20 | 1.33 | 1.43 | 1.37 | ||||||||||
Federal Home Loan Bank advances | 1.63 | 1.42 | 0.97 | 1.22 | 1.93 | ||||||||||
Other borrowings | 2.80 | 3.04 | 3.13 | 3.30 | 3.37 | ||||||||||
Subordinated notes | 5.05 | 5.02 | 5.05 | 5.02 | 5.08 | ||||||||||
Junior subordinated debentures | 4.29 | 4.39 | 4.46 | 4.47 | 4.78 | ||||||||||
Total interest-bearing liabilities | 0.98 | % | 1.34 | % | 1.45 | % | 1.56 | % | 1.51 | % | |||||
Interest rate spread (1)(3) | 2.46 | % | 2.79 | % | 2.80 | % | 2.97 | % | 3.23 | % | |||||
Less: Fully taxable-equivalent adjustment | (0.01 | ) | (0.02 | ) | (0.02 | ) | (0.02 | ) | (0.02 | ) | |||||
Net free funds/contribution (2) | 0.28 | 0.35 | 0.39 | 0.42 | 0.41 | ||||||||||
Net interest margin (GAAP) (3) | 2.73 | % | 3.12 | % | 3.17 | % | 3.37 | % | 3.62 | % | |||||
Fully taxable-equivalent adjustment | 0.01 | 0.02 | 0.02 | 0.02 | 0.02 | ||||||||||
Net interest margin, fully taxable-equivalent (non-GAAP) (3) | 2.74 | % | 3.14 | % | 3.19 | % | 3.39 | % | 3.64 | % | |||||
(1) | Interest rate spread is the difference between the yield earned on earning assets and the rate paid on interest-bearing liabilities. |
(2) | Net free funds are the difference between total average earning assets and total average interest-bearing liabilities. The estimated contribution to net interest margin from net free funds is calculated using the rate paid for total interest-bearing liabilities. |
(3) | See "Supplemental Non-GAAP Financial Measures/Ratios" at Table 18 for additional information on this performance measure/ratio. |
21
TABLE 7: YEAR-TO-DATE AVERAGE BALANCES, AND NET INTEREST INCOME AND MARGIN
Average Balance for six months ended, | Interest for six months ended, | Yield/Rate for six months ended, | |||||||||||||||||
(Dollars in thousands) | Jun 30, 2020 | Jun 30, 2019 | Jun 30, 2020 | Jun 30, 2019 | Jun 30, 2020 | Jun 30, 2019 | |||||||||||||
Interest-bearing deposits with banks and cash equivalents (1) | $ | 2,329,488 | $ | 895,497 | $ | 6,180 | $ | 10,506 | 0.53 | % | 2.37 | % | |||||||
Investment securities (2) | 4,545,090 | 3,642,142 | 60,661 | 56,811 | 2.68 | 3.15 | |||||||||||||
FHLB and FRB stock | 125,094 | 100,187 | 3,342 | 2,794 | 5.37 | 5.62 | |||||||||||||
Liquidity management assets (3)(8) | $ | 6,999,672 | $ | 4,637,826 | $ | 70,183 | $ | 70,111 | 2.02 | % | 3.05 | % | |||||||
Other earning assets (3)(4)(8) | 18,041 | 14,661 | 280 | 349 | 3.13 | 4.79 | |||||||||||||
Mortgage loans held-for-sale | 554,482 | 235,220 | 7,929 | 5,313 | 2.88 | 4.55 | |||||||||||||
Loans, net of unearned income (3)(5)(8) | 28,636,678 | 24,218,946 | 598,021 | 608,212 | 4.20 | 5.06 | |||||||||||||
Total earning assets (8) | $ | 36,208,873 | $ | 29,106,653 | $ | 676,413 | $ | 683,985 | 3.76 | % | 4.74 | % | |||||||
Allowance for loan losses | (199,388 | ) | (161,024 | ) | |||||||||||||||
Cash and due from banks | 337,202 | 278,324 | |||||||||||||||||
Other assets | 2,987,422 | 2,414,336 | |||||||||||||||||
Total assets | $ | 39,334,109 | $ | 31,638,289 | |||||||||||||||
NOW and interest bearing demand deposits | $ | 3,218,429 | $ | 2,840,886 | $ | 5,227 | $ | 10,166 | 0.33 | % | 0.72 | % | |||||||
Wealth management deposits | 3,609,857 | 2,609,839 | 14,179 | 14,091 | 0.79 | 1.09 | |||||||||||||
Money market accounts | 8,359,370 | 6,005,902 | 35,503 | 40,911 | 0.85 | 1.37 | |||||||||||||
Savings accounts | 3,292,158 | 2,734,228 | 9,630 | 9,208 | 0.59 | 0.68 | |||||||||||||
Time deposits | 5,315,554 | 5,295,241 | 52,953 | 53,624 | 2.00 | 2.04 | |||||||||||||
Interest-bearing deposits | $ | 23,795,368 | $ | 19,486,096 | $ | 117,492 | $ | 128,000 | 0.99 | % | 1.32 | % | |||||||
Federal Home Loan Bank advances | 1,082,994 | 732,834 | 8,294 | 6,643 | 1.54 | 1.83 | |||||||||||||
Other borrowings | 481,463 | 442,189 | 6,982 | 7,158 | 2.92 | 3.26 | |||||||||||||
Subordinated notes | 436,173 | 180,219 | 10,978 | 4,581 | 5.03 | 5.08 | |||||||||||||
Junior subordinated debentures | 253,566 | 253,566 | 5,563 | 6,214 | 4.34 | 4.88 | |||||||||||||
Total interest-bearing liabilities | $ | 26,049,564 | $ | 21,094,904 | $ | 149,309 | $ | 152,596 | 1.15 | % | 1.46 | % | |||||||
Non-interest bearing deposits | 8,421,353 | 6,466,122 | |||||||||||||||||
Other liabilities | 1,053,684 | 715,263 | |||||||||||||||||
Equity | 3,809,508 | 3,362,000 | |||||||||||||||||
Total liabilities and shareholders’ equity | $ | 39,334,109 | $ | 31,638,289 | |||||||||||||||
Interest rate spread (6)(8) | 2.61 | % | 3.28 | % | |||||||||||||||
Less: Fully taxable-equivalent adjustment | (2,530 | ) | (3,201 | ) | (0.02 | ) | (0.02 | ) | |||||||||||
Net free funds/contribution (7) | $ | 10,159,309 | $ | 8,011,749 | 0.32 | 0.40 | |||||||||||||
Net interest income/ margin (GAAP) (8) | $ | 524,574 | $ | 528,188 | 2.91 | % | 3.66 | % | |||||||||||
Fully taxable-equivalent adjustment | 2,530 | 3,201 | 0.02 | 0.02 | |||||||||||||||
Net interest income/ margin, fully taxable-equivalent (non-GAAP) (8) | $ | 527,104 | $ | 531,389 | 2.93 | % | 3.68 | % | |||||||||||
(1) | Includes interest-bearing deposits from banks, federal funds sold and securities purchased under resale agreements. |
(2) | Investment securities includes investment securities classified as available-for-sale and held-to-maturity, and equity securities with readily determinable fair values. Equity securities without readily determinable fair values are included within other assets. |
(3) | Interest income on tax-advantaged loans, trading securities and investment securities reflects a taxable-equivalent adjustment based on a marginal federal corporate tax rate in effect as of the applicable period. |
(4) | Other earning assets include brokerage customer receivables and trading account securities. |
(5) | Loans, net of unearned income, include non-accrual loans. |
(6) | Interest rate spread is the difference between the yield earned on earning assets and the rate paid on interest-bearing liabilities. |
(7) | Net free funds are the difference between total average earning assets and total average interest-bearing liabilities. The estimated contribution to net interest margin from net free funds is calculated using the rate paid for total interest-bearing liabilities. |
(8) | See “Supplemental Non-GAAP Financial Measures/Ratios” at Table 18 for additional information on this performance ratio. |
22
TABLE 8: INTEREST RATE SENSITIVITY
As an ongoing part of its financial strategy, the Company attempts to manage the impact of fluctuations in market interest rates on net interest income. Management measures its exposure to changes in interest rates by modeling many different interest rate scenarios.
The following interest rate scenarios display the percentage change in net interest income over a one-year time horizon assuming increases of 100 and 200 basis points and a decrease of 100 basis points. The Static Shock Scenario results incorporate actual cash flows and repricing characteristics for balance sheet instruments following an instantaneous, parallel change in market rates based upon a static (i.e. no growth or constant) balance sheet. Conversely, the Ramp Scenario results incorporate management’s projections of future volume and pricing of each of the product lines following a gradual, parallel change in market rates over twelve months. Actual results may differ from these simulated results due to timing, magnitude, and frequency of interest rate changes as well as changes in market conditions and management strategies. The interest rate sensitivity for both the Static Shock and Ramp Scenario is as follows:
Static Shock Scenario | +200 Basis Points | +100 Basis Points | -100 Basis Points | ||||||
Jun 30, 2020 | 25.9 | % | 12.6 | % | (8.3 | )% | |||
Mar 31, 2020 | 22.5 | 10.6 | (9.4 | ) | |||||
Dec 31, 2019 | 18.6 | 9.7 | (10.9 | ) | |||||
Sep 30, 2019 | 20.7 | 10.5 | (11.9 | ) | |||||
Jun 30, 2019 | 17.3 | 8.9 | (10.2 | ) | |||||
Ramp Scenario | +200 Basis Points | +100 Basis Points | -100 Basis Points | |||||
Jun 30, 2020 | 13.0 | % | 6.7 | % | (3.2 | )% | ||
Mar 31, 2020 | 7.7 | 3.7 | (3.8 | ) | ||||
Dec 31, 2019 | 9.3 | 4.8 | (5.0 | ) | ||||
Sep 30, 2019 | 10.1 | 5.2 | (5.6 | ) | ||||
Jun 30, 2019 | 8.3 | 4.3 | (4.6 | ) | ||||
23
TABLE 9: MATURITIES AND SENSITIVITIES TO CHANGES IN INTEREST RATES
Loans repricing or maturity period | |||||||||||||||
As of June 30, 2020 | One year or less | From one to five years | Over five years | ||||||||||||
(In thousands) | Total | ||||||||||||||
Commercial | |||||||||||||||
Fixed rate | $ | 270,078 | $ | 5,117,468 | $ | 822,542 | $ | 6,210,088 | |||||||
Variable rate | 5,628,606 | 20,411 | 127 | 5,649,144 | |||||||||||
Total commercial | $ | 5,898,684 | $ | 5,137,879 | $ | 822,669 | $ | 11,859,232 | |||||||
Commercial real estate | |||||||||||||||
Fixed rate | 542,353 | 2,163,918 | 431,543 | 3,137,814 | |||||||||||
Variable rate | 5,021,539 | 41,392 | — | 5,062,931 | |||||||||||
Total commercial real estate | $ | 5,563,892 | $ | 2,205,310 | $ | 431,543 | $ | 8,200,745 | |||||||
Home equity | |||||||||||||||
Fixed rate | 23,244 | 4,807 | 27 | 28,078 | |||||||||||
Variable rate | 438,518 | — | — | 438,518 | |||||||||||
Total home equity | $ | 461,762 | $ | 4,807 | $ | 27 | $ | 466,596 | |||||||
Residential real estate | |||||||||||||||
Fixed rate | 38,039 | 11,576 | 487,530 | 537,145 | |||||||||||
Variable rate | 60,409 | 341,479 | 488,396 | 890,284 | |||||||||||
Total residential real estate | $ | 98,448 | $ | 353,055 | $ | 975,926 | $ | 1,427,429 | |||||||
Premium finance receivables - commercial | |||||||||||||||
Fixed rate | 3,909,677 | 90,096 | 1 | 3,999,774 | |||||||||||
Variable rate | — | — | — | — | |||||||||||
Total premium finance receivables - commercial | $ | 3,909,677 | $ | 90,096 | $ | 1 | $ | 3,999,774 | |||||||
Premium finance receivables - life insurance | |||||||||||||||
Fixed rate | 43,954 | 153,947 | 21,576 | 219,477 | |||||||||||
Variable rate | 5,181,325 | — | — | 5,181,325 | |||||||||||
Total premium finance receivables - life insurance | $ | 5,225,279 | $ | 153,947 | $ | 21,576 | $ | 5,400,802 | |||||||
Consumer and other | |||||||||||||||
Fixed rate | 22,190 | 6,456 | 1,583 | 30,229 | |||||||||||
Variable rate | 18,096 | — | — | 18,096 | |||||||||||
Total consumer and other | $ | 40,286 | $ | 6,456 | $ | 1,583 | $ | 48,325 | |||||||
Total per category | |||||||||||||||
Fixed rate | 4,849,535 | 7,548,268 | 1,764,802 | 14,162,605 | |||||||||||
Variable rate | 16,348,493 | 403,282 | 488,523 | 17,240,298 | |||||||||||
Total loans, net of unearned income | $ | 21,198,028 | $ | 7,951,550 | $ | 2,253,325 | $ | 31,402,903 | |||||||
Variable Rate Loan Pricing by Index: | |||||||||||||||
Prime | $ | 2,164,995 | |||||||||||||
One- month LIBOR | 8,661,027 | ||||||||||||||
Three- month LIBOR | 301,327 | ||||||||||||||
Twelve- month LIBOR | 5,846,946 | ||||||||||||||
Other | 266,003 | ||||||||||||||
Total variable rate | $ | 17,240,298 | |||||||||||||
24
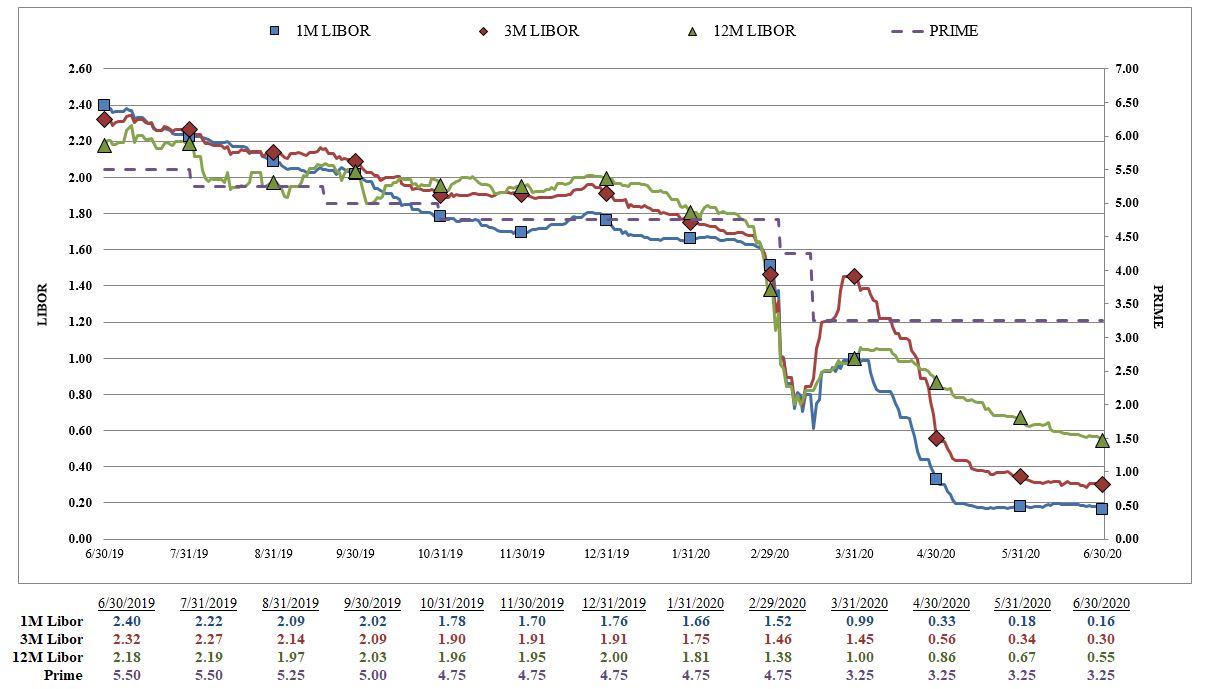 Source: Bloomberg
As noted in the table on the previous page, the majority of the Company’s portfolio is tied to LIBOR indices which, as shown in the table above, do not mirror the same changes as the Prime rate which has historically moved when the Federal Reserve raises or lowers interest rates. Specifically, the Company has $8.7 billion of variable rate loans tied to one-month LIBOR and $5.8 billion of variable rate loans tied to twelve-month LIBOR. The above chart shows:
Basis Points (bps) Change in | |||||||
Prime | 1-month LIBOR | 12-month LIBOR | |||||
Second Quarter 2020 | 0 | bps | -83 | bps | -45 | bps | |
First Quarter 2020 | -150 | -77 | -100 | ||||
Fourth Quarter 2019 | -25 | -26 | -3 | ||||
Third Quarter 2019 | -50 | -38 | -15 | ||||
Second Quarter 2019 | 0 | -9 | -53 | ||||
25
TABLE 10: ALLOWANCE FOR CREDIT LOSSES
Three Months Ended | Six Months Ended | ||||||||||||||||||||||||||
Jun 30, | Mar 31, | Dec 31, | Sep 30, | Jun 30, | Jun 30, | Jun 30, | |||||||||||||||||||||
(Dollars in thousands) | 2020 | 2020 | 2019 | 2019 | 2019 | 2020 | 2019 | ||||||||||||||||||||
Allowance for credit losses at beginning of period | $ | 253,482 | $ | 158,461 | $ | 163,273 | $ | 161,901 | $ | 159,622 | $ | 158,461 | $ | 154,164 | |||||||||||||
Cumulative effect adjustment from the adoption of ASU 2016-13 | — | 47,418 | — | — | — | 47,418 | — | ||||||||||||||||||||
Provision for credit losses | 135,053 | 52,961 | 7,826 | 10,834 | 24,580 | 188,014 | 35,204 | ||||||||||||||||||||
Other adjustments | 42 | (73 | ) | 30 | (13 | ) | (11 | ) | (31 | ) | (38 | ) | |||||||||||||||
Charge-offs: | |||||||||||||||||||||||||||
Commercial | 5,686 | 2,153 | 11,222 | 6,775 | 17,380 | 7,839 | 17,883 | ||||||||||||||||||||
Commercial real estate | 7,087 | 85 | 533 | 809 | 326 | 7,172 | 4,060 | ||||||||||||||||||||
Home equity | 239 | 1,001 | 1,330 | 1,594 | 690 | 1,240 | 778 | ||||||||||||||||||||
Residential real estate | 208 | 356 | 483 | 25 | 287 | 564 | 290 | ||||||||||||||||||||
Premium finance receivables | 3,434 | 3,184 | 3,817 | 1,866 | 5,009 | 6,618 | 7,219 | ||||||||||||||||||||
Consumer and other | 99 | 128 | 167 | 117 | 136 | 227 | 238 | ||||||||||||||||||||
PCD (1) | 222 | 530 | — | — | — | 752 | — | ||||||||||||||||||||
Total charge-offs | 16,975 | 7,437 | 17,552 | 11,186 | 23,828 | 24,412 | 30,468 | ||||||||||||||||||||
Recoveries: | |||||||||||||||||||||||||||
Commercial | 86 | 356 | 1,871 | 367 | 289 | 442 | 607 | ||||||||||||||||||||
Commercial real estate | 307 | 79 | 1,404 | 385 | 247 | 386 | 727 | ||||||||||||||||||||
Home equity | 36 | 294 | 166 | 183 | 68 | 330 | 130 | ||||||||||||||||||||
Residential real estate | 30 | 60 | 50 | 203 | 140 | 90 | 169 | ||||||||||||||||||||
Premium finance receivables | 833 | 1,110 | 1,350 | 563 | 734 | 1,943 | 1,290 | ||||||||||||||||||||
Consumer and other | 58 | 39 | 43 | 36 | 60 | 97 | 116 | ||||||||||||||||||||
PCD (1) | 222 | 214 | — | — | — | 436 | — | ||||||||||||||||||||
Total recoveries | 1,572 | 2,152 | 4,884 | 1,737 | 1,538 | 3,724 | 3,039 | ||||||||||||||||||||
Net charge-offs | (15,403 | ) | (5,285 | ) | (12,668 | ) | (9,449 | ) | (22,290 | ) | (20,688 | ) | (27,429 | ) | |||||||||||||
Allowance for credit losses at period end | $ | 373,174 | $ | 253,482 | $ | 158,461 | $ | 163,273 | $ | 161,901 | $ | 373,174 | $ | 161,901 | |||||||||||||
Annualized net charge-offs by category as a percentage of its own respective category’s average: | |||||||||||||||||||||||||||
Commercial | 0.20 | % | 0.09 | % | 0.46 | % | 0.31 | % | 0.85 | % | 0.15 | % | 0.44 | % | |||||||||||||
Commercial real estate | 0.34 | 0.00 | (0.04 | ) | 0.02 | 0.00 | 0.17 | 0.10 | |||||||||||||||||||
Home equity | 0.17 | 0.57 | 0.89 | 1.08 | 0.47 | 0.37 | 0.25 | ||||||||||||||||||||
Residential real estate | 0.06 | 0.10 | 0.14 | (0.07 | ) | 0.06 | 0.08 | 0.03 | |||||||||||||||||||
Premium finance receivables | 0.12 | 0.10 | 0.28 | 0.15 | 0.55 | 0.11 | 0.16 | ||||||||||||||||||||
Consumer and other | 0.22 | 0.59 | 0.41 | 0.27 | 0.30 | 0.28 | 0.23 | ||||||||||||||||||||
PCD (1) | 0.00 | 0.32 | — | — | — | 0.25 | — | ||||||||||||||||||||
Total loans, net of unearned income | 0.20 | % | 0.08 | % | 0.19 | % | 0.15 | % | 0.36 | % | 0.15 | % | 0.23 | % | |||||||||||||
Net charge-offs as a percentage of the provision for credit losses | 11.41 | % | 9.98 | % | 161.87 | % | 87.22 | % | 90.68 | % | 11.00 | % | 77.92 | % | |||||||||||||
Loans at period-end | $ | 31,402,903 | $ | 27,807,321 | $ | 26,800,290 | $ | 25,710,171 | $ | 25,304,659 | |||||||||||||||||
Allowance for loan losses as a percentage of loans at period end | 1.00 | % | 0.78 | % | 0.59 | % | 0.63 | % | 0.63 | % | |||||||||||||||||
Allowance for loan and unfunded lending-related commitment losses as a percentage of loans at period end | 1.19 | 0.91 | 0.59 | 0.64 | 0.64 | ||||||||||||||||||||||
Allowance for loan and unfunded lending-related commitment losses as a percentage of loans at period end, excluding PPP loans | 1.33 | 0.91 | 0.59 | 0.64 | 0.64 | ||||||||||||||||||||||
(1) | As a result of the adoption of ASU 2016-13, the Company transitioned all previously classified PCI loans to PCD loans effective January 1, 2020. For prior periods presented, the previously classified PCI charge-offs and recoveries are presented with the non-PCI charge-offs and recoveries in their respective class. |
26
TABLE 11: ALLOWANCE AND PROVISON FOR CREDIT LOSSES BY COMPONENT
Three Months Ended | Six Months Ended | ||||||||||||||||||||||||||
Jun 30, | Mar 31, | Dec 31, | Sep 30, | Jun 30, | Jun 30, | Jun 30, | |||||||||||||||||||||
(In thousands) | 2020 | 2020 | 2019 | 2019 | 2019 | 2020 | 2019 | ||||||||||||||||||||
Provision for loan losses | $ | 112,822 | $ | 50,396 | $ | 7,704 | $ | 10,804 | $ | 24,510 | $ | 163,218 | $ | 35,118 | |||||||||||||
Provision for unfunded lending-related commitments losses | 22,236 | 2,569 | 122 | 30 | 70 | 24,805 | 86 | ||||||||||||||||||||
Provision for held-to-maturity securities losses | (5 | ) | (4 | ) | — | — | — | (9 | ) | — | |||||||||||||||||
Provision for credit losses | $ | 135,053 | $ | 52,961 | $ | 7,826 | $ | 10,834 | $ | 24,580 | $ | 188,014 | $ | 35,204 | |||||||||||||
Allowance for loan losses | $ | 313,510 | $ | 216,050 | $ | 156,828 | $ | 161,763 | $ | 160,421 | |||||||||||||||||
Allowance for unfunded lending-related commitments losses | 59,599 | 37,362 | 1,633 | 1,510 | 1,480 | ||||||||||||||||||||||
Allowance for loan losses and unfunded lending-related commitments losses | 373,109 | 253,412 | 158,461 | 163,273 | 161,901 | ||||||||||||||||||||||
Allowance for held-to-maturity securities losses | 65 | 70 | — | — | — | ||||||||||||||||||||||
Allowance for credit losses | $ | 373,174 | $ | 253,482 | $ | 158,461 | $ | 163,273 | $ | 161,901 | |||||||||||||||||
27
TABLE 12: ALLOWANCE BY LOAN PORTFOLIO
The table below summarizes the calculation of allowance for loan losses and allowance for unfunded lending-related commitments losses for the Company’s core, niche and consumer and purchased loan portfolios, as of June 30, 2020, March 31, 2020, and December 31, 2019.
As of June 30, 2020 | As of March 31, 2020 | As of December 31, 2019 | ||||||||||||||||||||||||||||
(Dollars in thousands) | Recorded Investment | Calculated Allowance | % of its category’s balance | Recorded Investment | Calculated Allowance | % of its category’s balance | Recorded Investment | Calculated Allowance | % of its category’s balance | |||||||||||||||||||||
Commercial: (1) | ||||||||||||||||||||||||||||||
Commercial, industrial and other, excluding PPP loans | $ | 8,396,485 | $ | 130,585 | 1.56 | % | $ | 8,888,342 | $ | 104,754 | 1.18 | % | $ | 8,121,584 | $ | 64,829 | 0.80 | % | ||||||||||||
Commercial real estate: (1) | ||||||||||||||||||||||||||||||
Construction and development | 1,193,735 | 67,333 | 5.64 | 1,113,863 | 31,687 | 2.84 | 1,075,545 | 16,418 | 1.53 | |||||||||||||||||||||
Non-construction | 6,397,847 | 108,613 | 1.70 | 6,388,142 | 68,914 | 1.08 | 6,199,042 | 51,935 | 0.84 | |||||||||||||||||||||
Home equity (1) | 427,668 | 11,596 | 2.71 | 451,804 | 11,844 | 2.62 | 469,498 | 3,860 | 0.82 | |||||||||||||||||||||
Residential real estate (1) | 1,338,801 | 11,200 | 0.84 | 1,274,351 | 11,621 | 0.91 | 1,246,829 | 9,736 | 0.78 | |||||||||||||||||||||
Total core loan portfolio | $ | 17,754,536 | $ | 329,327 | 1.85 | % | $ | 18,116,502 | $ | 228,820 | 1.26 | % | $ | 17,112,498 | $ | 146,778 | 0.86 | % | ||||||||||||
Commercial PPP loans | $ | 3,335,368 | $ | 4 | 0.00 | % | $ | — | $ | — | — | % | $ | — | $ | — | — | % | ||||||||||||
Premium finance receivables (1) | ||||||||||||||||||||||||||||||
Commercial insurance loans | 3,999,774 | 17,122 | 0.43 | 3,465,055 | 7,426 | 0.21 | 3,442,027 | 8,132 | 0.24 | |||||||||||||||||||||
Life insurance loans | 5,277,126 | 470 | 0.01 | 5,084,695 | 454 | 0.01 | 4,935,321 | 1,515 | 0.03 | |||||||||||||||||||||
Consumer and other(1) | 45,474 | 556 | 1.22 | 34,111 | 331 | 0.97 | 107,053 | 1,704 | 1.59 | |||||||||||||||||||||
Total niche and consumer loan portfolio | $ | 12,657,742 | $ | 18,152 | 0.14 | % | $ | 8,583,861 | $ | 8,211 | 0.10 | % | $ | 8,484,401 | $ | 11,351 | 0.13 | % | ||||||||||||
Purchased commercial (2) | $ | 127,379 | $ | 3,008 | 2.36 | % | $ | 137,544 | $ | 2,592 | 1.88 | % | $ | 164,336 | $ | 91 | 0.06 | % | ||||||||||||
Purchased commercial real estate (2) | 609,163 | 21,180 | 3.48 | 683,526 | 12,195 | 1.78 | 745,689 | 158 | 0.02 | |||||||||||||||||||||
Purchased home equity (2) | 38,928 | 593 | 1.52 | 42,851 | 550 | 1.28 | 43,568 | 18 | 0.04 | |||||||||||||||||||||
Purchased residential real estate(2) | 88,628 | 715 | 0.81 | 103,038 | 929 | 0.90 | 107,392 | 64 | 0.06 | |||||||||||||||||||||
Purchased life insurance loans (2) | 123,676 | — | — | 136,944 | — | — | 139,281 | — | — | |||||||||||||||||||||
Purchased consumer and other (2) | 2,851 | 134 | 4.70 | 3,055 | 115 | 3.76 | 3,125 | 1 | 0.03 | |||||||||||||||||||||
Total purchased loan portfolio | $ | 990,625 | $ | 25,630 | 2.59 | % | $ | 1,106,958 | $ | 16,381 | 1.48 | % | $ | 1,203,391 | $ | 332 | 0.03 | % | ||||||||||||
Total loans, net of unearned income | $ | 31,402,903 | $ | 373,109 | 1.19 | % | $ | 27,807,321 | $ | 253,412 | 0.91 | % | $ | 26,800,290 | $ | 158,461 | 0.59 | % | ||||||||||||
Total loans, net of unearned income, excluding PPP loans | $ | 28,067,535 | $ | 373,105 | 1.33 | % | $ | 27,807,321 | $ | 253,412 | 0.91 | % | $ | 26,800,290 | $ | 158,461 | 0.59 | % | ||||||||||||
(1) | As a result of the adoption of ASU 2016-13, the Company transitioned all previously classified PCI loans to PCD loans effective January 1, 2020. Excludes PCD loans. |
(2) | Includes PCD loans. |
28
TABLE 13: LOAN PORTFOLIO AGING
As of June 30, 2020 | March 31, 2020 | |||||||||||||||||||||||
(Dollars in thousands) | Non-PCD | PCD (1) | Total Loans | Non-PCD | PCD (1) | Total Loans | ||||||||||||||||||
Loan Balances: | ||||||||||||||||||||||||
Commercial | ||||||||||||||||||||||||
Nonaccrual | $ | 39,589 | $ | 3,293 | $ | 42,882 | $ | 47,661 | $ | 2,255 | $ | 49,916 | ||||||||||||
90+ days and still accruing | 1,374 | — | 1,374 | 3 | 1,238 | 1,241 | ||||||||||||||||||
60-89 days past due | 8,107 | 845 | 8,952 | 8,541 | 332 | 8,873 | ||||||||||||||||||
30-59 days past due | 22,421 | 1,299 | 23,720 | 86,129 | — | 86,129 | ||||||||||||||||||
Current | 11,762,808 | 19,496 | 11,782,304 | 8,857,394 | 22,333 | 8,879,727 | ||||||||||||||||||
Total Commercial | $ | 11,834,299 | $ | 24,933 | $ | 11,859,232 | $ | 8,999,728 | $ | 26,158 | $ | 9,025,886 | ||||||||||||
Commercial real estate | ||||||||||||||||||||||||
Nonaccrual | $ | 43,334 | $ | 21,223 | $ | 64,557 | $ | 36,904 | $ | 25,926 | $ | 62,830 | ||||||||||||
90+ days and still accruing | — | — | — | 516 | — | 516 | ||||||||||||||||||
60-89 days past due | 22,402 | 4,078 | 26,480 | 7,415 | 2,797 | 10,212 | ||||||||||||||||||
30-59 days past due | 56,501 | 19,027 | 75,528 | 65,578 | 9,490 | 75,068 | ||||||||||||||||||
Current | 7,885,483 | 148,697 | 8,034,180 | 7,863,567 | 173,338 | 8,036,905 | ||||||||||||||||||
Total Commercial real estate | $ | 8,007,720 | $ | 193,025 | $ | 8,200,745 | $ | 7,973,980 | $ | 211,551 | $ | 8,185,531 | ||||||||||||
Home equity | ||||||||||||||||||||||||
Nonaccrual | $ | 7,261 | $ | — | $ | 7,261 | $ | 7,243 | $ | — | $ | 7,243 | ||||||||||||
90+ days and still accruing | — | — | — | — | — | — | ||||||||||||||||||
60-89 days past due | — | — | — | 214 | — | 214 | ||||||||||||||||||
30-59 days past due | 1,296 | — | 1,296 | 2,096 | — | 2,096 | ||||||||||||||||||
Current | 458,039 | — | 458,039 | 485,102 | — | 485,102 | ||||||||||||||||||
Total Home equity | $ | 466,596 | $ | — | $ | 466,596 | $ | 494,655 | $ | — | $ | 494,655 | ||||||||||||
Residential real estate | ||||||||||||||||||||||||
Nonaccrual | $ | 13,941 | $ | 5,588 | $ | 19,529 | $ | 13,132 | $ | 5,833 | $ | 18,965 | ||||||||||||
90+ days and still accruing | — | — | — | 605 | — | 605 | ||||||||||||||||||
60-89 days past due | 1,318 | 188 | 1,506 | 345 | — | 345 | ||||||||||||||||||
30-59 days past due | 3,595 | 805 | 4,400 | 26,437 | 2,546 | 28,983 | ||||||||||||||||||
Current | 1,391,944 | 10,050 | 1,401,994 | 1,319,452 | 9,039 | 1,328,491 | ||||||||||||||||||
Total Residential real estate | $ | 1,410,798 | $ | 16,631 | $ | 1,427,429 | $ | 1,359,971 | $ | 17,418 | $ | 1,377,389 | ||||||||||||
Premium finance receivables | ||||||||||||||||||||||||
Nonaccrual | $ | 16,460 | $ | — | $ | 16,460 | $ | 21,058 | $ | — | $ | 21,058 | ||||||||||||
90+ days and still accruing | 35,638 | — | 35,638 | 16,505 | — | 16,505 | ||||||||||||||||||
60-89 days past due | 42,353 | — | 42,353 | 12,730 | — | 12,730 | ||||||||||||||||||
30-59 days past due | 61,160 | — | 61,160 | 70,185 | — | 70,185 | ||||||||||||||||||
Current | 9,121,289 | 123,676 | 9,244,965 | 8,429,272 | 136,944 | 8,566,216 | ||||||||||||||||||
Total Premium finance receivables | $ | 9,276,900 | $ | 123,676 | $ | 9,400,576 | $ | 8,549,750 | $ | 136,944 | $ | 8,686,694 | ||||||||||||
Consumer and other | ||||||||||||||||||||||||
Nonaccrual | $ | 255 | $ | 172 | $ | 427 | $ | 232 | $ | 171 | $ | 403 | ||||||||||||
90+ days and still accruing | 156 | — | 156 | 78 | — | 78 | ||||||||||||||||||
60-89 days past due | 4 | — | 4 | 607 | 18 | 625 | ||||||||||||||||||
30-59 days past due | 281 | — | 281 | 188 | 19 | 207 | ||||||||||||||||||
Current | 46,159 | 1,298 | 47,457 | 34,441 | 1,412 | 35,853 | ||||||||||||||||||
Total Consumer and other | $ | 46,855 | $ | 1,470 | $ | 48,325 | $ | 35,546 | $ | 1,620 | $ | 37,166 | ||||||||||||
Total loans, net of unearned income | ||||||||||||||||||||||||
Nonaccrual | $ | 120,840 | $ | 30,276 | $ | 151,116 | $ | 126,230 | $ | 34,185 | $ | 160,415 | ||||||||||||
90+ days and still accruing | 37,168 | — | 37,168 | 17,707 | 1,238 | 18,945 | ||||||||||||||||||
60-89 days past due | 74,184 | 5,111 | 79,295 | 29,852 | 3,147 | 32,999 | ||||||||||||||||||
30-59 days past due | 145,254 | 21,131 | 166,385 | 250,613 | 12,055 | 262,668 | ||||||||||||||||||
Current | 30,665,722 | 303,217 | 30,968,939 | 26,989,228 | 343,066 | 27,332,294 | ||||||||||||||||||
Total loans, net of unearned income | $ | 31,043,168 | $ | 359,735 | $ | 31,402,903 | $ | 27,413,630 | $ | 393,691 | $ | 27,807,321 | ||||||||||||
(1) | As a result of the adoption of ASU 2016-13, the Company transitioned all previously classified PCI loans to PCD loans effective January 1, 2020. For prior periods presented, the previously classified PCI loans are presented with the PCD loans in their respective class. |
29
TABLE 14: NON-PERFORMING ASSETS AND TROUBLED DEBT RESTRUCTURINGS ("TDRs")
Jun 30, | Mar 31, | Dec 31, | Sep 30, | Jun 30, | |||||||||||||||||||||
(Dollars in thousands) | 2020 | 2020 | 2019 | 2019 | 2019 | ||||||||||||||||||||
Loans past due greater than 90 days and still accruing (1): | Non-PCD | PCD(2) | Non-PCD | PCD(2) | |||||||||||||||||||||
Commercial | $ | 1,374 | $ | — | $ | 3 | 1,238 | $ | — | $ | — | $ | 488 | ||||||||||||
Commercial real estate | — | — | 516 | — | — | — | — | ||||||||||||||||||
Home equity | — | — | — | — | — | — | — | ||||||||||||||||||
Residential real estate | — | — | 605 | — | — | — | — | ||||||||||||||||||
Premium finance receivables | 35,638 | — | 16,505 | — | 11,517 | 10,612 | 6,940 | ||||||||||||||||||
Consumer and other | 156 | — | 78 | — | 163 | 53 | 172 | ||||||||||||||||||
Total loans past due greater than 90 days and still accruing | 37,168 | — | 17,707 | 1,238 | 11,680 | 10,665 | 7,600 | ||||||||||||||||||
Non-accrual loans: | |||||||||||||||||||||||||
Commercial | 39,589 | 3,293 | 47,661 | 2,255 | 37,224 | 43,931 | 47,604 | ||||||||||||||||||
Commercial real estate | 43,334 | 21,223 | 36,904 | 25,926 | 26,113 | 21,557 | 20,875 | ||||||||||||||||||
Home equity | 7,261 | — | 7,243 | — | 7,363 | 7,920 | 8,489 | ||||||||||||||||||
Residential real estate | 13,941 | 5,588 | 13,132 | 5,833 | 13,797 | 13,447 | 14,236 | ||||||||||||||||||
Premium finance receivables | 16,460 | — | 21,058 | — | 21,180 | 16,540 | 14,423 | ||||||||||||||||||
Consumer and other | 255 | 172 | 232 | 171 | 231 | 224 | 220 | ||||||||||||||||||
Total non-accrual loans | 120,840 | 30,276 | 126,230 | 34,185 | 105,908 | 103,619 | 105,847 | ||||||||||||||||||
Total non-performing loans: | |||||||||||||||||||||||||
Commercial | 40,963 | 3,293 | 47,664 | 3,493 | 37,224 | 43,931 | 48,092 | ||||||||||||||||||
Commercial real estate | 43,334 | 21,223 | 37,420 | 25,926 | 26,113 | 21,557 | 20,875 | ||||||||||||||||||
Home equity | 7,261 | — | 7,243 | — | 7,363 | 7,920 | 8,489 | ||||||||||||||||||
Residential real estate | 13,941 | 5,588 | 13,737 | 5,833 | 13,797 | 13,447 | 14,236 | ||||||||||||||||||
Premium finance receivables | 52,098 | — | 37,563 | — | 32,697 | 27,152 | 21,363 | ||||||||||||||||||
Consumer and other | 411 | 172 | 310 | 171 | 394 | 277 | 392 | ||||||||||||||||||
Total non-performing loans | $ | 158,008 | $ | 30,276 | $ | 143,937 | 35,423 | $ | 117,588 | $ | 114,284 | $ | 113,447 | ||||||||||||
Other real estate owned | 2,409 | — | 2,701 | — | 5,208 | 8,584 | 9,920 | ||||||||||||||||||
Other real estate owned - from acquisitions | 7,788 | — | 8,325 | — | 9,963 | 8,898 | 9,917 | ||||||||||||||||||
Other repossessed assets | — | — | — | — | 4 | 257 | 263 | ||||||||||||||||||
Total non-performing assets | $ | 168,205 | $ | 30,276 | $ | 154,963 | 35,423 | $ | 132,763 | $ | 132,023 | $ | 133,547 | ||||||||||||
Accruing TDRs not included within non-performing assets | $ | 47,750 | $ | 859 | $ | 46,995 | $ | 54 | $ | 36,725 | $ | 45,178 | $ | 45,862 | |||||||||||
Total non-performing loans by category as a percent of its own respective category’s period-end balance: | |||||||||||||||||||||||||
Commercial | 0.35 | % | 13.21 | % | 0.53 | % | 13.35 | % | 0.45 | % | 0.54 | % | 0.58 | % | |||||||||||
Commercial real estate | 0.54 | 10.99 | 0.47 | 12.26 | 0.33 | 0.29 | 0.29 | ||||||||||||||||||
Home equity | 1.56 | — | 1.46 | — | 1.44 | 1.55 | 1.61 | ||||||||||||||||||
Residential real estate | 0.99 | 33.60 | 1.01 | 33.49 | 1.02 | 1.10 | 1.27 | ||||||||||||||||||
Premium finance receivables | 0.56 | — | 0.44 | — | 0.39 | 0.34 | 0.27 | ||||||||||||||||||
Consumer and other | 0.88 | 11.70 | 0.87 | 10.56 | 0.36 | 0.31 | 0.36 | ||||||||||||||||||
Total loans, net of unearned income | 0.51 | % | 8.42 | % | 0.53 | % | 9.00 | % | 0.44 | % | 0.44 | % | 0.45 | % | |||||||||||
Total non-performing assets as a percentage of total assets | 0.46 | % | 0.49 | % | 0.36 | % | 0.38 | % | 0.40 | % | |||||||||||||||
Allowance for loan losses as a percentage of total non-performing loans | 166.51 | % | 120.46 | % | 133.37 | % | 141.54 | % | 141.41 | % | |||||||||||||||
(1) | As of June 30, 2020, March 31, 2020, December 31, 2019, September 30, 2019, and June 30, 2019, no TDRs were past due greater than 90 days and still accruing interest. |
(2) | As a result of the adoption of ASU 2016-13, the Company transitioned all previously classified PCI loans to PCD loans effective January 1, 2020. |
30
Non-performing Loans Rollforward
Three Months Ended | Six Months Ended | |||||||||||||||||||||||||||||||
Jun 30, | Mar 31, | Dec 31, | Sep 30, | Jun 30, | Jun 30, | Jun 30, | ||||||||||||||||||||||||||
(In thousands) | 2020 | 2020 | 2019 | 2019 | 2019 | 2020 | 2019 | |||||||||||||||||||||||||
Non-PCD | PCD(2) | Non-PCD | PCD(2) | |||||||||||||||||||||||||||||
Balance at beginning of period | $ | 143,937 | $ | 35,423 | $ | 117,588 | $ | — | $ | 114,284 | $ | 113,447 | $ | 117,586 | $ | 117,588 | $ | 113,234 | ||||||||||||||
Additions from becoming non-performing in the respective period | 18,547 | 2,256 | 30,390 | 1,805 | 30,977 | 20,781 | 20,567 | 52,998 | 44,597 | |||||||||||||||||||||||
Additions from the adoption of ASU 2016-13 | — | — | — | 37,285 | — | — | — | 37,285 | — | |||||||||||||||||||||||
Return to performing status | (1,328 | ) | (1,238 | ) | (317 | ) | (169 | ) | (243 | ) | (407 | ) | (47 | ) | (3,052 | ) | (14,124 | ) | ||||||||||||||
Payments received | (5,408 | ) | (5,793 | ) | (4,451 | ) | (3,498 | ) | (19,380 | ) | (16,326 | ) | (5,438 | ) | (19,150 | ) | (9,462 | ) | ||||||||||||||
Transfer to OREO and other repossessed assets | — | — | (1,297 | ) | — | — | (1,493 | ) | (1,486 | ) | (1,297 | ) | (1,568 | ) | ||||||||||||||||||
Charge-offs | (12,512 | ) | (372 | ) | (2,551 | ) | — | (11,798 | ) | (6,984 | ) | (16,817 | ) | (15,435 | ) | (20,809 | ) | |||||||||||||||
Net change for niche loans (1) | 14,772 | — | 4,575 | — | 3,748 | 5,266 | (918 | ) | 19,347 | 1,579 | ||||||||||||||||||||||
Balance at end of period | $ | 158,008 | $ | 30,276 | $ | 143,937 | 35,423 | $ | 117,588 | $ | 114,284 | $ | 113,447 | $ | 188,284 | $ | 113,447 | |||||||||||||||
(1) | This includes activity for premium finance receivables and indirect consumer loans. |
(2) | As a result of the adoption of ASU 2016-13, the Company transitioned all previously classified PCI loans to PCD loans effective January 1, 2020. |
TDRs
Jun 30, | Mar 31, | Dec 31, | Sep 30, | Jun 30, | |||||||||||||||
(In thousands) | 2020 | 2020 | 2019 | 2019 | 2019 | ||||||||||||||
Accruing TDRs: | |||||||||||||||||||
Commercial | $ | 5,338 | $ | 6,500 | $ | 4,905 | $ | 14,099 | $ | 15,923 | |||||||||
Commercial real estate | 19,106 | 18,043 | 9,754 | 10,370 | 12,646 | ||||||||||||||
Residential real estate and other | 24,165 | 22,506 | 22,066 | 20,709 | 17,293 | ||||||||||||||
Total accrual | $ | 48,609 | $ | 47,049 | $ | 36,725 | $ | 45,178 | $ | 45,862 | |||||||||
Non-accrual TDRs: (1) | |||||||||||||||||||
Commercial | $ | 20,788 | $ | 17,206 | $ | 13,834 | $ | 7,451 | $ | 21,850 | |||||||||
Commercial real estate | 8,545 | 14,420 | 7,119 | 7,673 | 2,854 | ||||||||||||||
Residential real estate and other | 5,606 | 4,962 | 6,158 | 6,006 | 5,435 | ||||||||||||||
Total non-accrual | $ | 34,939 | $ | 36,588 | $ | 27,111 | $ | 21,130 | $ | 30,139 | |||||||||
Total TDRs: | |||||||||||||||||||
Commercial | $ | 26,126 | $ | 23,706 | $ | 18,739 | $ | 21,550 | $ | 37,773 | |||||||||
Commercial real estate | 27,651 | 32,463 | 16,873 | 18,043 | 15,500 | ||||||||||||||
Residential real estate and other | 29,771 | 27,468 | 28,224 | 26,715 | 22,728 | ||||||||||||||
Total TDRs | $ | 83,548 | $ | 83,637 | $ | 63,836 | $ | 66,308 | $ | 76,001 | |||||||||
(1) | Included in total non-performing loans. |
31
Other Real Estate Owned
Three Months Ended | |||||||||||||||||||
Jun 30, | Mar 31, | Dec 31, | Sep 30, | Jun 30, | |||||||||||||||
(In thousands) | 2020 | 2020 | 2019 | 2019 | 2019 | ||||||||||||||
Balance at beginning of period | $ | 11,026 | $ | 15,171 | $ | 17,482 | $ | 19,837 | $ | 21,520 | |||||||||
Disposals/resolved | (612 | ) | (4,793 | ) | (4,860 | ) | (4,501 | ) | (2,397 | ) | |||||||||
Transfers in at fair value, less costs to sell | — | 954 | 936 | 3,008 | 1,746 | ||||||||||||||
Additions from acquisition | — | — | 2,179 | — | — | ||||||||||||||
Fair value adjustments | (217 | ) | (306 | ) | (566 | ) | (862 | ) | (1,032 | ) | |||||||||
Balance at end of period | $ | 10,197 | $ | 11,026 | $ | 15,171 | $ | 17,482 | $ | 19,837 | |||||||||
Period End | |||||||||||||||||||
Jun 30, | Mar 31, | Dec 31, | Sep 30, | Jun 30, | |||||||||||||||
Balance by Property Type: | 2020 | 2020 | 2019 | 2019 | 2019 | ||||||||||||||
Residential real estate | $ | 1,382 | $ | 1,684 | $ | 1,016 | $ | 1,250 | $ | 1,312 | |||||||||
Residential real estate development | — | — | 810 | 1,282 | 1,282 | ||||||||||||||
Commercial real estate | 8,815 | 9,342 | 13,345 | 14,950 | 17,243 | ||||||||||||||
Total | $ | 10,197 | $ | 11,026 | $ | 15,171 | $ | 17,482 | $ | 19,837 | |||||||||
32
TABLE 15: NON-INTEREST INCOME
Three Months Ended | Q2 2020 compared to Q1 2020 | Q2 2020 compared to Q2 2019 | |||||||||||||||||||||||||||||||
Jun 30, | Mar 31, | Dec 31, | Sep 30, | Jun 30, | |||||||||||||||||||||||||||||
(Dollars in thousands) | 2020 | 2020 | 2019 | 2019 | 2019 | $ Change | % Change | $ Change | % Change | ||||||||||||||||||||||||
Brokerage | $ | 4,147 | $ | 5,281 | $ | 4,859 | $ | 4,686 | $ | 4,764 | $ | (1,134 | ) | (21 | )% | $ | (617 | ) | (13 | )% | |||||||||||||
Trust and asset management | 18,489 | 20,660 | 20,140 | 19,313 | 19,375 | (2,171 | ) | (11 | ) | (886 | ) | (5 | ) | ||||||||||||||||||||
Total wealth management | 22,636 | 25,941 | 24,999 | 23,999 | 24,139 | (3,305 | ) | (13 | ) | (1,503 | ) | (6 | ) | ||||||||||||||||||||
Mortgage banking | 102,324 | 48,326 | 47,860 | 50,864 | 37,411 | 53,998 | 112 | 64,913 | 174 | ||||||||||||||||||||||||
Service charges on deposit accounts | 10,420 | 11,265 | 10,973 | 9,972 | 9,277 | (845 | ) | (8 | ) | 1,143 | 12 | ||||||||||||||||||||||
Gains (losses) on investment securities, net | 808 | (4,359 | ) | 587 | 710 | 864 | 5,167 | NM | (56 | ) | (6 | ) | |||||||||||||||||||||
Fees from covered call options | — | 2,292 | 1,243 | — | 643 | (2,292 | ) | (100 | ) | (643 | ) | (100 | ) | ||||||||||||||||||||
Trading (losses) gains, net | (634 | ) | (451 | ) | 46 | 11 | (44 | ) | (183 | ) | (41 | ) | (590 | ) | NM | ||||||||||||||||||
Operating lease income, net | 11,785 | 11,984 | 12,487 | 12,025 | 11,733 | (199 | ) | (2 | ) | 52 | — | ||||||||||||||||||||||
Other: | |||||||||||||||||||||||||||||||||
Interest rate swap fees | 5,693 | 6,066 | 2,206 | 4,811 | 3,224 | (373 | ) | (6 | ) | 2,469 | 77 | ||||||||||||||||||||||
BOLI | 1,950 | (1,284 | ) | 1,377 | 830 | 1,149 | 3,234 | NM | 801 | 70 | |||||||||||||||||||||||
Administrative services | 933 | 1,112 | 1,072 | 1,086 | 1,009 | (179 | ) | (16 | ) | (76 | ) | (8 | ) | ||||||||||||||||||||
Foreign currency remeasurement (losses) gains | (208 | ) | (151 | ) | 261 | (55 | ) | 113 | (57 | ) | (38 | ) | (321 | ) | NM | ||||||||||||||||||
Early pay-offs of capital leases | 275 | 74 | 24 | 6 | — | 201 | 272 | 275 | NM | ||||||||||||||||||||||||
Miscellaneous | 6,011 | 12,427 | 9,085 | 10,878 | 8,640 | (6,416 | ) | (52 | ) | (2,629 | ) | (30 | ) | ||||||||||||||||||||
Total Other | 14,654 | 18,244 | 14,025 | 17,556 | 14,135 | (3,590 | ) | (20 | ) | 519 | 4 | ||||||||||||||||||||||
Total Non-Interest Income | $ | 161,993 | $ | 113,242 | $ | 112,220 | $ | 115,137 | $ | 98,158 | $ | 48,751 | 43 | % | $ | 63,835 | 65 | % | |||||||||||||||
NM - Not meaningful.
Six Months Ended | ||||||||||||||
Jun 30, | Jun 30, | $ | % | |||||||||||
(Dollars in thousands) | 2020 | 2019 | Change | Change | ||||||||||
Brokerage | $ | 9,428 | $ | 9,280 | $ | 148 | 2 | % | ||||||
Trust and asset management | 39,149 | 38,836 | 313 | 1 | ||||||||||
Total wealth management | 48,577 | 48,116 | 461 | 1 | ||||||||||
Mortgage banking | 150,650 | 55,569 | 95,081 | 171 | ||||||||||
Service charges on deposit accounts | 21,685 | 18,125 | 3,560 | 20 | ||||||||||
(Losses) gains on investment securities, net | (3,551 | ) | 2,228 | (5,779 | ) | NM | ||||||||
Fees from covered call options | 2,292 | 2,427 | (135 | ) | (6 | ) | ||||||||
Trading losses, net | (1,085 | ) | (215 | ) | (870 | ) | NM | |||||||
Operating lease income, net | 23,769 | 22,529 | 1,240 | 6 | ||||||||||
Other: | ||||||||||||||
Interest rate swap fees | 11,759 | 6,055 | 5,704 | 94 | ||||||||||
BOLI | 666 | 2,740 | (2,074 | ) | (76 | ) | ||||||||
Administrative services | 2,045 | 2,039 | 6 | — | ||||||||||
Foreign currency remeasurement (loss) gain | (359 | ) | 577 | (936 | ) | NM | ||||||||
Early pay-offs of leases | 349 | 5 | 344 | NM | ||||||||||
Miscellaneous | 18,438 | 19,620 | (1,182 | ) | (6 | ) | ||||||||
Total Other | 32,898 | 31,036 | 1,862 | 6 | ||||||||||
Total Non-Interest Income | $ | 275,235 | $ | 179,815 | $ | 95,420 | 53 | % | ||||||
NM - Not meaningful.
33
TABLE 16: MORTGAGE BANKING
Three Months Ended | Six Months Ended | |||||||||||||||||||||||||
(Dollars in thousands) | Jun 30, 2020 | Mar 31, 2020 | Dec 31, 2019 | Sep 30, 2019 | Jun 30, 2019 | Jun 30, 2020 | Jun 30, 2019 | |||||||||||||||||||
Originations and Commitments: | ||||||||||||||||||||||||||
Retail originations | $ | 1,588,932 | $ | 773,144 | $ | 782,122 | $ | 913,631 | $ | 669,510 | $ | 2,362,076 | $ | 1,035,112 | ||||||||||||
Correspondent originations | — | — | 4,024 | 50,639 | 182,966 | — | 331,066 | |||||||||||||||||||
Veterans First originations | 621,878 | 442,957 | 459,236 | 456,005 | 301,324 | 1,064,835 | 466,086 | |||||||||||||||||||
Total originations for sale (A) | $ | 2,210,810 | $ | 1,216,101 | $ | 1,245,382 | $ | 1,420,275 | $ | 1,153,800 | $ | 3,426,911 | $ | 1,832,264 | ||||||||||||
Originations for investment | 56,954 | 73,727 | 105,911 | 154,897 | 106,237 | 130,681 | 199,926 | |||||||||||||||||||
Total originations | $ | 2,267,764 | $ | 1,289,828 | $ | 1,351,293 | $ | 1,575,172 | $ | 1,260,037 | $ | 3,557,592 | $ | 2,032,190 | ||||||||||||
Purchases as a percentage of originations for sale | 30 | % | 37 | % | 40 | % | 48 | % | 63 | % | 32 | % | 64 | % | ||||||||||||
Refinances as a percentage of originations for sale | 70 | 63 | 60 | 52 | 37 | 68 | 36 | |||||||||||||||||||
Total | 100 | % | 100 | % | 100 | % | 100 | % | 100 | % | 100 | % | 100 | % | ||||||||||||
Mandatory commitments to fund originations for sale (1) | $ | 1,275,648 | $ | 1,375,162 | $ | 372,357 | $ | 433,009 | $ | 475,618 | ||||||||||||||||
Production Margin: | ||||||||||||||||||||||||||
Production revenue (B) (2) | $ | 93,433 | $ | 49,327 | $ | 34,622 | $ | 40,924 | $ | 29,895 | $ | 142,760 | $ | 46,501 | ||||||||||||
Production margin (B / A) | 4.23 | % | 4.06 | % | 2.78 | % | 2.88 | % | 2.59 | % | 4.17 | % | 2.54 | % | ||||||||||||
Mortgage Servicing: | ||||||||||||||||||||||||||
Loans serviced for others (C) | $ | 9,188,285 | $ | 8,314,634 | $ | 8,243,251 | $ | 7,901,045 | $ | 7,515,186 | ||||||||||||||||
MSRs, at fair value (D) | 77,203 | 73,504 | 85,638 | 75,585 | 72,850 | |||||||||||||||||||||
Percentage of MSRs to loans serviced for others (D / C) | 0.84 | % | 0.88 | % | 1.04 | % | 0.96 | % | 0.97 | % | ||||||||||||||||
Servicing income | $ | 6,908 | $ | 7,031 | $ | 6,247 | $ | 5,989 | $ | 5,460 | $ | 13,939 | $ | 10,920 | ||||||||||||
Components of MSR: | ||||||||||||||||||||||||||
MSR - current period capitalization | $ | 20,351 | $ | 9,447 | $ | 14,532 | $ | 14,029 | $ | 9,802 | $ | 29,798 | $ | 16,382 | ||||||||||||
MSR - collection of expected cash flows - paydowns | (419 | ) | (547 | ) | (483 | ) | (456 | ) | (457 | ) | (966 | ) | (962 | ) | ||||||||||||
MSR - collection of expected cash flows - payoffs | (8,252 | ) | (6,476 | ) | (6,325 | ) | (6,781 | ) | (3,619 | ) | (14,728 | ) | (5,111 | ) | ||||||||||||
Valuation: | ||||||||||||||||||||||||||
MSR - changes in fair value model assumptions | (7,982 | ) | (14,557 | ) | 2,329 | (4,058 | ) | (4,305 | ) | (22,539 | ) | (13,049 | ) | |||||||||||||
Gain (loss) on derivative contract held as an economic hedge, net | 589 | 4,160 | (483 | ) | 82 | 920 | 4,749 | 920 | ||||||||||||||||||
MSR valuation adjustment, net of gain/(loss) on derivative contract held as an economic hedge | $ | (7,393 | ) | $ | (10,397 | ) | $ | 1,846 | $ | (3,976 | ) | $ | (3,385 | ) | $ | (17,790 | ) | $ | (12,129 | ) | ||||||
Summary of Mortgage Banking Revenue: | ||||||||||||||||||||||||||
Production revenue (2) | $ | 93,433 | $ | 49,327 | $ | 34,622 | $ | 40,924 | $ | 29,895 | $ | 142,760 | $ | 46,501 | ||||||||||||
Servicing income | 6,908 | 7,031 | 6,247 | 5,989 | 5,460 | 13,939 | 10,920 | |||||||||||||||||||
MSR activity | 4,287 | (7,973 | ) | 9,570 | 2,816 | 2,341 | (3,686 | ) | (1,820 | ) | ||||||||||||||||
Other | (2,304 | ) | (59 | ) | (2,579 | ) | 1,135 | (285 | ) | (2,363 | ) | (32 | ) | |||||||||||||
Total mortgage banking revenue | $ | 102,324 | $ | 48,326 | $ | 47,860 | $ | 50,864 | $ | 37,411 | $ | 150,650 | $ | 55,569 | ||||||||||||
(1) | Certain volume adjusted for the estimated pull-through rate of the loan, which represents the Company’s best estimate of the likelihood that a committed loan will ultimately fund. |
(2) | Production revenue represents revenue earned from the origination and subsequent sale of mortgages, including gains on loans sold and fees from originations, processing and other related activities, and excludes servicing fees, changes in the fair value of servicing rights and changes to the mortgage recourse obligation and other non-production revenue. |
34
TABLE 17: NON-INTEREST EXPENSE
Three Months Ended | Q2 2020 compared to Q1 2020 | Q2 2020 compared to Q2 2019 | |||||||||||||||||||||||||||||||
Jun 30, | Mar 31, | Dec 31, | Sep 30, | Jun 30, | |||||||||||||||||||||||||||||
(Dollars in thousands) | 2020 | 2020 | 2019 | 2019 | 2019 | $ Change | % Change | $ Change | % Change | ||||||||||||||||||||||||
Salaries and employee benefits: | |||||||||||||||||||||||||||||||||
Salaries | $ | 87,105 | $ | 81,286 | $ | 82,888 | $ | 78,067 | $ | 75,360 | $ | 5,819 | 7 | % | $ | 11,745 | 16 | % | |||||||||||||||
Commissions and incentive compensation | 46,151 | 31,575 | 40,226 | 40,289 | 36,486 | 14,576 | 46 | 9,665 | 26 | ||||||||||||||||||||||||
Benefits | 20,900 | 23,901 | 22,827 | 22,668 | 21,886 | (3,001 | ) | (13 | ) | (986 | ) | (5 | ) | ||||||||||||||||||||
Total salaries and employee benefits | 154,156 | 136,762 | 145,941 | 141,024 | 133,732 | 17,394 | 13 | 20,424 | 15 | ||||||||||||||||||||||||
Equipment | 15,846 | 14,834 | 14,485 | 13,314 | 12,759 | 1,012 | 7 | 3,087 | 24 | ||||||||||||||||||||||||
Operating lease equipment | 9,292 | 9,260 | 9,766 | 8,907 | 8,768 | 32 | — | 524 | 6 | ||||||||||||||||||||||||
Occupancy, net | 16,893 | 17,547 | 17,132 | 14,991 | 15,921 | (654 | ) | (4 | ) | 972 | 6 | ||||||||||||||||||||||
Data processing | 10,406 | 8,373 | 7,569 | 6,522 | 6,204 | 2,033 | 24 | 4,202 | 68 | ||||||||||||||||||||||||
Advertising and marketing | 7,704 | 10,862 | 12,517 | 13,375 | 12,845 | (3,158 | ) | (29 | ) | (5,141 | ) | (40 | ) | ||||||||||||||||||||
Professional fees | 7,687 | 6,721 | 7,650 | 8,037 | 6,228 | 966 | 14 | 1,459 | 23 | ||||||||||||||||||||||||
Amortization of other intangible assets | 2,820 | 2,863 | 3,017 | 2,928 | 2,957 | (43 | ) | (2 | ) | (137 | ) | (5 | ) | ||||||||||||||||||||
FDIC insurance | 7,081 | 4,135 | 1,348 | 148 | 4,127 | 2,946 | 71 | 2,954 | 72 | ||||||||||||||||||||||||
OREO expense, net | 237 | (876 | ) | 536 | 1,170 | 1,290 | 1,113 | NM | (1,053 | ) | (82 | ) | |||||||||||||||||||||
Other: | |||||||||||||||||||||||||||||||||
Commissions - 3rd party brokers | 707 | 865 | 717 | 734 | 749 | (158 | ) | (18 | ) | (42 | ) | (6 | ) | ||||||||||||||||||||
Postage | 1,591 | 1,949 | 2,220 | 2,321 | 2,606 | (358 | ) | (18 | ) | (1,015 | ) | (39 | ) | ||||||||||||||||||||
Miscellaneous | 24,948 | 21,346 | 26,693 | 21,083 | 21,421 | 3,602 | 17 | 3,527 | 16 | ||||||||||||||||||||||||
Total other | 27,246 | 24,160 | 29,630 | 24,138 | 24,776 | 3,086 | 13 | 2,470 | 10 | ||||||||||||||||||||||||
Total Non-Interest Expense | $ | 259,368 | $ | 234,641 | $ | 249,591 | $ | 234,554 | $ | 229,607 | $ | 24,727 | 11 | % | $ | 29,761 | 13 | % | |||||||||||||||
NM - Not meaningful.
Six Months Ended | ||||||||||||||
Jun 30, | Jun 30, | $ | % | |||||||||||
(Dollars in thousands) | 2020 | 2019 | Change | Change | ||||||||||
Salaries and employee benefits: | ||||||||||||||
Salaries | $ | 168,391 | $ | 149,397 | $ | 18,994 | 13 | % | ||||||
Commissions and incentive compensation | 77,726 | 68,085 | 9,641 | 14 | ||||||||||
Benefits | 44,801 | 41,973 | 2,828 | 7 | ||||||||||
Total salaries and employee benefits | 290,918 | 259,455 | 31,463 | 12 | ||||||||||
Equipment | 30,680 | 24,529 | 6,151 | 25 | ||||||||||
Operating lease equipment | 18,552 | 17,087 | 1,465 | 9 | ||||||||||
Occupancy, net | 34,440 | 32,166 | 2,274 | 7 | ||||||||||
Data processing | 18,779 | 13,729 | 5,050 | 37 | ||||||||||
Advertising and marketing | 18,566 | 22,703 | (4,137 | ) | (18 | ) | ||||||||
Professional fees | 14,408 | 11,784 | 2,624 | 22 | ||||||||||
Amortization of other intangible assets | 5,683 | 5,899 | (216 | ) | (4 | ) | ||||||||
FDIC insurance | 11,216 | 7,703 | 3,513 | 46 | ||||||||||
OREO expense, net | (639 | ) | 1,922 | (2,561 | ) | NM | ||||||||
Other: | ||||||||||||||
Commissions - 3rd party brokers | 1,572 | 1,467 | 105 | 7 | ||||||||||
Postage | 3,540 | 5,056 | (1,516 | ) | (30 | ) | ||||||||
Miscellaneous | 46,294 | 40,481 | 5,813 | 14 | ||||||||||
Total other | 51,406 | 47,004 | 4,402 | 9 | ||||||||||
Total Non-Interest Expense | $ | 494,009 | $ | 443,981 | $ | 50,028 | 11 | % | ||||||
NM - Not meaningful.
35
TABLE 18: SUPPLEMENTAL NON-GAAP FINANCIAL MEASURES/RATIOS
The accounting and reporting policies of Wintrust conform to generally accepted accounting principles (“GAAP”) in the United States and prevailing practices in the banking industry. However, certain non-GAAP performance measures and ratios are used by management to evaluate and measure the Company’s performance. These include taxable-equivalent net interest income (including its individual components), taxable-equivalent net interest margin (including its individual components), the taxable-equivalent efficiency ratio, tangible common equity ratio, tangible book value per common share, return on average tangible common equity, pre-tax income, excluding provision for credit losses and pre-tax income, excluding provision for credit losses and MSR valuation adjustment. Management believes that these measures and ratios provide users of the Company’s financial information a more meaningful view of the performance of the Company's interest-earning assets and interest-bearing liabilities and of the Company’s operating efficiency. Other financial holding companies may define or calculate these measures and ratios differently.
Management reviews yields on certain asset categories and the net interest margin of the Company and its banking subsidiaries on a fully taxable-equivalent basis. In this non-GAAP presentation, net interest income is adjusted to reflect tax-exempt interest income on an equivalent before-tax basis using tax rates effective as of the end of the period. This measure ensures comparability of net interest income arising from both taxable and tax-exempt sources. Net interest income on a fully taxable-equivalent basis is also used in the calculation of the Company’s efficiency ratio. The efficiency ratio, which is calculated by dividing non-interest expense by total taxable-equivalent net revenue (less securities gains or losses), measures how much it costs to produce one dollar of revenue. Securities gains or losses are excluded from this calculation to better match revenue from daily operations to operational expenses. Management considers the tangible common equity ratio and tangible book value per common share as useful measurements of the Company’s equity. The Company references the return on average tangible common equity as a measurement of profitability. Management considers pre-tax income, excluding provision for credit losses and pre-tax income, excluding provision for credit losses and MSR valuation adjustment as useful measurements of the Company's core net income.
36
Three Months Ended | Six Months Ended | |||||||||||||||||||||||||
Jun 30, | Mar 31, | Dec 31, | Sep 30, | Jun 30, | Jun 30, | Jun 30, | ||||||||||||||||||||
(Dollars and shares in thousands) | 2020 | 2020 | 2019 | 2019 | 2019 | 2020 | 2019 | |||||||||||||||||||
Reconciliation of Non-GAAP Net Interest Margin and Efficiency Ratio: | ||||||||||||||||||||||||||
(A) Interest Income (GAAP) | $ | 329,816 | $ | 344,067 | $ | 349,731 | $ | 354,627 | $ | 346,814 | $ | 673,883 | $ | 680,784 | ||||||||||||
Taxable-equivalent adjustment: | ||||||||||||||||||||||||||
- Loans | 576 | 860 | 892 | 978 | 1,031 | 1,436 | 2,065 | |||||||||||||||||||
- Liquidity Management Assets | 538 | 551 | 573 | 574 | 568 | 1,089 | 1,133 | |||||||||||||||||||
- Other Earning Assets | 3 | 2 | 1 | 5 | 1 | 5 | 3 | |||||||||||||||||||
(B) Interest Income (non-GAAP) | $ | 330,933 | $ | 345,480 | $ | 351,197 | $ | 356,184 | $ | 348,414 | $ | 676,413 | $ | 683,985 | ||||||||||||
(C) Interest Expense (GAAP) | $ | 66,685 | $ | 82,624 | $ | 87,852 | $ | 89,775 | $ | 80,612 | $ | 149,309 | $ | 152,596 | ||||||||||||
(D) Net Interest Income (GAAP) (A minus C) | $ | 263,131 | $ | 261,443 | $ | 261,879 | $ | 264,852 | $ | 266,202 | $ | 524,574 | $ | 528,188 | ||||||||||||
(E) Net Interest Income (non-GAAP) (B minus C) | $ | 264,248 | $ | 262,856 | $ | 263,345 | $ | 266,409 | $ | 267,802 | $ | 527,104 | $ | 531,389 | ||||||||||||
Net interest margin (GAAP) | 2.73 | % | 3.12 | % | 3.17 | % | 3.37 | % | 3.62 | % | 2.91 | % | 3.66 | % | ||||||||||||
Net interest margin, fully taxable-equivalent (non-GAAP) | 2.74 | % | 3.14 | % | 3.19 | % | 3.39 | % | 3.64 | % | 2.93 | % | 3.68 | % | ||||||||||||
(F) Non-interest income | $ | 161,993 | $ | 113,242 | $ | 112,220 | $ | 115,137 | $ | 98,158 | $ | 275,235 | $ | 179,815 | ||||||||||||
(G) Gains (losses) on investment securities, net | 808 | (4,359 | ) | 587 | 710 | 864 | (3,551 | ) | 2,228 | |||||||||||||||||
(H) Non-interest expense | 259,368 | 234,641 | 249,591 | 234,554 | 229,607 | 494,009 | 443,981 | |||||||||||||||||||
Efficiency ratio (H/(D+F-G)) | 61.13 | % | 61.90 | % | 66.82 | % | 61.84 | % | 63.17 | % | 61.49 | % | 62.91 | % | ||||||||||||
Efficiency ratio (non-GAAP) (H/(E+F-G)) | 60.97 | % | 61.67 | % | 66.56 | % | 61.59 | % | 62.89 | % | 61.30 | % | 62.62 | % | ||||||||||||
Reconciliation of Non-GAAP Tangible Common Equity Ratio: | ||||||||||||||||||||||||||
Total shareholders’ equity (GAAP) | $ | 3,990,218 | $ | 3,700,393 | $ | 3,691,250 | $ | 3,540,325 | $ | 3,446,950 | ||||||||||||||||
Less: Non-convertible preferred stock (GAAP) | (412,500 | ) | (125,000 | ) | (125,000 | ) | (125,000 | ) | (125,000 | ) | ||||||||||||||||
Less: Intangible assets (GAAP) | (685,581 | ) | (687,626 | ) | (692,277 | ) | (627,972 | ) | (631,499 | ) | ||||||||||||||||
(I) Total tangible common shareholders’ equity (non-GAAP) | $ | 2,892,137 | $ | 2,887,767 | $ | 2,873,973 | $ | 2,787,353 | $ | 2,690,451 | ||||||||||||||||
(J) Total assets (GAAP) | $ | 43,540,017 | $ | 38,799,847 | $ | 36,620,583 | $ | 34,911,902 | $ | 33,641,769 | ||||||||||||||||
Less: Intangible assets (GAAP) | (685,581 | ) | (687,626 | ) | (692,277 | ) | (627,972 | ) | (631,499 | ) | ||||||||||||||||
(K) Total tangible assets (non-GAAP) | $ | 42,854,436 | $ | 38,112,221 | $ | 35,928,306 | $ | 34,283,930 | $ | 33,010,270 | ||||||||||||||||
Common equity to assets ratio (GAAP) (L/J) | 8.2 | % | 9.2 | % | 9.7 | % | 9.8 | % | 9.9 | % | ||||||||||||||||
Tangible common equity ratio (non-GAAP) (I/K) | 6.7 | % | 7.6 | % | 8.0 | % | 8.1 | % | 8.2 | % | ||||||||||||||||
37
Three Months Ended | Six Months Ended | |||||||||||||||||||||||||
Jun 30, | Mar 31, | Dec 31, | Sep 30, | Jun 30, | Jun 30, | Jun 30, | ||||||||||||||||||||
(Dollars and shares in thousands) | 2020 | 2020 | 2019 | 2019 | 2019 | 2020 | 2019 | |||||||||||||||||||
Reconciliation of Non-GAAP Tangible Book Value per Common Share: | ||||||||||||||||||||||||||
Total shareholders’ equity | $ | 3,990,218 | $ | 3,700,393 | $ | 3,691,250 | $ | 3,540,325 | $ | 3,446,950 | ||||||||||||||||
Less: Preferred stock | (412,500 | ) | (125,000 | ) | (125,000 | ) | (125,000 | ) | (125,000 | ) | ||||||||||||||||
(L) Total common equity | $ | 3,577,718 | $ | 3,575,393 | $ | 3,566,250 | $ | 3,415,325 | $ | 3,321,950 | ||||||||||||||||
(M) Actual common shares outstanding | 57,574 | 57,545 | 57,822 | 56,698 | 56,668 | |||||||||||||||||||||
Book value per common share (L/M) | $ | 62.14 | $ | 62.13 | $ | 61.68 | $ | 60.24 | $ | 58.62 | ||||||||||||||||
Tangible book value per common share (non-GAAP) (I/M) | $ | 50.23 | $ | 50.18 | $ | 49.70 | $ | 49.16 | $ | 47.48 | ||||||||||||||||
Reconciliation of Non-GAAP Return on Average Tangible Common Equity: | ||||||||||||||||||||||||||
(N) Net income applicable to common shares | $ | 19,609 | $ | 60,762 | $ | 83,914 | $ | 97,071 | $ | 79,416 | $ | 80,371 | $ | 166,512 | ||||||||||||
Add: Intangible asset amortization | 2,820 | 2,863 | 3,017 | 2,928 | 2,957 | 5,683 | 5,899 | |||||||||||||||||||
Less: Tax effect of intangible asset amortization | (832 | ) | (799 | ) | (793 | ) | (773 | ) | (771 | ) | (1,608 | ) | (1,502 | ) | ||||||||||||
After-tax intangible asset amortization | 1,988 | 2,064 | 2,224 | 2,155 | 2,186 | 4,075 | 4,397 | |||||||||||||||||||
(O) Tangible net income applicable to common shares (non-GAAP) | $ | 21,597 | $ | 62,826 | $ | 86,138 | $ | 99,226 | $ | 81,602 | $ | 84,446 | $ | 170,909 | ||||||||||||
Total average shareholders' equity | $ | 3,908,846 | $ | 3,710,169 | $ | 3,622,184 | $ | 3,496,714 | $ | 3,414,340 | $ | 3,809,508 | $ | 3,362,000 | ||||||||||||
Less: Average preferred stock | (273,489 | ) | (125,000 | ) | (125,000 | ) | (125,000 | ) | (125,000 | ) | (199,245 | ) | (125,000 | ) | ||||||||||||
(P) Total average common shareholders' equity | $ | 3,635,357 | $ | 3,585,169 | $ | 3,497,184 | $ | 3,371,714 | $ | 3,289,340 | $ | 3,610,263 | $ | 3,237,000 | ||||||||||||
Less: Average intangible assets | (686,526 | ) | (690,777 | ) | (689,286 | ) | (630,279 | ) | (624,794 | ) | (688,652 | ) | (623,524 | ) | ||||||||||||
(Q) Total average tangible common shareholders’ equity (non-GAAP) | $ | 2,948,831 | $ | 2,894,392 | $ | 2,807,898 | $ | 2,741,435 | $ | 2,664,546 | $ | 2,921,611 | $ | 2,613,476 | ||||||||||||
Return on average common equity, annualized (N/P) | 2.17 | % | 6.82 | % | 9.52 | % | 11.42 | % | 9.68 | % | 4.48 | % | 10.37 | % | ||||||||||||
Return on average tangible common equity, annualized (non-GAAP) (O/Q) | 2.95 | % | 8.73 | % | 12.17 | % | 14.36 | % | 12.28 | % | 5.81 | % | 13.19 | % | ||||||||||||
Reconciliation of Non-GAAP Pre-Tax, Pre-Provision Income and Pre-Tax, Pre-Provision, Pre-MSR Adjustment Income: | ||||||||||||||||||||||||||
Income before taxes | $ | 30,703 | $ | 87,083 | $ | 116,682 | $ | 134,601 | $ | 110,173 | $ | 117,786 | $ | 228,818 | ||||||||||||
Add: Provision for credit losses | 135,053 | 52,961 | 7,826 | 10,834 | 24,580 | 188,014 | 35,204 | |||||||||||||||||||
Pre-tax income, excluding provision for credit losses (non-GAAP) | $ | 165,756 | $ | 140,044 | $ | 124,508 | $ | 145,435 | $ | 134,753 | $ | 305,800 | $ | 264,022 | ||||||||||||
Less: MSR valuation adjustment, net of (loss)/gain on derivative contract held as an economic hedge | $ | (7,393 | ) | $ | (10,397 | ) | $ | 1,846 | $ | (3,976 | ) | $ | (3,385 | ) | $ | (17,790 | ) | $ | (12,129 | ) | ||||||
Pre-tax income, excluding provision for credit losses and MSR valuation adjustments (non-GAAP) | $ | 173,149 | $ | 150,441 | $ | 122,662 | $ | 149,411 | $ | 138,138 | $ | 323,590 | $ | 276,151 | ||||||||||||
38
WINTRUST SUBSIDIARIES AND LOCATIONS
Wintrust is a financial holding company whose common stock is traded on the Nasdaq Global Select Market (Nasdaq: WTFC). Its 15 community bank subsidiaries are: Lake Forest Bank & Trust Company, N.A., Hinsdale Bank & Trust Company, N.A., Wintrust Bank, N.A., in Chicago, Libertyville Bank & Trust Company, N.A., Barrington Bank & Trust Company, N.A., Crystal Lake Bank & Trust Company, N.A., Northbrook Bank & Trust Company, N.A., Schaumburg Bank & Trust Company, N.A., Village Bank & Trust, N.A., in Arlington Heights, Beverly Bank & Trust Company, N.A. in Chicago, Wheaton Bank & Trust Company, N.A., State Bank of The Lakes, N.A., in Antioch, Old Plank Trail Community Bank, N.A. in New Lenox, St. Charles Bank & Trust Company, N.A. and Town Bank, N.A., in Hartland, Wisconsin.
In addition to the locations noted above, the banks also operate facilities in Illinois in Addison, Algonquin, Aurora, Bloomingdale, Buffalo Grove, Burbank, Cary, Clarendon Hills, Crete, Countryside, Darien, Deerfield, Des Plaines, Downers Grove, Elgin, Elk Grove Village, Elmhurst, Evanston, Evergreen Park, Frankfort, Geneva, Glen Ellyn, Glencoe, Glenview, Gurnee, Grayslake, Hanover Park, Highland Park, Highwood, Hoffman Estates, Homer Glen, Island Lake, Itasca, Joliet, Lake Bluff, Lake Villa, Lansing, Lemont, Lindenhurst, Lynwood, Markham, Maywood, McHenry, Mokena, Mount Prospect, Mundelein, Naperville, North Chicago, Northfield, Norridge, Oak Lawn, Oak Brook, Orland Park, Palatine, Park Ridge, Prospect Heights, Ravinia, Riverside, Rolling Meadows, Roselle, Round Lake Beach, Shorewood, Skokie, South Holland, South Elgin, Spring Grove, Steger, Stone Park, Vernon Hills, Wauconda, Waukegan, Western Springs, Willowbrook, Wilmette, Winnetka and Wood Dale, and in Wisconsin in Albany, Burlington, Clinton, Darlington, Delafield, Delavan, Elm Grove, Genoa City, Kenosha, Lake Geneva, Madison, Menomonee Falls, Milwaukee, Monroe, Pewaukee, Racine, Sharon, Wales, Walworth and Wind Lake, and in Dyer, Indiana and in Naples, Florida.
Additionally, the Company operates various non-bank business units:
• | FIRST Insurance Funding, a division of Lake Forest Bank & Trust Company, N.A., and Wintrust Life Finance, a division of Lake Forest Bank & Trust Company, N.A., serve commercial and life insurance loan customers, respectively, throughout the United States. |
• | First Insurance Funding of Canada serves commercial insurance loan customers throughout Canada. |
• | Tricom, Inc. of Milwaukee provides high-yielding, short-term accounts receivable financing and value-added out-sourced administrative services, such as data processing of payrolls, billing and cash management services, to temporary staffing service clients located throughout the United States. |
• | Wintrust Mortgage, a division of Barrington Bank & Trust Company, N.A., engages primarily in the origination and purchase of residential mortgages for sale into the secondary market through origination offices located throughout the United States. Loans are also originated nationwide through relationships with wholesale and correspondent offices. |
• | Wintrust Investments, LLC is a broker-dealer providing a full range of private client and brokerage services to clients and correspondent banks located primarily in the Midwest. |
• | Great Lakes Advisors LLC provides money management services and advisory services to individual accounts. |
• | The Chicago Trust Company, N.A., a trust subsidiary, allows Wintrust to service customers’ trust and investment needs at each banking location. |
• | Wintrust Asset Finance offers direct leasing opportunities. |
• | CDEC provides Qualified Intermediary services (as defined by U.S. Treasury regulations) for taxpayers seeking to structure tax-deferred like-kind exchanges under Internal Revenue Code Section 1031. |
FORWARD-LOOKING STATEMENTS
This document contains forward-looking statements within the meaning of federal securities laws. Forward-looking information can be identified through the use of words such as “intend,” “plan,” “project,” “expect,” “anticipate,” “believe,” “estimate,” “contemplate,” “possible,” “will,” “may,” “should,” “would” and “could.” Forward-looking statements and information are not historical facts, are premised on many factors and assumptions, and represent only management’s expectations, estimates and projections regarding future events. Similarly, these statements are not guarantees of future performance and involve certain risks and uncertainties that are difficult to predict, such as the impacts of the COVID-19 pandemic, and which may include, but are not limited to, those listed below and the Risk Factors discussed under Item 1A of the Company’s 2019 Annual Report on Form 10-K and in any of the Company’s subsequent SEC filings. The Company intends such forward-looking statements to be covered by the safe harbor provisions for forward-looking statements contained in the Private Securities Litigation Reform Act of 1995, and is including this statement for purposes of invoking these safe harbor provisions. Such forward-looking statements may be deemed to include, among other things, statements relating to the Company’s future financial performance, the performance of its loan portfolio, the expected amount of future credit reserves and charge-offs, delinquency trends, growth plans, regulatory developments, securities that the Company may offer from time to time, and management’s long-term performance goals, as well as statements relating to the anticipated effects on financial condition and results of operations from expected developments or events, the Company’s business and growth strategies, including future acquisitions of banks, specialty finance or wealth management
39
businesses, internal growth and plans to form additional de novo banks or branch offices. Actual results could differ materially from those addressed in the forward-looking statements as a result of numerous factors, including the following:
• | the severity, magnitude and duration of the COVID-19 pandemic and the direct and indirect impact of such pandemic, as well as responses to the pandemic by the government, businesses and consumers, on our operations and personnel, commercial activity and demand across our business and our customers’ businesses; |
• | the disruption of global, national, state and local economies associated with the COVID-19 pandemic, which could affect the Company’s liquidity and capital positions, impair the ability of our borrowers to repay outstanding loans, impair collateral values and further increase our allowance for credit losses; |
• | the impact of the COVID-19 pandemic on our financial results, including possible lost revenue and increased expenses (including the cost of capital), as well as possible goodwill impairment charges; |
• | economic conditions that affect the economy, housing prices, the job market and other factors that may adversely affect the Company’s liquidity and the performance of its loan portfolios, particularly in the markets in which it operates; |
• | negative effects suffered by us or our customers resulting from changes in U.S. trade policies; |
• | the extent of defaults and losses on the Company’s loan portfolio, which may require further increases in its allowance for credit losses; |
• | estimates of fair value of certain of the Company’s assets and liabilities, which could change in value significantly from period to period; |
• | the financial success and economic viability of the borrowers of our commercial loans; |
• | commercial real estate market conditions in the Chicago metropolitan area and southern Wisconsin; |
• | the extent of commercial and consumer delinquencies and declines in real estate values, which may require further increases in the Company’s allowance for credit losses; |
• | inaccurate assumptions in our analytical and forecasting models used to manage our loan portfolio; |
• | changes in the level and volatility of interest rates, the capital markets and other market indices (including developments and volatility arising from or related to the COVID-19 pandemic) that may affect, among other things, the Company’s liquidity and the value of its assets and liabilities; |
• | competitive pressures in the financial services business which may affect the pricing of the Company’s loan and deposit products as well as its services (including wealth management services), which may result in loss of market share and reduced income from deposits, loans, advisory fees and income from other products; |
• | failure to identify and complete favorable acquisitions in the future or unexpected difficulties or developments related to the integration of the Company’s recent or future acquisitions; |
• | unexpected difficulties and losses related to FDIC-assisted acquisitions; |
• | harm to the Company’s reputation; |
• | any negative perception of the Company’s financial strength; |
• | ability of the Company to raise additional capital on acceptable terms when needed; |
• | disruption in capital markets, which may lower fair values for the Company’s investment portfolio; |
• | ability of the Company to use technology to provide products and services that will satisfy customer demands and create efficiencies in operations and to manage risks associated therewith; |
• | failure or breaches of our security systems or infrastructure, or those of third parties; |
• | security breaches, including denial of service attacks, hacking, social engineering attacks, malware intrusion or data corruption attempts and identity theft; |
• | adverse effects on our information technology systems resulting from failures, human error or cyberattacks; |
• | adverse effects of failures by our vendors to provide agreed upon services in the manner and at the cost agreed, particularly our information technology vendors; |
• | increased costs as a result of protecting our customers from the impact of stolen debit card information; |
• | accuracy and completeness of information the Company receives about customers and counterparties to make credit decisions; |
• | ability of the Company to attract and retain senior management experienced in the banking and financial services industries; |
• | environmental liability risk associated with lending activities; |
• | the impact of any claims or legal actions to which the Company is subject, including any effect on our reputation; |
• | losses incurred in connection with repurchases and indemnification payments related to mortgages and increases in reserves associated therewith; |
• | the loss of customers as a result of technological changes allowing consumers to complete their financial transactions without the use of a bank; |
• | the soundness of other financial institutions; |
• | the expenses and delayed returns inherent in opening new branches and de novo banks; |
• | examinations and challenges by tax authorities, and any unanticipated impact of the Tax Act; |
• | changes in accounting standards, rules and interpretations such as the new CECL standard and related changes to address the impact of COVID-19, and the impact on the Company’s financial statements; |
• | the ability of the Company to receive dividends from its subsidiaries; |
40
• | uncertainty about the discontinued use of LIBOR and transition to an alternative rate; |
• | a decrease in the Company’s capital ratios, including as a result of declines in the value of its loan portfolios, or otherwise; |
• | legislative or regulatory changes, particularly changes in regulation of financial services companies and/or the products and services offered by financial services companies, including those changes that are in response to the COVID-19 pandemic, including without limitation the CARES Act and the rules and regulations that may be promulgated thereunder; |
• | a lowering of our credit rating; |
• | changes in U.S. monetary policy and changes to the Federal Reserve’s balance sheet, including changes in response to the COVID-19 pandemic or otherwise; |
• | regulatory restrictions upon our ability to market our products to consumers and limitations on our ability to profitably operate our mortgage business; |
• | increased costs of compliance, heightened regulatory capital requirements and other risks associated with changes in regulation and the regulatory environment; |
• | the impact of heightened capital requirements; |
• | increases in the Company’s FDIC insurance premiums, or the collection of special assessments by the FDIC; |
• | delinquencies or fraud with respect to the Company’s premium finance business; |
• | credit downgrades among commercial and life insurance providers that could negatively affect the value of collateral securing the Company’s premium finance loans; |
• | the Company’s ability to comply with covenants under its credit facility; and |
• | fluctuations in the stock market, which may have an adverse impact on the Company’s wealth management business and brokerage operation. |
Therefore, there can be no assurances that future actual results will correspond to these forward-looking statements. The reader is cautioned not to place undue reliance on any forward-looking statement made by the Company. Any such statement speaks only as of the date the statement was made or as of such date that may be referenced within the statement. The Company undertakes no obligation to update any forward-looking statement to reflect the impact of circumstances or events after the date of the press release. Persons are advised, however, to consult further disclosures management makes on related subjects in its reports filed with the Securities and Exchange Commission and in its press releases.
CONFERENCE CALL, WEBCAST AND REPLAY
The Company will hold a conference call on Wednesday, July 22, 2020 at 11:00 a.m. (Central Time) regarding second quarter 2020 results. Individuals interested in listening should call (877) 363-5049 and enter Conference ID #6266965. A simultaneous audio-only webcast and replay of the conference call as well as an accompanying slide presentation may be accessed via the Company’s website at https://www.wintrust.com, Investor Relations, Investor News and Events, Presentations & Conference Calls. The text of the second quarter 2020 earnings press release will be available on the home page of the Company’s website at https://www.wintrust.com and at the Investor Relations, Investor News and Events, Press Releases link on its website.
41