 | EXHIBIT 99.1 | |||||||||||||
1Q 2022 Earnings Release | ||||||||||||||
| FOR IMMEDIATE RELEASE | April 29, 2022 | |||||||||||||
ExxonMobil Announces First-Quarter 2022 Results
•Earned $5.5 billion in first quarter 2022; generated $14.8 billion of cash flow from operating activities, more than covering capital investment and shareholder distributions
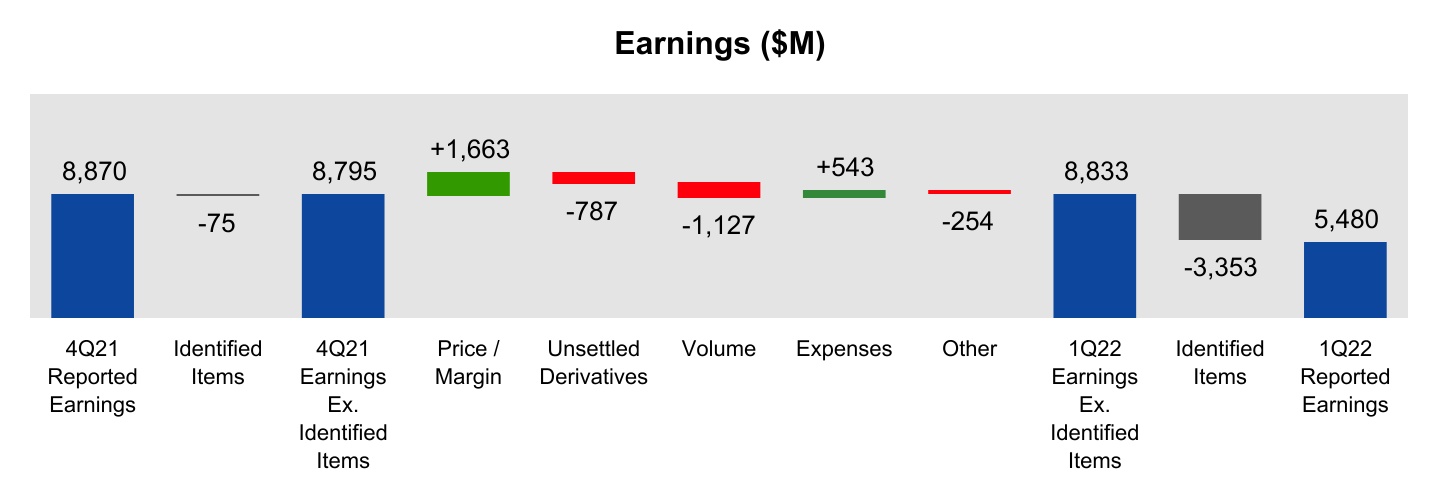
•Earnings excluding identified items were $8.8 billion, an increase of more than $6 billion versus the first quarter of 2021, after adjusting for a $3.4 billion after-tax charge related to the company's Russia Sakhalin-1 operation
•Announced increase in share repurchase program up to a total of $30 billion through 2023
•Achieved first oil at the Liza Phase 2 development in Guyana; Payara FPSO construction approximately five months ahead of schedule with start-up likely before year-end 2023; announced five new discoveries, increasing the estimated recoverable resource base for the Stabroek block to nearly 11 billion oil-equivalent barrels
•Progressed significant lower-emission opportunities, including plans for a world-scale blue hydrogen plant supported by one of the world's largest carbon capture and storage projects in Baytown, Texas, and received top certification for methane emission management at Poker Lake in the Permian Basin
•Effective April 1, to further capture benefits of technology, scale, and integration, the corporation formed ExxonMobil Product Solutions, combining world-scale Downstream and Chemical businesses, and centralized Technology & Engineering and Operations & Sustainability groups
| Results Summary | |||||||||||||||||
Dollars in millions (except per share data) | 1Q22 | 4Q21 | Change vs 4Q21 | 1Q21 | Change vs 1Q21 | ||||||||||||
| Earnings (U.S. GAAP) | 5,480 | 8,870 | -3,390 | 2,730 | +2,750 | ||||||||||||
| Earnings Excluding Identified Items | 8,833 | 8,795 | +38 | 2,761 | +6,072 | ||||||||||||
| Earnings Per Common Share ¹ | 1.28 | 2.08 | -0.80 | 0.64 | +0.64 | ||||||||||||
| Earnings Excluding Identified Items Per Common Share ¹ | 2.07 | 2.05 | +0.02 | 0.65 | +1.42 | ||||||||||||
| Capital and Exploration Expenditures | 4,904 | 5,808 | -904 | 3,133 | +1,771 | ||||||||||||
| ¹ Assuming dilution | |||||||||||||||||
IRVING, Texas – April 29, 2022 – Exxon Mobil Corporation today announced estimated first-quarter 2022 earnings of $5.5 billion, or $1.28 per share assuming dilution. First-quarter results included an unfavorable identified item of $3.4 billion associated with our planned exit from Russia Sakhalin-1, or $0.79 per share assuming dilution. First-quarter capital and exploration expenditures were $4.9 billion.
Oil-equivalent production was 3.7 million barrels per day, down 4% from the fourth quarter of 2021 due to weather-related unscheduled downtime, planned maintenance, lower entitlements associated with higher prices, and divestments. Excluding entitlement effects, government mandates, and divestments, oil-equivalent production was down 2%.
“The quarter illustrated the strength of our underlying business and significant progress in further developing our competitively advantaged production portfolio,” said Darren Woods, chairman and chief executive officer. “Earnings increased modestly, as strong margin improvement and underlying growth was offset by weather and timing impacts. The absence of these temporary impacts in March provides strong, positive momentum for the second quarter.”
1
4Q21 to 1Q22 Factor Analysis | ||||||||||||||
Financial Highlights
•First-quarter earnings of $5.5 billion compared with $8.9 billion in the fourth quarter of 2021. Excluding identified items, earnings of $8.8 billion were slightly higher than the prior quarter, as higher industry prices and margins and reduced expenses were largely offset by a temporary reduction in volumes, unfavorable mark-to-market derivative effects, and price timing impacts.
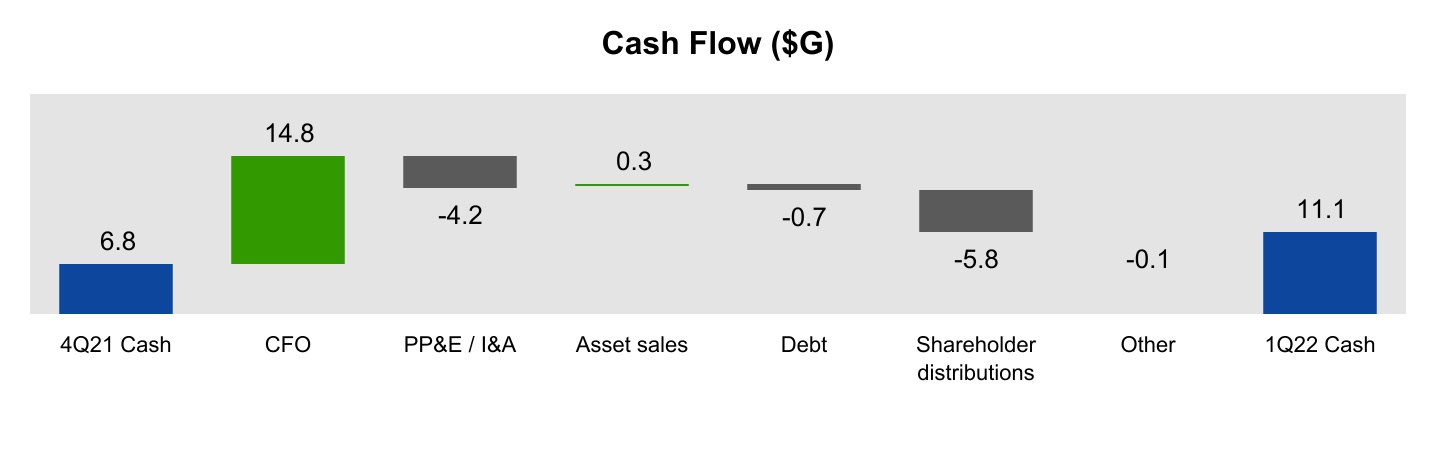
•First-quarter cash increased by $4.3 billion compared to the fourth quarter of 2021, as strong cash flow from operations more than funded capital investment, additional debt reduction, and shareholder distributions in the quarter. Free cash flow in the quarter was approximately $11 billion.
•With the balance sheet well within the targeted debt-to-capital range of 20-25%, the company initiated its previously announced $10 billion buyback program, repurchasing shares totaling $2.1 billion during the quarter. The company has increased this program and now expects to repurchase up to a total of $30 billion through 2023.
•Effective April 1, to improve the effectiveness of our operations and to better serve our customers, the corporation formed ExxonMobil Product Solutions, combining world-scale Downstream and Chemical businesses, and centralized Technology & Engineering and Operations & Sustainability groups. This new integrated business will be focused on high-value products, improving portfolio value, and leading in sustainability. The new centralized organizations will fully leverage functional expertise and quickly deploy best practices across the globe.
2
Leading the Drive to Net Zero
•In January, ExxonMobil announced its ambition to achieve net-zero greenhouse gas emissions from operated assets by 2050. This ambition applies to Scope 1 and 2 greenhouse gas emissions and builds on the company’s 2030 emission-reduction plans.
•The company reached a final investment decision to expand carbon capture capacity at its facility in LaBarge, Wyoming, adding up to 1.2 million metric tons to the nearly 7 million metric tons already captured at LaBarge each year.
•ExxonMobil announced plans for its first world-scale blue hydrogen plant in Baytown, Texas. The proposed plant would produce up to 1 billion cubic feet per day of blue hydrogen and include one of the world’s largest carbon capture and storage projects, doubling the company’s industry-leading carbon capture capacity and providing a potential anchor for the ambitious Houston Industrial Hub emissions reduction project.
•The company advanced several renewable fuel initiatives, including planned renewable diesel production through an equity investment in Global Clean Energy Holdings. In partnership with Neste, the company also agreed to deliver sustainable aviation fuel to Virgin Atlantic and Singapore Airlines.
•Earlier this month, ExxonMobil began selling commercial volumes of certified natural gas after MiQ, an independent validator, certified the company’s assets in the Permian Basin with an "A" grade – the highest recognition possible – for its methane and emissions-reduction processes and technology applications. The company plans to expand the certification process to other operations in the United States.
•The company recently announced that Dan Ammann has been appointed president of ExxonMobil Low Carbon Solutions, effective May 1. Ammann previously served as president and CEO of General Motors’ Cruise autonomous vehicle company.
3
| . | |||||||||||||
EARNINGS AND VOLUME SUMMARY BY SEGMENT | ||||||||||||||
Upstream | |||||||||||
| Dollars in millions (unless otherwise noted) | 1Q22 | 4Q21 | 1Q21 | ||||||||
| Earnings (U.S. GAAP) | |||||||||||
| United States | 2,376 | 1,768 | 363 | ||||||||
| Non-U.S. | 2,112 | 4,317 | 2,191 | ||||||||
| Worldwide | 4,488 | 6,085 | 2,554 | ||||||||
| Earnings Excluding Identified Items | |||||||||||
| United States | 2,376 | 2,031 | 363 | ||||||||
| Non-U.S. | 5,367 | 4,597 | 2,191 | ||||||||
| Worldwide | 7,743 | 6,628 | 2,554 | ||||||||
| Production (koebd) | 3,675 | 3,816 | 3,787 | ||||||||
•First-quarter 2022 Upstream earnings of $4.5 billion compared with $6.1 billion in the fourth quarter of 2021. Excluding identified items, earnings were $7.7 billion, an increase of $1.1 billion from the previous quarter, primarily due to higher liquids prices and lower expenses, partly offset by lower volumes driven by weather-related impacts, fewer days in the quarter, price entitlement effects, and divestments. Average realizations for crude oil increased 28%.
•Oil-equivalent production in the first quarter was 3.7 million barrels per day. Excluding entitlement effects, divestments, and government mandates, oil-equivalent production decreased 2% versus the fourth quarter 2021. Liquids volumes were down 119,000 barrels per day, while natural gas volumes were down 132 million cubic feet per day. By the end of the quarter, production had fully recovered from weather-related impacts.
•Relative to the first quarter of 2021, earnings excluding identified items increased $5.2 billion, primarily due to higher industry prices, which were partly offset by lower volumes. Average realizations for crude oil increased 68%, while natural gas realizations increased 137%. Excluding entitlement effects, divestments, and government mandates, oil-equivalent production decreased 2%. Liquids volumes were up slightly, while natural gas volumes were down 721 million cubic feet per day.
•The company is discontinuing operations at the Sakhalin-1 venture (“Sakhalin”). As operator of Sakhalin, the company remains focused on the safety of people, protection of the environment, and integrity of operations. In the first quarter the company recorded a charge of $3.4 billion related to its investment in the project, which is reflected as an identified item and mainly impacts the Upstream segment.
•The Permian Basin continued to improve efficiency and grow production, reaching production of 560,000 barrels per day at the end of the quarter. The company remains on track to deliver a production increase of 25% this year versus full-year 2021, and to eliminate routine flaring by year end.
•In February, the company started production at its second major development offshore Guyana. The successful start-up of the Liza Phase 2 development brought total production capacity to more than 340,000 barrels per day. In early April, ExxonMobil announced it made a final investment decision for the Yellowtail development. Yellowtail will be the company’s fourth and largest development to date in Guyana with production capacity of 250,000 barrels of oil per day. It is expected to begin production in 2025. Additionally, Payara FPSO construction is running approximately five months ahead of schedule with start-up likely before year-end 2023.
•ExxonMobil continued to progress its global LNG growth strategy to meet growing worldwide demand for reliable gas supply. Commissioning of the Area 4 Coral South Floating LNG project in Mozambique is underway, with first production expected this year, and the company signed the P’nyang Gas Agreement in Papua New Guinea. Additionally, construction of the Golden Pass liquefaction facilities on the U.S. Gulf Coast remains on schedule.
4
Downstream | |||||||||||
| Dollars in millions (unless otherwise noted) | 1Q22 | 4Q21 | 1Q21 | ||||||||
| Earnings/(Loss) (U.S. GAAP) | |||||||||||
| United States | 685 | 913 | (113) | ||||||||
| Non-U.S. | (353) | 554 | (277) | ||||||||
| Worldwide | 332 | 1,467 | (390) | ||||||||
| Earnings/(Loss) Excluding Identified Items | |||||||||||
| United States | 685 | 909 | (113) | ||||||||
| Non-U.S. | (353) | 554 | (277) | ||||||||
| Worldwide | 332 | 1,463 | (390) | ||||||||
| Petroleum Product Sales (kbd) | 5,158 | 5,391 | 4,881 | ||||||||
•First-quarter 2022 Downstream earnings of $0.3 billion compared with $1.5 billion in fourth quarter 2021. Improved industry fuels refining margins and lower expenses were partially offset by lower basestock margins and lower volumes, driven by higher turnaround activity. Results were also impacted by unfavorable mark-to-market impacts and price timing effects that are expected to reverse or unwind over time.
•Global refining margins improved from the fourth quarter despite softening seasonal demand, higher natural gas prices in Europe, and lagging jet demand recovery. By the end of the first quarter, industry margins improved to levels above the 10-year range, with the tight supply / demand balance expected to persist. While average basestock margins declined from the prior quarter, pricing in April is catching up to rising feedstock costs.
•Refining throughput was lower than in the fourth quarter of 2021, primarily due to increased planned maintenance activity.
•Compared to the first quarter of 2021, earnings excluding identified items increased $0.7 billion, primarily due to higher industry refining margins, the absence of unfavorable one-time impacts, and improved reliability.
•The Permian Crude Venture remains on track for phased expansion in 2023 and 2024. The project will significantly expand pipeline capacity to transport Permian crude to both the Baytown and Beaumont, Texas refineries, and includes a 250,000 barrel per day light crude processing expansion at Beaumont. Transport fuels production is expected to increase by nearly 125,000 barrels per day in 2023.
5
Chemical | |||||||||||
| Dollars in millions (unless otherwise noted) | 1Q22 | 4Q21 | 1Q21 | ||||||||
| Earnings (U.S. GAAP) | |||||||||||
| United States | 819 | 1,322 | 715 | ||||||||
| Non-U.S. | 535 | 599 | 700 | ||||||||
| Worldwide | 1,354 | 1,921 | 1,415 | ||||||||
| Earnings Excluding Identified Items | |||||||||||
| United States | 819 | 828 | 715 | ||||||||
| Non-U.S. | 535 | 463 | 700 | ||||||||
| Worldwide | 1,354 | 1,291 | 1,415 | ||||||||
| Prime Product Sales (kt) | 6,737 | 6,701 | 6,446 | ||||||||
•First-quarter 2022 Chemical earnings of $1.4 billion compared with $1.9 billion in the fourth quarter 2021. Excluding identified items, earnings of $1.4 billion in the first quarter 2022 compared with $1.3 billion in the previous quarter. The increase was driven by lower expenses and higher volumes on improved production mix, partly offset by lower margins.
•Compared to the first quarter of 2021, earnings excluding identified items were down slightly as increased project and planned maintenance spend offset higher volumes.
•While first-quarter global industry chemical margins declined, with bottom-of-cycle conditions in Asia Pacific, ExxonMobil’s advantaged portfolio continued to capture value from its ethane feed advantage to deliver strong results.
•The recently completed Corpus Christi Chemical Complex is already delivering positive cash and earnings results, despite still ramping up to full production capacity.
•The company is progressing plans to increase its global offer of certified circular polymer with capacity to process up to 500 metric tons of plastic waste per year by 2026. ExxonMobil is leveraging existing assets and proprietary advanced recycling technology to increase its capacity to process a wide range of plastic waste. Operations in Baytown will be among North America’s largest advanced plastic waste recycling facilities when its expansion is complete later this year, and will have an initial planned capacity to recycle 30,000 metric tons of plastic waste per year. The company is also evaluating and progressing other opportunities in France, the Netherlands, the U.S. Gulf Coast, Canada, and Singapore. In the first quarter of 2022, the company announced its first commercial sale of certified circular polymer using its Exxtend™ technology for advanced recycling of plastic waste.
•ExxonMobil is growing high-value, performance product capacity with competitively advantaged projects. The company's new polypropylene manufacturing unit in Baton Rouge, Louisiana, is expected to start up by year-end 2022. Construction of the new Vistamaxx™ performance polymer and linear alpha olefins (LAO) manufacturing units in Baytown are progressing toward a mid-2023 start-up. ExxonMobil will manufacture 10 high-purity LAO products and market this new offering under the Elevexx™ brand name. LAOs are used in a broad range of applications, including plastic packaging, high-performing engine and industrial oils, surfactants and other specialty chemicals.
Corporate and Financing | |||||||||||
| Dollars in millions (unless otherwise noted) | 1Q22 | 4Q21 | 1Q21 | ||||||||
| Earnings/(Loss) (U.S. GAAP) | (694) | (603) | (849) | ||||||||
| Earnings/(Loss) Excluding Identified Items | (596) | (587) | (818) | ||||||||
•Corporate and Financing reported net charges of $0.7 billion in the first quarter 2022, compared with $0.6 billion in the fourth quarter 2021. Excluding an identified items charge of $0.1 billion related to Russia, net charges were essentially flat.
•Net charges of $0.7 billion in the first quarter 2022 compared with $0.8 billion in the first quarter of 2021. Excluding identified items, costs declined $0.2 billion, driven by lower pension-related corporate costs.
6
| . | |||||||||||||
CASH FLOW FROM OPERATIONS AND ASSET SALES EXCLUDING WORKING CAPITAL | ||||||||||||||
| Dollars in millions | 1Q22 | 4Q21 | 1Q21 | ||||||||
| Net income including noncontrolling interests ¹ | 5,750 | 9,079 | 2,796 | ||||||||
| Depreciation | 8,883 | 5,661 | 5,004 | ||||||||
| Changes in operational working capital | 1,086 | 1,930 | 1,953 | ||||||||
| Other | (931) | 454 | (489) | ||||||||
| Cash Flow from Operating Activities (U.S. GAAP) | 14,788 | 17,124 | 9,264 | ||||||||
| Proceeds associated with asset sales | 293 | 2,601 | 307 | ||||||||
| Cash Flow from Operations and Asset Sales | 15,081 | 19,725 | 9,571 | ||||||||
| Changes in operational working capital | (1,086) | (1,930) | (1,953) | ||||||||
| Cash Flow from Operations and Asset Sales excluding Working Capital | 13,995 | 17,795 | 7,618 | ||||||||
| ¹ Noncontrolling interests of $270M included in net income above | |||||||||||
FREE CASH FLOW | |||||||||||
| Dollars in millions | 1Q22 | 4Q21 | 1Q21 | ||||||||
| Cash Flow from Operating Activities (U.S. GAAP) | 14,788 | 17,124 | 9,264 | ||||||||
| Additions to property, plant and equipment | (3,911) | (4,089) | (2,400) | ||||||||
| Additional investments and advances | (417) | (1,762) | (349) | ||||||||
| Other investing activities including collection of advances | 90 | 1,140 | 87 | ||||||||
| Proceeds from asset sales and returns of investments | 293 | 2,601 | 307 | ||||||||
| Free Cash Flow | 10,843 | 15,014 | 6,909 | ||||||||
7
ExxonMobil will discuss financial and operating results and other matters during a webcast at 8:30 a.m. Central Time on April 29, 2022. To listen to the event or access an archived replay, please visit www.exxonmobil.com.
Cautionary Statement
Outlooks; projections; descriptions of strategic, operating, and financial plans and objectives; statements of future ambitions and plans; and other statements of future events or conditions in this release, are forward-looking statements. Similarly, the emission-reduction roadmaps to drive towards net zero emissions are dependent on future market factors, such as continued technological progress and policy support, and represent forward-looking statements. Actual future results, including financial and operating performance; total capital expenditures and mix, including allocations of capital to low carbon solutions; cost reductions and efficiency gains, including the ability to meet or exceed announced cost and expense reduction objectives; plans to reduce future emissions and emissions intensity; timing and outcome of projects to capture and store CO2; timing and outcome of biofuel and plastic waste recycling projects; cash flow, dividends and shareholder returns, including the timing and amounts of share repurchases; future debt levels and credit ratings; business and project plans, timing, costs, capacities and returns; achievement of ambitions to reach Scope 1 and Scope 2 net zero from operated assets by 2050; achievement of plans to reach Scope 1 and 2 net zero in Upstream Permian Basin operated assets by 2030; and resource recoveries and production rates could differ materially due to a number of factors. These include global or regional changes in the supply and demand for oil, natural gas, petrochemicals, and feedstocks and other market conditions that impact prices and differentials for our products; variable impacts of trading activities on our margins and results each quarter; actions of competitors and commercial counterparties; the outcome of commercial negotiations, including final agreed terms and conditions; the ability to access debt markets; the ultimate impacts of COVID-19, including the extent and nature of further outbreaks and the effects of government responses on people and economies; reservoir performance, including variability and timing factors applicable to unconventional resources; the outcome of exploration projects; timely completion of development and other construction projects; final management approval of future projects and any changes in the scope, terms, or costs of such projects as approved; changes in law, taxes, or regulation including environmental regulations, trade sanctions, and timely granting of governmental permits and certifications; government policies and support and market demand for low carbon technologies; war, and other political or security disturbances; opportunities for potential investments or divestments and satisfaction of applicable conditions to closing, including regulatory approvals; the capture of efficiencies within and between business lines and the ability to maintain near-term cost reductions as ongoing efficiencies; unforeseen technical or operating difficulties and unplanned maintenance; the development and competitiveness of alternative energy and emission reduction technologies; the results of research programs and the ability to bring new technologies to commercial scale on a cost-competitive basis; and other factors discussed under Item 1A. Risk Factors of ExxonMobil’s 2021 Form 10-K.
Frequently Used Terms and Non-GAAP Measures
This press release includes cash flow from operations and asset sales. Because of the regular nature of our asset management and divestment program, the company believes it is useful for investors to consider proceeds associated with the sales of subsidiaries, property, plant and equipment, and sales and returns of investments together with cash provided by operating activities when evaluating cash available for investment in the business and financing activities. A reconciliation to net cash provided by operating activities for 2021 and 2022 periods is shown on page 7.
This press release also includes cash flow from operations and asset sales excluding working capital. The company believes it is useful for investors to consider these numbers in comparing the underlying performance of the company's business across periods when there are significant period-to-period differences in the amount of changes in working capital. A reconciliation to net cash provided by operating activities for 2021 and 2022 periods is shown on page 7.
This press release also includes earnings/(loss) excluding identified items, which are earnings/(loss) excluding individually significant non-operational events with an absolute corporate total earnings impact of at least $250 million in a given quarter. The earnings/(loss) impact of an identified item for an individual segment may be less than $250 million when the item impacts several periods or several segments. Earnings / (loss) excluding identified items does include non-operational earnings events or impacts that are below the $250M threshold utilized for identified items. When the effect of these events are material in aggregate, they are indicated in analysis of period results as part of quarterly earnings press release and teleconference materials. Management uses these figures to improve comparability of the underlying business across multiple periods by isolating and removing significant non-operational events from business results. The Corporation believes this view provides investors increased transparency into business results and trends and provides investors with a view of the business as seen through the eyes of management. Earnings excluding Identified Items is not meant to be viewed in isolation or as a substitute for net income (loss) attributable to ExxonMobil as prepared in accordance with U.S. GAAP. A reconciliation to earnings is shown for 2022 and 2021 periods in Attachments II-a and II-b. Corresponding per share amounts are shown on page 1 and in Attachment II-a, including a reconciliation to earnings/(loss) per common share – assuming dilution (U.S. GAAP).
This press release also includes total taxes including sales-based taxes. This is a broader indicator of the total tax burden on the corporation’s products and earnings, including certain sales and value-added taxes imposed on and concurrent with revenue-producing transactions with customers and collected on behalf of governmental authorities (“sales-based taxes”). It combines “Income taxes” and “Total other taxes and duties” with sales-based taxes, which are reported net in the income statement. The company believes it is useful for the corporation and its investors to understand the total tax burden imposed on the corporation’s products and earnings. A reconciliation to total taxes is shown in Attachment I-a.
8
This press release also references free cash flow. Free cash flow is the sum of net cash provided by operating activities and net cash flow used in investing activities. This measure is useful when evaluating cash available for financing activities, including shareholder distributions, after investment in the business. Free cash flow is not meant to be viewed in isolation or as a substitute for net cash provided by operating activities. A reconciliation to net cash provided by operating activities for 2021 and 2022 periods is shown on page 7.
References to the resource base and other quantities of oil, natural gas or condensate may include estimated amounts that are not yet classified as “proved reserves” under SEC definitions, but which are expected to be ultimately recoverable. A reconciliation of production excluding divestments, entitlements, and government mandates to actual production is contained in the Supplement to this release included as Exhibit 99.2 to the Form 8-K filed the same day as this news release. The term “project” as used in this release can refer to a variety of different activities and does not necessarily have the same meaning as in any government payment transparency reports.
ExxonMobil reported emissions, including reductions and avoidance performance data, are based on a combination of measured and estimated data. Calculations are based on industry standards and best practices, including guidance from the American Petroleum Institute (API) and IPIECA. The uncertainty associated with the emissions, reductions and avoidance performance data depends on variation in the processes and operations, the availability of sufficient data, the quality of those data and methodology used for measurement and estimation. Changes to the performance data may be reported as updated data and/or emission methodologies become available. ExxonMobil works with industry, including API and IPIECA, to improve emission factors and methodologies, including measurements and estimates.
Reference to Earnings
References to corporate earnings mean net income attributable to ExxonMobil (U.S. GAAP) from the consolidated income statement. Unless otherwise indicated, references to earnings, Upstream, Downstream, Chemical and Corporate and financing segment earnings, and earnings per share are ExxonMobil’s share after excluding amounts attributable to noncontrolling interests.
Exxon Mobil Corporation has numerous affiliates, many with names that include ExxonMobil, Exxon, Mobil, Esso, and XTO. For convenience and simplicity, those terms and terms such as corporation, company, our, we, and its are sometimes used as abbreviated references to specific affiliates or affiliate groups. Similarly, ExxonMobil has business relationships with thousands of customers, suppliers, governments, and others. For convenience and simplicity, words such as venture, joint venture, partnership, co-venturer, and partner are used to indicate business and other relationships involving common activities and interests, and those words may not indicate precise legal relationships. ExxonMobil's ambitions, plans and goals do not guarantee any action or future performance by its affiliates or Exxon Mobil Corporation's responsibility for those affiliates' actions and future performance, each affiliate of which manages its own affairs.
9
| . | ATTACHMENT I-a | ||||||||||||
CONDENSED CONSOLIDATED STATEMENT OF INCOME | ||||||||||||||
| (Preliminary) | ||||||||||||||
Three Months Ended March 31, | ||||||||
| Dollars in millions (unless otherwise noted) | 2022 | 2021 | ||||||
| Revenues and other income | ||||||||
| Sales and other operating revenue | 87,734 | 57,552 | ||||||
| Income from equity affiliates | 2,538 | 1,473 | ||||||
| Other income | 228 | 122 | ||||||
| Total revenues and other income | 90,500 | 59,147 | ||||||
| Costs and other deductions | ||||||||
| Crude oil and product purchases | 52,388 | 32,601 | ||||||
| Production and manufacturing expenses | 10,241 | 8,062 | ||||||
| Selling, general and administrative expenses | 2,409 | 2,428 | ||||||
| Depreciation and depletion (includes impairments) | 8,883 | 5,004 | ||||||
| Exploration expenses, including dry holes | 173 | 164 | ||||||
| Non-service pension and postretirement benefit expense | 108 | 378 | ||||||
| Interest expense | 188 | 258 | ||||||
| Other taxes and duties | 7,554 | 6,660 | ||||||
| Total costs and other deductions | 81,944 | 55,555 | ||||||
| Income (loss) before income taxes | 8,556 | 3,592 | ||||||
| Income taxes | 2,806 | 796 | ||||||
| Net income (loss) including noncontrolling interests | 5,750 | 2,796 | ||||||
| Net income (loss) attributable to noncontrolling interests | 270 | 66 | ||||||
| Net income (loss) attributable to ExxonMobil | 5,480 | 2,730 | ||||||
| OTHER FINANCIAL DATA | ||||||||
Three Months Ended March 31, | ||||||||
| 2022 | 2021 | |||||||
Earnings per common share (U.S. dollars) | 1.28 | 0.64 | ||||||
Earnings per common share - assuming dilution (U.S. dollars) | 1.28 | 0.64 | ||||||
| Dividends on common stock | ||||||||
| Total | 3,760 | 3,720 | ||||||
Per common share (U.S. dollars) | 0.88 | 0.87 | ||||||
| Millions of common shares outstanding | ||||||||
| Average - assuming dilution | 4,266 | 4,272 | ||||||
| Income taxes | 2,806 | 796 | ||||||
| Total other taxes and duties | 8,449 | 7,283 | ||||||
| Total taxes | 11,255 | 8,079 | ||||||
| Sales-based taxes | 6,100 | 4,662 | ||||||
| Total taxes including sales-based taxes | 17,355 | 12,741 | ||||||
| ExxonMobil share of income taxes of equity companies | 1,047 | 600 | ||||||
10
| . | ATTACHMENT I-b | ||||||||||||
| CONDENSED CONSOLIDATED BALANCE SHEET | ||||||||||||||
| (Preliminary) | ||||||||||||||
| Dollars in millions (unless otherwise noted) | March 31, 2022 | December 31, 2021 | ||||||
| ASSETS | ||||||||
| Current assets | ||||||||
| Cash and cash equivalents | 11,074 | 6,802 | ||||||
| Notes and accounts receivable – net | 42,142 | 32,383 | ||||||
| Inventories | ||||||||
| Crude oil, products and merchandise | 18,074 | 14,519 | ||||||
| Materials and supplies | 4,103 | 4,261 | ||||||
| Other current assets | 1,862 | 1,189 | ||||||
| Total current assets | 77,255 | 59,154 | ||||||
| Investments, advances and long-term receivables | 46,329 | 45,195 | ||||||
| Property, plant and equipment – net | 212,773 | 216,552 | ||||||
| Other assets, including intangibles – net | 18,414 | 18,022 | ||||||
| Total assets | 354,771 | 338,923 | ||||||
| LIABILITIES | ||||||||
| Current liabilities | ||||||||
| Notes and loans payable | 4,886 | 4,276 | ||||||
| Accounts payable and accrued liabilities | 63,501 | 50,766 | ||||||
| Income taxes payable | 3,672 | 1,601 | ||||||
| Total current liabilities | 72,059 | 56,643 | ||||||
| Long-term debt | 42,651 | 43,428 | ||||||
| Postretirement benefits reserves | 18,255 | 18,430 | ||||||
| Deferred income tax liabilities | 19,533 | 20,165 | ||||||
| Long-term obligations to equity companies | 2,875 | 2,857 | ||||||
| Other long-term obligations | 22,872 | 21,717 | ||||||
| Total liabilities | 178,245 | 163,240 | ||||||
| EQUITY | ||||||||
| Common stock without par value | ||||||||
(9,000 million shares authorized, 8,019 million shares issued) | 15,879 | 15,746 | ||||||
| Earnings reinvested | 393,779 | 392,059 | ||||||
| Accumulated other comprehensive income | (12,914) | (13,764) | ||||||
| Common stock held in treasury | ||||||||
(3,806 million shares at March 31, 2022, and 3,780 million shares at December 31, 2021) | (227,529) | (225,464) | ||||||
| ExxonMobil share of equity | 169,215 | 168,577 | ||||||
| Noncontrolling interests | 7,311 | 7,106 | ||||||
| Total equity | 176,526 | 175,683 | ||||||
| Total liabilities and equity | 354,771 | 338,923 | ||||||
11
| . | ATTACHMENT I-c | ||||||||||||
| CONDENSED CONSOLIDATED STATEMENT OF CASH FLOWS | ||||||||||||||
| (Preliminary) | ||||||||||||||
Three Months Ended March 31, | ||||||||
| Dollars in millions (unless otherwise noted) | 2022 | 2021 | ||||||
| CASH FLOWS FROM OPERATING ACTIVITIES | ||||||||
| Net income (loss) including noncontrolling interests | 5,750 | 2,796 | ||||||
| Depreciation and depletion (includes impairments) | 8,883 | 5,004 | ||||||
| Changes in operational working capital, excluding cash and debt | 1,086 | 1,953 | ||||||
| All other items – net | (931) | (489) | ||||||
| Net cash provided by operating activities | 14,788 | 9,264 | ||||||
| CASH FLOWS FROM INVESTING ACTIVITIES | ||||||||
| Additions to property, plant and equipment | (3,911) | (2,400) | ||||||
| Proceeds from asset sales and returns of investments | 293 | 307 | ||||||
| Additional investments and advances | (417) | (349) | ||||||
| Other investing activities including collection of advances | 90 | 87 | ||||||
| Net cash used in investing activities | (3,945) | (2,355) | ||||||
| CASH FLOWS FROM FINANCING ACTIVITIES | ||||||||
| Additions to short-term debt | — | 5,781 | ||||||
| Reductions in short-term debt | (2,098) | (10,849) | ||||||
| Additions/(reductions) in debt with three months or less maturity | 1,366 | 1,003 | ||||||
| Cash dividends to ExxonMobil shareholders | (3,760) | (3,720) | ||||||
| Cash dividends to noncontrolling interests | (60) | (52) | ||||||
| Changes in noncontrolling interests | (94) | 53 | ||||||
| Common stock acquired | (2,067) | (1) | ||||||
| Net cash used in financing activities | (6,713) | (7,785) | ||||||
| Effects of exchange rate changes on cash | 142 | 27 | ||||||
| Increase/(decrease) in cash and cash equivalents | 4,272 | (849) | ||||||
| Cash and cash equivalents at beginning of period | 6,802 | 4,364 | ||||||
| Cash and cash equivalents at end of period | 11,074 | 3,515 | ||||||
12
| . | ATTACHMENT II-a | ||||||||||||
KEY FIGURES: IDENTIFIED ITEMS | ||||||||||||||
| Dollars in millions | 1Q22 | 4Q21 | 1Q21 | ||||||||
| Earnings (U.S. GAAP) | 5,480 | 8,870 | 2,730 | ||||||||
| Identified Items | |||||||||||
| Impairments | (2,975) | (752) | — | ||||||||
| Gain on sale of assets | — | 1,081 | — | ||||||||
| Severance | — | (4) | (31) | ||||||||
| Other (first quarter 2022 includes Russia-related items) | (378) | (250) | — | ||||||||
| Total Identified Items | (3,353) | 75 | (31) | ||||||||
| Earnings (U.S. GAAP) Excluding Identified Items | 8,833 | 8,795 | 2,761 | ||||||||
| Dollars per common share | 1Q22 | 4Q21 | 1Q21 | ||||||||
| Earnings Per Common Share ¹ | 1.28 | 2.08 | 0.64 | ||||||||
| Identified Items Per Common Share ¹ | |||||||||||
| Impairments | (0.70) | (0.17) | — | ||||||||
| Gain on sale of assets | — | 0.26 | — | ||||||||
| Severance | — | — | (0.01) | ||||||||
| Other | (0.09) | (0.06) | — | ||||||||
| Total Identified Items Per Common Share ¹ | (0.79) | 0.03 | (0.01) | ||||||||
| Earnings (U.S. GAAP) Excluding Identified Items Per Common Share ¹ | 2.07 | 2.05 | 0.65 | ||||||||
¹ Assuming dilution | |||||||||||
13
| . | ATTACHMENT II-b | ||||||||||||
KEY FIGURES: ADJUSTMENT ITEMS BY SEGMENT | ||||||||||||||
First Quarter 2022 | Upstream | Downstream | Chemical | Corporate & Financing | Total | |||||||||||||||||||||
| Dollars in millions | U.S. | Non-U.S. | U.S. | Non-U.S. | U.S. | Non-U.S. | ||||||||||||||||||||
| Earnings/(Loss) (U.S. GAAP) | 2,376 | 2,112 | 685 | (353) | 819 | 535 | (694) | 5,480 | ||||||||||||||||||
| Identified Items | ||||||||||||||||||||||||||
| Impairments | — | (2,877) | — | — | — | — | (98) | (2,975) | ||||||||||||||||||
| Other | — | (378) | — | — | — | — | — | (378) | ||||||||||||||||||
| Total Identified Items | — | (3,255) | — | — | — | — | (98) | (3,353) | ||||||||||||||||||
| Earnings/(Loss) Excluding Identified Items | 2,376 | 5,367 | 685 | (353) | 819 | 535 | (596) | 8,833 | ||||||||||||||||||
Fourth Quarter 2021 | Upstream | Downstream | Chemical | Corporate & Financing | Total | |||||||||||||||||||||
| Dollars in millions | U.S. | Non-U.S. | U.S. | Non-U.S. | U.S. | Non-U.S. | ||||||||||||||||||||
| Earnings/(Loss) (U.S. GAAP) | 1,768 | 4,317 | 913 | 554 | 1,322 | 599 | (603) | 8,870 | ||||||||||||||||||
| Identified Items | ||||||||||||||||||||||||||
| Impairments | (263) | (489) | — | — | — | — | — | (752) | ||||||||||||||||||
| Gain/(Loss) on sale of assets | — | 459 | 4 | — | 494 | 136 | (12) | 1,081 | ||||||||||||||||||
| Severance | — | — | — | — | — | — | (4) | (4) | ||||||||||||||||||
| Other | — | (250) | — | — | — | — | — | (250) | ||||||||||||||||||
| Total Identified Items | (263) | (280) | 4 | — | 494 | 136 | (16) | 75 | ||||||||||||||||||
| Earnings/(Loss) Excluding Identified Items | 2,031 | 4,597 | 909 | 554 | 828 | 463 | (587) | 8,795 | ||||||||||||||||||
First Quarter 2021 | Upstream | Downstream | Chemical | Corporate & Financing | Total | |||||||||||||||||||||
| Dollars in millions | U.S. | Non-U.S. | U.S. | Non-U.S. | U.S. | Non-U.S. | ||||||||||||||||||||
| Earnings/(Loss) (U.S. GAAP) | 363 | 2,191 | (113) | (277) | 715 | 700 | (849) | 2,730 | ||||||||||||||||||
| Identified Items | ||||||||||||||||||||||||||
| Severance | — | — | — | — | — | — | (31) | (31) | ||||||||||||||||||
| Total Identified Items | — | — | — | — | — | — | (31) | (31) | ||||||||||||||||||
| Earnings/(Loss) Excluding Identified Items | 363 | 2,191 | (113) | (277) | 715 | 700 | (818) | 2,761 | ||||||||||||||||||
14
| . | ATTACHMENT III | ||||||||||||
KEY FIGURES: UPSTREAM VOLUMES | ||||||||||||||
| Net production of crude oil, natural gas liquids, bitumen and synthetic oil, thousand barrels per day (kbd) | 1Q22 | 4Q21 | 1Q21 | ||||||||
| United States | 753 | 770 | 665 | ||||||||
| Canada / Other Americas | 474 | 571 | 575 | ||||||||
| Europe | 4 | 17 | 35 | ||||||||
| Africa | 257 | 235 | 253 | ||||||||
| Asia | 738 | 752 | 691 | ||||||||
| Australia / Oceania | 40 | 40 | 39 | ||||||||
| Worldwide | 2,266 | 2,385 | 2,258 | ||||||||
| Natural gas production available for sale, million cubic feet per day (mcfd) | 1Q22 | 4Q21 | 1Q21 | ||||||||
| United States | 2,777 | 2,713 | 2,767 | ||||||||
| Canada / Other Americas | 182 | 189 | 216 | ||||||||
| Europe | 770 | 844 | 1,403 | ||||||||
| Africa | 58 | 48 | 24 | ||||||||
| Asia | 3,340 | 3,468 | 3,599 | ||||||||
| Australia / Oceania | 1,325 | 1,322 | 1,164 | ||||||||
| Worldwide | 8,452 | 8,584 | 9,173 | ||||||||
Oil-equivalent production (koebd) ¹ | 3,675 | 3,816 | 3,787 | ||||||||
1 Natural gas is converted to an oil-equivalent basis at six million cubic feet per one thousand barrels. | |||||||||||
15
| . | ATTACHMENT IV | ||||||||||||
KEY FIGURES: MANUFACTURING THROUGHPUT AND SALES | ||||||||||||||
| Refinery throughput, thousand barrels per day (kbd) | 1Q22 | 4Q21 | 1Q21 | ||||||||
| United States | 1,685 | 1,740 | 1,532 | ||||||||
| Canada | 399 | 416 | 364 | ||||||||
| Europe | 1,193 | 1,246 | 1,153 | ||||||||
| Asia Pacific | 537 | 546 | 545 | ||||||||
| Other | 169 | 170 | 157 | ||||||||
| Worldwide | 3,983 | 4,118 | 3,751 | ||||||||
| Petroleum product sales, thousand barrels per day (kbd) | 1Q22 | 4Q21 | 1Q21 | ||||||||
| United States | 2,256 | 2,383 | 2,077 | ||||||||
| Canada | 442 | 488 | 409 | ||||||||
| Europe | 1,345 | 1,384 | 1,272 | ||||||||
| Asia Pacific | 644 | 643 | 665 | ||||||||
| Other | 471 | 493 | 458 | ||||||||
| Worldwide | 5,158 | 5,391 | 4,881 | ||||||||
| Gasolines, naphthas | 2,114 | 2,325 | 1,996 | ||||||||
| Heating oils, kerosene, diesel | 1,722 | 1,804 | 1,692 | ||||||||
| Aviation fuels | 289 | 267 | 183 | ||||||||
| Heavy fuels | 249 | 265 | 257 | ||||||||
| Specialty products | 784 | 730 | 753 | ||||||||
| Worldwide | 5,158 | 5,391 | 4,881 | ||||||||
| Chemical prime product sales, thousand metric tons (kt) | 1Q22 | 4Q21 | 1Q21 | ||||||||
| United States | 2,704 | 2,512 | 2,190 | ||||||||
| Non-U.S. | 4,033 | 4,189 | 4,256 | ||||||||
| Worldwide | 6,737 | 6,701 | 6,446 | ||||||||
16
| . | ATTACHMENT V | ||||||||||||
KEY FIGURES: CAPITAL AND EXPLORATION EXPENDITURES | ||||||||||||||
| Dollars in millions | 1Q22 | 4Q21 | 1Q21 | ||||||||
| Upstream | |||||||||||
| United States | 1,369 | 1,307 | 810 | ||||||||
| Non-U.S. | 2,510 | 2,934 | 1,547 | ||||||||
| Total | 3,879 | 4,241 | 2,357 | ||||||||
| Downstream | |||||||||||
| United States | 394 | 337 | 271 | ||||||||
| Non-U.S. | 183 | 367 | 199 | ||||||||
| Total | 577 | 704 | 470 | ||||||||
| Chemical | |||||||||||
| United States | 234 | 461 | 208 | ||||||||
| Non-U.S. | 214 | 401 | 98 | ||||||||
| Total | 448 | 862 | 306 | ||||||||
| Other | |||||||||||
| Other | — | 1 | — | ||||||||
| Worldwide | 4,904 | 5,808 | 3,133 | ||||||||
| CASH CAPITAL EXPENDITURES | |||||||||||
| Dollars in millions | 1Q22 | 4Q21 | 1Q21 | ||||||||
| Additions to property, plant and equipment | 3,911 | 4,089 | 2,400 | ||||||||
| Net investments and advances | 327 | 622 | 262 | ||||||||
| Total Cash Capital Expenditures | 4,238 | 4,711 | 2,662 | ||||||||
17
| . | ATTACHMENT VI | ||||||||||||
KEY FIGURES: EARNINGS/(LOSS) BY QUARTER | ||||||||||||||
| Dollars in millions | 2022 | 2021 | 2020 | 2019 | 2018 | ||||||||||||
| First Quarter | 5,480 | 2,730 | (610) | 2,350 | 4,650 | ||||||||||||
| Second Quarter | — | 4,690 | (1,080) | 3,130 | 3,950 | ||||||||||||
| Third Quarter | — | 6,750 | (680) | 3,170 | 6,240 | ||||||||||||
| Fourth Quarter | — | 8,870 | (20,070) | 5,690 | 6,000 | ||||||||||||
| Full Year | — | 23,040 | (22,440) | 14,340 | 20,840 | ||||||||||||
| Dollars per common share ¹ | 2022 | 2021 | 2020 | 2019 | 2018 | ||||||||||||
| First Quarter | 1.28 | 0.64 | (0.14) | 0.55 | 1.09 | ||||||||||||
| Second Quarter | — | 1.10 | (0.26) | 0.73 | 0.92 | ||||||||||||
| Third Quarter | — | 1.57 | (0.15) | 0.75 | 1.46 | ||||||||||||
| Fourth Quarter | — | 2.08 | (4.70) | 1.33 | 1.41 | ||||||||||||
| Full Year | — | 5.39 | (5.25) | 3.36 | 4.88 | ||||||||||||
1 Computed using the average number of shares outstanding during each period. | |||||||||||||||||
18