UNITED STATES
SECURITIES AND EXCHANGE COMMISSION
WASHINGTON, D.C. 20549
FORM
CURRENT REPORT
Pursuant to Section 13 or 15(d) of the
Securities Exchange Act of 1934
Date of Report (Date of earliest event reported):
(Exact Name of Registrant as Specified in Charter)
(State or Other Jurisdiction of Incorporation) | (Commission File Number) | (I.R.S. Employer |
|
|
|
(Address of Principal Executive Office) | (Zip Code) | |
Registrant’s telephone number, including area code: ( | ||
Check the appropriate box below if the Form 8-K filing is intended to simultaneously satisfy the filing obligation of the registrant under any of the following provisions:
Securities registered pursuant to Section 12(b) of the Act:
Title of each class | Trading symbol | Name of each exchange on which registered |
Indicate by check mark whether the registrant is an emerging growth company as defined in Rule 405 of the Securities Act of 1933 (§230.405 of this chapter) or Rule 12b-2 of the Securities Exchange Act of 1934 (§240.12b-2 of this chapter). Emerging growth company
If an emerging growth company, indicate by check mark if the registrant has elected not to use the extended transition period for complying with any new or revised financial accounting standards provided pursuant to Section 13(a) of the Exchange Act. ☐
Item 2.02 | Disclosure of Results of Operations and Financial Condition |
On August 14, 2023, 22nd Century Group, Inc. (the “Company”) issued an earnings release for the quarter ended June 30, 2023. A copy of the earnings release is furnished as Exhibit 99.1 to this report.
The information in this item shall not be deemed “filed” for purposes of Section 18 of the Securities Exchange Act of 1934 (the “Exchange Act”), or otherwise subject to the liabilities of Section 18, nor shall it be deemed incorporated by reference in any of the Company’s filings under the Securities Act of 1933, as amended, or the Exchange Act, except to the extent, if any, expressly set forth by specific reference in such filing.
Item 9.01(d) | Financial Statements and Exhibits |
Supplemental financial information for earnings release dated August 14, 2023 |
104 | Cover Page Interactive Data File - The cover page XBRL tags are embedded within the inline XBRL document |
SIGNATURES
Pursuant to the requirements of the Securities Exchange Act of 1934, the Registrant has duly caused this report to be signed on its behalf by the undersigned hereunto duly authorized.
| 22nd Century Group, Inc. |
|
|
|
|
| /s/ R. Hugh Kinsman |
Date: August 14, 2023 | R. Hugh Kinsman |
| Chief Financial Officer |
Exhibit 99.1
22nd Century Group (XXII) Reports Second Quarter 2023 Financial Results
| ● | Second Quarter 2023 Net Revenues Increased 62% to $23.4 Million |
| ● | Launched VLN® Sales in California, Texas and Florida |
| ● | Delivered Record GVB Ingredient Volumes as Dominant Supplier in North America |
| ● | Initiated Operating Cost Reduction Program Targeting $15+ Million in Annualized Savings |
| ● | Updated 2023 Revenue Outlook to a Range of $80 Million to $90 Million to Reflect Revised VLN® Rollout Timelines and Transitioning GVB Ingredient Volumes Back to Internal Production |
BUFFALO, N.Y., August 14, 2023 — 22nd Century Group, Inc. (Nasdaq: XXII), a leading biotechnology company focused on utilizing advanced plant technologies to improve health and wellness with reduced nicotine tobacco, hemp/cannabis and hops, today reported results for the Second quarter ended June 30, 2023, and provided an update on recent business highlights. The Company will host a live audio webcast today at 8:00 a.m. ET.
“Our focus in 2023 remains 22nd Century’s transformation from a primary emphasis on research and development to a fully commercial enterprise providing innovative harm reduction and consumer health and wellness products to key end markets. We have now significantly advanced our commercialization plan for VLN® sales across targeted states, 14 of which are now in place and two more states scheduled in September with a new drug store customer, a diversified hemp/cannabis ingredients and distribution business and a robust license and distribution business in both tobacco and hemp/cannabis,” and said John Miller, interim Chief Executive Officer of 22nd Century Group.
“Following an initial delay in our commercial plans earlier this year, which are common on retail launches, we have now substantially expanded the availability of our FDA authorized, reduced nicotine content cigarettes VLN®, a tobacco harm reduction product unlike any other. VLN® retail outlets and points of sale increased notably in the second quarter, then more than doubled with the additional stores added in July with our launch at the #1 U.S. c-store chain and others in California, Texas and Florida. New chains continue to launch, such as our first drug store channel placement expected to commence as a five-state launch in September. With this improved reach and density, we have updated and revised our sales planning to focus on maximizing our depth and maintaining the message within these channels to demonstrate proof of concept with the new brand marketing and retail chains throughout the rest of this year. Our revised and updated VLN plan will include a more focused, cost-efficient marketing and sales effort within our footprint and a commitment to streamline our operations relative to the first half that reflected heavier investment in new systems and logistics for the launch.”
“Our hemp/cannabis ingredients, manufacturing and licensing business reported another record quarter as 22nd Century continues to consolidate and leverage its industry leadership position. We believe the record ingredient volumes reflected both overall industry growth and increasing customer preference for our products over other less reliable sources. Initial sales under our new license and distribution agreements occurred in July, with additional scale expected in the second half, which is expected to provide a new source of revenue and gross profit. The return of our in-house manufacturing capabilities is expected to mean the return of manufacturing gross profits, helping to restore our verticalized operating profile that was directly affected by the fire last November.”
“In addition to these commercial opportunities, we are also implementing programs intended to reduce our operating costs by at least $15 million on an annualized basis. Much of this will reflect efficiencies and streamlining as we conclude a period of substantial extra upfront investment undertaken in the first half of 2023 to upgrade distribution, regulatory approvals, marketing, sales and research activities in support of our VLN® launch, which we are now aligning to the more focused ongoing needs for the commercial launch,” concluded Mr. Miller.
.
Recent Key Financial and Business Highlights
Tobacco Business
| ● | Continued multi-state VLN® rollout strategy, now selling in 14 targeted states for 2023. |
| ● | More than doubled VLN® store counts in July after strong growth through the second quarter, with VLN now available in 2,800+ stores and the three largest state markets of Texas, California and Florida. |
| ● | Launched new VLN® educational materials, distribution resources, retail incentives and media programming targeting adult smoker and influencer audiences. |
| ● | Continued to scale support for Pinnacle, a private label conventional premium cigarette brand selling at one of the nation's top-10 gas station convenience store chains in 20+ states. |
| ● | VLN® pilot activities continued in international markets of Switzerland, Japan and South Korea. |
| ● | Poised to benefit from federal, state and international regulatory interest, including the proposed FDA menthol cigarette ban expected to be updated in August 2023, among others. |
Hemp/Cannabis Business
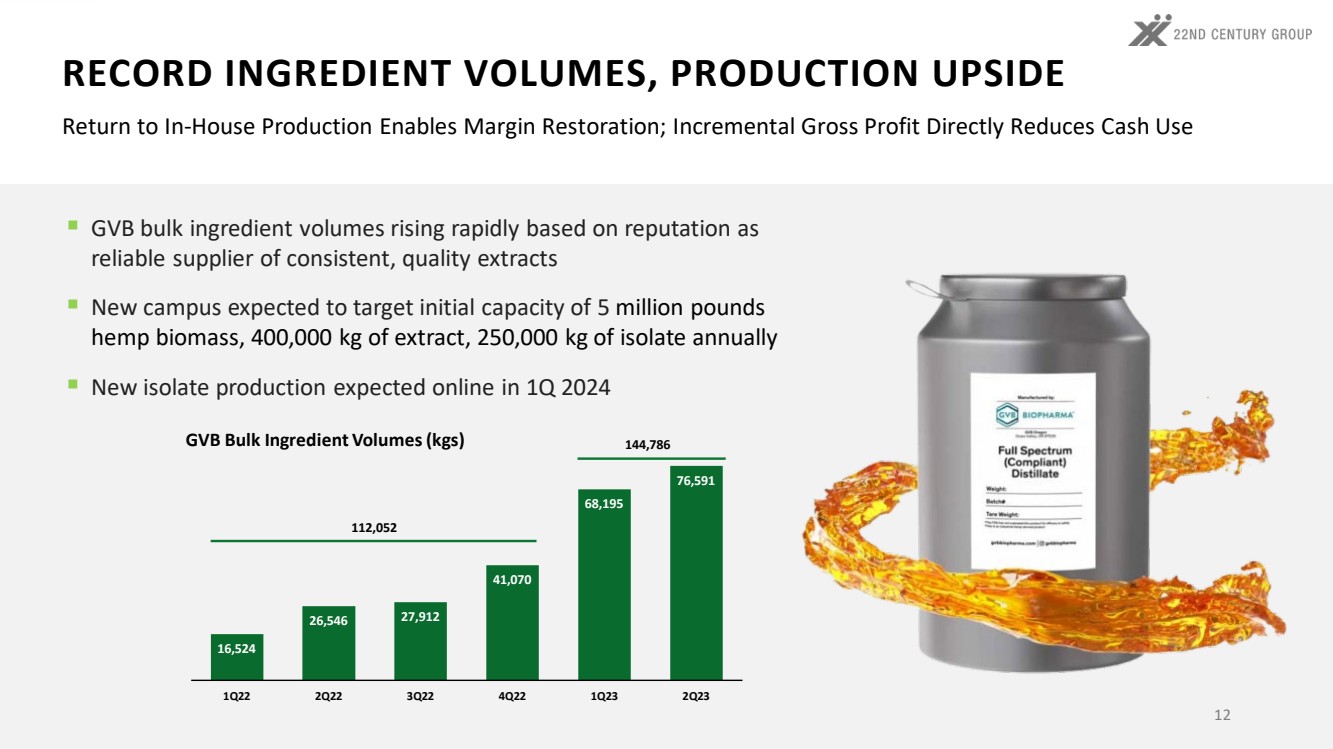
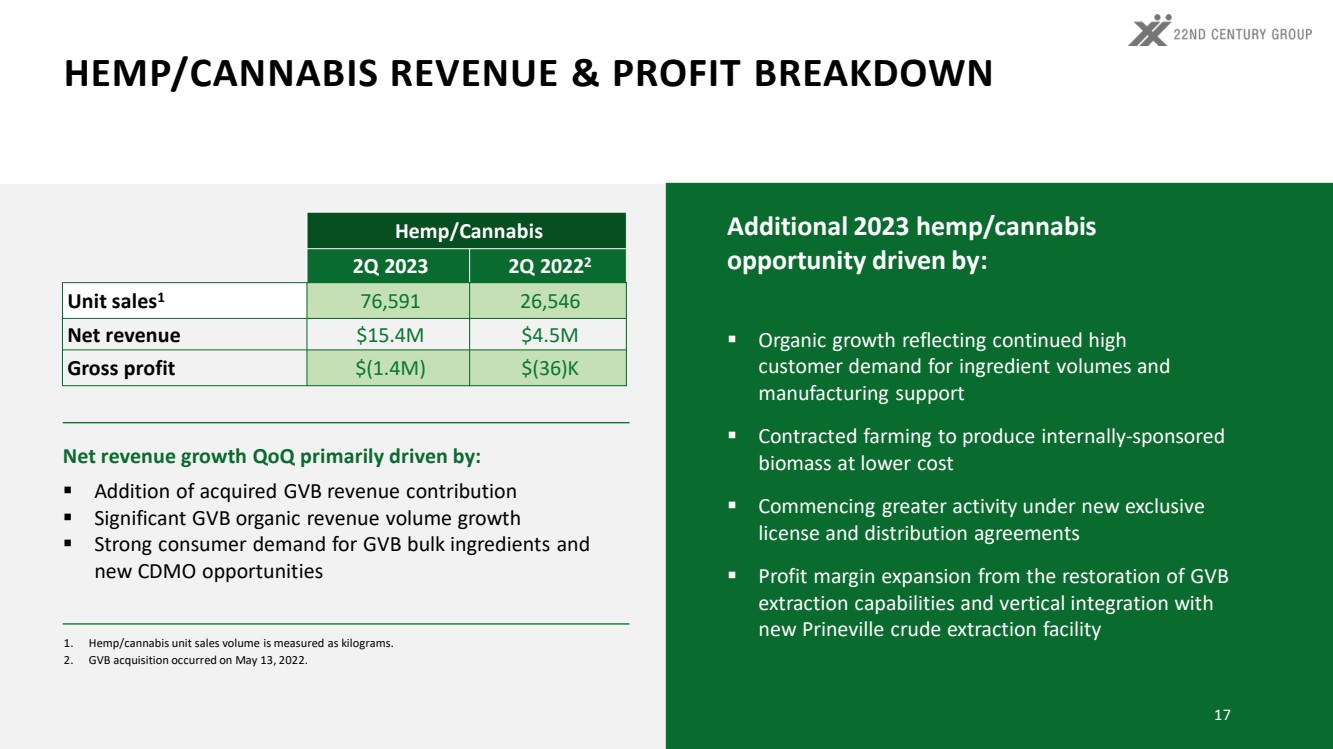
| ● | Shipped record cannabinoid ingredient volumes, increased more than 188% year-over-year to more than 76,000 kgs supplied, as the largest provider of cannabinoid extracts and isolates in North America focused on cannabidiol (CBD) and cannabigerol (CBG) extracted and refined at industrial scale into distillates. |
| ● | 1H 2023 ingredient volumes in excess of 144,000 kgs have already exceeded full-year 2022 shipments of more than 112,000 kgs. |
| ● | In July resumed production of CBD distillate products at new GVB facilities located in Oregon, which should facilitate gross margin improvement on GVB produced cannabinoid products for the remainder of 2023. |
| ● | Commenced CBD crude extract operations, providing opportunities for additional verticalization and related gross profit improvement. |
| ● | Contracted new growing programs to cultivate hemp biomass for extraction, designed to improve both margin on and availability of biomass volumes sufficient to meet rising customer demand, with harvests expected 2H 2023. |
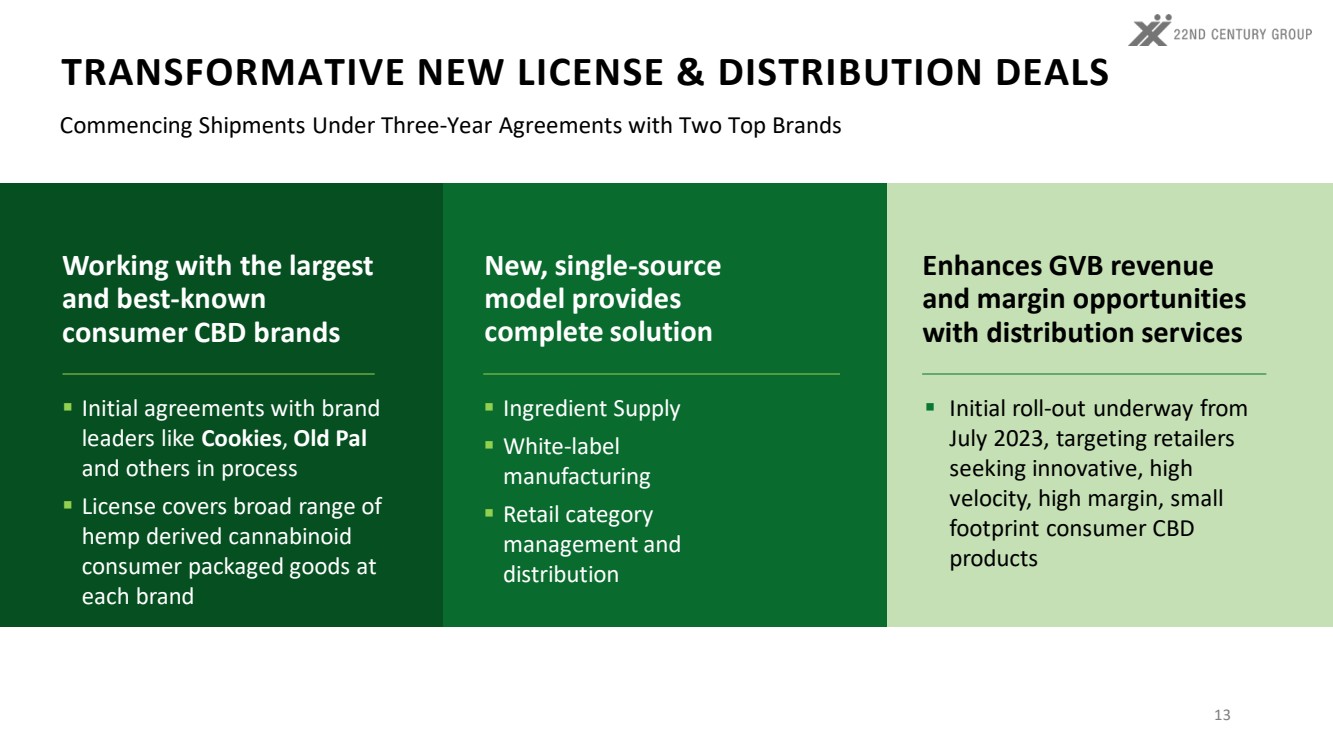
| ● | Advanced distribution and point of sale activity to initial shipments in July 2023 for three-year exclusive license and distribution agreements with Cookies and Old Pal. |
| ● | Advanced plans to restart CBD isolate production, expected in Q1 2024, which should further improve gross margin. |
Corporate Updates
| ● | Revised the Company’s 2023 revenue outlook from a range of $105 million to $110 million to a range of $80 million to $90 million to account for changes in the launch timeline and scope of VLN® at certain key chains in 2023, transitioning GVB volumes back to internal production and the operating cost reduction plan. |
| ● | Announced the resignation of James A. Mish as Chief Executive Officer, and appointed John Miller, who leads the tobacco business unit, as interim Chief Executive Officer. |
| ● | Regained compliance with Nasdaq listing qualifications per a letter dated July 19, 2023. |
| ● | Added Wall Street veteran Andy Arno as an Independent Director and member of the Board of Directors. |
| ● | Raised an aggregate of $19.9 million in gross proceeds in June and July 2023. |
Second Quarter 2023 Financial Results
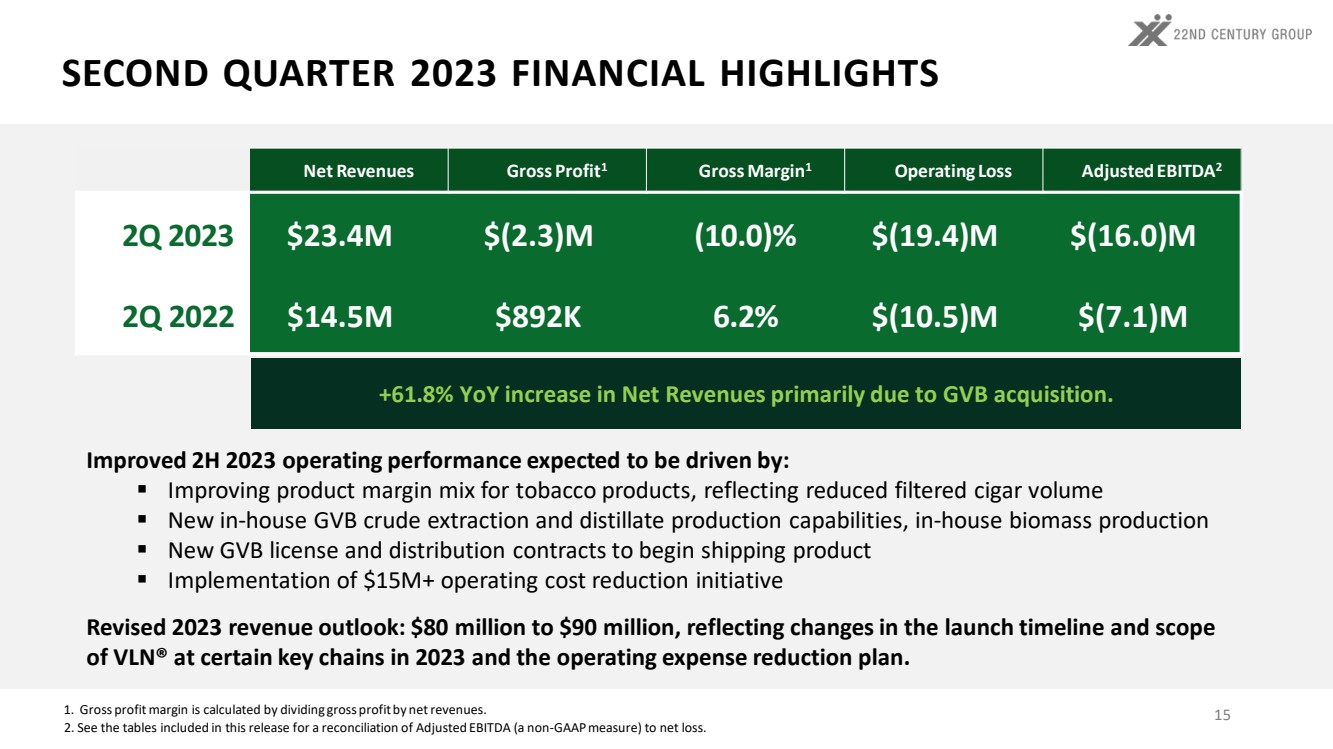
| ● | Net revenues for the second quarter of 2023 were $23.4 million, an increase of 61.8% from the same period in 2022. |
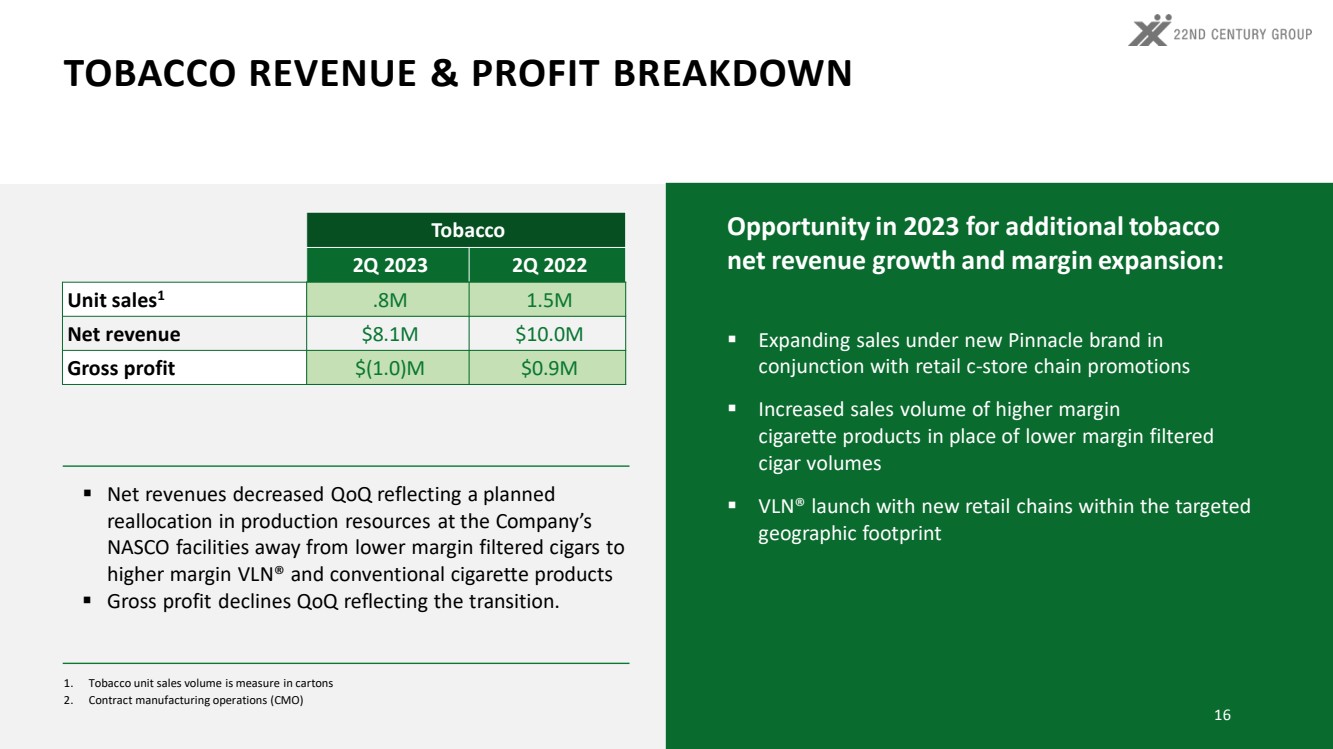
| o | Revenue from tobacco-related products was $8.1 million, reflecting the Company’s transition away from low margin filtered cigar products to focus production and capacity on higher margin products, such as VLN® and Pinnacle. |
| o | Revenue from hemp/cannabis-related products was $15.4 million, as volumes continued to ramp on share gains. |
| ◾ | Approximately $0.6 million of additional sales initially intended for the second quarter will instead be recognized in the third quarter due to shipment cutoff timing to accommodate the Fourth of July holiday. |
| ● | Gross profit for the second quarter of 2023 was $(2.3) million as compared to $0.9 million in the prior year period. |
| o | Gross profit from tobacco-related products was $(1.0) million, reflecting the aforementioned lower margin product mix. |
| o | Gross profit from hemp/cannabis-related products was $(1.4) million, reflecting the final quarter of primarily ingredient trading activity due to the November 2022 plant fire; the Company is restarting production in its own ingredients at new facilities. |
| ◾ | Second quarter gross profit was negatively impacted by approximately $2.4 million related to the plant fire. |
| ◾ | The Company believes these losses are covered by its business interruption insurance coverage and has filed litigation to enforce its claim dating to the November 2022 plant fire. |
| o | Gross margin is expected to improve in the second half of 2023 reflecting: |
| ◾ | Improving product margin mix for tobacco products reflecting reduced filtered cigar volume |
| ◾ | New in-house GVB crude extraction and distillate production capabilities as opposed to reselling activities |
| ◾ | The initial harvest of hemp/cannabis biomass expected to reduce raw material expenses in the second half of 2023 |
| ◾ | New CDMO+D contracts to begin shipping product in the second half of 2023. |
| ● | Total operating expenses for the second quarter of 2023 were $17.0 million, driven by the addition of GVB operations, investment in the VLN® products sales and launch and ongoing investments in back-office support. |
| o | The Company announced a cost reduction initiative for the second half 2023, expected to generate at least $15 million in annualized operating cost reductions |
| o | Cost reductions are intended to streamline the business, focusing operating activities on sustaining and growing the commercial footprint, following heavier initial investment required to support the commercial launches during 1H 2023 |
| ● | Operating loss and net loss for the second quarter of 2023 was $19.4 million, compared to $10.5 million in the prior year period. |
| ● | Adjusted EBITDA was a loss of $16.0 million, compared to prior year loss of $7.1 million. See the tables included in this release for a reconciliation of Adjusted EBITDA (a non-GAAP measure) to net loss. |
Balance Sheet and Liquidity
| ● | As of June 30, 2023, the Company had $11.9 million in cash, cash equivalents and restricted cash. |
| ● | Subsequently, in July 2023, the Company raised approximately $14.6 million in additional gross proceeds in equity transactions. |
Second Quarter 2023 Conference Call
22nd Century will host a live webcast today at 8:00 a.m. E.T. to discuss its second quarter 2023 financial results and business highlights.
The live webcast, interactive Q&A, and slide presentation will be accessible in the Events section on 22nd Century’s Investor Relations website at https://ir.xxiicentury.com/events-and-presentations/default.aspx. An archived replay of the webcast will also be available shortly after the live event has concluded.
About 22nd Century Group, Inc.
22nd Century Group, Inc. (Nasdaq: XXII) is a leading biotechnology company focused on utilizing advanced plant technologies to improve health and wellness through tobacco harm reduction, reduced nicotine tobacco, hemp/cannabis and hops. With dozens of patents allowing it to control nicotine biosynthesis in the tobacco plant, the Company has developed proprietary reduced nicotine content (RNC) tobacco plants and cigarettes, which have become the cornerstone of the FDA’s Comprehensive Plan to address the widespread death and disease caused by smoking. The Company received the first and only FDA Modified Risk Tobacco Product (MRTP) authorization for a combustible cigarette in December 2021. In tobacco, hemp/cannabis and hop plants, 22nd Century uses modern plant breeding technologies, including genetic engineering, gene-editing, and molecular breeding to deliver solutions for the pharmaceutical and consumer products industries by creating new, proprietary plants with optimized alkaloid and flavonoid profiles as well as improved yields and valuable agronomic traits.
Learn more at xxiicentury.com, on Twitter, on LinkedIn, and on YouTube.
Learn more about VLN® at tryvln.com.
Cautionary Note Regarding Forward-Looking Statements
Except for historical information, all of the statements, expectations, and assumptions contained in this press release are forward-looking statements, including but not limited to our full year business outlook. Forward-looking statements typically contain terms such as “anticipate,” “believe,” “consider,” “continue,” “could,” “estimate,” “expect,” “explore,” “foresee,” “goal,” “guidance,” “intend,” “likely,” “may,” “plan,” “potential,” “predict,” “preliminary,” “probable,” “project,” “promising,” “seek,” “should,” “will,” “would,” and similar expressions. Actual results might differ materially from those explicit or implicit in forward-looking statements. Important factors that could cause actual results to differ materially are set forth in “Risk Factors” in the Company’s Annual Report on Form 10-K filed on March 9, 2023. All information provided in this release is as of the date hereof, and the Company assumes no obligation to and does not intend to update these forward-looking statements, except as required by law.
Investor Relations & Media Contact
Matt Kreps
Investor Relations
22nd Century Group
214-597-8200
22nd CENTURY GROUP, INC.
CONDENSED CONSOLIDATED BALANCE SHEETS
(Unaudited)
(amounts in thousands, except per-share data)
| | June 30, | | December 31, | ||
|
| 2023 |
| 2022 | ||
ASSETS |
| |
|
| |
|
Current assets: |
| |
|
| |
|
Cash and cash equivalents | | $ | 4,433 | | $ | 3,020 |
Short-term investment securities | |
| — | |
| 18,193 |
Accounts receivable, net | |
| 8,736 | |
| 5,641 |
Inventories | |
| 14,318 | |
| 10,008 |
Insurance recoveries | |
| 3,000 | |
| 5,000 |
Prepaid expenses and other current assets | |
| 6,388 | |
| 2,743 |
Total current assets | |
| 36,875 | |
| 44,605 |
Property, plant and equipment, net | |
| 14,401 | |
| 13,093 |
Operating lease right-of-use assets, net | |
| 6,955 | |
| 2,675 |
Goodwill | |
| 33,360 | |
| 33,160 |
Intangible assets, net | |
| 21,526 | |
| 16,853 |
Investments | |
| 682 | |
| 682 |
Restricted cash | |
| 7,500 | |
| — |
Other assets | | | 3,681 | | | 3,583 |
Total assets | | $ | 124,980 | | $ | 114,651 |
| |
|
| |
|
|
LIABILITIES AND SHAREHOLDERS' EQUITY | |
|
| |
|
|
Current liabilities: | |
|
| |
|
|
Notes and loans payable - current | | $ | 1,988 | | $ | 908 |
Current portion of long-term debt | | | 1,960 | | | — |
Operating lease obligations | |
| 1,082 | |
| 681 |
Accounts payable | |
| 6,449 | |
| 4,168 |
Accrued expenses | |
| 6,842 | |
| 1,428 |
Accrued payroll | |
| 2,426 | |
| 3,199 |
Accrued excise taxes and fees | |
| 2,704 | |
| 1,423 |
Deferred income | | | 214 | | | 831 |
Other current liabilities | |
| 1,438 | |
| 380 |
Total current liabilities | |
| 25,103 | |
| 13,018 |
Long-term liabilities: | |
|
| |
|
|
Notes and loans payable | |
| 185 | |
| 3,001 |
Operating lease obligations | |
| 6,118 | |
| 2,141 |
Long-term debt | |
| 15,326 | |
| — |
Other long-term liabilities | | | 5,656 | | | 516 |
Total liabilities | | | 52,388 | | | 18,676 |
Commitments and contingencies (Note 11) | |
| | |
| |
Shareholders' equity | |
|
| |
|
|
Preferred stock, $.00001 par value, 10,000,000 shares authorized | |
|
| |
|
|
Common stock, $.00001 par value, 33,333,334 shares authorized | |
|
| |
|
|
Capital stock issued and outstanding: | |
|
| |
|
|
15,926,803 common shares (14,349,275 at December 31, 2022) | |
| | |
| |
Common stock, par value | | | — | | | — |
Capital in excess of par value | |
| 349,206 | |
| 333,900 |
Accumulated other comprehensive loss | |
| 39 | |
| (111) |
Accumulated deficit | |
| (276,653) | |
| (237,814) |
Total shareholders' equity | |
| 72,592 | |
| 95,975 |
Total liabilities and shareholders’ equity | | $ | 124,980 | | $ | 114,651 |
22nd CENTURY GROUP, INC.
CONDENSED CONSOLIDATED STATEMENTS OF OPERATIONS AND COMPREHENSIVE LOSS
(Unaudited)
(amounts in thousands, except per-share data)
| | Three Months Ended | | Six Months Ended | ||||||||
| | June 30, | | June 30, | ||||||||
|
| 2023 |
| 2022 |
| 2023 |
| 2022 | ||||
Revenues, net | | $ | 23,427 | | $ | 14,477 | | $ | 45,389 | | $ | 23,521 |
Cost of goods sold | |
| 25,772 | |
| 13,585 | |
| 48,911 | |
| 22,321 |
Gross (loss) profit | |
| (2,345) | |
| 892 | |
| (3,522) | |
| 1,200 |
Operating expenses: | |
|
| |
|
| |
| | |
| |
Sales, general and administrative | |
| 14,540 | |
| 8,684 | |
| 28,771 | |
| 15,946 |
Research and development | |
| 1,793 | |
| 1,897 | |
| 3,310 | |
| 3,036 |
Other operating expense, net | | | 675 | |
| 787 | |
| 1,573 | |
| 839 |
Total operating expenses | |
| 17,008 | |
| 11,368 | |
| 33,654 | |
| 19,821 |
Operating loss | |
| (19,353) | |
| (10,476) | |
| (37,176) | |
| (18,621) |
Other income (expense): | |
|
| |
|
| |
| | |
| |
Unrealized loss on investments | |
| — | |
| (885) | |
| — | |
| (1,702) |
Realized loss on short-term investment securities | |
| (28) | |
| (108) | |
| (41) | |
| (108) |
Other income, net | |
| 16 | |
| — | |
| 34 | |
| — |
Interest income, net | |
| 65 | |
| 48 | |
| 122 | |
| 98 |
Interest expense | |
| (1,193) | |
| (77) | |
| (1,614) | |
| (82) |
Total other expense | |
| (1,140) | |
| (1,022) | |
| (1,499) | |
| (1,794) |
Loss before income taxes | |
| (20,493) | | | (11,498) | |
| (38,675) | | | (20,415) |
Provision for income taxes | |
| 46 | | | — | |
| 46 | |
| — |
Net loss | | $ | (20,539) | | $ | (11,498) | | $ | (38,721) | | $ | (20,415) |
Deemed dividend from trigger of anti-dilution provision feature | | | (367) | | | — | | | (367) | | | — |
Net loss available to common shareholders | | $ | (20,906) | | $ | (11,498) | | $ | (39,088) | | $ | (20,415) |
| | | | | | | | | | | | |
Basic and diluted loss per common share | | $ | (1.40) | | $ | (0.95) | | $ | (2.67) | | $ | (1.77) |
Weighted average common shares outstanding - basic and diluted | |
| 14,900 | | $ | 12,134 | | | 14,644 | | | 11,509 |
| | | | | | | | | | | | |
| | | | | | | | | | | | |
Net loss | | | (20,539) | | | (11,498) | | $ | (38,721) | | $ | (20,415) |
Other comprehensive loss: | |
|
| |
|
| |
| | |
| |
Unrealized gain (loss) on short-term investment securities | |
| 10 | |
| (69) | |
| 71 | |
| (469) |
Foreign currency translation | |
| 42 | |
| — | |
| 38 | |
| — |
Reclassification of realized losses to net loss | |
| 28 | |
| 108 | |
| 41 | |
| 108 |
Other comprehensive income (loss) | | | 80 | | | 39 | | | 150 | | | (361) |
Comprehensive loss | | $ | (20,459) | | $ | (11,459) | | $ | (38,571) | | $ | (20,776) |
Reconciliations of Non-GAAP Measures
Below is a table containing information relating to the Company’s Net loss, EBITDA and Adjusted EBITDA for the three and six month periods ended June 30, 2023 and 2022, including a reconciliation of these Non-GAAP measures for such periods.
| | Quarter Ended | |||||||
| | June 30, | |||||||
| | Dollar Amounts in Thousands ($000's) | |||||||
| | (UNAUDITED) | |||||||
|
| | |
| | |
| | $ Change |
| | 2023 | | 2022 | | | fav / (unfav) | ||
Net loss | | $ | (20,539) | | $ | (11,498) |
| $ | (9,041) |
Interest (income)/expense, net | | | 1,129 | | | 29 |
| | 1,100 |
Provision for income taxes | | | 46 | | | — | | | 46 |
Amortization and depreciation | | | 1,212 | | | 595 | | | 617 |
EBITDA | | $ | (18,152) | | $ | (10,875) |
| $ | (7,278) |
Adjustments: | | | | | | | | | |
Equity-based employee compensation expense | | | 1,486 | | | 1,106 |
| | 380 |
Needlerock Farms settlement | | | 10 | | | — |
| | 10 |
Grass Valley fire | | | 256 | | | — | | | 256 |
Loss on change of warrant liability | | | 584 | | | — | | | 584 |
Gain on change in contingent consideration | | | (217) | | | — | | | (217) |
Acquisition costs | | | 70 | | | 787 | | | (717) |
Unrealized loss on investment | | | — | | | 885 | | | (885) |
Inventory step-up | | | — | | | 978 | | | (978) |
Adjusted EBITDA | | $ | (15,963) | | $ | (7,118) |
| $ | (8,845) |
1Fav = Favorable variance, which increases EBITDA and Adjusted EBITDA; Unfav = unfavorable variance, which reduces EBITDA and Adjusted EBITDA
| | Year Ended | |||||||
| | June 30, | |||||||
| | Dollar Amounts in Thousands ($000's) | |||||||
| | (UNAUDITED) | |||||||
|
| | |
| | |
| | $ Change |
| | 2023 | | 2022 | | | fav / (unfav) | ||
Net loss | | $ | (38,721) | | $ | (20,415) |
| $ | (18,306) |
Interest (income)/expense, net | | | 1,492 | | | (16) |
| | 1,508 |
Provision for income taxes | | | 46 | | | — | | | 46 |
Amortization and depreciation | | | 2,093 | | | 924 | | | 1,169 |
EBITDA | | $ | (35,090) | | $ | (19,507) |
| $ | (15,583) |
Adjustments: | | | | | | | | | |
Equity-based employee compensation expense | | | 2,661 | | | 2,319 |
| | 342 |
Needlerock Farms settlement | | | 756 | | | — |
| | 756 |
Grass Valley fire | | | 324 | | | — |
| | 324 |
Loss on change of warrant liability | | | 723 | | | — |
| | 723 |
Gain on change in contingent consideration | | | (195) | | | — |
| | (195) |
Acquisition costs | | | 139 | | | 839 |
| | (700) |
Unrealized loss on investment | | | — | | | 1,702 |
| | (1,702) |
Inventory step-up | | | — | | | 978 |
| | (978) |
Adjusted EBITDA | | $ | (30,682) | | $ | (13,669) |
| $ | (17,013) |
1Fav = Favorable variance, which increases EBITDA and Adjusted EBITDA; Unfav = unfavorable variance, which reduces EBITDA and Adjusted EBITDA
Notes regarding Non-GAAP Financial Information
In addition to the Company’s reported results in accordance with generally accepted accounting principles in the United States of America (“GAAP”), the Company provides EBITDA and Adjusted EBITDA.
In order to calculate EBITDA, the Company adjusts net (loss) income by adding back interest expense (income), provision (benefit) for income taxes, and depreciation and amortization expense from intangible assets. Adjusted EBITDA consists of EBITDA adjusted by the Company for certain non-cash and non-operating expense, including adding back equity-based employee compensation expense, (gain) loss on investments, acquisition costs, and any unusual or infrequently occurring items.
The Company believes that the presentation of EBITDA and Adjusted EBITDA are important financial measures that supplement discussion and analysis of its financial condition and results of operations and enhances an understanding of its operating performance. While management considers EBITDA and Adjusted EBITDA to be important, these financial performance measures should be considered in addition to, but not as a substitute for or superior to, other measures of financial performance prepared in accordance with GAAP, such as operating (loss) income, net (loss) income and cash flows from operations. Adjusted EBITDA is susceptible to varying calculations and the Company’s measurement of Adjusted EBITDA may not be comparable to those of other companies.
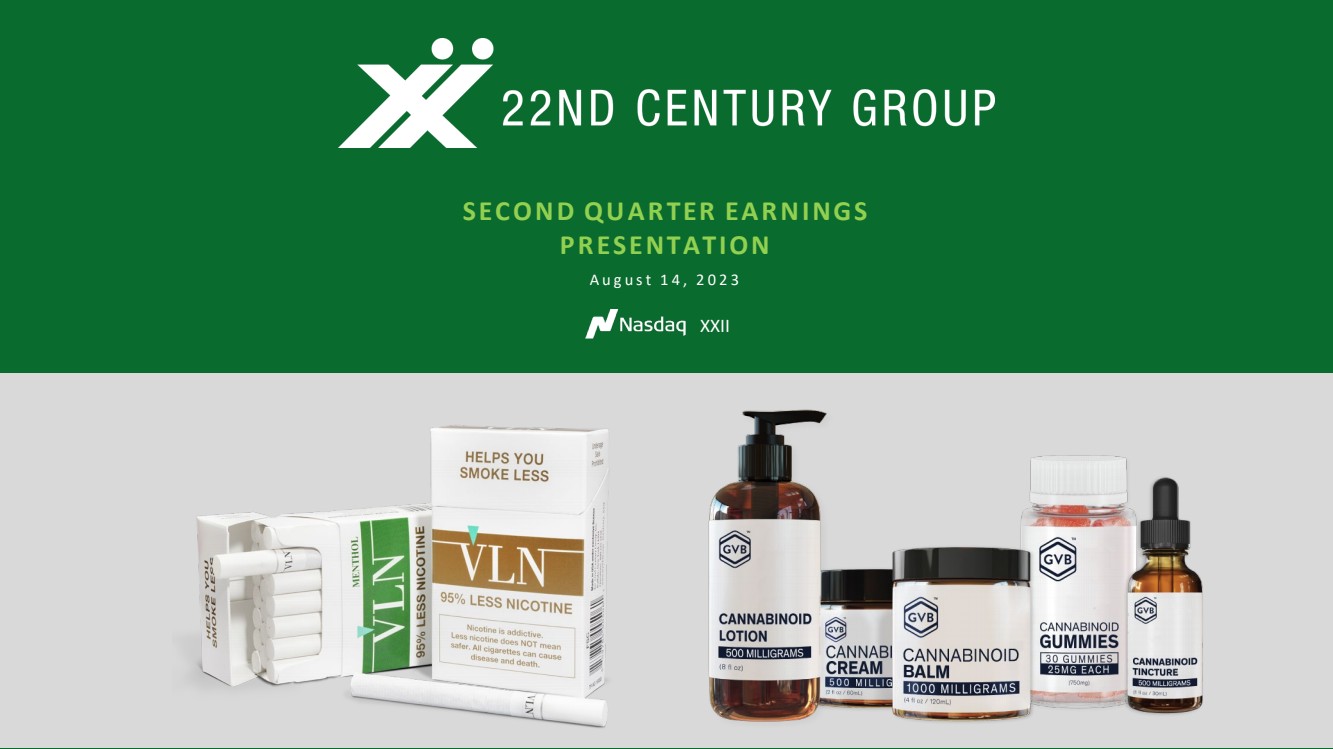
| XXII SECOND QUARTER EARNINGS PRESENTATION August 14, 2023 |
| CAUTIONARY NOTE ON FORWARD-LOOKING STATEMENTS This presentation contains forward-looking statements concerning our business operations, and financial performance and conditions, as well as our plans, objectives, and expectations for our business operations and financial performance and conditions that are subject to risks and uncertainties. All statements other than those of historical fact are forward-looking statements. These types of statements typically contain words such as “aim,” “anticipate,” “assume,” “believe,” “could,” “due,” “estimate,” “expect,” “goal,” “intend,” “may,” “objective,” “plan,” “potential,” “positioned,” “predict,” “should,” “target,” “will,” “would” and other similar expressions that are predictions of or indicate future events and future trends. Forward-looking statements are based on current expectations, estimates, forecasts, and projections about our business, the industry in which we operate, and our management’s beliefs and assumptions. 2 These statements are not guarantees of future performance or development and involve known and unknown risks, uncertainties, and other factors that are in some cases beyond our control. All forward-looking statements are subject to risks and uncertainties that could cause actual results to differ materially from those estimated. The contents of this presentation should be considered in conjunction with the risk factors, warnings, and cautionary statements contained in the Company’s annual, quarterly, and other reports filed with the U.S. Securities and Exchange Commission. We undertake no obligation to publicly update or revise any forward-looking statement as a result of new information, future events, or otherwise, except as required by law. |
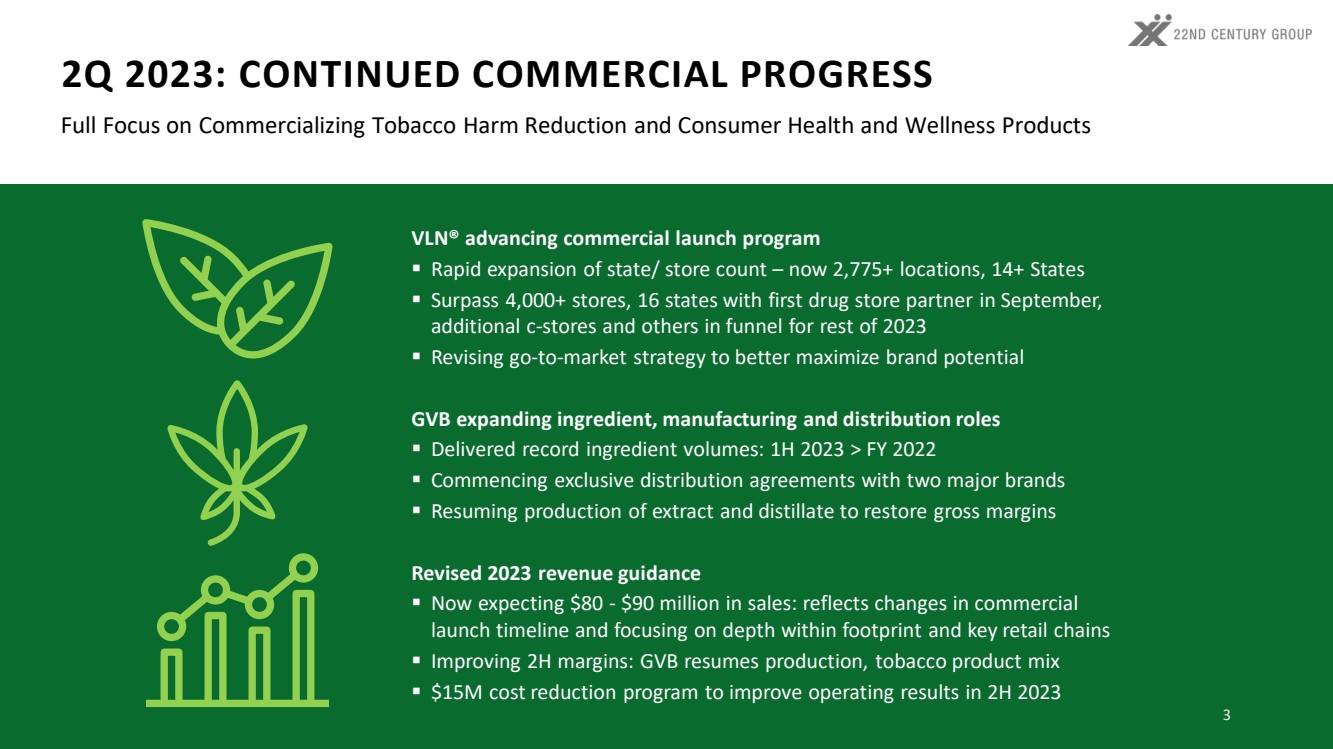
| VLN® advancing commercial launch program Rapid expansion of state/ store count – now 2,775+ locations, 14+ States Surpass 4,000+ stores, 16 states with first drug store partner in September, additional c-stores and others in funnel for rest of 2023 Revising go-to-market strategy to better maximize brand potential GVB expanding ingredient, manufacturing and distribution roles Delivered record ingredient volumes: 1H 2023 > FY 2022 Commencing exclusive distribution agreements with two major brands Resuming production of extract and distillate to restore gross margins Revised 2023 revenue guidance Now expecting $80 - $90 million in sales: reflects changes in commercial launch timeline and focusing on depth within footprint and key retail chains Improving 2H margins: GVB resumes production, tobacco product mix $15M cost reduction program to improve operating results in 2H 2023 2Q 2023: CONTINUED COMMERCIAL PROGRESS 3 Full Focus on Commercializing Tobacco Harm Reduction and Consumer Health and Wellness Products |
| FDA Authorized VLN® Cannabinoid Ingredients, APIs and CDMO Corporate/Financial |
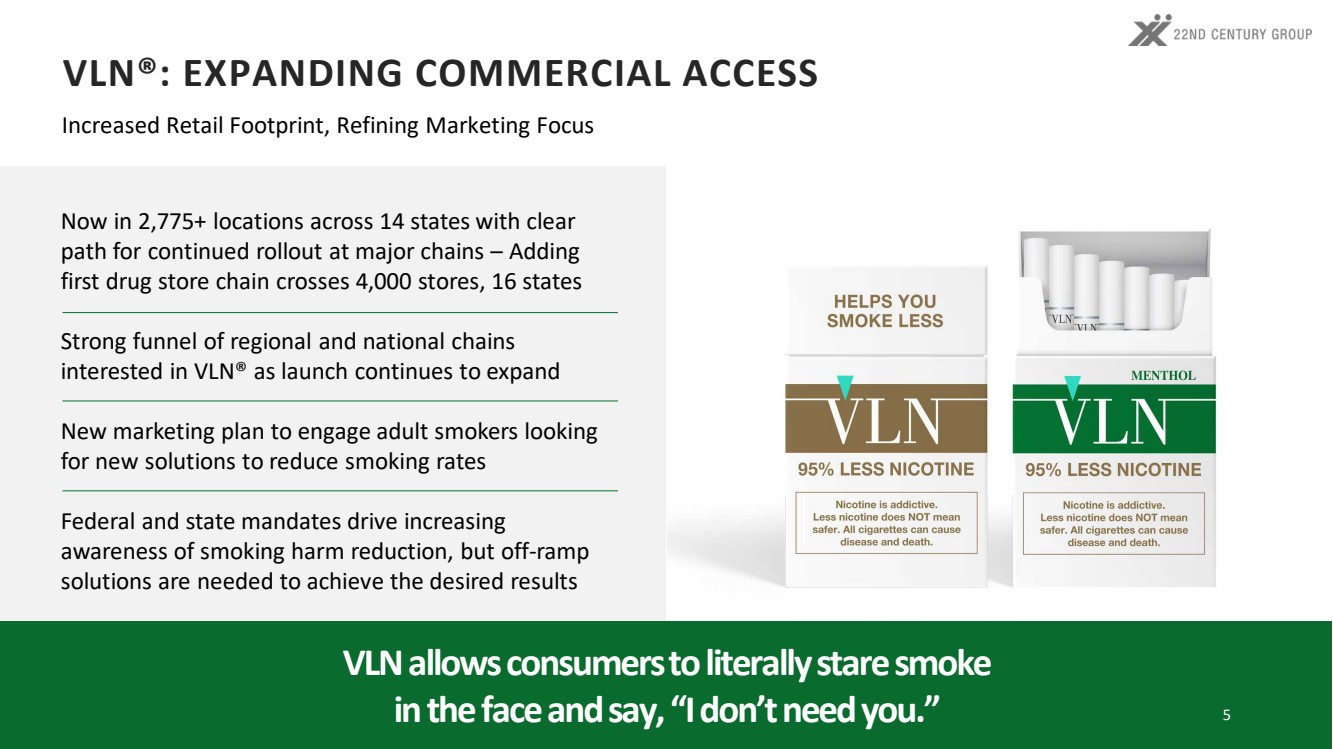
| VLN®: EXPANDING COMMERCIAL ACCESS Now in 2,775+ locations across 14 states with clear path for continued rollout at major chains – Adding first drug store chain crosses 4,000 stores, 16 states Strong funnel of regional and national chains interested in VLN® as launch continues to expand New marketing plan to engage adult smokers looking for new solutions to reduce smoking rates Federal and state mandates drive increasing awareness of smoking harm reduction, but off-ramp solutions are needed to achieve the desired results VLN allows consumers to literally stare smoke in the face and say, “I don’t need you.” 5 Increased Retail Footprint, Refining Marketing Focus |
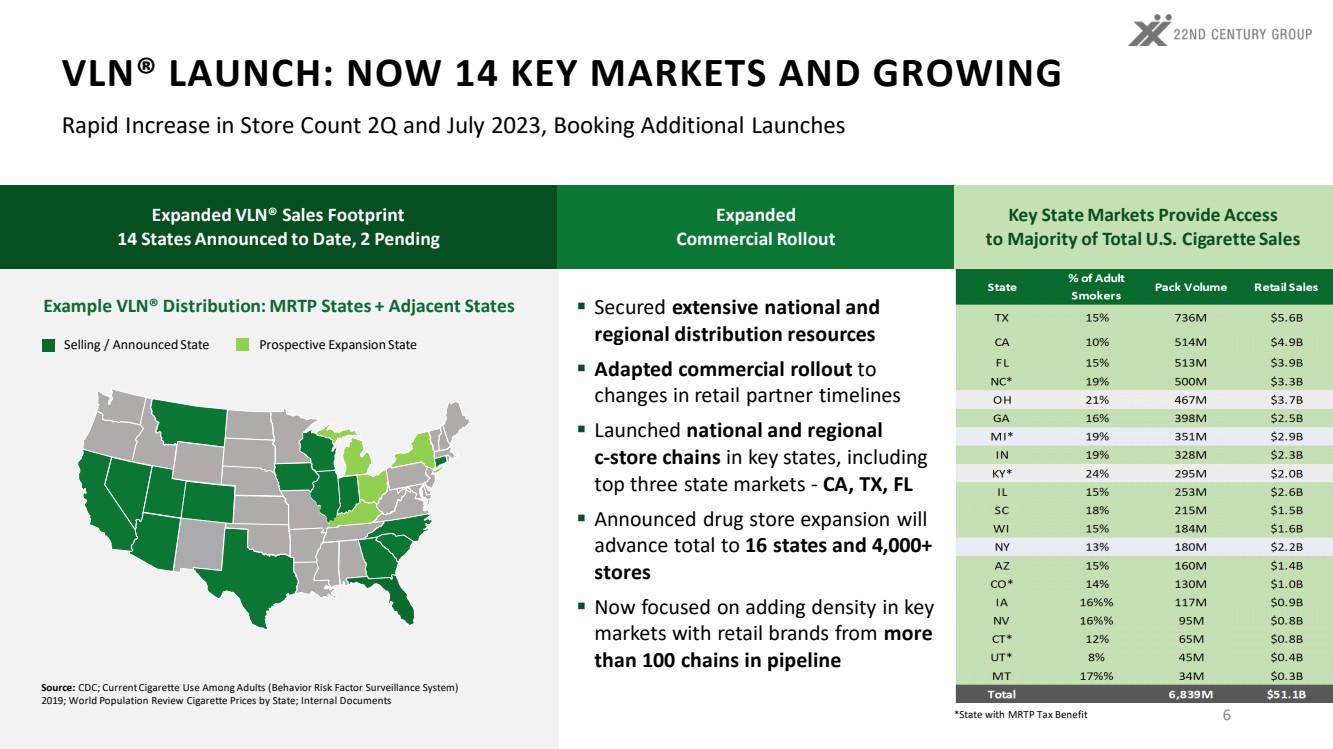
| Example VLN® Distribution: MRTP States + Adjacent States 6 VLN® LAUNCH: NOW 14 KEY MARKETS AND GROWING Selling / Announced State Prospective Expansion State Source: CDC; Current Cigarette Use Among Adults (Behavior Risk Factor Surveillance System) 2019; World Population Review Cigarette Prices by State; Internal Documents Expanded VLN® Sales Footprint 14 States Announced to Date, 2 Pending Rapid Increase in Store Count 2Q and July 2023, Booking Additional Launches *State with MRTP Tax Benefit Expanded Commercial Rollout Key State Markets Provide Access to Majority of Total U.S. Cigarette Sales Secured extensive national and regional distribution resources Adapted commercial rollout to changes in retail partner timelines Launched national and regional c-store chains in key states, including top three state markets - CA, TX, FL Announced drug store expansion will advance total to 16 states and 4,000+ stores Now focused on adding density in key markets with retail brands from more than 100 chains in pipeline TO UPDATE STATES CHART |
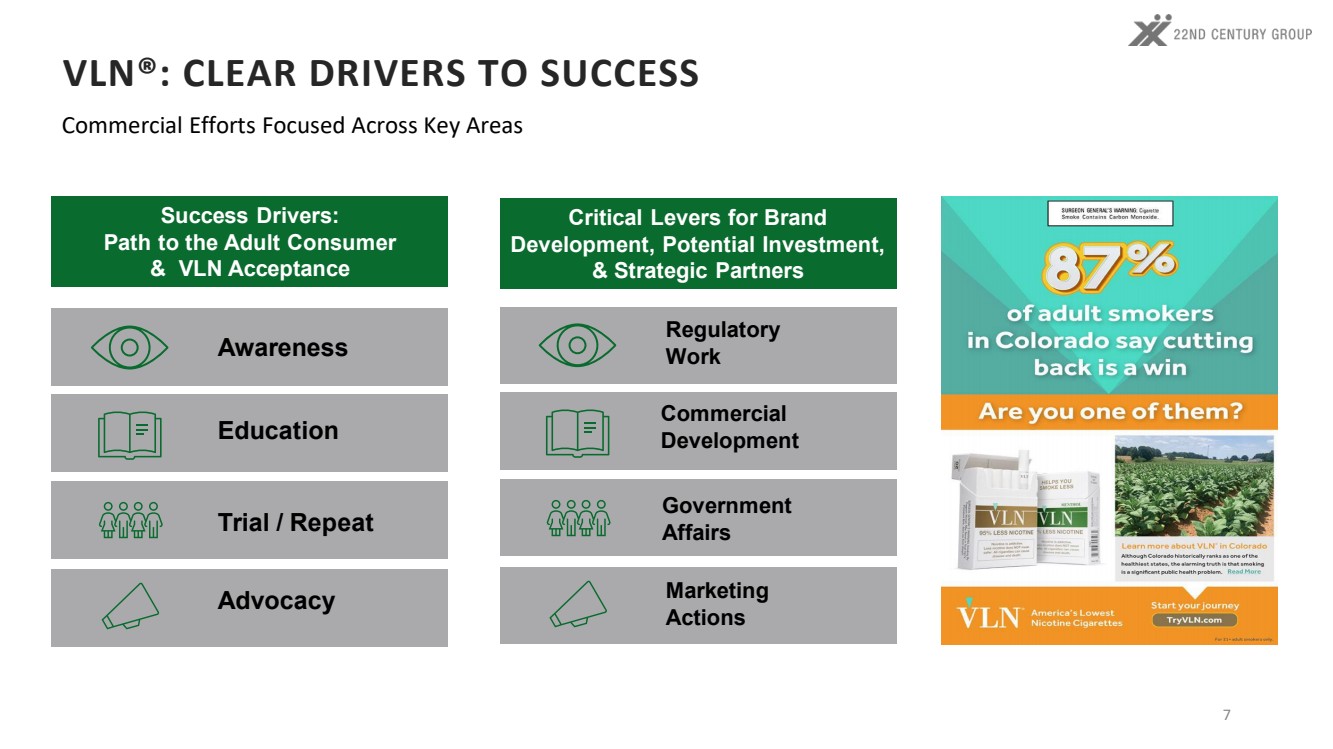
| Tobacco Division Executive Summary • The Success Drivers (to the consumer) and our Critical Levers (Org Dev) have not changed • The Drivers and Levers are Reinforcing to Each Other and Support our Mission • Success in Both Areas Will Drive Sales and Profits. All our Efforts are Focused in these Areas. 7 Critical Levers for Brand Development, Potential Investment, & Strategic Partners Regulatory Work Commercial Development Marketing Actions Government Affairs Success Drivers: Path to the Adult Consumer & VLN Acceptance Education Advocacy Trial / Repeat Awareness VLN®: CLEAR DRIVERS TO SUCCESS Commercial Efforts Focused Across Key Areas |
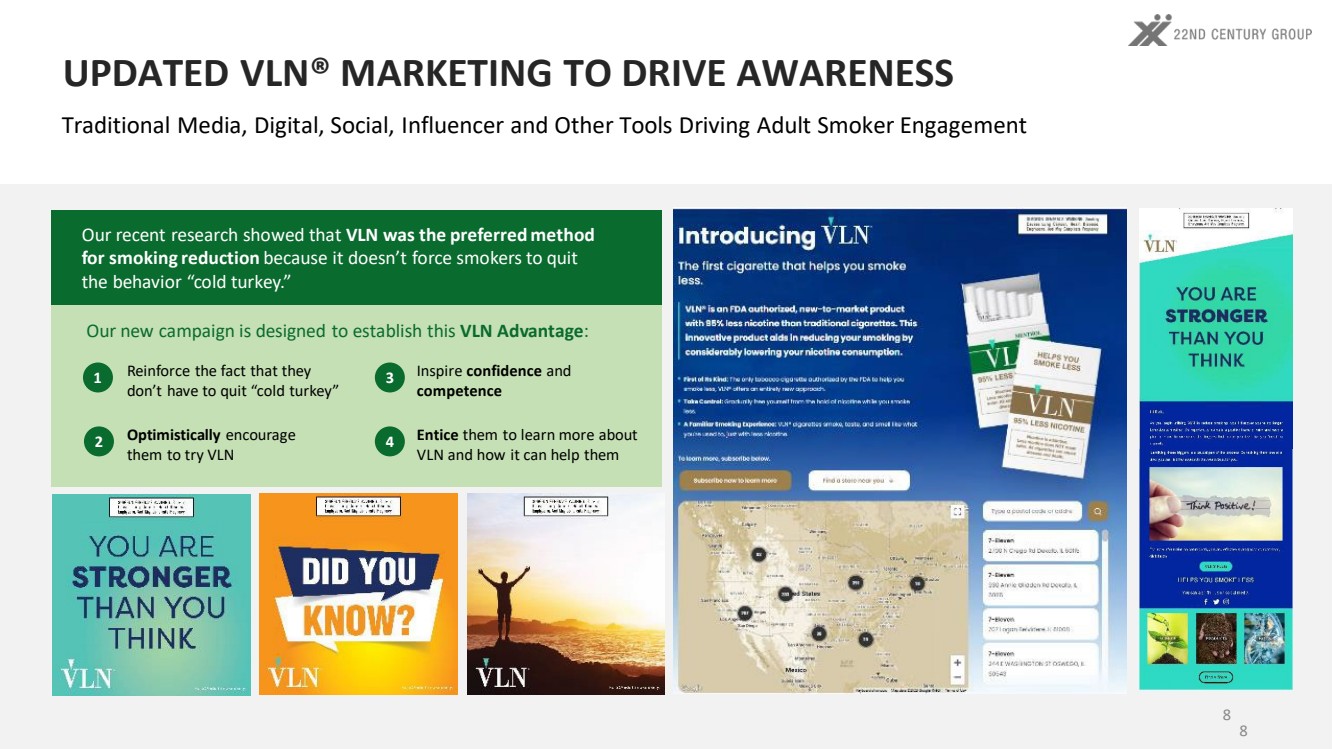
| UPDATED VLN® MARKETING TO DRIVE AWARENESS 8 4 Our new campaign is designed to establish this VLN Advantage: Our recent research showed that VLN was the preferred method for smoking reduction because it doesn’t force smokers to quit the behavior “cold turkey.” Reinforce the fact that they don’t have to quit “cold turkey” Optimistically encourage them to try VLN 1 2 3 Inspire confidence and competence Entice them to learn more about VLN and how it can help them 8 Traditional Media, Digital, Social, Influencer and Other Tools Driving Adult Smoker Engagement |
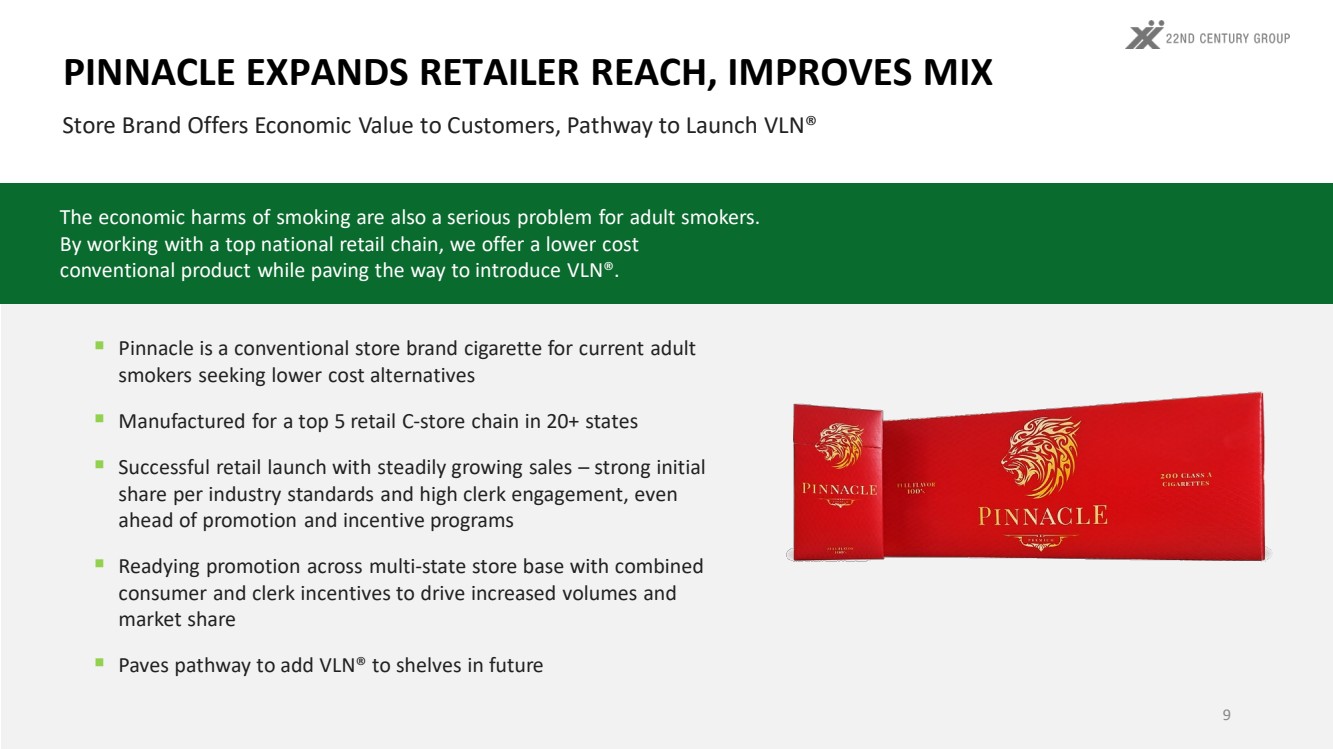
| PINNACLE EXPANDS RETAILER REACH, IMPROVES MIX Store Brand Offers Economic Value to Customers, Pathway to Launch VLN® Pinnacle is a conventional store brand cigarette for current adult smokers seeking lower cost alternatives Manufactured for a top 5 retail C-store chain in 20+ states Successful retail launch with steadily growing sales – strong initial share per industry standards and high clerk engagement, even ahead of promotion and incentive programs Readying promotion across multi-state store base with combined consumer and clerk incentives to drive increased volumes and market share Paves pathway to add VLN® to shelves in future The economic harms of smoking are also a serious problem for adult smokers. By working with a top national retail chain, we offer a lower cost conventional product while paving the way to introduce VLN®. 9 |
| FDA Authorized VLN® Cannabinoid Ingredients, APIs and CDMO Corporate/Financial |

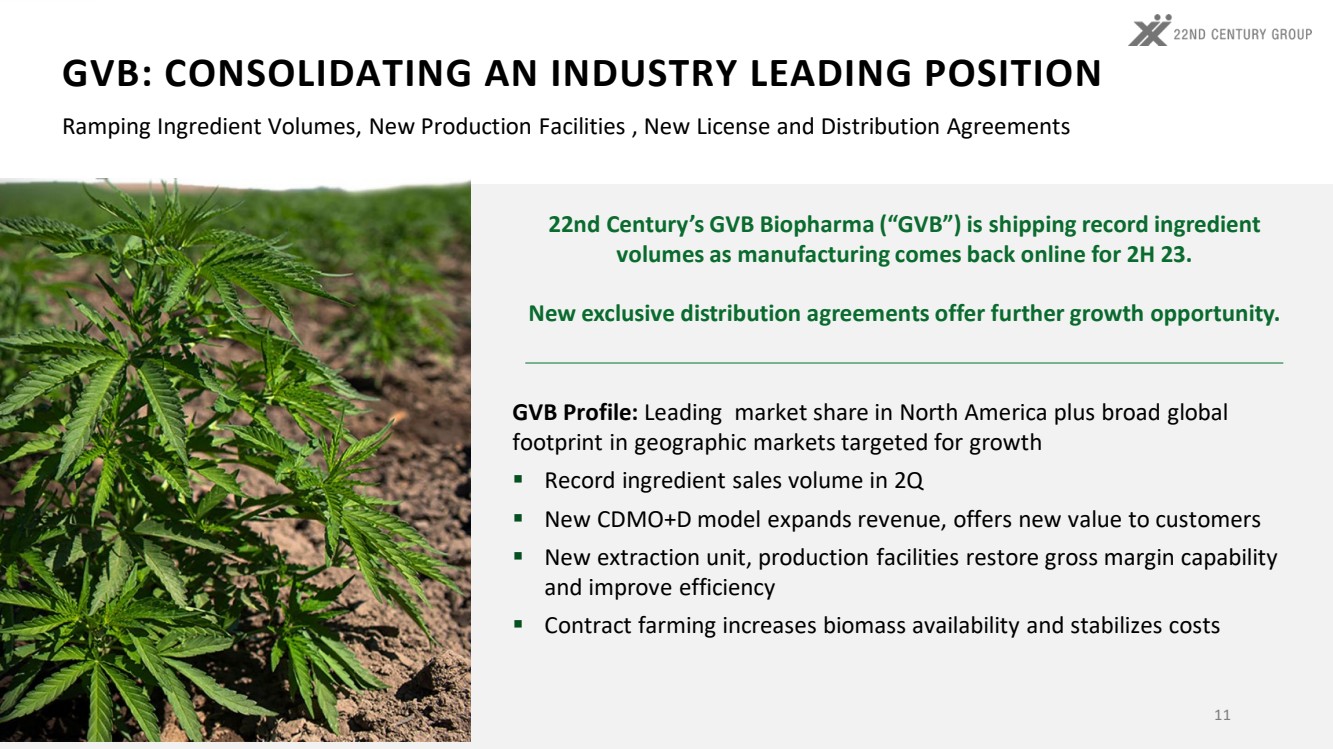
| GVB Profile: Leading market share in North America plus broad global footprint in geographic markets targeted for growth Record ingredient sales volume in 2Q New CDMO+D model expands revenue, offers new value to customers New extraction unit, production facilities restore gross margin capability and improve efficiency Contract farming increases biomass availability and stabilizes costs GVB: CONSOLIDATING AN INDUSTRY LEADING POSITION Ramping Ingredient Volumes, New Production Facilities , New License and Distribution Agreements 22nd Century’s GVB Biopharma (“GVB”) is shipping record ingredient volumes as manufacturing comes back online for 2H 23. New exclusive distribution agreements offer further growth opportunity. 11 |
| 16,524 26,546 27,912 41,070 68,195 76,591 1Q22 2Q22 3Q22 4Q22 1Q23 2Q23 RECORD INGREDIENT VOLUMES, PRODUCTION UPSIDE Return to In-House Production Enables Margin Restoration; Incremental Gross Profit Directly Reduces Cash Use GVB Bulk Ingredient Volumes (kgs) GVB bulk ingredient volumes rising rapidly based on reputation as reliable supplier of consistent, quality extracts New campus expected to target initial capacity of 5 million pounds hemp biomass, 400,000 kg of extract, 250,000 kg of isolate annually New isolate production expected online in 1Q 2024 12 112,052 144,786 |
| TRANSFORMATIVE NEW LICENSE & DISTRIBUTION DEALS Commencing Shipments Under Three-Year Agreements with Two Top Brands Working with the largest and best-known consumer CBD brands 13 New, single-source model provides complete solution Enhances GVB revenue and margin opportunities with distribution services Initial agreements with brand leaders like Cookies, Old Pal and others in process License covers broad range of hemp derived cannabinoid consumer packaged goods at each brand Ingredient Supply White-label manufacturing Retail category management and distribution Initial roll-out underway from July 2023, targeting retailers seeking innovative, high velocity, high margin, small footprint consumer CBD products |
| FDA Authorized VLN® Cannabinoid Ingredients, APIs and CDMO Corporate/Financial |
| SECOND QUARTER 2023 FINANCIAL HIGHLIGHTS 1. Gross profit margin is calculated by dividing gross profit by netrevenues. 2. See the tables included in this release for a reconciliation of Adjusted EBITDA (a non-GAAP measure) to net loss. +61.8% YoY increase in Net Revenues primarily due to GVB acquisition. Net Revenues Gross Profit1 Gross Margin1 Operating Loss Adjusted EBITDA2 2Q 2023 $23.4M $(2.3)M (10.0)% $(19.4)M $(16.0)M 2Q 2022 $14.5M $892K 6.2% $(10.5)M $(7.1)M Improved 2H 2023 operating performance expected to be driven by: Improving product margin mix for tobacco products, reflecting reduced filtered cigar volume New in-house GVB crude extraction and distillate production capabilities, in-house biomass production New GVB license and distribution contracts to begin shipping product Implementation of $15M+ operating cost reduction initiative Revised 2023 revenue outlook: $80 million to $90 million, reflecting changes in the launch timeline and scope of VLN® at certain key chains in 2023 and the operating expense reduction plan. 15 |
| TOBACCO REVENUE & PROFIT BREAKDOWN Tobacco 2Q 2023 2Q 2022 Unit sales1 .8M 1.5M Net revenue $8.1M $10.0M Gross profit $(1.0)M $0.9M 16 Net revenues decreased QoQ reflecting a planned reallocation in production resources at the Company’s NASCO facilities away from lower margin filtered cigars to higher margin VLN® and conventional cigarette products Gross profit declines QoQ reflecting the transition. 1. Tobacco unit sales volume is measure in cartons 2. Contract manufacturing operations (CMO) Opportunity in 2023 for additional tobacco net revenue growth and margin expansion: Expanding sales under new Pinnacle brand in conjunction with retail c-store chain promotions Increased sales volume of higher margin cigarette products in place of lower margin filtered cigar volumes VLN® launch with new retail chains within the targeted geographic footprint |
| HEMP/CANNABIS REVENUE & PROFIT BREAKDOWN 17 Net revenue growth QoQ primarily driven by: Addition of acquired GVB revenue contribution Significant GVB organic revenue volume growth Strong consumer demand for GVB bulk ingredients and new CDMO opportunities 1. Hemp/cannabis unit sales volume is measured as kilograms. 2. GVB acquisition occurred on May 13, 2022. Additional 2023 hemp/cannabis opportunity driven by: Organic growth reflecting continued high customer demand for ingredient volumes and manufacturing support Contracted farming to produce internally-sponsored biomass at lower cost Commencing greater activity under new exclusive license and distribution agreements Profit margin expansion from the restoration of GVB extraction capabilities and vertical integration with new Prineville crude extraction facility Hemp/Cannabis 2Q 2023 2Q 20222 Unit sales1 76,591 26,546 Net revenue $15.4M $4.5M Gross profit $(1.4M) $(36)K |
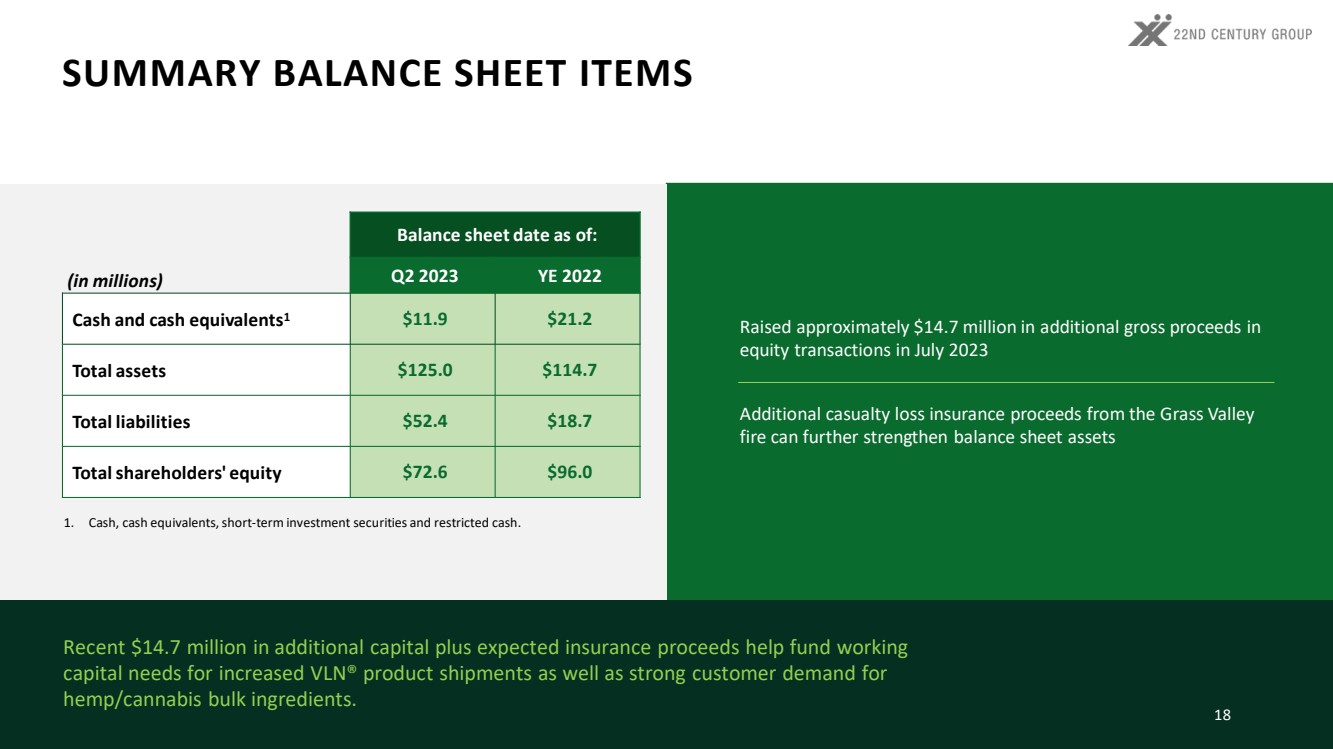
| SUMMARY BALANCE SHEET ITEMS Balance sheet date as of: (in millions) Q2 2023 YE 2022 Cash and cash equivalents1 $11.9 $21.2 Total assets $125.0 $114.7 Total liabilities $52.4 $18.7 Total shareholders' equity $72.6 $96.0 18 Raised approximately $14.7 million in additional gross proceeds in equity transactions in July 2023 Additional casualty loss insurance proceeds from the Grass Valley fire can further strengthen balance sheet assets 1. Cash, cash equivalents, short-term investment securities and restricted cash. Recent $14.7 million in additional capital plus expected insurance proceeds help fund working capital needs for increased VLN® product shipments as well as strong customer demand for hemp/cannabis bulk ingredients. |
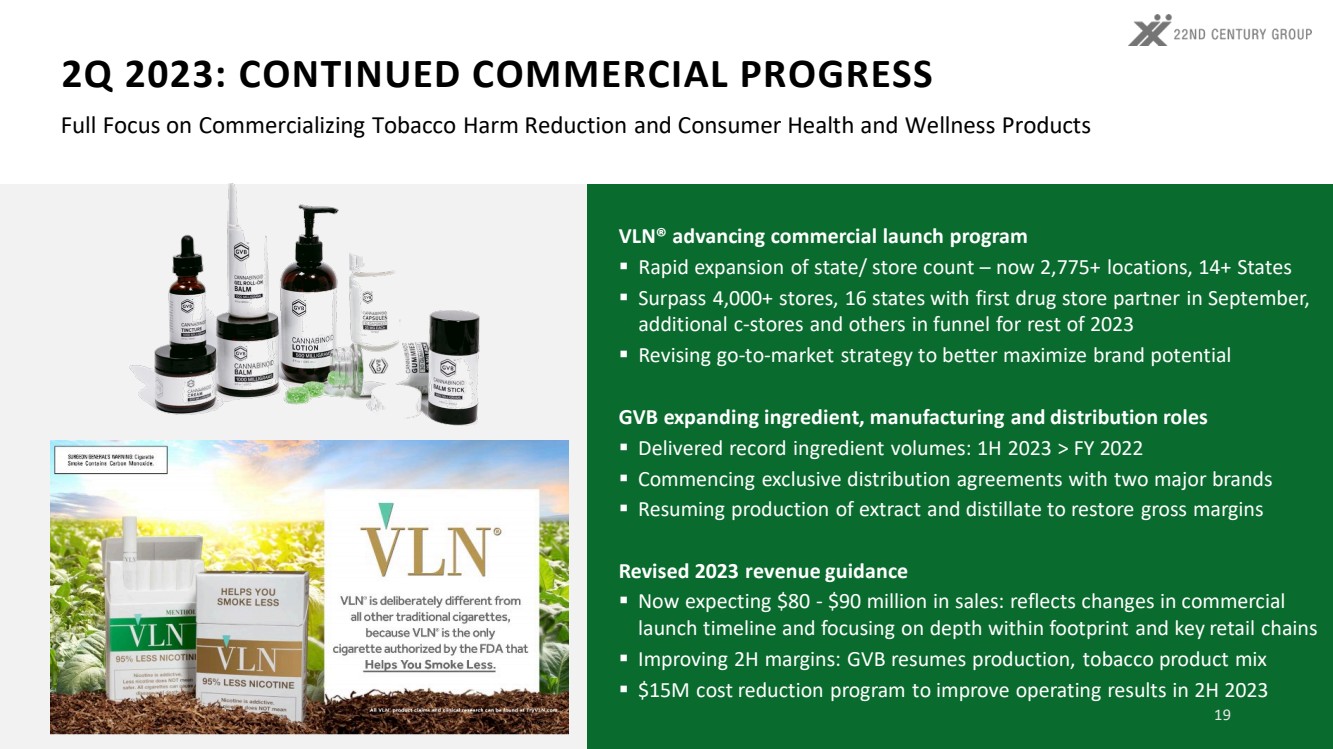
| 2Q 2023: CONTINUED COMMERCIAL PROGRESS 19 Full Focus on Commercializing Tobacco Harm Reduction and Consumer Health and Wellness Products VLN® advancing commercial launch program Rapid expansion of state/ store count – now 2,775+ locations, 14+ States Surpass 4,000+ stores, 16 states with first drug store partner in September, additional c-stores and others in funnel for rest of 2023 Revising go-to-market strategy to better maximize brand potential GVB expanding ingredient, manufacturing and distribution roles Delivered record ingredient volumes: 1H 2023 > FY 2022 Commencing exclusive distribution agreements with two major brands Resuming production of extract and distillate to restore gross margins Revised 2023 revenue guidance Now expecting $80 - $90 million in sales: reflects changes in commercial launch timeline and focusing on depth within footprint and key retail chains Improving 2H margins: GVB resumes production, tobacco product mix $15M cost reduction program to improve operating results in 2H 2023 |
| Questions & Answers Q A INVESTOR RELATIONS & MEDIA CONTACT Matt Kreps Investor Relations 22nd Century Group, Inc. +1 -214 -597 -8200 [email protected] |