
z-20210805
false000161764000016176402021-08-052021-08-050001617640us-gaap:CommonClassAMember2021-08-052021-08-050001617640us-gaap:CommonClassCMember2021-08-052021-08-05

UNITED STATES
SECURITIES AND EXCHANGE COMMISSION
Washington, D.C. 20549

FORM 8-K
CURRENT REPORT
Pursuant to Section 13 or 15(d)
of the Securities Exchange Act of 1934
Date of Report (Date of Earliest Event Reported): August 5, 2021
ZILLOW GROUP, INC.
(Exact name of registrant as specified in its charter)
Washington 001-36853 47-1645716
(State or other jurisdiction
of incorporation)
 (Commission
File Number)
 (I.R.S. Employer
Identification No.)
1301 Second Avenue, Floor 31, Seattle, Washington
 98101
(Address of principal executive offices) (Zip Code)
(206) 470-7000
(Registrant’s telephone number, including area code)
Check the appropriate box below if the Form 8-K filing is intended to simultaneously satisfy the filing obligation of the registrant under any of the following provisions:
Written communications pursuant to Rule 425 under the Securities Act (17 CFR 230.425)
Soliciting material pursuant to Rule 14a-12 under the Exchange Act (17 CFR 240.14a-12)
Pre-commencement communications pursuant to Rule 14d-2(b) under the Exchange Act (17 CFR 240.14d-2(b))
Pre-commencement communications pursuant to Rule 13e-4(c) under the Exchange Act (17 CFR 240.13e-4(c))

Securities registered pursuant to Section 12(b) of the Act:
Title of each classTrading Symbol(s)Name of each exchange on which registered
Class A Common Stock, par value $0.0001 per shareZGThe Nasdaq Global Select Market
Class C Capital Stock, par value $0.0001 per shareZThe Nasdaq Global Select Market
Indicate by check mark whether the registrant is an emerging growth company as defined in Rule 405 of the Securities Act of 1933 (§230.405 of this chapter) or Rule 12b-2 of the Securities Exchange Act of 1934 (§240.12b-2 of this chapter).
Emerging growth company     
If an emerging growth company, indicate by check mark if the registrant has elected not to use the extended transition period for complying with any new or revised financial accounting standards provided pursuant to Section 13(a) of the Exchange Act.    ☐


Item 2.02Results of Operations and Financial Condition.
Zillow Group, Inc. (“Zillow Group”) today issued a press release and a shareholder letter announcing its financial results for the fiscal quarter ended June 30, 2021. The full text of the press release issued in connection with the announcement is furnished as Exhibit 99.1, accompanying supporting tables as Exhibit 99.2 and the shareholder letter as Exhibit 99.3 to this Current Report on Form 8-K.
The information in this Item 2.02 and Exhibits 99.1, 99.2 and 99.3 of this Current Report on Form 8-K shall not be deemed to be “filed” for purposes of Section 18 of the Securities Exchange Act of 1934, as amended (the “Exchange Act”), or otherwise subject to the liabilities of that section, nor shall it be deemed incorporated by reference into any filing under the Securities Act of 1933, as amended, or the Exchange Act, except as expressly set forth by specific reference in such a filing.
Item 9.01Financial Statements and Exhibits.
(d) Exhibits.
Exhibit
Number
  Description
99.1
99.2
99.3
104Cover Page Interactive Data File (embedded within the Inline XBRL document).


SIGNATURES
Pursuant to the requirements of the Securities Exchange Act of 1934, the registrant has duly caused this report to be signed on its behalf by the undersigned hereunto duly authorized.
 
Dated: August 5, 2021 ZILLOW GROUP, INC.
 By:
/s/ JENNIFER ROCK
 Name:Jennifer Rock
 Title:Chief Accounting Officer


Exhibit 99.1

zglogoa04a.jpg
Contacts:
Brad Berning
Investor Relations
[email protected]
Chrissy Roebuck
Public Relations
[email protected]
 
Zillow Group Reports Second-Quarter 2021 Financial Results

SEATTLE – August 5, 2021 – Zillow Group, Inc. (NASDAQ: Z and ZG), which is transforming the way people buy, sell, rent and finance homes, today announced its consolidated financial results for the three months ended June 30, 2021.

Complete financial results for the second quarter and outlook for the third quarter of 2021 can be found in the company’s shareholder letter in the Investor Relations section of Zillow Group’s website at https://investors.zillowgroup.com/investors/financials/quarterly-results/default.aspx.

“Zillow is making rapid and significant progress toward building a seamless, integrated real estate experience for our customers and partners. Our strong second-quarter results show how well we’re executing on the three- to five-year growth objectives we announced in 2019,” said Zillow Group co-founder and CEO Rich Barton. “Of particular note, our iBuying business, Zillow Offers, continues to accelerate as we offer more customers a fast, fair, flexible and convenient way to move. Zillow Offers is proving attractive to sellers even in this sizzling-hot seller’s market. Finally, we expect millennial-buyers, low interest rates, and the increasing adoption of location-flexible work policies, to fuel interest in moving for many years to come. And these movers will increasingly demand e-commerce-like solutions where Zillow excels.”

Recent highlights include:
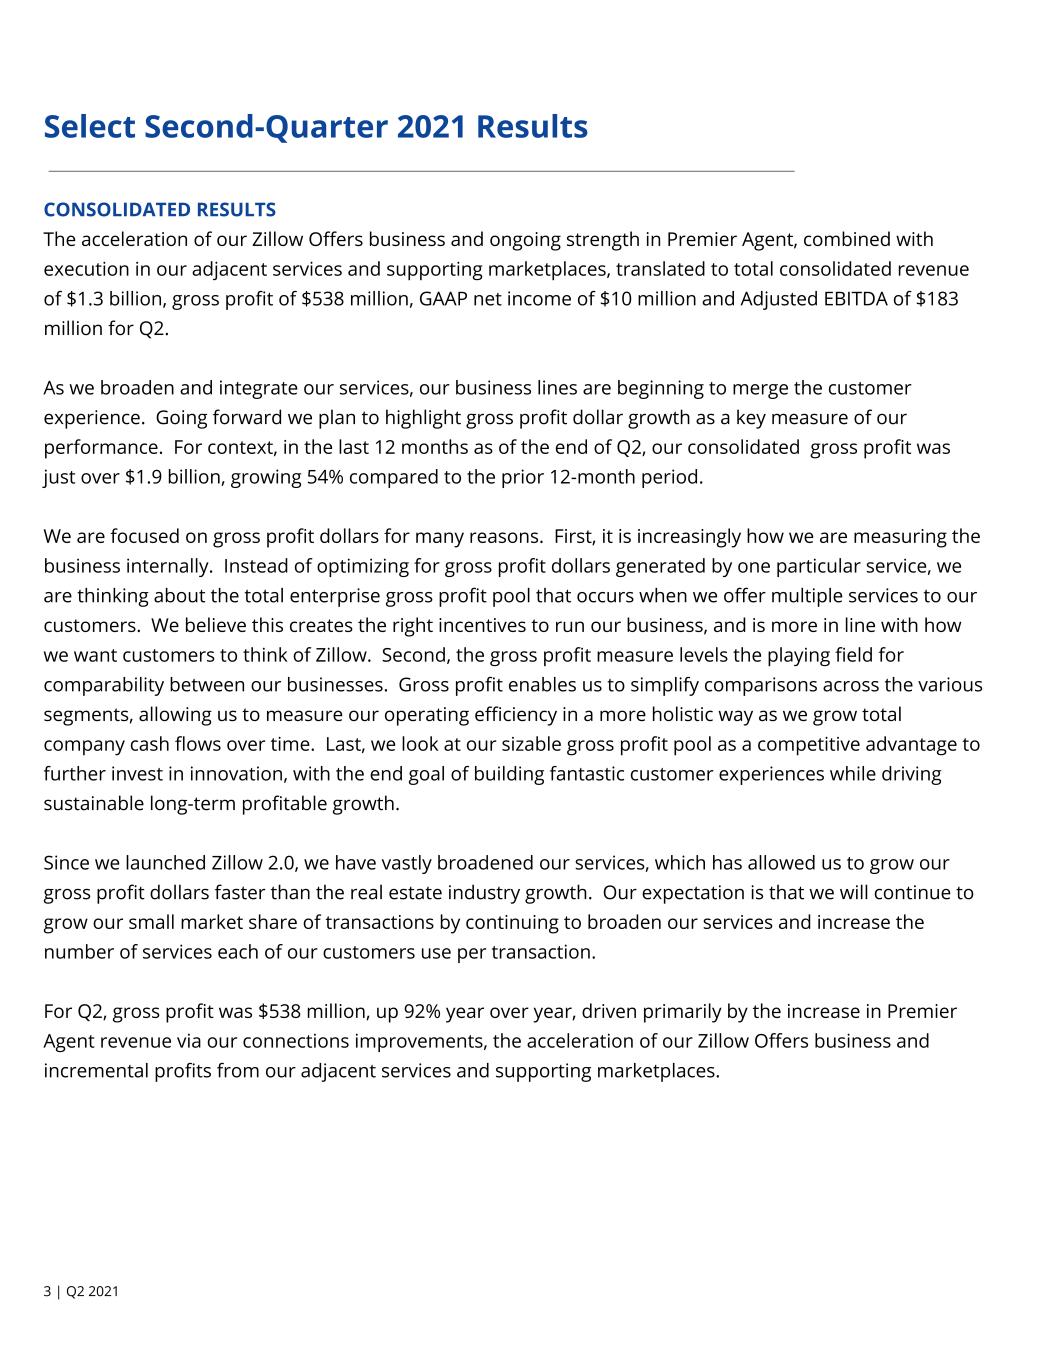
Consolidated second-quarter revenue of $1.3 billion and revenue for the IMT and Homes segments exceeded the high end of the company’s second-quarter outlook.
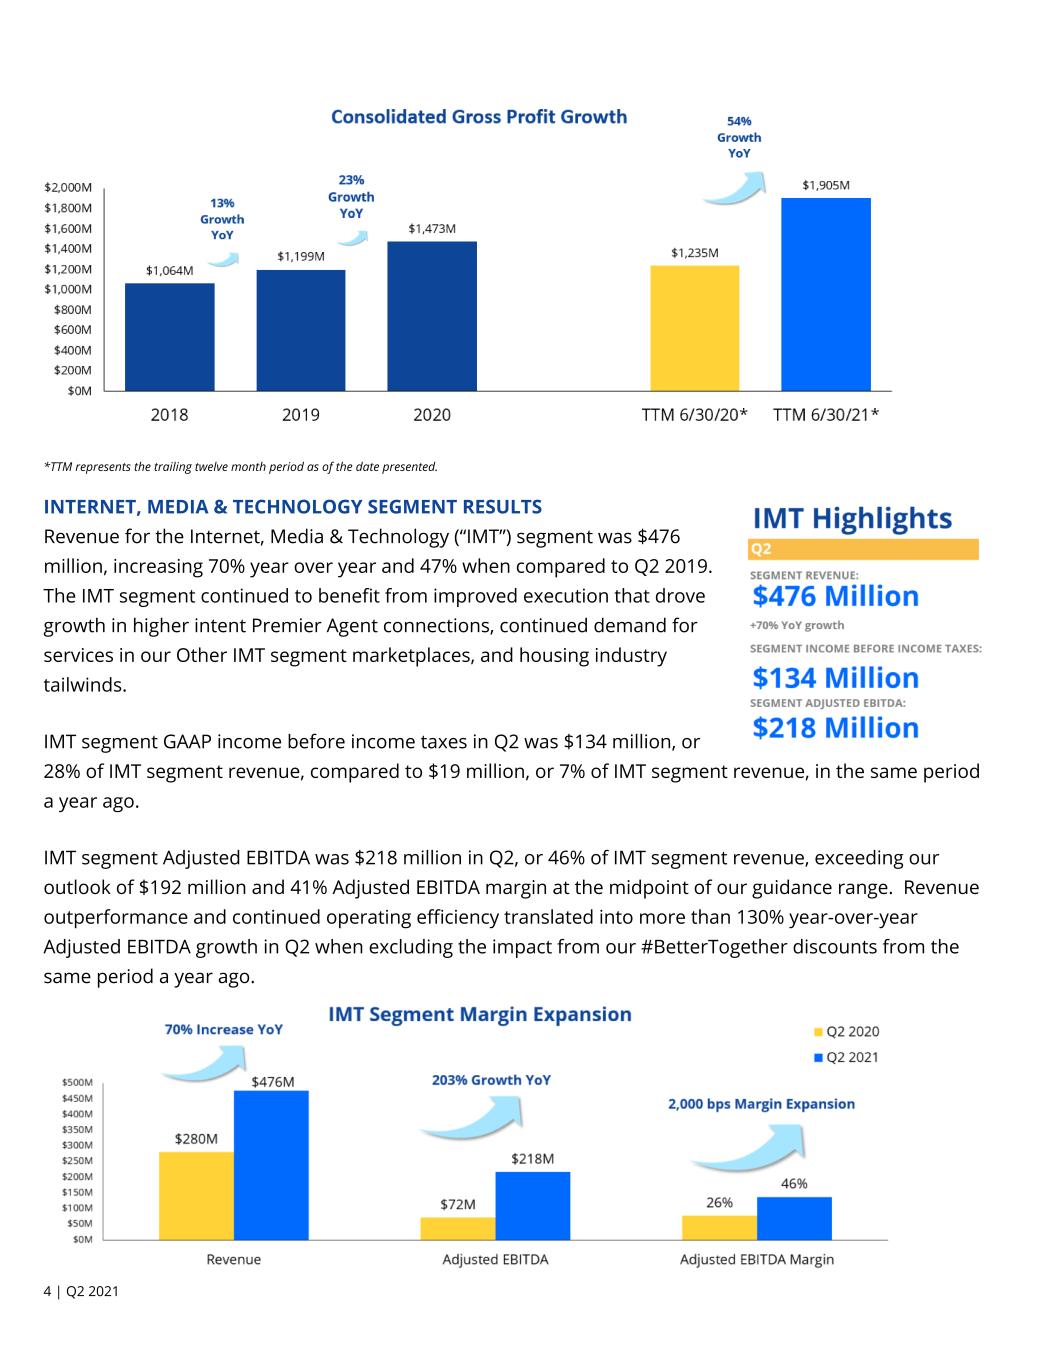
Consolidated second-quarter gross profit was $538 million, up 92% year over year.
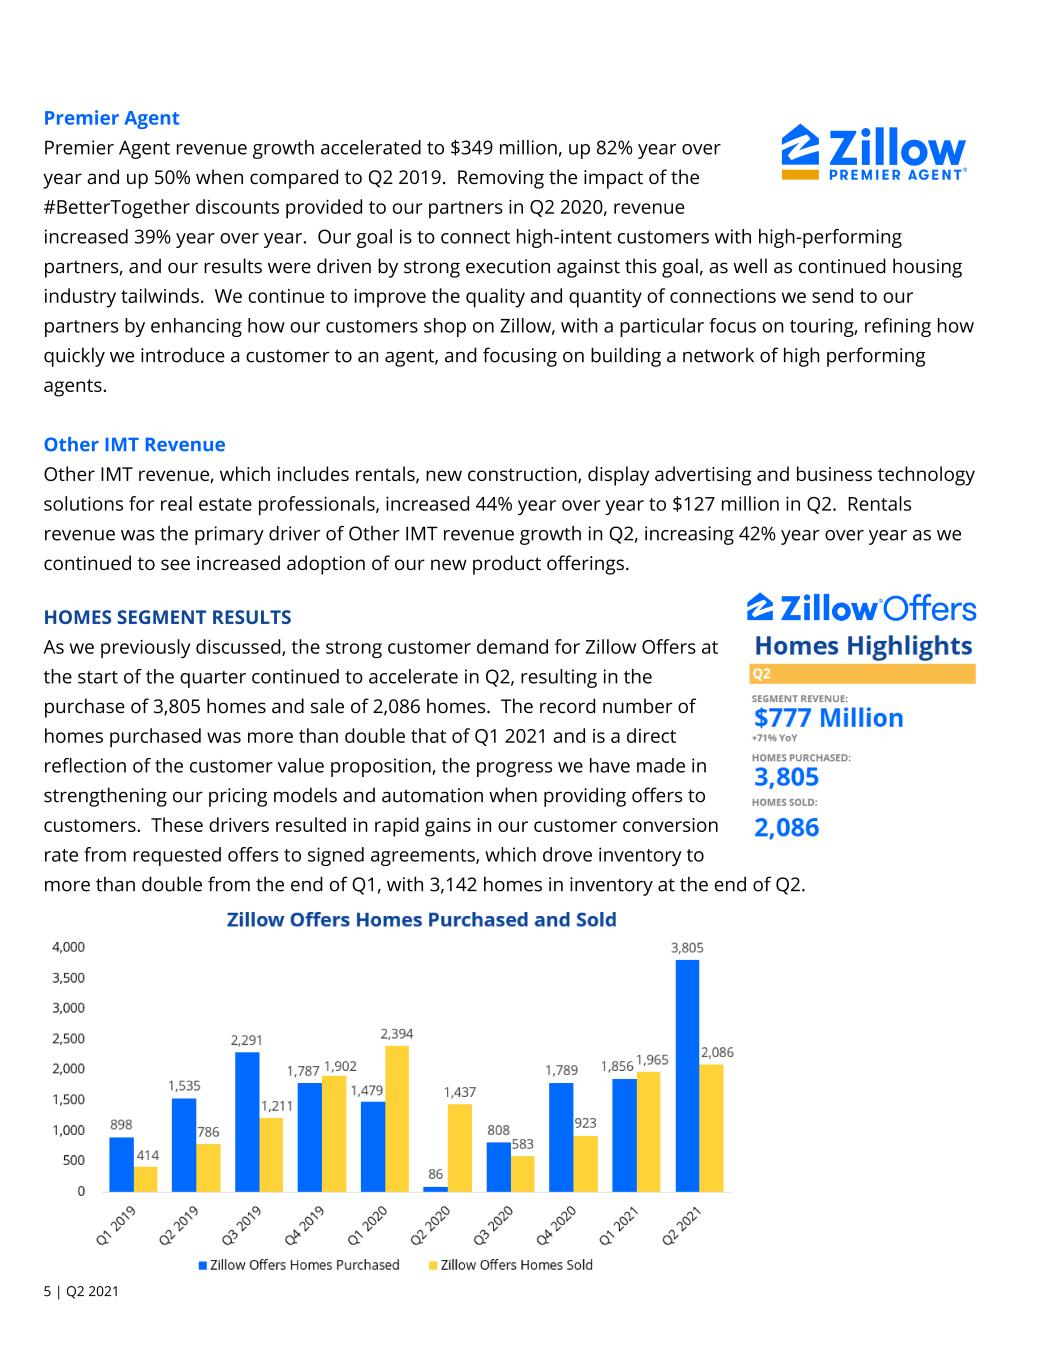
Consolidated net income was $10 million for the second quarter. Segment income (loss) before income taxes was $134 million, $(59) million and $(18) million for the IMT, Homes and Mortgages segments, respectively, for the second quarter.
Second-quarter Adjusted EBITDA of $183 million and Adjusted EBITDA for the IMT and Homes segments exceeded the high end of the company’s second-quarter outlook. Adjusted EBITDA by segment was $218 million, $(29) million and $(6) million for the IMT, Homes and Mortgages segments, respectively, for the second quarter.
Traffic to Zillow Group’s mobile apps and websites in the second quarter reached 229 million average monthly unique users, an increase of 5% year over year, driving 2.8 billion visits during the quarter, up 10% year over year.
The company ended the second quarter of 2021 with cash and investments of $4.6 billion.


Second Quarter 2021 Financial Highlights

The following table sets forth Zillow Group’s financial highlights for the periods presented (in thousands, unaudited):

 Three Months Ended
June 30,
2020 to 2021
% Change
Six Months Ended
June 30,
2020 to 2021
% Change
 2021202020212020
Revenue:
Homes segment:
Zillow Offers$772,030$453,81670%$1,473,004$1,222,92820%
Other (1)5,1154361,073%8,2931,197593%
Total Homes segment revenue777,145454,25271%1,481,2971,224,12521%
IMT segment:
Premier Agent348,754191,96282%683,072434,06857%
Other (2)127,33688,37744%239,346176,93735%
Total IMT segment revenue476,090280,33970%922,418611,00551%
Mortgages segment56,74533,76168%124,70559,043111%
Total revenue$1,309,980$768,35270%$2,528,420$1,894,17333%
Other Financial Data:
Gross profit$538,395$280,869$1,045,515$614,292
Income (loss) before income taxes:
Homes segment$(59,346)$(80,058)$(117,820)$(178,016)
IMT segment133,57319,166277,148(22,341)
Mortgages segment(17,685)(240)(19,505)(13,385)
Corporate items (3)(33,591)(22,637)(67,798)(42,528)
Total income (loss) before income taxes
$22,951$(83,769)$72,025$(256,270)
Net income (loss)
$9,641$(84,448)$61,605$(247,721)
Adjusted EBITDA (4):
Homes segment$(29,092)$(60,908)$(63,040)$(135,903)
IMT segment217,76371,862426,346157,579
Mortgages segment(5,897)4,885450(718)
Total Adjusted EBITDA$182,774$15,839$363,756$20,958
Percentage of Revenue:
Gross profit41%37%41%32%
Income (loss) before income taxes:
Homes segment(8)%(18)%(8)%(15)%
IMT segment28%7%30%(4)%
Mortgages segment(31)%(1)%(16)%(23)%
Corporate items (3)N/AN/AN/AN/A
Total income (loss) before income taxes
2%(11)%3%(14)%
Net income (loss)
1%(11)%2%(13)%
Adjusted EBITDA:
Homes segment(4)%(13)%(4)%(11)%
IMT segment46%26%46%26%
Mortgages segment(10)%14%—%(1)%
Total Adjusted EBITDA14%2%14%1%
(1) Other Homes segment revenue relates to revenue associated with the title and escrow services provided through Zillow Closing Services.
(2) Other IMT segment revenue includes revenue generated by rentals, new construction and display advertising, as well as revenue from the sale of various other advertising and business technology solutions for real estate professionals, including dotloop.
(3) Certain corporate items are not directly attributable to any of our segments, including the gain (loss) on extinguishment of debt, interest income earned on our short-term investments included in other income and interest costs on our convertible senior notes included in interest expense.
(4) Adjusted EBITDA is a non-GAAP financial measure; it is not calculated or presented in accordance with U.S. generally accepted accounting principles, or GAAP. See below for more information regarding our presentation of Adjusted EBITDA, including a reconciliation of Adjusted EBITDA to the most directly comparable GAAP financial measure, which is net income (loss) on a consolidated basis and income (loss) before income taxes for each segment, for each of the periods presented.


Conference Call and Webcast Information
Zillow Group co-founder and CEO Rich Barton and CFO Allen Parker will host a live conference call to discuss the results today at 2 p.m. Pacific Standard Time (5 p.m. Eastern Standard Time). A shareholder letter and link to both the live webcast and recorded replay of the call may be accessed in the Quarterly Results section of Zillow Group’s Investor Relations website. Participants must register for the live call in advance at https://dpregister.com/sreg/10157707/e9c2f07193 to receive emailed instructions. This preregistration process is designed to reduce delays due to operator congestion when accessing the live call.
Forward-Looking Statements

This press release contains forward-looking statements within the meaning of Section 27A of the Securities Act of 1933 and Section 21E of the Securities Exchange Act of 1934 that involve risks and uncertainties, including, without limitation, statements regarding the future performance and operation of our business and the current and future health and stability of the residential housing market and economy and our expectations regarding future shifts in behavior by consumers and employees. Statements containing words such as “may,” “believe,” “anticipate,” “expect,” “intend,” “plan,” “project,” “predict,” “will,” “projections,” “continue,” “estimate,” “outlook,” “guidance,” “would,” “could,” or similar expressions constitute forward-looking statements. Forward-looking statements are made based on assumptions as of August 5, 2021, and although we believe the expectations reflected in the forward-looking statements are reasonable, we cannot guarantee these results. Differences in Zillow Group’s actual results from those described in these forward-looking statements may result from actions taken by Zillow Group as well as from risks and uncertainties beyond Zillow Group’s control.

Factors that may contribute to such differences include, but are not limited to, the impact of the COVID-19 pandemic (including variants) or other public health crises and any associated economic downturn on Zillow Group’s future financial position, operations and financial performance; the magnitude, duration and severity of the COVID-19 pandemic and the availability and widespread distribution and use of effective vaccines; the impact of actions taken by governments, businesses and individuals in response to the COVID-19 pandemic, including changes in laws or regulations that limit our ability to operate; the current and future health and stability of the economy, financial conditions and residential housing market, including any extended slowdown in the real estate markets as a result of the COVID-19 pandemic; changes in laws or regulations applicable to our business, employees, products or services, including current and future laws, regulations and orders that limit Zillow Group’s ability to operate in light of the COVID-19 pandemic; the satisfaction of conditions precedent to the closing of Zillow Group’s proposed acquisition of ShowingTime.com, Inc., including expiration or termination of any applicable waiting period under the Hart-Scott-Rodino Act or Zillow Group’s timing agreement with ShowingTime.com, Inc. and the U.S. Federal Trade Commission; changes in general economic and financial conditions that reduce demand for our products and services, lower our profitability or reduce Zillow Group’s access to credit; actual or anticipated fluctuations in our financial condition and results of operations; changes in projected operational and financial results; addition or loss of significant customers; actual or anticipated changes in Zillow Group’s growth rate relative to that of our competitors; acquisitions, strategic partnerships, joint ventures, capital-raising activities or other corporate transactions or commitments by us or our competitors; actual or anticipated changes in technology, products, markets or services by us or our competitors; ability to obtain or maintain licenses and permits to support Zillow Group’s current and future businesses; ability to comply with MLS rules and requirements to access and use listing data, and to maintain or establish relationships with listings and data providers; ability to operate Zillow Group’s mortgage originations business, including the ability to obtain sufficient financing; fluctuations in the valuation of companies perceived by investors to be comparable to Zillow Group; the impact of natural disasters and other catastrophic events; the impact of pending or future litigation; and the issuance of new or updated research or reports by securities analysts.

The foregoing list of risks and uncertainties is illustrative but not exhaustive. For more information about potential factors that could affect Zillow Group’s business and financial results, please review the “Risk Factors” described in Zillow Group’s Annual Report on Form 10-K for the year ended December 31, 2020. Except as may be required by law, Zillow Group does not intend and undertakes no duty to update this information to reflect future events or circumstances.
Use of Non-GAAP Financial Measures
To provide investors with additional information regarding our financial results, this press release includes references to Adjusted EBITDA in total and for each segment, each a non-GAAP financial measure. We have provided a reconciliation below of Adjusted EBITDA in total to net income (loss) and Adjusted EBITDA by segment to income (loss) before income taxes for each segment, the most directly comparable GAAP financial measures.


Adjusted EBITDA is a key metric used by our management and board of directors to measure operating performance and trends and to prepare and approve our annual budget. In particular, the exclusion of certain expenses in calculating Adjusted EBITDA facilitates operating performance comparisons on a period-to-period basis.
Our use of Adjusted EBITDA in total and for each segment has limitations as an analytical tool, and you should not consider these measures in isolation or as a substitute for analysis of our results as reported under GAAP. Some of these limitations are:
Adjusted EBITDA does not reflect our cash expenditures or future requirements for capital expenditures or contractual commitments;
Adjusted EBITDA does not reflect changes in, or cash requirements for, our working capital needs;
Adjusted EBITDA does not consider the potentially dilutive impact of share-based compensation;
Although depreciation and amortization are non-cash charges, the assets being depreciated and amortized may have to be replaced in the future, and Adjusted EBITDA does not reflect cash capital expenditure requirements for such replacements or for new capital expenditure requirements;
Adjusted EBITDA does not reflect impairment costs;
Adjusted EBITDA does not reflect acquisition-related costs;
Adjusted EBITDA does not reflect the gain (loss) on extinguishment of debt;
Adjusted EBITDA does not reflect interest expense or other income;
Adjusted EBITDA does not reflect income taxes; and
Other companies, including companies in our own industry, may calculate Adjusted EBITDA differently than we do, limiting its usefulness as a comparative measure.
Because of these limitations, you should consider Adjusted EBITDA in total and for each segment alongside other financial performance measures, including various cash flow metrics, net income (loss), income (loss) before income taxes for each segment, and our other GAAP results.
About Zillow Group, Inc.
Zillow Group, Inc. (NASDAQ: Z and ZG) is reimagining real estate to make it easier to unlock life’s next chapter.
As the most visited real estate website in the United States, Zillow® and its affiliates offer customers an on-demand experience for selling, buying, renting or financing with transparency and nearly seamless end-to-end service. Zillow Offers® buys and sells homes directly in dozens of markets across the country, allowing sellers control over their timeline. Zillow Home Loans™, our affiliate lender, provides our customers with an easy option to get pre-approved and secure financing for their next home purchase. Zillow recently launched Zillow Homes, Inc., a licensed brokerage entity, to streamline Zillow Offers transactions.
Zillow Group’s brands, affiliates and subsidiaries include Zillow®; Zillow Offers®; Zillow Premier Agent®; Zillow Home Loans™; Zillow Closing Services™; Zillow Homes, Inc.; Trulia®; Out East®; StreetEasy® and HotPads®. Zillow Home Loans, LLC is an Equal Housing Lender, NMLS #10287 (www.nmlsconsumeraccess.org).
Please visit http://investors.zillowgroup.com, www.zillowgroup.com/ir-blog, and www.twitter.com/zillowgroup, where Zillow Group discloses information about the company, its financial information, and its business that may be deemed material.
The Zillow Group logo is available at http://zillowgroup.mediaroom.com/logos-photos.
(ZFIN)


Adjusted EBITDA

The following tables present a reconciliation of Adjusted EBITDA to the most directly comparable GAAP financial measure, which is net income (loss) on a consolidated basis and income (loss) before income taxes for each segment, for each of the periods presented (in thousands, unaudited):

Three Months Ended
June 30, 2021
HomesIMTMortgagesCorporate Items (2)Consolidated
Reconciliation of Adjusted EBITDA to Net Income and Income (Loss) Before Income Taxes:
Net income (1)N/AN/AN/AN/A$9,641 
Income taxesN/AN/AN/AN/A13,310 
Income (loss) before income taxes$(59,346)$133,573 $(17,685)$(33,591)$22,951 
Other income— — (1,006)(581)(1,587)
Depreciation and amortization4,733 22,157 2,093 — 28,983 
Share-based compensation20,495 58,362 9,538 — 88,395 
Acquisition-related costs— 3,671 — — 3,671 
Loss on extinguishment of debt— — — 931 931 
Interest expense5,026 — 1,163 33,241 39,430 
Adjusted EBITDA$(29,092)$217,763 $(5,897)$— $182,774 

Three Months Ended
June 30, 2020
HomesIMTMortgagesCorporate Items (2)Consolidated
Reconciliation of Adjusted EBITDA to Net Loss and Income (Loss) Before Income Taxes:
Net loss (1)N/AN/AN/AN/A$(84,448)
Income taxesN/AN/AN/AN/A679 
Income (loss) before income taxes$(80,058)$19,166 $(240)$(22,637)$(83,769)
Other income— (5,300)(385)(4,430)(10,115)
Depreciation and amortization2,597 22,038 1,538 — 26,173 
Share-based compensation12,728 35,958 3,665 — 52,351 
Gain on extinguishment of debt— — — (6,391)(6,391)
Interest expense3,825 — 307 33,458 37,590 
Adjusted EBITDA$(60,908)$71,862 $4,885 $— $15,839 


Six Months Ended
June 30, 2021
HomesIMTMortgagesCorporate Items (2)Consolidated
Reconciliation of Adjusted EBITDA to Net Income and Income (Loss) Before Income Taxes:
Net income (1)N/AN/AN/AN/A$61,605 
Income taxesN/AN/AN/AN/A10,420 
Income (loss) before income taxes$(117,820)$277,148 $(19,505)$(67,798)$72,025 
Other income— — (2,738)(1,288)(4,026)
Depreciation and amortization9,026 44,956 3,900 — 57,882 
Share-based compensation36,416 99,754 15,898 — 152,068 
Acquisition-related costs— 4,488 — — 4,488 
Loss on extinguishment of debt— — — 2,334 2,334 
Interest expense9,338 — 2,895 66,752 78,985 
Adjusted EBITDA$(63,040)$426,346 $450 $— $363,756 

Six Months Ended
June 30, 2020
HomesIMTMortgagesCorporate Items (2)Consolidated
Reconciliation of Adjusted EBITDA to Net Loss and Loss Before Income Taxes:
Net loss (1)N/AN/AN/AN/A$(247,721)
Income taxesN/AN/AN/AN/A(8,549)
Loss before income taxes$(178,016)$(22,341)$(13,385)$(42,528)$(256,270)
Other income— (5,300)(587)(13,821)(19,708)
Depreciation and amortization6,172 45,815 3,212 — 55,199 
Share-based compensation24,032 65,505 6,609 — 96,146 
Gain on extinguishment of debt— — — (6,391)(6,391)
Impairment costs— 73,900 2,900 — 76,800 
Interest expense11,909 — 533 62,740 75,182 
Adjusted EBITDA$(135,903)$157,579 $(718)$— $20,958 
(1) We use income (loss) before income taxes as our profitability measure in making operating decisions and assessing the performance of our segments, therefore, net income (loss) and income tax benefit (expense) are calculated and presented only on a consolidated basis within our financial statements.
(2) Certain corporate items are not directly attributable to any of our segments, including the gain (loss) on extinguishment of debt, interest income earned on our short-term investments included in other income and interest costs on our convertible senior notes included in interest expense.


Exhibit 99.2


Reported Consolidated Results

ZILLOW GROUP, INC.
UNAUDITED CONDENSED CONSOLIDATED BALANCE SHEETS
(in thousands)
June 30, 2021December 31, 2020
Assets
Current assets:
Cash and cash equivalents$3,713,156 $1,703,130 
Short-term investments880,875 2,218,108 
Accounts receivable, net
101,927 69,940 
Mortgage loans held for sale171,450 330,758 
Inventory1,169,601 491,293 
Prepaid expenses and other current assets107,687 75,846 
Restricted cash141,024 75,805 
Total current assets6,285,720 4,964,880 
Contract cost assets47,938 50,719 
Property and equipment, net189,950 196,152 
Right of use assets175,058 187,960 
Goodwill1,984,907 1,984,907 
Intangible assets, net81,362 94,767 
Other assets10,486 7,175 
Total assets$8,775,421 $7,486,560 
Liabilities and shareholders’ equity
Current liabilities:
Accounts payable$15,640 $18,974 
Accrued expenses and other current liabilities175,876 94,487 
Accrued compensation and benefits55,564 47,666 
Borrowings under credit facilities987,832 670,209 
Deferred revenue53,547 48,995 
Lease liabilities, current portion27,963 28,310 
Convertible senior notes, current portion330,095 — 
Total current liabilities1,646,517 908,641 
Lease liabilities, net of current portion193,891 207,723 
Convertible senior notes, net of current portion1,276,487 1,613,523 
Other long-term liabilities14,411 14,857 
Total liabilities3,131,306 2,744,744 
Shareholders’ equity:
Class A common stock
Class B common stock
Class C capital stock
18 17 
Additional paid-in capital6,721,435 5,880,883 
Accumulated other comprehensive income305 164 
Accumulated deficit(1,077,650)(1,139,255)
Total shareholders’ equity5,644,115 4,741,816 
Total liabilities and shareholders’ equity$8,775,421 $7,486,560 


ZILLOW GROUP, INC.
UNAUDITED CONDENSED CONSOLIDATED STATEMENTS OF OPERATIONS
(in thousands, except per share data)
 Three Months Ended
June 30,
Six Months Ended
June 30,
 2021202020212020
Revenue:
Homes$777,145 $454,252 $1,481,297 $1,224,125 
IMT476,090 280,339 922,418 611,005 
Mortgages56,745 33,761 124,705 59,043 
Total revenue1,309,980 768,352 2,528,420 1,894,173 
Cost of revenue (1):
Homes 707,522 434,900 1,352,125 1,170,659 
IMT43,444 45,354 90,481 95,407 
Mortgages20,619 7,229 40,299 13,815 
Total cost of revenue771,585 487,483 1,482,905 1,279,881 
Gross profit538,395 280,869 1,045,515 614,292 
Operating expenses:
Sales and marketing (1)
229,434 160,667 427,389 369,111 
Technology and development (1)
128,463 97,507 248,764 197,988 
General and administrative (1)
115,102 85,380 215,556 177,580 
Impairment costs— — — 76,800 
Acquisition-related costs3,671 — 4,488 — 
Total operating expenses476,670 343,554 896,197 821,479 
Income (loss) from operations61,725 (62,685)149,318 (207,187)
Gain (loss) on extinguishment of debt(931)6,391 (2,334)6,391 
Other income1,587 10,115 4,026 19,708 
Interest expense(39,430)(37,590)(78,985)(75,182)
Income (loss) before income taxes22,951 (83,769)72,025 (256,270)
Income tax benefit (expense)(13,310)(679)(10,420)8,549 
Net income (loss)$9,641 $(84,448)$61,605 $(247,721)
Net income (loss) per share:
Basic$0.04 $(0.38)$0.25 $(1.15)
Diluted$0.04 $(0.38)$0.24 $(1.15)
Weighted-average shares outstanding:
Basic248,152 219,467 245,763 215,070 
Diluted261,496 219,467 260,484 215,070 
(1) Includes share-based compensation expense as follows:
Cost of revenue$2,972 $1,364 $5,660 $2,766 
Sales and marketing13,350 9,116 23,237 16,109 
Technology and development34,951 21,421 61,042 40,109 
General and administrative37,122 20,450 62,129 37,162 
Total$88,395 $52,351 $152,068 $96,146 
Other Financial Data:
Income (loss) before income taxes:
Homes segment$(59,346)$(80,058)$(117,820)$(178,016)
IMT segment133,573 19,166 277,148 (22,341)
Mortgages segment(17,685)(240)(19,505)(13,385)
Corporate items (2)(33,591)(22,637)(67,798)(42,528)
Total income (loss) before income taxes$22,951 $(83,769)$72,025 $(256,270)
Adjusted EBITDA: (3):
Homes segment$(29,092)$(60,908)$(63,040)$(135,903)
IMT segment217,763 71,862 426,346 157,579 
Mortgages segment(5,897)4,885 450 (718)
Total Adjusted EBITDA$182,774 $15,839 $363,756 $20,958 
(2) Certain corporate items are not directly attributable to any of our segments, including the gain (loss) on extinguishment of debt, interest income earned on our short-term investments included in other income and interest costs on our convertible senior notes included in interest expense.
(3) Adjusted EBITDA is a non-GAAP financial measure; it is not calculated or presented in accordance with U.S. generally accepted accounting principles, or GAAP. See Exhibit 99.1 for more information regarding our presentation of Adjusted EBITDA and for a reconciliation of Adjusted EBITDA to net income (loss) on a consolidated basis and income (loss) before income taxes for each segment, the most directly comparable GAAP financial measures, for each of the periods presented.


ZILLOW GROUP, INC.
UNAUDITED CONDENSED CONSOLIDATED STATEMENTS OF CASH FLOWS
(in thousands)
 Six Months Ended
June 30,
 20212020
Operating activities
Net income (loss)$61,605 $(247,721)
Adjustments to reconcile net income (loss) to net cash provided by (used in) operating activities:
Depreciation and amortization57,882 55,199 
Share-based compensation152,068 96,146 
Amortization of right of use assets12,902 12,731 
Amortization of contract cost assets20,188 17,070 
Amortization of debt discount and debt issuance costs50,372 47,746 
Loss (gain) on extinguishment of debt2,334 (6,391)
Impairment costs— 76,800 
Deferred income taxes— (8,549)
Other adjustments to reconcile net income (loss) to cash provided by (used in) operating activities 8,271 (975)
Changes in operating assets and liabilities:
Accounts receivable(32,811)(1,487)
Mortgage loans held for sale159,308 (38,514)
Inventory(677,746)701,145 
Prepaid expenses and other assets(35,788)(771)
Contract cost assets(17,407)(19,608)
Lease liabilities(14,179)(495)
Accounts payable2,676 7,504 
Accrued expenses and other current liabilities80,819 (8,741)
Accrued compensation and benefits7,898 (3,285)
Deferred revenue4,552 4,767 
Other long-term liabilities(446)10,049 
Net cash provided by (used in) operating activities(157,502)692,620 
Investing activities
Proceeds from maturities of investments1,329,552 701,266 
Proceeds from sales of investments— 116,394 
Purchases of investments— (1,026,233)
Purchases of property and equipment(24,137)(54,653)
Purchases of intangible assets(10,407)(11,408)
Proceeds from sale of equity investment— 10,000 
Net cash provided by (used in) investing activities1,295,008 (264,634)
Financing activities
Proceeds from issuance of convertible senior notes, net of issuance costs— 553,282 
Proceeds from issuance of Class C capital stock, net of issuance costs544,557 411,522 
Proceeds from borrowings on credit facilities610,118 43,200 
Repayments of borrowings on credit facilities(146,839)(617,506)
Net borrowings (repayments) on warehouse line of credit and repurchase agreements(145,656)39,387 
Repurchase of convertible senior notes— (194,670)
Proceeds from exercise of stock options75,685 184,984 
Value of equity awards withheld for tax liability(126)— 
Net cash provided by financing activities937,739 420,199 
Net increase in cash, cash equivalents and restricted cash during period2,075,245 848,185 
Cash, cash equivalents and restricted cash at beginning of period1,778,935 1,230,909 
Cash, cash equivalents and restricted cash at end of period$3,854,180 $2,079,094 
Supplemental disclosures of cash flow information
Cash paid for interest$27,773 $29,201 
Noncash transactions:
Capitalized share-based compensation$8,665 $8,490 
Write-off of fully depreciated property and equipment$24,345 $6,942 
Write-off of fully amortized intangible assets$3,782 $— 
Property and equipment purchased on account$1,352 $5,305 


Non-GAAP Net Income (Loss) per Share
Our presentation of non-GAAP net income (loss) per share excludes the impact of share-based compensation expense, impairment costs, acquisition-related costs, the gain (loss) on extinguishment of debt and income taxes. This measure is not a key metric used by our management and board of directors to measure operating performance or otherwise manage the business. However, we provide non-GAAP net income (loss) per share as supplemental information to investors, as we believe the exclusion of share-based compensation expense, impairment costs, acquisition-related costs, the gain (loss) on extinguishment of debt and income taxes facilitates investors’ operating performance comparisons on a period-to-period basis. You should not consider non-GAAP net income (loss) per share in isolation or as a substitute for analysis of our results as reported under GAAP.

The following table sets forth a reconciliation of non-GAAP net income (loss), adjusted, to net income (loss), as reported on a GAAP basis, and the calculation of non-GAAP net income (loss) per share - basic and diluted, for each of the periods presented (in thousands, except per share data, unaudited):
Three Months Ended
June 30,
Six Months Ended
June 30,
 2021202020212020
Net income (loss), as reported
$9,641 $(84,448)$61,605 $(247,721)
Share-based compensation88,395 52,351 152,068 96,146 
Impairment costs— — — 76,800 
Acquisition-related costs3,671 — 4,488 — 
Loss (gain) on extinguishment of debt931 (6,391)2,334 (6,391)
Income taxes13,310 679 10,420 (8,549)
Net income (loss), adjusted$115,948 $(37,809)$230,915 $(89,715)
Non-GAAP net income (loss) per share:
Basic$0.47 $(0.17)$0.94 $(0.42)
Diluted$0.44 $(0.17)$0.89 $(0.42)
Weighted-average shares outstanding:
Basic248,152 219,467 245,763 215,070 
Diluted261,496 219,467 260,484 215,070 
Diluted non-GAAP net income (loss) per share for the periods presented is calculated using diluted weighted-average shares outstanding, which includes potential shares of Class A common stock and Class C capital stock for the periods in which their effect would have been dilutive. The potential shares of Class A common stock and Class C capital stock were excluded from the calculation of non-GAAP net income (loss) per share for certain periods presented if their effect would have been antidilutive. The following table reconciles the denominators used in the basic and diluted non-GAAP net income (loss) per share calculations (in thousands, unaudited):
Three Months Ended
June 30,
Six Months Ended
June 30,
 2021202020212020
Denominator for basic calculation248,152 219,467 245,763 215,070 
Effect of dilutive securities:
     Option awards10,472 — 11,450 — 
     Unvested restricted stock units2,872 — 3,271 — 
          Denominator for dilutive calculation261,496 219,467 260,484 215,070 


Segment Results of Operations
The following tables present our segment results for the periods presented (in thousands, unaudited):
 Three Months Ended
June 30, 2021
Three Months Ended
June 30, 2020
HomesIMTMortgagesHomesIMTMortgages
Revenue$777,145 $476,090 $56,745 $454,252 $280,339 $33,761 
Cost of revenue 707,522 43,444 20,619 434,900 45,354 7,229 
Gross profit69,623 432,646 36,126 19,352 234,985 26,532 
Operating expenses:
Sales and marketing65,791 136,620 27,023 47,539 101,458 11,670 
Technology and development30,328 89,838 8,297 26,155 65,890 5,462 
General and administrative27,824 68,944 18,334 21,891 53,771 9,718 
Acquisition-related costs— 3,671 — — — — 
Total operating expenses123,943 299,073 53,654 95,585 221,119 26,850 
Income (loss) from operations(54,320)133,573 (17,528)(76,233)13,866 (318)
Segment other income— — 1,006 — 5,300 385 
Segment interest expense (5,026)— (1,163)(3,825)— (307)
Income (loss) before income taxes (1)
$(59,346)$133,573 $(17,685)$(80,058)$19,166 $(240)
 Six Months Ended
June 30, 2021
Six Months Ended
June 30, 2020
HomesIMTMortgagesHomesIMTMortgages
Revenue$1,481,297 $922,418 $124,705 $1,224,125 $611,005 $59,043 
Cost of revenue 1,352,125 90,481 40,299 1,170,659 95,407 13,815 
Gross profit129,172 831,937 84,406 53,466 515,598 45,228 
Operating expenses:
Sales and marketing120,810 254,227 52,352 119,457 225,019 24,635 
Technology and development63,497 168,482 16,785 54,815 131,865 11,308 
General and administrative53,347 127,592 34,617 45,301 112,455 19,824 
Impairment costs— — — — 73,900 2,900 
Acquisition-related costs— 4,488 — — — — 
Total operating expenses237,654 554,789 103,754 219,573 543,239 58,667 
Income (loss) from operations(108,482)277,148 (19,348)(166,107)(27,641)(13,439)
Segment other income— — 2,738 — 5,300 587 
Segment interest expense (9,338)— (2,895)(11,909)— (533)
Income (loss) before income taxes (1)
$(117,820)$277,148 $(19,505)$(178,016)$(22,341)$(13,385)
(1) The following table presents the reconciliation of total segment income (loss) before income taxes to consolidated income (loss) before income taxes for the periods presented (in thousands):


Three Months Ended
June 30,
Six Months Ended
June 30,
2021202020212020
Total segment income (loss) before income taxes$56,542 $(61,132)$139,823 $(213,742)
Corporate interest expense(33,241)(33,458)(66,752)(62,740)
Corporate other income581 4,430 1,288 13,821 
Gain (loss) on extinguishment of debt(931)6,391 (2,334)6,391 
Consolidated income (loss) before income taxes$22,951 $(83,769)$72,025 $(256,270)
Certain corporate items are not directly attributable to any of our segments, including the gain (loss) on extinguishment of debt, interest income earned on our short-term investments included in other income and interest costs on our convertible senior notes included in interest expense.

Key Metrics
The following table presents our visits and average monthly unique users for each of the periods presented (in millions):
 Three Months Ended
June 30,
2020 to 2021
% Change
 20212020
Visits (1)2,750.2 2,491.1 10 %
Average monthly unique users (2)228.8 218.1 %
(1)Visits includes visits to the Zillow, Trulia and StreetEasy mobile apps and websites. We measure Zillow and StreetEasy visits with Google Analytics and Trulia visits with Adobe Analytics.
(2)Zillow, StreetEasy and HotPads measure unique users with Google Analytics, and Trulia measures unique users with Adobe Analytics.

The following table presents the number of homes sold through Zillow Offers for the periods presented:
Three Months Ended
June 30,
2020 to 2021
% Change
20212020
Number of homes sold2,0861,43745 %

The following table presents loan origination volume by purpose and in total for Zillow Home Loans for the periods presented (in thousands):
Three Months Ended
June 30,
2020 to 2021
% Change
20212020
Purchase loan origination volume$230,012 $120,831 90 %
Refinance loan origination volume657,928 147,475 346 %
Total loan origination volume$887,940 $268,306 231 %


Non-GAAP Average Return on Homes Sold After Interest Expense

To provide investors with additional information regarding our Zillow Offers financial results, this Exhibit includes a calculation of Average Return on Homes Sold After Interest Expense, which is a non-GAAP financial measure. We have provided a reconciliation of Average Return on Homes Sold After Interest Expense to the most directly comparable GAAP financial measure, which is average gross profit per home for the Zillow Offers business.
We believe that Average Return on Homes Sold After Interest Expense is a useful financial measure to investors as it is one of the primary measures used by management in making investment decisions, measuring unit level economics and evaluating operating performance for the Zillow Offers business. The measure is intended to convey the unit level economics of homes sold during the period by presenting the average revenue and associated expenses directly attributed to the homes sold. We believe this average per unit measure facilitates meaningful period over period comparisons notwithstanding variability in the number of homes sold during a period and indicates ability to generate average returns on assets sold after considering home purchase costs, renovation costs, holding costs and selling costs.

We calculate the Average Return on Homes Sold After Interest Expense as revenue associated with homes sold during the period less direct costs attributable to those homes divided by the number of homes sold during the period. Specifically, direct costs include, with respect to each home sold during the period (1) home acquisition and renovation costs, which in turn include certain labor costs directly associated with these activities; (2) holding and selling costs; and (3) interest costs incurred.

Included in direct holding and interest expense amounts for the periods presented are holding and interest costs recorded as period expenses in prior periods associated with homes sold in the presented period, which are not calculated in accordance with, or as an alternative for, GAAP and should not be considered in isolation or as a substitute for results reported under GAAP. Excluded from certain of these direct cost amounts are costs recorded in the presented period related to homes that remain in inventory at the end of the period, as shown in the tables below. We make these period adjustments because we believe presenting Average Return on Homes Sold After Interest Expense in this manner provides a focused view on a subset of our assets - homes sold during the period - and reflecting costs associated with those homes sold from the time we acquire to the time we sell the home, which may be useful to investors.

Average Return on Homes Sold After Interest Expense is intended to illustrate the performance of homes sold during the period and is not intended to be a segment or company performance metric. Average Return on Homes Sold After Interest Expense is a supplemental measure of operating performance for a subset of assets and has limitations as an analytical tool, and you should not consider it in isolation or as a substitute for analysis of our results as reported under GAAP. Some of these limitations are:

Although depreciation and amortization are non-cash charges, the assets being depreciated and amortized may have to be replaced in the future, and Average Return on Homes Sold After Interest Expense does not reflect capital expenditure requirements for such replacements or for new capital expenditure requirements;
Average Return on Homes Sold After Interest Expense does not consider the potentially dilutive impact of share-based compensation;
Average Return on Homes Sold After Interest Expense does not include period costs that were not eligible for inventory capitalization associated with homes held in inventory at the end of the period;
Average Return on Homes Sold After Interest Expense does not reflect indirect expenses included in cost of revenue, sales and marketing, technology and development, or general and administrative expenses, some of which are recurring cash expenditures necessary to operate the business; and
Average Return on Homes Sold After Interest Expense does not reflect income taxes.


On a GAAP basis, Zillow Offers average gross profit per home was $33,849 and $14,409 for three months ended June 30, 2021 and 2020, respectively.

The following table presents the total return on homes sold after interest expense and the Average Return on Homes Sold After Interest Expense for the periods presented (unaudited):

Three Months Ended
June 30, 2021
Three Months Ended
June 30, 2020
TotalAverage
Per Home
TotalAverage
Per Home
Homes sold2,086 1,437 
Zillow Offers revenue$772,030,000 $370,101 $453,816,000 $315,808 
Operating costs:
Home acquisition costs (1)672,592,000 322,432 409,509,000 284,975 
Renovation costs (1)20,862,000 10,001 22,773,000 15,848 
Holding costs (1)(2)4,527,000 2,170 5,987,000 4,166 
Selling costs29,544,000 14,163 19,570,000 13,619 
Total operating costs727,525,000 348,766 457,839,000 318,608 
Interest expense (1)(2)3,545,000 1,699 5,948,000 4,139 
Return on homes sold after interest expense$40,960,000 $19,636 $(9,971,000)$(6,939)
(1) Amount excludes expenses incurred during the period that are not related to homes sold during the period.
(2) Holding costs and interest expense include $1.7 million and $1.3 million, respectively, of costs incurred in prior periods associated with homes sold in the second quarter of 2021 and $3.9 million and $3.8 million, respectively, of costs incurred in prior periods associated with homes sold in the second quarter of 2020.
The calculation of Average Return on Homes Sold After Interest Expense includes only those expenses directly attributed to the homes sold during the period. To arrive at return on homes sold after interest expense, the Company deducts from Zillow Offers gross profit (1) holding costs incurred in the presented period and prior periods for homes sold during the presented period that are included in sales and marketing expense, (2) selling costs incurred in the presented period for homes sold during the presented period that are included in sales and marketing expense and (3) interest expense incurred in the presented period and prior periods for homes sold during the presented period. The Company adds to Zillow Offers gross profit (1) inventory valuation adjustments recorded during the presented period associated with homes that remain in inventory at period end, net of inventory valuation adjustments recorded in prior periods related to homes sold in the presented period, and indirect expenses included in cost of revenue and (2) share-based compensation expense and depreciation and amortization expense included in cost of revenue. The following table presents the calculation of Zillow Offers average gross profit per home and Average Return on Homes Sold After Interest Expense and a reconciliation of return on homes sold after interest expense to Zillow Offers gross profit for the periods presented (unaudited):


Three Months Ended
June 30,
Calculation of Average Gross Profit per Home20212020
Zillow Offers revenue$772,030,000 $453,816,000 
Zillow Offers cost of revenue701,420,000 433,110,000 
Zillow Offers gross profit$70,610,000 $20,706,000 
Homes sold2,086 1,437 
Average Zillow Offers gross profit per home$33,849 $14,409 
Reconciliation of Non-GAAP Measure to Nearest GAAP Measure
Zillow Offers gross profit$70,610,000 $20,706,000 
Holding costs included in sales and marketing (1)(3,841,000)(5,987,000)
Selling costs included in sales and marketing (2)(29,544,000)(19,570,000)
Interest expense (3)(3,545,000)(5,948,000)
Direct and indirect expenses included in cost of revenue (4)3,953,000 (890,000)
Share-based compensation and depreciation and amortization included in cost of revenue 3,327,000 1,718,000 
Return on homes sold after interest expense$40,960,000 $(9,971,000)
Homes sold2,086 1,437 
Average return on homes sold after interest expense$19,636 $(6,939)
(1) Amount represents holding costs incurred related to homes sold in the presented period that were not eligible for inventory capitalization and were therefore expensed as period costs in the presented period and prior periods. These costs primarily include homeowners association dues, property taxes, insurance, utilities, and cleaning and maintenance costs incurred during the time a home is held for sale after the renovation period is complete. On a GAAP basis, the Company incurred a total of $5.3 million and $2.6 million of holding costs included in sales and marketing expense for the three months ended June 30, 2021 and 2020, respectively.
(2) Amount represents selling costs incurred related to homes sold in the presented period that were not eligible for inventory capitalization and were therefore expensed as period costs in the presented period. These costs primarily include agent commissions paid upon the sale of a home.
(3) Amount represents interest expense incurred related to homes sold in the presented period that was not eligible for inventory capitalization and was therefore expensed as a period cost in the presented period and prior periods.
(4) Amount includes inventory valuation adjustments recorded during the period associated with homes that remain in inventory at period end, net of inventory valuation adjustments recorded in prior periods related to homes sold in the presented period, holding costs incurred in the renovation period that are eligible for inventory capitalization and are expensed in the period presented when the associated home is sold, as well as corporate costs allocated to Zillow Offers such as headcount expenses and hosting-related costs related to the operation of our website.


On a GAAP basis, Zillow Offers average gross profit per home was $32,296 and $14,579 for six months ended June 30, 2021 and 2020, respectively.

The following table presents the total return on homes sold after interest expense and the Average Return on Homes Sold After Interest Expense for the periods presented (unaudited):

Six Months Ended
June 30, 2021
Six Months Ended
June 30, 2020
TotalAverage
Per Home
TotalAverage
Per Home
Homes sold4,051 3,831 
Zillow Offers revenue$1,473,004,000 $363,615 $1,222,928,000 $319,219 
Operating costs:
Home acquisition costs (1)1,282,786,000 316,659 1,099,163,000 286,913 
Renovation costs (1)41,684,000 10,290 59,364,000 15,496 
Holding costs (1)(2)9,079,000 2,241 15,605,000 4,073 
Selling costs56,455,000 13,936 52,483,000 13,699 
Total operating costs1,390,004,000 343,126 1,226,615,000 320,181 
Interest expense (1)(2)7,390,000 1,824 17,004,000 4,439 
Return on homes sold after interest expense$75,610,000 $18,665 $(20,691,000)$(5,401)
(1) Amount excludes expenses incurred during the period that are not related to homes sold during the period.
(2) Holding costs and interest expense include $1.2 million and $1.6 million, respectively, of costs incurred in prior periods associated with homes sold in the six months ended June 30, 2021 and $6.4 million and $8.1 million, respectively, of costs incurred in prior periods associated with homes sold in the six months ended June 30, 2020.

The calculation of Average Return on Homes Sold After Interest Expense includes only those expenses directly attributed to the homes sold during the period. To arrive at return on homes sold after interest expense, the Company deducts from Zillow Offers gross profit (1) holding costs incurred in the presented period and prior periods for homes sold during the presented period that are included in sales and marketing expense, (2) selling costs incurred in the presented period for homes sold during the presented period that are included in sales and marketing expense and (3) interest expense incurred in the presented period and prior periods for homes sold during the presented period. The Company adds to Zillow Offers gross profit (1) inventory valuation adjustments recorded during the presented period associated with homes that remain in inventory at period end, net of inventory valuation adjustments recorded in prior periods related to homes sold in the presented period, and indirect expenses included in cost of revenue and (2) share-based compensation expense and depreciation and amortization expense included in cost of revenue. The following table presents the calculation of Zillow Offers average gross profit per home and Average Return on Homes Sold After Interest Expense and a reconciliation of return on homes sold after interest expense to Zillow Offers gross profit for the periods presented (unaudited):


Six Months Ended
June 30,
Calculation of Average Gross Profit per Home20212020
Zillow Offers revenue$1,473,004,000 $1,222,928,000 
Zillow Offers cost of revenue1,342,172,000 1,167,076,000 
Zillow Offers gross profit$130,832,000 $55,852,000 
Homes sold4,051 3,831 
Average Zillow Offers gross profit per home$32,296 $14,579 
Reconciliation of Non-GAAP Measure to Nearest GAAP Measure
Zillow Offers gross profit$130,832,000 $55,852,000 
Holding costs included in sales and marketing (1)(7,718,000)(15,605,000)
Selling costs included in sales and marketing (2)(56,455,000)(52,483,000)
Interest expense (3)(7,390,000)(17,004,000)
Direct and indirect expenses included in cost of revenue (4)10,370,000 4,544,000 
Share-based compensation and depreciation and amortization included in cost of revenue 5,971,000 4,005,000 
Return on homes sold after interest expense$75,610,000 $(20,691,000)
Homes sold4,051 3,831 
Average return on homes sold after interest expense$18,665 $(5,401)
(1) Amount represents holding costs incurred related to homes sold in the presented period that were not eligible for inventory capitalization and were therefore expensed as period costs in the presented period and prior periods. These costs primarily include homeowners association dues, property taxes, insurance, utilities, and cleaning and maintenance costs incurred during the time a home is held for sale after the renovation period is complete. On a GAAP basis, the Company incurred a total of $9.2 million and $7.9 million of holding costs included in sales and marketing expense for the six months ended June 30, 2021 and 2020, respectively.
(2) Amount represents selling costs incurred related to homes sold in the presented period that were not eligible for inventory capitalization and were therefore expensed as period costs in the presented period. These costs primarily include agent commissions paid upon the sale of a home.
(3) Amount represents interest expense incurred related to homes sold in the presented period that was not eligible for inventory capitalization and was therefore expensed as a period cost in the presented period and prior periods.
(4) Amount includes inventory valuation adjustments recorded during the period associated with homes that remain in inventory at period end, net of inventory valuation adjustments recorded in prior periods related to homes sold in the presented period, holding costs incurred in the renovation period that are eligible for inventory capitalization and are expensed in the period presented when the associated home is sold, as well as corporate costs allocated to Zillow Offers such as headcount expenses and hosting-related costs related to the operation of our website.

Zillow Offers Supplemental Information

The weighted average days held for homes in inventory as of June 30, 2021 was 29 days. The weighted average days held for homes sold during the three and six month periods ended June 30, 2021 was 66 days and 70 days, respectively.

The following table presents information on the geographic concentration of homes by state for each state where the value of homes in inventory exceeds 10% of our total inventory as of the date presented (in thousands, except number of homes and percentage of inventory, unaudited):

June 30, 2021
GeographyNumber of HomesInventory Balance% of Total Inventory
California447 $270,366 23 %
Texas588 180,933 15 
Florida606 179,439 15 
Georgia390 118,617 10 
All other states1,111 420,246 37 
Total3,142 $1,169,601 100 %


Selected Historical Data

Beginning with the three and six month periods ended June 30, 2021, we present a gross profit subtotal in our condensed consolidated statements of operations, which requires certain depreciation expense and amortization expense to be included within cost of revenue. To effect the presentation of gross profit, certain reclassifications have been made in the condensed consolidated statements of operations to conform data for prior periods to the current format.

The following tables set forth selected recast statements of operations information for the periods presented (in thousands, unaudited):

 Three Months Ended
March 31, 2021
HomesIMTMortgagesConsolidated
Revenue$704,152 $446,328 $67,960 $1,218,440 
Cost of revenue 644,603 47,037 19,680 711,320 
Gross profit59,549 399,291 48,280 507,120 
Operating expenses:
Sales and marketing55,019 117,607 25,329 197,955 
Technology and development33,169 78,644 8,488 120,301 
General and administrative25,523 58,648 16,283 100,454 
Acquisition-related costs— 817 — 817 
Total operating expenses$113,711 $255,716 $50,100 $419,527 

 Three Months Ended
 December 31, 2020September 30, 2020June 30, 2020March 31, 2020
HomesIMTMortgagesConsolidatedHomesIMTMortgagesConsolidatedHomesIMTMortgagesConsolidatedHomesIMTMortgagesConsolidated
Revenue$304,145 $423,838 $60,969 $788,952 $187,105 $415,389 $54,198 $656,692 $454,252 $280,339 $33,761 $768,352 $769,873 $330,666 $25,282 $1,125,821 
Cost of revenue 281,040 47,698 14,000 342,738 183,056 49,992 10,725 243,773 434,900 45,354 7,229 487,483 735,759 50,053 6,586 792,398 
Gross profit23,105 376,140 46,969 446,214 4,049 365,397 43,473 412,919 19,352 234,985 26,532 280,869 34,114 280,613 18,696 333,423 
Operating expenses:
Sales and marketing38,647 107,598 19,869 166,114 32,714 107,900 15,280 155,894 47,539 101,458 11,670 160,667 71,918 123,561 12,965 208,444 
Technology and development26,375 64,337 6,698 97,410 25,028 64,075 5,671 94,774 26,155 65,890 5,462 97,507 28,660 65,975 5,846 100,481 
General and administrative21,406 58,836 13,096 93,338 20,327 53,466 12,011 85,804 21,891 53,771 9,718 85,380 23,410 58,684 10,106 92,200 
Impairment costs— — — — — — — — — — — — — 73,900 2,900 76,800 
Total operating expenses$86,428 $230,771 $39,663 $356,862 $78,069 $225,441 $32,962 $336,472 $95,585 $221,119 $26,850 $343,554 $123,988 $322,120 $31,817 $477,925 

 Three Months Ended
 December 31, 2019September 30, 2019June 30, 2019March 31, 2019
HomesIMTMortgagesConsolidatedHomesIMTMortgagesConsolidatedHomesIMTMortgagesConsolidatedHomesIMTMortgagesConsolidated
Revenue$603,228 $319,665 $21,054 $943,947 $384,626 $335,290 $25,292 $745,208 $248,924 $323,669 $26,985 $599,578 $128,472 $298,272 $27,360 $454,104 
Cost of revenue 585,143 47,554 6,174 638,871 373,029 50,093 6,601 429,723 242,861 49,277 6,394 298,532 123,431 46,961 6,581 176,973 
Gross profit18,085 272,111 14,880 305,076 11,597 285,197 18,691 315,485 6,063 274,392 20,591 301,046 5,041 251,311 20,779 277,131 
Operating expenses:
Sales and marketing64,176 112,411 11,283 187,870 49,186 121,896 13,646 184,728 37,255 139,154 14,407 190,816 20,954 130,012 14,251 165,217 
Technology and development24,136 61,176 6,681 91,993 18,423 65,532 6,791 90,746 16,225 67,342 6,086 89,653 11,178 61,914 5,439 78,531 
General and administrative27,052 62,303 9,632 98,987 22,169 55,716 10,567 88,452 17,806 54,658 10,358 82,822 14,356 70,837 10,565 95,758 
Integration costs— — — — — — — — 293 293 — — 352 352 
Total operating expenses$115,364 $235,890 $27,596 $378,850 $89,778 $243,144 $31,009 $363,931 $71,286 $261,154 $31,144 $363,584 $46,488 $262,763 $30,607 $339,858 


 Three Months Ended
 December 31, 2018September 30, 2018June 30, 2018March 31, 2018
HomesIMTMortgagesConsolidatedHomesIMTMortgagesConsolidatedHomesIMTMortgagesConsolidatedHomesIMTMortgagesConsolidated
Revenue$41,347 $300,708 $23,280 $365,335 $11,018 $313,638 $18,438 $343,094 $— $305,941 $19,305 $325,246 $— $280,856 $19,023 $299,879 
Cost of revenue 39,540 47,696 7,606 94,842 10,369 52,150 2,718 65,237 32 51,510 2,863 54,405 140 51,785 3,168 55,093 
Gross profit1,807 253,012 15,674 270,493 649 261,488 15,720 277,857 (32)254,431 16,442 270,841 (140)229,071 15,855 244,786 
Operating expenses:
Sales and marketing10,099 121,948 10,226 142,273 4,649 121,287 6,562 132,498 2,095 142,043 7,663 151,801 290 132,969 8,246 141,505 
Technology and development8,736 66,288 5,412 80,436 5,986 63,207 3,799 72,992 3,759 59,840 3,826 67,425 2,176 52,530 3,861 58,567 
General and administrative10,039 57,230 7,474 74,743 6,010 60,672 4,054 70,736 4,175 52,438 3,965 60,578 1,784 50,161 4,106 56,051 
Impairment costs— 65,000 4,000 69,000 — 10,000 — 10,000 — — — — — — — — 
Acquisition-related costs— — 268 268 — — 1,405 1,405 — — 632 632 — 27 — 27 
Integration costs— — 1,492 1,492 — — 523 523 — — — — — — — — 
Total operating expenses$28,874 $310,466 $28,872 $368,212 $16,645 $255,166 $16,343 $288,154 $10,029 $254,321 $16,086 $280,436 $4,250 $235,687 $16,213 $256,150 


1 | Q2 2021


August 5, 2021 Dear Shareholders: Two and half years ago, we made a big bet to evolve from a search-and-find real estate marketplace to participate in the real estate transaction itself. Despite some monumental curveballs like a global pandemic, we are on track with each of the three-to five-year growth objectives we set for ourselves in early 2019. We are in a strong position and executing with operational rigor as we innovate and integrate our product offerings to deliver a seamless home transaction experience. As we evolve on our journey, we are also evolving how we measure success. This quarter, we are introducing gross profit as a GAAP financial measure that better demonstrates the growth of the Zillow ecosystem. Second-Quarter 2021 Highlights: ● Consolidated Q2 revenue of $1.3 billion and revenue for the IMT and Homes segments exceeded the high end of our Q2 outlook. ○ IMT segment revenue grew 70% year over year to $476 million, and Premier Agent revenue grew 82% year over year. ○ Homes segment record revenue of $777 million & record purchases drove our strong Q3 outlook. ○ Mortgages segment revenue grew 68% year over year to $57 million, driven by originations growth, with purchase volume up 100% sequentially from Q1. ● Consolidated gross profit was $538 million, up 92% year over year. ● Consolidated GAAP net income was $10 million in Q2. Segment income (loss) before income taxes was $134 million, $(59) million and $(18) million for the IMT, Homes and Mortgages segments, respectively. ● Consolidated Adjusted EBITDA1 of $183 million and Adjusted EBITDA for the IMT and Homes segments exceeded the high end of our Q2 outlook. Adjusted EBITDA by segment was $218 million, $(29) million and $(6) million for the IMT, Homes and Mortgages segments, respectively. ● The company ended the second quarter with cash and investments of $4.6 billion and on August 3, 2021, priced its first ever securitization of approximately $450 million to continue funding Zillow Offers growth.2 ● Traffic to Zillow Group’s mobile apps and websites reached 229 million average monthly unique users, growing 5% year over year and driving 2.8 billion visits, up 10% from a year ago. 2The notes issued in the securitization will not be registered under the Securities Act of 1933, as amended (the “Securities Act”), and may not be offered or sold in the United States absent registration or an applicable exemption from registration requirements. This letter shall not constitute an offer to sell or the solicitation of any offer to buy nor shall there be any sale of the notes in any jurisdiction in which such offer, solicitation or sale would be unlawful under the laws of such jurisdiction. 1Adjusted EBITDA and segment-level Adjusted EBITDA are non-GAAP financial measures; they are not calculated or presented in accordance with U.S. generally accepted accounting principles, or GAAP. Please see the sections “Use of Non-GAAP Financial Measures” and “Adjusted EBITDA” below for more information about our presentation of Adjusted EBITDA and segment-level Adjusted EBITDA, including a reconciliation to the most directly comparable GAAP financial measure, which is net income (loss) on a consolidated basis and income (loss) before income taxes for each segment, for the relevant period. 2 | Q2 2021

 
Select Second-Quarter 2021 Results CONSOLIDATED RESULTS The acceleration of our Zillow Offers business and ongoing strength in Premier Agent, combined with execution in our adjacent services and supporting marketplaces, translated to total consolidated revenue of $1.3 billion, gross profit of $538 million, GAAP net income of $10 million and Adjusted EBITDA of $183 million for Q2. As we broaden and integrate our services, our business lines are beginning to merge the customer experience. Going forward we plan to highlight gross profit dollar growth as a key measure of our performance. For context, in the last 12 months as of the end of Q2, our consolidated gross profit was just over $1.9 billion, growing 54% compared to the prior 12-month period. We are focused on gross profit dollars for many reasons. First, it is increasingly how we are measuring the business internally. Instead of optimizing for gross profit dollars generated by one particular service, we are thinking about the total enterprise gross profit pool that occurs when we offer multiple services to our customers. We believe this creates the right incentives to run our business, and is more in line with how we want customers to think of Zillow. Second, the gross profit measure levels the playing field for comparability between our businesses. Gross profit enables us to simplify comparisons across the various segments, allowing us to measure our operating efficiency in a more holistic way as we grow total company cash flows over time. Last, we look at our sizable gross profit pool as a competitive advantage to further invest in innovation, with the end goal of building fantastic customer experiences while driving sustainable long-term profitable growth. Since we launched Zillow 2.0, we have vastly broadened our services, which has allowed us to grow our gross profit dollars faster than the real estate industry growth. Our expectation is that we will continue to grow our small market share of transactions by continuing to broaden our services and increase the number of services each of our customers use per transaction. For Q2, gross profit was $538 million, up 92% year over year, driven primarily by the increase in Premier Agent revenue via our connections improvements, the acceleration of our Zillow Offers business and incremental profits from our adjacent services and supporting marketplaces. 3 | Q2 2021

 
*TTM represents the trailing twelve month period as of the date presented. INTERNET, MEDIA & TECHNOLOGY SEGMENT RESULTS Revenue for the Internet, Media & Technology (“IMT”) segment was $476 million, increasing 70% year over year and 47% when compared to Q2 2019. The IMT segment continued to benefit from improved execution that drove growth in higher intent Premier Agent connections, continued demand for services in our Other IMT segment marketplaces, and housing industry tailwinds. IMT segment GAAP income before income taxes in Q2 was $134 million, or 28% of IMT segment revenue, compared to $19 million, or 7% of IMT segment revenue, in the same period a year ago. IMT segment Adjusted EBITDA was $218 million in Q2, or 46% of IMT segment revenue, exceeding our outlook of $192 million and 41% Adjusted EBITDA margin at the midpoint of our guidance range. Revenue outperformance and continued operating efficiency translated into more than 130% year-over-year Adjusted EBITDA growth in Q2 when excluding the impact from our #BetterTogether discounts from the same period a year ago. 4 | Q2 2021

 
Premier Agent Premier Agent revenue growth accelerated to $349 million, up 82% year over year and up 50% when compared to Q2 2019. Removing the impact of the #BetterTogether discounts provided to our partners in Q2 2020, revenue increased 39% year over year. Our goal is to connect high-intent customers with high-performing partners, and our results were driven by strong execution against this goal, as well as continued housing industry tailwinds. We continue to improve the quality and quantity of connections we send to our partners by enhancing how our customers shop on Zillow, with a particular focus on touring, refining how quickly we introduce a customer to an agent, and focusing on building a network of high performing agents. Other IMT Revenue Other IMT revenue, which includes rentals, new construction, display advertising and business technology solutions for real estate professionals, increased 44% year over year to $127 million in Q2. Rentals revenue was the primary driver of Other IMT revenue growth in Q2, increasing 42% year over year as we continued to see increased adoption of our new product offerings. HOMES SEGMENT RESULTS As we previously discussed, the strong customer demand for Zillow Offers at the start of the quarter continued to accelerate in Q2, resulting in the purchase of 3,805 homes and sale of 2,086 homes. The record number of homes purchased was more than double that of Q1 2021 and is a direct reflection of the customer value proposition, the progress we have made in strengthening our pricing models and automation when providing offers to customers. These drivers resulted in rapid gains in our customer conversion rate from requested offers to signed agreements, which drove inventory to more than double from the end of Q1, with 3,142 homes in inventory at the end of Q2. 5 | Q2 2021
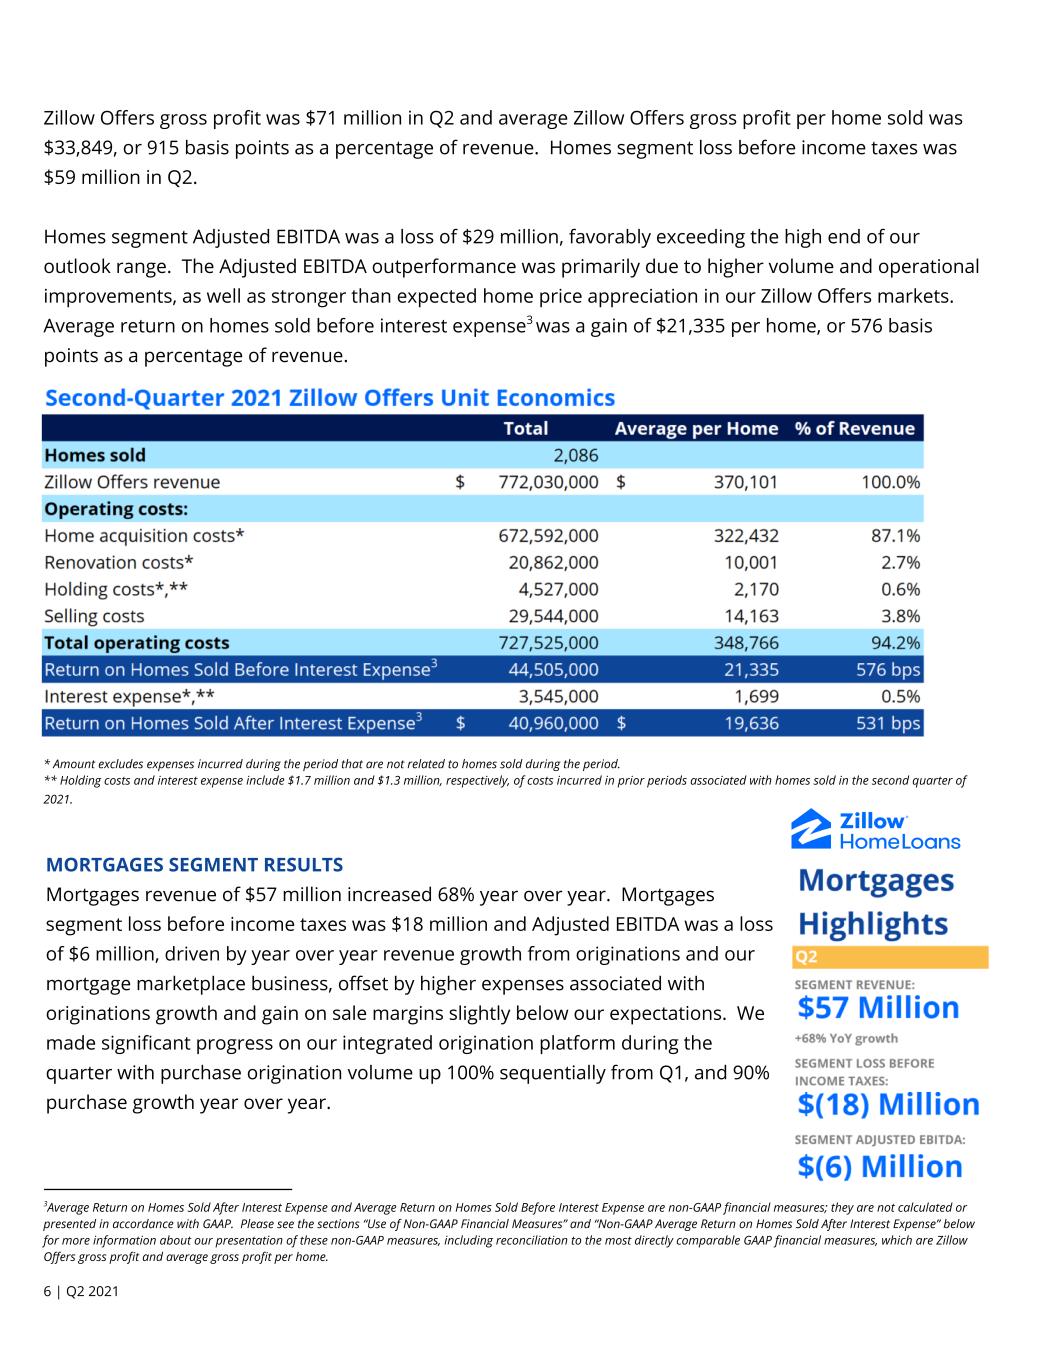

 
Zillow Offers gross profit was $71 million in Q2 and average Zillow Offers gross profit per home sold was $33,849, or 915 basis points as a percentage of revenue. Homes segment loss before income taxes was $59 million in Q2. Homes segment Adjusted EBITDA was a loss of $29 million, favorably exceeding the high end of our outlook range. The Adjusted EBITDA outperformance was primarily due to higher volume and operational improvements, as well as stronger than expected home price appreciation in our Zillow Offers markets. Average return on homes sold before interest expense3 was a gain of $21,335 per home, or 576 basis points as a percentage of revenue. * Amount excludes expenses incurred during the period that are not related to homes sold during the period. ** Holding costs and interest expense include $1.7 million and $1.3 million, respectively, of costs incurred in prior periods associated with homes sold in the second quarter of 2021. MORTGAGES SEGMENT RESULTS Mortgages revenue of $57 million increased 68% year over year. Mortgages segment loss before income taxes was $18 million and Adjusted EBITDA was a loss of $6 million, driven by year over year revenue growth from originations and our mortgage marketplace business, offset by higher expenses associated with originations growth and gain on sale margins slightly below our expectations. We made significant progress on our integrated origination platform during the quarter with purchase origination volume up 100% sequentially from Q1, and 90% purchase growth year over year. 3Average Return on Homes Sold After Interest Expense and Average Return on Homes Sold Before Interest Expense are non-GAAP financial measures; they are not calculated or presented in accordance with GAAP. Please see the sections “Use of Non-GAAP Financial Measures” and “Non-GAAP Average Return on Homes Sold After Interest Expense” below for more information about our presentation of these non-GAAP measures, including reconciliation to the most directly comparable GAAP financial measures, which are Zillow Offers gross profit and average gross profit per home. 6 | Q2 2021
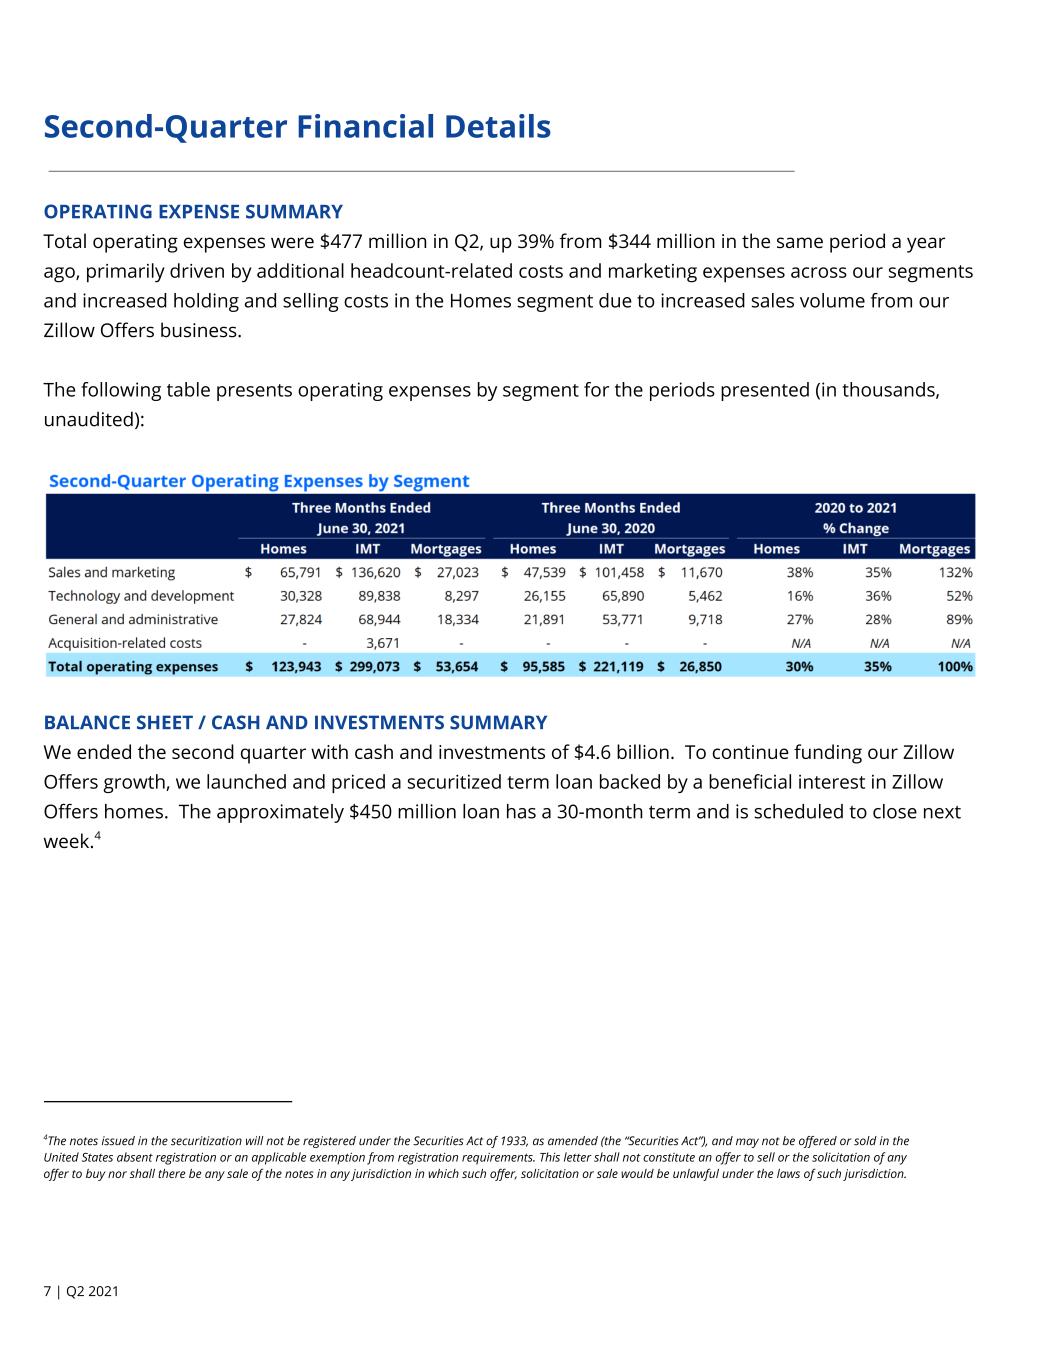

 
Second-Quarter Financial Details OPERATING EXPENSE SUMMARY Total operating expenses were $477 million in Q2, up 39% from $344 million in the same period a year ago, primarily driven by additional headcount-related costs and marketing expenses across our segments and increased holding and selling costs in the Homes segment due to increased sales volume from our Zillow Offers business. The following table presents operating expenses by segment for the periods presented (in thousands, unaudited): BALANCE SHEET / CASH AND INVESTMENTS SUMMARY We ended the second quarter with cash and investments of $4.6 billion. To continue funding our Zillow Offers growth, we launched and priced a securitized term loan backed by a beneficial interest in Zillow Offers homes. The approximately $450 million loan has a 30-month term and is scheduled to close next week.4 4The notes issued in the securitization will not be registered under the Securities Act of 1933, as amended (the “Securities Act”), and may not be offered or sold in the United States absent registration or an applicable exemption from registration requirements. This letter shall not constitute an offer to sell or the solicitation of any offer to buy nor shall there be any sale of the notes in any jurisdiction in which such offer, solicitation or sale would be unlawful under the laws of such jurisdiction. 7 | Q2 2021
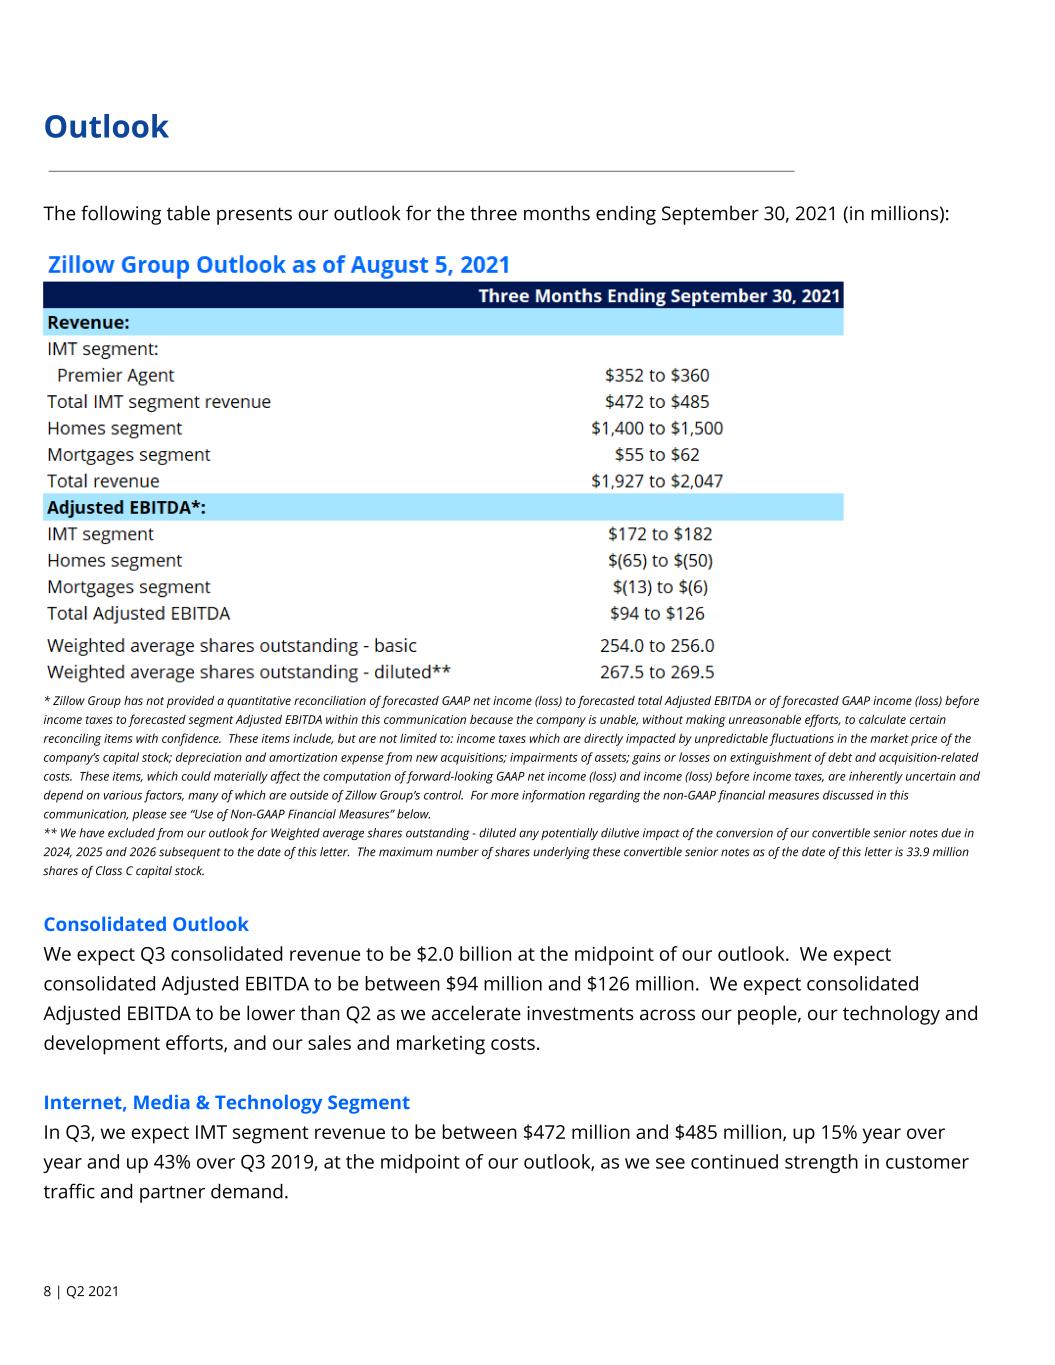

 
Outlook The following table presents our outlook for the three months ending September 30, 2021 (in millions): * Zillow Group has not provided a quantitative reconciliation of forecasted GAAP net income (loss) to forecasted total Adjusted EBITDA or of forecasted GAAP income (loss) before income taxes to forecasted segment Adjusted EBITDA within this communication because the company is unable, without making unreasonable efforts, to calculate certain reconciling items with confidence. These items include, but are not limited to: income taxes which are directly impacted by unpredictable fluctuations in the market price of the company’s capital stock; depreciation and amortization expense from new acquisitions; impairments of assets; gains or losses on extinguishment of debt and acquisition-related costs. These items, which could materially affect the computation of forward-looking GAAP net income (loss) and income (loss) before income taxes, are inherently uncertain and depend on various factors, many of which are outside of Zillow Group’s control. For more information regarding the non-GAAP financial measures discussed in this communication, please see “Use of Non-GAAP Financial Measures” below. ** We have excluded from our outlook for Weighted average shares outstanding - diluted any potentially dilutive impact of the conversion of our convertible senior notes due in 2024, 2025 and 2026 subsequent to the date of this letter. The maximum number of shares underlying these convertible senior notes as of the date of this letter is 33.9 million shares of Class C capital stock. Consolidated Outlook We expect Q3 consolidated revenue to be $2.0 billion at the midpoint of our outlook. We expect consolidated Adjusted EBITDA to be between $94 million and $126 million. We expect consolidated Adjusted EBITDA to be lower than Q2 as we accelerate investments across our people, our technology and development efforts, and our sales and marketing costs. Internet, Media & Technology Segment In Q3, we expect IMT segment revenue to be between $472 million and $485 million, up 15% year over year and up 43% over Q3 2019, at the midpoint of our outlook, as we see continued strength in customer traffic and partner demand. 8 | Q2 2021

 
We expect Q3 IMT segment Adjusted EBITDA margin to be 37% at the midpoint of our outlook, down sequentially from 46% in Q2. As we position ourselves to drive sustainable, profitable long-term growth, we expect Q3 IMT segment Adjusted EBITDA margin to reflect our planned accelerated investments in marketing, staffing and technology up from Q2 levels. We expect these investment levels to be consistent in Q3 and Q4. For the full year 2021, we expect IMT segment Adjusted EBITDA dollar growth to outpace revenue growth driven by our first half results while continuing to sustain planned second half investments. Premier Agent In Q3, Premier Agent revenue is expected to be between $352 million and $360 million, up 19% year over year and up 48% over Q3 2019, at the midpoint of our outlook. Homes Segment In Q3, we expect Homes segment revenue to be between $1.4 billion and $1.5 billion, and Homes segment Adjusted EBITDA loss to be between $65 million and $50 million. This guidance reflects a step up in purchase activity and accelerated investments to build scale, resulting from the progress we have made in strengthening our pricing models. Automation at the top of the funnel will help drive scalability and improved customer experience for future periods. Our goal continues to be a housing market maker with Zillow Offers. We expect homes that we purchase to have tighter pricing assumptions closer to our self-imposed guardrails of +/- 200 basis points before interest expense over the course of the second half of the year. Mortgages Segment In Q3, Mortgages segment revenue is expected to be between $55 million and $62 million, which is roughly flat from Q2, and assumes slower refinance activity, consistent gain on sale levels, and continued growth in purchase originations. Mortgages segment Adjusted EBITDA is expected to be between a loss of $13 million and $6 million as a result of flat revenue and continued investments to grow mortgage originations. Summary Our strongly held belief is that people want a simpler real estate transaction experience. Our connected services and products are increasingly able to help customers, agents and partners navigate that daunting process with ease and simplicity. For the past several quarters we have talked about the value proposition of the end-to-end real estate solution that Zillow can provide. Wherever our customers are in their home shopping journey, they are able to choose from the Zillow menu that best meets their needs. 9 | Q2 2021


 
We are beginning to see these efforts to integrate the real estate transaction reflected in our results. As Zillow Offers accelerates, it is lifting Zillow Home Loans purchase originations, with approximately 40% of purchase originations in the second quarter sourced from Zillow Offers. The successful launch of Zillow Closing Services is another example of how our services are becoming more integrated and complementary. We believe there continues to be strong, durable support for the housing market from tailwinds including the Great Reshuffling, which is driven in part by the adoption of location-flexible work, millennials entering their prime home-buying years, and low interest rates. And while cyclicality in the housing market affects us, we believe our vision to come down the funnel and streamline the real estate transaction for customers and agents will drive our secular growth in the future. As we continue to innovate around the customer transaction experience, we expect to grow the small share of transactions we are currently involved with by continuing to broaden our services and increasing the number of services each of our customers use per transaction. This quarter, we introduced gross profit as a key measure of how we are performing in integrating the customer transaction experience. Our focus on growing gross profit helps us align our businesses, and invest in innovation on behalf of our customers while driving sustainable, profitable growth over the long term. Watch the full story here5 Customers Ina and Tony of Atlanta, recently wrapped up a seamless move to their new home with the help of Zillow's connected services -- Zillow 360. Feeling overwhelmed by the prospect of balancing closing dates with their personal commitments, Ina and Tony decided to accept an offer to sell their home to Zillow. Recognizing the ease that Zillow brought to this experience, they were intrigued when our teams told them they could sell, finance and close with Zillow, too. The opportunity to align the buying and selling processes so it could work on their timeline was too good to pass up. We connected them to one of our agent partners in the area, who helped them find their dream home. By this point, financing with Zillow was “a no-brainer” for the couple. We found out last week that after his great customer experience with Zillow, Tony applied for, was offered, and subsequently accepted a role with our Zillow Offers team as an estimator. You can’t get much more of a shining customer endorsement than that. Stories like these — of ease and connectivity — inspire us to continue innovating on behalf of our customers for a frictionless experience. We’ve made big bets on the e-commerce future of the real estate industry. And every day we edge closer to realizing our dream of delivering a seamless, integrated, perhaps even joyful experience for our customers and partners. We appreciate your continued support and confidence. Sincerely, Rich Barton, Co-founder & CEO Allen Parker, CFO 5 https://www.zillowgroup.com/news/sell-buy-finance-zillow-360 10 | Q2 2021

 
Forward-Looking Statements This communication contains forward-looking statements within the meaning of Section 27A of the Securities Act of 1933 and Section 21E of the Securities Exchange Act of 1934 that involve risks and uncertainties, including, without limitation, statements regarding the future performance and operation of our business and the current and future health and stability of the residential housing market and economy and our expectations regarding future shifts in behavior by consumers and employees. Statements containing words such as “may,” “believe,” “anticipate,” “expect,” “intend,” “plan,” “project,” “predict,” “will,” “projections,” “continue,” “estimate,” “outlook,” “guidance,” “would,” “could,” or similar expressions constitute forward-looking statements. Forward-looking statements are made based on assumptions as of August 5, 2021, and although we believe the expectations reflected in the forward-looking statements are reasonable, we cannot guarantee these results. Differences in Zillow Group’s actual results from those described in these forward-looking statements may result from actions taken by Zillow Group as well as from risks and uncertainties beyond Zillow Group’s control. Factors that may contribute to such differences include, but are not limited to, the impact of the COVID-19 pandemic (including variants) or other public health crises and any associated economic downturn on Zillow Group’s future financial position, operations and financial performance; the magnitude, duration and severity of the COVID-19 pandemic and the availability and widespread distribution and use of effective vaccines; the impact of actions taken by governments, businesses and individuals in response to the COVID-19 pandemic, including changes in laws or regulations that limit our ability to operate; the current and future health and stability of the economy, financial conditions and residential housing market, including any extended slowdown in the real estate markets as a result of the COVID-19 pandemic; changes in laws or regulations applicable to our business, employees, products or services, including current and future laws, regulations and orders that limit Zillow Group’s ability to operate in light of the COVID-19 pandemic; the satisfaction of conditions precedent to the closing of Zillow Group’s proposed acquisition of ShowingTime.com, Inc., including expiration or termination of any applicable waiting period under the Hart- Scott-Rodino Act or Zillow Group’s timing agreement with ShowingTime.com, Inc. and the U.S. Federal Trade Commission; changes in general economic and financial conditions that reduce demand for our products and services, lower our profitability or reduce Zillow Group’s access to credit; actual or anticipated fluctuations in our financial condition and results of operations; changes in projected operational and financial results; addition or loss of significant customers; actual or anticipated changes in Zillow Group’s growth rate relative to that of our competitors; acquisitions, strategic partnerships, joint ventures, capital-raising activities or other corporate transactions or commitments by us or our competitors; actual or anticipated changes in technology, products, markets or services by us or our competitors; ability to obtain or maintain licenses and permits to support Zillow Group’s current and future businesses; ability to comply with MLS rules and requirements to access and use listing data, and to maintain or establish relationships with listings and data providers; ability to operate Zillow Group’s mortgage originations business, including the ability to obtain sufficient financing; fluctuations in the valuation of companies perceived by investors to be comparable to Zillow Group; the impact of natural disasters and other catastrophic events; the impact of pending or future litigation; and the issuance of new or updated research or reports by securities analysts. The foregoing list of risks and uncertainties is illustrative but not exhaustive. For more information about potential factors that could affect Zillow Group’s business and financial results, please review the “Risk Factors” described in Zillow Group’s Annual Report on Form 10-K for the year ended December 31, 2020. Except as may be required by law, Zillow Group does not intend and undertakes no duty to update this information to reflect future events or circumstances. 11| Q2 2021


Use of Non-GAAP Financial Measures This communication includes references to Adjusted EBITDA (in total and for each segment, and including forecasted Adjusted EBITDA and EBITDA margin), Average Return on Homes Sold Before Interest Expense and Average Return on Homes Sold After Interest Expense, which are non-GAAP financial measures not prepared in conformity with accounting principles generally accepted in the United States (“GAAP”). These non-GAAP financial measures are not prepared under a comprehensive set of accounting rules and, therefore, should only be reviewed alongside results reported under GAAP. Adjusted EBITDA To provide investors with additional information regarding our financial results, this communication includes references to Adjusted EBITDA in total and for each segment, each a non-GAAP financial measure. We have provided a reconciliation below of Adjusted EBITDA in total to net income (loss) and Adjusted EBITDA by segment to income (loss) before income taxes for each segment, the most directly comparable GAAP financial measures. Adjusted EBITDA is a key metric used by our management and board of directors to measure operating performance and trends and to prepare and approve our annual budget. In particular, the exclusion of certain expenses in calculating Adjusted EBITDA facilitates operating performance comparisons on a period-to-period basis. Our use of Adjusted EBITDA in total and for each segment has limitations as an analytical tool, and you should not consider these measures in isolation or as a substitute for analysis of our results as reported under GAAP. Some of these limitations are: • Adjusted EBITDA does not reflect our cash expenditures or future requirements for capital expenditures or contractual commitments; • Adjusted EBITDA does not reflect changes in, or cash requirements for, our working capital needs; • Adjusted EBITDA does not consider the potentially dilutive impact of share-based compensation; • Although depreciation and amortization are non-cash charges, the assets being depreciated and amortized may have to be replaced in the future, and Adjusted EBITDA does not reflect cash capital expenditure requirements for such replacements or for new capital expenditure requirements; • Adjusted EBITDA does not reflect impairment costs; • Adjusted EBITDA does not reflect acquisition-related costs; • Adjusted EBITDA does not reflect the gain (loss) on extinguishment of debt; • Adjusted EBITDA does not reflect interest expense or other income; • Adjusted EBITDA does not reflect income taxes; and • Other companies, including companies in our own industry, may calculate Adjusted EBITDA differently than we do, limiting its usefulness as a comparative measure. Because of these limitations, you should consider Adjusted EBITDA in total and for each segment alongside other financial performance measures, including various cash flow metrics, net income (loss), income (loss) before income taxes for each segment, and our other GAAP results. 12| Q2 2021
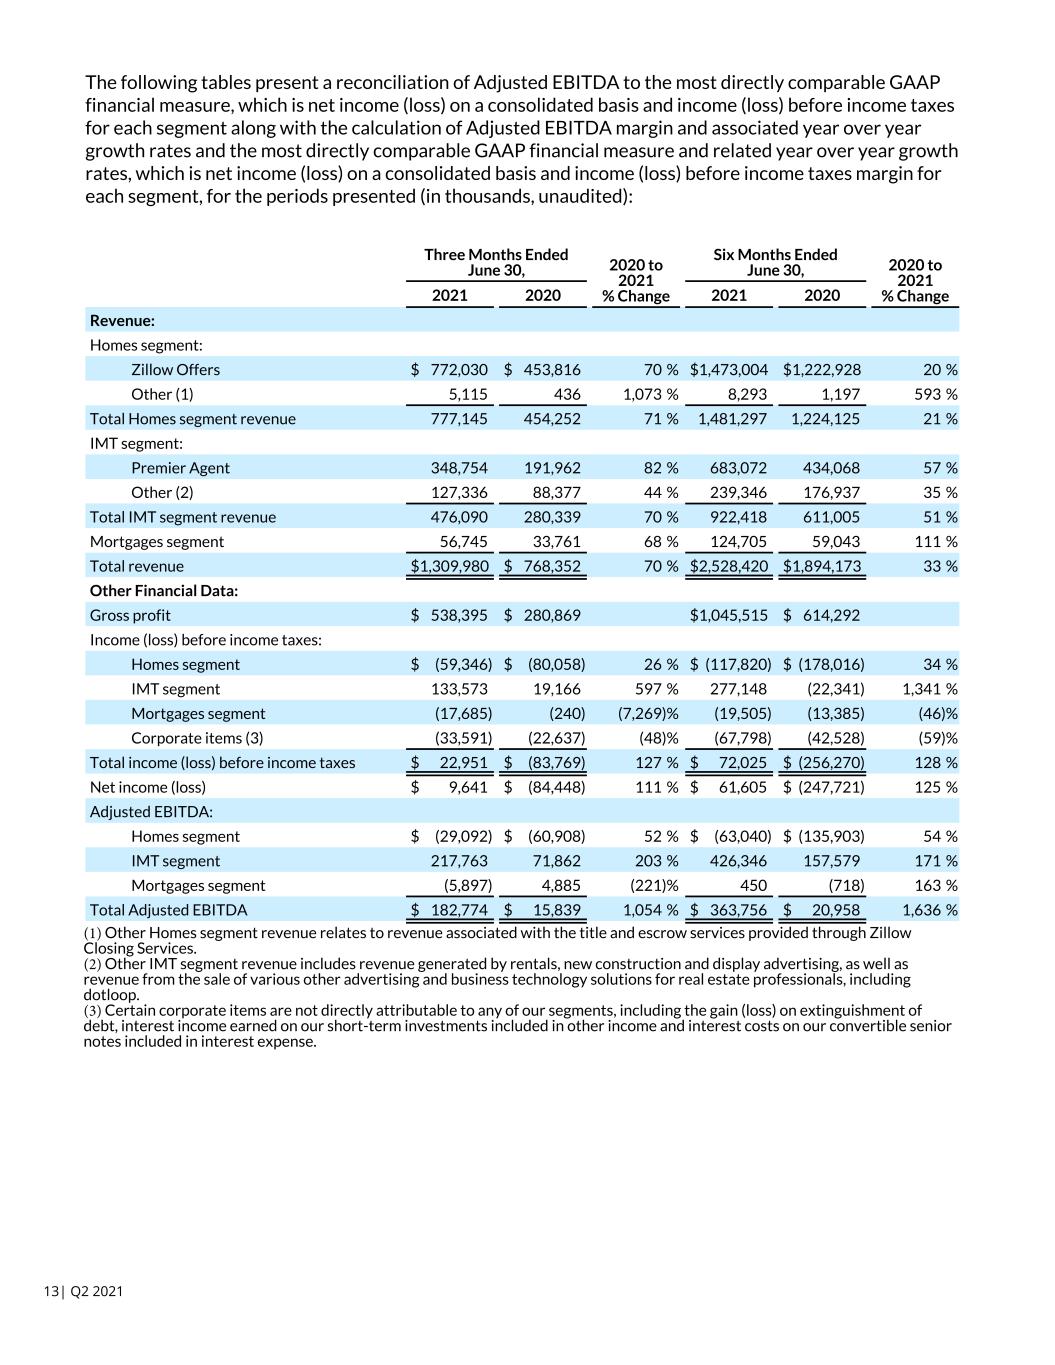

 
The following tables present a reconciliation of Adjusted EBITDA to the most directly comparable GAAP financial measure, which is net income (loss) on a consolidated basis and income (loss) before income taxes for each segment along with the calculation of Adjusted EBITDA margin and associated year over year growth rates and the most directly comparable GAAP financial measure and related year over year growth rates, which is net income (loss) on a consolidated basis and income (loss) before income taxes margin for each segment, for the periods presented (in thousands, unaudited): Three Months Ended June 30, 2020 to 2021 % Change Six Months Ended June 30, 2020 to 2021 % Change2021 2020 2021 2020 Revenue: Homes segment: Zillow Offers $ 772,030 $ 453,816 70 % $ 1,473,004 $ 1,222,928 20 % Other (1) 5,115 436 1,073 % 8,293 1,197 593 % Total Homes segment revenue 777,145 454,252 71 % 1,481,297 1,224,125 21 % IMT segment: Premier Agent 348,754 191,962 82 % 683,072 434,068 57 % Other (2) 127,336 88,377 44 % 239,346 176,937 35 % Total IMT segment revenue 476,090 280,339 70 % 922,418 611,005 51 % Mortgages segment 56,745 33,761 68 % 124,705 59,043 111 % Total revenue $ 1,309,980 $ 768,352 70 % $ 2,528,420 $ 1,894,173 33 % Other Financial Data: Gross profit $ 538,395 $ 280,869 $ 1,045,515 $ 614,292 Income (loss) before income taxes: Homes segment $ (59,346) $ (80,058) 26 % $ (117,820) $ (178,016) 34 % IMT segment 133,573 19,166 597 % 277,148 (22,341) 1,341 % Mortgages segment (17,685) (240) (7,269) % (19,505) (13,385) (46) % Corporate items (3) (33,591) (22,637) (48) % (67,798) (42,528) (59) % Total income (loss) before income taxes $ 22,951 $ (83,769) 127 % $ 72,025 $ (256,270) 128 % Net income (loss) $ 9,641 $ (84,448) 111 % $ 61,605 $ (247,721) 125 % Adjusted EBITDA: Homes segment $ (29,092) $ (60,908) 52 % $ (63,040) $ (135,903) 54 % IMT segment 217,763 71,862 203 % 426,346 157,579 171 % Mortgages segment (5,897) 4,885 (221) % 450 (718) 163 % Total Adjusted EBITDA $ 182,774 $ 15,839 1,054 % $ 363,756 $ 20,958 1,636 % (1) Other Homes segment revenue relates to revenue associated with the title and escrow services provided through Zillow Closing Services. (2) Other IMT segment revenue includes revenue generated by rentals, new construction and display advertising, as well as revenue from the sale of various other advertising and business technology solutions for real estate professionals, including dotloop. (3) Certain corporate items are not directly attributable to any of our segments, including the gain (loss) on extinguishment of debt, interest income earned on our short-term investments included in other income and interest costs on our convertible senior notes included in interest expense. 13| Q2 2021
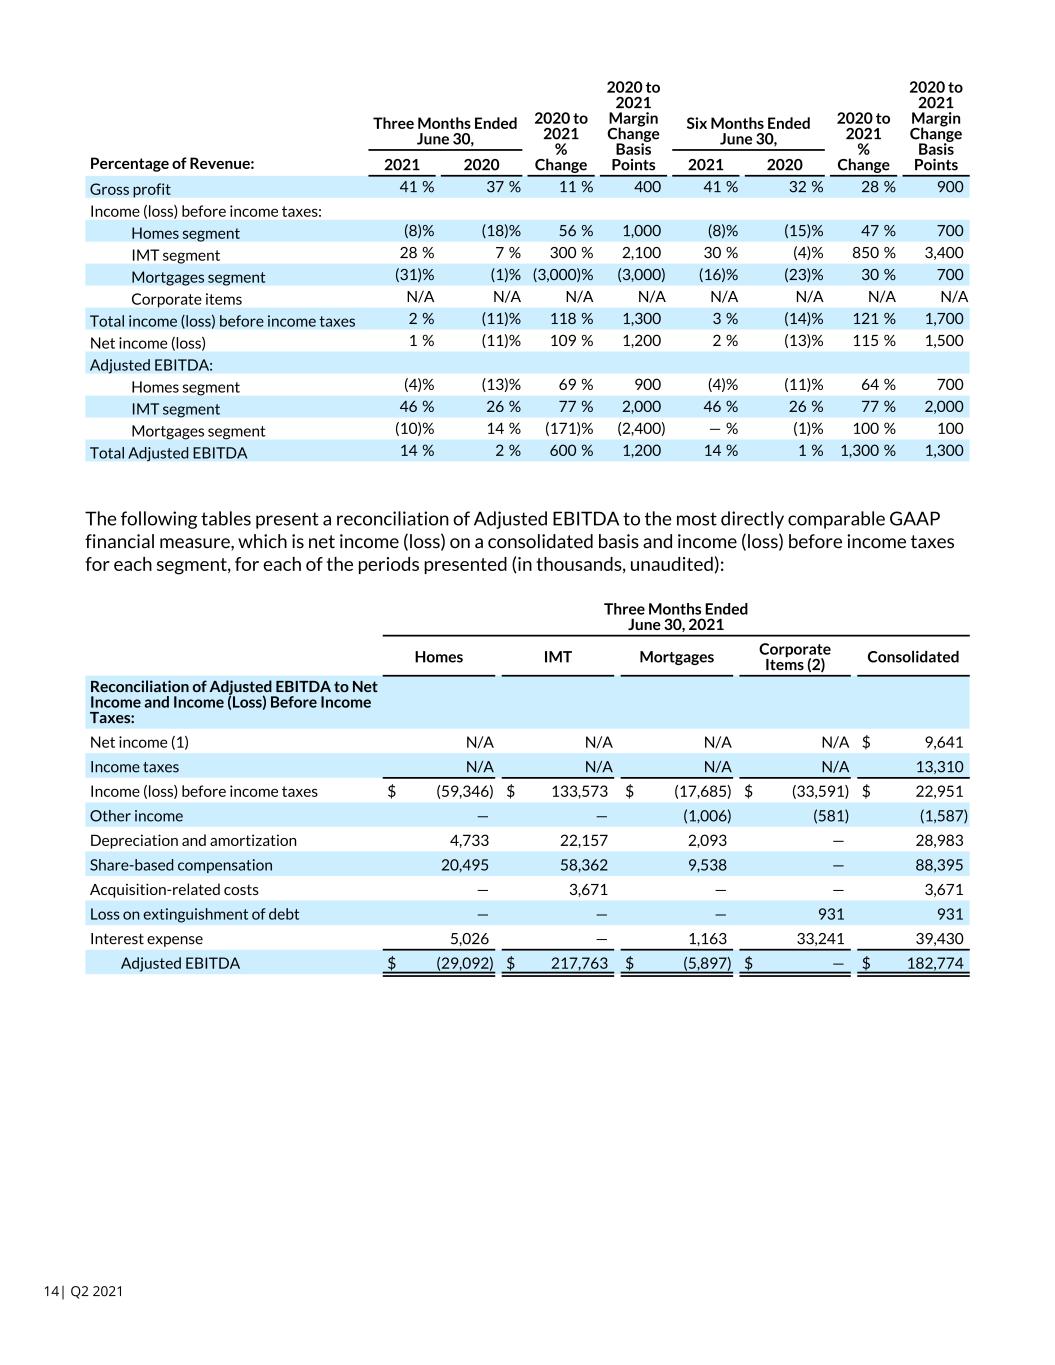

 
Three Months Ended June 30, 2020 to 2021 % Change 2020 to 2021 Margin Change Basis Points Six Months Ended June 30, 2020 to 2021 % Change 2020 to 2021 Margin Change Basis PointsPercentage of Revenue: 2021 2020 2021 2020 Gross profit 41 % 37 % 11 % 400 41 % 32 % 28 % 900 Income (loss) before income taxes: Homes segment (8) % (18) % 56 % 1,000 (8) % (15) % 47 % 700 IMT segment 28 % 7 % 300 % 2,100 30 % (4) % 850 % 3,400 Mortgages segment (31) % (1) % (3,000) % (3,000) (16) % (23) % 30 % 700 Corporate items N/A N/A N/A N/A N/A N/A N/A N/A Total income (loss) before income taxes 2 % (11) % 118 % 1,300 3 % (14) % 121 % 1,700 Net income (loss) 1 % (11) % 109 % 1,200 2 % (13) % 115 % 1,500 Adjusted EBITDA: Homes segment (4) % (13) % 69 % 900 (4) % (11) % 64 % 700 IMT segment 46 % 26 % 77 % 2,000 46 % 26 % 77 % 2,000 Mortgages segment (10) % 14 % (171) % (2,400) — % (1) % 100 % 100 Total Adjusted EBITDA 14 % 2 % 600 % 1,200 14 % 1 % 1,300 % 1,300 The following tables present a reconciliation of Adjusted EBITDA to the most directly comparable GAAP financial measure, which is net income (loss) on a consolidated basis and income (loss) before income taxes for each segment, for each of the periods presented (in thousands, unaudited): Three Months Ended June 30, 2021 Homes IMT Mortgages Corporate Items (2) Consolidated Reconciliation of Adjusted EBITDA to Net Income and Income (Loss) Before Income Taxes: Net income (1) N/A N/A N/A N/A $ 9,641 Income taxes N/A N/A N/A N/A 13,310 Income (loss) before income taxes $ (59,346) $ 133,573 $ (17,685) $ (33,591) $ 22,951 Other income — — (1,006) (581) (1,587) Depreciation and amortization 4,733 22,157 2,093 — 28,983 Share-based compensation 20,495 58,362 9,538 — 88,395 Acquisition-related costs — 3,671 — — 3,671 Loss on extinguishment of debt — — — 931 931 Interest expense 5,026 — 1,163 33,241 39,430 Adjusted EBITDA $ (29,092) $ 217,763 $ (5,897) $ — $ 182,774 14| Q2 2021
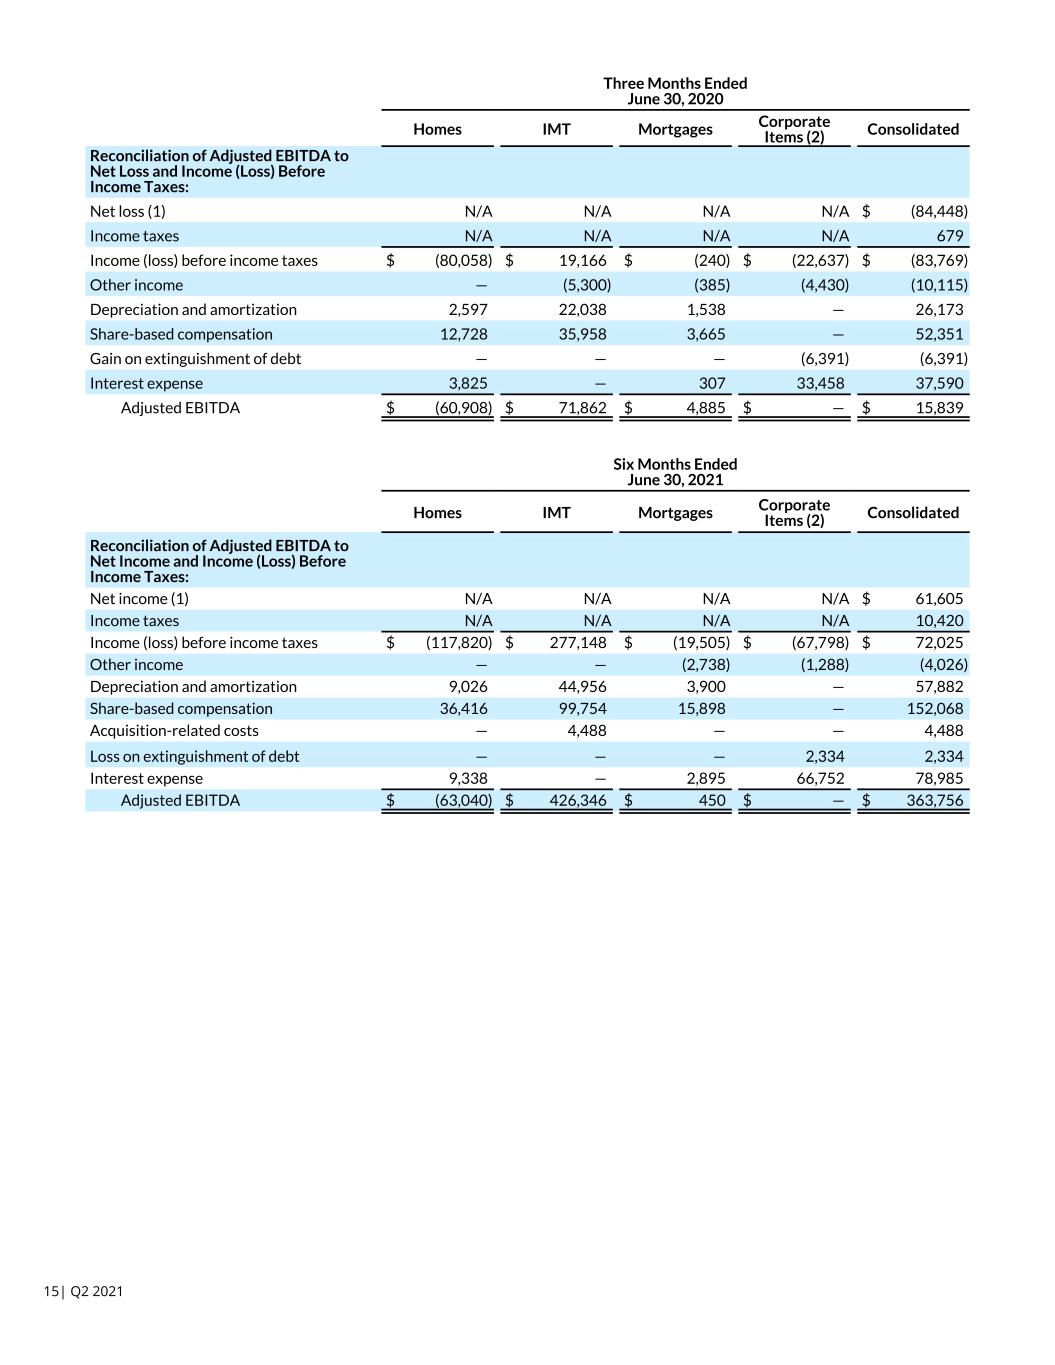

 
Three Months Ended June 30, 2020 Homes IMT Mortgages Corporate Items (2) Consolidated Reconciliation of Adjusted EBITDA to Net Loss and Income (Loss) Before Income Taxes: Net loss (1) N/A N/A N/A N/A $ (84,448) Income taxes N/A N/A N/A N/A 679 Income (loss) before income taxes $ (80,058) $ 19,166 $ (240) $ (22,637) $ (83,769) Other income — (5,300) (385) (4,430) (10,115) Depreciation and amortization 2,597 22,038 1,538 — 26,173 Share-based compensation 12,728 35,958 3,665 — 52,351 Gain on extinguishment of debt — — — (6,391) (6,391) Interest expense 3,825 — 307 33,458 37,590 Adjusted EBITDA $ (60,908) $ 71,862 $ 4,885 $ — $ 15,839 Six Months Ended June 30, 2021 Homes IMT Mortgages Corporate Items (2) Consolidated Reconciliation of Adjusted EBITDA to Net Income and Income (Loss) Before Income Taxes: Net income (1) N/A N/A N/A N/A $ 61,605 Income taxes N/A N/A N/A N/A 10,420 Income (loss) before income taxes $ (117,820) $ 277,148 $ (19,505) $ (67,798) $ 72,025 Other income — — (2,738) (1,288) (4,026) Depreciation and amortization 9,026 44,956 3,900 — 57,882 Share-based compensation 36,416 99,754 15,898 — 152,068 Acquisition-related costs — 4,488 — — 4,488 Loss on extinguishment of debt — — — 2,334 2,334 Interest expense 9,338 — 2,895 66,752 78,985 Adjusted EBITDA $ (63,040) $ 426,346 $ 450 $ — $ 363,756 15| Q2 2021
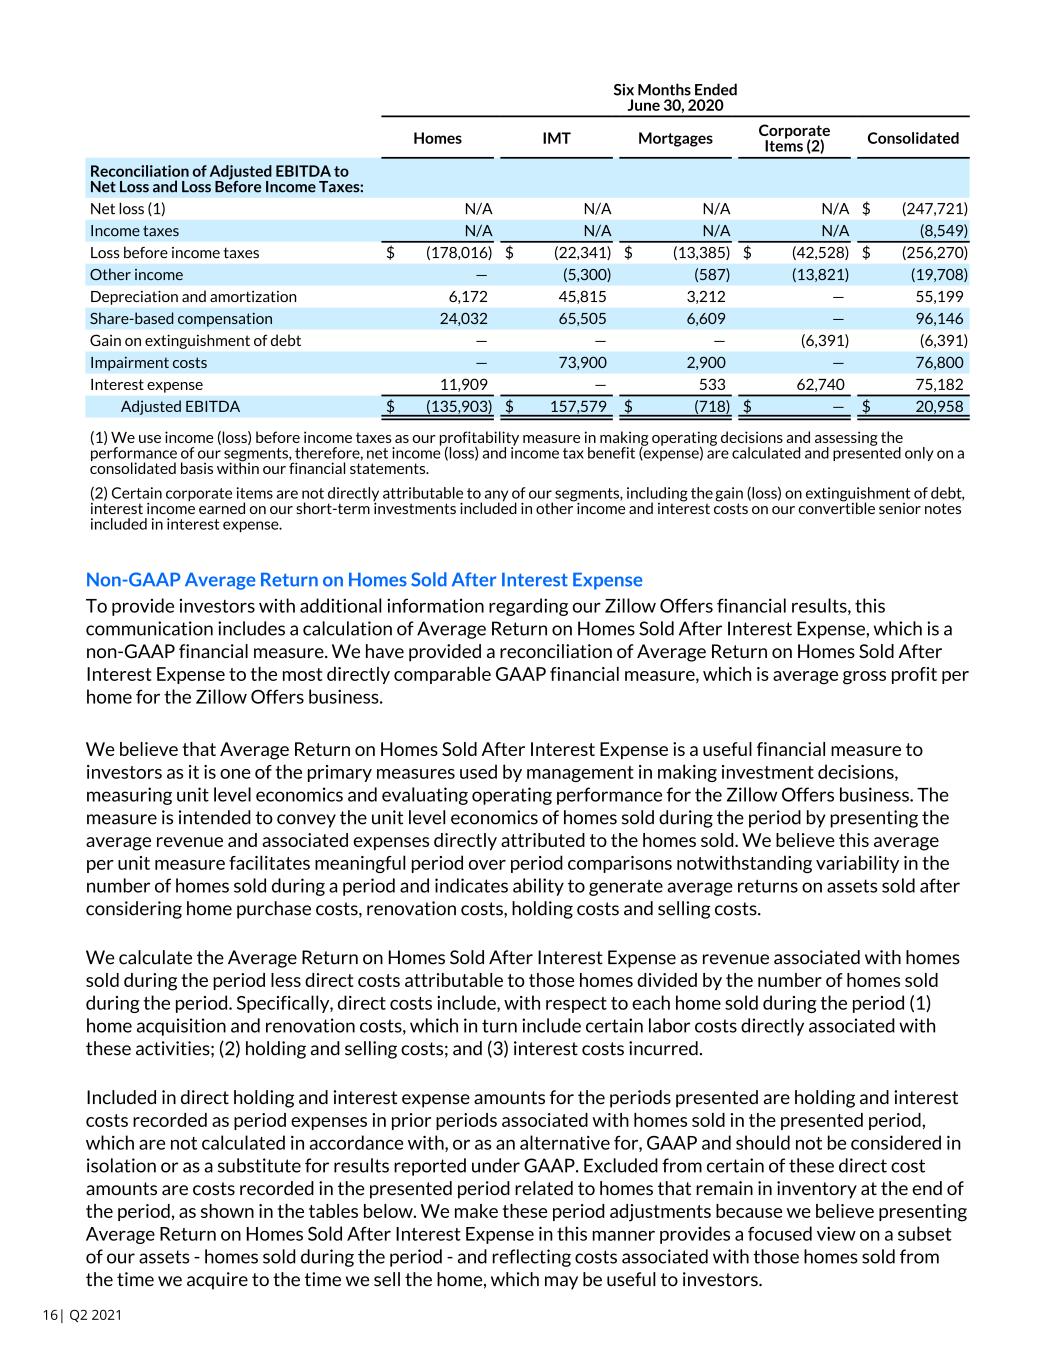

 
Six Months Ended June 30, 2020 Homes IMT Mortgages Corporate Items (2) Consolidated Reconciliation of Adjusted EBITDA to Net Loss and Loss Before Income Taxes: Net loss (1) N/A N/A N/A N/A $ (247,721) Income taxes N/A N/A N/A N/A (8,549) Loss before income taxes $ (178,016) $ (22,341) $ (13,385) $ (42,528) $ (256,270) Other income — (5,300) (587) (13,821) (19,708) Depreciation and amortization 6,172 45,815 3,212 — 55,199 Share-based compensation 24,032 65,505 6,609 — 96,146 Gain on extinguishment of debt — — — (6,391) (6,391) Impairment costs — 73,900 2,900 — 76,800 Interest expense 11,909 — 533 62,740 75,182 Adjusted EBITDA $ (135,903) $ 157,579 $ (718) $ — $ 20,958 (1) We use income (loss) before income taxes as our profitability measure in making operating decisions and assessing the performance of our segments, therefore, net income (loss) and income tax benefit (expense) are calculated and presented only on a consolidated basis within our financial statements. (2) Certain corporate items are not directly attributable to any of our segments, including the gain (loss) on extinguishment of debt, interest income earned on our short-term investments included in other income and interest costs on our convertible senior notes included in interest expense. Non-GAAP Average Return on Homes Sold After Interest Expense To provide investors with additional information regarding our Zillow Offers financial results, this communication includes a calculation of Average Return on Homes Sold After Interest Expense, which is a non-GAAP financial measure. We have provided a reconciliation of Average Return on Homes Sold After Interest Expense to the most directly comparable GAAP financial measure, which is average gross profit per home for the Zillow Offers business. We believe that Average Return on Homes Sold After Interest Expense is a useful financial measure to investors as it is one of the primary measures used by management in making investment decisions, measuring unit level economics and evaluating operating performance for the Zillow Offers business. The measure is intended to convey the unit level economics of homes sold during the period by presenting the average revenue and associated expenses directly attributed to the homes sold. We believe this average per unit measure facilitates meaningful period over period comparisons notwithstanding variability in the number of homes sold during a period and indicates ability to generate average returns on assets sold after considering home purchase costs, renovation costs, holding costs and selling costs. We calculate the Average Return on Homes Sold After Interest Expense as revenue associated with homes sold during the period less direct costs attributable to those homes divided by the number of homes sold during the period. Specifically, direct costs include, with respect to each home sold during the period (1) home acquisition and renovation costs, which in turn include certain labor costs directly associated with these activities; (2) holding and selling costs; and (3) interest costs incurred. Included in direct holding and interest expense amounts for the periods presented are holding and interest costs recorded as period expenses in prior periods associated with homes sold in the presented period, which are not calculated in accordance with, or as an alternative for, GAAP and should not be considered in isolation or as a substitute for results reported under GAAP. Excluded from certain of these direct cost amounts are costs recorded in the presented period related to homes that remain in inventory at the end of the period, as shown in the tables below. We make these period adjustments because we believe presenting Average Return on Homes Sold After Interest Expense in this manner provides a focused view on a subset of our assets - homes sold during the period - and reflecting costs associated with those homes sold from the time we acquire to the time we sell the home, which may be useful to investors. 16| Q2 2021

 
Average Return on Homes Sold After Interest Expense is intended to illustrate the performance of homes sold during the period and is not intended to be a segment or company performance metric. Average Return on Homes Sold After Interest Expense is a supplemental measure of operating performance for a subset of assets and has limitations as an analytical tool, and you should not consider it in isolation or as a substitute for analysis of our results as reported under GAAP. Some of these limitations are: • Although depreciation and amortization are non-cash charges, the assets being depreciated and amortized may have to be replaced in the future, and Average Return on Homes Sold After Interest Expense does not reflect capital expenditure requirements for such replacements or for new capital expenditure requirements; • Average Return on Homes Sold After Interest Expense does not consider the potentially dilutive impact of share-based compensation; • Average Return on Homes Sold After Interest Expense does not include period costs that were not eligible for inventory capitalization associated with homes held in inventory at the end of the period; • Average Return on Homes Sold After Interest Expense does not reflect indirect expenses included in cost of revenue, sales and marketing, technology and development, or general and administrative expenses, some of which are recurring cash expenditures necessary to operate the business; and • Average Return on Homes Sold After Interest Expense does not reflect income taxes. The calculation of Average Return on Homes Sold After Interest Expense includes only those expenses directly attributed to the homes sold during the period. To arrive at return on homes sold after interest expense, the Company deducts from Zillow Offers gross profit (1) holding costs incurred in the presented period and prior periods for homes sold during the presented period that are included in sales and marketing expense, (2) selling costs incurred in the presented period for homes sold during the presented period that are included in sales and marketing expense and (3) interest expense incurred in the presented period and prior periods for homes sold during the presented period. The Company adds to Zillow Offers gross profit (1) inventory valuation adjustments recorded during the presented period associated with homes that remain in inventory at period end, net of inventory valuation adjustments recorded in prior periods related to homes sold in the presented period, and indirect expenses included in cost of revenue and (2) share-based compensation expense and depreciation and amortization expense included in cost of revenue. The following table presents the calculation of Zillow Offers average gross profit per home and Average Return on Homes Sold After Interest Expense and a reconciliation of return on homes sold after interest expense to Zillow Offers gross profit for the periods presented (unaudited): 17| Q2 2021
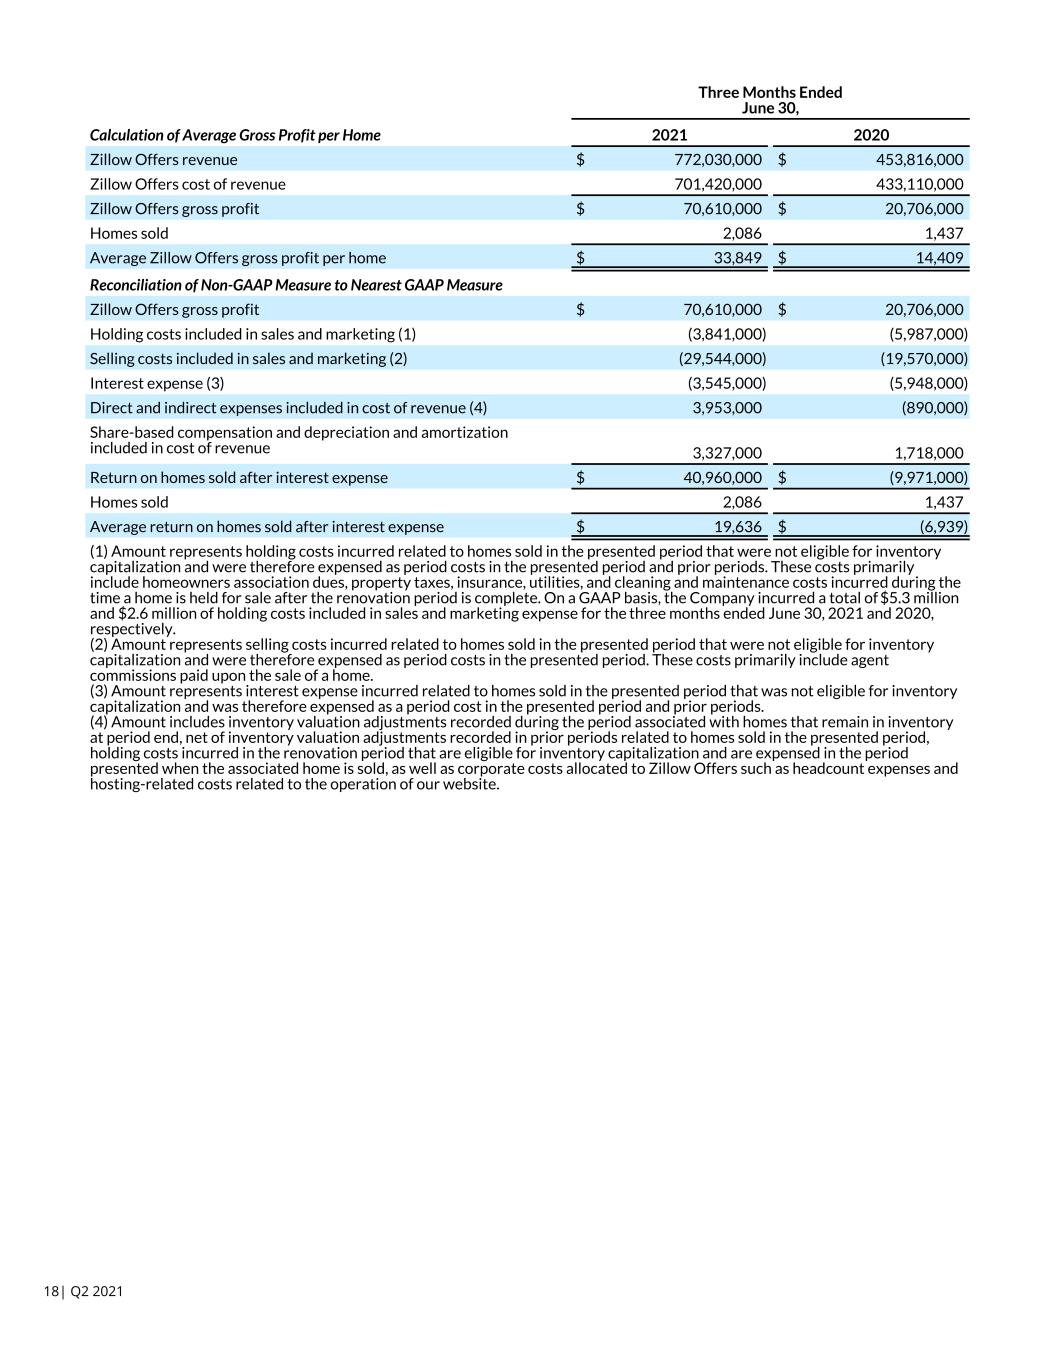

 
Three Months Ended June 30, Calculation of Average Gross Profit per Home 2021 2020 Zillow Offers revenue $ 772,030,000 $ 453,816,000 Zillow Offers cost of revenue 701,420,000 433,110,000 Zillow Offers gross profit $ 70,610,000 $ 20,706,000 Homes sold 2,086 1,437 Average Zillow Offers gross profit per home $ 33,849 $ 14,409 Reconciliation of Non-GAAP Measure to Nearest GAAP Measure Zillow Offers gross profit $ 70,610,000 $ 20,706,000 Holding costs included in sales and marketing (1) (3,841,000) (5,987,000) Selling costs included in sales and marketing (2) (29,544,000) (19,570,000) Interest expense (3) (3,545,000) (5,948,000) Direct and indirect expenses included in cost of revenue (4) 3,953,000 (890,000) Share-based compensation and depreciation and amortization included in cost of revenue 3,327,000 1,718,000 Return on homes sold after interest expense $ 40,960,000 $ (9,971,000) Homes sold 2,086 1,437 Average return on homes sold after interest expense $ 19,636 $ (6,939) (1) Amount represents holding costs incurred related to homes sold in the presented period that were not eligible for inventory capitalization and were therefore expensed as period costs in the presented period and prior periods. These costs primarily include homeowners association dues, property taxes, insurance, utilities, and cleaning and maintenance costs incurred during the time a home is held for sale after the renovation period is complete. On a GAAP basis, the Company incurred a total of $5.3 million and $2.6 million of holding costs included in sales and marketing expense for the three months ended June 30, 2021 and 2020, respectively. (2) Amount represents selling costs incurred related to homes sold in the presented period that were not eligible for inventory capitalization and were therefore expensed as period costs in the presented period. These costs primarily include agent commissions paid upon the sale of a home. (3) Amount represents interest expense incurred related to homes sold in the presented period that was not eligible for inventory capitalization and was therefore expensed as a period cost in the presented period and prior periods. (4) Amount includes inventory valuation adjustments recorded during the period associated with homes that remain in inventory at period end, net of inventory valuation adjustments recorded in prior periods related to homes sold in the presented period, holding costs incurred in the renovation period that are eligible for inventory capitalization and are expensed in the period presented when the associated home is sold, as well as corporate costs allocated to Zillow Offers such as headcount expenses and hosting-related costs related to the operation of our website. 18| Q2 2021
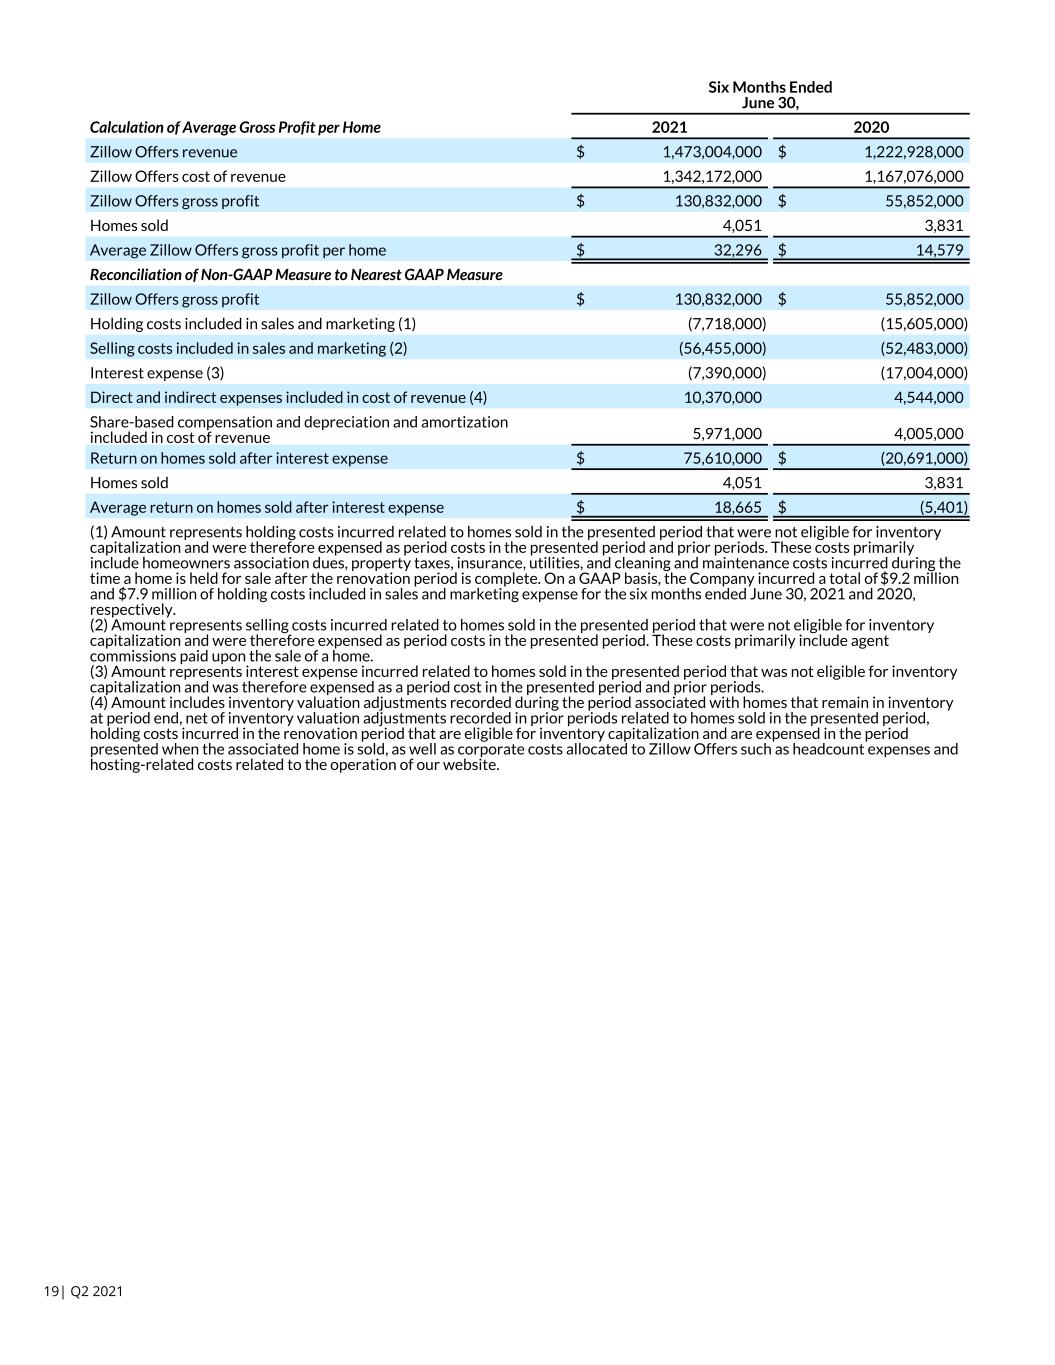

 
Six Months Ended June 30, Calculation of Average Gross Profit per Home 2021 2020 Zillow Offers revenue $ 1,473,004,000 $ 1,222,928,000 Zillow Offers cost of revenue 1,342,172,000 1,167,076,000 Zillow Offers gross profit $ 130,832,000 $ 55,852,000 Homes sold 4,051 3,831 Average Zillow Offers gross profit per home $ 32,296 $ 14,579 Reconciliation of Non-GAAP Measure to Nearest GAAP Measure Zillow Offers gross profit $ 130,832,000 $ 55,852,000 Holding costs included in sales and marketing (1) (7,718,000) (15,605,000) Selling costs included in sales and marketing (2) (56,455,000) (52,483,000) Interest expense (3) (7,390,000) (17,004,000) Direct and indirect expenses included in cost of revenue (4) 10,370,000 4,544,000 Share-based compensation and depreciation and amortization included in cost of revenue 5,971,000 4,005,000 Return on homes sold after interest expense $ 75,610,000 $ (20,691,000) Homes sold 4,051 3,831 Average return on homes sold after interest expense $ 18,665 $ (5,401) (1) Amount represents holding costs incurred related to homes sold in the presented period that were not eligible for inventory capitalization and were therefore expensed as period costs in the presented period and prior periods. These costs primarily include homeowners association dues, property taxes, insurance, utilities, and cleaning and maintenance costs incurred during the time a home is held for sale after the renovation period is complete. On a GAAP basis, the Company incurred a total of $9.2 million and $7.9 million of holding costs included in sales and marketing expense for the six months ended June 30, 2021 and 2020, respectively. (2) Amount represents selling costs incurred related to homes sold in the presented period that were not eligible for inventory capitalization and were therefore expensed as period costs in the presented period. These costs primarily include agent commissions paid upon the sale of a home. (3) Amount represents interest expense incurred related to homes sold in the presented period that was not eligible for inventory capitalization and was therefore expensed as a period cost in the presented period and prior periods. (4) Amount includes inventory valuation adjustments recorded during the period associated with homes that remain in inventory at period end, net of inventory valuation adjustments recorded in prior periods related to homes sold in the presented period, holding costs incurred in the renovation period that are eligible for inventory capitalization and are expensed in the period presented when the associated home is sold, as well as corporate costs allocated to Zillow Offers such as headcount expenses and hosting-related costs related to the operation of our website. 19| Q2 2021
