z-20200806
false000161764000016176402020-08-062020-08-060001617640us-gaap:CommonClassAMember2020-08-062020-08-060001617640us-gaap:CommonClassCMember2020-08-062020-08-06


UNITED STATES
SECURITIES AND EXCHANGE COMMISSION
Washington, D.C. 20549
FORM 8-K
CURRENT REPORT
Pursuant to Section 13 or 15(d)
of the Securities Exchange Act of 1934
Date of Report (Date of Earliest Event Reported): August 6, 2020
ZILLOW GROUP, INC.
(Exact name of registrant as specified in its charter)

Washington 001-36853 47-1645716
(State or other jurisdiction
of incorporation)
 (Commission
File Number)
 (I.R.S. Employer
Identification No.)
1301 Second Avenue, Floor 31, Seattle, Washington
 98101
(Address of principal executive offices) (Zip Code)
(206) 470-7000
(Registrant’s telephone number, including area code)

Check the appropriate box below if the Form 8-K filing is intended to simultaneously satisfy the filing obligation of the registrant under any of the following provisions:

Written communications pursuant to Rule 425 under the Securities Act (17 CFR 230.425)
Soliciting material pursuant to Rule 14a-12 under the Exchange Act (17 CFR 240.14a-12)
Pre-commencement communications pursuant to Rule 14d-2(b) under the Exchange Act (17 CFR 240.14d-2(b))
Pre-commencement communications pursuant to Rule 13e-4(c) under the Exchange Act (17 CFR 240.13e-4(c))

Securities registered pursuant to Section 12(b) of the Act:
Title of each classTrading Symbol(s)Name of each exchange on which registered
Class A Common Stock, par value $0.0001 per shareZGThe Nasdaq Global Select Market
Class C Capital Stock, par value $0.0001 per shareZThe Nasdaq Global Select Market
Indicate by check mark whether the registrant is an emerging growth company as defined in Rule 405 of the Securities Act of 1933 (§230.405 of this chapter) or Rule 12b-2 of the Securities Exchange Act of 1934 (§240.12b-2 of this chapter).
Emerging growth company     
If an emerging growth company, indicate by check mark if the registrant has elected not to use the extended transition period for complying with any new or revised financial accounting standards provided pursuant to Section 13(a) of the Exchange Act.    ☐


Item 2.02Results of Operations and Financial Condition.
Zillow Group, Inc. (“Zillow Group”) today issued a press release and a shareholder letter announcing its financial results for the fiscal quarter ended June 30, 2020. The full text of the press release issued in connection with the announcement is furnished as Exhibit 99.1, accompanying supporting tables as Exhibit 99.2 and the shareholder letter as Exhibit 99.3 to this Current Report on Form 8-K.
The information in this Item 2.02 and Exhibits 99.1, 99.2 and 99.3 of this Current Report on Form 8-K shall not be deemed to be “filed” for purposes of Section 18 of the Securities Exchange Act of 1934, as amended (the “Exchange Act”), or otherwise subject to the liabilities of that section, nor shall it be deemed incorporated by reference into any filing under the Securities Act of 1933, as amended, or the Exchange Act, except as expressly set forth by specific reference in such a filing.

Item 9.01Financial Statements and Exhibits.
(d) Exhibits.
 
Exhibit
Number
  Description
99.1
99.2
99.3
104Cover Page Interactive Data File (embedded within the Inline XBRL document).


SIGNATURES
Pursuant to the requirements of the Securities Exchange Act of 1934, the registrant has duly caused this report to be signed on its behalf by the undersigned hereunto duly authorized.
 
Dated: August 6, 2020 ZILLOW GROUP, INC.
 By:
/s/ JENNIFER ROCK
 Name:Jennifer Rock
 Title:Chief Accounting Officer


Exhibit 99.1

zglogoa0411.jpg 
Contacts:
Brad Berning
Investor Relations
[email protected]
Emily Heffter
Public Relations
[email protected]


Zillow Group Reports Second Quarter 2020 Financial Results


SEATTLE – August 6, 2020 – Zillow Group, Inc. (NASDAQ:Z) (NASDAQ:ZG), which is transforming the way people buy, sell, rent and finance homes, today announced its consolidated financial results for the three months ended June 30, 2020. The company’s consolidated quarterly revenue grew 28% year over year to $768 million, driven primarily by a continued increase in Zillow Offers resale volume.

Complete financial results and outlook for the third quarter of 2020 can be found in our shareholder letter on the investor relations section of Zillow Group’s website at https://investors.zillowgroup.com/investors/financials/quarterly-results/default.aspx.

“Zillow’s second quarter results are even better than we had hoped, and firm up our belief that powerful tailwinds in both real estate and technology are rapidly converging, with Zillow at the nexus,” said Zillow Group co-founder and CEO Rich Barton. “I believe we are at the dawn of a Great Reshuffling, as COVID and work-from-home policies are inspiring people to rethink their homes and consider moving. In addition, real estate, like other industries, is experiencing an acceleration in technology adoption, as people move their shopping habits from offline to online. We’re lucky to be in a position to serve our customers no matter how they want to move, whether through a seamless Zillow Offers transaction or in partnership with our best-in-class Premier Agents.

“Even more important than the business results is the way our team has responded over the past several months, as we all grapple with fear, loss, protest, and anger through a health crisis and social reckoning. We’ve managed through all of this with a strong commitment that we can and will do more to support our communities and address systemic barriers in real estate.”

Second quarter 2020 highlights include:
Total consolidated revenue grew 28% year over year to $768 million.
Segment income (loss) before income taxes was $19 million, $(80) million and $(0.2) million for the IMT, Homes, and Mortgages segments, respectively, and consolidated GAAP net loss was $(84) million.
Adjusted EBITDA beat company expectations on a consolidated basis and for all three segments.
Premier Agent year-over-year revenue decreased 17% to $192 million, primarily due to the impact of COVID-19-related discounts offered to our Premier Agent partners.


The Homes segment delivered $454 million in revenue. Our resale strategies combined with the resilient housing market delivered higher Homes segment revenue, better segment Adjusted EBITDA and lower ending inventory than expected.
Zillow Offers entered Q2 with home acquisitions temporarily paused due to market uncertainty. During the quarter, the company sold 1,437 homes and purchased 86 homes through Zillow Offers, ending Q2 with 440 homes in inventory. Zillow Offers is now actively purchasing homes in all 24 markets where it previously operated.
Traffic to Zillow Group’s mobile apps and websites reached a record 218 million average monthly unique users, an increase of 12% year over year, driving 2.5 billion visits during the quarter.
The company exited the quarter with the highest cash balance in its history, growing cash and investments to $3.5 billion from $2.6 billion at the end of Q1 2020. We further strengthened our balance sheet in Q2 by completing nearly $1 billion in capital transactions with a combination convertible debt and equity offering.


Second Quarter 2020 Financial Highlights
The following table sets forth Zillow Group’s financial highlights for the periods presented (in thousands, unaudited):
 Three Months Ended
June 30,
2019 to 2020
% Change
Six Months Ended
June 30,
2019 to 2020
% Change
 2020201920202019
Revenue:
Homes segment:
Zillow Offers
$453,816  $248,924  82%$1,222,928  $377,396  224%
Other (1)
436  —  N/A1,197  —  N/A
Total Homes segment revenue454,252  248,924  82%1,224,125  377,396  224%
IMT segment:
Premier Agent
191,962  231,961  (17)%434,068  449,696  (3)%
Other (2)
88,377  91,708  (4)%176,937  172,245  3%
Total IMT segment revenue280,339  323,669  (13)%611,005  621,941  (2)%
Mortgages segment33,761  26,985  25%59,043  54,345  9%
Total revenue$768,352  $599,578  28%$1,894,173  $1,053,682  80%
Other Financial Data:
Segment income (loss) before income taxes:
Homes segment
$(80,058) $(71,122) $(178,016) $(116,327) 
IMT segment
19,166  13,238  (22,341) 1,786  
Mortgages segment
(240) (10,438) (13,385) (20,054) 
Total segment loss before income taxes$(61,132) $(68,322) $(213,742) $(134,595) 
Net loss$(84,448) $(71,977) $(247,721) $(139,502) 
Adjusted EBITDA (3):
Homes segment
$(60,908) $(56,452) $(135,903) $(90,976) 
IMT segment
71,862  64,055  157,579  125,102  
Mortgages segment
4,885  (5,306) (718) (7,907) 
Total Adjusted EBITDA$15,839  $2,297  $20,958  $26,219  
Percentage of Revenue:
Segment income (loss) before income taxes:
Homes segment
(18)%(29)%(15)%(31)%
IMT segment
  (4) —  
Mortgages segment
(1) (39) (23) (37) 
Total segment loss before income taxes(8)%(11)%(11)%(13)%
Net loss(11)%(12)%(13)%(13)%
Adjusted EBITDA:
Homes segment
(13)%(23)%(11)%(24)%
IMT segment
26  20  26  20  
Mortgages segment
14  (20) (1) (15) 
Total Adjusted EBITDA%— %%%
(1) Other Homes segment revenue includes revenue generated through Zillow Closing Services.
(2) Other IMT segment revenue includes revenue generated by rentals, new construction and display, as well as revenue from the sale of various other marketing and business products and services to real estate professionals.
(3) Adjusted EBITDA is a non-GAAP financial measure; it is not calculated or presented in accordance with U.S. generally accepted accounting principles, or GAAP. See below for more information regarding our presentation of Adjusted EBITDA, including a reconciliation of Adjusted EBITDA to the most directly comparable GAAP financial measure, which is net loss on a consolidated basis and income (loss) before income taxes for each segment, for each of the periods presented.


Conference Call and Webcast Information
Zillow Group CEO & co-founder Rich Barton and CFO Allen Parker will host a live conference call to discuss the results today at 2 p.m. Pacific Time (5 p.m. Eastern Time). A Shareholder Letter and link to both the live webcast and recorded replay of the call may be accessed on the Quarterly Results section of Zillow Group’s investor relations website. To dial into the live call, please register in advance at: http://www.directeventreg.com/registration/event/4760225 using conference ID 4760225. After registering, instructions on how to join the live call will be emailed to you. At the time of the call, participants will dial in using the instructions provided in the confirmation email. This new process is designed to reduce potential delays due to operator congestion when accessing the live call.
Forward-Looking Statements
This press release contains forward-looking statements within the meaning of Section 27A of the Securities Act of 1933 and Section 21E of the Securities Exchange Act of 1934 that involve risks and uncertainties, including, without limitation, statements regarding the future performance and operation of our business and the current and future health and stability of the residential housing market and economy and our expectations regarding future shifts in behavior by consumers and employees. Statements containing words such as “may,” “believe,” “anticipate,” “expect,” “intend,” “plan,” “project,” “predict,” “will,” “projections,” “continue,” “estimate,” “outlook,” “guidance,” or similar expressions constitute forward-looking statements. Forward-looking statements are made based on assumptions as of August 6, 2020, and although we believe the expectations reflected in the forward-looking statements are reasonable, we cannot guarantee these results. Differences in Zillow Group’s actual results from those described in these forward-looking statements may result from actions taken by Zillow Group as well as from risks and uncertainties beyond Zillow Group’s control. Factors that may contribute to such differences include, but are not limited to, the impact of the novel coronavirus (“COVID-19”) pandemic and any associated economic downturn on Zillow Group’s future financial position, operations and financial performance; the magnitude, duration and severity of the COVID-19 pandemic; the current and future health and stability of the economy and residential housing market, including any extended slowdown in the real estate markets as a result of COVID-19; Zillow Group’s ability to execute on strategy; Zillow Group’s ability to maintain and effectively manage an adequate rate of growth; Zillow Group’s ability to innovate and provide products and services that are attractive to its users and advertisers; Zillow Group’s investment of resources to pursue strategies that may not prove effective; Zillow Group’s ability to compete successfully against existing or future competitors; the impact of pending or future legal proceedings, including those described in Zillow Group’s filings with the Securities and Exchange Commission, or SEC; Zillow Group’s ability to successfully integrate and realize the benefits of its past or future strategic acquisitions or investments; Zillow Group’s ability to maintain or establish relationships with listings and data providers; the reliable performance of Zillow Group’s network infrastructure and content delivery processes; Zillow Group’s ability to obtain or maintain licenses and permits to support our current and future businesses; actual or anticipated changes to our products and services; and Zillow Group’s ability to protect its intellectual property. The foregoing list of risks and uncertainties is illustrative but not exhaustive. For more information about potential factors that could affect Zillow Group’s business and financial results, please review the “Risk Factors” described in Zillow Group’s Annual Report on Form 10-K for the year ended December 31, 2019 and in Zillow Group’s Quarterly Report on Form 10-Q for the three months ended June 30, 2020 filed with the SEC and in Zillow Group’s other filings with the SEC. Except as may be required by law, Zillow Group does not intend and undertakes no duty to update this information to reflect future events or circumstances.
Use of Non-GAAP Financial Measures
To provide investors with additional information regarding our financial results, this press release includes references to Adjusted EBITDA in total and for each segment, each a non-GAAP financial measure. We have provided a reconciliation within this earnings release of Adjusted EBITDA in total to net loss and Adjusted EBITDA by segment to income (loss) before income taxes for each segment, the most directly comparable GAAP financial measures.
Adjusted EBITDA is a key metric used by our management and board of directors to measure operating performance and trends and to prepare and approve our annual budget. In particular, the exclusion of certain expenses in calculating Adjusted EBITDA facilitates operating performance comparisons on a period-to-period basis.
Our use of Adjusted EBITDA in total and for each segment has limitations as an analytical tool, and you should not consider these measures in isolation or as a substitute for analysis of our results as reported under GAAP. Some of these limitations are:
Adjusted EBITDA does not reflect our cash expenditures or future requirements for capital expenditures or contractual commitments;
Adjusted EBITDA does not reflect changes in, or cash requirements for, our working capital needs;


Adjusted EBITDA does not consider the potentially dilutive impact of share-based compensation;
Although depreciation and amortization are non-cash charges, the assets being depreciated and amortized may have to be replaced in the future, and Adjusted EBITDA does not reflect cash capital expenditure requirements for such replacements or for new capital expenditure requirements;
Adjusted EBITDA does not reflect impairment costs;
Adjusted EBITDA does not reflect the gain on the partial extinguishment of the 2021 Notes;
Adjusted EBITDA does not reflect interest expense or other income;
Adjusted EBITDA does not reflect income taxes; and
Other companies, including companies in our own industry, may calculate Adjusted EBITDA differently than we do, limiting its usefulness as a comparative measure.
Because of these limitations, you should consider Adjusted EBITDA in total and for each segment alongside other financial performance measures, including various cash flow metrics, net loss, and income (loss) before income taxes for each segment and our other GAAP results.
About Zillow Group, Inc.
Zillow Group, Inc. (NASDAQ:Z) (NASDAQ:ZG), the largest portfolio of real estate brands on mobile and the web that attracted 218 million average monthly unique users during the second quarter of 2020, is building a trusted, on-demand real estate experience. Whether selling, buying, renting or financing, customers can turn to the Zillow family of businesses to find and get into their next home with speed, certainty and ease.
In addition to Zillow’s for-sale and rental listings, Zillow Offers™ buys and sells homes directly in dozens of markets across the country, allowing sellers control over their timeline. Zillow Closing Services offers customers title and escrow services to support a more seamless transaction experience. Zillow Home Loans, our affiliate lender, provides our customers with an easy option to get pre-approved and secure financing for their next home purchase.
Other consumer brands include Trulia®, StreetEasy®, HotPads®, Naked Apartments® and Out East®. In addition, Zillow Group provides a comprehensive suite of marketing software and technology solutions which include Mortech®, dotloop®, Bridge Interactive® and New Home Feed®. The company is headquartered in Seattle, Washington.
Please visit http://investors.zillowgroup.com, www.zillowgroup.com/ir-blog, and www.twitter.com/zillowgroup, where Zillow Group discloses information about the company, its financial information, and its business which may be deemed material.
The Zillow Group logo is available at http://zillowgroup.mediaroom.com/logos-photos.
Zillow, Premier Agent, Mortech, Bridge Interactive, StreetEasy, HotPads, Out East and New Home Feed are registered trademarks of Zillow, Inc. Zillow Offers is a trademark of Zillow, Inc. Trulia is a registered trademark of Trulia, LLC. dotloop is a registered trademark of DotLoop, LLC. Naked Apartments is a registered trademark of Naked Apartments, LLC. Zillow Home Loans, LLC is an Equal Housing Lender; NMLS #10287.
(ZFIN)


Adjusted EBITDA
The following tables set forth a reconciliation of Adjusted EBITDA to the most directly comparable GAAP financial measure, which is net loss on a consolidated basis and income (loss) before income taxes for each segment, for each of the periods presented (in thousands, unaudited):
 Three Months Ended June 30, 2020
HomesIMTMortgagesCorporate Items (2)Consolidated
Reconciliation of Adjusted EBITDA to Net Loss and Income (Loss) Before Income Taxes:
Net loss (1)N/AN/AN/AN/A$(84,448) 
Income tax expenseN/AN/AN/AN/A679  
Income (loss) before income taxes$(80,058) $19,166  $(240) $(22,637) $(83,769) 
Other income—  (5,300) (385) (4,430) (10,115) 
Depreciation and amortization expense2,597  22,038  1,538  —  26,173  
Share-based compensation expense12,728  35,958  3,665  —  52,351  
Gain on partial extinguishment of 2021 Notes—  —  —  (6,391) (6,391) 
Interest expense3,825  —  307  33,458  37,590  
Adjusted EBITDA$(60,908) $71,862  $4,885  $—  $15,839  

 Three Months Ended June 30, 2019
HomesIMTMortgagesCorporate Items (2)Consolidated
Reconciliation of Adjusted EBITDA to Net Loss and Income (Loss) Before Income Taxes:
Net loss (1)N/AN/AN/AN/A$(71,977) 
Income tax benefitN/AN/AN/AN/A—  
Income (loss) before income taxes$(71,122) $13,238  $(10,438) $(3,655) $(71,977) 
Other income—  —  (402) (9,056) (9,458) 
Depreciation and amortization expense1,732  18,308  1,163  —  21,203  
Share-based compensation expense7,039  32,509  4,084  —  43,632  
Interest expense5,899  —  287  12,711  18,897  
Adjusted EBITDA$(56,452) $64,055  $(5,306) $—  $2,297  


 Six Months Ended June 30, 2020
HomesIMTMortgagesCorporate Items (2)Consolidated
Reconciliation of Adjusted EBITDA to Net Loss and Loss Before Income Taxes:
Net loss (1)N/AN/AN/AN/A$(247,721) 
Income tax benefitN/AN/AN/AN/A(8,549) 
Loss before income taxes$(178,016) $(22,341) $(13,385) $(42,528) $(256,270) 
Other income—  (5,300) (587) (13,821) (19,708) 
Depreciation and amortization expense6,172  45,815  3,212  —  55,199  
Share-based compensation expense24,032  65,505  6,609  —  96,146  
Gain on partial extinguishment of 2021 Notes—  —  —  (6,391) (6,391) 
Impairment costs—  73,900  2,900  —  76,800  
Interest expense11,909  —  533  62,740  75,182  
Adjusted EBITDA$(135,903) $157,579  $(718) $—  $20,958  

 Six Months Ended June 30, 2019
HomesIMTMortgagesCorporate Items (2)Consolidated
Reconciliation of Adjusted EBITDA to Net Loss and Income (Loss) Before Income Taxes:
Net loss (1)N/AN/AN/AN/A$(139,502) 
Income tax benefitN/AN/AN/AN/A(2,500) 
Income (loss) before income taxes$(116,327) $1,786  $(20,054) $(7,407) $(142,002) 
Other income—  —  (715) (17,911) (18,626) 
Depreciation and amortization expense3,053  35,902  2,773  —  41,728  
Share-based compensation expense12,641  87,414  9,701  —  109,756  
Interest expense9,657  —  388  25,318  35,363  
Adjusted EBITDA$(90,976) $125,102  $(7,907) $—  $26,219  
(1) We use income (loss) before income taxes as our profitability measure in making operating decisions and assessing the performance of our segments, therefore, net loss and income tax benefit (expense) are calculated and presented only on a consolidated basis within our financial statements.
(2) Certain corporate items are not directly attributable to any of our segments, including the gain on the partial extinguishment of the 2021 Notes, interest income earned on our short-term investments included in Other income and interest costs on our convertible senior notes included in Interest expense.


Exhibit 99.2


Reported Consolidated Results

ZILLOW GROUP, INC.
UNAUDITED CONDENSED CONSOLIDATED BALANCE SHEETS
(in thousands)
June 30, 2020December 31, 2019
Assets
Current assets:
Cash and cash equivalents$2,045,474  $1,141,263  
Short-term investments
1,491,167  1,280,989  
Accounts receivable, net
66,878  67,005  
Mortgage loans held for sale75,021  36,507  
Inventory135,401  836,627  
Prepaid expenses and other current assets56,373  58,117  
Restricted cash33,620  89,646  
Total current assets3,903,934  3,510,154  
Contract cost assets47,747  45,209  
Property and equipment, net195,747  170,489  
Right of use assets199,422  212,153  
Goodwill1,984,907  1,984,907  
Intangible assets, net106,990  190,567  
Other assets11,041  18,494  
Total assets$6,449,788  $6,131,973  
Liabilities and shareholders’ equity
Current liabilities:
Accounts payable$14,307  $8,343  
Accrued expenses and other current liabilities74,646  85,442  
Accrued compensation and benefits34,520  37,805  
Borrowings under credit facilities187,032  721,951  
Deferred revenue44,514  39,747  
Lease liabilities, current portion22,789  17,592  
Convertible senior notes, current portion9,637  9,637  
Total current liabilities387,445  920,517  
Lease liabilities, net of current portion214,752  220,445  
Convertible senior notes, net of current portion1,810,341  1,543,402  
Deferred tax liabilities and other long-term liabilities14,192  12,188  
Total liabilities2,426,730  2,696,552  
Shareholders’ equity:
Class A common stock
  
Class B common stock
  
Class C capital stock
16  14  
Additional paid-in capital5,246,371  4,412,200  
Accumulated other comprehensive income1,525  340  
Accumulated deficit(1,224,861) (977,140) 
Total shareholders’ equity4,023,058  3,435,421  
Total liabilities and shareholders’ equity$6,449,788  $6,131,973  


ZILLOW GROUP, INC.
UNAUDITED CONDENSED CONSOLIDATED STATEMENTS OF OPERATIONS
(in thousands, except per share data)
 Three Months Ended
June 30,
Six Months Ended
June 30,
 2020201920202019
Revenue:
Homes$454,252  $248,924  $1,224,125  $377,396  
IMT280,339  323,669  611,005  621,941  
Mortgages33,761  26,985  59,043  54,345  
Total revenue768,352  599,578  1,894,173  1,053,682  
Cost of revenue (exclusive of amortization) (1)(2):
Homes431,788  240,732  1,163,987  363,151  
IMT23,387  26,059  47,705  50,310  
Mortgages 5,896  4,430  11,051  9,108  
Total cost of revenue461,071  271,221  1,222,743  422,569  
Sales and marketing (2)155,598  187,433  360,246  349,020  
Technology and development (2)128,857  120,330  263,775  228,100  
General and administrative (2)85,511  82,839  177,796  178,613  
Impairment costs—  —  76,800  —  
Integration costs—  293  —  645  
Total costs and expenses831,037  662,116  2,101,360  1,178,947  
Loss from operations(62,685) (62,538) (207,187) (125,265) 
Gain on partial extinguishment of 2021 Notes6,391  —  6,391  —  
Other income10,115  9,458  19,708  18,626  
Interest expense(37,590) (18,897) (75,182) (35,363) 
Loss before income taxes(83,769) (71,977) (256,270) (142,002) 
Income tax benefit (expense)(679) —  8,549  2,500  
Net loss$(84,448) $(71,977) $(247,721) $(139,502) 
Net loss per share — basic and diluted$(0.38) $(0.35) $(1.15) $(0.68) 
Weighted-average shares outstanding — basic and diluted219,467  205,754  215,070  205,137  
_________________
(1) Amortization of website development costs and intangible assets included in technology and development
$18,857  $14,656  $36,041  $29,056  
(2) Includes share-based compensation expense as follows:
Cost of revenue$1,119  $936  $2,292  $1,816  
Sales and marketing9,116  6,801  16,109  12,451  
Technology and development21,666  18,399  40,583  33,908  
General and administrative20,450  17,496  37,162  61,581  
Total$52,351  $43,632  $96,146  $109,756  
Other Financial Data:
Segment income (loss) before income taxes:
Homes segment$(80,058) $(71,122) $(178,016) $(116,327) 
IMT segment19,166  13,238  (22,341) 1,786  
Mortgages segment(240) (10,438) (13,385) (20,054) 
Total segment loss before income taxes$(61,132) $(68,322) $(213,742) $(134,595) 
Adjusted EBITDA (3):
Homes segment$(60,908) $(56,452) $(135,903) $(90,976) 
IMT segment71,862  64,055  157,579  125,102  
Mortgages segment4,885  (5,306) (718) (7,907) 
Total Adjusted EBITDA$15,839  $2,297  $20,958  $26,219  
(3) Adjusted EBITDA is a non-GAAP financial measure; it is not calculated or presented in accordance with U.S. generally accepted accounting principles, or GAAP. See Exhibit 99.1 for more information regarding our presentation of Adjusted EBITDA and for a reconciliation of Adjusted EBITDA to net loss on a consolidated basis and income (loss) before income taxes for each segment, the most directly comparable GAAP financial measures, for each of the periods presented.


ZILLOW GROUP, INC.
UNAUDITED CONDENSED CONSOLIDATED STATEMENTS OF CASH FLOWS
(in thousands)
 Six Months Ended
June 30,
 20202019
Operating activities
Net loss$(247,721) $(139,502) 
Adjustments to reconcile net loss to net cash provided by (used in) operating activities:
Depreciation and amortization55,199  41,728  
Share-based compensation expense96,146  109,756  
Amortization of right of use assets12,731  10,572  
Amortization of contract cost assets17,070  17,880  
Amortization of discount and issuance costs on convertible senior notes maturing in 2021, 2023, 2024, 2025 and 202647,746  17,799  
Gain on partial extinguishment of 2021 Notes(6,391) —  
Impairment costs76,800  —  
Deferred income taxes(8,549) (2,500) 
(Gain) loss on disposal of property and equipment and other assets(2,658) 3,878  
Credit loss expense1,614  706  
Net loss on investment securities372  —  
Accretion of bond discount(303) (3,695) 
Changes in operating assets and liabilities:
Accounts receivable(1,487) (16,884) 
Mortgage loans held for sale(38,514) (3,244) 
Inventory701,145  (389,994) 
Prepaid expenses and other assets(771) (2,015) 
Lease liabilities(495) (11,946) 
Contract cost assets(19,608) (18,332) 
Accounts payable7,504  1,256  
Accrued expenses and other current liabilities(8,741) 6,952  
Accrued compensation and benefits(3,285) 613  
Deferred revenue4,767  3,000  
Other long-term liabilities10,049  149  
Net cash provided by (used in) operating activities692,620  (373,823) 
Investing activities
Proceeds from maturities of investments701,266  539,312  
Proceeds from sales of investments116,394  —  
Purchases of investments(1,026,233) (302,891) 
Purchases of property and equipment(54,653) (29,672) 
Purchases of intangible assets(11,408) (8,927) 
Proceeds from sale of equity investment10,000  —  
Net cash provided by (used in) investing activities(264,634) 197,822  
Financing activities
Proceeds from issuance of 2025 Notes, net of issuance costs553,282  —  
Proceeds from issuance of Class C capital stock, net of issuance costs411,522  —  
Partial extinguishment of 2021 Notes(194,670) —  
Proceeds from borrowings on credit facilities43,200  293,099  
Repayments of borrowings on credit facilities(617,506) —  
Net borrowings (repayments) on warehouse lines of credit and repurchase agreement39,387  (2,961) 
Proceeds from exercise of stock options184,984  32,997  
Value of equity awards withheld for tax liability—   
Net cash provided by financing activities420,199  323,138  
Net increase in cash, cash equivalents and restricted cash during period848,185  147,137  
Cash, cash equivalents and restricted cash at beginning of period1,230,909  663,443  
Cash, cash equivalents and restricted cash at end of period$2,079,094  $810,580  
Supplemental disclosures of cash flow information
Cash paid for interest$29,201  $16,616  
Noncash transactions:
Capitalized share-based compensation$8,490  $5,878  
Write-off of fully depreciated property and equipment$6,942  $9,867  
Write-off of fully amortized intangible assets$—  $3,311  
Property and equipment purchased on account$5,305  $2,408  


Non-GAAP Net Loss per Share
Our presentation of non-GAAP net loss per share excludes the impact of share-based compensation expense, impairment costs, the gain on the partial extinguishment of the 2021 Notes and income taxes. This measure is not a key metric used by our management and board of directors to measure operating performance or otherwise manage the business. However, we provide non-GAAP net loss per share as supplemental information to investors, as we believe the exclusion of share-based compensation expense, impairment costs, the gain on the partial extinguishment of the 2021 Notes and income taxes facilitates investors’ operating performance comparisons on a period-to-period basis. You should not consider non-GAAP net loss per share in isolation or as a substitute for analysis of our results as reported under GAAP.

The following table sets forth a reconciliation of non-GAAP net loss, adjusted, to net loss, as reported on a GAAP basis, and the calculation of non-GAAP net loss per share - basic and diluted, for each of the periods presented (in thousands, except per share data, unaudited):
Three Months Ended
June 30,
Six Months Ended
June 30,
 2020201920202019
Net loss, as reported$(84,448) $(71,977) $(247,721) $(139,502) 
Share-based compensation expense52,351  43,632  96,146  109,756  
Impairment costs—  —  76,800  —  
Gain on partial extinguishment of 2021 Notes(6,391) —  (6,391) —  
Income tax expense (benefit) 679  —  (8,549) (2,500) 
Net loss, adjusted$(37,809) $(28,345) $(89,715) $(32,246) 
Non-GAAP net loss per share — basic and diluted$(0.17) $(0.14) $(0.42) $(0.16) 
Weighted-average shares outstanding — basic and diluted219,467  205,754  215,070  205,137  

Segment Results of Operations
The following tables present our segment results for the periods presented (in thousands, unaudited):
 Three Months Ended
June 30, 2020
Three Months Ended
June 30, 2019
HomesIMTMortgagesHomesIMTMortgages
Revenue$454,252  $280,339  $33,761  $248,924  $323,669  $26,985  
Costs and expenses:
Cost of revenue431,788  23,387  5,896  240,732  26,059  4,430  
Sales and marketing47,877  96,026  11,695  37,409  135,440  14,584  
Technology and development28,918  93,176  6,763  18,198  94,261  7,871  
General and administrative21,902  53,884  9,725  17,808  54,671  10,360  
Integration costs—  —  —  —  —  293  
Total costs and expenses530,485  266,473  34,079  314,147  310,431  37,538  
Income (loss) from operations(76,233) 13,866  (318) (65,223) 13,238  (10,553) 
Segment other income—  5,300  385  —  —  402  
Segment interest expense (3,825) —  (307) (5,899) —  (287) 
Income (loss) before income taxes (1)$(80,058) $19,166  $(240) $(71,122) $13,238  $(10,438) 


 Six Months Ended
June 30, 2020
Six Months Ended
June 30, 2019
HomesIMTMortgagesHomesIMTMortgages
Revenue$1,224,125  $611,005  $59,043  $377,396  $621,941  $54,345  
Costs and expenses:
Cost of revenue1,163,987  47,705  11,051  363,151  50,310  9,108  
Sales and marketing119,466  216,199  24,581  58,271  262,094  28,655  
Technology and development61,456  188,204  14,115  30,479  182,230  15,391  
General and administrative45,323  112,638  19,835  32,165  125,521  20,927  
Impairment costs—  73,900  2,900  —  —  —  
Integration costs—  —  —  —  —  645  
Total costs and expenses1,390,232  638,646  72,482  484,066  620,155  74,726  
Income (loss) from operations(166,107) (27,641) (13,439) (106,670) 1,786  (20,381) 
Segment other income—  5,300  587  —  —  715  
Segment interest expense (11,909) —  (533) (9,657) —  (388) 
Income (loss) before income taxes (1)$(178,016) $(22,341) $(13,385) $(116,327) $1,786  $(20,054) 
(1) The following table presents the reconciliation of total segment loss before income taxes to consolidated loss before income taxes for the periods presented (in thousands):
Three Months Ended
June 30,
Six Months Ended
June 30,
2020201920202019
Total segment loss before income taxes$(61,132) $(68,322) $(213,742) $(134,595) 
Corporate interest expense(33,458) (12,711) (62,740) (25,318) 
Corporate other income4,430  9,056  13,821  17,911  
Gain on partial extinguishment of 2021 Notes6,391  —  6,391  —  
Consolidated loss before income taxes$(83,769) $(71,977) $(256,270) $(142,002) 
Certain corporate items are not directly attributable to any of our segments, including the gain on the partial extinguishment of the 2021 Notes, interest income earned on our short-term investments included in Other income and interest costs on our convertible senior notes included in Interest expense.

Key Metrics
The following table sets forth our key metrics for each of the periods presented (in millions):
 Three Months Ended
June 30,
2019 to 2020
% Change
 20202019
  
Visits (1)2,491.1  2,181.4  14 %
Average Monthly Unique Users (2)218.1  194.3  12 %
Number of Homes Sold1,437  786  83 %
(1)Visits includes visits to the Zillow, Trulia and StreetEasy mobile apps and websites. We measure Zillow and StreetEasy visits with Google Analytics and Trulia visits with Adobe Analytics.
(2)Zillow, StreetEasy, HotPads and Naked Apartments measure unique users with Google Analytics, and Trulia measures unique users with Adobe Analytics.


Non-GAAP Average Return on Homes Sold After Interest Expense
To provide investors with additional information regarding our Zillow Offers financial results, this Exhibit includes a calculation of Average Return on Homes Sold After Interest Expense, which is a non-GAAP financial measure. We have provided a reconciliation of Average Return on Homes Sold After Interest Expense to the most directly comparable GAAP financial measure, which is average gross profit per home for the Zillow Offers business.
We believe that Average Return on Homes Sold After Interest Expense is a useful financial measure to investors as it is one of the primary measures used by management in making investment decisions, measuring unit level economics and evaluating operating performance for the Zillow Offers business. The measure is intended to convey the unit level economics of homes sold during the period by presenting the average revenue and associated expenses directly attributed to the homes sold. We believe this average per unit measure facilitates meaningful period over period comparisons notwithstanding variability in the number of homes sold during a period and indicates ability to generate average returns on assets sold after considering home purchase costs, renovation costs, holding costs and selling costs.
We calculate the Average Return on Homes Sold After Interest Expense as revenue associated with homes sold during the period less direct costs attributable to those homes divided by the number of homes sold during the period. Specifically, direct costs include, with respect to each home sold during the period (1) home acquisition and renovation costs, which in turn include certain labor costs directly associated with these activities; (2) holding and selling costs; and (3) interest costs incurred.
Included in direct holding and interest expense amounts for the periods presented are holding and interest costs recorded as period expenses in prior periods associated with homes sold in the presented period, which are not calculated in accordance with, or as an alternative for, GAAP and should not be considered in isolation or as a substitute for results reported under GAAP. Excluded from certain of these direct cost amounts are costs recorded in the presented period related to homes that remain in inventory at the end of the period, as shown in the tables below. We make these period adjustments because we believe presenting Average Return on Homes Sold After Interest Expense in this manner provides a focused view on a subset of our assets - homes sold during the period - and reflecting costs associated with those homes sold from the time we acquire to the time we sell the home, which may be useful to investors.
Average Return on Homes Sold After Interest Expense is intended to illustrate the performance of homes sold during the period and is not intended to be a segment or company performance metric. Average Return on Homes Sold After Interest Expense is a supplemental measure of operating performance for a subset of assets and has limitations as an analytical tool, and you should not consider it in isolation or as a substitute for analysis of our results as reported under GAAP. Some of these limitations are:
Although depreciation and amortization are non-cash charges, the assets being depreciated and amortized may have to be replaced in the future, and Average Return on Homes Sold After Interest Expense does not reflect capital expenditure requirements for such replacements or for new capital expenditure requirements;
Average Return on Homes Sold After Interest Expense does not consider the potentially dilutive impact of share-based compensation;
Average Return on Homes Sold After Interest Expense does not include period costs that were not eligible for inventory capitalization associated with homes held in inventory at the end of the period;
Average Return on Homes Sold After Interest Expense does not reflect indirect expenses included in cost of revenue, sales and marketing, technology and development, or general and administrative expenses, some of which are recurring cash expenditures necessary to operate the business; and
Average Return on Homes Sold After Interest Expense does not reflect income taxes.

On a GAAP basis, Zillow Offers average gross profit per home was $16,551 and $10,422, respectively, for the three months ended June 30, 2020 and 2019.


The following table presents the total return on homes sold after interest expense and the Average Return on Homes Sold After Interest Expense for the periods presented (unaudited):
Three Months Ended
June 30, 2020
Three Months Ended
June 30, 2019
TotalAverage
Per Home
TotalAverage
Per Home
Homes sold1,437  786  
Zillow Offers revenue$453,816,000  $315,808  $248,924,000  $316,697  
Operating costs:
Home acquisition costs (1)409,509,000  284,975  224,955,000  286,202  
Renovation costs (1)22,773,000  15,848  9,484,000  12,066  
Holding costs (1)(2)5,987,000  4,166  2,569,000  3,268  
Selling costs19,570,000  13,619  10,676,000  13,583  
Total operating costs457,839,000  318,608  247,684,000  315,119  
Interest expense (1)(2)5,948,000  4,139  3,532,000  4,494  
Return on homes sold after interest expense$(9,971,000) $(6,939) $(2,292,000) $(2,916) 
(1) Amount excludes expenses incurred during the period that are not related to homes sold during the period.
(2) Holding costs and interest expense include $3.9 million and $3.8 million, respectively, of costs incurred in prior periods associated with homes sold in the second quarter of 2020 and $1.1 million and $1.6 million, respectively, of costs incurred in prior periods associated with homes sold in the second quarter of 2019.


The calculation of Average Return on Homes Sold After Interest Expense includes only those expenses directly attributed to the homes sold during the period. To arrive at return on homes sold after interest expense, the Company deducts from Zillow Offers gross profit (1) holding costs incurred in the presented period and prior periods for homes sold during the presented period that are included in sales and marketing expense, (2) selling costs incurred in the presented period for homes sold during the presented period that are included in sales and marketing expense and (3) interest expense incurred in the presented period and prior periods for homes sold during the presented period. The Company adds to Zillow Offers gross profit (1) inventory valuation adjustments recorded during the presented period associated with homes that remain in inventory at period end, net of inventory valuation adjustments recorded in prior periods related to homes sold in the presented period, and indirect expenses included in cost of revenue and (2) share-based compensation expense and depreciation and amortization expense included in cost of revenue. The following table presents the calculation of Zillow Offers average gross profit per home and Average Return on Homes Sold After Interest Expense and a reconciliation of return on homes sold after interest expense to Zillow Offers gross profit for the periods presented (unaudited):
Three Months Ended
June 30,
Calculation of Average Gross Profit per Home20202019
Zillow Offers revenue$453,816,000  $248,924,000  
Zillow Offers cost of revenue430,032,000  240,732,000  
Zillow Offers gross profit$23,784,000  $8,192,000  
Homes sold1,437  786  
Average Zillow Offers gross profit per home$16,551  $10,422  
Reconciliation of Non-GAAP Measure to Nearest GAAP Measure
Zillow Offers gross profit$23,784,000  $8,192,000  
Holding costs included in sales and marketing (1)(5,987,000) (2,569,000) 
Selling costs included in sales and marketing (2)(19,570,000) (10,676,000) 
Interest expense (3)(5,948,000) (3,532,000) 
Direct and indirect expenses included in cost of revenue (4)(2,573,000) 6,101,000  
Share-based compensation expense and depreciation and amortization expense included in cost of revenue323,000  192,000  
Return on homes sold after interest expense$(9,971,000) $(2,292,000) 
Homes sold1,437  786  
Average return on homes sold after interest expense$(6,939) $(2,916) 
(1) Amount represents holding costs incurred related to homes sold in the presented period that were not eligible for inventory capitalization and were therefore expensed as period costs in the presented period and prior periods. These costs primarily include homeowners association dues, property taxes, insurance, utilities, and cleaning and maintenance costs incurred during the time a home is held for sale after the renovation period is complete. On a GAAP basis, the Company incurred a total of $2.6 million and $4.4 million of holding costs included in sales and marketing expense for the three months ended June 30, 2020 and 2019, respectively.
(2) Amount represents selling costs incurred related to homes sold in the presented period that were not eligible for inventory capitalization and were therefore expensed as period costs in the presented period. These costs primarily include agent commissions paid upon the sale of a home.
(3) Amount represents interest expense incurred related to homes sold in the presented period that was not eligible for inventory capitalization and was therefore expensed as a period cost in the presented period and prior periods.
(4) Amount includes inventory valuation adjustments recorded during the period associated with homes that remain in inventory at period end, net of inventory valuation adjustments recorded in prior periods related to homes sold in the presented period, as well as corporate costs allocated to Zillow Offers such as headcount expenses and hosting-related costs related to the operation of our website.


On a GAAP basis, Homes segment average gross profit per home was $16,277 and $11,871, respectively, for the six months ended June 30, 2020 and 2019.

The following table presents the total return on homes sold after interest expense and the Average Return on Homes Sold After Interest Expense for the periods presented (unaudited):
Six Months Ended
June 30, 2020
Six Months Ended
June 30, 2019
TotalAverage
Per Home
TotalAverage
Per Home
Homes sold3,831  1,200  
Zillow Offers revenue$1,222,928,000  $319,219  $377,396,000  $314,497  
Operating costs:
Home acquisition costs (1)1,099,163,000  286,913  341,664,000  284,720  
Renovation costs (1)59,364,000  15,496  14,165,000  11,804  
Holding costs (1)(2)15,605,000  4,073  3,807,000  3,173  
Selling costs52,483,000  13,699  16,218,000  13,515  
Total operating costs1,226,615,000  320,181  375,854,000  313,212  
Interest expense (1)(2)17,004,000  4,439  5,187,000  4,323  
Return on homes sold after interest expense$(20,691,000) $(5,401) $(3,645,000) $(3,038) 
(1) Amount excludes expenses incurred during the period that are not related to homes sold during the period.
(2) Holding costs and interest expense include $6.4 million and $8.1 million, respectively, of costs incurred in prior periods associated with homes sold in the six months ended June 30, 2020 and $0.9 million and $0.9 million, respectively, of costs incurred in prior periods associated with homes sold in the six months ended June 30, 2019.


The following table presents the calculation of Homes segment average gross profit per home and Average Return on Homes Sold After Interest Expense and a reconciliation of return on homes sold after interest expense to Homes segment gross profit for the periods presented (unaudited):
Six Months Ended
June 30,
Calculation of Average Gross Profit per Home20202019
Zillow Offers revenue$1,222,928,000  $377,396,000  
Zillow Offers cost of revenue1,160,569,000  363,151,000  
Zillow Offers gross profit$62,359,000  $14,245,000  
Homes sold3,831  1,200  
Average Zillow Offers gross profit per home$16,277  $11,871  
Reconciliation of Non-GAAP Measure to Nearest GAAP Measure
Zillow Offers gross profit$62,359,000  $14,245,000  
Holding costs included in sales and marketing (1)(15,605,000) (3,807,000) 
Selling costs included in sales and marketing (2)(52,483,000) (16,218,000) 
Interest expense (3)(17,004,000) (5,187,000) 
Direct and indirect expenses included in cost of revenue (4)1,257,000  7,021,000  
Share-based compensation expense and depreciation and amortization expense included in cost of revenue785,000  301,000  
Return on homes sold after interest expense$(20,691,000) $(3,645,000) 
Homes sold3,831  1,200  
Average return on homes sold after interest expense$(5,401) $(3,038) 
(1) Amount represents holding costs incurred related to homes sold in the presented period that were not eligible for inventory capitalization and were therefore expensed as period costs in the presented period and prior periods. These costs primarily include homeowners association dues, property taxes, insurance, utilities, and cleaning and maintenance costs incurred during the time a home is held for sale after the renovation period is complete. On a GAAP basis, the Company incurred a total of $7.9 million and $6.7 million of holding costs included in sales and marketing expense for the six months ended June 30, 2020 and 2019, respectively.
(2) Amount represents selling costs incurred related to homes sold in the presented period that were not eligible for inventory capitalization and were therefore expensed as period costs in the presented period. These costs primarily include agent commissions paid upon the sale of a home.
(3) Amount represents interest expense incurred related to homes sold in the presented period that was not eligible for inventory capitalization and was therefore expensed as a period cost in the presented period and prior periods.
(4) Amount includes inventory valuation adjustments recorded during the period associated with homes that remain in inventory at period end, net of inventory valuation adjustments recorded in prior periods related to homes sold in the presented period, as well as corporate costs allocated to Zillow Offers such as headcount expenses and hosting-related costs related to the operation of our website.


1 ​| Q2.2020  -ebruary 19, 2020 


August 6, 2020    Dear Shareholders:     The second quarter of 2020 has proven that people’s desire for home is  resilient. The unprecedented health and economic crisis we have  experienced over the past few months has caused many to rethink what  home could be, serving as a catalyst for a Great Reshuffling. This  movement is in the early days as companies and employees continue to  learn and evolve through this forced large-scale experience of working  from home. We are seeing an emergence of what customers have always  indicated to us, an underlying inherent desire to move. And now, with  home as the epicenter of people's lives more than ever, there are even  more reasons to move forward.      Shopping and transacting real estate during the pandemic has forced a  rapid structural transition from physical to virtual, as it has in many  aspects of our lives. Customers are adopting Zillow’s virtual tools and we  will continue to innovate to drive our industry toward the future. We are  also working with and supporting our partners to help our mutual  customers stay safe while unlocking the next chapters in their lives.      The initial shock and fear around COVID-19 pressured home shopping  activity levels early in Q2. Our response to offer our partners  #BetterTogether billing relief announced in March and continuing into Q2  delivered support during a very uncertain time. These billing discounts,  combined with our efforts to connect more and higher-intent customers,  were effective in maintaining partner retention.      These actions put us in a strong position to benefit from the  faster-than-expected recovery in home shopping activity during May and  June, and we delivered better Q2 results than we originally anticipated. In  fact, in ​June, we experienced record new Premier Agent monthly recurring  revenue (“MRR”) and, at the end of June, had our highest level of total MRR  and retention since the inception of the Premier Agent market-based-pricing  (“MBP”) program1.​ The better-than-expected revenue combined with our  previously announced cost reductions drove improved segment income  (loss) before taxes and upside for all three of our segments’ Q2 Adjusted  EBITDA versus our outlook. Many of our businesses entered the third  quarter performing even better than we expected pre-COVID-19.    1 ​Please see “Use of Operating Metrics” below for additional information about how we calculate MRR.  2 ​| Q2.2020 


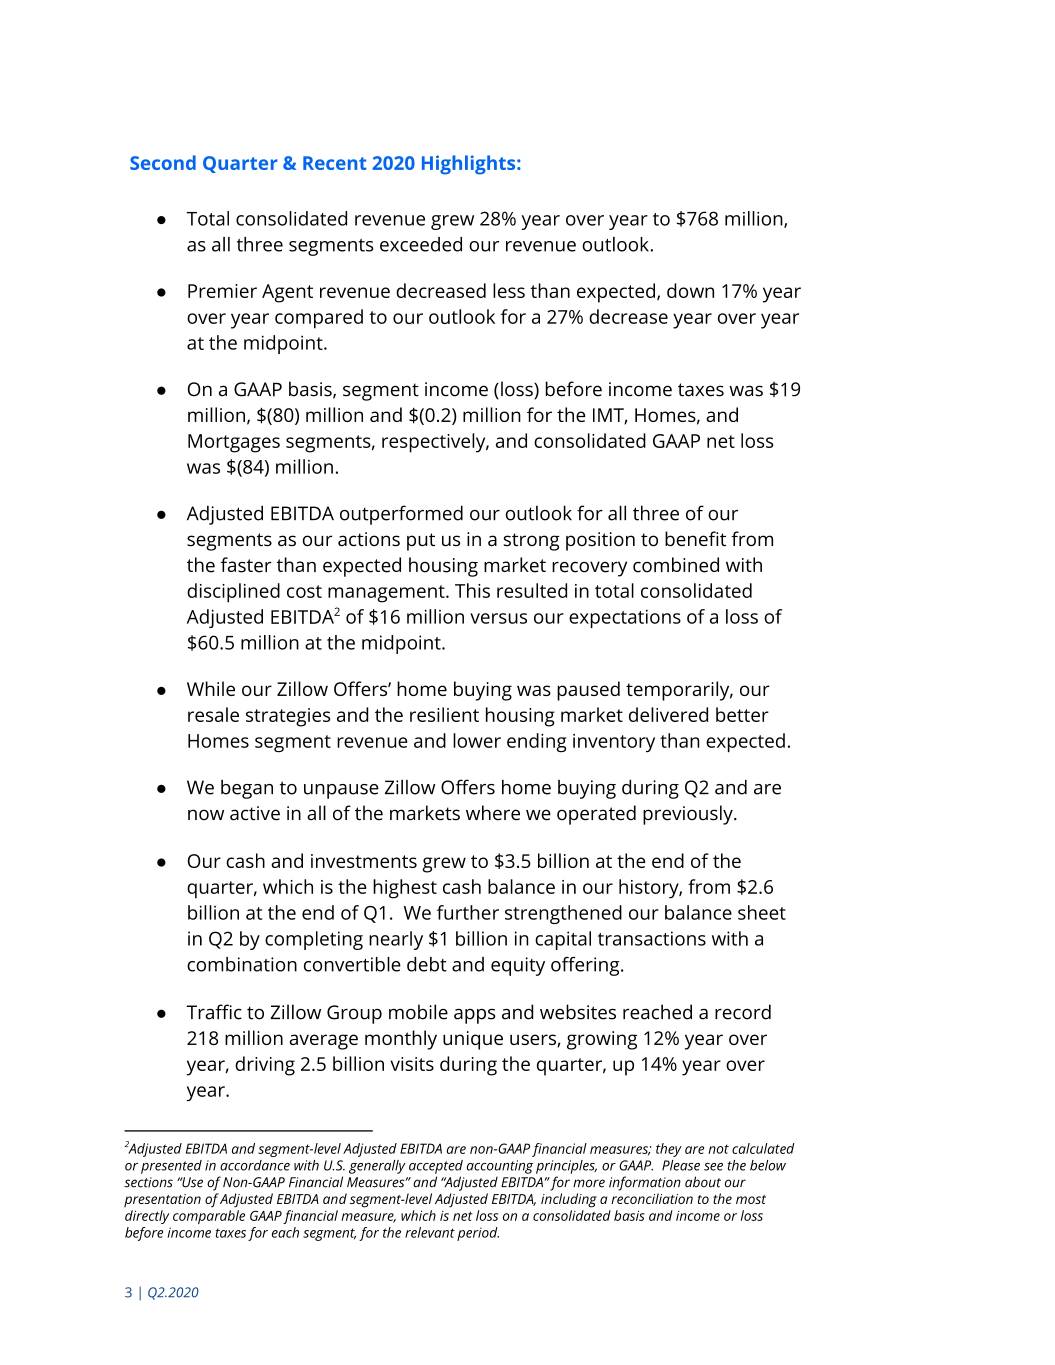
​Second Quarter & Recent 2020 Highlights:    ● Total consolidated revenue grew 28% year over year to $768 million,  as all three segments exceeded our revenue outlook.      ● Premier Agent revenue decreased less than expected, down 17% year  over year compared to our outlook for a 27% decrease year over year  at the midpoint.      ● On a GAAP basis, segment income (loss) before income taxes was $19  million, $(80) million and $(0.2) million for the IMT, Homes, and  Mortgages segments, respectively, and consolidated GAAP net loss  was $(84) million.      ● Adjusted EBITDA outperformed our outlook for all three of our  segments as our actions put us in a strong position to benefit from  the faster than expected housing market recovery combined with  disciplined cost management. This resulted in total consolidated  Adjusted EBITDA2 of $16 million versus our expectations of a loss of  $60.5 million at the midpoint.     ● While our Zillow Offers’ home buying was paused temporarily, our  resale strategies and the resilient housing market delivered better  Homes segment revenue and lower ending inventory than expected.      ● We began to unpause Zillow Offers home buying during Q2 and are  now active in all of the markets where we operated previously.    ● Our cash and investments grew to $3.5 billion at the end of the  quarter, which is the highest cash balance in our history, from $2.6  billion at the end of Q1. We further strengthened our balance sheet  in Q2 by completing nearly $1 billion in capital transactions with a  combination convertible debt and equity offering.      ● Traffic to Zillow Group mobile apps and websites reached a record  218 million average monthly unique users, growing 12% year over  year, driving 2.5 billion visits during the quarter, up 14% year over  year.    2Adjusted EBITDA and segment-level Adjusted EBITDA are non-GAAP financial measures; they are not calculated  or presented in accordance with U.S. generally accepted accounting principles, or GAAP. Please see the below  sections “Use of Non-GAAP Financial Measures” and “Adjusted EBITDA” for more information about our  presentation of Adjusted EBITDA and segment-level Adjusted EBITDA, including a reconciliation to the most  directly comparable GAAP financial measure, which is net loss on a consolidated basis and income or loss   before income taxes for each segment, for the relevant period.    3 ​| Q2.2020 


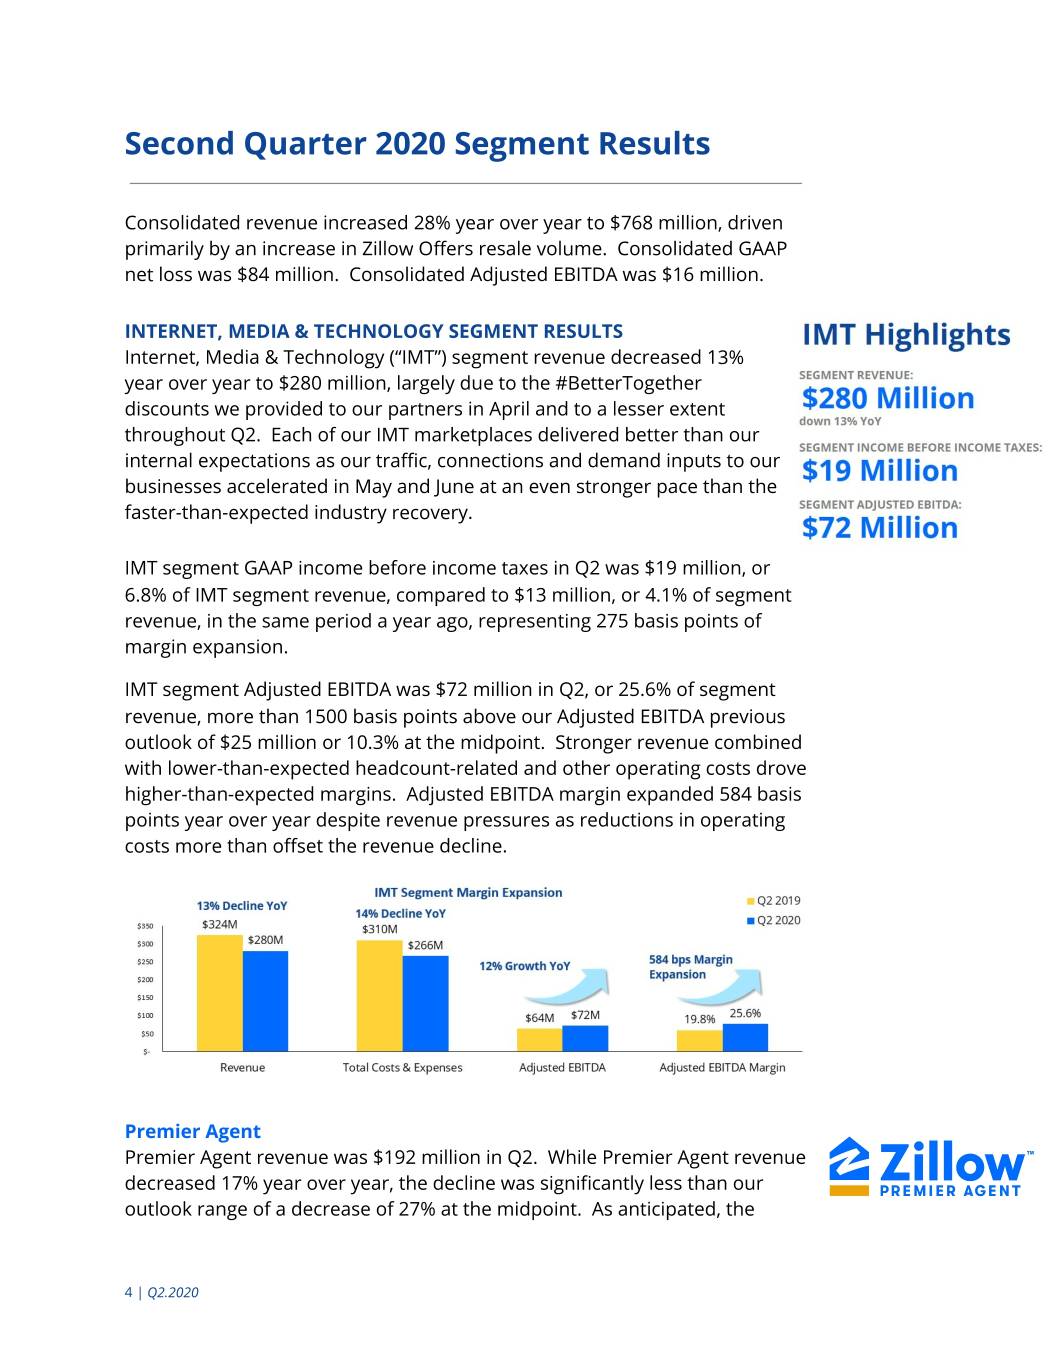
Second Quarter 2020 Segment Results     Consolidated revenue increased 28% year over year to $768 million, driven  primarily by an increase in Zillow Offers resale volume. Consolidated GAAP  net loss was $84 million. Consolidated Adjusted EBITDA was $16 million.    INTERNET, MEDIA & TECHNOLOGY SEGMENT RESULTS   Internet, Media & Technology (“IMT”) segment revenue decreased 13%  year over year to $280 million, largely due to the #BetterTogether  discounts we provided to our partners in April and to a lesser extent  throughout Q2. Each of our IMT marketplaces delivered better than our  internal expectations as our traffic, connections and demand inputs to our  businesses accelerated in May and June at an even stronger pace than the  faster-than-expected industry recovery.    IMT segment GAAP income before income taxes in Q2 was $19 million, or  6.8% of IMT segment revenue, compared to $13 million, or 4.1% of segment  revenue, in the same period a year ago, representing 275 basis points of  margin expansion.    IMT segment Adjusted EBITDA was $72 million in Q2, or 25.6% of segment  revenue, more than 1500 basis points above our Adjusted EBITDA previous  outlook of $25 million or 10.3% at the midpoint. Stronger revenue combined  with lower-than-expected headcount-related and other operating costs drove  higher-than-expected margins. Adjusted EBITDA margin expanded 584 basis  points year over year despite revenue pressures as reductions in operating  costs more than offset the revenue decline.    Premier Agent   Premier Agent revenue was $192 million in Q2. While Premier Agent revenue  decreased 17% year over year, the decline was significantly less than our  outlook range of a decrease of 27% at the midpoint. As anticipated, the  4 ​| Q2.2020 


decline in revenue was primarily due to the impact of COVID-19-related  discounts offered to our Premier Agent partners during the quarter. We  believe supporting our partners by providing our #BetterTogether billing  relief through discounts during this uncertain time was highly effective for  agent retention and kept our partner base largely intact.      These actions put us in a strong position to benefit from the housing market  recovery in May and June. Further, our partners saw the benefits of Zillow  connections during a time that has likely been more difficult to generate new  leads through traditional means. For example, as the decline in open houses  made it difficult to meet unrepresented buyers in homes, we believe Zillow  Premier Agents saw more potential buyers becoming comfortable meeting a  new agent virtually through our platform.   As often happens during times of uncertainty and stress, consumers flock to  brands they know and trust. Zillow Group visits were up 14% year over year  for a new record in Q2 despite beginning the quarter down year over year.  The rise in search activity is consistent with consumer surveys that show two  thirds of people working from home would consider moving if they were  allowed to continue working from home long-term.   In our Q1 letter, we discussed the accelerated innovations we made at the  beginning of Q2 to better support customers’ needs for virtual real estate  experiences. We have continued to enhance our 3D Home tour technology  with the roll-out of floor plans to make it easier to jump from room to room  while shopping virtually. We also enhanced our Zillow 3D HomeⓇ​ ​ app to  make it easier for more homeowners to upload their homes into the tool.    As we have discussed previously, we continued to expand the testing of Flex  in Q2 with high-performing partners in select markets. It is still early, but we  have observed the ability for Market-Based-Pricing (“MBP”) and Flex to  complement each other in markets as we continue to maximize leads for  revenue, profit and customer satisfaction.     Other IMT Revenue   Other IMT revenue, which includes rentals, new construction, display and  other advertising, and business technology solutions for real estate  professionals, declined 4% year over year to $88 million, driven primarily by  COVID-19-related billing relief in the quarter. Despite the market-related  pressures in New York City, Rentals revenue accelerated in Q2 to 20% year  over year growth from 16% in Q1, driven primarily by strong growth in our  customer rental applications offering. We also continue to innovate with  5 ​| Q2.2020 


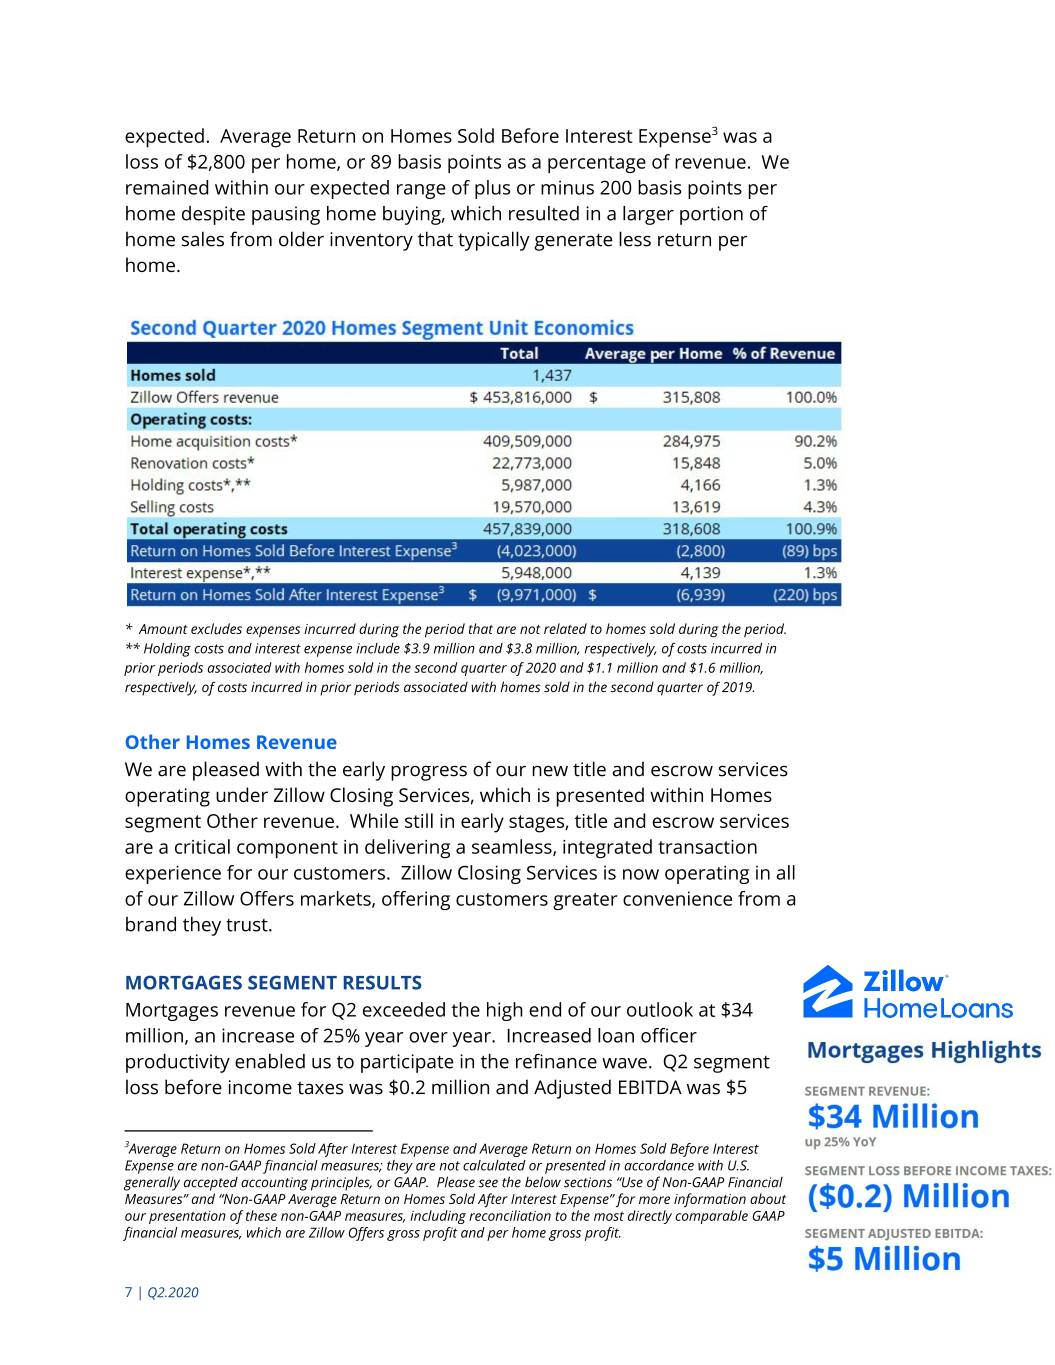
solutions like Zillow Rental Manager, which provides digital tools to help  people shop, apply, and pay rent while concurrently enabling us to better  monetize listings by moving us closer to the rental transaction.    The non-Rentals marketplaces included in Other IMT revenue were down  25% year over year due to COVID-19 pressure across many of the  marketplaces, but all were better than we expected internally as housing  market conditions recovered quickly.   HOMES SEGMENT RESULTS   In Q2, Zillow successfully demonstrated that we have the data, operating  platform, prudent capital levels and leadership to actively manage this  business even during challenging times.      Zillow Offers entered Q2 with home acquisitions temporarily paused due  to market uncertainty. Fortunately, housing transactions proved resilient  as we, our partners, and the broader industry participants found creative  solutions to enable real estate transactions and customers to move  forward safely.      Zillow Offers purchased only 86 homes in the quarter due to the temporary  pause of home acquisitions. We restarted purchasing homes in mid-May in  select markets where we had confidence we could operate safely. We are  currently actively purchasing homes in all 24 markets where we previously  operated. Agreements to repurchase homes often take weeks to months to  close, which is why the majority of homes we agreed to purchase in Q2 will  not be added to our inventory until closing at a later date.      While purchasing was paused, we did continue to sell homes amid  accelerating buyer demand and tight supply. Our selling strategies,  combined with tailwinds of a strong housing market, resulted in the sale of  1,437 homes during Q2, yielding Homes segment revenue of $454 million,  well above our outlook. Zillow Offers ended the quarter with 440 homes in  inventory, down from 1,791 homes at the end of Q1.    During Q2, Zillow Offers gross profit was $23.8 million, and average Zillow  Offers gross profit per home sold was $16.6 thousand. Homes segment loss  before income taxes was $80 million. Homes segment Adjusted EBITDA was  a loss of $61 million, better than our outlook, as gross profit benefitted from  lower cost of revenue and we incurred less headcount-related expenses than  6 ​| Q2.2020 


expected. Average Return on Homes Sold Before Interest Expense3 was a  loss of $2,800 per home, or 89 basis points as a percentage of revenue. We  remained within our expected range of plus or minus 200 basis points per  home despite pausing home buying, which resulted in a larger portion of  home sales from older inventory that typically generate less return per  home.      * Amount excludes expenses incurred during the period that are not related to homes sold during the period.  ** Holding costs and interest expense include $3.9 million and $3.8 million, respectively, of costs incurred in  prior periods associated with homes sold in the second quarter of 2020 and $1.1 million and $1.6 million,  respectively, of costs incurred in prior periods associated with homes sold in the second quarter of 2019.  Other Homes Revenue  We are pleased with the early progress of our new title and escrow services  operating under Zillow Closing Services, which is presented within Homes  segment Other revenue. While still in early stages, title and escrow services  are a critical component in delivering a seamless, integrated transaction  experience for our customers. Zillow Closing Services is now operating in all  of our Zillow Offers markets, offering customers greater convenience from a  brand they trust.    MORTGAGES SEGMENT RESULTS   Mortgages revenue for Q2 exceeded the high end of our outlook at $34  million, an increase of 25% year over year. Increased loan officer  productivity enabled us to participate in the refinance wave. Q2 segment  loss before income taxes was $0.2 million and Adjusted EBITDA was $5  3Average Return on Homes Sold After Interest Expense and Average Return on Homes Sold Before Interest  Expense are non-GAAP financial measures; they are not calculated or presented in accordance with U.S.  generally accepted accounting principles, or GAAP. Please see the below sections “Use of Non-GAAP Financial  Measures” and “Non-GAAP Average Return on Homes Sold After Interest Expense” for more information about  our presentation of these non-GAAP measures, including reconciliation to the most directly comparable GAAP  financial measures, which are Zillow Offers gross profit and per home gross profit.    7 ​| Q2.2020 


million. Stronger revenue combined with cost discipline drove the positive  Adjusted EBITDA for Q2. We are encouraged with our progress and plans to  integrate Zillow Home Loans to provide financing for customers of Zillow and  Zillow Offers - a critical component to a seamless transaction.  Second Quarter Financial Details     OPERATING EXPENSE SUMMARY   Total consolidated costs and expenses were $831 million, up from $662  million a year ago, primarily due to the continued expansion of the Homes  segment. Operating expenses excluding Homes cost of revenue were lower  in the quarter than expected primarily due to lower than planned hiring  activity, but also due to proactive measures we have taken to reduce costs.    Our Sales and marketing, Technology and development, and General and  administrative costs totaled $370 million in Q2, a decrease of 5% year over  year, due primarily to the pause of the majority of our advertising spend in  Q2 and lower than expected headcount-related costs.      The following table presents certain costs and expenses by segment for the  periods presented (in thousands, unaudited):     BALANCE SHEET & CASH FLOW SUMMARY   We further improved our strong balance sheet during Q2 and as of the end  of the quarter, we now have the highest cash balance in our history. We  ended the quarter with more than $3.5 billion in cash, cash equivalents and  investments, up from $2.6 billion at the end of Q1. During Q2, we completed  a $565 million ($553 million net of fees and expenses) convertible debt  offering, effectively refinancing a portion of our convertible debt due in  December 2021. We also opportunistically raised $422 million in an equity  offering ($412 million net of fees and expenses).    8 ​| Q2.2020 


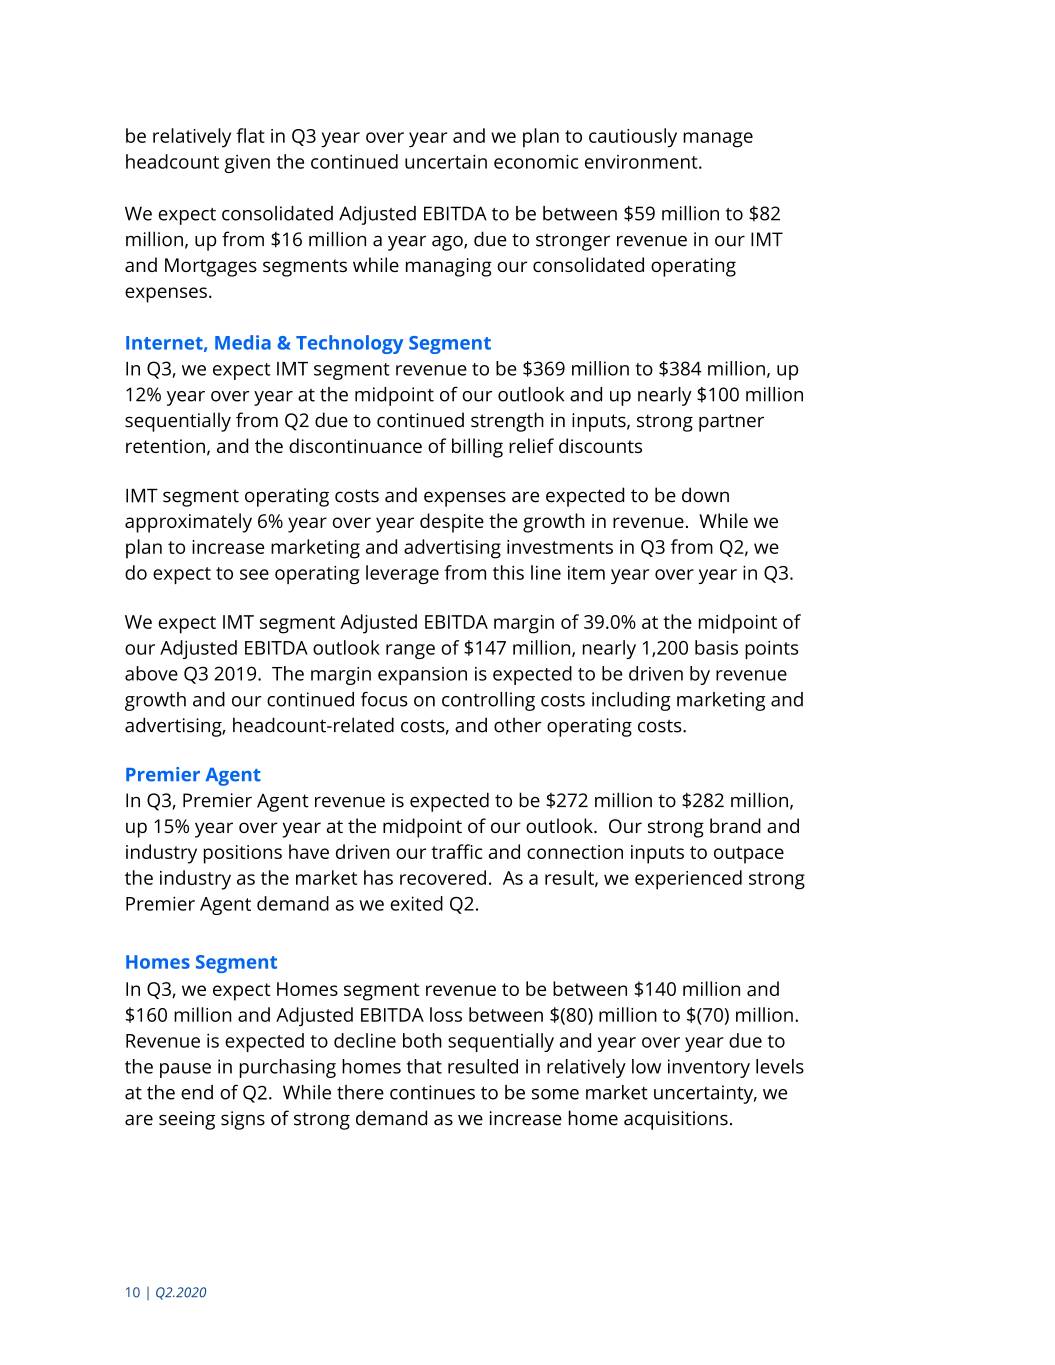
Outlook     The following table presents our outlook for the three months ending  September 30, 2020 (in millions):        * Zillow Group has not provided a quantitative reconciliation of forecasted GAAP net loss to forecasted total  Adjusted EBITDA or of forecasted GAAP income (loss) before income taxes to forecasted segment Adjusted EBITDA  within this communication because the company is unable, without making unreasonable efforts, to calculate  certain reconciling items with confidence. These items include, but are not limited to: income taxes which are  directly impacted by unpredictable fluctuations in the market price of the company’s capital stock; depreciation  and amortization expense from new acquisitions; impairments of assets; gains or losses on extinguishment of  debt and acquisition-related costs. These items, which could materially affect the computation of  forward-looking GAAP net loss and income (loss) before income taxes, are inherently uncertain and depend on  various factors, many of which are outside of Zillow Group’s control. For more information regarding the  non-GAAP financial measure discussed in this communication, please see “Use of Non-GAAP Financial Measures”  below.  Consolidated Outlook   We expect consolidated revenue to be $543 to $581 million, down from $745  million in Q3 2019. The decline is primarily due to lower Homes segment  revenue driven by the lower inventory of homes for sale in Q3 as a result of  the pause in Zillow Offers purchasing activity during Q2. We expect strong  revenue growth in our IMT and Mortgages segments for Q3, accelerating  above our pre-COVID-19 internal expectations.    We expect to make additional investments in marketing and advertising  expenses and operations in Q3 as compared to Q2, but expect to achieve  year over year operating leverage. Headcount-related costs are expected to  9 ​| Q2.2020 


be relatively flat in Q3 year over year and we plan to cautiously manage  headcount given the continued uncertain economic environment.      We expect consolidated Adjusted EBITDA to be between $59 million to $82  million, up from $16 million a year ago, due to stronger revenue in our IMT  and Mortgages segments while managing our consolidated operating  expenses.       Internet, Media & Technology Segment   In Q3, we expect IMT segment revenue to be $369 million to $384 million, up  12% year over year at the midpoint of our outlook and up nearly $100 million  sequentially from Q2 due to continued strength in inputs, strong partner  retention, and the discontinuance of billing relief discounts    IMT segment operating costs and expenses are expected to be down  approximately 6% year over year despite the growth in revenue. While we  plan to increase marketing and advertising investments in Q3 from Q2, we  do expect to see operating leverage from this line item year over year in Q3.    We expect IMT segment Adjusted EBITDA margin of 39.0% at the midpoint of  our Adjusted EBITDA outlook range of $147 million, nearly 1,200 basis points  above Q3 2019. The margin expansion is expected to be driven by revenue  growth and our continued focus on controlling costs including marketing and  advertising, headcount-related costs, and other operating costs.    Premier Agent   In Q3, Premier Agent revenue is expected to be $272 million to $282 million,  up 15% year over year at the midpoint of our outlook. Our strong brand and  industry positions have driven our traffic and connection inputs to outpace  the industry as the market has recovered. As a result, we experienced strong  Premier Agent demand as we exited Q2.    Homes Segment   In Q3, we expect Homes segment revenue to be between $140 million and  $160 million and Adjusted EBITDA loss between $(80) million to $(70) million.  Revenue is expected to decline both sequentially and year over year due to  the pause in purchasing homes that resulted in relatively low inventory levels  at the end of Q2. While there continues to be some market uncertainty, we  are seeing signs of strong demand as we increase home acquisitions.     10 |​ Q2.2020 


Mortgages Segment   We are continuing to innovate our mortgages technology platform while  navigating the mortgage rate market. We expect Q3 Mortgages revenue to  be between $34 million and $37 million and Adjusted EBITDA to be a slight  loss to break even based upon capacity, current market conditions and  additional investments in the operations. Our mortgage leadership  continues to focus on building the technology, processes and operations to  deliver a seamless lending experience for our customers.      Summary    The meaning of home is evolving. It used to be a place where we slept and  did a little bit of a lot of things - cooking and eating, family time, some work  and homework, and possibly some exercise. It has now also become our  office, school, gym, staycation, and base for social connections whether they  be virtual or socially distanced. The changing needs of our homes has served  as a catalyst for the pent up inherent demand in peoples’ desire to move.      Our mission is to help meet this need by​ giving people the power to unlock  life’s next chapter​. We continue to innovate on behalf of our customers to  provide added transparency, liquidity and efficiency throughout the home  shopping process. Zillow’s tools are uniquely positioned to help people stay  safe and move forward virtually. A great example of this is the story of a  Seattle couple, Marie-Yvonne Chase and Ethan Wieczorek, who wanted more  space during the Covid lockdown in Seattle. They started on Zillow, where  their new landlord, Raul Tello, had used Zillow tools to set up an entirely  virtual experience for them to shop. After a 3D tour and a virtual tour, the  couple agreed to move forward. Raul uploaded a lease they could sign, and  they paid their rent through Zillow’s platform. All that was left was handing  over the keys; he left them in a lockbox on the front porch.  Watch the full story here4  Similarly, we have expanded from managing employees virtually to engaging  and growing our workforce virtually - and seeing significant improvements to  employee satisfaction. Last week we announced that approximately 90% of  our nearly 5,400 employees will have the flexibility to work from home at  least part-time - indefinitely. This is a testament to our teams, who nimbly  worked through massive changes in the working environment since the  beginning of the year. They have proven we can be a high-functioning and  4 https://www.zillowgroup.com/renting-becomes-safer-online-transaction/  11 |​ Q2.2020 


innovative company, regardless of where our employees work. We would  like to sincerely thank all of our employees for adapting with grace and  successfully navigating this unprecedented confluence of events.     Looking forward, we believe that the concept of a flexible work environment  - work from home, office or a combination of the two - will be a key factor in  preserving our culture and attracting and retaining a diverse workforce.      Our Q3 priorities remain predominantly the same as we discussed in Q2,  except, in addition to cutting costs, we are now looking for opportunities to  invest in growth. Our updated Q3 priorities:  ● Continue to protect the ZG enterprise, including protecting the health  and safety of our people, customers, and partners  ● Manage costs and investment for growth   ● Further accelerate technology innovations to deliver seamless and,  now, more virtual real estate shopping and transaction experiences  ● Enhance our relative competitive position to lead the industry to Real  Estate 2.0     Before closing, we want to acknowledge the important events around racial  and social justice that were sparked during the quarter. As social protests  broke out across the country, we made the public statement that Racism  Has No Home Here, and made a commitment that we can and will do more.  This declaration supports our commitment to Equity & Belonging and to  ensure we examine our role toward ending racism and inequities in real  estate. W​ e have pledged at least $1 million over the next 12 months to  support lasting partnerships to fight racism and discrimination. And we are  deepening our partnership with the National Fair Housing Alliance to support  a level playing field for the American dream of home. ​ ​We are also facilitating  important conversations within the industry to reimagine real estate and  propel the industry forward.        We appreciate your partnership in this journey. Stay safe.  Sincerely,   Rich Barton, Co-founder & CEO   Allen Parker, CFO       12 |​ Q2.2020 


Forward-Looking Statements This communication contains forward-looking statements within the meaning of Section 27A of the Securities Act of 1933 and Section 21E of the Securities Exchange Act of 1934 that involve risks and uncertainties, including, without limitation, statements regarding our business outlook for 2020; the future performance and operation of the Homes, IMT and Mortgages segments in 2020 and beyond; the current and future health and stability of the residential housing market and economy; and our expectations regarding future shifts in behavior by consumers and employees. Statements containing words such as “may,” “believe,” “anticipate,” “expect,” “intend,” “plan,” “project,” “predict,” “will,” “projections,” “continue,” “estimate,” “outlook,” “guidance,” or similar expressions, constitute forward-looking statements. Forward- looking statements are made based on assumptions as of August 6, 2020, and although we believe the expectations reflected in the forward-looking statements are reasonable, we cannot guarantee these results. Differences in Zillow Group’s actual results from those described in these forward-looking statements may result from actions taken by Zillow Group as well as from risks and uncertainties beyond Zillow Group’s control. Factors that may contribute to such differences include, but are not limited to, the impact of the novel coronavirus (“COVID-19”) pandemic and any associated economic downturn on Zillow Group’s future financial position, operations and financial performance; the magnitude, duration and severity of the COVID-19 pandemic; the current and future health and stability of the economy and residential housing market, including any extended slowdown in the real estate markets as a result of COVID-19 or the economy; Zillow Group’s ability to execute on strategy; Zillow Group’s ability to maintain and effectively manage an adequate rate of growth; Zillow Group’s ability to innovate and provide products and services that are attractive to its users and advertisers; Zillow Group’s investment of resources to pursue strategies that may not prove effective; Zillow Group’s ability to compete successfully against existing or future competitors; the impact of pending or future legal proceedings, including those described in Zillow Group’s filings with the Securities and Exchange Commission, or SEC; Zillow Group’s ability to successfully integrate and realize the benefits of its past or future strategic acquisitions or investments; Zillow Group’s ability to maintain or establish relationships with listings and data providers; the reliable performance of Zillow Group’s network infrastructure and content delivery processes; Zillow Group’s ability to obtain or maintain licenses and permits to support our current and future businesses; actual or anticipated changes to our products and services; and Zillow Group’s ability to protect its intellectual property. The foregoing list of risks and uncertainties is illustrative but not exhaustive. For more information about potential factors that could affect Zillow Group’s business and financial results, please review the “Risk Factors” described in Zillow Group’s Annual Report on Form 10-K for the year ended December 31, 2019 and in Zillow Group’s Quarterly Report on Form 10-Q for the quarterly period ended June 30, 2020 filed with the SEC and in other filings with the SEC. Except as may be required by law, Zillow Group does not intend, and undertakes no duty to update this information to reflect future events or circumstances. Use of Non-GAAP Financial Measures This communication includes references to Adjusted EBITDA (in total and for each segment, and including forecasted Adjusted EBITDA and EBITDA margin), Average Return on Homes Sold Before Interest Expense and Average Return on Homes Sold After Interest Expense, which are non-GAAP financial measures not prepared in conformity with accounting principles generally accepted in the United States (“GAAP”). These non-GAAP financial measures are not prepared under a comprehensive set of accounting rules and, therefore, should only be reviewed alongside results reported under GAAP. Adjusted EBITDA To provide investors with additional information regarding our financial results, this communication includes references to Adjusted EBITDA (in total and for each segment, and including  forecasted Adjusted  EBITDA and EBITDA margin), which is a non-GAAP financial measure. We have provided a reconciliation within this communication of Adjusted EBITDA in total to net loss and Adjusted EBITDA by segment to income (loss) before income taxes for each segment, the most directly comparable GAAP financial measures.


Adjusted EBITDA is a key metric used by our management and board of directors to measure operating performance and trends, and to prepare and approve our annual budget. In particular, the exclusion of certain expenses in calculating Adjusted EBITDA facilitates operating performance comparisons on a period-to-period basis. Our use of Adjusted EBITDA in total and for each segment has limitations as an analytical tool, and you should not consider these measures in isolation or as a substitute for analysis of our results as reported under GAAP. Some of these limitations are: ▪ Adjusted EBITDA does not reflect our cash expenditures or future requirements for capital expenditures or contractual commitments; ▪ Adjusted EBITDA does not reflect changes in, or cash requirements for, our working capital needs; ▪ Adjusted EBITDA does not consider the potentially dilutive impact of share-based compensation; ▪ Although depreciation and amortization are non-cash charges, the assets being depreciated and amortized may have to be replaced in the future, and Adjusted EBITDA does not reflect cash capital expenditure requirements for such replacements or for new capital expenditure requirements; ▪ Adjusted EBITDA does not reflect impairment costs; ▪ Adjusted EBITDA does not reflect the gain on the partial extinguishment of the 2021 Notes; ▪ Adjusted EBITDA does not reflect interest expense or other income; ▪ Adjusted EBITDA does not reflect income taxes; and ▪ Other companies, including companies in our own industry, may calculate Adjusted EBITDA differently than we do, limiting its usefulness as a comparative measure. Because of these limitations, you should consider Adjusted EBITDA in total and for each segment alongside other financial performance measures, including various cash flow metrics, net loss and income (loss) before income taxes for each segment and our other GAAP results.
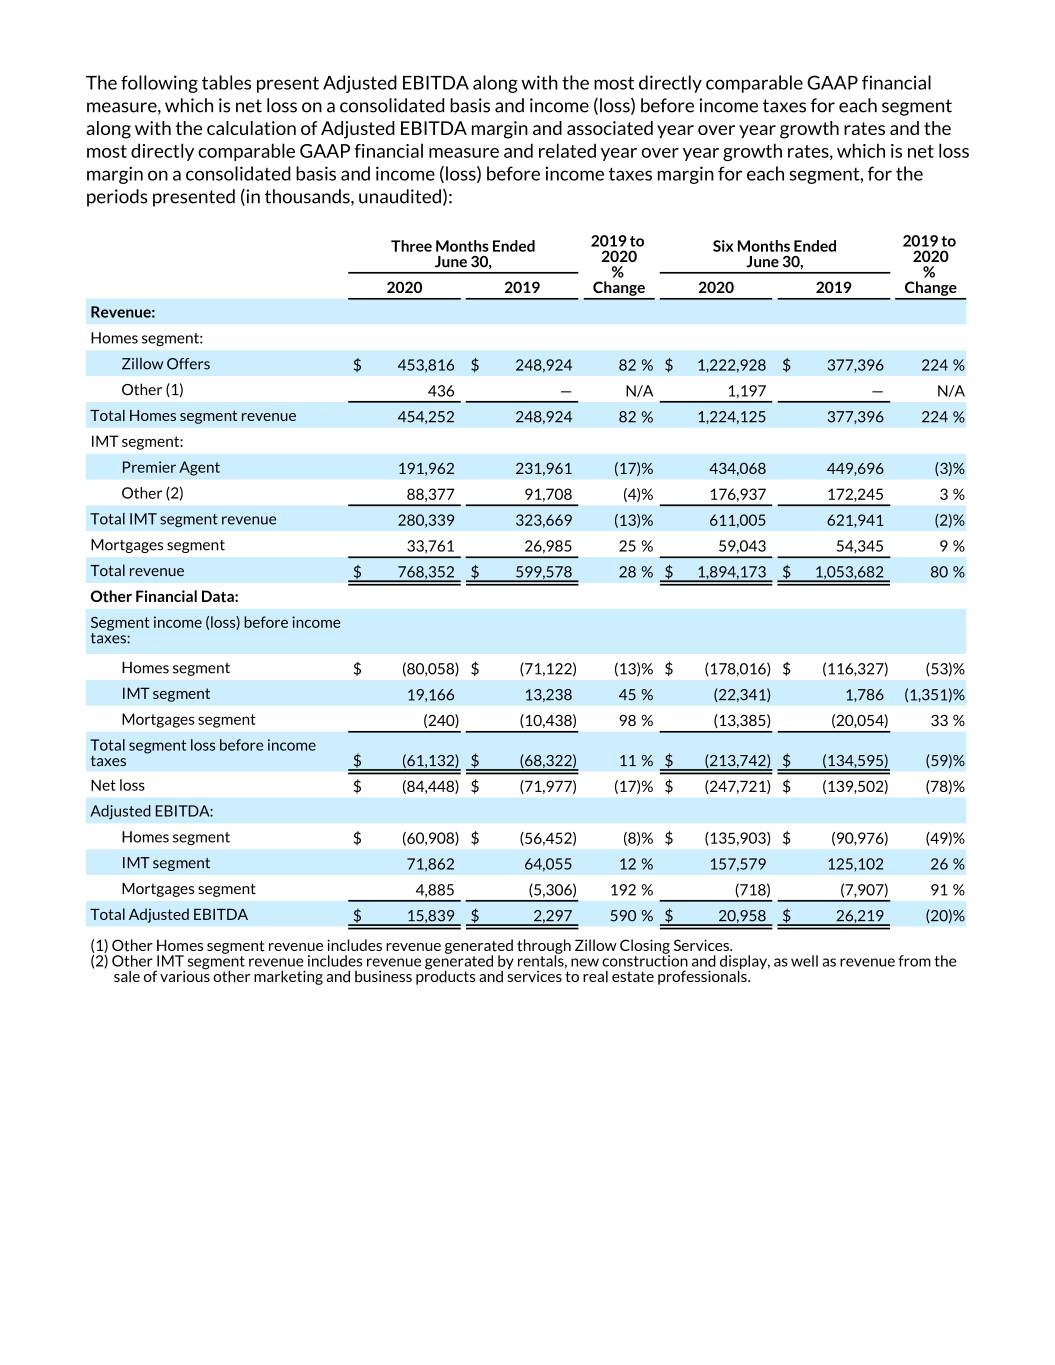

 
The following tables present Adjusted EBITDA along with the most directly comparable GAAP financial measure, which is net loss on a consolidated basis and income (loss) before income taxes for each segment along with the calculation of Adjusted EBITDA margin and associated year over year growth rates and the most directly comparable GAAP financial measure and related year over year growth rates, which is net loss margin on a consolidated basis and income (loss) before income taxes margin for each segment, for the periods presented (in thousands, unaudited): Three Months Ended 2019 to  Six Months Ended 2019 to  June 30, 2020 June 30, 2020 % % 2020 2019 Change 2020 2019 Change Revenue: Homes segment: Zillow Offers $ 453,816 $ 248,924 82 % $ 1,222,928 $ 377,396 224 % Other (1) 436 — N/A 1,197 — N/A Total Homes segment revenue 454,252 248,924 82 % 1,224,125 377,396 224 % IMT segment: Premier Agent 191,962 231,961 (17) % 434,068 449,696 (3) % Other (2) 88,377 91,708 (4) % 176,937 172,245 3 % Total IMT segment revenue 280,339 323,669 (13) % 611,005 621,941 (2) % Mortgages segment 33,761 26,985 25 % 59,043 54,345 9 % Total revenue $ 768,352 $ 599,578 28 % $ 1,894,173 $ 1,053,682 80 % Other Financial Data: Segment income (loss) before income taxes: Homes segment $ (80,058) $ (71,122) (13) % $ (178,016) $ (116,327) (53) % IMT segment 19,166 13,238 45 % (22,341) 1,786 (1,351) % Mortgages segment (240) (10,438) 98 % (13,385) (20,054) 33 % Total segment loss before income taxes $ (61,132) $ (68,322) 11 % $ (213,742) $ (134,595) (59) % Net loss $ (84,448) $ (71,977) (17) % $ (247,721) $ (139,502) (78) % Adjusted EBITDA: Homes segment $ (60,908) $ (56,452) (8) % $ (135,903) $ (90,976) (49) % IMT segment 71,862 64,055 12 % 157,579 125,102 26 % Mortgages segment 4,885 (5,306) 192 % (718) (7,907) 91 % Total Adjusted EBITDA $ 15,839 $ 2,297 590 % $ 20,958 $ 26,219 (20) % (1) Other Homes segment revenue includes revenue generated through Zillow Closing Services. (2) Other IMT segment revenue includes revenue generated by rentals, new construction and display, as well as revenue from the sale of various other marketing and business products and services to real estate professionals.


2019 to 2019 to 2020 2020 Three Months Ended Margin Six Months Ended Margin June 30, 2019 to Change June 30, 2019 to Change 2020 % Basis 2020 % Basis Percentage of Revenue: 2020 2019 Change Points 2020 2019 Change Points Segment income (loss) before income taxes: Homes segment (17.62) % (28.57) % 38 % 1,095 (14.54) % (30.82) % 53 % 1,628 IMT segment 6.84 % 4.09 % 67 % 275 (3.66) % 0.29 % (1,362) % (395) Mortgages segment (0.71) % (38.68) % 98 % 3,797 (22.67) % (36.90) % 39 % 1,423 Total segment loss before income taxes (7.96) % (11.40) % 30 % 344 (11.28) % (12.77) % 12 % 149 Net loss (10.99) % (12.00) % 8 % 101 (13.08) % (13.24) % 1 % 16 Adjusted EBITDA: Homes segment (13.41) % (22.68) % 41 % 927 (11.10) % (24.11) % 54 % 1,301 IMT segment 25.63 % 19.79 % 30 % 584 25.79 % 20.11 % 28 % 568 Mortgages segment 14.47 % (19.66) % 174 % 3,413 (1.22) % (14.55) % 92 % 1,333 Total Adjusted EBITDA 2.06 % 0.38 % 442 % 168 1.11 % 2.49 % (55) % (138) The following tables set forth a reconciliation of Adjusted EBITDA to the most directly comparable GAAP financial measure, which is net loss on a consolidated basis and income (loss) before income taxes for each segment, for each of the periods presented (in thousands, unaudited):   Three Months Ended June 30, 2020 Corporate Homes IMT Mortgages Items (2) Consolidated Reconciliation of Adjusted EBITDA to Net Loss and Income (Loss) Before Income Taxes: Net loss (1) N/A N/A N/A N/A $ (84,448) Income tax expense N/A N/A N/A N/A 679 Income (loss) before income taxes $ (80,058) $ 19,166 $ (240) $ (22,637) $ (83,769) Other income — (5,300) (385) (4,430) (10,115) Depreciation and amortization expense 2,597 22,038 1,538 — 26,173 Share-based compensation expense 12,728 35,958 3,665 — 52,351 Gain on partial extinguishment of 2021 Notes — — — (6,391) (6,391) Interest expense 3,825 — 307 33,458 37,590 Adjusted EBITDA $ (60,908) $ 71,862 $ 4,885 $ — $ 15,839   Three Months Ended June 30, 2019 Corporate Homes IMT Mortgages Items (2) Consolidated Reconciliation of Adjusted EBITDA to Net Loss and Income (Loss) Before Income Taxes: Net loss (1) N/A N/A N/A N/A $ (71,977) Income tax benefit N/A N/A N/A N/A — Income (loss) before income taxes $ (71,122) $ 13,238 $ (10,438) $ (3,655) $ (71,977) Other income — — (402) (9,056) (9,458) Depreciation and amortization expense 1,732 18,308 1,163 — 21,203 Share-based compensation expense 7,039 32,509 4,084 — 43,632 Interest expense 5,899 — 287 12,711 18,897 Adjusted EBITDA $ (56,452) $ 64,055 $ (5,306) $ — $ 2,297


  Six Months Ended June 30, 2020 Corporate Homes IMT Mortgages Items (2) Consolidated Reconciliation of Adjusted EBITDA to Net Loss and Loss Before Income Taxes: Net loss (1) N/A N/A N/A N/A $ (247,721) Income tax benefit N/A N/A N/A N/A (8,549) Loss before income taxes $ (178,016) $ (22,341) $ (13,385) $ (42,528) $ (256,270) Other income — (5,300) (587) (13,821) (19,708) Depreciation and amortization expense 6,172 45,815 3,212 — 55,199 Share-based compensation expense 24,032 65,505 6,609 — 96,146 Gain on partial extinguishment of 2021 Notes — — — (6,391) (6,391) Impairment costs — 73,900 2,900 — 76,800 Interest expense 11,909 — 533 62,740 75,182 Adjusted EBITDA $ (135,903) $ 157,579 $ (718) $ — $ 20,958   Six Months Ended June 30, 2019 Corporate Homes IMT Mortgages Items (2) Consolidated Reconciliation of Adjusted EBITDA to Net Loss and Income (Loss) Before Income Taxes: Net loss (1) N/A N/A N/A N/A $ (139,502) Income tax benefit N/A N/A N/A N/A (2,500) Income (loss) before income taxes $ (116,327) $ 1,786 $ (20,054) $ (7,407) $ (142,002) Other income — — (715) (17,911) (18,626) Depreciation and amortization expense 3,053 35,902 2,773 — 41,728 Share-based compensation expense 12,641 87,414 9,701 — 109,756 Interest expense 9,657 — 388 25,318 35,363 Adjusted EBITDA $ (90,976) $ 125,102 $ (7,907) $ — $ 26,219 (1) We use net income (loss) before income taxes as our profitability measure in making operating decisions and assessing the performance of our segments, therefore, net loss and income tax benefit (expense) are calculated and presented only on a consolidated basis within our financial statements. (2) Certain corporate items are not directly attributable to any of our segments, including the gain on the partial extinguishment of the 2021 Notes, interest income earned on our short-term investments included in Other income and interest costs on our convertible senior notes included in Interest expense. Non-GAAP Average Return on Homes Sold After Interest Expense To provide investors with additional information regarding our Zillow Offers financial results, this communication includes a calculation of Average Return on Homes Sold After Interest Expense, which is a non-GAAP financial measure. We have provided a reconciliation of Average Return on Homes Sold After Interest Expense to the most directly comparable GAAP financial measure, which is average gross profit per home for the Zillow Offers business. We believe that Average Return on Homes Sold After Interest Expense is a useful financial measure to investors as it is one of the primary measures used by management in making investment decisions, measuring unit level economics and evaluating operating performance for the Zillow Offers business. The measure is intended to convey the unit level economics of homes sold during the period by presenting the average revenue and associated expenses directly attributed to the homes sold. We believe this average per unit measure facilitates meaningful period over period comparisons notwithstanding variability in the number of homes sold during a period and indicates ability to generate average returns on assets sold after considering home purchase costs, renovation costs, holding costs and selling costs.


We calculate the Average Return on Homes Sold After Interest Expense as revenue associated with homes sold during the period less direct costs attributable to those homes divided by the number of homes sold during the period. Specifically, direct costs include, with respect to each home sold during the period (1) home acquisition and renovation costs, which in turn include certain labor costs directly associated with these activities; (2) holding and selling costs; and (3) interest costs incurred. Included in direct holding and interest expense amounts for the periods presented are holding and interest costs recorded as period expenses in prior periods associated with homes sold in the presented period, which are not calculated in accordance with, or as an alternative for, GAAP and should not be considered in isolation or as a substitute for results reported under GAAP. Excluded from certain of these direct cost amounts are costs recorded in the presented period related to homes that remain in inventory at the end of the period, as shown in the tables below. We make these period adjustments because we believe presenting Average Return on Homes Sold After Interest Expense in this manner provides a focused view on a subset of our assets - homes sold during the period - and reflecting costs associated with those homes sold from the time we acquire to the time we sell the home, which may be useful to investors. Average Return on Homes Sold After Interest Expense is intended to illustrate the performance of homes sold during the period and is not intended to be a segment or company performance metric. Average Return on Homes Sold After Interest Expense is a supplemental measure of operating performance for a subset of assets and has limitations as an analytical tool, and you should not consider it in isolation or as a substitute for analysis of our results as reported under GAAP. Some of these limitations are: • Although depreciation and amortization are non-cash charges, the assets being depreciated and amortized may have to be replaced in the future, and Average Return on Homes Sold After Interest Expense does not reflect capital expenditure requirements for such replacements or for new capital expenditure requirements; • Average Return on Homes Sold After Interest Expense does not consider the potentially dilutive impact of share-based compensation; • Average Return on Homes Sold After Interest Expense does not include period costs that were not eligible for inventory capitalization associated with homes held in inventory at the end of the period; • Average Return on Homes Sold After Interest Expense does not reflect indirect expenses included in cost of revenue, sales and marketing, technology and development, or general and administrative expenses, some of which are recurring cash expenditures necessary to operate the business; and • Average Return on Homes Sold After Interest Expense does not reflect income taxes. The calculation of Average Return on Homes Sold After Interest Expense includes only those expenses directly attributed to the homes sold during the period. To arrive at return on homes sold after interest expense, the Company deducts from Zillow Offers gross profit (1) holding costs incurred in the presented period and prior periods for homes sold during the presented period that are included in sales and marketing expense, (2) selling costs incurred in the presented period for homes sold during the presented period that are included in sales and marketing expense and (3) interest expense incurred in the presented period and prior periods for homes sold during the presented period. The Company adds to Zillow Offers gross profit (1) inventory valuation adjustments recorded during the presented period associated with homes that remain in inventory at period end, net of inventory valuation adjustments recorded in prior periods related to homes sold in the presented period, and indirect expenses included in cost of revenue and (2) share-based compensation expense and depreciation and amortization expense included in cost of revenue. The following table presents the calculation of Zillow Offers average gross profit per home and Average Return on Homes Sold After Interest Expense and a reconciliation of return on homes sold after interest expense to Zillow Offers gross profit for the periods presented (unaudited):


Three Months Ended June 30, Calculation of Average Gross Profit per Home 2020 2019 Zillow Offers revenue $ 453,816,000 $ 248,924,000 Zillow Offers cost of revenue 430,032,000 240,732,000 Zillow Offers gross profit $ 23,784,000 $ 8,192,000 Homes sold 1,437 786 Average Zillow Offers gross profit per home $ 16,551 $ 10,422 Reconciliation of Non-GAAP Measure to Nearest GAAP Measure Zillow Offers gross profit $ 23,784,000 $ 8,192,000 Holding costs included in sales and marketing (1) (5,987,000) (2,569,000) Selling costs included in sales and marketing (2) (19,570,000) (10,676,000) Interest expense (3) (5,948,000) (3,532,000) Direct and indirect expenses included in cost of revenue (4) (2,573,000) 6,101,000 Share-based compensation expense and depreciation and 323,000 192,000 amortization expense included in cost of revenue Return on homes sold after interest expense $ (9,971,000) $ (2,292,000) Homes sold 1,437 786 Average return on homes sold after interest expense $ (6,939) $ (2,916) (1) Amount represents holding costs incurred related to homes sold in the presented period that were not eligible for inventory capitalization and were therefore expensed as period costs in the presented period and prior periods. These costs primarily include homeowners association dues, property taxes, insurance, utilities, and cleaning and maintenance costs incurred during the time a home is held for sale after the renovation period is complete. On a GAAP basis, the Company incurred a total of $2.6 million and $4.4 million of holding costs included in sales and marketing expense for the three months ended June 30, 2020 and 2019, respectively. (2) Amount represents selling costs incurred related to homes sold in the presented period that were not eligible for inventory capitalization and were therefore expensed as period costs in the presented period. These costs primarily include agent commissions paid upon the sale of a home. (3) Amount represents interest expense incurred related to homes sold in the presented period that was not eligible for inventory capitalization and was therefore expensed as a period cost in the presented period and prior periods. (4) Amount includes inventory valuation adjustments recorded during the period associated with homes that remain in inventory at period end, net of inventory valuation adjustments recorded in prior periods related to homes sold in the presented period, as well as corporate costs allocated to Zillow Offers such as headcount expenses and hosting-related costs related to the operation of our website.


Six Months Ended June 30, Calculation of Average Gross Profit per Home 2020 2019 Zillow Offers revenue $ 1,222,928,000 $ 377,396,000 Zillow Offers cost of revenue 1,160,569,000 363,151,000 Zillow Offers gross profit $ 62,359,000 $ 14,245,000 Homes sold 3,831 1,200 Average Zillow Offers gross profit per home $ 16,277 $ 11,871 Reconciliation of Non-GAAP Measure to Nearest GAAP Measure Zillow Offers gross profit $ 62,359,000 $ 14,245,000 Holding costs included in sales and marketing (1) (15,605,000) (3,807,000) Selling costs included in sales and marketing (2) (52,483,000) (16,218,000) Interest expense (3) (17,004,000) (5,187,000) Direct and indirect expenses included in cost of revenue (4) 1,257,000 7,021,000 Share-based compensation expense and depreciation and amortization expense included in cost of revenue 785,000 301,000 Return on homes sold after interest expense $ (20,691,000) $ (3,645,000) Homes sold 3,831 1,200 Average return on homes sold after interest expense $ (5,401) $ (3,038) (1) Amount represents holding costs incurred related to homes sold in the presented period that were not eligible for inventory capitalization and were therefore expensed as period costs in the presented period and prior periods. These costs primarily include homeowners association dues, property taxes, insurance, utilities, and cleaning and maintenance costs incurred during the time a home is held for sale after the renovation period is complete. On a GAAP basis, the Company incurred a total of $7.9 million and $6.7 million of holding costs included in sales and marketing expense for the six months ended June 30, 2020 and 2019, respectively. (2) Amount represents selling costs incurred related to homes sold in the presented period that were not eligible for inventory capitalization and were therefore expensed as period costs in the presented period. These costs primarily include agent commissions paid upon the sale of a home. (3) Amount represents interest expense incurred related to homes sold in the presented period that was not eligible for inventory capitalization and was therefore expensed as a period cost in the presented period and prior periods. (4) Amount includes inventory valuation adjustments recorded during the period associated with homes that remain in inventory at period end, net of inventory valuation adjustments recorded in prior periods related to homes sold in the presented period, as well as corporate costs allocated to Zillow Offers such as headcount expenses and hosting-related costs related to the operation of our website. Use of Operating Metrics Zillow Group reviews a number of operating metrics to evaluate its business, measure performance, identify trends, formulate business plans, and make strategic decisions. This communication includes Premier Agent Monthly Recurring Revenue (“MRR”). Zillow Group is temporarily using this operating metric to evaluate and provide investors with insight into the current health and performance of Zillow Group’s Premier Agent business. MRR Zillow Group determines total MRR by calculating the gross contractual monthly budgeted spend of Premier Agent and Premier Broker advertiser accounts, as of the date of determination, to project the revenue we expect to generate in a future month or to evaluate the performance of our Premier Agent and Premier Broker services in a previous month. Our MRR calculation includes all Premier Agent and Premier Broker revenue generating products and services (except for Flex) and assumes that there will not be changes to pricing or purchase or cancellation of any products or services that may be applicable to that account. Discounts do not impact MRR, as they do not change the contractual budgeted spend. New MRR


represents MRR from (i) new Premier Agent and Premier Broker advertisers and (ii) existing Premier Agent and Premier Broker advertisers that increased their budgeted spend during the relevant period. MRR is not determined by reference to historical revenue, deferred revenue, or any other GAAP financial measure over any period. It is forward-looking and contractually derived as of the date of determination.