jcom-20220510
0001084048false00010840482022-05-102022-05-10

UNITED STATES
SECURITIES AND EXCHANGE COMMISSION
Washington, D.C. 20549
FORM 8-K

CURRENT REPORT
Pursuant to Section 13 OR 15(d) of The Securities Exchange Act of 1934

Date of Report (date of earliest event reported) May 10, 2022

Ziff Davis, Inc.
(Exact name of registrant as specified in its charter)
Delaware
0-25965
47-1053457
(State or other jurisdiction of incorporation or organization)
(Commission File Number)
(I.R.S. Employer Identification No.)
114 5th Avenue, 15th Floor
New York, New York 10011
(Address of principal executive offices)

(212) 503-3500
(Registrant's telephone number, including area code)

Check the appropriate box below if the Form 8-K filing is intended to simultaneously satisfy the filing obligation of the registrant under any of the following provisions (see General Instruction A.2. below):

Written communications pursuant to Rule 425 under the Securities Act (17 CFR 230.425)

Soliciting material pursuant to Rule 14a-12 under the Exchange Act (17 CFR 240.14a-12)

Pre-commencement communications pursuant to Rule 14d-2(b) under the Exchange Act (17 CFR 240.14d-2(b))

Pre-commencement communications pursuant to Rule 13e-4(c) under the Exchange Act (17 CFR 240.13e-4(c))

Securities registered pursuant to Section 12(b) of the Act:
Title of each classTrading Symbol(s)Name of each exchange on which registered
Common Stock, $0.01 par valueZDNasdaq Stock Market LLC
Indicate by check mark whether the registrant is an emerging growth company as defined in Rule 405 of the Securities Act of 1933 (§230.405 of this chapter) or Rule 12b-2 of the Securities Exchange Act of 1934 (§240.12b-2 of this chapter).
Emerging growth company

If an emerging growth company, indicate by check mark if the registrant has elected not to use the extended transition period for complying with any new or revised financial accounting standards provided pursuant to Section 13(a) of the Exchange Act. o


Item 2.02. Results of Operations and Financial Condition.

On May 10, 2022, Ziff Davis, Inc. (the “Company”) issued a press release (the “First Quarter 2022 Results Press Release”) announcing its financial results for the first quarter of fiscal 2022 and reaffirming its financial guidance for fiscal year 2022.

A copy of the First Quarter 2022 Results Press Release is furnished as Exhibit 99.1 to this Form 8-K.

Item 7.01. Regulation FD Disclosure.

Board Chair Appointment. On May 10, 2022, the Company issued a press release (the “Fay Appointment Press Release”) announcing that the Board of Directors (the “Board”) of the Company has appointed Sarah Fay as Chair of the Board. A copy of the Fay Appointment Press Release is furnished as Exhibit 99.2 to this Form 8-K.

Earnings Conference Call. On May 11, 2022, at 8:30 a.m. Eastern Time, the Company will host its first quarter 2022 earnings conference call and Webcast. Via the Webcast, the Company will present portions of its May 2022 Investor Presentation, which contains a summary of the Company’s financial results for the fiscal quarter ended March 31, 2022, and certain other financial and operating information regarding the Company. A copy of this presentation is furnished as Exhibit 99.3 to this Form 8-K.

NOTE: The information in this Item 7.01 is being furnished and shall not be deemed “filed” for purposes of Section 18 of the Securities Exchange Act of 1934, as amended (the “Exchange Act”), or incorporated by reference in any filing under the Securities Act of 1933, as amended (the “Securities Act”) or the Exchange Act, except as shall be expressly set forth by specific reference in such a filing.

Item 9.01. Financial Statements and Exhibits.

(d) Exhibits

Exhibit
Number
Description
104Cover Page Interactive Data File (embedded within the Inline XBRL document)

This Current Report on Form 8-K contains forward-looking statements within the meaning of Section 27A of the Securities Act and Section 21E of the Exchange Act. Such forward-looking statements are subject to numerous assumptions, risks and uncertainties that could cause actual results to differ materially from those described in such statements. Such forward-looking statements are based on management’s expectations or beliefs as of May 10, 2022. Factors that might cause such differences include, but are not limited to, a variety of economic, competitive, and regulatory factors, many of which are beyond the Company’s control and are described in the Company’s Annual Report on Form 10-K filed by the Company on March 15, 2022 with the Securities and Exchange Commission (the “SEC”) and the other reports the Company files from time to time with the SEC. The Company undertakes no obligation to revise or publicly release any updates to such statements based on future information or actual results.


SIGNATURES

Pursuant to the requirements of the Securities Exchange Act of 1934, the registrant has duly caused this report to be signed on its behalf by the undersigned hereunto duly authorized.
   
    
Ziff Davis, Inc.
(Registrant)
 
      
Date:May 10, 2022By:/s/ Jeremy Rossen
    Jeremy Rossen
Executive Vice President, General Counsel


Ziff Davis Reports First Quarter 2022 Results & Reaffirms Full Year 2022 Guidance

NEW YORK, NY -- Ziff Davis, Inc. (NASDAQ: ZD) (“Ziff Davis”) today reported unaudited financial results for the first quarter ended March 31, 2022.

“We are very pleased to have delivered strong financial results in a challenging environment, once again demonstrating the strength and quality of our businesses,” said Vivek Shah, Chief Executive Officer of Ziff Davis. “We are also excited by the opportunities to allocate capital, given our strong liquidity position, to enhance shareholder value.”

FIRST QUARTER 2022 RESULTS

On October 7, 2021, Ziff Davis completed the spin-off of its Consensus Cloud Solutions, Inc. (“Consensus”) business. Ziff Davis has classified Consensus as a discontinued operation in its financial statements for the first quarter of 2021 results. Historical results in this press release represent continuing operations, except for the Statement of Cash Flows, net cash provided by operating activities and free cash flow during the first quarter of 2021, which are on a combined continuing and discontinued operations basis.

Q1 2022 quarterly revenues increased 1.1% to $315.1 million compared to $311.7 million for Q1 2021. On a pro-forma(1) basis, Q1 2022 quarterly revenues increased 5.3% to $315.1 million as compared to $299.1 million for Q1 2021.

GAAP net income per diluted share from continuing operations(2) decreased to $0.51 in Q1 2022 compared to $0.83 for Q1 2021. The net income decrease was primarily due to lower income from an equity method investment.

Adjusted non-GAAP net income per diluted share from continuing operations(2)(3) for the quarter decreased 1.0% to $1.23 as compared to $1.24 for Q1 2021. On a pro-forma(1) basis, Adjusted non-GAAP net income per diluted share from continuing operations(2)(3) for the quarter increased 3.4% to $1.23 compared to $1.19 for Q1 2021.

GAAP net income from continuing operations decreased to $24.5 million compared to $38.8 million for Q1 2021 primarily due to lower income from an equity method investment.

Adjusted non-GAAP net income from continuing operations increased by 4.5% to $57.9 million as compared to $55.4 million for Q1 2021. On a pro-forma(1) basis, Adjusted non-GAAP net income from continuing operations increased by 9.0% to $57.9 million as compared to $53.1 million for Q1 2021.

Adjusted EBITDA(4) for the quarter increased 0.1% to $100.8 million compared to $100.7 million for Q1 2021. On a pro-forma(1) basis, Adjusted EBITDA(4) for the quarter increased 5.1% to $100.8 million compared to $95.9 million for Q1 2021.

Net cash provided by operating activities from continuing operations was $116.5 million in Q1 2022. Free cash flow from continuing operations(6) was $86.0 million in Q1 2022.

Ziff Davis ended the quarter with approximately $988.7 million in cash, cash equivalents, and investments after deploying during the quarter approximately $58.7 million with respect to its share repurchase program, approximately $54.6 million to repay outstanding principal of its senior notes and approximately $30.8 million for current and prior year acquisitions.

Key unaudited financial results for Q1 2022 versus Q1 2021 are set forth in the following table (in millions, except per share amounts). Reconciliations of Adjusted non-GAAP net income per diluted share from continuing operations, Adjusted EBITDA and free cash flow from continuing operations to their nearest comparable GAAP financial measures are attached to this Press Release.


The following table reflects Actual and Pro-Forma Results from Continuing Operations for the first quarter of 2022 and 2021 (in millions, except per share amounts). Pro-Forma Results from Continuing Operations below excludes the operating results from Voice assets in the United Kingdom and the Company’s B2B Backup business that were sold in 2021.
Pro-Forma Results(1)
Q1 2022Q1 2021% ChangeQ1 2022Q1 2021% Change
Revenues
Digital Media$234.7 $226.8 3.5%$234.7 $226.8 3.5%
Cybersecurity and Martech$80.4 $84.9 (5.3)%$80.4 $72.3 11.2%
Total revenue(5):
$315.1 $311.7 1.1%$315.1 $299.1 5.3%
Income from operations$30.6 $26.9 13.8%
GAAP income per diluted share from continuing operations(2)
$0.51$0.83(38.6)%
Adjusted non-GAAP income per diluted share from continuing operations(2) (3)
$1.23$1.24(1.0)%$1.23 $1.19 3.4%
GAAP net income from continuing operations$24.5 $38.8 (36.9)%
Adjusted non-GAAP net income from continuing operations$57.9 $55.4 4.5%$57.9 $53.1 9.0%
Adjusted EBITDA(4)
$100.8 $100.7 0.1%$100.8 $95.9 5.1%
Adjusted EBITDA margin(4)
32.0 %32.3 %(0.3)%32.0 %32.1 %(0.1)%
Net cash provided by operating activities from continuing operations(6)
$116.5 
NA (7)
Free cash flow from continuing operations(6)
$86.0 
NA (7)

ZIFF DAVIS GUIDANCE

The Company reaffirms its guidance for fiscal year 2022 as follows (in millions, except per share data):

RevenueAdjusted EBITDAAdjusted non-GAAP Diluted EPS
FY 2022 Range of Estimates $1,497-$1,535$538-$555$6.52-$6.79

* Adjusted non-GAAP net income per diluted share for 2022 excludes share-based compensation of between $24 million and $28 million, amortization of acquired intangibles and the impact of any currently unanticipated items, in each case net of tax. It is anticipated that the non-GAAP effective tax rate for 2022 (exclusive of the release of reserves for uncertain tax positions) will be between 23.5% and 25%.

The Company has not reconciled the non-GAAP Business Outlook for 2022 Adjusted EBITDA or Adjusted non-GAAP Diluted EPS and the associated tax rate information included in this release to the most directly comparable GAAP measure because this cannot be done without unreasonable effort due to the variability with respect to costs related to acquisitions and taxation, which are potential adjustments to future earnings. We expect the variability of these items to have a potentially unpredictable and significant impact on our future non-GAAP financial results.


Notes:
(1)
Pro-forma figures are provided taking into consideration the sale of certain Voice assets in the United Kingdom as well as the sale of the Company’s B2B Backup business as if they had occurred January 1, 2021.
(2)
The estimated GAAP effective tax rates were approximately 16.7% for Q1 2022 and (90.3)% for Q1 2021. The estimated Adjusted non-GAAP effective tax rates were approximately 23.2% for Q1 2022 and 22.0% for Q1 2021.
(3)
Adjusted non-GAAP net income per diluted share excludes certain non-GAAP items, as defined in the Reconciliation of GAAP to Adjusted non-GAAP financial measures, for the three months ended March 31, 2022 and 2021 which totaled $0.72 and $0.41 per diluted share, respectively.
(4)Adjusted EBITDA is defined as net income from continuing operations before interest; gain on sale of businesses; unrealized gain (loss) on short-term investments, other income (expense), net; income tax expense (benefit); income (loss) from equity method investments, net; depreciation and amortization; and the items used to reconcile EPS to Adjusted non-GAAP EPS, as defined in the Reconciliation of GAAP to Adjusted non-GAAP financial measures. Adjusted EBITDA amounts are not meant as a substitute for GAAP, but are solely for informational purposes.
(5)The revenues associated with each of the businesses may not foot precisely since each is presented independently.
(6)Free cash flow from continuing operations is defined as net cash provided by operating activities from continuing operations, less purchases of property and equipment from continuing operations, plus contingent consideration from continuing operations. Free cash flow amounts are not meant as a substitute for GAAP, but are solely for informational purposes. There were no discontinued operations in the first quarter of 2022.
(7)
NA = Not available. The Company has not prepared net cash provided by operating activities from continuing operations and free cash flow from continuing operations for the first quarter of 2021. Net cash provided by operating activities from continuing and discontinued operations on a combined basis and free cash flow from continuing and discontinued operations on a combined basis for the three months ended March 31, 2021 was $178.7 million and $152.5 million, respectively. Free cash flow from continuing and discontinued operations is defined as net cash provided by operating activities from continuing and discontinued operations, less purchases of property and equipment from continuing and discontinued operations, plus contingent consideration from continuing and discontinued operations. 


About Ziff Davis
Ziff Davis, Inc. (NASDAQ: ZD) is a vertically focused digital media and internet company whose portfolio includes leading brands in technology, entertainment, shopping, health, cybersecurity, and martech. For more information, visit www.ziffdavis.com.

Contact:
Rebecca Wright
Ziff Davis, Inc.
800-577-1790
[email protected]
 
“Safe Harbor” Statement Under the Private Securities Litigation Reform Act of 1995: Certain statements in this Press Release are “forward-looking statements” within the meaning of The Private Securities Litigation Reform Act of 1995, including those contained in Vivek Shah’s quote and the “Business Outlook” portion regarding the Company’s expected fiscal 2022 financial performance. These forward-looking statements are based on management’s current expectations or beliefs and are subject to numerous assumptions, risks and uncertainties that could cause actual results to differ materially from those described in the forward-looking statements. These factors and uncertainties include, among other items: the Company’s ability to grow advertising revenues, profitability and cash flows; the Company’s ability to make interest and debt payments; the Company’s ability to identify, close and successfully transition acquisitions; subscriber growth and retention; variability of the Company’s revenue based on changing conditions in particular industries and the economy generally; protection of the Company’s proprietary technology or infringement by the Company of intellectual property of others; the risk of losing critical third-party vendors or key personnel; the risks associated with fraudulent activity, system failure or a security breach; risks related to our ability to adhere to our internal controls and procedures; the risk of adverse changes in the U.S. or international regulatory environments, including but not limited to the imposition or increase of taxes or regulatory-related fees; the risk of liability for legal and other claims; and the numerous other factors set forth in Ziff Davis’s (formerly J2 Global, Inc.) filings with the Securities and Exchange Commission (“SEC”). For a more detailed description of the risk factors and uncertainties affecting Ziff Davis, refer to the 2021 Annual Report on Form 10-K filed by Ziff Davis on March 15, 2022, and the other reports filed by Ziff Davis from time-to-time with the SEC, each of which is available at www.sec.gov. The forward-looking statements provided in this press release, including those contained in Vivek Shah’s quote and in the “Business Outlook” portion regarding the Company’s expected fiscal 2022 financial performance are based on limited information available to the Company at this time, which is subject to change. Although management’s expectations may change after the date of this press release, the Company undertakes no obligation to revise or update these statements.


About Non-GAAP Financial Measures

To supplement our consolidated financial statements, which are prepared and presented in accordance with GAAP, we use the following Adjusted non-GAAP financial measures: Adjusted non-GAAP and Pro Forma net income, Adjusted non-GAAP and Pro Forma net income per diluted share, Adjusted and Pro Forma EBITDA and free cash flow. The presentation of this financial information is not intended to be considered in isolation or as a substitute for, or superior to, the financial information prepared and presented in accordance with GAAP.

We use these Adjusted non-GAAP financial measures for financial and operational decision-making and as a means to evaluate period-to-period comparisons. Our management believes that these Adjusted non-GAAP financial measures provide meaningful supplemental information regarding our performance and liquidity by excluding certain expenses and expenditures that may not be indicative of our recurring core business operating results. We believe that both management and investors benefit from referring to these Adjusted non-GAAP financial measures in assessing our performance and when planning, forecasting, and analyzing future periods. These Adjusted non-GAAP financial measures also facilitate management’s internal comparisons to our historical performance and liquidity. We believe these Adjusted non-GAAP financial measures are useful to investors both because (1) they allow for greater transparency with respect to key metrics used by management in its financial and operational decision-making and (2) they are used by our institutional investors and the analyst community to help them analyze the health of our business.

For more information on these Adjusted non-GAAP financial measures, please see the appropriate GAAP to Adjusted non-GAAP reconciliation tables included within the attached Exhibit to this release. 


ZIFF DAVIS, INC. AND SUBSIDIARIES
CONDENSED CONSOLIDATED BALANCE SHEETS
(UNAUDITED, IN THOUSANDS)
March 31, 2022December 31, 2021
ASSETS  
Cash and cash equivalents$629,030 $694,842 
Short-term investments238,151 229,200 
Accounts receivable, net of allowances263,659 316,342 
Prepaid expenses and other current assets62,089 60,290 
Total current assets1,192,929 1,300,674 
Long-term investments 121,552 122,593 
Property and equipment, net160,399 161,209 
Operating lease right-of-use assets53,585 55,617 
Trade names, net144,084 147,761 
Customer relationships, net260,577 275,451 
Goodwill1,557,078 1,531,455 
Other purchased intangibles, net139,985 149,513 
Deferred income taxes, noncurrent6,143 5,917 
Other assets26,839 20,090 
TOTAL ASSETS$3,663,171 $3,770,280 
LIABILITIES AND STOCKHOLDERS’ EQUITY 
Accounts payable and accrued expenses$213,001 $226,621 
Income taxes payable, current2,025 3,151 
Deferred revenue, current190,418 185,571 
Operating lease liabilities, current26,459 27,156 
Current portion of long-term debt— 54,609 
Other current liabilities288 130 
Total current liabilities432,191 497,238 
Long-term debt1,122,945 1,036,018 
Deferred revenue, noncurrent13,655 14,839 
Operating lease liabilities, noncurrent49,719 53,708 
Income taxes payable, noncurrent11,675 11,675 
Liability for uncertain tax positions42,949 42,546 
Deferred income taxes, noncurrent91,211 108,982 
Other long-term liabilities33,332 37,542 
TOTAL LIABILITIES1,797,677 1,802,548 
Commitments and contingencies— — 
Preferred stock — — 
Common stock470 474 
Additional paid-in capital 415,653 509,122 
Retained earnings1,508,802 1,515,358 
Accumulated other comprehensive loss(59,431)(57,222)
TOTAL STOCKHOLDERS’ EQUITY1,865,494 1,967,732 
TOTAL LIABILITIES AND STOCKHOLDERS’ EQUITY$3,663,171 $3,770,280 


ZIFF DAVIS, INC. AND SUBSIDIARIES
CONDENSED CONSOLIDATED STATEMENTS OF OPERATIONS
(UNAUDITED, IN THOUSANDS EXCEPT SHARE AND PER SHARE DATA)
Three Months Ended March 31,
20222021
Total revenues$315,068 $311,657 
Cost of revenues (1)
46,100 43,852 
Gross profit268,968 267,805 
Operating expenses:
Sales and marketing (1)
117,762 107,951 
Research, development and engineering (1)
18,427 19,675 
General and administrative (1)
102,217 113,298 
Total operating expenses238,406 240,924 
Income from operations30,562 26,881 
Interest expense, net(11,510)(21,477)
Gain on sale of businesses— 1,979 
Unrealized gain on short-term investments8,951 — 
Other income, net2,399 243 
Income from continuing operations before income taxes and (loss) income from equity method investment, net30,402 7,626 
Income tax expense (benefit)5,080 (6,884)
(Loss) income from equity method investment, net(785)24,270 
Net income from continuing operations$24,537 $38,780 
Income from discontinued operations, net of income taxes— 39,142 
Net income24,537 77,922 
Net income per common share from continuing operations:
Basic$0.52 $0.87 
Diluted$0.51 $0.83 
Net income per common share from discontinued operations:
Basic$0.88 
Diluted$0.84 
Net income per common share:
Basic$0.52 $1.75 
Diluted$0.51 $1.67 
Weighted average shares outstanding:
Basic47,054,411 44,399,149 
Diluted52,405,317 46,731,872 
(1) Includes share-based compensation expense as follows:
Cost of revenues$84 $83 
Sales and marketing569 266 
Research, development and engineering629 418 
General and administrative5,435 4,963 
Total$6,717 $5,730 


ZIFF DAVIS, INC. AND SUBSIDIARIES
CONDENSED CONSOLIDATED STATEMENTS OF CASH FLOWS
(UNAUDITED, IN THOUSANDS)
                                                              Three Months Ended March 31,
20222021
Cash flows from operating activities:
Net income$24,537 $77,922 
Adjustments to reconcile net income to net cash provided by operating activities:
Depreciation and amortization59,071 65,492 
Amortization of financing costs and discounts613 7,296 
Non-cash operating lease costs2,392 3,320 
Share-based compensation6,717 6,113 
Provision for credit losses on accounts receivable(1,032)2,485 
Deferred income taxes, net(3,745)(5,380)
Loss on extinguishment of debt 1,220 — 
Gain on sale of businesses— (1,979)
Lease asset impairments and other charges— 1,086 
Changes in fair value of contingent consideration112 510 
Foreign currency remeasurement gain143 655 
Loss (income) from equity method investments785 (24,270)
Unrealized gain on short-term investments(8,951)— 
Decrease (increase) in:
Accounts receivable 57,483 68,564 
Prepaid expenses and other current assets10,638 (2,481)
Operating lease right-of-use assets1,938 1,438 
Other assets(7,541)1,193 
Increase (decrease) in:
Accounts payable and accrued expenses(25,694)(22,078)
Income taxes payable3,193 2,471 
Deferred revenue3,061 7,867 
Operating lease liabilities(6,924)(7,389)
Liability for uncertain tax positions403 1,304 
Other long-term liabilities(1,908)(5,415)
Net cash provided by operating activities116,511 178,724 
Cash flows from investing activities:
Purchases of equity method investment— (8,064)
Purchases of equity investments— (999)
Purchases of property and equipment(30,502)(26,269)
Acquisition of businesses, net of cash received(28,136)385 
Proceeds from sale of assets— 5,999 
Purchases of intangible assets— (8)
Net cash used in investing activities$(58,638)(28,956)
Cash flows from financing activities:
Payment of debt(54,609)— 
Debt extinguishment costs(756)— 
Repurchase of common stock(62,810)(12,179)
Exercise of stock options148 444 
Deferred payments for acquisitions(2,676)(7,853)
Other(5)(551)
Net cash used in financing activities(120,708)(20,139)
Effect of exchange rate changes on cash and cash equivalents(2,977)(310)


Net change in cash and cash equivalents(65,812)129,319 
Cash and cash equivalents at beginning of period694,842 242,652 
Cash and cash equivalents at beginning of period associated with discontinued operations— 66,210 
Cash and cash equivalents at beginning of period associated with continuing operations694,842 176,442 
Cash and cash equivalents at end of period629,030 371,971 
Cash and cash equivalents at end of period associated with discontinued operations— 149,675 
Cash and cash equivalents at end of period associated with continuing operations$629,030 $222,296 


ZIFF DAVIS, INC. AND SUBSIDIARIES
RECONCILIATION OF GAAP TO ADJUSTED NON-GAAP FINANCIAL MEASURES
THREE MONTHS ENDED MARCH 31, 2022 AND 2021
(UNAUDITED, IN THOUSANDS, EXCEPT PER SHARE AMOUNTS)

Adjusted non-GAAP net income from continuing operations is GAAP net income from continuing operations with the following modifications: (1) elimination of share-based compensation; (2) elimination of certain acquisition related integration costs; (3) elimination of interest costs in excess of the coupon rate associated with outstanding debt; (4) elimination of amortization of patents and intangible assets that we acquired; (5) elimination of change in value of investments; (6) elimination of gain/loss on sale of assets; (7) elimination of lease asset impairments and other charges; (8) elimination of disposal related costs; (9) elimination of dilutive effect of the convertible debt.

Three months ended March 31,
2022Per diluted share*2021Per diluted share*
Net income from continuing operations$24,537 $0.51 $38,780 $0.83 
Plus:
Share based compensation (1)
4,878 0.10 3,289 0.07 
Acquisition related integration costs (2)
1,200 0.03 2,111 0.05 
Interest costs (3)
1,006 0.02 4,845 0.11 
Amortization (4)
32,398 0.69 32,456 0.73 
Investments (5)
(8,167)(0.17)(25,444)(0.57)
Sale of assets (6)
— — (2,022)(0.05)
Lease asset impairments and other charges (7)
1,258 0.03 1,417 0.03 
Disposal related costs (8)
818 0.02 — — 
Convertible debt dilution (9)
— — — 0.04 
Adjusted non-GAAP net income from continuing operations$57,928 $1.23 $55,432 $1.24 
* The reconciliation of net income from continuing operations per diluted share from GAAP to Adjusted non-GAAP net income from continuing operations per share may not foot since each is calculated independently.


ZIFF DAVIS, INC. AND SUBSIDIARIES
RECONCILIATION OF GAAP TO ADJUSTED NON-GAAP FINANCIAL MEASURES
THREE MONTHS ENDED MARCH 31, 2022 AND 2021
(UNAUDITED, IN THOUSANDS, EXCEPT PER SHARE AMOUNTS)

Three months ended March 31,
20222021
Cost of revenues$46,100 $43,852 
Plus:
Share based compensation(1)
(85)(82)
Acquisition related integration costs(2)
(52)(40)
Amortization(4)
(278)(593)
Adjusted non-GAAP cost of revenues$45,685 $43,137 
Sales and marketing117,762 $107,951 
Plus:
Share based compensation(1)
(569)(266)
Acquisition related integration costs(2)
(166)(837)
Lease asset impairments and other charges(7)
(524)— 
Adjusted non-GAAP sales and marketing$116,503 $106,848 
Research, development and engineering$18,427 $19,675 
Plus:
Share based compensation(1)
(629)(418)
Acquisition related integration costs(2)
(218)(324)
Adjusted non-GAAP research, development and engineering$17,580 $18,933 
General and administrative$102,217 $113,298 
Plus:
Share based compensation(1)
(5,434)(4,963)
Acquisition related integration costs(2)
(1,100)(2,349)
Amortization(4)
(41,225)(47,209)
Lease asset impairments and other charges(7)
(1,141)(1,874)
Disposal related costs(8)
(1,239)— 
Adjusted non-GAAP general and administrative$52,078 $56,903 
Interest expense, net$(11,510)$(21,477)
Plus:
Interest costs (3)
(1,337)(6,417)
Adjusted non-GAAP interest expense, net$(12,847)$(27,894)


ZIFF DAVIS, INC. AND SUBSIDIARIES
RECONCILIATION OF GAAP TO ADJUSTED NON-GAAP FINANCIAL MEASURES - CONTINUED
THREE MONTHS ENDED MARCH 31, 2022 AND 2021
(UNAUDITED, IN THOUSANDS, EXCEPT PER SHARE AMOUNTS)

Three months ended March 31,
20222021
Gain on sale of businesses$ $1,979 
Plus:
Sale of assets(6)
— (1,979)
Adjusted non-GAAP gain on sale of businesses$ $ 
Unrealized gain on short-term investments8,951 $ 
Plus:
Investments(5)
(8,951)— 
Adjusted non-GAAP unrealized gain on short-term investments, net$ $ 
Other income, net$2,399 $243 
Plus:
Sale of assets(6)
— — 
Adjusted non-GAAP other income, net$2,399 $243 
Income tax (expense) benefit$(5,080)$6,884 
Plus:
Share based compensation(1)
1,839 2,440 
Acquisition related integration costs(2)
334 1,439 
Interest costs(3)
334 1,572 
Amortization(4)
9,104 15,346 
Investments(5)
— 1,174 
Sale of assets(6)
— 43 
Lease asset impairments and other charges(7)
407 457 
Disposal related costs(8)
422 — 
Adjusted non-GAAP income tax benefit $7,360 $29,355 
(Loss) income from equity method investment, net$(785)$24,270 
Plus:
Investments(5)
785 (24,270)
Adjusted non-GAAP income from equity method investment, net$ $ 


ZIFF DAVIS, INC. AND SUBSIDIARIES
RECONCILIATION OF GAAP TO ADJUSTED NON-GAAP FINANCIAL MEASURES - CONTINUED
THREE MONTHS ENDED MARCH 31, 2022 AND 2021
(UNAUDITED, IN THOUSANDS, EXCEPT PER SHARE AMOUNTS)

Three months ended March 31,
20222021
Total adjustments$(33,391)$(16,652)
GAAP Net income per diluted share from continuing operations$0.51 $0.83 
Adjustments *$0.72 $0.41 
Adjusted non-GAAP Net income per diluted share from continuing operations$1.23 $1.24 
* The reconciliation of Net income per share from GAAP to Adjusted non-GAAP may not foot since each is calculated independently.


The Company discloses Adjusted non-GAAP net income per diluted share (“Adjusted Diluted EPS”) as a supplemental Non-GAAP financial performance measure, as it believes it is a useful metric by which to compare the performance of its business from period to period. The Company also understands that an Adjusted Diluted EPS measure is broadly used by analysts, rating agencies and investors in assessing the Company’s performance. Accordingly, the Company believes that the presentation of Adjusted Diluted EPS provides useful information to investors.

Adjusted Diluted EPS is not in accordance with, or an alternative to, net income per diluted share from continuing operations and may be different from Non-GAAP measures with similar or even identical names used by other companies. In addition, Adjusted Diluted EPS is not based on any comprehensive set of accounting rules or principles. The Adjusted Diluted EPS measure has limitations in that it does not reflect all of the amounts associated with the Company’s results of operations determined in accordance with GAAP.


Non-GAAP Financial Measures

To supplement its condensed consolidated financial statements, which are prepared and presented in accordance with US generally accepted accounting principles (“GAAP”), the Company uses the following Non-GAAP financial measures: Adjusted EBITDA, Adjusted non-GAAP net income from continuing operations, and Adjusted Diluted EPS from continuing operations (collectively the “Non-GAAP financial measures”). The presentation of this financial information is not intended to be considered in isolation or as a substitute for, or superior to, the financial information prepared and presented in accordance with U.S. GAAP. The Company uses these non-GAAP financial measures for financial and operational decision making and as a means to evaluate period-to-period comparisons. The Company believes that they provide useful information about core operating results, enhance the overall understanding of past financial performance and future prospects, and allow for greater transparency with respect to key metrics used by management in its financial and operational decision making.

(1) Share Based Compensation. The Company excludes stock-based compensation because it is non-cash in nature and because the Company believes that the non-GAAP financial measures excluding this item provide meaningful supplemental information regarding operational performance. The Company further believes this measure is useful to investors in that it allows for greater transparency to certain line items in its financial statements. In addition, excluding this item from the non-GAAP measures facilitates comparisons to historical operating results and comparisons to peers, many of which similarly exclude this item.

(2) Acquisition Related Integration Costs. The Company excludes certain acquisition and related integration costs such as adjustments to contingent consideration, severance, lease terminations, retention bonuses and other acquisition-specific items. The Company believes that the Non-GAAP financial measures excluding this item provide meaningful supplemental information regarding operational performance. In addition, excluding this item from the non-GAAP measures facilitates comparisons to historical operating results and comparisons to peers, many of which similarly exclude this item.

(3) Interest Costs. In June 2014, the Company issued $402.5 million aggregate principal amount of 3.25% convertible senior notes and in November 2019, the Company issued $550.0 million aggregate principal amount of 1.75% convertible senior notes. For the three months ended March 31, 2021, the Company separately accounted for the value of the liability and equity features of its outstanding convertible senior notes in a manner that reflects the Company’s non-convertible debt borrowing rate. The value of the conversion feature, reflected as a debt discount, was amortized to interest expense over time. Accordingly, the Company recognized imputed interest expense on its 3.25% and 1.75% convertible senior notes of approximately 5.8% and 5.5%, respectively, in its statement of operations during the three months ended March 31, 2021. The Company excluded the difference between the imputed interest expense and the coupon interest expense of 3.25% and 1.75%, respectively, because it was non-cash in nature and because the Company believes that the non-GAAP financial measures excluding this item provide meaningful supplemental information regarding core operational performance. During the three months ended March 31, 2022, the Company adopted ASU 2020-06, Debt-Debt with Conversion and Other Options (Subtopic 470-20) and Derivatives and Hedging - Contracts in Entity’s own Equity (Subtopic 815-40): Accounting for Convertible Instruments and Contracts in an Entity’s Own Equity, whereby a portion of the convertible senior notes is no longer recorded in equity with a debt discount and amortization in interest expense. Therefore, no similar adjustment was made for the three months ended March 31, 2022. The Company has excluded the difference between the imputed and coupon interest expense associated with the 4.625% Senior Notes in each period presented. Further, for the three months ended March 31, 2022, the Company recorded a loss on extinguishment associated with the buy-back of its 4.625% Senior Notes, which is included within this Non-GAAP adjustment. The Company has determined excluding these items from the non-GAAP measures facilitates comparisons to historical operating results and comparisons to peers, many of which similarly exclude this item.

(4) Amortization. The Company excludes amortization of patents and acquired intangible assets because it is non-cash in nature and because the Company believes that the non-GAAP financial measures excluding this item provide meaningful supplemental information regarding operational performance. In addition, excluding this item from the non-GAAP measures facilitates comparisons to historical operating results and comparisons to peers, many of which similarly exclude this item.

(5) Change in Value on Investments. The Company excludes the change in value of its investments, which includes income (loss) from equity method investments, the unrealized gain (loss) on its investment in Consensus and other income (loss) on investments. The Company believes that the non-GAAP financial measures excluding this item provide meaningful supplemental information regarding operational performance as these items are not part of the Company’s core operations. In addition, excluding these items from the non-GAAP measures facilitates comparisons to historical operating results.

(6) Gain (Loss) on Sale of Assets. The Company excludes the gain (loss) on sale of certain of its assets. The Company believes that the non-GAAP financial measures excluding this item provide meaningful supplemental information regarding operational performance. In addition, excluding this item from the non-GAAP measures facilitates comparisons to historical operating results.


(7) Lease Asset Impairments and Other Charges. The Company excludes lease asset impairments and other charges as they are non-cash in nature and because the Company believes that the non-GAAP financial measures excluding this item provide meaningful supplemental information regarding operational performance. In addition, excluding this item from the non-GAAP measures facilitates comparisons to historical operating results.

(8) Disposal related Costs. The Company excludes expenses associated with the disposal of certain businesses. The Company believes that the non-GAAP financial measures excluding this item provide meaningful supplemental information regarding operational performance. In addition, excluding this item from the non-GAAP measures facilitates comparisons to historical operating results.

(9) Convertible Debt Dilution. The Company excludes convertible debt dilution from diluted EPS. The Company believes that the Non-GAAP financial measures excluding this item provide meaningful supplemental information regarding operational performance. In addition, excluding this item from the Non-GAAP measures facilitates comparisons to historical operating results.

The Company presents Adjusted non-GAAP Cost of Revenues, Adjusted non-GAAP Research, Development and Engineering, Adjusted non-GAAP Sales and Marketing, Adjusted non-GAAP General and Administrative, Adjusted non-GAAP Interest Expense, Adjusted Gain on Sale of Businesses, Adjusted non-GAAP Loss on Investments, Adjusted non-GAAP Other (Income) Expense, Adjusted non-GAAP Income Tax benefit (expense), Adjusted non-GAAP (Income) Loss from Equity Method Investment, Net and Adjusted non-GAAP Net income because the Company believes that these provide useful information about our operating results and enhance the overall understanding of past financial performance and future prospects.


Pro-Forma Financial Results

Key pro-forma financial results for the three months ended March 31, 2022 and 2021, are set forth in the following table (in millions, except per share amounts). The financial results below reflect the Company’s results, on a pro-forma basis, taking into consideration the sale of certain Voice assets in the United Kingdom as well as the sale of the Company’s B2B Backup business as if they had occurred January 1, 2021.

 Three months ended March 31,
20222021
Total Revenues$315.1 $311.7 
Pro-Forma Revenue Adjustments$— $(12.6)
Pro-Forma Total Revenue: (1)
$315.1 $299.1 
Adjusted Non-GAAP Net Income per Diluted Share from Continuing Operations (1)
$1.23 $1.24 
Pro-Forma Net Income per Diluted Share from Continuing Operations Adjustments$— $(0.05)
Adjusted Pro Forma Net Income per Diluted Share from Continuing Operations (1)
$1.23 $1.19 
Adjusted Non-GAAP Net Income from Continuing Operations$57.9 $55.4 
Pro-Forma Net Income from Continuing Operations Adjustments$— $(2.3)
Adjusted Pro-Forma Net Income from Continuing Operations$57.9 $53.1 
Adjusted EBITDA (1)
$100.8 $100.7 
Pro-Forma EBITDA Adjustments$— $(4.8)
Adjusted Pro-Forma EBITDA (1)
$100.8 $95.9 
Adjusted EBITDA Margin (1)
32.0%32.3%
Pro-Forma EBITDA Margin Adjustments0.0%(0.2)%
Adjusted Pro-Forma EBITDA Margin (1)
32.0%32.1%
(1)Refer to the notes earlier in this Release.


ZIFF DAVIS, INC. AND SUBSIDIARIES
RECONCILIATION OF GAAP TO ADJUSTED NON-GAAP FINANCIAL MEASURES
THREE MONTHS ENDED MARCH 31, 2022 AND 2021
(UNAUDITED, IN THOUSANDS)

The following table sets forth a reconciliation of Adjusted EBITDA to net income from continuing operations, the most directly comparable GAAP financial measure.
Three Months Ended March 31,
20222021
Net income from continuing operations$24,537 $38,780 
Plus:
Interest expense, net11,510 21,477 
Loss (gain) on sale of businesses— (1,979)
Unrealized gain on short-term investment(8,951)— 
Other income, net(2,399)(243)
Income tax expense (benefit)5,080 (6,884)
Loss (income) from equity method investment, net785 (24,270)
Depreciation and amortization59,071 62,670 
Reconciliation of GAAP to Adjusted non-GAAP financial measures:
Share-based compensation6,717 5,730 
Acquisition-related integration costs1,534 3,550 
Lease asset impairments and other charges1,665 1,874 
Disposal related costs1,239 — 
Adjusted EBITDA$100,788 $100,705 

Adjusted EBITDA as calculated above represents net income from continuing operations before interest, gain on sale of businesses, unrealized gain on short-term investment, other (income) expense, net, income tax expense, (income) loss from equity method investments, net, depreciation and amortization and the items used to reconcile GAAP to Adjusted non-GAAP financial measures, including (1) share-based compensation, (2) certain acquisition-related integration costs, (3) lease asset impairments and other charges and (4) disposal related costs. We disclose Adjusted EBITDA as a supplemental Non-GAAP financial performance measure as we believe it is a useful metric by which to compare the performance of our business from period to period. We understand that measures similar to Adjusted EBITDA are broadly used by analysts, rating agencies and investors in assessing our performance. Accordingly, we believe that the presentation of Adjusted EBITDA provides useful information to investors.

Adjusted EBITDA is not in accordance with, or an alternative to, net income from continuing operations, and may be different from non-GAAP measures used by other companies. In addition, Adjusted EBITDA is not based on any comprehensive set of accounting rules or principles. This Adjusted non-GAAP measure has limitations in that it does not reflect all of the amounts associated with the Company’s results of operations determined in accordance with GAAP.


ZIFF DAVIS, INC. AND SUBSIDIARIES
NON-GAAP FINANCIAL MEASURES
(UNAUDITED, IN THOUSANDS)


Q1Q2Q3Q4YTD
2022
Net cash provided by operating activities $116,511 $— $— $— $116,511 
Less: Purchases of property and equipment(30,502)— — — (30,502)
Add: Contingent consideration— — — — — 
Free cash flow$86,009 $ $ $ $86,009 

Q1Q2Q3Q4YTD
2021
Net cash provided by operating activities from continuing and discontinued operations$178,724 $111,298 $140,230 $85,319 $515,571 
Less: Purchases of property and equipment(26,269)(31,497)(29,729)(26,245)(113,740)
Add: Contingent consideration(1)
— 685 — — 685 
Free cash flow from continuing and discontinued operations$152,455 $80,486 $110,501 $59,074 $402,516 
(1)Free cash flows from continuing and discontinued operations of $80.5 million for Q2 2021 is before the effect of payments associated with certain contingent consideration related to recent acquisitions.

The Company discloses free cash flows from continuing and discontinued operations as supplemental non-GAAP financial performance measure, as it believes it is a useful metric by which to compare the performance of its business from period to period. The Company also understands that this non-GAAP measure is broadly used by analysts, rating agencies and investors in assessing the Company’s performance. Accordingly, the Company believes that the presentation of this non-GAAP financial measure provides useful information to investors.

Free cash flows from continuing and discontinued operations is not in accordance with, or an alternative to, Cash flows from operating activities, and may be different from non-GAAP measures with similar or even identical names used by other companies. In addition, the non-GAAP measure is not based on any comprehensive set of accounting rules or principles. This non-GAAP measure has limitations in that it does not reflect all of the amounts associated with the Company’s results of operations determined in accordance with GAAP.


ZIFF DAVIS, INC. AND SUBSIDIARIES
RECONCILIATION OF GAAP TO ADJUSTED NON-GAAP FINANCIAL MEASURES
THREE MONTHS ENDED MARCH 31, 2022
(UNAUDITED, IN THOUSANDS)
    
DigitalCybersecurity
Mediaand MartechCorporateTotal
Revenues
GAAP revenues$234,695 $80,373 $— $315,068 
Gross profit
GAAP gross profit$209,695 $59,273 $— $268,968 
Non-GAAP adjustments:
Share-based compensation79 — 84 
Acquisition related integration costs(3)54 — 51 
Amortization— 278 — 278 
Adjusted non-GAAP gross profit$209,697 $59,684 $— $269,381 
Operating profit
Income (loss) from operations$31,888 $12,264 $(13,590)$30,562 
Non-GAAP adjustments:
Share-based compensation2,431 1,241 3,045 6,717 
Acquisition related integration costs1,165 347 22 1,534 
Amortization31,840 9,569 93 41,502 
Lease asset impairments and other charges1,436 229 — 1,665 
Disposal related costs11 — 1,228 1,239 
Adjusted non-GAAP operating profit (loss)$68,771 $23,650 $(9,202)$83,219 
Depreciation14,281 3,288 — 17,569 
Adjusted EBITDA$83,052 $26,938 $(9,202)$100,788 
Table above excludes certain intercompany allocations.


ZIFF DAVIS, INC. AND SUBSIDIARIES
RECONCILIATION OF GAAP TO ADJUSTED NON-GAAP FINANCIAL MEASURES
THREE MONTHS ENDED MARCH 31, 2021
(UNAUDITED, IN THOUSANDS)
    
DigitalCybersecurity
Mediaand MartechCorporateTotal
Revenues
GAAP revenues$226,806 $84,851 $— $311,657 
Gross profit
GAAP gross profit$206,013 $61,857 $(65)$267,805 
Non-GAAP adjustments:
Share-based compensation79 — 82 
Acquisition related integration costs— 40 — 40 
Amortization— 593 — 593 
Adjusted non-GAAP gross profit$206,016 $62,569 $(65)$268,520 
Operating profit
Income (loss) from operations$30,600 $11,918 $(15,637)$26,881 
Non-GAAP adjustments:
Share-based compensation1,647 1,108 2,975 5,730 
Acquisition related integration costs2,053 378 1,119 3,550 
Amortization37,059 10,648 95 47,802 
Lease asset impairments and other charges1,716 158 — 1,874 
Adjusted non-GAAP operating profit (loss)$73,075 $24,210 $(11,448)$85,837 
Depreciation11,291 3,577 — 14,868 
Adjusted EBITDA$84,366 $27,787 $(11,448)$100,705 
Table above excludes certain intercompany allocations.


Sarah Fay Appointed Chair of Ziff Davis Board of Directors
Company Release - 4:05pm ET, 5/10/2022
NEW YORK--(BUSINESS WIRE)-- Ziff Davis, Inc. (NASDAQ: ZD), today announced that Sarah Fay, who has served as a Board member since 2018, has been appointed Chair of the Ziff Davis Board of Directors, effective immediately. She replaces Richard Ressler, a Board member since 1997, who recently announced his retirement from the Ziff Davis Board and as its Chair.
“I am thrilled that Sarah is our new Chair. Her wisdom, perspective, and commitment to our company and its stakeholders is unmatched,” said Ziff Davis CEO Vivek Shah. “I also want to express my deep gratitude to Richard who has been a guiding force for our company since its beginnings and a valuable mentor to me.”
Fay is a Managing Director with Boston-based venture capital firm Glasswing Ventures. She formerly served as Chief Executive Officer of Aegis Media North America, a media and digital marketing communications company. Prior to this position, Fay served as President of Carat US and Isobar US. She is Co-Lead of the steering committee of All Raise’s Boston Chapter, on the Executive Board of the Ad Club of Boston, the Board of Boston’s Chamber of Commerce, and on the Board of The Massachusetts Innovation and Technology Exchange (MITX).
“I am excited to work closely with Vivek and the Board to continue Ziff Davis’ exceptional track record of creating value for its stakeholders,” said Fay. “Our portfolio of digital media and Internet brands is powerful and we are proven experts in digital transformation.”
About Ziff Davis


Ziff Davis (NASDAQ: ZD) is a vertically focused digital media and internet company whose portfolio includes leading brands in technology, entertainment, shopping, health, cybersecurity and martech. For more information, visit www.ziffdavis.com.
Rebecca Wright
Ziff Davis, Inc.
(212) 503-5247
[email protected]

Source: Ziff Davis, Inc.


www.ziffdavis.com©2022 Ziff Davis. All rights reserved. FIRST QUARTER 2022 RESULTS MAY 10, 2022

 
2 Certain statements in this presentation are “forward-looking statements” within the meaning of the Private Securities Litigation Reform Act of 1995, particularly those regarding our 2022 Financial Guidance. Such forward-looking statements are subject to numerous assumptions, risks and uncertainties that could cause actual results to differ materially from those described in those statements. Readers should carefully review the Risk Factors slide of this presentation. These forward-looking statements are based on management’s expectations or beliefs as of May 10, 2022 as well as those set forth in our Annual Report on Form 10-K filed by us on March 15, 2022 with the Securities and Exchange Commission (“SEC”) and the other reports we file from time to time with the SEC. We undertake no obligation to revise or publicly release any updates to such statements based on future information or actual results. Such forward-looking statements address the following subjects, among others: • Future operating results • Ability to acquire businesses on acceptable terms and integrate and recognize synergies from acquired businesses • Deployment of cash and investment balances to grow the company • Subscriber growth, retention, usage levels and average revenue per account • Digital media and cloud services growth • International growth • New products, services, features and technologies • Corporate spending including stock repurchases • Intellectual property and related licensing revenues • Liquidity and ability to repay or refinance indebtedness • Systems capacity, coverage, reliability and security • Regulatory developments and taxes All information in this presentation speaks as of May 10, 2022 and any redistribution or rebroadcast of this presentation after that date is not intended and will not be construed as updating or confirming such information. Third Party Information All third-party trademarks, including names, logos and brands, referenced by the Company in this presentation are property of their respective owners. All references to third-party trademarks are for identification purposes only and shall be considered nominative fair use under trademark law. Industry, Market and Other Data Certain information contained in this presentation concerning our industry and the markets in which we operate, including our general expectations and market position, market opportunity and market size, is based on reports from various sources. Because this information involves a number of assumptions and limitations, you are cautioned not to give undue weight to such information. We have not independently verified market data and industry forecasts provided by any of these or any other third-party sources referred to in this presentation. In addition, projections, assumptions and estimates of our future performance and the future performance of the industry in which we operate are necessarily subject to a high degree of uncertainty and risk due to a variety of factors. These and other factors could cause results to differ materially from those expressed in the estimates made by third parties and by us. Non-GAAP Financial information Included in this presentation are certain financial measures that are not calculated in accordance with U.S. generally accepted accounting principles ("GAAP") designed to supplement, and not substitute, Ziff Davis’s financial information presented in accordance with GAAP. The non-GAAP measures as defined by Ziff Davis may not be comparable to similar non-GAAP measures presented by other companies. The presentation of such measures, which may include adjustments to exclude unusual or non-recurring items, should not be construed as an inference that Ziff Davis’s future results or leverage will be unaffected by other unusual or non-recurring items. Please see the appendix to this presentation for how we define these non-GAAP measures, a discussion of why we believe they are useful to investors and certain limitations thereof, and reconciliations thereof to the most directly comparable GAAP measures. Pro Forma Financial Information, Continuing Operations Unless otherwise specified, all financial data and operating metrics presented herein for Ziff Davis are presented on a pro forma (“PF”) basis adjusted non-GAAP for Ziff Davis continuing operations, giving effect to the divestitures in the United Kingdom, as well as the sale of the Company’s B2B Backup businesses and the separation of Consensus Cloud Solutions, Inc. (“Consensus”) as described in the Form 10 filed by Consensus with the Securities and Exchange Commission, as if they had occurred on January 1, 2020. Safe Harbor for Forward-looking Statements

 
3 Some factors that could cause actual results to be materially adversely affected include, but are not limited to, our ability and intention to: • Manage certain risks inherent to our business, such as costs associated with fraudulent activity, system failure or security breach; effectively maintaining and managing our billing systems; time and resources required to manage our legal proceedings; liability for legal and other claims; or adhering to our internal controls and procedures; • Compete with other similar providers with regard to price, service, functionality; • Achieve business and financial objectives in light of burdensome domestic and international telecommunications, internet or other regulations, including regulations related to data privacy, access, security, retention, and sharing; • Successfully manage our growth, including but not limited to our operational and personnel-related resources, and integration of newly acquired businesses; • Successfully adapt to technological changes and diversify services and related revenues at acceptable levels of financial return; • Successfully develop and protect our intellectual property, both domestically and internationally, including our brands, patents, trademarks and domain names, and avoid infringing upon the proprietary rights of others; • Recruit and retain key personnel; • Realize the expected benefits of the cloud fax spin-off transaction or the sale of the B2B Backup business; and • Other factors set forth in our Annual Report on Form 10-K filed by us on March 15, 2022 with the SEC and the other reports we file from time to time with the SEC. • Sustain growth or profitability, particularly in light of an uncertain U.S. or worldwide economy, including inflation, supply chain and other factors and their related impact on customer acquisition and retention rates, customer usage levels, and credit and debit card payment declines; • Maintain and increase our customer base and average revenue per user; • Generate sufficient cash flow to make interest and debt payments, reinvest in our business, and pursue desired activities and businesses plans while satisfying restrictive covenants relating to debt obligations; • Acquire businesses on acceptable terms and successfully integrate and realize anticipated synergies from such acquisitions; • Continue to expand our businesses and operations internationally in the wake of numerous risks, including adverse currency fluctuations, difficulty in staffing and managing international operations, higher operating costs as a percentage of revenues, or the implementation of adverse regulations; • Maintain our financial position, operating results and cash flows in the event that we incur new or unanticipated costs or tax liabilities, including those relating to federal and state income tax and indirect taxes, such as sales, value-added and telecommunication taxes; • Accurately estimate the assumptions underlying our effective worldwide tax rate; • Maintain favorable relationships with critical third-party vendors whose financial condition will not negatively impact the services they provide; • Create compelling digital media content causing increased traffic and advertising levels; additional advertisers or an increase in advertising spend; and effectively target digital media advertisements to desired audiences; Risk Factors
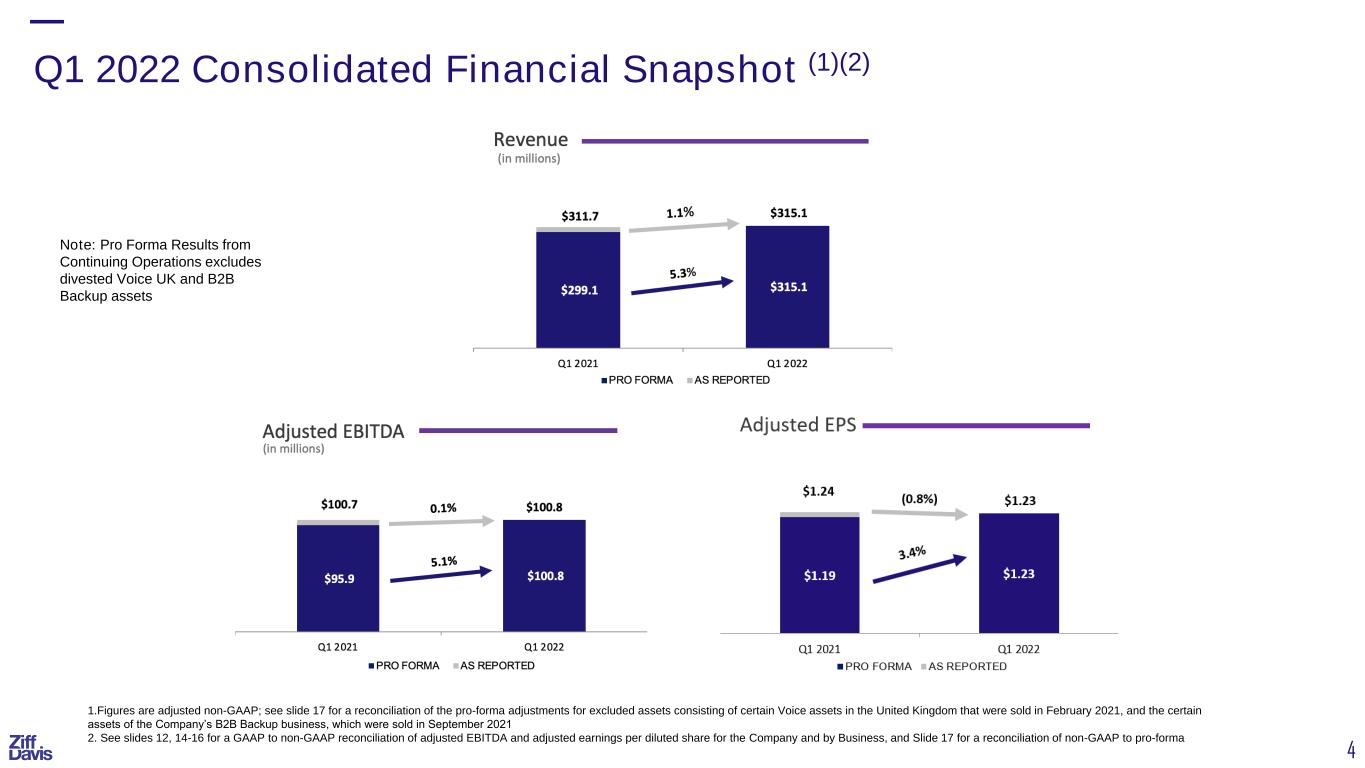

 
4 Q1 2022 Consolidated Financial Snapshot (1)(2) 1.Figures are adjusted non-GAAP; see slide 17 for a reconciliation of the pro-forma adjustments for excluded assets consisting of certain Voice assets in the United Kingdom that were sold in February 2021, and the certain assets of the Company’s B2B Backup business, which were sold in September 2021 2. See slides 12, 14-16 for a GAAP to non-GAAP reconciliation of adjusted EBITDA and adjusted earnings per diluted share for the Company and by Business, and Slide 17 for a reconciliation of non-GAAP to pro-forma Note: Pro Forma Results from Continuing Operations excludes divested Voice UK and B2B Backup assets
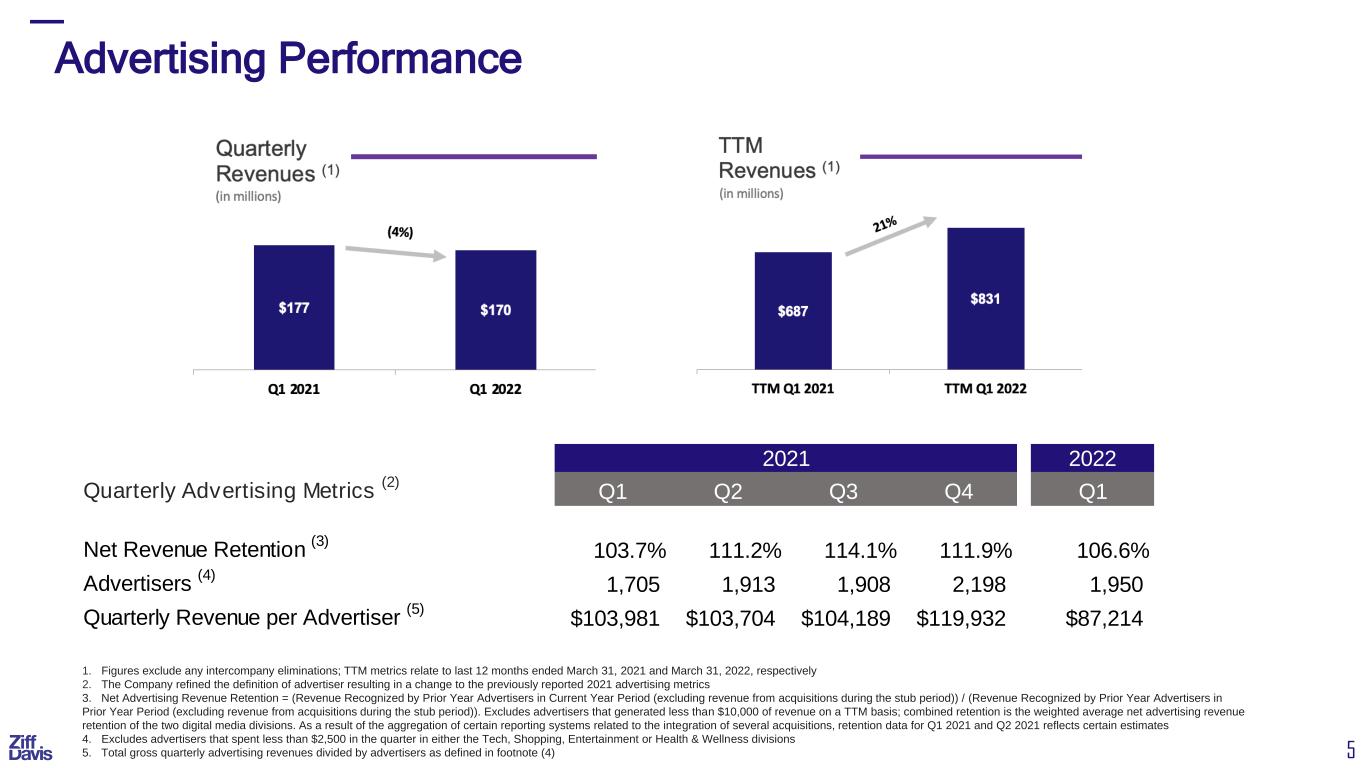

 
5 1. Figures exclude any intercompany eliminations; TTM metrics relate to last 12 months ended March 31, 2021 and March 31, 2022, respectively 2. The Company refined the definition of advertiser resulting in a change to the previously reported 2021 advertising metrics 3. Net Advertising Revenue Retention = (Revenue Recognized by Prior Year Advertisers in Current Year Period (excluding revenue from acquisitions during the stub period)) / (Revenue Recognized by Prior Year Advertisers in Prior Year Period (excluding revenue from acquisitions during the stub period)). Excludes advertisers that generated less than $10,000 of revenue on a TTM basis; combined retention is the weighted average net advertising revenue retention of the two digital media divisions. As a result of the aggregation of certain reporting systems related to the integration of several acquisitions, retention data for Q1 2021 and Q2 2021 reflects certain estimates 4. Excludes advertisers that spent less than $2,500 in the quarter in either the Tech, Shopping, Entertainment or Health & Wellness divisions 5. Total gross quarterly advertising revenues divided by advertisers as defined in footnote (4) Advertising Performance Quarterly Advertising Metrics (2) Q1 Q2 Q3 Q4 Q1 Net Revenue Retention (3) 103.7% 111.2% 114.1% 111.9% 106.6% Advertisers (4) 1,705 1,913 1,908 2,198 1,950 Quarterly Revenue per Advertiser (5) $103,981 $103,704 $104,189 $119,932 $87,214 20222021
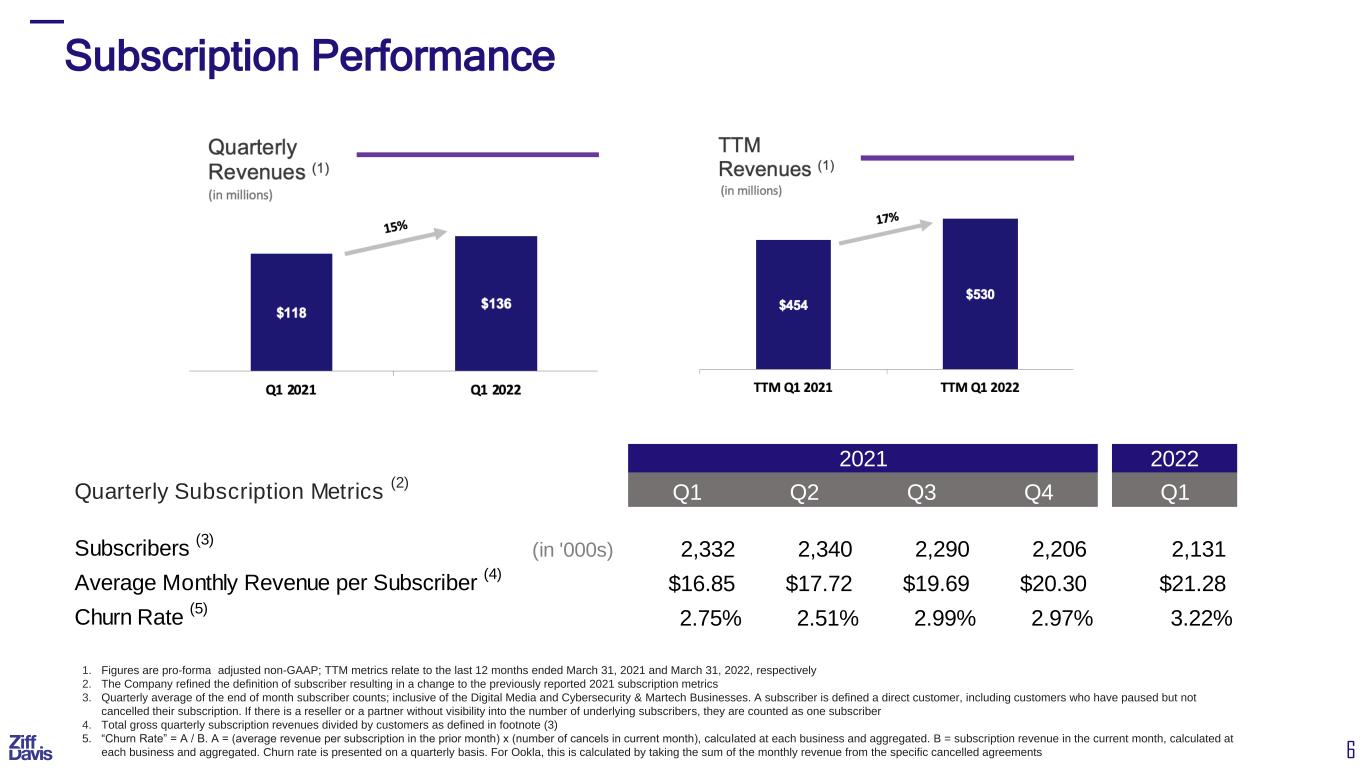

 
6 1. Figures are pro-forma adjusted non-GAAP; TTM metrics relate to the last 12 months ended March 31, 2021 and March 31, 2022, respectively 2. The Company refined the definition of subscriber resulting in a change to the previously reported 2021 subscription metrics 3. Quarterly average of the end of month subscriber counts; inclusive of the Digital Media and Cybersecurity & Martech Businesses. A subscriber is defined a direct customer, including customers who have paused but not cancelled their subscription. If there is a reseller or a partner without visibility into the number of underlying subscribers, they are counted as one subscriber 4. Total gross quarterly subscription revenues divided by customers as defined in footnote (3) 5. “Churn Rate” = A / B. A = (average revenue per subscription in the prior month) x (number of cancels in current month), calculated at each business and aggregated. B = subscription revenue in the current month, calculated at each business and aggregated. Churn rate is presented on a quarterly basis. For Ookla, this is calculated by taking the sum of the monthly revenue from the specific cancelled agreements Subscription Performance Quarterly Subscription Metrics (2) Q1 Q2 Q3 Q4 Q1 Subscribers (3) (in '000s) 2,332 2,340 2,290 2,206 2,131 Average Monthly Revenue per Subscriber (4) $16.85 $17.72 $19.69 $20.30 $21.28 Churn Rate (5) 2.75% 2.51% 2.99% 2.97% 3.22% 20222021
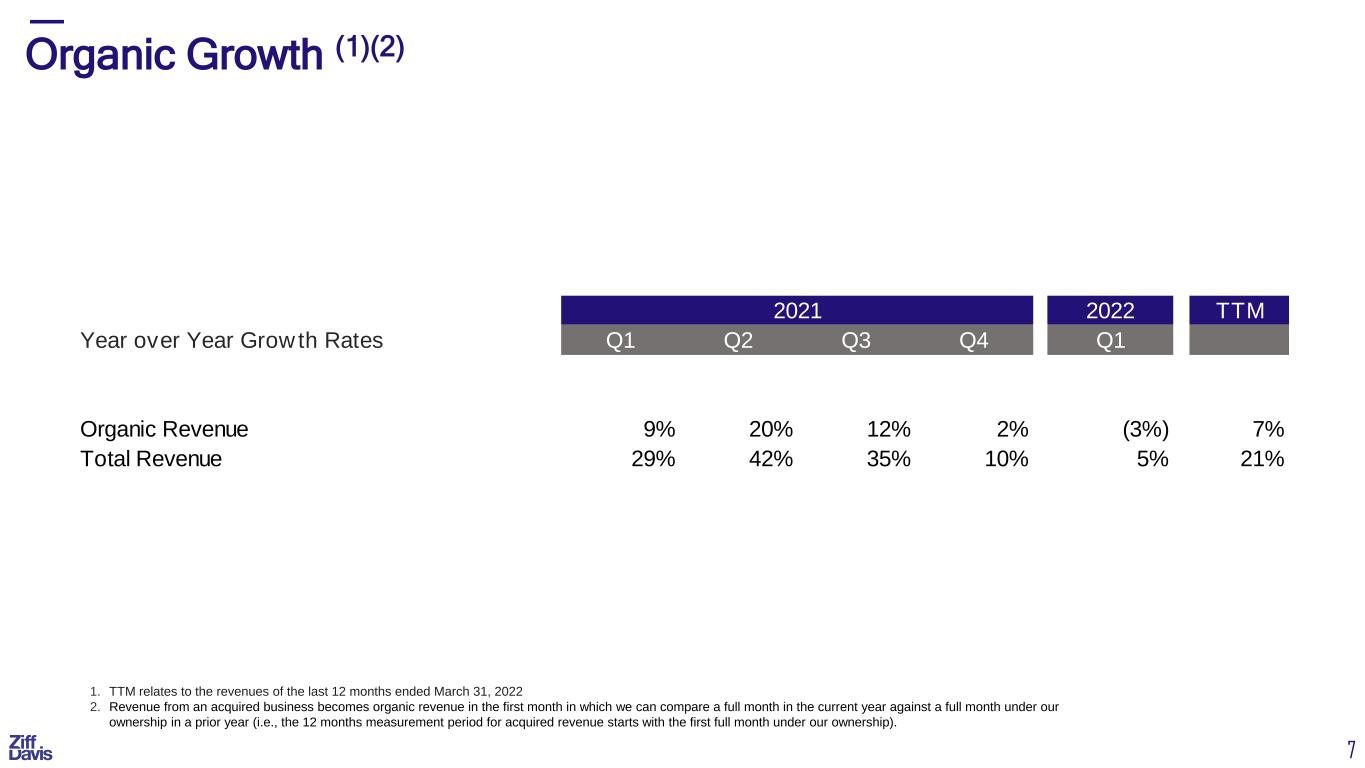

 
7 Organic Growth (1)(2) 1. TTM relates to the revenues of the last 12 months ended March 31, 2022 2. Revenue from an acquired business becomes organic revenue in the first month in which we can compare a full month in the current year against a full month under our ownership in a prior year (i.e., the 12 months measurement period for acquired revenue starts with the first full month under our ownership). Year over Year Growth Rates Q1 Q2 Q3 Q4 Q1 Organic Revenue 9% 20% 12% 2% (3%) 7% Total Revenue 29% 42% 35% 10% 5% 21% TTM2021 2022
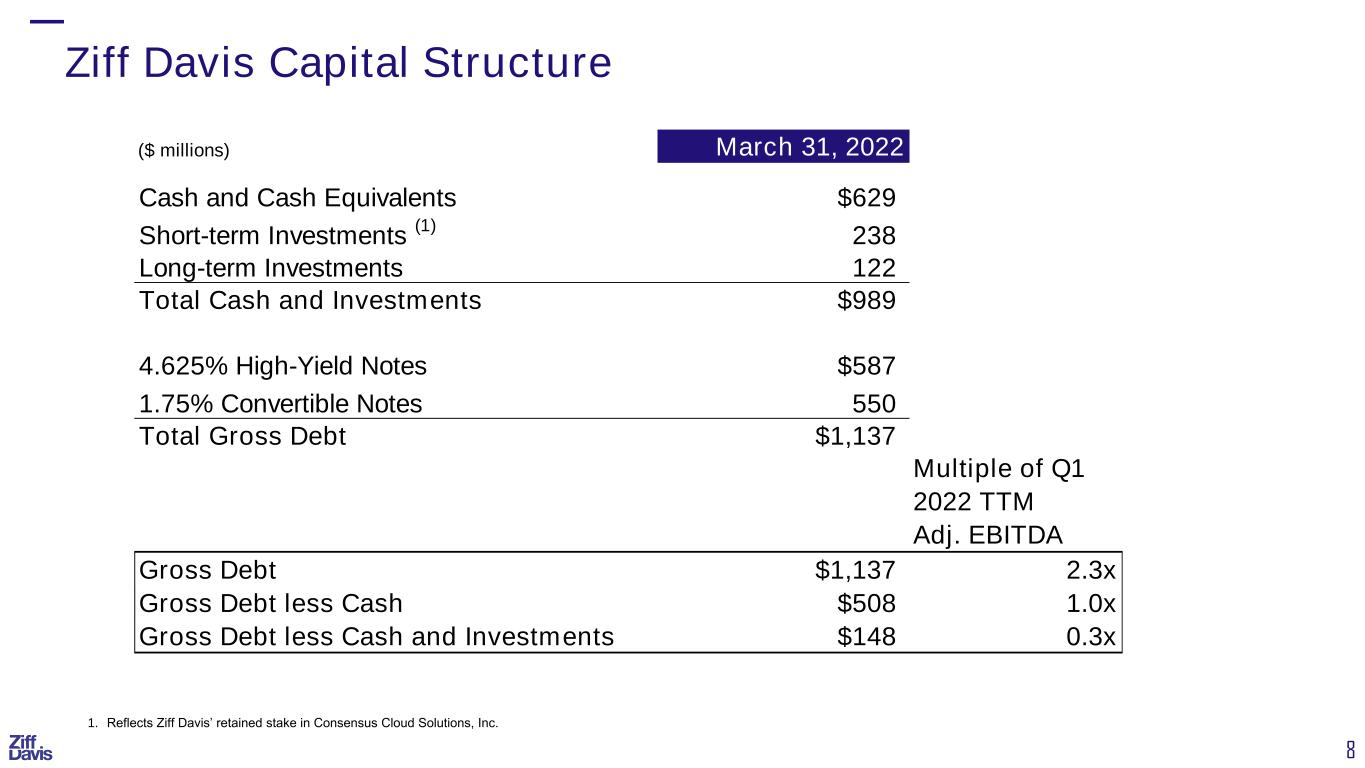

 
8 Ziff Davis Capital Structure 1. Reflects Ziff Davis’ retained stake in Consensus Cloud Solutions, Inc. ($ millions) March 31, 2022 Cash and Cash Equivalents $629 Short-term Investments (1) 238 Long-term Investments 122 Total Cash and Investments $989 4.625% High-Yield Notes $587 1.75% Convertible Notes 550 Total Gross Debt $1,137 Multiple of Q1 2022 TTM Adj. EBITDA Gross Debt $1,137 2.3x Gross Debt less Cash $508 1.0x Gross Debt less Cash and Investments $148 0.3x

 
2022 FINANCIAL GUIDANCE
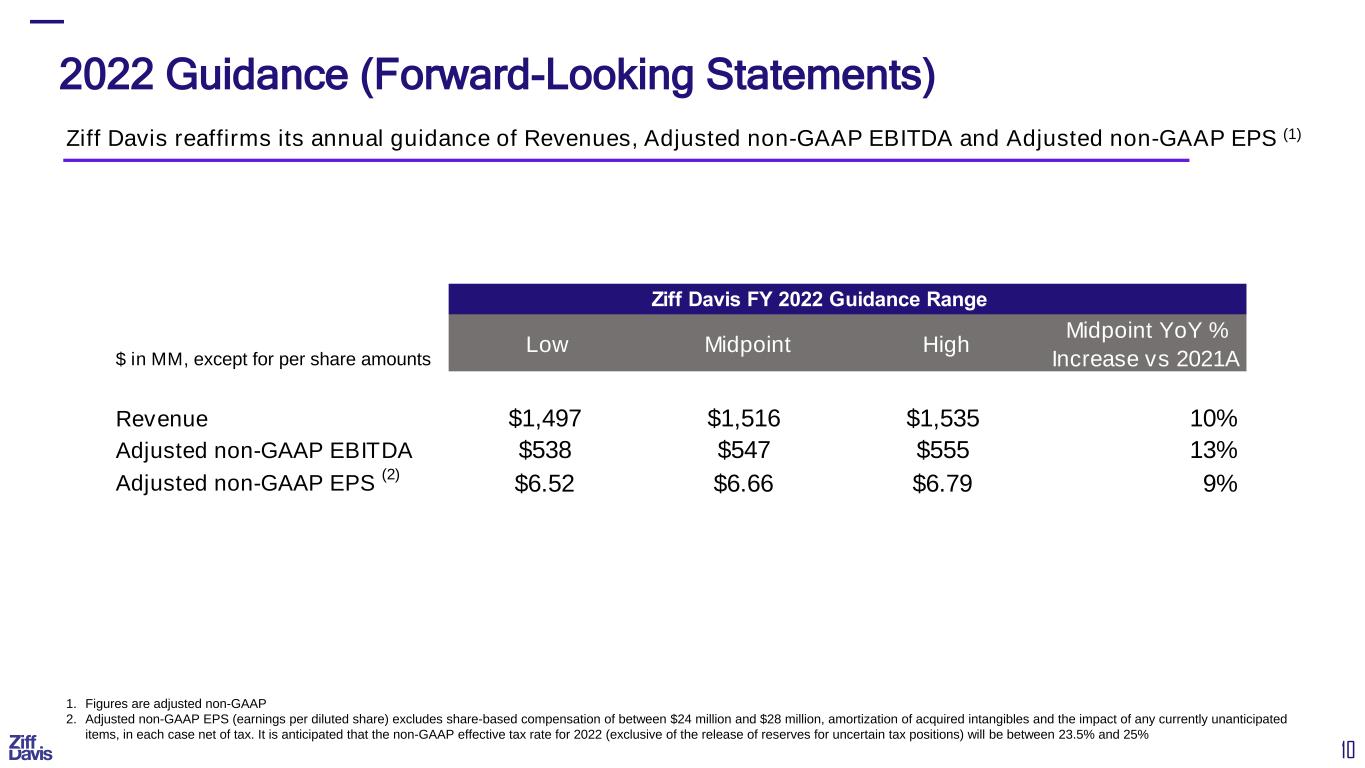

 
10 2022 Guidance (Forward-Looking Statements) Ziff Davis reaffirms its annual guidance of Revenues, Adjusted non-GAAP EBITDA and Adjusted non-GAAP EPS (1) 1. Figures are adjusted non-GAAP 2. Adjusted non-GAAP EPS (earnings per diluted share) excludes share-based compensation of between $24 million and $28 million, amortization of acquired intangibles and the impact of any currently unanticipated items, in each case net of tax. It is anticipated that the non-GAAP effective tax rate for 2022 (exclusive of the release of reserves for uncertain tax positions) will be between 23.5% and 25% Ziff Davis FY 2022 Guidance Range $ in MM, except for per share amounts Low Midpoint High Midpoint YoY % Increase vs 2021A Revenue $1,497 $1,516 $1,535 10% Adjusted non-GAAP EBITDA $538 $547 $555 13% Adjusted non-GAAP EPS (2) $6.52 $6.66 $6.79 9%

 
SUPPLEMENTAL INFORMATION
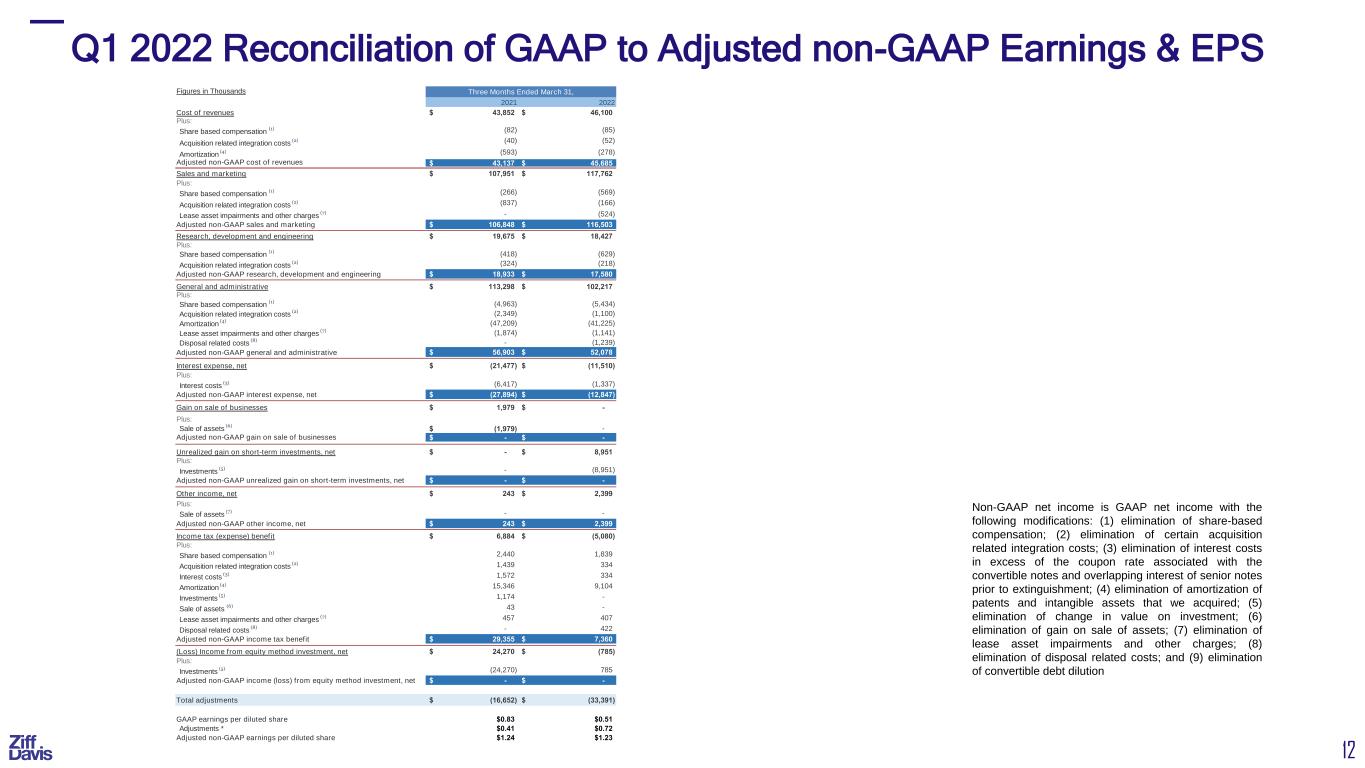

 
12 Q1 2022 Reconciliation of GAAP to Adjusted non-GAAP Earnings & EPS Non-GAAP net income is GAAP net income with the following modifications: (1) elimination of share-based compensation; (2) elimination of certain acquisition related integration costs; (3) elimination of interest costs in excess of the coupon rate associated with the convertible notes and overlapping interest of senior notes prior to extinguishment; (4) elimination of amortization of patents and intangible assets that we acquired; (5) elimination of change in value on investment; (6) elimination of gain on sale of assets; (7) elimination of lease asset impairments and other charges; (8) elimination of disposal related costs; and (9) elimination of convertible debt dilution Figures in Thousands 2021 2022 Cost of revenues 43,852$ 46,100$ Plus: Share based compensation (1) (82) (85) Acquisition related integration costs (2) (40) (52) Amortization (4) (593) (278) Adjusted non-GAAP cost of revenues 43,137$ 45,685$ Sales and marketing 107,951$ 117,762$ Plus: Share based compensation (1) (266) (569) Acquisition related integration costs (2) (837) (166) Lease asset impairments and other charges (7) - (524) Adjusted non-GAAP sales and marketing 106,848$ 116,503$ Research, development and engineering 19,675$ 18,427$ Plus: Share based compensation (1) (418) (629) Acquisition related integration costs (2) (324) (218) Adjusted non-GAAP research, development and engineering 18,933$ 17,580$ General and administrative 113,298$ 102,217$ Plus: Share based compensation (1) (4,963) (5,434) Acquisition related integration costs (2) (2,349) (1,100) Amortization (4) (47,209) (41,225) Lease asset impairments and other charges (7) (1,874) (1,141) Disposal related costs (8) - (1,239) Adjusted non-GAAP general and administrative 56,903$ 52,078$ Interest expense, net (21,477)$ (11,510)$ Plus: Interest costs (3) (6,417) (1,337) Adjusted non-GAAP interest expense, net (27,894)$ (12,847)$ Gain on sale of businesses 1,979$ -$ Plus: Sale of assets (6) (1,979)$ - Adjusted non-GAAP gain on sale of businesses -$ -$ Unrealized gain on short-term investments, net -$ 8,951$ Plus: Investments (5) - (8,951) Adjusted non-GAAP unrealized gain on short-term investments, net -$ -$ Other income, net 243$ 2,399$ Plus: Sale of assets (7) - - Adjusted non-GAAP other income, net 243$ 2,399$ Income tax (expense) benefit 6,884$ (5,080)$ Plus: Share based compensation (1) 2,440 1,839 Acquisition related integration costs (2) 1,439 334 Interest costs (3) 1,572 334 Amortization (4) 15,346 9,104 Investments (5) 1,174 - Sale of assets (6) 43 - Lease asset impairments and other charges (7) 457 407 Disposal related costs (8) - 422 Adjusted non-GAAP income tax benefit 29,355$ 7,360$ (Loss) Income from equity method investment, net 24,270$ (785)$ Plus: Investments (5) (24,270) 785 Adjusted non-GAAP income (loss) from equity method investment, net -$ -$ Total adjustments (16,652)$ (33,391)$ GAAP earnings per diluted share $0.83 $0.51 Adjustments * $0.41 $0.72 Adjusted non-GAAP earnings per diluted share $1.24 $1.23 Three Months Ended March 31,
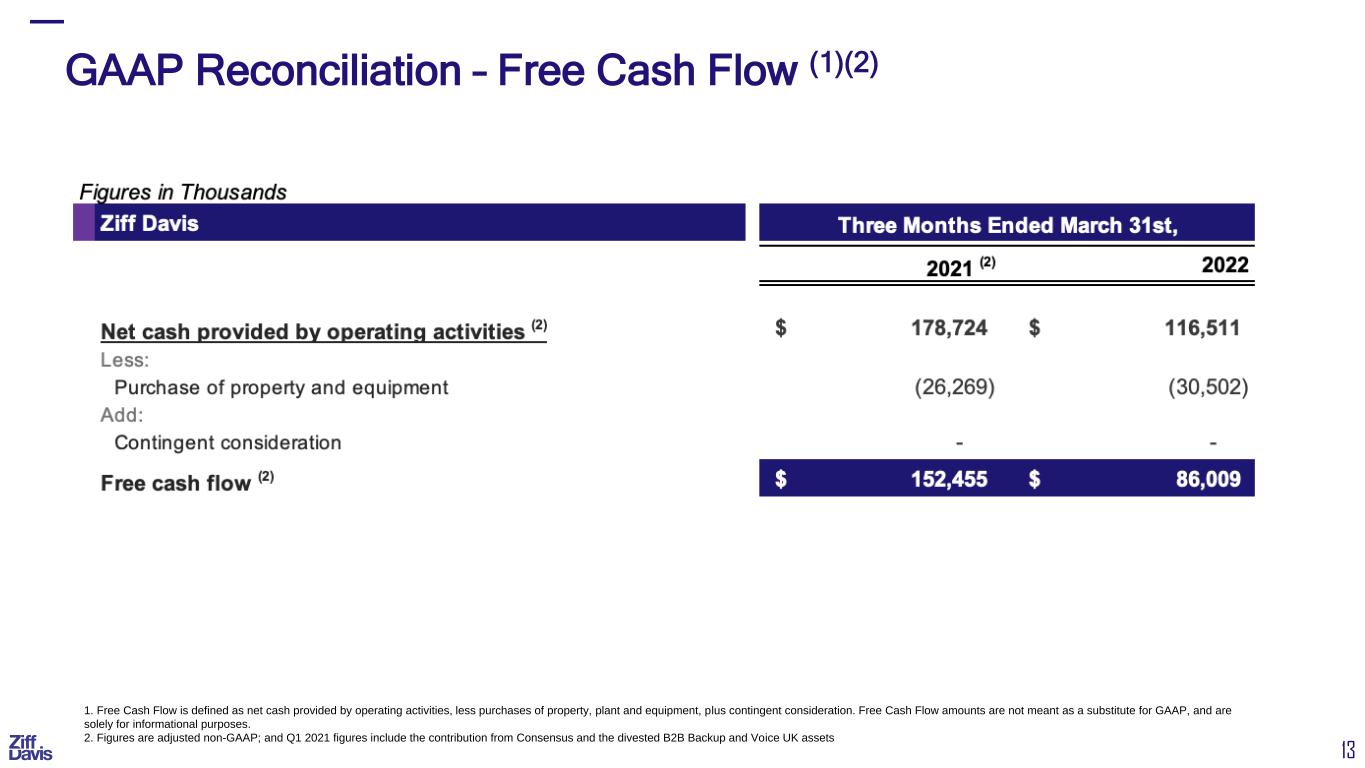

 
13 GAAP Reconciliation – Free Cash Flow (1)(2) 1. Free Cash Flow is defined as net cash provided by operating activities, less purchases of property, plant and equipment, plus contingent consideration. Free Cash Flow amounts are not meant as a substitute for GAAP, and are solely for informational purposes. 2. Figures are adjusted non-GAAP; and Q1 2021 figures include the contribution from Consensus and the divested B2B Backup and Voice UK assets
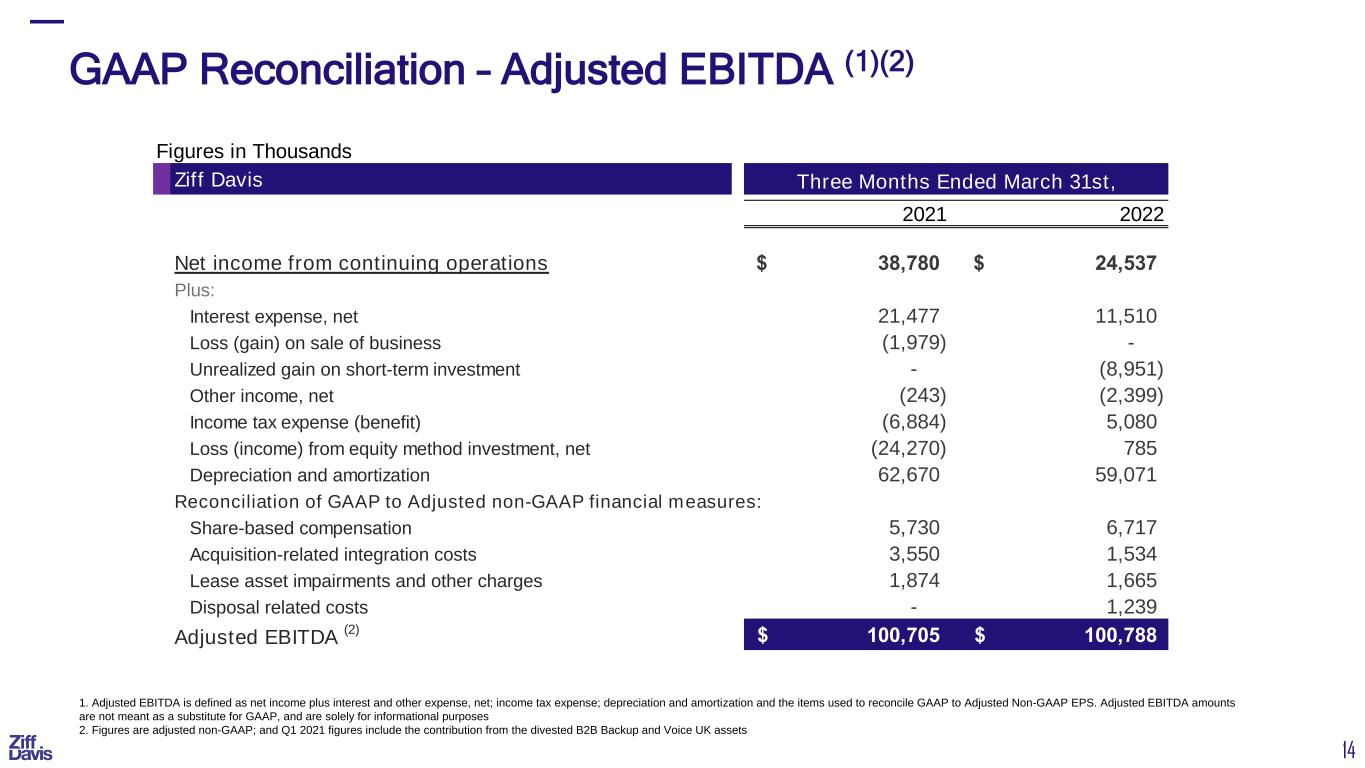

 
14 GAAP Reconciliation – Adjusted EBITDA (1)(2) 1. Adjusted EBITDA is defined as net income plus interest and other expense, net; income tax expense; depreciation and amortization and the items used to reconcile GAAP to Adjusted Non-GAAP EPS. Adjusted EBITDA amounts are not meant as a substitute for GAAP, and are solely for informational purposes 2. Figures are adjusted non-GAAP; and Q1 2021 figures include the contribution from the divested B2B Backup and Voice UK assets Figures in Thousands Ziff Davis 2021 2022 Net income from continuing operations 38,780$ 24,537$ Plus: Interest expense, net 21,477 11,510 Loss (gain) on sale of business (1,979) - Unrealized gain on short-term investment - (8,951) Other income, net (243) (2,399) Income tax expense (benefit) (6,884) 5,080 Loss (income) from equity method investment, net (24,270) 785 Depreciation and amortization 62,670 59,071 Reconciliation of GAAP to Adjusted non-GAAP financial measures: Share-based compensation 5,730 6,717 Acquisition-related integration costs 3,550 1,534 Lease asset impairments and other charges 1,874 1,665 Disposal related costs - 1,239 Adjusted EBITDA (2) 100,705$ 100,788$ Three Months Ended March 31st,
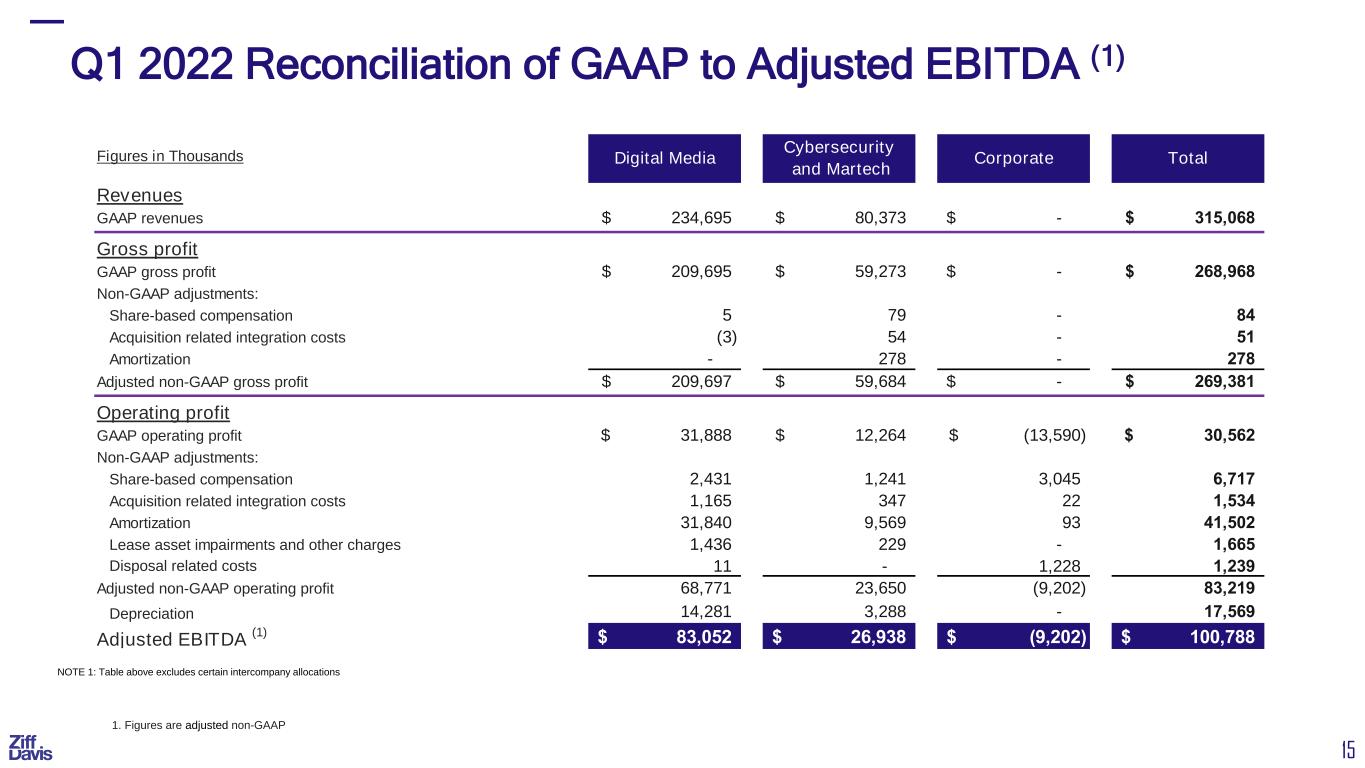

 
15 NOTE 1: Table above excludes certain intercompany allocations 1. Figures are adjusted non-GAAP Q1 2022 Reconciliation of GAAP to Adjusted EBITDA (1) Figures in Thousands Revenues GAAP revenues 234,695$ 80,373$ -$ 315,068$ Gross profit GAAP gross profit 209,695$ 59,273$ -$ 268,968$ Non-GAAP adjustments: Share-based compensation 5 79 - 84 Acquisition related integration costs (3) 54 - 51 Amortization - 278 - 278 Adjusted non-GAAP gross profit 209,697$ 59,684$ -$ 269,381$ Operating profit GAAP operating profit 31,888$ 12,264$ (13,590)$ 30,562$ Non-GAAP adjustments: Share-based compensation 2,431 1,241 3,045 6,717 Acquisition related integration costs 1,165 347 22 1,534 Amortization 31,840 9,569 93 41,502 Lease asset impairments and other charges 1,436 229 - 1,665 Disposal related costs 11 - 1,228 1,239 Adjusted non-GAAP operating profit 68,771 23,650 (9,202) 83,219 Depreciation 14,281 3,288 - 17,569 Adjusted EBITDA (1) 83,052$ 26,938$ (9,202)$ 100,788$ Digital Media Cybersecurity and Martech Corporate Total
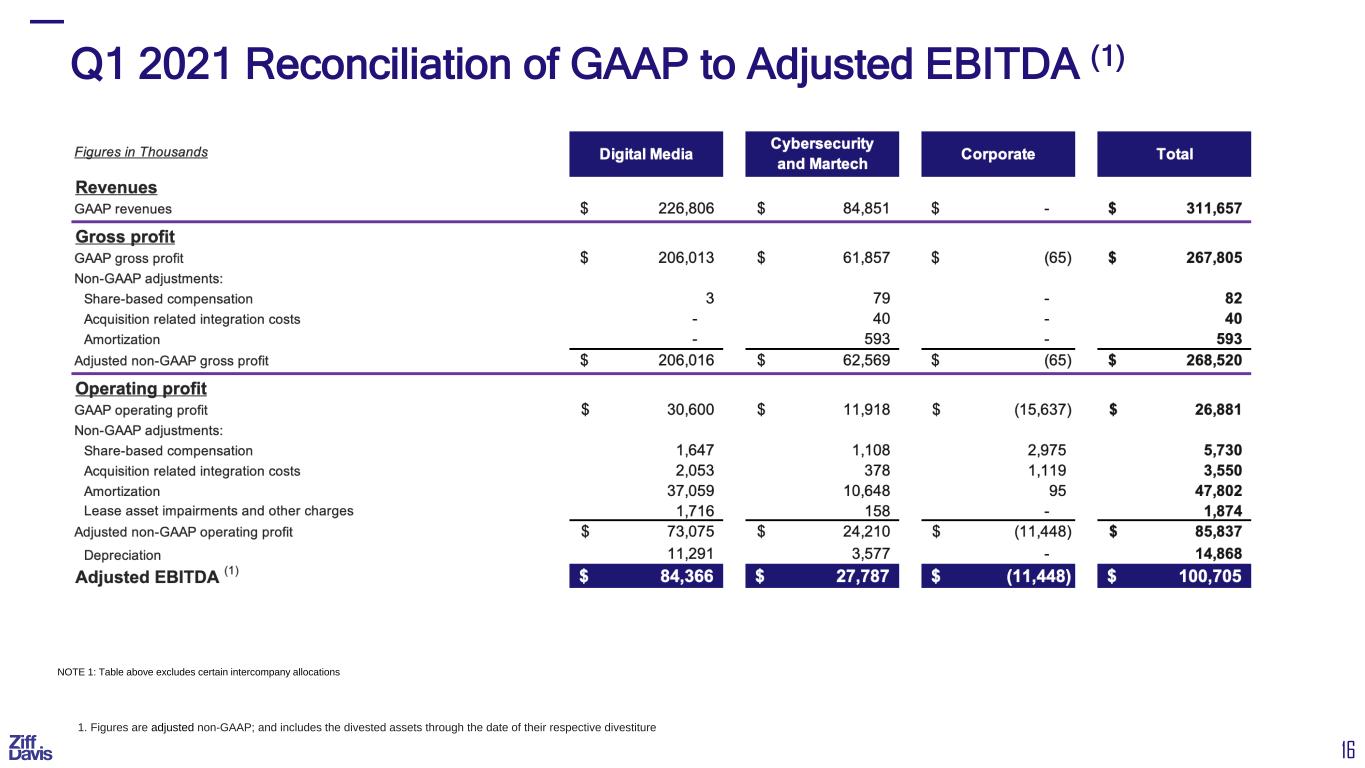

 
16 Q1 2021 Reconciliation of GAAP to Adjusted EBITDA (1) 1. Figures are adjusted non-GAAP; and includes the divested assets through the date of their respective divestiture NOTE 1: Table above excludes certain intercompany allocations
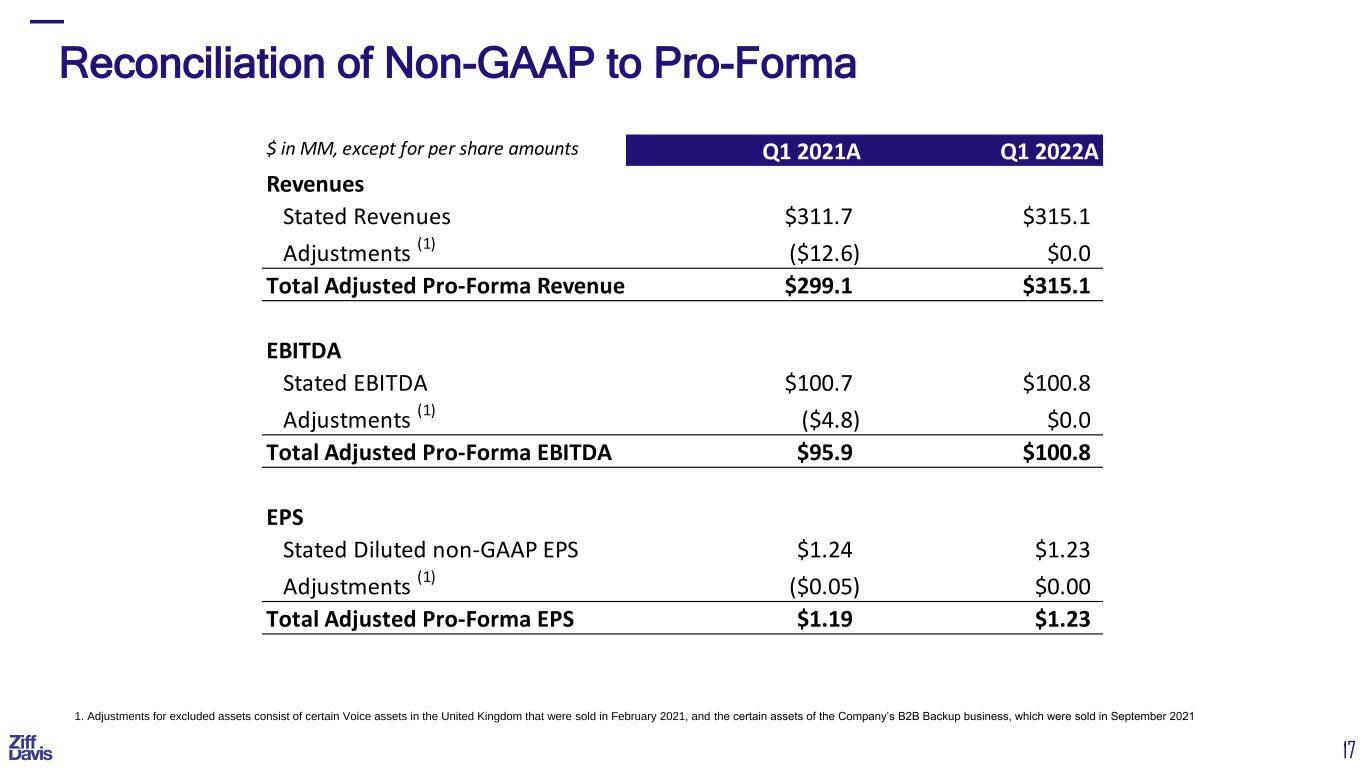

 
17 Reconciliation of Non-GAAP to Pro-Forma 1. Adjustments for excluded assets consist of certain Voice assets in the United Kingdom that were sold in February 2021, and the certain assets of the Company’s B2B Backup business, which were sold in September 2021 $ in MM, except for per share amounts Q1 2021A Q1 2022A Revenues Stated Revenues $311.7 $315.1 Adjustments (1) ($12.6) $0.0 Total Adjusted Pro-Forma Revenue $299.1 $315.1 EBITDA Stated EBITDA $100.7 $100.8 Adjustments (1) ($4.8) $0.0 Total Adjusted Pro-Forma EBITDA $95.9 $100.8 EPS Stated Diluted non-GAAP EPS $1.24 $1.23 Adjustments (1) ($0.05) $0.00 Total Adjusted Pro-Forma EPS $1.19 $1.23