jcom-20220809
0001084048false00010840482022-08-092022-08-09

UNITED STATES
SECURITIES AND EXCHANGE COMMISSION
Washington, D.C. 20549
FORM 8-K

CURRENT REPORT
Pursuant to Section 13 OR 15(d) of The Securities Exchange Act of 1934

Date of Report (date of earliest event reported) August 9, 2022

Ziff Davis, Inc.
(Exact name of registrant as specified in its charter)
Delaware
0-25965
47-1053457
(State or other jurisdiction of incorporation or organization)
(Commission File Number)
(I.R.S. Employer Identification No.)
114 5th Avenue, 15th Floor
New York, New York 10011
(Address of principal executive offices)

(212) 503-3500
(Registrant's telephone number, including area code)

Check the appropriate box below if the Form 8-K filing is intended to simultaneously satisfy the filing obligation of the registrant under any of the following provisions (see General Instruction A.2. below):

Written communications pursuant to Rule 425 under the Securities Act (17 CFR 230.425)

Soliciting material pursuant to Rule 14a-12 under the Exchange Act (17 CFR 240.14a-12)

Pre-commencement communications pursuant to Rule 14d-2(b) under the Exchange Act (17 CFR 240.14d-2(b))

Pre-commencement communications pursuant to Rule 13e-4(c) under the Exchange Act (17 CFR 240.13e-4(c))

Securities registered pursuant to Section 12(b) of the Act:
Title of each classTrading Symbol(s)Name of each exchange on which registered
Common Stock, $0.01 par valueZDNasdaq Stock Market LLC
Indicate by check mark whether the registrant is an emerging growth company as defined in Rule 405 of the Securities Act of 1933 (§230.405 of this chapter) or Rule 12b-2 of the Securities Exchange Act of 1934 (§240.12b-2 of this chapter).
Emerging growth company

If an emerging growth company, indicate by check mark if the registrant has elected not to use the extended transition period for complying with any new or revised financial accounting standards provided pursuant to Section 13(a) of the Exchange Act. o


Item 2.02. Results of Operations and Financial Condition.

On August 9, 2022, Ziff Davis, Inc. (the “Company”) issued a press release (the “Second Quarter 2022 Results Press Release”) announcing its financial results for the second quarter of fiscal 2022 and revising its financial guidance for fiscal year 2022.

A copy of the Second Quarter 2022 Results Press Release is furnished as Exhibit 99.1 to this Form 8-K.

Item 7.01. Regulation FD Disclosure.

On August 10, 2022, at 8:30 a.m. Eastern Time, the Company will host its second quarter 2022 earnings conference call and webcast. Via the webcast, the Company will present portions of its August 2022 Investor Presentation, which contains a summary of the Company’s financial results for the fiscal quarter ended June 30, 2022, and certain other financial and operating information regarding the Company. A copy of this presentation is furnished as Exhibit 99.2 to this Form 8-K.

NOTE: The information in this Item 7.01 is being furnished and shall not be deemed “filed” for purposes of Section 18 of the Securities Exchange Act of 1934, as amended (the “Exchange Act”), or incorporated by reference in any filing under the Securities Act of 1933, as amended (the “Securities Act”) or the Exchange Act, except as shall be expressly set forth by specific reference in such a filing.

Item 9.01. Financial Statements and Exhibits.

(d) Exhibits

Exhibit
Number
Description
104Cover Page Interactive Data File (embedded within the Inline XBRL document)

This Current Report on Form 8-K contains forward-looking statements within the meaning of Section 27A of the Securities Act and Section 21E of the Exchange Act. Such forward-looking statements are subject to numerous assumptions, risks and uncertainties that could cause actual results to differ materially from those described in such statements. Such forward-looking statements are based on management’s expectations or beliefs as of August 9, 2022. Factors that might cause such differences include, but are not limited to, a variety of economic, competitive, and regulatory factors, many of which are beyond the Company’s control and are described in the Company’s Annual Report on Form 10-K filed by the Company on March 15, 2022 with the Securities and Exchange Commission (the “SEC”) and the other reports the Company files from time to time with the SEC. The Company undertakes no obligation to revise or publicly release any updates to such statements based on future information or actual results.


SIGNATURES

Pursuant to the requirements of the Securities Exchange Act of 1934, the registrant has duly caused this report to be signed on its behalf by the undersigned hereunto duly authorized.
   
    
Ziff Davis, Inc.
(Registrant)
 
      
Date:August 9, 2022By:/s/ Jeremy Rossen
    Jeremy Rossen
Executive Vice President, General Counsel and Secretary


Ziff Davis Reports Second Quarter 2022 Results & Revises Full Year 2022 Guidance

NEW YORK, NY -- Ziff Davis, Inc. (NASDAQ: ZD) (“Ziff Davis”) today reported unaudited financial results for the second quarter ended June 30, 2022.

"We continue to skillfully navigate a difficult and challenging operating environment with a strategy of producing near-term earnings growth while positioning the company for an eventual macro-economic recovery," said Vivek Shah, Chief Executive Officer of Ziff Davis. "At the same time, we continue to strengthen our balance sheet as we seek acquisition opportunities that enhance our businesses and grow and diversify our revenue streams."

SECOND QUARTER 2022 RESULTS

On October 7, 2021, Ziff Davis completed the spin-off of its Consensus Cloud Solutions, Inc. (“Consensus”) business. Ziff Davis has classified Consensus as a discontinued operation in its financial statements for the three and six months ended June 30, 2021 results. Historical results in this press release represent continuing operations, except for the Statement of Cash Flows, net cash provided by operating activities and free cash flow during the three and six months ended June 30, 2021, which are on a combined continuing and discontinued operations basis.

Q2 2022 quarterly revenues decreased 1.1% to $337.4 million compared to $341.3 million for Q2 2021. On a pro-forma(1) basis, Q2 2022 quarterly revenues increased 2.2% to $337.4 million as compared to $330.0 million for Q2 2021.

GAAP net loss per diluted share from continuing operations(2) increased to $0.99 in Q2 2022 compared to $0.52 for Q2 2021. The net loss increase was primarily due to losses on our investment in Consensus.

Adjusted non-GAAP net income per diluted share from continuing operations(2)(3) for the quarter increased 5.3% to $1.58 as compared to $1.50 for Q2 2021. On a pro-forma(1) basis, Adjusted non-GAAP net income per diluted share from continuing operations(2)(3) for the quarter increased 12.1% to $1.58 compared to $1.41 for Q2 2021.

GAAP net loss from continuing operations increased to $46.4 million compared to $23.0 million for Q2 2021 primarily due to losses on our investment in Consensus.

Adjusted non-GAAP net income from continuing operations increased by 10.9% to $74.4 million as compared to $67.1 million for Q2 2021. On a pro-forma(1) basis, Adjusted non-GAAP net income from continuing operations increased by 17.7% to $74.4 million as compared to $63.2 million for Q2 2021.

Adjusted EBITDA(4) for the quarter increased 0.9% to $118.0 million compared to $117.0 million for Q2 2021. On a pro-forma(1) basis, Adjusted EBITDA(4) for the quarter increased 5.3% to $118.0 million compared to $112.1 million for Q2 2021.

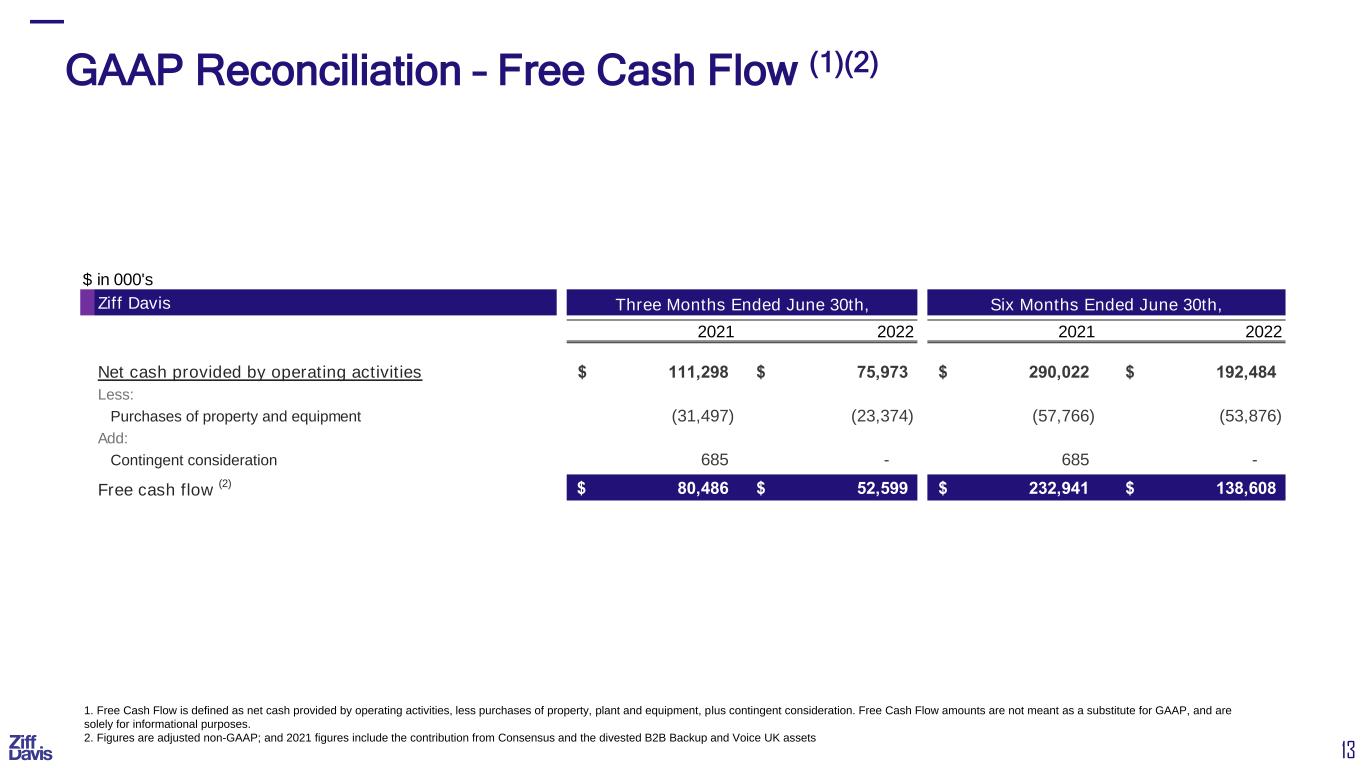
Net cash provided by operating activities from continuing operations was $76.0 million in Q2 2022. Free cash flow from continuing operations(6) was $52.6 million in Q2 2022.

Ziff Davis ended the quarter with approximately $849.3 million in cash, cash equivalents, and investments after deploying during the quarter approximately $68.7 million for current and prior year acquisitions, approximately $18.2 million to repay $21.5 million of outstanding principal of its senior notes and approximately $12.7 million with respect to its share repurchase program.

Key unaudited financial results for Q2 2022 versus Q2 2021 are set forth in the following table (in millions, except per share amounts). Reconciliations of Adjusted non-GAAP net income per diluted share from continuing operations, Adjusted EBITDA and free cash flow from continuing operations to their nearest comparable GAAP financial measures are attached to this Press Release.

1


The following table reflects Actual and Pro-Forma Results from Continuing Operations for the second quarter of 2022 and 2021 (in millions, except per share amounts). Pro-Forma Results from Continuing Operations below excludes the operating results from the Company’s B2B Backup business that was sold in the third quarter of 2021.
QTDQTD
Pro-Forma Results(1)
Q2 2022Q2 2021% ChangeQ2 2022Q2 2021% Change
Revenues
Digital Media$258.4$253.81.8%$258.4$253.81.8%
Cybersecurity and Martech$79.0$87.5(9.7)%$79.0$76.23.7%
Total revenue(5):
$337.4$341.3(1.1)%$337.4$330.02.2%
Income from operations$45.9$10.1354.5%
GAAP loss per diluted share from continuing operations(2)
$(0.99)$(0.52)90.4%
Adjusted non-GAAP income per diluted share from continuing operations(2) (3)
$1.58$1.505.3%$1.58$1.4112.1%
GAAP net loss from continuing operations$(46.4)$(23.0)101.7%
Adjusted non-GAAP net income from continuing operations$74.4$67.110.9%$74.4$63.217.7%
Adjusted EBITDA(4)
$118.0$117.00.9%$118.0$112.15.3%
Adjusted EBITDA margin(4)
35.0%34.3%0.7%35.0%34.0%1.0%
Net cash provided by operating activities from continuing operations(6)
$76.0
NA (7)
Free cash flow from continuing operations(6)
$52.6
NA (7)

The following table reflects Actual and Pro-Forma Results from Continuing Operations for the six months ended June 30, 2022 and 2021 (in millions, except per share amounts). Pro-Forma Results from Continuing Operations below excludes the operating results from Voice assets in the United Kingdom and the Company’s B2B Backup business that were sold in 2021.
YTDYTD
Pro-Forma Results(1)
Q2 2022Q2 2021% ChangeQ2 2022Q2 2021% Change
Revenues
Digital Media$493.0$480.62.6%$493.0$480.62.6%
Cybersecurity and Martech$159.4$172.4(7.5)%$159.4$148.57.3%
Total revenue(5):
$652.4$653.0(0.1)%$652.4$629.13.7%
Income from operations$76.4$36.9107.0%
GAAP (loss) income per diluted share from continuing operations(2)
$(0.47)$0.33(242.4)%
Adjusted non-GAAP income per diluted share from continuing operations(2) (3)
$2.81$2.742.6%$2.81$2.608.1%
GAAP net (loss) income from continuing operations$(21.9)$15.7(239.5)%
Adjusted non-GAAP net income from continuing operations$132.4$122.58.1%$132.4$116.313.8%
Adjusted EBITDA(4)
$218.8$217.70.5%$218.8$208.05.2%
Adjusted EBITDA margin(4)
33.5%33.3%0.2%33.5%33.1%0.4%
Net cash provided by operating activities from continuing operations(6)
$192.5
NA (7)
Free cash flow from continuing operations(6)
$138.6
NA (7)


2


ZIFF DAVIS GUIDANCE

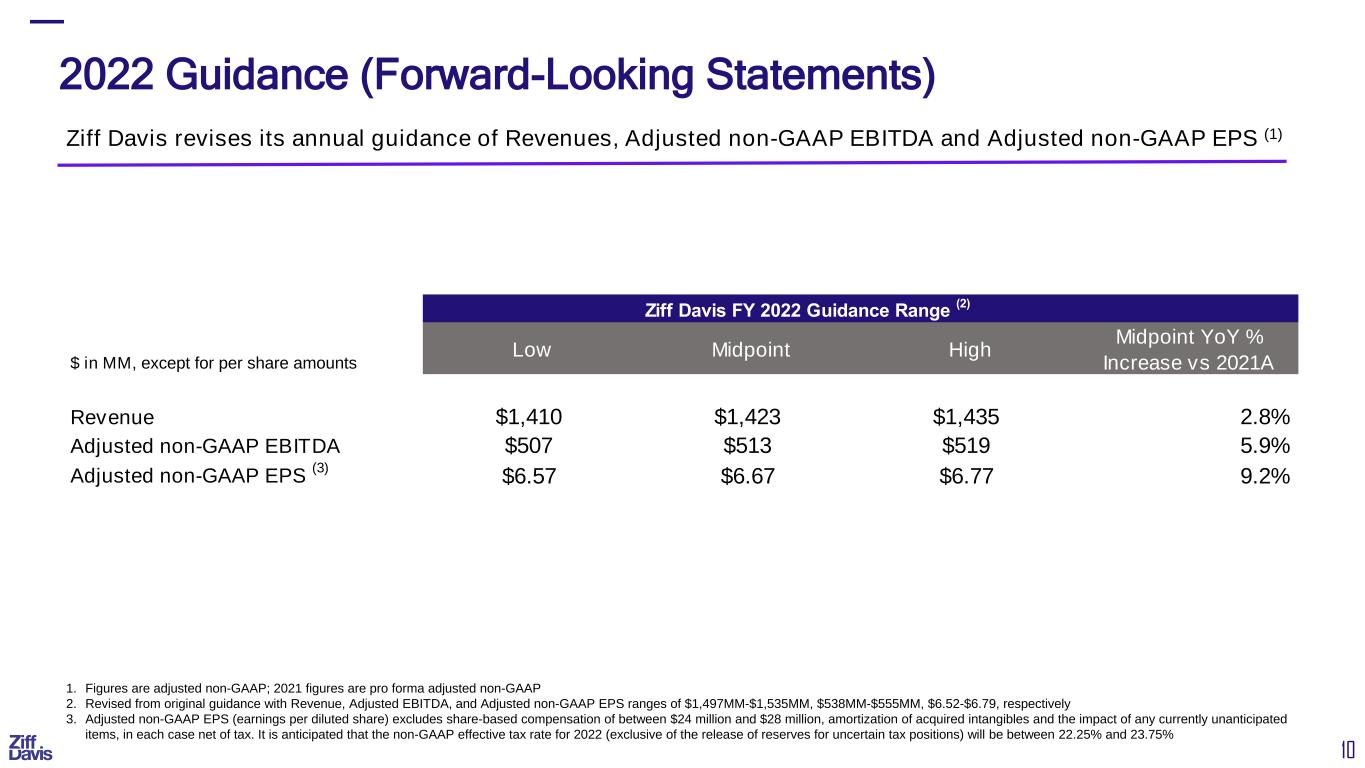
The Company is revising its guidance for revenue, adjusted EBITDA and adjusted non-GAAP Diluted EPS for fiscal year 2022 as follows (in millions, except per share data):

Current GuidanceRevised FY 2022 Range of Estimates
LowHighLowHigh
Revenue$1,497 $1,535 $1,410 $1,435 
Adjusted EBITDA$538 $555 $507 $519 
Adjusted non-GAAP Diluted EPS$6.52 $6.79 $6.57 $6.77 
* Adjusted non-GAAP net income per diluted share for 2022 excludes share-based compensation of between $24 million and $28 million, amortization of acquired intangibles and the impact of any currently unanticipated items, in each case net of tax. It is anticipated that the non-GAAP effective tax rate for 2022 (exclusive of the release of reserves for uncertain tax positions) will be between 22.25% and 23.75%.

The Company has not reconciled the non-GAAP Business Outlook for 2022 Adjusted EBITDA or Adjusted non-GAAP Diluted EPS and the associated tax rate information included in this press release to the most directly comparable GAAP measure because this cannot be done without unreasonable effort due to the variability with respect to costs related to acquisitions and taxation, which are potential adjustments to future earnings. We expect the variability of these items to have a potentially unpredictable and significant impact on our future non-GAAP financial results.

Notes:
(1)
Pro-forma figures are provided taking into consideration the sale of certain Voice assets in the United Kingdom as well as the sale of the Company’s B2B Backup business as if they had occurred January 1, 2021.
(2)
The estimated GAAP effective tax rates were approximately (33.2)% for Q2 2022 and 37.4% for Q2 2021. The estimated Adjusted non-GAAP effective tax rates were approximately 22.7% for Q2 2022 and 22.3% for Q2 2021.
(3)
Adjusted non-GAAP net income per diluted share excludes certain non-GAAP items, as defined in the Reconciliation of GAAP to Adjusted non-GAAP financial measures, for the three months ended June 30, 2022 and 2021 which totaled $2.57 and $2.02 per diluted share, respectively.
(4)Adjusted EBITDA is defined as net income from continuing operations before interest; gain on sale of businesses; loss on investments, net, unrealized gain (loss) on short-term investments, other income (expense), net; income tax expense (benefit); income (loss) from equity method investments, net; depreciation and amortization; and the items used to reconcile EPS to Adjusted non-GAAP EPS, as defined in the Reconciliation of GAAP to Adjusted non-GAAP financial measures. Adjusted EBITDA amounts are not meant as a substitute for GAAP, but are solely for informational purposes.
(5)The revenues associated with each of the businesses may not foot precisely since each is presented independently.
(6)Free cash flow from continuing operations is defined as net cash provided by operating activities from continuing operations, less purchases of property and equipment from continuing operations, plus contingent consideration from continuing operations. Free cash flow amounts are not meant as a substitute for GAAP, but are solely for informational purposes. There were no discontinued operations in 2022.
(7)
NA = Not available. The Company has not prepared net cash provided by operating activities from continuing operations and free cash flow from continuing operations for the second quarter of 2021. Net cash provided by operating activities from continuing and discontinued operations on a combined basis and free cash flow from continuing and discontinued operations on a combined basis for the three months ended June 30, 2021 was $111.3 million and $80.5 million, respectively. Free cash flow from continuing and discontinued operations is defined as net cash provided by operating activities from continuing and discontinued operations, less purchases of property and equipment from continuing and discontinued operations, plus contingent consideration from continuing and discontinued operations. 

About Ziff Davis
Ziff Davis, Inc. (NASDAQ: ZD) is a vertically focused digital media and internet company whose portfolio includes leading brands in technology, entertainment, shopping, health, cybersecurity, and martech. For more information, visit www.ziffdavis.com.

Contact:
Rebecca Wright
Ziff Davis, Inc.
800-577-1790
[email protected]


3


“Safe Harbor” Statement Under the Private Securities Litigation Reform Act of 1995: Certain statements in this Press Release are “forward-looking statements” within the meaning of The Private Securities Litigation Reform Act of 1995, including those contained in Vivek Shah’s quote and the “Business Outlook” portion regarding the Company’s expected fiscal 2022 financial performance. These forward-looking statements are based on management’s current expectations or beliefs and are subject to numerous assumptions, risks and uncertainties that could cause actual results to differ materially from those described in the forward-looking statements. These factors and uncertainties include, among other items: the Company’s ability to grow advertising revenues, profitability and cash flows; the Company’s ability to make interest and debt payments; the Company’s ability to identify, close and successfully transition acquisitions; subscriber growth and retention; variability of the Company’s revenue based on changing conditions in particular industries and the economy generally; protection of the Company’s proprietary technology or infringement by the Company of intellectual property of others; the risk of losing critical third-party vendors or key personnel; the risks associated with fraudulent activity, system failure or a security breach; risks related to our ability to adhere to our internal controls and procedures; the risk of adverse changes in the U.S. or international regulatory environments, including but not limited to the imposition or increase of taxes or regulatory-related fees; the risk of liability for legal and other claims; and the numerous other factors set forth in Ziff Davis’s (formerly J2 Global, Inc.) filings with the Securities and Exchange Commission (“SEC”). For a more detailed description of the risk factors and uncertainties affecting Ziff Davis, refer to the 2021 Annual Report on Form 10-K filed by Ziff Davis on March 15, 2022, and the other reports filed by Ziff Davis from time-to-time with the SEC, each of which is available at www.sec.gov. The forward-looking statements provided in this press release, including those contained in Vivek Shah’s quote and in the “Business Outlook” portion regarding the Company’s expected fiscal 2022 financial performance are based on limited information available to the Company at this time, which is subject to change. Although management’s expectations may change after the date of this press release, the Company undertakes no obligation to revise or update these statements.

About Non-GAAP Financial Measures

To supplement our consolidated financial statements, which are prepared and presented in accordance with GAAP, we use the following Adjusted non-GAAP financial measures: Adjusted non-GAAP and Pro Forma net income, Adjusted non-GAAP and Pro Forma net income per diluted share, Adjusted and Pro Forma EBITDA and free cash flow. The presentation of this financial information is not intended to be considered in isolation or as a substitute for, or superior to, the financial information prepared and presented in accordance with GAAP.

We use these Adjusted non-GAAP financial measures for financial and operational decision-making and as a means to evaluate period-to-period comparisons. Our management believes that these Adjusted non-GAAP financial measures provide meaningful supplemental information regarding our performance and liquidity by excluding certain expenses and expenditures that may not be indicative of our recurring core business operating results. We believe that both management and investors benefit from referring to these Adjusted non-GAAP financial measures in assessing our performance and when planning, forecasting, and analyzing future periods. These Adjusted non-GAAP financial measures also facilitate management’s internal comparisons to our historical performance and liquidity. We believe these Adjusted non-GAAP financial measures are useful to investors both because (1) they allow for greater transparency with respect to key metrics used by management in its financial and operational decision-making and (2) they are used by our institutional investors and the analyst community to help them analyze the health of our business.

For more information on these Adjusted non-GAAP financial measures, please see the appropriate GAAP to Adjusted non-GAAP reconciliation tables included within the attached Exhibit to this press release. 
4


ZIFF DAVIS, INC. AND SUBSIDIARIES
CONDENSED CONSOLIDATED BALANCE SHEETS
(UNAUDITED, IN THOUSANDS)
June 30, 2022December 31, 2021
ASSETS  
Cash and cash equivalents$648,290 $694,842 
Short-term investments72,535 229,200 
Accounts receivable, net of allowances243,300 316,342 
Prepaid expenses and other current assets60,956 60,290 
Total current assets1,025,081 1,300,674 
Long-term investments 128,460 122,593 
Property and equipment, net166,152 161,209 
Operating lease right-of-use assets48,565 55,617 
Trade names, net147,621 147,761 
Customer relationships, net248,522 275,451 
Goodwill1,603,340 1,531,455 
Other purchased intangibles, net140,597 149,513 
Deferred income taxes, noncurrent7,321 5,917 
Other assets27,436 20,090 
TOTAL ASSETS$3,543,095 $3,770,280 
LIABILITIES AND STOCKHOLDERS’ EQUITY 
Accounts payable and accrued expenses$191,922 $226,621 
Income taxes payable, current4,027 3,151 
Deferred revenue, current194,522 185,571 
Operating lease liabilities, current24,867 27,156 
Current portion of long-term debt68,506 54,609 
Other current liabilities203 130 
Total current liabilities484,047 497,238 
Long-term debt1,033,695 1,036,018 
Deferred revenue, noncurrent9,246 14,839 
Operating lease liabilities, noncurrent43,634 53,708 
Income taxes payable, noncurrent11,675 11,675 
Liability for uncertain tax positions43,597 42,546 
Deferred income taxes88,217 108,982 
Other long-term liabilities34,788 37,542 
TOTAL LIABILITIES1,748,899 1,802,548 
Commitments and contingencies— — 
Preferred stock — — 
Common stock472 474 
Additional paid-in capital 426,104 509,122 
Retained earnings1,451,316 1,515,358 
Accumulated other comprehensive loss(83,696)(57,222)
TOTAL STOCKHOLDERS’ EQUITY1,794,196 1,967,732 
TOTAL LIABILITIES AND STOCKHOLDERS’ EQUITY$3,543,095 $3,770,280 

5


ZIFF DAVIS, INC. AND SUBSIDIARIES
CONDENSED CONSOLIDATED STATEMENTS OF OPERATIONS
(UNAUDITED, IN THOUSANDS EXCEPT SHARE AND PER SHARE DATA)
Three Months Ended June 30,Six months ended June 30,
2022202120222021
Total revenues$337,356 $341,293 $652,424 $652,950 
Cost of revenues (1)
46,004 48,785 92,104 92,637 
Gross profit291,352 292,508 560,320 560,313 
Operating expenses:
Sales and marketing (1)
123,777 120,421 241,539 228,372 
Research, development and engineering (1)
19,721 17,705 38,148 37,380 
General and administrative (1)
101,967 111,698 204,184 224,996 
Goodwill impairment on business— 32,629 — 32,629 
Total operating expenses245,465 282,453 483,871 523,377 
Income from operations45,887 10,055 76,449 36,936 
Interest expense, net(6,956)(21,013)(18,466)(42,490)
Gain on sale of businesses— 823 — 2,802 
Loss on investments, net(48,243)(16,677)(48,243)(16,677)
Unrealized loss on short-term investments(27,317)— (18,366)— 
Other income (loss), net6,345 (816)8,744 (573)
(Loss) income from continuing operations before income taxes and (loss) income from equity method investment, net(30,284)(27,628)118 (20,002)
Income tax expense (benefit)10,051 (10,334)15,131 (17,218)
(Loss) income from equity method investment, net(6,101)(5,751)(6,886)18,519 
Net (loss) income from continuing operations(46,436)(23,045)(21,899)15,735 
Income from discontinued operations, net of income taxes— 38,762 — 77,905 
Net (loss) income$(46,436)$15,717 $(21,899)$93,640 
Net (loss) income per common share from continuing operations:
Basic$(0.99)$(0.52)$(0.47)$0.35 
Diluted$(0.99)$(0.52)$(0.47)$0.33 
Net income per common share from discontinued operations:
Basic$— $0.87 $— $1.75 
Diluted$— $0.87 $— $1.65 
Net (loss) income per common share:
Basic$(0.99)$0.35 $(0.47)$2.10 
Diluted$(0.99)$0.35 $(0.47)$1.98 
Weighted average shares outstanding:
Basic46,978,709 44,613,533 47,016,351 44,506,933 
Diluted46,978,709 44,613,533 47,016,351 47,130,979 
6


(1) Includes share-based compensation expense as follows:
Cost of revenues$142 $67 $226 $150 
Sales and marketing1,106 278 1,675 544 
Research, development and engineering852 458 1,481 876 
General and administrative5,603 5,066 11,038 10,029 
Total$7,703 $5,869 $14,420 $11,599 
7


ZIFF DAVIS, INC. AND SUBSIDIARIES
CONDENSED CONSOLIDATED STATEMENTS OF CASH FLOWS
(UNAUDITED, IN THOUSANDS)
                                                              Six Months Ended June 30,
20222021
Cash flows from operating activities:
Net (loss) income$(21,899)$93,640 
Adjustments to reconcile net (loss) income to net cash provided by operating activities:
Depreciation and amortization118,943 130,226 
Amortization of financing costs and discounts1,398 14,058 
Non-cash operating lease costs5,913 6,714 
Share-based compensation14,420 12,363 
Provision for credit losses on accounts receivable(1,376)4,329 
Deferred income taxes, net(10,266)(11,853)
Gain on extinguishment of debt, net(1,393)— 
Gain on sale of businesses— (2,802)
Lease asset impairments and other charges168 7,829 
Changes in fair value of contingent consideration(9)562 
Foreign currency remeasurement gain549 415 
Loss (income) from equity method investments6,886 (18,519)
Unrealized loss on short-term investments18,366 — 
Loss on investments, net48,243 16,677 
Decrease (increase) in:
Accounts receivable 77,168 65,312 
Prepaid expenses and other current assets5,804 (7,720)
Operating lease right-of-use assets2,260 689 
Other assets(7,250)(701)
Increase (decrease) in:
Accounts payable and accrued expenses(45,329)(23,438)
Income taxes payable8,825 (15,123)
Deferred revenue(11,882)2,499 
Operating lease liabilities(13,721)(14,218)
Liability for uncertain tax positions403 (3,567)
Other long-term liabilities(3,737)21 
Net cash provided by operating activities192,484 290,022 
Cash flows from investing activities:
Proceeds from sale of available-for-sale investments— 663 
Purchases of equity method investment— (11,053)
Investment in available-for-sale securities(15,000)— 
Purchases of property and equipment(53,876)(57,766)
Purchases of equity investments— (999)
Proceeds from sale of assets— 6,033 
Acquisition of businesses, net of cash received(92,425)(89,489)
Net cash used in investing activities(161,301)(152,611)
Cash flows from financing activities:
Payment of debt(72,853)(2,802)
Debt issuance cost— — 
Proceeds from term loan89,991 2,811 
Debt extinguishment costs(756)— 
Repurchase of common stock(76,345)(22,934)
Issuance of common stock under employee stock purchase plan5,235 4,232 
8


Exercise of stock options148 1,331 
Deferred payments for acquisitions(7,094)(12,934)
Other(5)(1,294)
Net cash used in financing activities(61,679)(31,590)
Effect of exchange rate changes on cash and cash equivalents(16,056)(616)
Net change in cash and cash equivalents(46,552)105,205 
Cash and cash equivalents at beginning of period694,842 242,652 
Cash and cash equivalents at beginning of period associated with discontinued operations— 66,210 
Cash and cash equivalents at beginning of period associated with continuing operations694,842 176,442 
Cash and cash equivalents at end of period648,290 347,857 
Cash and cash equivalents at end of period associated with discontinued operations— 107,666 
Cash and cash equivalents at end of period associated with continuing operations$648,290 $240,191 

9


ZIFF DAVIS, INC. AND SUBSIDIARIES
RECONCILIATION OF GAAP TO ADJUSTED NON-GAAP FINANCIAL MEASURES
THREE MONTHS ENDED JUNE 30, 2022 AND 2021
(UNAUDITED, IN THOUSANDS, EXCEPT PER SHARE AMOUNTS)

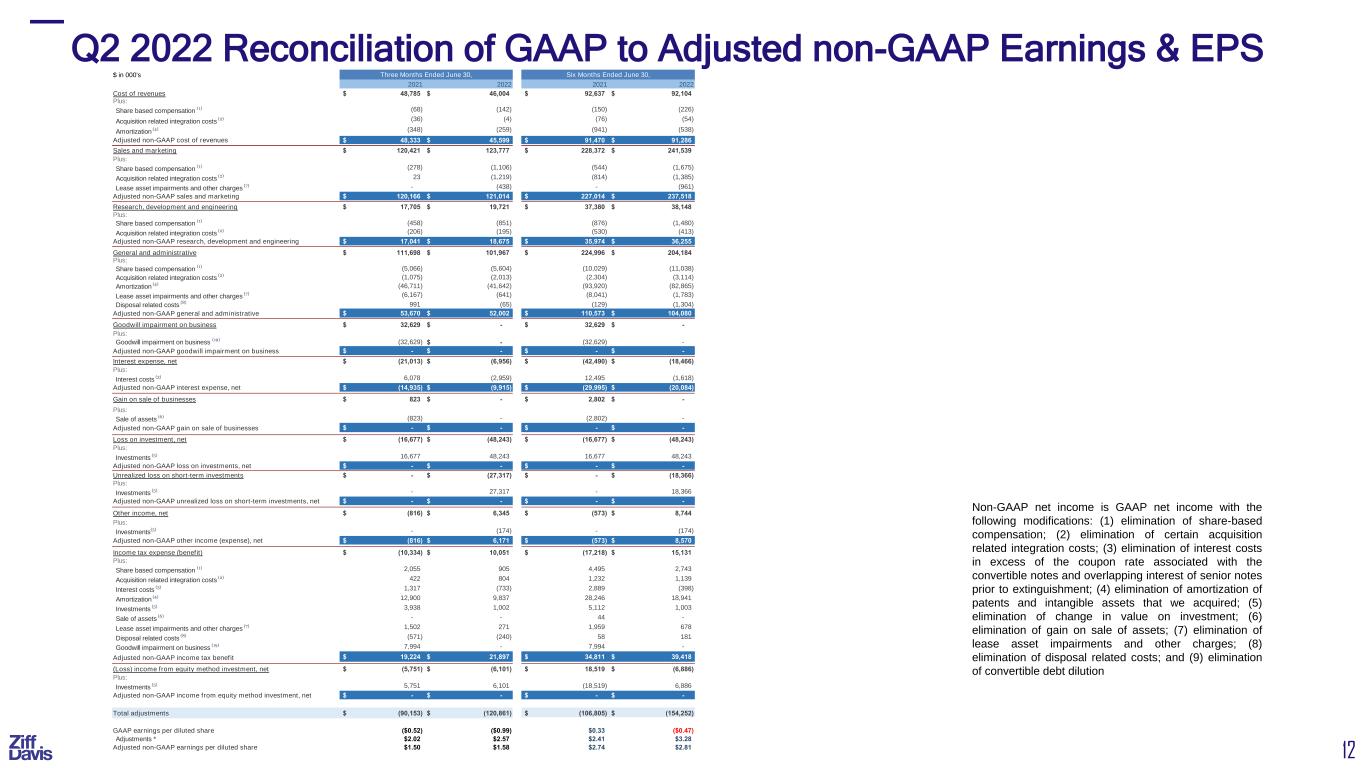
Adjusted non-GAAP net income from continuing operations is GAAP net income from continuing operations with the following modifications: (1) elimination of share-based compensation; (2) elimination of certain acquisition related integration costs; (3) elimination of certain interest costs; (4) elimination of amortization of patents and intangible assets that we acquired; (5) elimination of change in value of investments; (6) elimination of gain/loss on sale of assets; (7) elimination of lease asset impairments and other charges; (8) elimination of disposal related costs and (9) elimination of goodwill impairment on business.

Three months ended June 30,
2022Per diluted share*2021Per diluted share*
Net loss from continuing operations$(46,436)$(0.99)$(23,045)$(0.52)
Plus:
Share based compensation (1)
6,798 0.14 3,815 0.09 
Acquisition related integration costs (2)
2,627 0.06 872 0.02 
Interest costs (3)
(2,226)(0.05)4,761 0.11 
Amortization (4)
32,064 0.68 34,159 0.77 
Investments (5)
80,485 1.71 18,490 0.41 
Sale of assets (6)
— — (823)(0.02)
Lease asset impairments and other charges (7)
808 0.02 4,665 0.10 
Disposal related costs (8)
305 0.01 (421)(0.01)
Goodwill impairment on business (9)
— — 24,635 0.55 
Adjusted non-GAAP net income from continuing operations$74,425 $1.58 $67,108 $1.50 
* The reconciliation of net income from continuing operations per diluted share from GAAP to Adjusted non-GAAP net income from continuing operations per share may not foot since each is calculated independently.

10


ZIFF DAVIS, INC. AND SUBSIDIARIES
RECONCILIATION OF GAAP TO ADJUSTED NON-GAAP FINANCIAL MEASURES
SIX MONTHS ENDED JUNE 30, 2022 AND 2021
(UNAUDITED, IN THOUSANDS, EXCEPT PER SHARE AMOUNTS)

Adjusted non-GAAP net income from continuing operations is GAAP net income from continuing operations with the following modifications: (1) elimination of share-based compensation; (2) elimination of certain acquisition related integration costs; (3) elimination of certain interest costs; (4) elimination of amortization of patents and intangible assets that we acquired; (5) elimination of change in value of investments; (6) elimination of gain/loss on sale of assets; (7) elimination of lease asset impairments and other charges; (8) elimination of disposal related costs; (9) elimination of goodwill impairment on business; and (10) elimination of dilutive effect of the convertible debt.

Six months ended June 30,
2022Per diluted share*2021Per diluted share*
Net (loss) income from continuing operations$(21,899)$(0.47)$15,735 $0.33 
Plus:
Share based compensation (1)
11,676 — 7,104 0.16 
Acquisition related integration costs (2)
3,827 0.08 2,492 0.06 
Interest costs (3)
(1,220)(0.03)9,606 0.22 
Amortization (4)
64,462 1.37 66,615 1.49 
Investments (5)
72,318 1.53 (6,954)(0.16)
Sale of assets (6)
— — (2,845)(0.06)
Lease asset impairments and other charges (7)
2,066 0.05 6,082 0.14 
Disposal related costs (8)
1,123 0.03 70 — 
Goodwill impairment on business (9)
— — 24,635 0.55 
Convertible debt dilution (10)
— — — 0.01 
Adjusted non-GAAP net income from continuing operations$132,353 $2.81 $122,540 $2.74 
* The reconciliation of net income from continuing operations per diluted share from GAAP to Adjusted non-GAAP net income from continuing operations per share may not foot since each is calculated independently.


11


ZIFF DAVIS, INC. AND SUBSIDIARIES
RECONCILIATION OF GAAP TO ADJUSTED NON-GAAP FINANCIAL MEASURES
THREE MONTHS ENDED JUNE 30, 2022 AND 2021
(UNAUDITED, IN THOUSANDS, EXCEPT PER SHARE AMOUNTS)

Three months ended June 30,
20222021
Cost of revenues$46,004 $48,785 
Plus:
Share based compensation(1)
(142)(68)
Acquisition related integration costs(2)
(4)(36)
Amortization(4)
(259)(348)
Adjusted non-GAAP cost of revenues$45,599 $48,333 
Sales and marketing$123,777 $120,421 
Plus:
Share based compensation(1)
(1,106)(278)
Acquisition related integration costs(2)
(1,219)23 
Lease asset impairments and other charges(7)
(438)— 
Adjusted non-GAAP sales and marketing$121,014 $120,166 
Research, development and engineering$19,721 $17,705 
Plus:
Share based compensation(1)
(851)(458)
Acquisition related integration costs(2)
(195)(206)
Adjusted non-GAAP research, development and engineering$18,675 $17,041 
General and administrative$101,967 $111,698 
Plus:
Share based compensation(1)
(5,604)(5,066)
Acquisition related integration costs(2)
(2,013)(1,075)
Amortization(4)
(41,642)(46,711)
Lease asset impairments and other charges(7)
(641)(6,167)
Disposal related costs(8)
(65)991 
Adjusted non-GAAP general and administrative$52,002 $53,670 
Goodwill impairment on business$ $32,629 
Plus:
Goodwill impairment on business(19)
— (32,629)
Adjusted non-GAAP goodwill impairment on business$ $ 
Interest expense, net$(6,956)$(21,013)
Plus:
Interest costs (3)
(2,959)6,078 
Adjusted non-GAAP interest expense, net$(9,915)$(14,935)


12


ZIFF DAVIS, INC. AND SUBSIDIARIES
RECONCILIATION OF GAAP TO ADJUSTED NON-GAAP FINANCIAL MEASURES - CONTINUED
THREE MONTHS ENDED JUNE 30, 2022 AND 2021
(UNAUDITED, IN THOUSANDS, EXCEPT PER SHARE AMOUNTS)

Three months ended June 30,
20222021
Gain on sale of businesses$ $823 
Plus:
Sale of assets(6)
— (823)
Adjusted non-GAAP gain on sale of businesses$ $ 
Loss on investment, net$(48,243)$(16,677)
Plus:
Investments(5)
48,243 16,677 
Adjusted non-GAAP loss on investments, net$ $ 
Unrealized loss on short-term investments$(27,317)$ 
Plus:
Investments(5)
27,317 — 
Adjusted non-GAAP unrealized loss on short-term investments, net$ $ 
Other income, net$6,345 $(816)
Plus:
Investments(5)
(174)— 
Adjusted non-GAAP other income, net$6,171 $(816)
Income tax expense (benefit)$10,051 $(10,334)
Plus the tax effect of:
Share based compensation(1)
905 2,055 
Acquisition related integration costs(2)
804 422 
Interest costs(3)
(733)1,317 
Amortization(4)
9,837 12,900 
Investments(5)
1,002 3,938 
Lease asset impairments and other charges(7)
271 1,502 
Disposal related costs(8)
(240)(571)
Goodwill impairment on business(19)
— 7,994 
Adjusted non-GAAP income tax expense $21,897 $19,224 
Loss from equity method investment, net$(6,101)$(5,751)
Plus:
Investments(5)
6,101 5,751 
Adjusted non-GAAP income from equity method investment, net$ $ 


13


ZIFF DAVIS, INC. AND SUBSIDIARIES
RECONCILIATION OF GAAP TO ADJUSTED NON-GAAP FINANCIAL MEASURES - CONTINUED
THREE MONTHS ENDED JUNE 30, 2022 AND 2021
(UNAUDITED, IN THOUSANDS, EXCEPT PER SHARE AMOUNTS)

Three months ended June 30,
20222021
Total adjustments$(120,861)$(90,153)
GAAP Net income per diluted share from continuing operations$(0.99)$(0.52)
Adjustments *$2.57 $2.02 
Adjusted non-GAAP Net income per diluted share from continuing operations$1.58 $1.50 
* The reconciliation of Net income per share from GAAP to Adjusted non-GAAP may not foot since each is calculated independently.


The Company discloses Adjusted non-GAAP net income per diluted share (“Adjusted Diluted EPS”) as a supplemental Non-GAAP financial performance measure, as it believes it is a useful metric by which to compare the performance of its business from period to period. The Company also understands that an Adjusted Diluted EPS measure is broadly used by analysts, rating agencies and investors in assessing the Company’s performance. Accordingly, the Company believes that the presentation of Adjusted Diluted EPS provides useful information to investors.

Adjusted Diluted EPS is not in accordance with, or an alternative to, net income per diluted share from continuing operations and may be different from Non-GAAP measures with similar or even identical names used by other companies. In addition, Adjusted Diluted EPS is not based on any comprehensive set of accounting rules or principles. The Adjusted Diluted EPS measure has limitations in that it does not reflect all of the amounts associated with the Company’s results of operations determined in accordance with GAAP.

14


ZIFF DAVIS, INC. AND SUBSIDIARIES
RECONCILIATION OF GAAP TO ADJUSTED NON-GAAP FINANCIAL MEASURES
SIX MONTHS ENDED JUNE 30, 2022 AND 2021
(UNAUDITED, IN THOUSANDS, EXCEPT PER SHARE AMOUNTS)

Six months ended June 30,
20222021
Cost of revenues$92,104 $92,637 
Plus:
Share based compensation(1)
(226)(150)
Acquisition related integration costs(2)
(54)(76)
Amortization(4)
(538)(941)
Adjusted non-GAAP cost of revenues$91,286 $91,470 
Sales and marketing$241,539 $228,372 
Plus:
Share based compensation(1)
(1,675)(544)
Acquisition related integration costs(2)
(1,385)(814)
Lease asset impairments and other charges(7)
(961)— 
Adjusted non-GAAP sales and marketing$237,518 $227,014 
Research, development and engineering$38,148 $37,380 
Plus:
Share based compensation(1)
(1,480)(876)
Acquisition related integration costs(2)
(413)(530)
Adjusted non-GAAP research, development and engineering$36,255 $35,974 
General and administrative$204,184 $224,996 
Plus:
Share based compensation(1)
(11,038)(10,029)
Acquisition related integration costs(2)
(3,114)(2,304)
Amortization(4)
(82,865)(93,920)
Lease asset impairments and other charges(7)
(1,783)(8,041)
Disposal related costs(8)
(1,304)(129)
Adjusted non-GAAP general and administrative$104,080 $110,573 
Goodwill impairment on business— $32,629 
Plus:
Goodwill impairment on business (10)
— (32,629)
Adjusted non-GAAP goodwill impairment on business$ $ 
Interest expense, net$(18,466)$(42,490)
Plus:
Interest costs (3)
(1,618)12,495 
Adjusted non-GAAP interest expense, net$(20,084)$(29,995)


15


ZIFF DAVIS, INC. AND SUBSIDIARIES
RECONCILIATION OF GAAP TO ADJUSTED NON-GAAP FINANCIAL MEASURES - CONTINUED
SIX MONTHS ENDED JUNE 30, 2022 AND 2021
(UNAUDITED, IN THOUSANDS, EXCEPT PER SHARE AMOUNTS)
Six months ended June 30,
20222021
Gain on sale of businesses$ $2,802 
Plus:
Sale of assets(6)
— (2,802)
Adjusted non-GAAP gain on sale of businesses$ $ 
Loss on investments, net$(48,243)$(16,677)
Plus:
Investments(5)
48,243 16,677 
Adjusted non-GAAP loss on investments, net$ $ 
Unrealized loss on short-term investments$(18,366)$ 
Plus:
Investments(5)
18,366 — 
Adjusted non-GAAP unrealized loss on short-term investments, net$ $ 
Other income (expense), net$8,744 $(573)
Plus:
Investments(5)
(174)— 
Adjusted non-GAAP other income, net$8,570 $(573)
Income tax expense (benefit)$15,131 $(17,218)
Plus the tax effect of:
Share based compensation(1)
2,743 4,495 
Acquisition related integration costs(2)
1,139 1,232 
Interest costs(3)
(398)2,889 
Amortization(4)
18,941 28,246 
Investments(5)
1,003 5,112 
Sale of assets(6)
— 44 
Lease asset impairments and other charges(7)
678 1,959 
Disposal related costs(8)
181 58 
Goodwill impairment on business(10)
— 7,994 
Adjusted non-GAAP income tax expense $39,418 $34,811 
(Loss) income from equity method investment, net$(6,886)$18,519 
Plus:
Investments(5)
6,886 (18,519)
Adjusted non-GAAP income from equity method investment, net$ $ 


16


ZIFF DAVIS, INC. AND SUBSIDIARIES
RECONCILIATION OF GAAP TO ADJUSTED NON-GAAP FINANCIAL MEASURES - CONTINUED
SIX MONTHS ENDED JUNE 30, 2022 AND 2021
(UNAUDITED, IN THOUSANDS, EXCEPT PER SHARE AMOUNTS)

Six months ended June 30,
20222021
Total adjustments$(154,252)$(106,805)
GAAP Net income per diluted share from continuing operations$(0.47)$0.33 
Adjustments *$3.28 $2.41 
Adjusted non-GAAP Net income per diluted share from continuing operations$2.81 $2.74 
* The reconciliation of Net income per share from GAAP to Adjusted non-GAAP may not foot since each is calculated independently.


The Company discloses Adjusted non-GAAP net income per diluted share (“Adjusted Diluted EPS”) as a supplemental Non-GAAP financial performance measure, as it believes it is a useful metric by which to compare the performance of its business from period to period. The Company also understands that an Adjusted Diluted EPS measure is broadly used by analysts, rating agencies and investors in assessing the Company’s performance. Accordingly, the Company believes that the presentation of Adjusted Diluted EPS provides useful information to investors.

Adjusted Diluted EPS is not in accordance with, or an alternative to, net income per diluted share from continuing operations and may be different from Non-GAAP measures with similar or even identical names used by other companies. In addition, Adjusted Diluted EPS is not based on any comprehensive set of accounting rules or principles. The Adjusted Diluted EPS measure has limitations in that it does not reflect all of the amounts associated with the Company’s results of operations determined in accordance with GAAP.
17


Non-GAAP Financial Measures

To supplement its condensed consolidated financial statements, which are prepared and presented in accordance with US generally accepted accounting principles (“GAAP”), the Company uses the following Non-GAAP financial measures: Adjusted EBITDA, Adjusted non-GAAP net income from continuing operations, and Adjusted Diluted EPS from continuing operations (collectively the “Non-GAAP financial measures”). The presentation of this financial information is not intended to be considered in isolation or as a substitute for, or superior to, the financial information prepared and presented in accordance with U.S. GAAP. The Company uses these non-GAAP financial measures for financial and operational decision making and as a means to evaluate period-to-period comparisons. The Company believes that they provide useful information about core operating results, enhance the overall understanding of past financial performance and future prospects, and allow for greater transparency with respect to key metrics used by management in its financial and operational decision making.

(1) Share Based Compensation. The Company excludes stock-based compensation because it is non-cash in nature and because the Company believes that the non-GAAP financial measures excluding this item provide meaningful supplemental information regarding operational performance. The Company further believes this measure is useful to investors in that it allows for greater transparency to certain line items in its financial statements. In addition, excluding this item from the non-GAAP measures facilitates comparisons to historical operating results and comparisons to peers, many of which similarly exclude this item.

(2) Acquisition Related Integration Costs. The Company excludes certain acquisition and related integration costs such as adjustments to contingent consideration, severance, lease terminations, retention bonuses and other acquisition-specific items. The Company believes that the Non-GAAP financial measures excluding this item provide meaningful supplemental information regarding operational performance. In addition, excluding this item from the non-GAAP measures facilitates comparisons to historical operating results and comparisons to peers, many of which similarly exclude this item.

(3) Interest Costs. In June 2014, the Company issued $402.5 million aggregate principal amount of 3.25% convertible senior notes and in November 2019, the Company issued $550.0 million aggregate principal amount of 1.75% convertible senior notes. For the three and six months ended June 30, 2021, the Company separately accounted for the value of the liability and equity features of its outstanding convertible senior notes in a manner that reflects the Company’s non-convertible debt borrowing rate. The value of the conversion feature, reflected as a debt discount, was amortized to interest expense over time. Accordingly, the Company recognized imputed interest expense on its 3.25% and 1.75% convertible senior notes of approximately 5.8% and 5.5%, respectively, in its statement of operations during the three and six months ended June 30, 2021. The Company excluded the difference between the imputed interest expense and the coupon interest expense of 3.25% and 1.75%, respectively, because it was non-cash in nature and because the Company believes that the non-GAAP financial measures excluding this item provide meaningful supplemental information regarding core operational performance. During 2022, the Company adopted ASU 2020-06, Debt-Debt with Conversion and Other Options (Subtopic 470-20) and Derivatives and Hedging - Contracts in Entity’s own Equity (Subtopic 815-40): Accounting for Convertible Instruments and Contracts in an Entity’s Own Equity, whereby a portion of the convertible senior notes is no longer recorded in equity with a debt discount and amortization in interest expense. Therefore, no similar adjustment was made for the three and six months ended June 30, 2022. The Company has excluded the difference between the imputed and coupon interest expense associated with the 4.625% Senior Notes in each period presented. Further, for the three and six months ended June 30, 2022, the Company recorded a gain on extinguishment associated with the buy-back of its 4.625% Senior Notes, which is included within this Non-GAAP adjustment. The Company has determined excluding these items from the non-GAAP measures facilitates comparisons to historical operating results and comparisons to peers, many of which similarly exclude this item.

(4) Amortization. The Company excludes amortization of patents and acquired intangible assets because it is non-cash in nature and because the Company believes that the non-GAAP financial measures excluding this item provide meaningful supplemental information regarding operational performance. In addition, excluding this item from the non-GAAP measures facilitates comparisons to historical operating results and comparisons to peers, many of which similarly exclude this item.

(5) Change in Value on Investments. The Company excludes the change in value of its investments, which includes income (loss) from equity method investments, the unrealized gain (loss) on its investment in Consensus and other income (loss) on investments (including Consensus). The Company believes that the non-GAAP financial measures excluding this item provide meaningful supplemental information regarding operational performance as these items are not part of the Company’s core operations. In addition, excluding these items from the non-GAAP measures facilitates comparisons to historical operating results.

(6) Gain (Loss) on Sale of Assets. The Company excludes the gain (loss) on sale of certain of its assets. The Company believes that the non-GAAP financial measures excluding this item provide meaningful supplemental information regarding operational performance. In addition, excluding this item from the non-GAAP measures facilitates comparisons to historical operating results.
18


(7) Lease Asset Impairments and Other Charges. The Company excludes lease asset impairments and other charges as they are non-cash in nature and because the Company believes that the non-GAAP financial measures excluding this item provide meaningful supplemental information regarding operational performance. In addition, excluding this item from the non-GAAP measures facilitates comparisons to historical operating results.

(8) Disposal related Costs. The Company excludes expenses associated with the disposal of certain businesses. The Company believes that the non-GAAP financial measures excluding this item provide meaningful supplemental information regarding operational performance. In addition, excluding this item from the non-GAAP measures facilitates comparisons to historical operating results.

(9) Goodwill Impairment on Business. The Company excludes the goodwill impairment on business because it is non-cash in nature and the Company believes that the Non-GAAP financial measures excluding this item provide meaningful supplemental information regarding operational performance. In addition, excluding this item from the Non-GAAP measures facilitates comparisons to historical operating results.

(10) Convertible Debt Dilution. The Company excludes convertible debt dilution from diluted EPS. The Company believes that the Non-GAAP financial measures excluding this item provide meaningful supplemental information regarding operational performance. In addition, excluding this item from the Non-GAAP measures facilitates comparisons to historical operating results.

The Company presents Adjusted non-GAAP Cost of Revenues, Adjusted non-GAAP Research, Development and Engineering, Adjusted non-GAAP Sales and Marketing, Adjusted non-GAAP General and Administrative, Adjusted non-GAAP Interest Expense, Adjusted Gain on Sale of Businesses, Adjusted non-GAAP Loss on Investments, Adjusted non-GAAP Unrealized Loss on Short-term Investments, Adjusted non-GAAP Other (Income) Expense, Adjusted non-GAAP Income Tax benefit (expense), Adjusted non-GAAP (Income) Loss from Equity Method Investment, Net and Adjusted non-GAAP Net income because the Company believes that these provide useful information about our operating results and enhance the overall understanding of past financial performance and future prospects.
19


Pro-Forma Financial Results

Key pro-forma financial results for the three and six months ended June 30, 2022 and 2021, are set forth in the following table (in millions, except per share amounts). The financial results below reflect the Company’s results, on a pro-forma basis, taking into consideration the sale of certain Voice assets in the United Kingdom as well as the sale of the Company’s B2B Backup business as if they had occurred January 1, 2021.

 Three months ended June 30,Six months ended June 30,
2022202120222021
Total Revenues$337.4$341.3$652.4$653.0
Pro-Forma Revenue Adjustments$—$(11.3)$—$(23.9)
Pro-Forma Total Revenue: (1)
$337.4$330.0$652.4$629.1
Adjusted Non-GAAP Net Income per Diluted Share from Continuing Operations (1)
$1.58$1.50$2.81$2.74
Pro-Forma Net Income per Diluted Share from Continuing Operations Adjustments$—$(0.09)$—$(0.14)
Adjusted Pro Forma Net Income per Diluted Share from Continuing Operations (1)
$1.58$1.41$2.81$2.60
Adjusted Non-GAAP Net Income from Continuing Operations$74.4$67.1$132.4$122.5
Pro-Forma Net Income from Continuing Operations Adjustments$—$(3.9)$—$(6.2)
Adjusted Pro-Forma Net Income from Continuing Operations$74.4$63.2$132.4$116.3
Adjusted EBITDA (1)
$118.0$117.0$218.8$217.7
Pro-Forma EBITDA Adjustments$—$(4.9)$—$(9.7)
Adjusted Pro-Forma EBITDA (1)
$118.0$112.1$218.8$208.0
Adjusted EBITDA Margin (1)
35.0%34.3%33.5%33.3%
Pro-Forma EBITDA Margin Adjustments0.0%(0.3)%0.0%(0.2)%
Adjusted Pro-Forma EBITDA Margin (1)
35.0%34.0%33.5%33.1%
(1)Refer to the notes earlier in this Press Release.

20


ZIFF DAVIS, INC. AND SUBSIDIARIES
RECONCILIATION OF GAAP TO ADJUSTED NON-GAAP FINANCIAL MEASURES
THREE AND SIX MONTHS ENDED JUNE 30, 2022 AND 2021
(UNAUDITED, IN THOUSANDS)

The following table sets forth a reconciliation of Adjusted EBITDA to net (loss) income from continuing operations, the most directly comparable GAAP financial measure.
Three months ended June 30,Six months ended June 30,
2022202120222021
Net (loss) income from continuing operations$(46,436)$(23,045)$(21,899)$15,735 
Plus:
Interest expense, net6,956 21,013 18,466 42,490 
Gain on sale of businesses— (823)— (2,802)
Unrealized loss on short-term investment27,317 — 18,366 — 
Loss on investments, net48,243 16,677 48,243 16,677 
Other (income) loss, net(6,345)816 (8,744)573 
Income tax expense (benefit)10,051 (10,334)15,131 (17,218)
Loss (income) from equity method investment, net6,101 5,751 6,886 (18,519)
Depreciation and amortization59,872 61,955 118,943 124,625 
Reconciliation of GAAP to Adjusted non-GAAP financial measures:
Share-based compensation7,703 5,869 14,420 11,599 
Acquisition-related integration costs3,431 1,294 4,965 3,724 
Lease asset impairments and other charges1,079 6,167 2,744 8,041 
Disposal related costs65 (992)1,304 128 
Goodwill impairment on business— 32,629 — 32,629 
Adjusted EBITDA$118,037 $116,977 $218,825 $217,682 

Adjusted EBITDA as calculated above represents net income from continuing operations before interest, gain on sale of businesses, unrealized gain on short-term investment, other (income) expense, net, income tax expense, (income) loss from equity method investments, net, depreciation and amortization and the items used to reconcile GAAP to Adjusted non-GAAP financial measures, including (1) share-based compensation, (2) certain acquisition-related integration costs, (3) lease asset impairments and other charges, (4) disposal related costs and (5) goodwill impairment on business. We disclose Adjusted EBITDA as a supplemental Non-GAAP financial performance measure as we believe it is a useful metric by which to compare the performance of our business from period to period. We understand that measures similar to Adjusted EBITDA are broadly used by analysts, rating agencies and investors in assessing our performance. Accordingly, we believe that the presentation of Adjusted EBITDA provides useful information to investors.

Adjusted EBITDA is not in accordance with, or an alternative to, net income from continuing operations, and may be different from non-GAAP measures used by other companies. In addition, Adjusted EBITDA is not based on any comprehensive set of accounting rules or principles. This Adjusted non-GAAP measure has limitations in that it does not reflect all of the amounts associated with the Company’s results of operations determined in accordance with GAAP.

21


ZIFF DAVIS, INC. AND SUBSIDIARIES
NON-GAAP FINANCIAL MEASURES
(UNAUDITED, IN THOUSANDS)


Q1Q2Q3Q4YTD
2022
Net cash provided by operating activities $116,511 $75,973 $— $— $192,484 
Less: Purchases of property and equipment(30,502)(23,374)— — (53,876)
Add: Contingent consideration— — — — — 
Free cash flow$86,009 $52,599 $ $ $138,608 

Q1Q2Q3Q4YTD
2021
Net cash provided by operating activities from continuing and discontinued operations$178,724 $111,298 $140,230 $85,319 $515,571 
Less: Purchases of property and equipment(26,269)(31,497)(29,729)(26,245)(113,740)
Add: Contingent consideration(1)
— 685 — — 685 
Free cash flow from continuing and discontinued operations$152,455 $80,486 $110,501 $59,074 $402,516 
(1)Free cash flows from continuing and discontinued operations of $80.5 million for Q2 2021 is before the effect of payments associated with certain contingent consideration related to acquisitions.

The Company discloses free cash flows from continuing and discontinued operations as supplemental non-GAAP financial performance measure, as it believes it is a useful metric by which to compare the performance of its business from period to period. The Company also understands that this non-GAAP measure is broadly used by analysts, rating agencies and investors in assessing the Company’s performance. Accordingly, the Company believes that the presentation of this non-GAAP financial measure provides useful information to investors.

Free cash flows from continuing and discontinued operations is not in accordance with, or an alternative to, Cash flows from operating activities, and may be different from non-GAAP measures with similar or even identical names used by other companies. In addition, the non-GAAP measure is not based on any comprehensive set of accounting rules or principles. This non-GAAP measure has limitations in that it does not reflect all of the amounts associated with the Company’s results of operations determined in accordance with GAAP.
22


ZIFF DAVIS, INC. AND SUBSIDIARIES
RECONCILIATION OF GAAP TO ADJUSTED NON-GAAP FINANCIAL MEASURES
THREE MONTHS ENDED JUNE 30, 2022
(UNAUDITED, IN THOUSANDS)
    
DigitalCybersecurity
Mediaand MartechCorporateTotal
Revenues
GAAP revenues$258,343 $79,013 $— $337,356 
Gross profit
GAAP gross profit$232,987 $58,365 $— $291,352 
Non-GAAP adjustments:
Share-based compensation24 118 — 142 
Acquisition related integration costs— — 4 
Amortization— 259 — 259 
Adjusted non-GAAP gross profit$233,011 $58,746 $— $291,757 
Operating profit
Income (loss) from operations$44,162 $13,023 $(11,298)$45,887 
Non-GAAP adjustments:
Share-based compensation3,306 1,389 3,008 7,703 
Acquisition related integration costs3,183 239 3,431 
Amortization32,734 9,103 64 41,901 
Lease asset impairments and other charges637 442 — 1,079 
Disposal related costs— — 65 65 
Adjusted non-GAAP operating profit (loss)$84,022 $24,196 $(8,152)$100,066 
Depreciation14,811 3,160 — 17,971 
Adjusted EBITDA$98,833 $27,356 $(8,152)$118,037 
Table above excludes certain intercompany allocations.
23


ZIFF DAVIS, INC. AND SUBSIDIARIES
RECONCILIATION OF GAAP TO ADJUSTED NON-GAAP FINANCIAL MEASURES
THREE MONTHS ENDED JUNE 30, 2021
(UNAUDITED, IN THOUSANDS)
    
DigitalCybersecurity
Mediaand MartechCorporateTotal
Revenues
GAAP revenues$253,761 $87,532 $— $341,293 
Gross profit
GAAP gross profit$228,622 $63,895 $(9)$292,508 
Non-GAAP adjustments:
Share-based compensation66 — 68 
Acquisition related integration costs32 — 36 
Amortization— 348 — 348 
Adjusted non-GAAP gross profit$228,628 $64,341 $(9)$292,960 
Operating profit
Income (loss) from operations$44,106 $(21,195)$(12,856)$10,055 
Non-GAAP adjustments:
Share-based compensation1,784 1,047 3,038 5,869 
Acquisition related integration costs125 1,169 — 1,294 
Amortization37,483 9,531 45 47,059 
Lease asset impairments and other charges6,195 (28)— 6,167 
Disposal related costs— — (992)(992)
Goodwill impairment on a business— 32,629 $— 32,629 
Adjusted non-GAAP operating profit (loss)$89,693 $23,153 $(10,765)$102,081 
Depreciation11,492 3,404 — 14,896 
Adjusted EBITDA$101,185 $26,557 $(10,765)$116,977 
Table above excludes certain intercompany allocations.

24
www.ziffdavis.com©2022 Ziff Davis. All rights reserved. SECOND QUARTER 2022 RESULTS AUGUST 9, 2022

 
2 Certain statements in this presentation are “forward-looking statements” within the meaning of the Private Securities Litigation Reform Act of 1995, particularly those regarding our 2022 Financial Guidance. Such forward-looking statements are subject to numerous assumptions, risks and uncertainties that could cause actual results to differ materially from those described in those statements. Readers should carefully review the Risk Factors slide of this presentation. These forward-looking statements are based on management’s expectations or beliefs as of August 9, 2022 as well as those set forth in our Annual Report on Form 10-K filed by us on March 15, 2022 with the Securities and Exchange Commission (“SEC”) and the other reports we file from time to time with the SEC. We undertake no obligation to revise or publicly release any updates to such statements based on future information or actual results. Such forward-looking statements address the following subjects, among others: • Future operating results • Ability to acquire businesses on acceptable terms and integrate and recognize synergies from acquired businesses • Deployment of cash and investment balances to grow the company • Subscriber growth, retention, usage levels and average revenue per account • Digital media and cloud services growth • International growth • New products, services, features and technologies • Corporate spending including stock repurchases • Intellectual property and related licensing revenues • Liquidity and ability to repay or refinance indebtedness • Systems capacity, coverage, reliability and security • Regulatory developments and taxes All information in this presentation speaks as of August 9, 2022 and any redistribution or rebroadcast of this presentation after that date is not intended and will not be construed as updating or confirming such information. Third Party Information All third-party trademarks, including names, logos and brands, referenced by the Company in this presentation are property of their respective owners. All references to third-party trademarks are for identification purposes only and shall be considered nominative fair use under trademark law. Industry, Market and Other Data Certain information contained in this presentation concerning our industry and the markets in which we operate, including our general expectations and market position, market opportunity and market size, is based on reports from various sources. Because this information involves a number of assumptions and limitations, you are cautioned not to give undue weight to such information. We have not independently verified market data and industry forecasts provided by any of these or any other third-party sources referred to in this presentation. In addition, projections, assumptions and estimates of our future performance and the future performance of the industry in which we operate are necessarily subject to a high degree of uncertainty and risk due to a variety of factors. These and other factors could cause results to differ materially from those expressed in the estimates made by third parties and by us. Non-GAAP Financial information Included in this presentation are certain financial measures that are not calculated in accordance with U.S. generally accepted accounting principles ("GAAP") designed to supplement, and not substitute, Ziff Davis’s financial information presented in accordance with GAAP. The non- GAAP measures as defined by Ziff Davis may not be comparable to similar non-GAAP measures presented by other companies. The presentation of such measures, which may include adjustments to exclude unusual or non-recurring items, should not be construed as an inference that Ziff Davis’s future results or leverage will be unaffected by other unusual or non-recurring items. Please see the appendix to this presentation for how we define these non-GAAP measures, a discussion of why we believe they are useful to investors and certain limitations thereof, and reconciliations thereof to the most directly comparable GAAP measures. Pro Forma Financial Information, Continuing Operations Unless otherwise specified, all financial data and operating metrics presented herein for Ziff Davis are presented on a pro forma (“PF”) basis adjusted non-GAAP for Ziff Davis continuing operations, giving effect to the divestitures of the Voice assets in Australia, New Zealand, and the United Kingdom, as well as the sale of the Company’s B2B Backup businesses and the separation of Consensus Cloud Solutions, Inc. (“Consensus”) as described in the Form 10 filed by Consensus with the Securities and Exchange Commission, as if they had occurred on January 1, 2020. Safe Harbor for Forward-looking Statements

 
3 Some factors that could cause actual results to be materially adversely affected include, but are not limited to, our ability and intention to: • Manage certain risks inherent to our business, such as costs associated with fraudulent activity, system failure or security breach; effectively maintaining and managing our billing systems; time and resources required to manage our legal proceedings; liability for legal and other claims; or adhering to our internal controls and procedures; • Compete with other similar providers with regard to price, service, functionality; • Achieve business and financial objectives in light of burdensome domestic and international telecommunications, internet or other regulations, including regulations related to data privacy, access, security, retention, and sharing; • Successfully manage our growth, including but not limited to our operational and personnel-related resources, and integration of newly acquired businesses; • Successfully adapt to technological changes and diversify services and related revenues at acceptable levels of financial return; • Successfully develop and protect our intellectual property, both domestically and internationally, including our brands, patents, trademarks and domain names, and avoid infringing upon the proprietary rights of others; • Recruit and retain key personnel; • Realize the expected benefits of the cloud fax spin-off transaction or the sale of the B2B Backup business; and • Other factors set forth in our Annual Report on Form 10-K filed by us on March 15, 2022 with the SEC and the other reports we file from time to time with the SEC. • Sustain growth or profitability, particularly in light of an uncertain U.S. or worldwide economy, including inflation, supply chain and other factors and their related impact on customer acquisition and retention rates, customer usage levels, and credit and debit card payment declines; • Maintain and increase our customer base and average revenue per user; • Generate sufficient cash flow to make interest and debt payments, reinvest in our business, and pursue desired activities and businesses plans while satisfying restrictive covenants relating to debt obligations; • Acquire businesses on acceptable terms and successfully integrate and realize anticipated synergies from such acquisitions; • Continue to expand our businesses and operations internationally in the wake of numerous risks, including adverse currency fluctuations, difficulty in staffing and managing international operations, higher operating costs as a percentage of revenues, or the implementation of adverse regulations; • Maintain our financial position, operating results and cash flows in the event that we incur new or unanticipated costs or tax liabilities, including those relating to federal and state income tax and indirect taxes, such as sales, value-added and telecommunication taxes; • Accurately estimate the assumptions underlying our effective worldwide tax rate; • Maintain favorable relationships with critical third-party vendors whose financial condition will not negatively impact the services they provide; • Create compelling digital media content causing increased traffic and advertising levels; additional advertisers or an increase in advertising spend; and effectively target digital media advertisements to desired audiences; Risk Factors
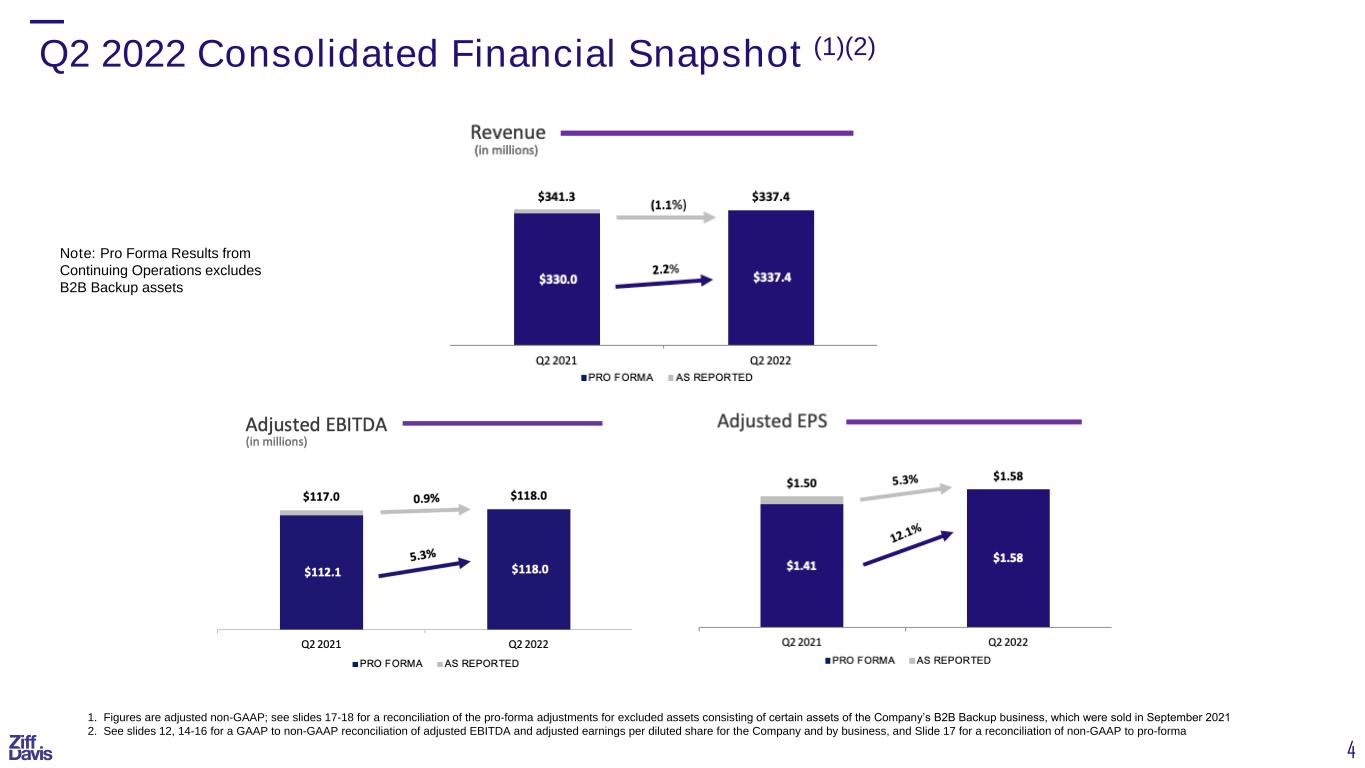

 
4 Q2 2022 Consolidated Financial Snapshot (1)(2) 1. Figures are adjusted non-GAAP; see slides 17-18 for a reconciliation of the pro-forma adjustments for excluded assets consisting of certain assets of the Company’s B2B Backup business, which were sold in September 2021 2. See slides 12, 14-16 for a GAAP to non-GAAP reconciliation of adjusted EBITDA and adjusted earnings per diluted share for the Company and by business, and Slide 17 for a reconciliation of non-GAAP to pro-forma Note: Pro Forma Results from Continuing Operations excludes B2B Backup assets


5 1. Figures exclude any intercompany eliminations; TTM metrics relate to last 12 months ended June 30, 2021 and June 30, 2022, respectively 2. Net Advertising Revenue Retention = (Revenue Recognized by Prior Year Advertisers in Current Year Period (excluding revenue from acquisitions during the stub period)) / (Revenue Recognized by Prior Year Advertisers in Prior Year Period (excluding revenue from acquisitions during the stub period)). Excludes advertisers that generated less than $10,000 of revenue in the measurement period; combined retention is the weighted average net advertising revenue retention of the two digital media divisions. As a result of the aggregation of certain reporting systems related to the integration of several acquisitions, retention data for Q1 2021 and Q2 2021 reflects certain estimates 3. Excludes advertisers that spent less than $2,500 in the quarter in either the Tech, Shopping, Entertainment or Health & Wellness divisions 4. Total gross quarterly advertising revenues divided by advertisers as defined in footnote (3) Advertising Performance Quarterly Advertising Metrics Q1 Q2 Q3 Q4 Q1 Q2 Net Revenue Retention (2) 103.7% 111.2% 114.1% 111.9% 106.6% 99.6% Advertisers (3) 1,705 1,913 1,908 2,198 1,950 2,016 Quarterly Revenue per Advertiser (4) $103,981 $103,704 $104,189 $119,932 $87,214 $93,848 20222021
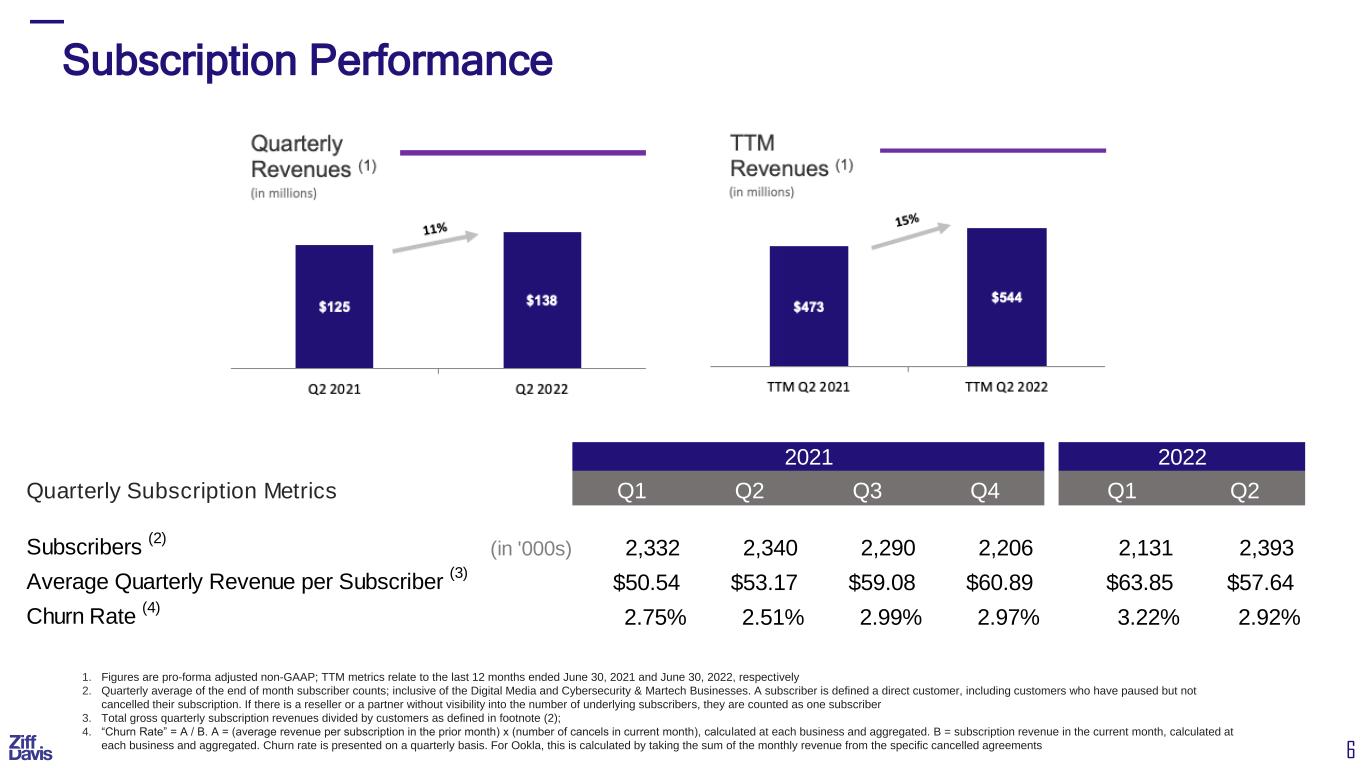

 
6 1. Figures are pro-forma adjusted non-GAAP; TTM metrics relate to the last 12 months ended June 30, 2021 and June 30, 2022, respectively 2. Quarterly average of the end of month subscriber counts; inclusive of the Digital Media and Cybersecurity & Martech Businesses. A subscriber is defined a direct customer, including customers who have paused but not cancelled their subscription. If there is a reseller or a partner without visibility into the number of underlying subscribers, they are counted as one subscriber 3. Total gross quarterly subscription revenues divided by customers as defined in footnote (2); 4. “Churn Rate” = A / B. A = (average revenue per subscription in the prior month) x (number of cancels in current month), calculated at each business and aggregated. B = subscription revenue in the current month, calculated at each business and aggregated. Churn rate is presented on a quarterly basis. For Ookla, this is calculated by taking the sum of the monthly revenue from the specific cancelled agreements Subscription Performance Quarterly Subscription Metrics Q1 Q2 Q3 Q4 Q1 Q2 Subscribers (2) (in '000s) 2,332 2,340 2,290 2,206 2,131 2,393 Average Quarterly Revenue per Subscriber (3) $50.54 $53.17 $59.08 $60.89 $63.85 $57.64 Churn Rate (4) 2.75% 2.51% 2.99% 2.97% 3.22% 2.92% 20222021
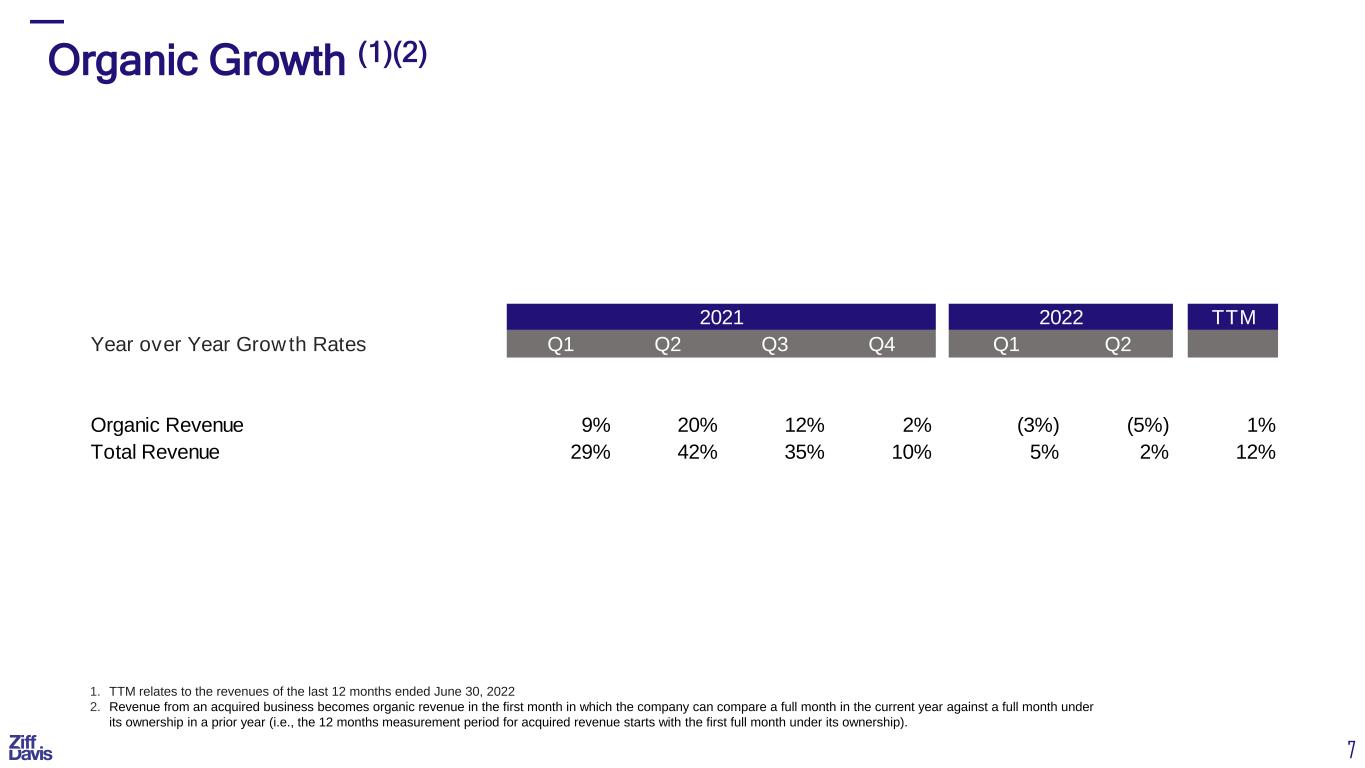

 
7 1. TTM relates to the revenues of the last 12 months ended June 30, 2022 2. Revenue from an acquired business becomes organic revenue in the first month in which the company can compare a full month in the current year against a full month under its ownership in a prior year (i.e., the 12 months measurement period for acquired revenue starts with the first full month under its ownership). Year over Year Growth Rates Q1 Q2 Q3 Q4 Q1 Q2 Organic Revenue 9% 20% 12% 2% (3%) (5%) 1% Total Revenue 29% 42% 35% 10% 5% 2% 12% TTM2021 2022 Organic Growth (1)(2)
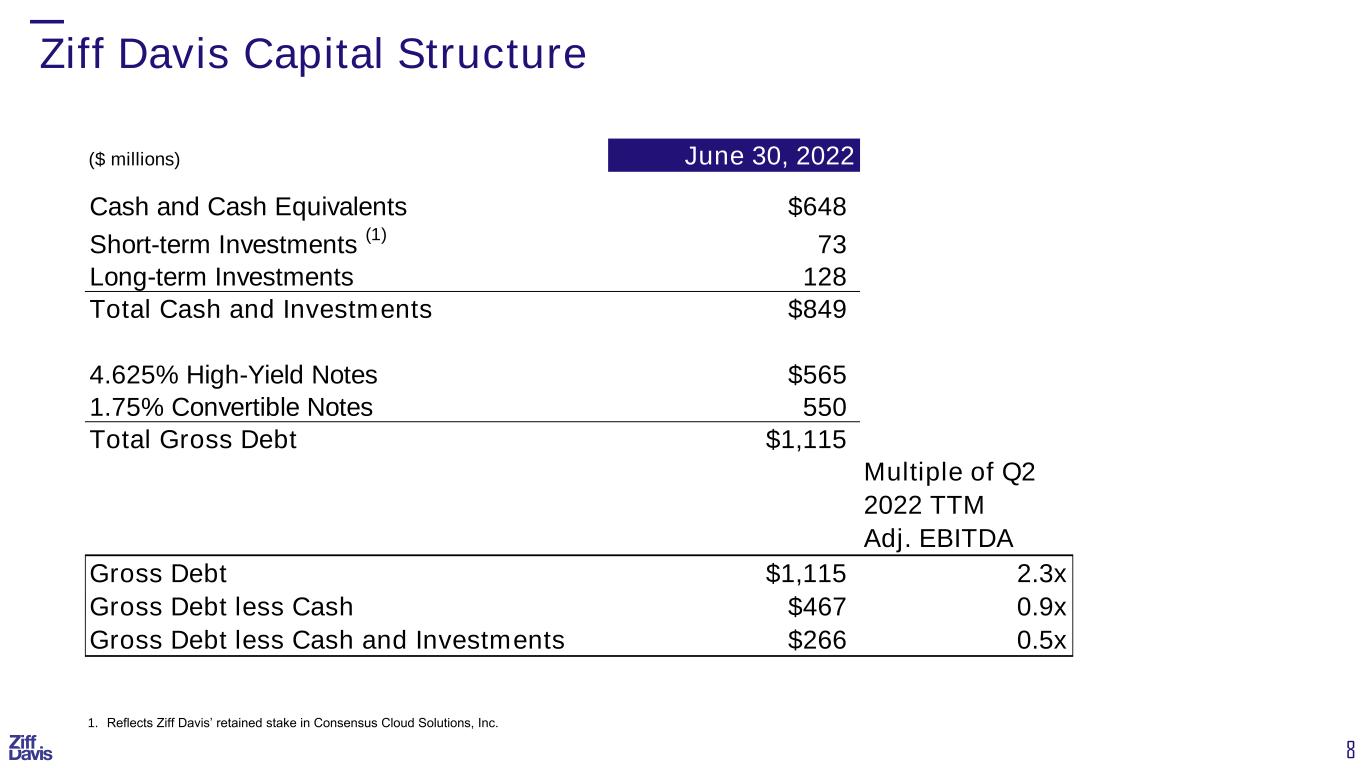

 
8 Ziff Davis Capital Structure 1. Reflects Ziff Davis’ retained stake in Consensus Cloud Solutions, Inc. ($ millions) June 30, 2022 Cash and Cash Equivalents $648 Short-term Investments (1) 73 Long-term Investments 128 Total Cash and Investments $849 4.625% High-Yield Notes $565 1.75% Convertible Notes 550 Total Gross Debt $1,115 Multiple of Q2 2022 TTM Adj. EBITDA Gross Debt $1,115 2.3x Gross Debt less Cash $467 0.9x Gross Debt less Cash and Investments $266 0.5x

 
2022 FINANCIAL GUIDANCE

 
10 2022 Guidance (Forward-Looking Statements) Ziff Davis revises its annual guidance of Revenues, Adjusted non-GAAP EBITDA and Adjusted non-GAAP EPS (1) 1. Figures are adjusted non-GAAP; 2021 figures are pro forma adjusted non-GAAP 2. Revised from original guidance with Revenue, Adjusted EBITDA, and Adjusted non-GAAP EPS ranges of $1,497MM-$1,535MM, $538MM-$555MM, $6.52-$6.79, respectively 3. Adjusted non-GAAP EPS (earnings per diluted share) excludes share-based compensation of between $24 million and $28 million, amortization of acquired intangibles and the impact of any currently unanticipated items, in each case net of tax. It is anticipated that the non-GAAP effective tax rate for 2022 (exclusive of the release of reserves for uncertain tax positions) will be between 22.25% and 23.75% Ziff Davis FY 2022 Guidance Range (2) $ in MM, except for per share amounts Low Midpoint High Midpoint YoY % Increase vs 2021A Revenue $1,410 $1,423 $1,435 2.8% Adjusted non-GAAP EBITDA $507 $513 $519 5.9% Adjusted non-GAAP EPS (3) $6.57 $6.67 $6.77 9.2%

 
SUPPLEMENTAL INFORMATION

 
12 Q2 2022 Reconciliation of GAAP to Adjusted non-GAAP Earnings & EPS Non-GAAP net income is GAAP net income with the following modifications: (1) elimination of share-based compensation; (2) elimination of certain acquisition related integration costs; (3) elimination of interest costs in excess of the coupon rate associated with the convertible notes and overlapping interest of senior notes prior to extinguishment; (4) elimination of amortization of patents and intangible assets that we acquired; (5) elimination of change in value on investment; (6) elimination of gain on sale of assets; (7) elimination of lease asset impairments and other charges; (8) elimination of disposal related costs; and (9) elimination of convertible debt dilution $ in 000's 2021 2022 2021 2022 Cost of revenues 48,785$ 46,004$ 92,637$ 92,104$ Plus: Share based compensation (1) (68) (142) (150) (226) Acquisition related integration costs (2) (36) (4) (76) (54) Amortization (4) (348) (259) (941) (538) Adjusted non-GAAP cost of revenues 48,333$ 45,599$ 91,470$ 91,286$ Sales and marketing 120,421$ 123,777$ 228,372$ 241,539$ Plus: Share based compensation (1) (278) (1,106) (544) (1,675) Acquisition related integration costs (2) 23 (1,219) (814) (1,385) Lease asset impairments and other charges (7) - (438) - (961) Adjusted non-GAAP sales and marketing 120,166$ 121,014$ 227,014$ 237,518$ Research, development and engineering 17,705$ 19,721$ 37,380$ 38,148$ Plus: Share based compensation (1) (458) (851) (876) (1,480) Acquisition related integration costs (2) (206) (195) (530) (413) Adjusted non-GAAP research, development and engineering 17,041$ 18,675$ 35,974$ 36,255$ General and administrative 111,698$ 101,967$ 224,996$ 204,184$ Plus: Share based compensation (1) (5,066) (5,604) (10,029) (11,038) Acquisition related integration costs (2) (1,075) (2,013) (2,304) (3,114) Amortization (4) (46,711) (41,642) (93,920) (82,865) Lease asset impairments and other charges (7) (6,167) (641) (8,041) (1,783) Disposal related costs (8) 991 (65) (129) (1,304) Adjusted non-GAAP general and administrative 53,670$ 52,002$ 110,573$ 104,080$ Goodwill impairment on business 32,629$ -$ 32,629$ -$ Plus: Goodwill impairment on business (19) (32,629) -$ (32,629) - Adjusted non-GAAP goodwill impairment on business -$ -$ -$ -$ Interest expense, net (21,013)$ (6,956)$ (42,490)$ (18,466)$ Plus: Interest costs (3) 6,078 (2,959) 12,495 (1,618) Adjusted non-GAAP interest expense, net (14,935)$ (9,915)$ (29,995)$ (20,084)$ Gain on sale of businesses 823$ -$ 2,802$ -$ Plus: Sale of assets (6) (823) - (2,802) - Adjusted non-GAAP gain on sale of businesses -$ -$ -$ -$ Loss on investment, net (16,677)$ (48,243)$ (16,677)$ (48,243)$ Plus: Investments (5) 16,677 48,243 16,677 48,243 Adjusted non-GAAP loss on investments, net -$ -$ -$ -$ Unrealized loss on short-term investments -$ (27,317)$ -$ (18,366)$ Plus: Investments (5) - 27,317 - 18,366 Adjusted non-GAAP unrealized loss on short-term investments, net -$ -$ -$ -$ Other income, net (816)$ 6,345$ (573)$ 8,744$ Plus: Investments (5) - (174) - (174) Adjusted non-GAAP other income (expense), net (816)$ 6,171$ (573)$ 8,570$ Income tax expense (benefit) (10,334)$ 10,051$ (17,218)$ 15,131$ Plus: Share based compensation (1) 2,055 905 4,495 2,743 Acquisition related integration costs (2) 422 804 1,232 1,139 Interest costs (3) 1,317 (733) 2,889 (398) Amortization (4) 12,900 9,837 28,246 18,941 Investments (5) 3,938 1,002 5,112 1,003 Sale of assets (6) - - 44 - Lease asset impairments and other charges (7) 1,502 271 1,959 678 Disposal related costs (8) (571) (240) 58 181 Goodwill impairment on business (19) 7,994 - 7,994 - Adjusted non-GAAP income tax benefit 19,224$ 21,897$ 34,811$ 39,418$ (Loss) income from equity method investment, net (5,751)$ (6,101)$ 18,519$ (6,886)$ Plus: Investments (5) 5,751 6,101 (18,519) 6,886 Adjusted non-GAAP income from equity method investment, net -$ -$ -$ -$ Total adjustments (90,153)$ (120,861)$ (106,805)$ (154,252)$ GAAP earnings per diluted share ($0.52) ($0.99) $0.33 ($0.47) Adjustments * $2.02 $2.57 $2.41 $3.28 Adjusted non-GAAP earnings per diluted share $1.50 $1.58 $2.74 $2.81 Three Months Ended June 30, Six Months Ended June 30,

 
13 GAAP Reconciliation – Free Cash Flow (1)(2) 1. Free Cash Flow is defined as net cash provided by operating activities, less purchases of property, plant and equipment, plus contingent consideration. Free Cash Flow amounts are not meant as a substitute for GAAP, and are solely for informational purposes. 2. Figures are adjusted non-GAAP; and 2021 figures include the contribution from Consensus and the divested B2B Backup and Voice UK assets $ in 000's Ziff Davis 2021 2022 2021 2022 Net cash provided by operating activities 111,298$ 75,973$ 290,022$ 192,484$ Less: Purchases of property and equipment (31,497) (23,374) (57,766) (53,876) Add: Contingent consideration 685 - 685 - Free cash flow (2) 80,486$ 52,599$ 232,941$ 138,608$ Three Months Ended June 30th, Six Months Ended June 30th,
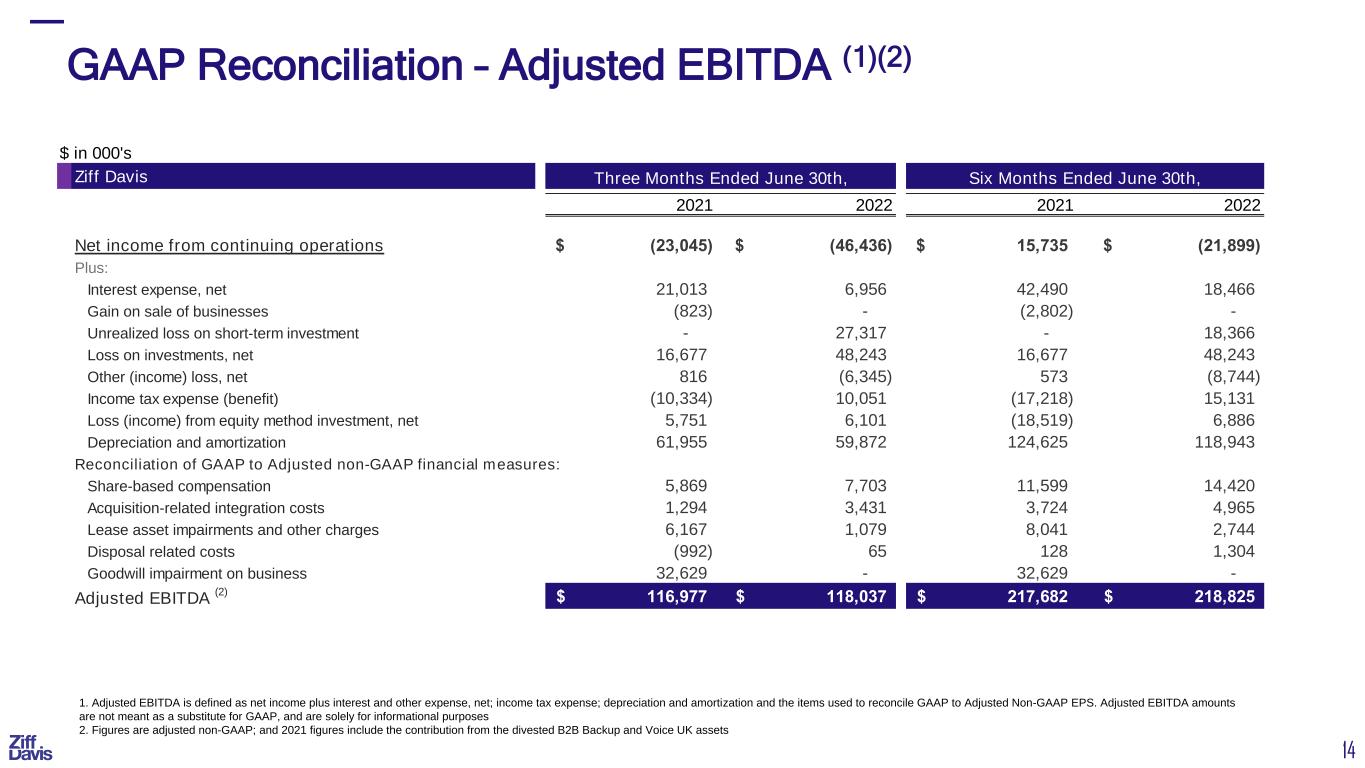

 
14 GAAP Reconciliation – Adjusted EBITDA (1)(2) 1. Adjusted EBITDA is defined as net income plus interest and other expense, net; income tax expense; depreciation and amortization and the items used to reconcile GAAP to Adjusted Non-GAAP EPS. Adjusted EBITDA amounts are not meant as a substitute for GAAP, and are solely for informational purposes 2. Figures are adjusted non-GAAP; and 2021 figures include the contribution from the divested B2B Backup and Voice UK assets $ in 000's Ziff Davis 2021 2022 2021 2022 Net income from continuing operations (23,045)$ (46,436)$ 15,735$ (21,899)$ Plus: Interest expense, net 21,013 6,956 42,490 18,466 Gain on sale of businesses (823) - (2,802) - Unrealized loss on short-term investment - 27,317 - 18,366 Loss on investments, net 16,677 48,243 16,677 48,243 Other (income) loss, net 816 (6,345) 573 (8,744) Income tax expense (benefit) (10,334) 10,051 (17,218) 15,131 Loss (income) from equity method investment, net 5,751 6,101 (18,519) 6,886 Depreciation and amortization 61,955 59,872 124,625 118,943 Reconciliation of GAAP to Adjusted non-GAAP financial measures: Share-based compensation 5,869 7,703 11,599 14,420 Acquisition-related integration costs 1,294 3,431 3,724 4,965 Lease asset impairments and other charges 6,167 1,079 8,041 2,744 Disposal related costs (992) 65 128 1,304 Goodwill impairment on business 32,629 - 32,629 - Adjusted EBITDA (2) 116,977$ 118,037$ 217,682$ 218,825$ Three Months Ended June 30th, Six Months Ended June 30th,
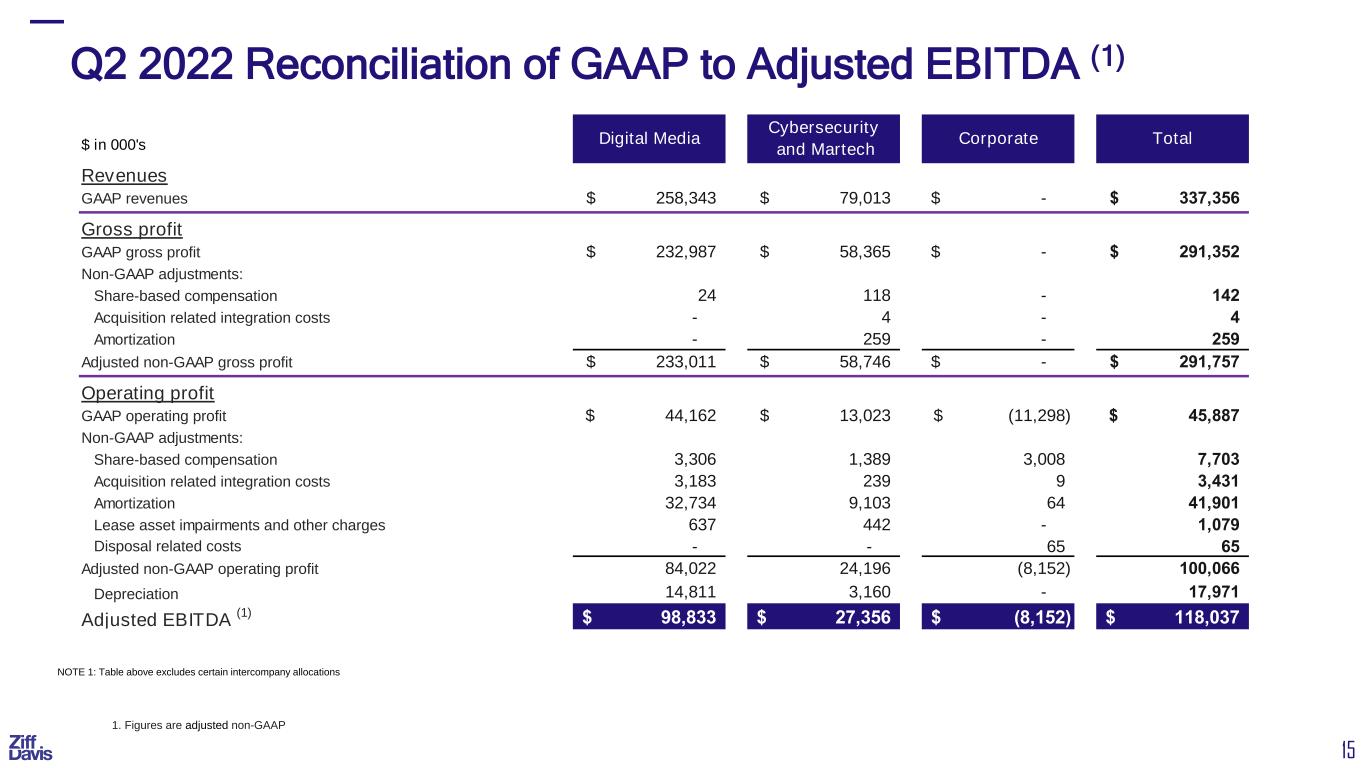

 
15 NOTE 1: Table above excludes certain intercompany allocations 1. Figures are adjusted non-GAAP Q2 2022 Reconciliation of GAAP to Adjusted EBITDA (1) $ in 000's Revenues GAAP revenues 258,343$ 79,013$ -$ 337,356$ Gross profit GAAP gross profit 232,987$ 58,365$ -$ 291,352$ Non-GAAP adjustments: Share-based compensation 24 118 - 142 Acquisition related integration costs - 4 - 4 Amortization - 259 - 259 Adjusted non-GAAP gross profit 233,011$ 58,746$ -$ 291,757$ Operating profit GAAP operating profit 44,162$ 13,023$ (11,298)$ 45,887$ Non-GAAP adjustments: Share-based compensation 3,306 1,389 3,008 7,703 Acquisition related integration costs 3,183 239 9 3,431 Amortization 32,734 9,103 64 41,901 Lease asset impairments and other charges 637 442 - 1,079 Disposal related costs - - 65 65 Adjusted non-GAAP operating profit 84,022 24,196 (8,152) 100,066 Depreciation 14,811 3,160 - 17,971 Adjusted EBITDA (1) 98,833$ 27,356$ (8,152)$ 118,037$ Digital Media Cybersecurity and Martech Corporate Total
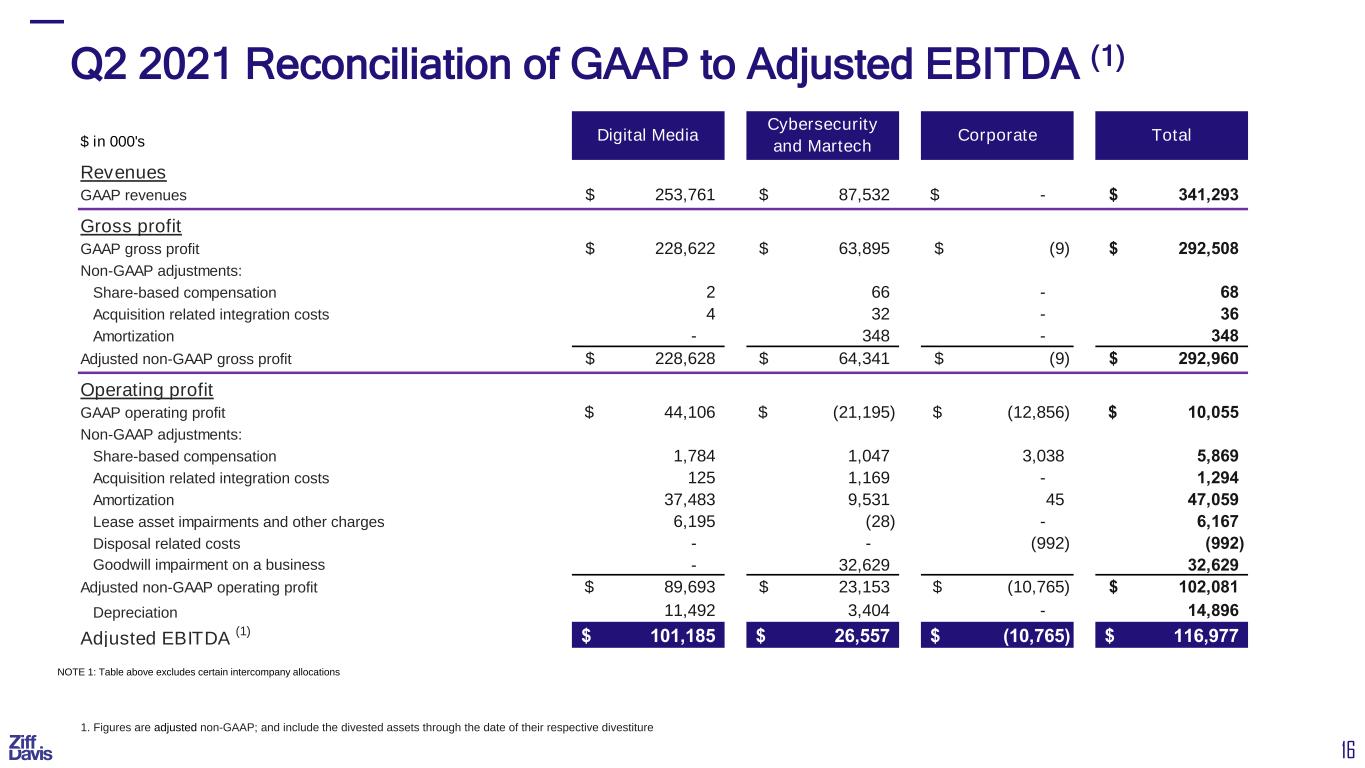

 
16 Q2 2021 Reconciliation of GAAP to Adjusted EBITDA (1) 1. Figures are adjusted non-GAAP; and include the divested assets through the date of their respective divestiture NOTE 1: Table above excludes certain intercompany allocations $ in 000's Revenues GAAP revenues 253,761$ 87,532$ -$ 341,293$ Gross profit GAAP gross profit 228,622$ 63,895$ (9)$ 292,508$ Non-GAAP adjustments: Share-based compensation 2 66 - 68 Acquisition related integration costs 4 32 - 36 Amortization - 348 - 348 Adjusted non-GAAP gross profit 228,628$ 64,341$ (9)$ 292,960$ Operating profit GAAP operating profit 44,106$ (21,195)$ (12,856)$ 10,055$ Non-GAAP adjustments: Share-based compensation 1,784 1,047 3,038 5,869 Acquisition related integration costs 125 1,169 - 1,294 Amortization 37,483 9,531 45 47,059 Lease asset impairments and other charges 6,195 (28) - 6,167 Disposal related costs - - (992) (992) Goodwill impairment on a business - 32,629 32,629 Adjusted non-GAAP operating profit 89,693$ 23,153$ (10,765)$ 102,081$ Depreciation 11,492 3,404 - 14,896 Adjusted EBITDA (1) 101,185$ 26,557$ (10,765)$ 116,977$ Digital Media Cybersecurity and Martech Corporate Total
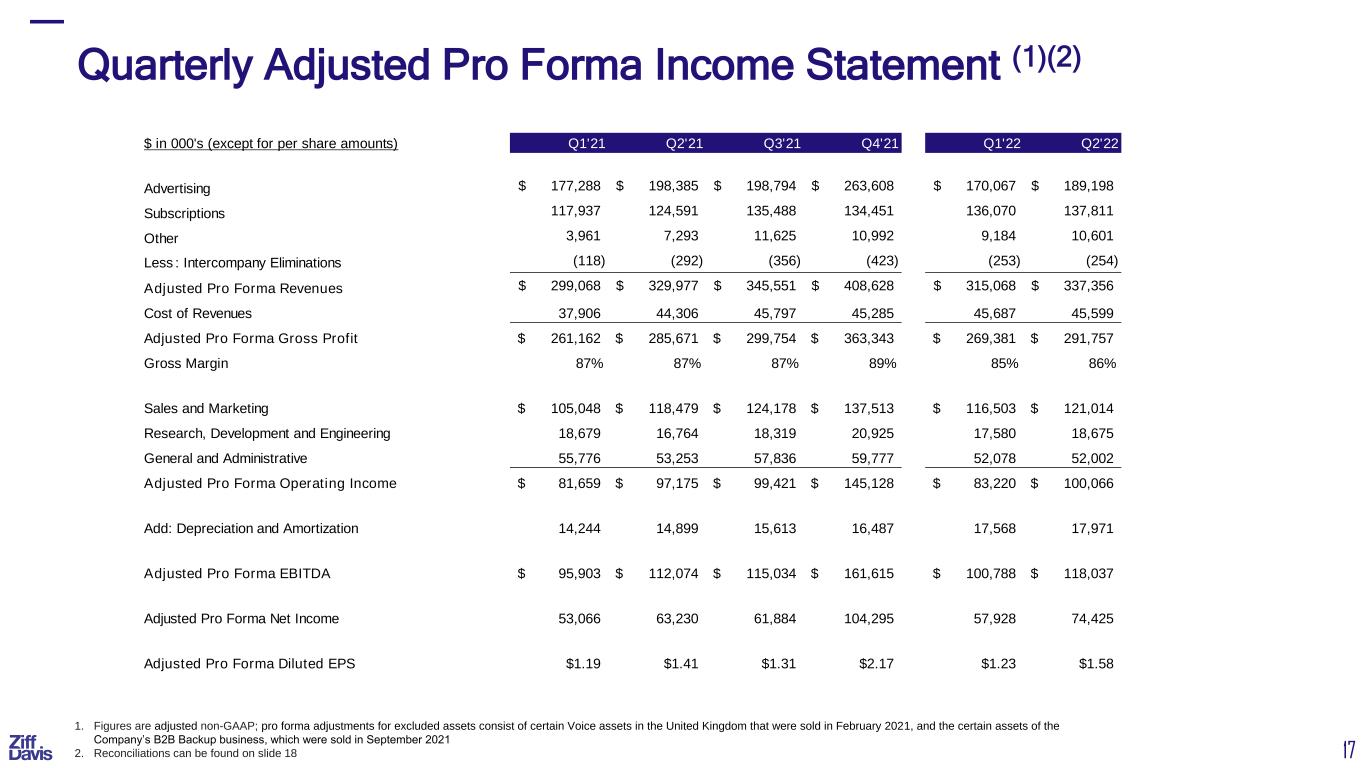

 
17 Quarterly Adjusted Pro Forma Income Statement (1)(2) 1. Figures are adjusted non-GAAP; pro forma adjustments for excluded assets consist of certain Voice assets in the United Kingdom that were sold in February 2021, and the certain assets of the Company’s B2B Backup business, which were sold in September 2021 2. Reconciliations can be found on slide 18 $ in 000's (except for per share amounts) Q1'21 Q2'21 Q3'21 Q4'21 Q1'22 Q2'22 Advertising 177,288$ 198,385$ 198,794$ 263,608$ 170,067$ 189,198$ Subscriptions 117,937 124,591 135,488 134,451 136,070 137,811 Other 3,961 7,293 11,625 10,992 9,184 10,601 Less : Intercompany Eliminations (118) (292) (356) (423) (253) (254) Adjusted Pro Forma Revenues 299,068$ 329,977$ 345,551$ 408,628$ 315,068$ 337,356$ Cost of Revenues 37,906 44,306 45,797 45,285 45,687 45,599 Adjusted Pro Forma Gross Profit 261,162$ 285,671$ 299,754$ 363,343$ 269,381$ 291,757$ Gross Margin 87% 87% 87% 89% 85% 86% Sales and Marketing 105,048$ 118,479$ 124,178$ 137,513$ 116,503$ 121,014$ Research, Development and Engineering 18,679 16,764 18,319 20,925 17,580 18,675 General and Administrative 55,776 53,253 57,836 59,777 52,078 52,002 Adjusted Pro Forma Operating Income 81,659$ 97,175$ 99,421$ 145,128$ 83,220$ 100,066$ Add: Depreciation and Amortization 14,244 14,899 15,613 16,487 17,568 17,971 Adjusted Pro Forma EBITDA 95,903$ 112,074$ 115,034$ 161,615$ 100,788$ 118,037$ Adjusted Pro Forma Net Income 53,066 63,230 61,884 104,295 57,928 74,425 Adjusted Pro Forma Diluted EPS $1.19 $1.41 $1.31 $2.17 $1.23 $1.58
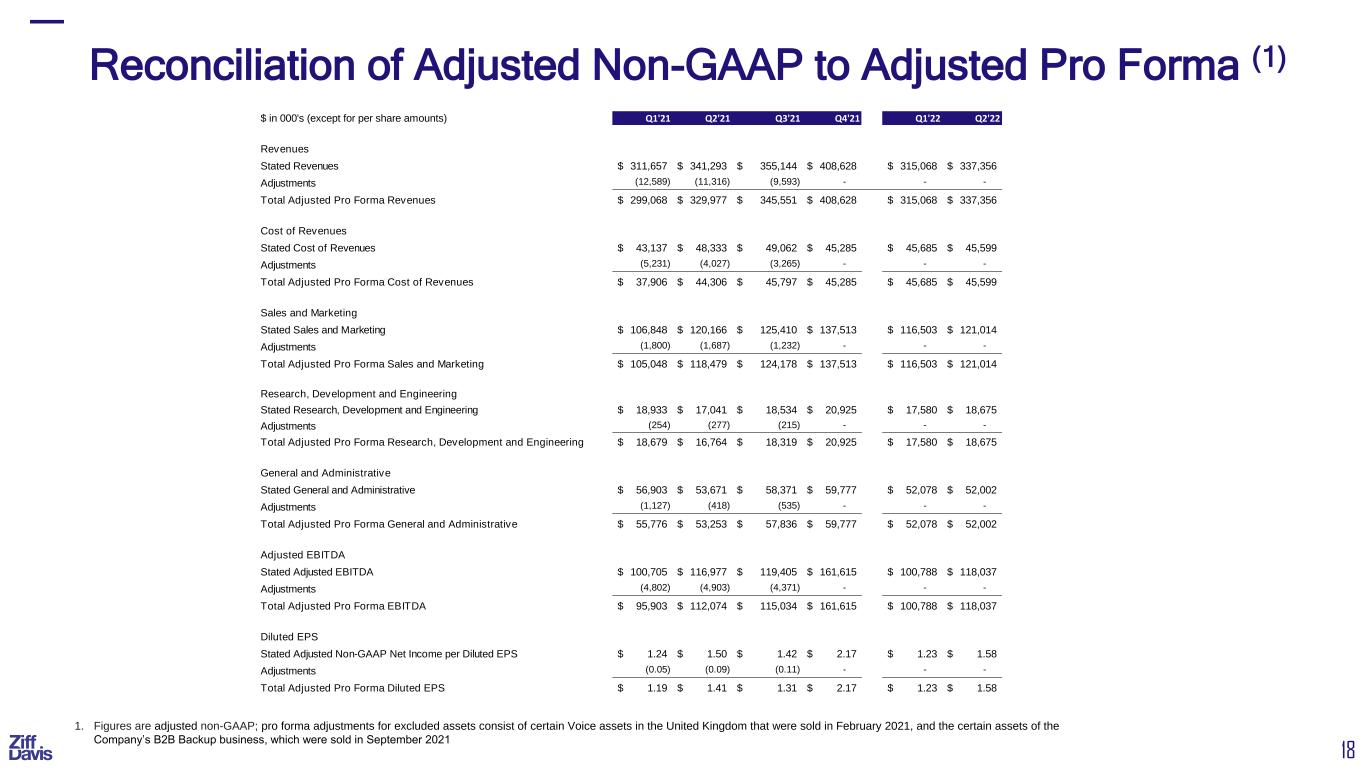

 
18 Reconciliation of Adjusted Non-GAAP to Adjusted Pro Forma (1) 1. Figures are adjusted non-GAAP; pro forma adjustments for excluded assets consist of certain Voice assets in the United Kingdom that were sold in February 2021, and the certain assets of the Company’s B2B Backup business, which were sold in September 2021 $ in 000's (except for per share amounts) Q1'21 Q2'21 Q3'21 Q4'21 Q1'22 Q2'22 Revenues Stated Revenues 311,657$ 341,293$ 355,144$ 408,628$ 315,068$ 337,356$ Adjustments (12,589) (11,316) (9,593) - - - Total Adjusted Pro Forma Revenues 299,068$ 329,977$ 345,551$ 408,628$ 315,068$ 337,356$ Cost of Revenues Stated Cost of Revenues 43,137$ 48,333$ 49,062$ 45,285$ 45,685$ 45,599$ Adjustments (5,231) (4,027) (3,265) - - - Total Adjusted Pro Forma Cost of Revenues 37,906$ 44,306$ 45,797$ 45,285$ 45,685$ 45,599$ Sales and Marketing Stated Sales and Marketing 106,848$ 120,166$ 125,410$ 137,513$ 116,503$ 121,014$ Adjustments (1,800) (1,687) (1,232) - - - Total Adjusted Pro Forma Sales and Marketing 105,048$ 118,479$ 124,178$ 137,513$ 116,503$ 121,014$ Research, Development and Engineering Stated Research, Development and Engineering 18,933$ 17,041$ 18,534$ 20,925$ 17,580$ 18,675$ Adjustments (254) (277) (215) - - - Total Adjusted Pro Forma Research, Development and Engineering 18,679$ 16,764$ 18,319$ 20,925$ 17,580$ 18,675$ General and Administrative Stated General and Administrative 56,903$ 53,671$ 58,371$ 59,777$ 52,078$ 52,002$ Adjustments (1,127) (418) (535) - - - Total Adjusted Pro Forma General and Administrative 55,776$ 53,253$ 57,836$ 59,777$ 52,078$ 52,002$ Adjusted EBITDA Stated Adjusted EBITDA 100,705$ 116,977$ 119,405$ 161,615$ 100,788$ 118,037$ Adjustments (4,802) (4,903) (4,371) - - - Total Adjusted Pro Forma EBITDA 95,903$ 112,074$ 115,034$ 161,615$ 100,788$ 118,037$ Diluted EPS Stated Adjusted Non-GAAP Net Income per Diluted EPS 1.24$ 1.50$ 1.42$ 2.17$ 1.23$ 1.58$ Adjustments (0.05) (0.09) (0.11) - - - Total Adjusted Pro Forma Diluted EPS 1.19$ 1.41$ 1.31$ 2.17$ 1.23$ 1.58$