z-20230215
false000161764000016176402023-02-152023-02-150001617640us-gaap:CommonClassAMember2023-02-152023-02-150001617640us-gaap:CommonClassCMember2023-02-152023-02-15

UNITED STATES
SECURITIES AND EXCHANGE COMMISSION
Washington, D.C. 20549
FORM 8-K
CURRENT REPORT
Pursuant to Section 13 or 15(d)
of the Securities Exchange Act of 1934
Date of Report (Date of Earliest Event Reported): February 15, 2023
ZILLOW GROUP, INC.
(Exact name of registrant as specified in its charter)
Washington 001-36853 47-1645716
(State or other jurisdiction
of incorporation)
 (Commission
File Number)
 (I.R.S. Employer
Identification No.)
1301 Second Avenue, Floor 31, Seattle, Washington
 98101
(Address of principal executive offices) (Zip Code)
(206) 470-7000
(Registrant’s telephone number, including area code)
Check the appropriate box below if the Form 8-K filing is intended to simultaneously satisfy the filing obligation of the registrant under any of the following provisions:
Written communications pursuant to Rule 425 under the Securities Act (17 CFR 230.425)
Soliciting material pursuant to Rule 14a-12 under the Exchange Act (17 CFR 240.14a-12)
Pre-commencement communications pursuant to Rule 14d-2(b) under the Exchange Act (17 CFR 240.14d-2(b))
Pre-commencement communications pursuant to Rule 13e-4(c) under the Exchange Act (17 CFR 240.13e-4(c))

Securities registered pursuant to Section 12(b) of the Act:
Title of each classTrading Symbol(s)Name of each exchange on which registered
Class A Common Stock, par value $0.0001 per shareZGThe Nasdaq Global Select Market
Class C Capital Stock, par value $0.0001 per shareZThe Nasdaq Global Select Market
Indicate by check mark whether the registrant is an emerging growth company as defined in Rule 405 of the Securities Act of 1933 (§230.405 of this chapter) or Rule 12b-2 of the Securities Exchange Act of 1934 (§240.12b-2 of this chapter).
Emerging growth company     
If an emerging growth company, indicate by check mark if the registrant has elected not to use the extended transition period for complying with any new or revised financial accounting standards provided pursuant to Section 13(a) of the Exchange Act.    ☐


Item 2.02Results of Operations and Financial Condition.
Zillow Group, Inc. (“Zillow Group”) today issued a press release and a shareholder letter announcing its financial results for the fiscal quarter and full year ended December 31, 2022. The full text of the press release issued in connection with the announcement is furnished as Exhibit 99.1, accompanying supporting tables as Exhibit 99.2 and the shareholder letter as Exhibit 99.3 to this Current Report on Form 8-K.
The information in this Item 2.02 and Exhibits 99.1, 99.2 and 99.3 of this Current Report on Form 8-K shall not be deemed to be “filed” for purposes of Section 18 of the Securities Exchange Act of 1934, as amended (the “Exchange Act”), or otherwise subject to the liabilities of that section, nor shall it be deemed incorporated by reference into any filing under the Securities Act of 1933, as amended, or the Exchange Act, except as expressly set forth by specific reference in such a filing.

Item 9.01Financial Statements and Exhibits.
(d) Exhibits.
Exhibit
Number
  Description
99.1
99.2
99.3
104Cover Page Interactive Data File (embedded within the Inline XBRL document).


SIGNATURES
Pursuant to the requirements of the Securities Exchange Act of 1934, the registrant has duly caused this report to be signed on its behalf by the undersigned hereunto duly authorized.
 
Dated: February 15, 2023
 ZILLOW GROUP, INC.
 By:
/s/ JENNIFER ROCK
 Name:Jennifer Rock
 Title:Chief Accounting Officer


Exhibit 99.1
zglogoa04a.jpg 
Contacts:
Investors
Brad Berning
[email protected]
Media
Chrissy Roebuck
[email protected]


Zillow Group Reports Fourth-Quarter and Full-Year 2022 Financial Results

SEATTLE — Feb. 15, 2023 — Zillow Group, Inc. (NASDAQ: Z and ZG), which is transforming the way people buy, sell, rent and finance homes, today announced its consolidated financial results for the three months ended and year ended Dec. 31, 2022.

Complete financial results and outlook for the first quarter of 2023 can be found in the shareholder letter on the Investor Relations section of Zillow Group’s website at https://investors.zillowgroup.com/investors/financials/quarterly-results/default.aspx.

“While navigating a slow and difficult housing market in 2022, we kept our eyes on the future — our vision of building the housing super app,” said Zillow co-founder and CEO Rich Barton. “Our consolidated Q4 financial results outperformed our expectations, and we’ve been rapidly shipping products aligned with our five growth pillars. We’re building momentum that will help us scale as we serve customers and the industry with an easier, more seamless way to transact in real estate.”

Recent highlights include:
Zillow Group’s fourth-quarter results exceeded the company’s outlook at a consolidated level for both revenue and Adjusted EBITDA.
Consolidated Q4 revenue was $435 million, and full-year 2022 revenue from continuing operations was $2.0 billion.
IMT segment revenue was above the high end of the company’s outlook range, declining 14% year over year to $417 million.
Driven by the relative strength at the top of the company’s funnel, Premier Agent revenue outperformed the company’s expectations and the industry total transaction dollar decline of 31%, decreasing 20% year over year to $283 million for Q4.
Rentals revenue increased 13% year over year to $68 million as the company continued to see strong traffic and growth in multifamily properties.
Mortgages segment revenue was $18 million for Q4, near the midpoint of the company’s outlook range.
On a GAAP basis, consolidated net loss was $72 million for Q4 and $101 million for 2022. Consolidated net loss from continuing operations was $72 million for Q4 and $88 million for 2022. Segment income (loss) from continuing operations before income taxes for the IMT, Homes and Mortgages segments was $(22) million, $(13) million and $(51) million in Q4, and $160 million, $(93) million and $(167) million for full-year 2022, respectively. IMT segment income from continuing operations before income taxes margin contracted to 9% from 29% in 2021.
Consolidated Adjusted EBITDA from continuing operations was $73 million for Q4 and $514 million for full-year 2022. Adjusted EBITDA from continuing operations by segment was $113 million, $(8) million and $(32) million for the IMT, Homes and Mortgages segments in Q4, and $672 million, $(66) million and $(92) million for full-year 2022, respectively. The Q4 consolidated results were primarily driven by higher-than-anticipated margins in the company’s IMT segment as revenue outperformed the company’s expectations. The 2022 results were driven primarily by IMT segment Adjusted EBITDA margin contracting to 37% from 45% in 2021 as the company continued to invest during a weaker macroeconomic environment.


During Q4, the company acquired VRX Media, a national photographer network that helped accelerate the launch of Listing Media Services through the ShowingTime+ brand in early Q1 2023. The company also just launched a new selling solution with Opendoor that enables homeowners to explore multiple selling options on Zillow.
Cash and investments at the end of Q4 were $3.4 billion, compared to $3.5 billion at the end of Q3 2022, after $174 million in share repurchases during the quarter. As of the end of Q4, $500 million remained under the company’s total repurchase authorizations of $1.8 billion. Convertible debt outstanding was $1.7 billion at the end of Q4.
Traffic to Zillow Group’s mobile apps and websites in Q4 was 198 million average monthly unique users, flat year over year. Visits during Q4 were 2.2 billion, down 5% year over year. Average monthly unique users for 2022 were 220 million, up 1% year over year. Visits during 2022 were 10.5 billion, up 3% from the previous year.


Fourth-Quarter and Full-Year 2022 Financial Highlights
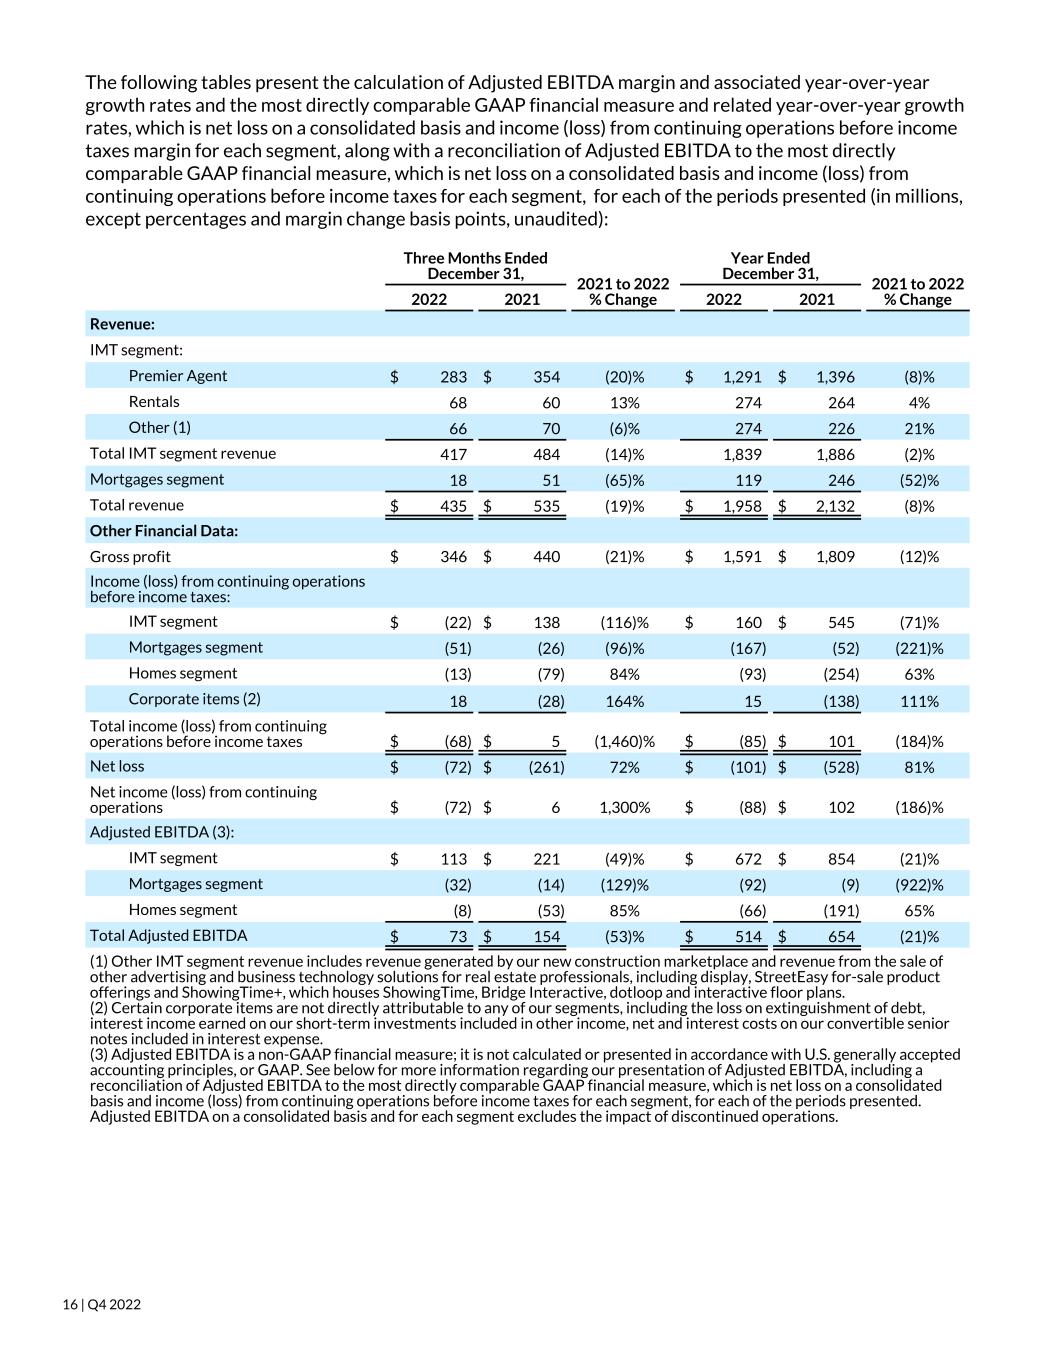
The following table sets forth Zillow Group’s financial highlights for the periods presented (in millions, except percentages, unaudited):
 Three Months Ended
December 31,
2021 to 2022
% Change
Year Ended December 31,2021 to 2022
% Change
 2022202120222021
Revenue:
IMT segment:
Premier Agent
$283 $354 (20)%$1,291 $1,396 (8)%
Rentals68 60 13%274 264 4%
Other (1)66 70 (6)%274 226 21%
Total IMT segment revenue417 484 (14)%1,839 1,886 (2)%
Mortgages segment18 51 (65)%119 246 (52)%
Total revenue$435 $535 (19)%$1,958 $2,132 (8)%
Other Financial Data:
Gross profit$346 $440 $1,591 $1,809 
Income (loss) from continuing operations before income taxes:
IMT segment
$(22)$138 $160 $545 
Mortgages segment
(51)(26)(167)(52)
Homes segment
(13)(79)(93)(254)
Corporate items (2)18 (28)15 (138)
Total income (loss) from continuing operations before income taxes$(68)$$(85)$101 
Net loss$(72)$(261)$(101)$(528)
Net income (loss) from continuing operations$(72)$$(88)$102 
Adjusted EBITDA (3):
IMT segment
$113 $221 $672 $854 
Mortgages segment
(32)(14)(92)(9)
Homes segment
(8)(53)(66)(191)
Total Adjusted EBITDA$73 $154 $514 $654 
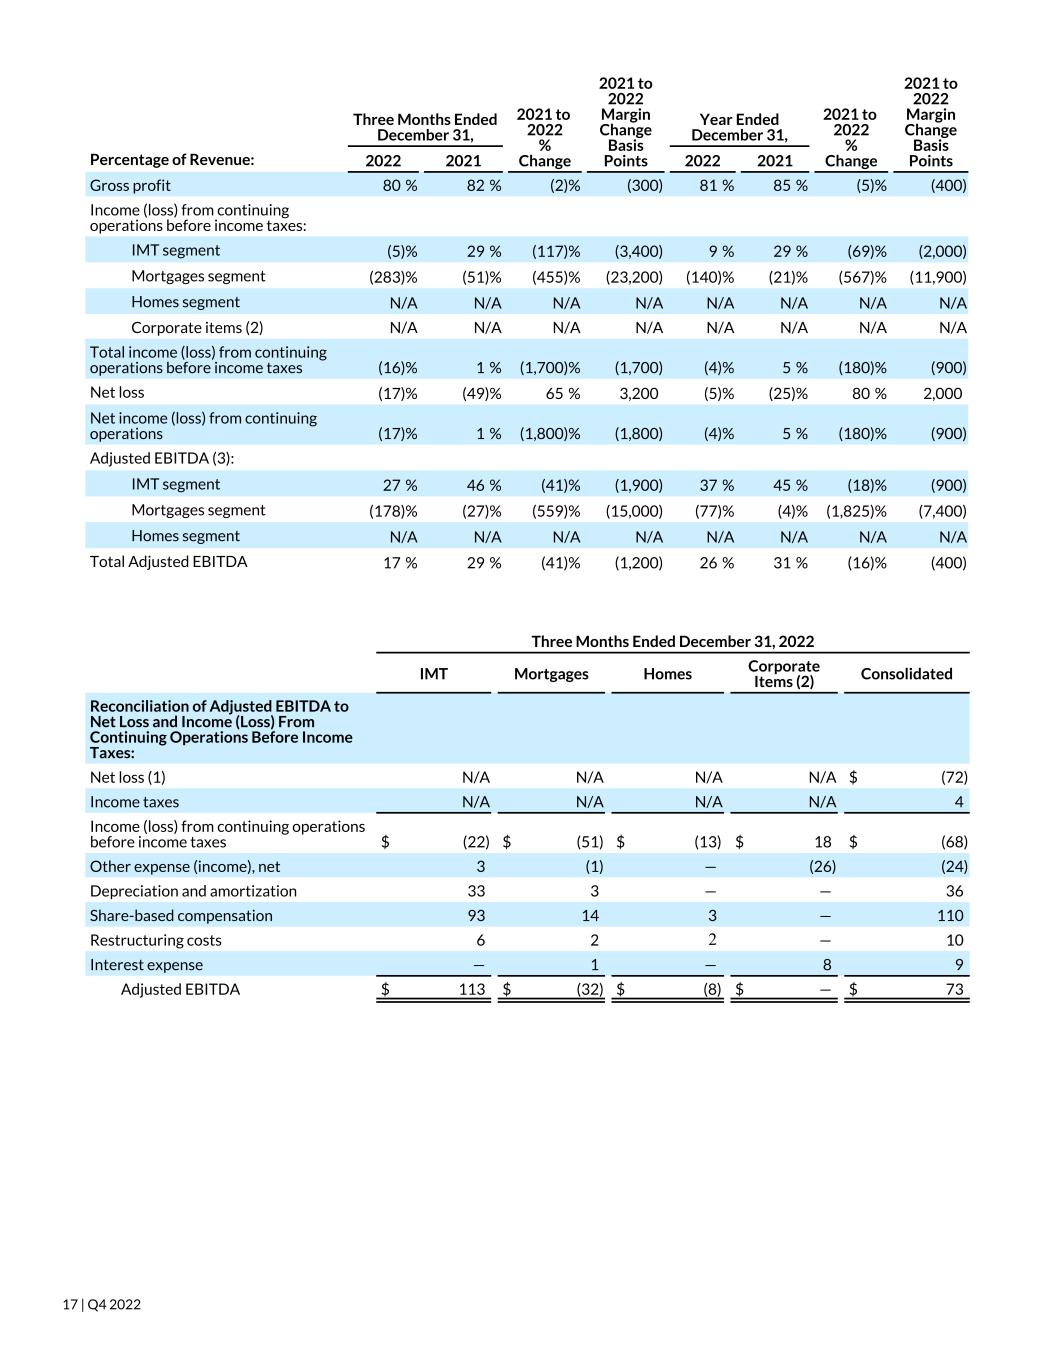
Percentage of Revenue:
Gross profit80 %82 %81 %85 %
Income (loss) from continuing operations before income taxes:
IMT segment
(5)%29 %%29 %
Mortgages segment
(283)%(51)%(140)%(21)%
Homes segment
N/AN/AN/AN/A
Corporate items (2)N/AN/AN/AN/A
Total income (loss) from continuing operations before income taxes(16)%%(4)%%
Net loss(17)%(49)%(5)%(25)%
Net income (loss) from continuing operations(17)%%(4)%%
Adjusted EBITDA (3):
IMT segment
27 %46 %37 %45 %
Mortgages segment
(178)%(27)%(77)%(4)%
Homes segment
N/AN/AN/AN/A
Total Adjusted EBITDA17 %29 %26 %31 %
(1) Other IMT segment revenue includes revenue generated by our new construction marketplace and revenue from the sale of other advertising and business technology solutions for real estate professionals, including display, StreetEasy for-sale product offerings and ShowingTime+, which houses ShowingTime, Bridge Interactive, dotloop and interactive floor plans.
(2) Certain corporate items are not directly attributable to any of our segments, including the loss on extinguishment of debt, interest income earned on our short-term investments included in other income, net and interest costs on our convertible senior notes included in interest expense.
(3) Adjusted EBITDA is a non-GAAP financial measure; it is not calculated or presented in accordance with U.S. generally accepted accounting principles, or GAAP. See below for more information regarding our presentation of Adjusted EBITDA, including a reconciliation of Adjusted EBITDA to the most directly comparable GAAP financial measure, which is net loss on a consolidated basis and income (loss) from continuing operations before income taxes for each segment, for each of the periods presented. Adjusted EBITDA on a consolidated basis and for each segment excludes the impact of discontinued operations.


Conference Call and Webcast Information
The company will host a live conference call to discuss the results today at 2 p.m. Pacific Time (5 p.m. Eastern Time). A shareholder letter and link to both the live webcast and recorded replay of the call may be accessed in the Quarterly Results section of Zillow Group’s investor relations website. Participants must register for the live call in advance at: https://www.netroadshow.com/events/login?show=b351961a&confId=45366 to receive emailed instructions. This pre-registration process is designed to reduce delays due to operator congestion when accessing the live call.
Forward-Looking Statements

This press release contains forward-looking statements within the meaning of Section 27A of the Securities Act of 1933 and Section 21E of the Securities Exchange Act of 1934 that involve risks and uncertainties, including, without limitation, statements regarding the future performance and operation of our business, the current and future health and stability of the residential housing market and economy, volatility of mortgage interest rates, and our expectations regarding future shifts in behavior by consumers and employees. Statements containing words such as “may,” “believe,” “anticipate,” “expect,” “intend,” “plan,” “project,” “predict,” “will,” “projections,” “continue,” “estimate,” “outlook,” “guidance,” “would,” “could,” or similar expressions constitute forward-looking statements. Forward-looking statements are made based on assumptions as of Feb. 15, 2023, and although we believe the expectations reflected in the forward-looking statements are reasonable, we cannot guarantee these results. Differences in Zillow Group’s actual results from those described in these forward-looking statements may result from actions taken by Zillow Group as well as from risks and uncertainties beyond Zillow Group’s control.
Factors that may contribute to such differences include, but are not limited to, the current and future health and stability of the economy, financial conditions and residential housing market, including any extended downturn or slowdown; changes in general economic and financial conditions (including federal monetary policy, interest rates, inflation, home price fluctuations, housing inventory, labor shortages and supply chain issues) that may reduce demand for our products and services, lower our profitability or reduce our access to financing; investment of resources to pursue strategies and develop new products and services that may not prove effective or that are not attractive to customers and real estate partners or that do not allow us to compete successfully; ability to comply with multiple listing service rules and requirements to access and use listing data, and to maintain or establish relationships with listings and data providers; ability to obtain or maintain licenses and permits to support our current and future businesses; ability to operate and grow our mortgage origination business, including the ability to obtain sufficient financing and resell originated mortgages on the secondary market; the duration and impact of natural disasters and other catastrophic events (including public health crises) on our ability to operate, on demand for our products or services, or on general economic conditions; acquisitions, strategic partnerships, joint ventures, capital-raising activities or other corporate transactions or commitments by us or our competitors; ability to manage advertising inventory and pricing; effectivity of our technology and information security systems, or those of third parties on which we rely; actual or anticipated fluctuations in our financial condition and results of operations; changes in projected operational and financial results; ability to protect the information and privacy of our customers and other third parties; ability to attract and retain qualified employees and key personnel; ability to protect our brand and intellectual property; changes in laws or government regulation affecting our business; and the impact of pending or future litigation or regulatory actions.
The foregoing list of risks and uncertainties is illustrative but not exhaustive. For more information about potential factors that could affect Zillow Group’s business and financial results, please review the “Risk Factors” described in Zillow Group’s Annual Report on Form 10-K for the fiscal year ended December 31, 2022, filed with the SEC, and in Zillow Group’s other filings with the SEC. Except as may be required by law, Zillow Group does not intend and undertakes no duty to update this information to reflect future events or circumstances.
About Zillow Group, Inc.
Zillow Group, Inc. (NASDAQ: Z and ZG) is reimagining real estate to make it easier to unlock life’s next chapter. As the most visited real estate website in the United States, Zillow® and its affiliates offer customers an on-demand experience for selling, buying, renting or financing with transparency and ease.
Zillow Group’s affiliates and subsidiaries include Zillow®; Zillow Premier Agent®; Zillow Home Loans™; Zillow Closing Services™; Trulia®; Out East®; StreetEasy®; HotPads®; and ShowingTime+SM, which houses ShowingTime®, Bridge Interactive®, dotloop®, and interactive floor plans. Zillow Home Loans, LLC is an Equal Housing Lender, NMLS #10287 (www.nmlsconsumeraccess.org).
Please visit https://investors.zillowgroup.com, www.zillowgroup.com/news, and www.twitter.com/zillowgroup, where Zillow Group discloses information about the company, its financial information and its business that may be deemed material.


The Zillow Group logo is available at https://zillowgroup.mediaroom.com/logos-photos.
(ZFIN)
Use of Non-GAAP Financial Measures
To provide investors with additional information regarding our financial results, this press release includes references to Adjusted EBITDA in total and for each segment, each a non-GAAP financial measure. We have provided a reconciliation below of Adjusted EBITDA in total to net loss and Adjusted EBITDA by segment to income (loss) from continuing operations before income taxes for each segment, the most directly comparable U.S. generally accepted accounting principles (“GAAP”) financial measures.
Adjusted EBITDA is a key metric used by our management and board of directors to measure operating performance and trends and to prepare and approve our annual budget. In particular, the exclusion of certain expenses in calculating Adjusted EBITDA facilitates operating performance comparisons on a period-to-period basis.
Our use of Adjusted EBITDA in total and for each segment has limitations as an analytical tool, and you should not consider these measures in isolation or as a substitute for analysis of our results as reported under GAAP. Some of these limitations are:
Adjusted EBITDA does not reflect changes in, or cash requirements for, our working capital needs;
Adjusted EBITDA does not reflect the results of discontinued operations;
Adjusted EBITDA does not consider the potentially dilutive impact of share-based compensation;
Although depreciation and amortization are non-cash charges, the assets being depreciated and amortized may have to be replaced in the future, and Adjusted EBITDA does not reflect cash capital expenditure requirements for such replacements or for new capital expenditures or contractual commitments;
Adjusted EBITDA does not reflect restructuring costs;
Adjusted EBITDA does not reflect acquisition-related costs;
Adjusted EBITDA does not reflect loss on extinguishment of debt;
Adjusted EBITDA does not reflect interest expense or other income (expense), net;
Adjusted EBITDA does not reflect income taxes; and
Other companies, including companies in our own industry, may calculate Adjusted EBITDA differently from the way we do, limiting its usefulness as a comparative measure.
Because of these limitations, you should consider Adjusted EBITDA in total and for each segment alongside other financial performance measures, including various cash flow metrics, net loss, income (loss) from continuing operations before income taxes for each segment, and our other GAAP results.


Adjusted EBITDA
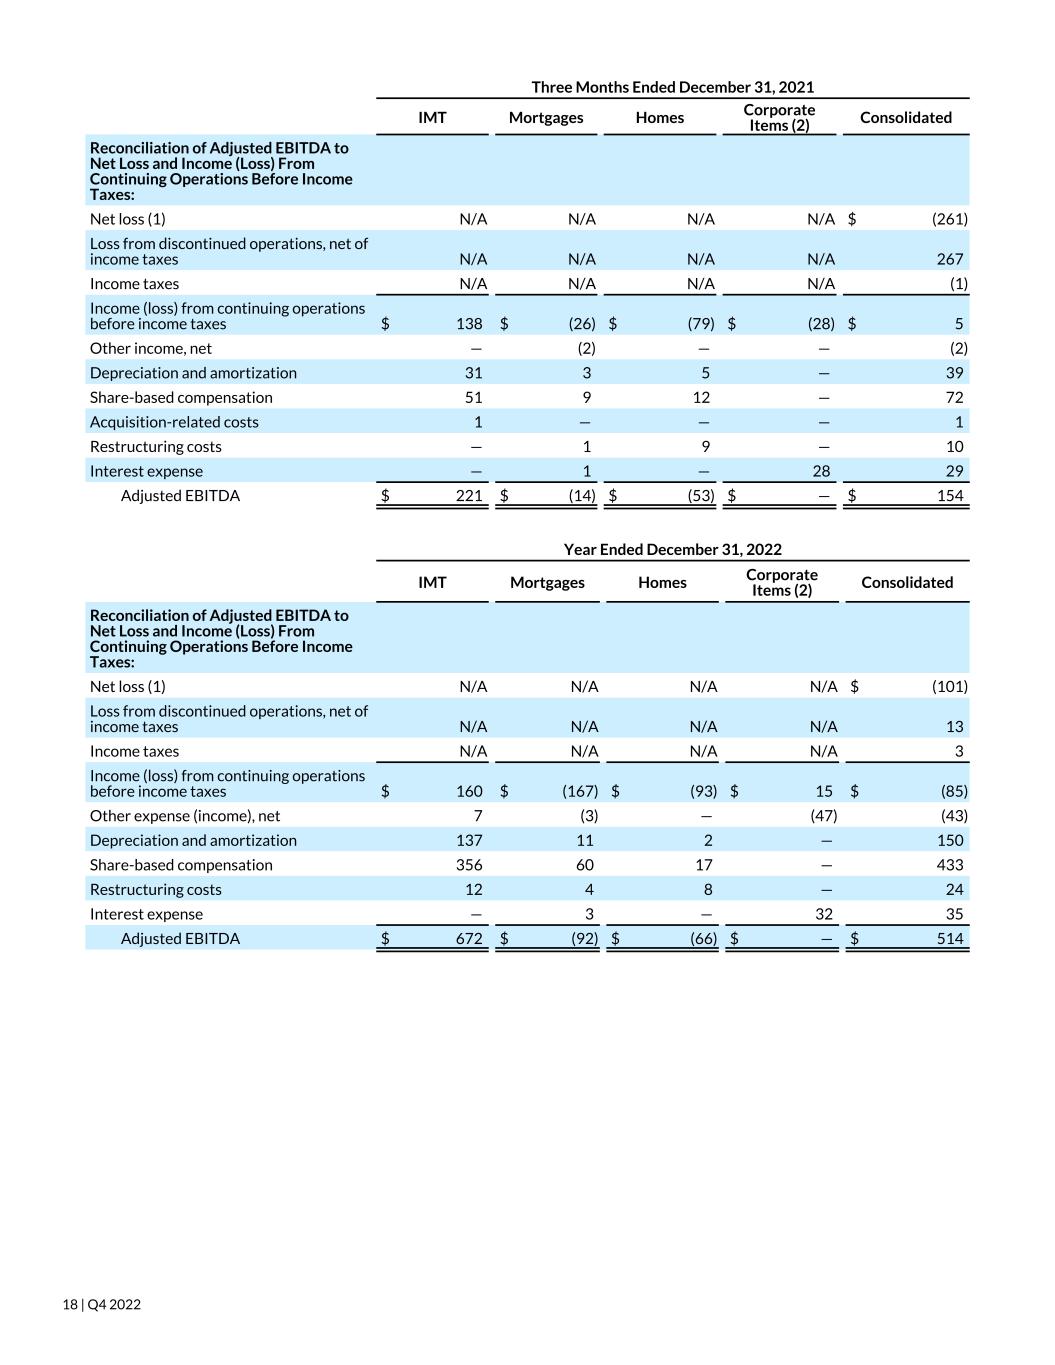
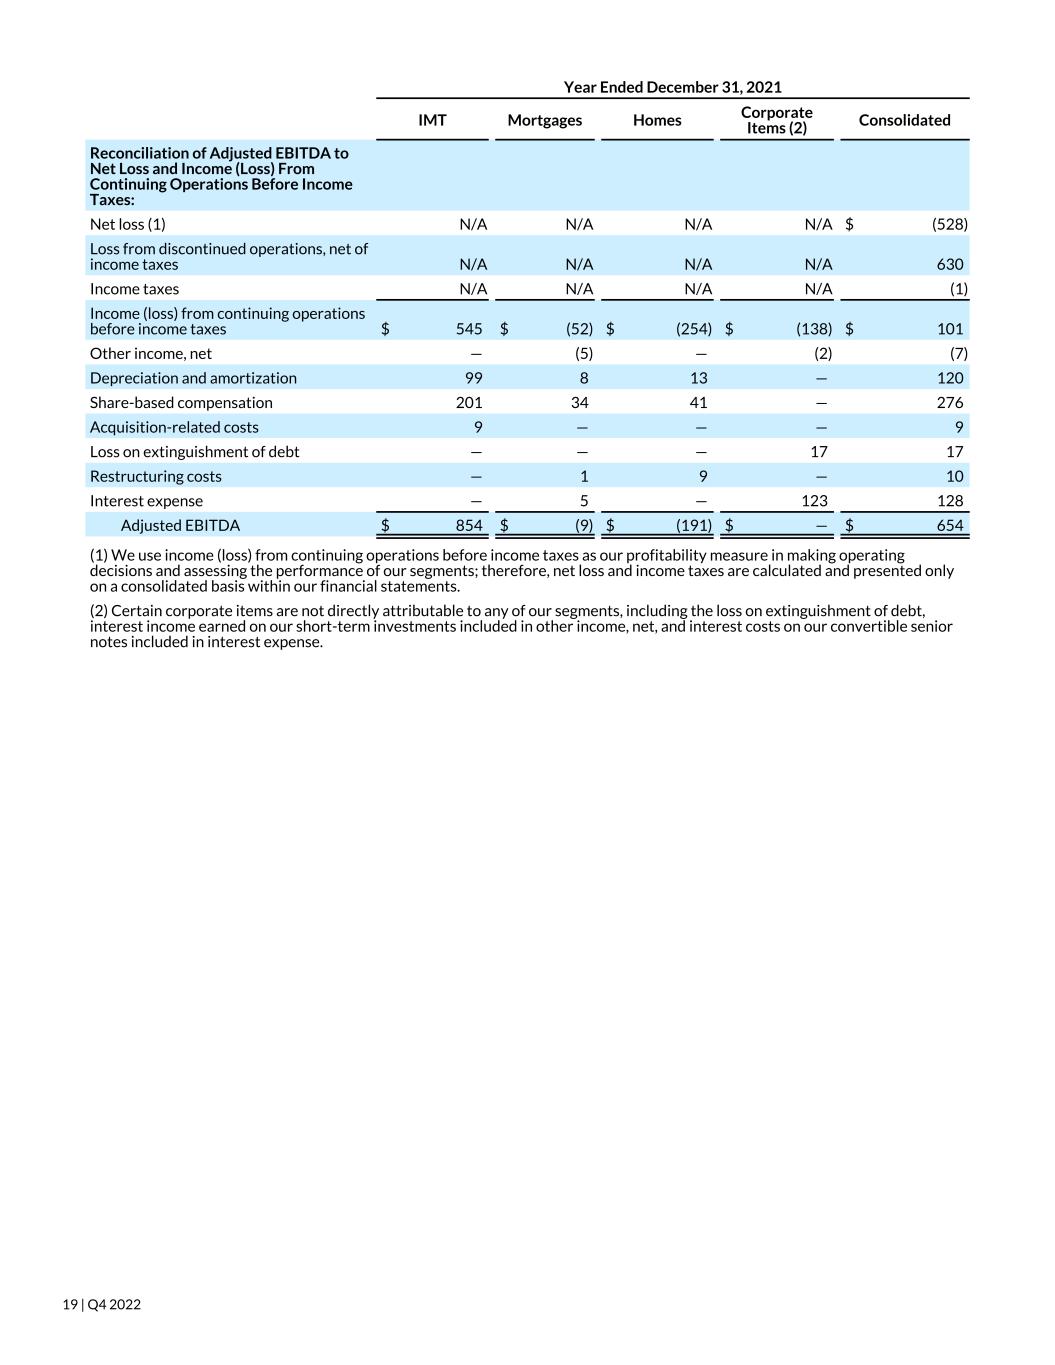
The following tables present a reconciliation of Adjusted EBITDA to the most directly comparable GAAP financial measure, which is net loss on a consolidated basis and income (loss) from continuing operations before income taxes for each segment, for each of the periods presented (in millions, unaudited):
 Three Months Ended December 31, 2022
IMTMortgagesHomesCorporate Items (2)Consolidated
Reconciliation of Adjusted EBITDA to Net Loss and Income (Loss) From Continuing Operations Before Income Taxes:
Net loss (1)N/AN/AN/AN/A$(72)
Income taxesN/AN/AN/AN/A
Income (loss) from continuing operations before income taxes$(22)$(51)$(13)$18 $(68)
Other expense (income), net(1)— (26)(24)
Depreciation and amortization 33 — — 36 
Share-based compensation 93 14 — 110 
Restructuring costs— 10 
Interest expense— — 
Adjusted EBITDA$113 $(32)$(8)$— $73 
 Three Months Ended December 31, 2021
IMTMortgagesHomesCorporate Items (2)Consolidated
Reconciliation of Adjusted EBITDA to Net Loss and Income (Loss) From Continuing Operations Before Income Taxes:
Net loss (1)N/AN/AN/AN/A$(261)
Loss from discontinued operations, net of income taxesN/AN/AN/AN/A267 
Income taxesN/AN/AN/AN/A(1)
Income (loss) from continuing operations before income taxes$138 $(26)$(79)$(28)$
Other income, net— (2)— — (2)
Depreciation and amortization31 — 39 
Share-based compensation51 12 — 72 
Acquisition-related costs— — — 
Restructuring costs— — 10 
Interest expense— — 28 29 
Adjusted EBITDA$221 $(14)$(53)$— $154 


 Year Ended December 31, 2022
IMTMortgagesHomesCorporate Items (2)Consolidated
Reconciliation of Adjusted EBITDA to Net Loss and Income (Loss) From Continuing Operations Before Income Taxes:
Net loss (1)N/AN/AN/AN/A$(101)
Loss from discontinued operations, net of income taxesN/AN/AN/AN/A13 
Income taxesN/AN/AN/AN/A
Income (loss) from continuing operations before income taxes$160 $(167)$(93)$15 $(85)
Other expense (income), net(3)— (47)(43)
Depreciation and amortization 137 11 — 150
Share-based compensation 356 60 17 — 433
Restructuring costs12 — 24
Interest expense— 3— 3235
Adjusted EBITDA$672 $(92)$(66)$— $514 
 Year Ended December 31, 2021
IMTMortgagesHomesCorporate Items (2)Consolidated
Reconciliation of Adjusted EBITDA to Net Loss and Income (Loss) From Continuing Operations Before Income Taxes:
Net loss (1)N/AN/AN/AN/A$(528)
Loss from discontinued operations, net of income taxesN/AN/AN/AN/A630 
Income taxesN/AN/AN/AN/A(1)
Income (loss) from continuing operations before income taxes$545 $(52)$(254)$(138)$101 
Other income, net— (5)— (2)(7)
Depreciation and amortization 99 13 — 120 
Share-based compensation 201 34 41 — 276 
Acquisition-related costs— — — 
Loss on extinguishment of debt— — — 17 17 
Restructuring costs— — 10 
Interest expense— — 123 128 
Adjusted EBITDA$854 $(9)$(191)$— $654 
(1) We use income (loss) from continuing operations before income taxes as our profitability measure in making operating decisions and assessing the performance of our segments; therefore, net loss and income taxes are calculated and presented only on a consolidated basis within our financial statements.
(2) Certain corporate items are not directly attributable to any of our segments, including the loss on extinguishment of debt, interest income earned on our short-term investments included in other income, net, and interest costs on our convertible senior notes included in interest expense.


Exhibit 99.2


Reported Consolidated Results

ZILLOW GROUP, INC.
UNAUDITED CONDENSED CONSOLIDATED BALANCE SHEETS
(in millions)
December 31,
20222021
Assets
Current assets:
Cash and cash equivalents$1,466 $2,315 
Short-term investments1,896 514 
Accounts receivable, net
72 77 
Mortgage loans held for sale41 107 
Prepaid expenses and other current assets126 140 
Restricted cash
Current assets of discontinued operations— 4,526 
Total current assets3,603 7,680 
Contract cost assets23 35 
Property and equipment, net271 215 
Right of use assets126 130 
Goodwill2,374 2,374 
Intangible assets, net154 176 
Other assets12 
Noncurrent assets of discontinued operations— 82 
Total assets$6,563 $10,695 
Liabilities and shareholders’ equity
Current liabilities:
Accounts payable$20 $11 
Accrued expenses and other current liabilities90 89 
Accrued compensation and benefits48 61 
Borrowings under credit facilities37 113 
Deferred revenue44 51 
Lease liabilities, current portion31 24 
Current liabilities of discontinued operations— 3,533 
Total current liabilities270 3,882 
Lease liabilities, net of current portion139 148 
Convertible senior notes1,660 1,319 
Other long-term liabilities12 
Total liabilities2,081 5,354 
Shareholders’ equity:
Class A common stock
— — 
Class B common stock
— — 
Class C capital stock
— — 
Additional paid-in capital6,109 7,001 
Accumulated other comprehensive income (loss) (15)
Accumulated deficit(1,612)(1,667)
Total shareholders’ equity4,482 5,341 
Total liabilities and shareholders’ equity$6,563 $10,695 


ZILLOW GROUP, INC.
UNAUDITED CONDENSED CONSOLIDATED STATEMENTS OF OPERATIONS
(in millions, except share data, which are presented in thousands, and per share data)
 Three Months Ended
December 31,
Year Ended December 31,
 2022202120222021
Revenue$435 $535 $1,958 $2,132 
Cost of revenue (1)89 95 367 323 
Gross profit346 440 1,591 1,809 
Operating expenses:
Sales and marketing (1)162 183 664 715 
Technology and development (1)129 102 498 421 
General and administrative (1)128 111 498 414 
Restructuring costs (1)10 10 24 10 
Acquisition-related costs— — 
Integration costs— — 
Total operating expenses429 408 1,684 1,570 
Income (loss) from continuing operations(83)32 (93)239 
Loss on extinguishment of debt— — — (17)
Other income, net24 43 
Interest expense(9)(29)(35)(128)
Income (loss) from continuing operations before income taxes(68)(85)101 
Income tax benefit (expense)(4)(3)
Net income (loss) from continuing operations(72)(88)102 
Net loss from discontinued operations, net of income taxes— (267)(13)(630)
Net loss$(72)$(261)$(101)$(528)
Net income (loss) from continuing operations per share
Basic$(0.31)$0.02 $(0.36)$0.41 
Diluted$(0.31)$0.02 $(0.36)$0.39 
Net loss per share:
Basic$(0.31)$(1.03)$(0.42)$(2.11)
Diluted$(0.31)$(1.00)$(0.42)$(2.02)
Weighted-average shares outstanding:
Basic236,246 254,013 242,163 249,937 
Diluted236,246 261,181 242,163 261,826 
(1) Includes share-based compensation expense as follows:
Cost of revenue$$$16 $
Sales and marketing17 11 63 42 
Technology and development42 25 165 103 
General and administrative47 34 189 122 
Restructuring costs— 
Share-based compensation - continuing operations$110 $73 $435 $277 
Other Financial Data:
Income (loss) from continuing operations before income taxes:
IMT segment$(22)$138 $160 $545 
Mortgages segment(51)(26)(167)(52)
Homes segment(13)(79)(93)(254)
Corporate items (2)18 (28)15 (138)
Total income (loss) from continuing operations before income taxes$(68)$$(85)$101 
Adjusted EBITDA (3):
IMT segment$113 $221 $672 $854 
Mortgages segment(32)(14)(92)(9)
Homes segment(8)(53)(66)(191)
Total Adjusted EBITDA$73 $154 $514 $654 
(2) Certain corporate items are not directly attributable to any of our segments, including the loss on extinguishment of debt, interest income earned on our short-term investments included in other income, net and interest costs on our convertible senior notes included in interest expense.
(3) Adjusted EBITDA is a non-GAAP financial measure; it is not calculated or presented in accordance with U.S. generally accepted accounting principles, or GAAP. See Exhibit 99.1 for more information regarding our presentation of Adjusted EBITDA and for a reconciliation of Adjusted EBITDA to net loss on a consolidated basis and income (loss) from continuing operations before income taxes for each segment, the most directly comparable GAAP financial measures, for each of the periods presented. Adjusted EBITDA on a consolidated basis and for each segment excludes the impact of discontinued operations.


ZILLOW GROUP, INC.
UNAUDITED CONDENSED CONSOLIDATED STATEMENTS OF CASH FLOWS
(in millions)
 Year Ended December 31,
 20222021
Operating activities
Net loss$(101)$(528)
Adjustments to reconcile net loss to net cash provided by (used in) operating activities:
Depreciation and amortization157 130 
Share-based compensation451 312 
Amortization of right of use assets23 23 
Amortization of contract cost assets30 42 
Amortization of debt discount and debt issuance costs26 104 
Loss on extinguishment of debt21 17 
Impairment and restructuring costs— 57 
Inventory valuation adjustment408 
Other adjustments to reconcile net loss to net cash provided by (used in) operating activities(3)12 
Changes in operating assets and liabilities:
Accounts receivable82 (82)
Mortgage loans held for sale66 224 
Inventory3,904 (3,827)
Prepaid expenses and other assets(82)
Contract cost assets(18)(26)
Lease liabilities(21)(29)
Accounts payable
Accrued expenses and other current liabilities(71)61 
Accrued compensation and benefits(60)13 
Deferred revenue(7)
Other long-term liabilities(12)
Net cash provided by (used in) operating activities4,504 (3,177)
Investing activities
Proceeds from maturities of investments802 2,206 
Purchases of investments(2,191)(516)
Purchases of property and equipment(115)(74)
Purchases of intangible assets(25)(31)
Cash paid for acquisitions, net(4)(497)
Net cash provided by (used in) investing activities(1,533)1,088 
Financing activities
Proceeds from issuance of Class C capital stock, net of issuance costs— 545 
Proceeds from issuance of term loan, net of issuance costs— 1,138 
Proceeds from borrowings on credit facilities— 3,618 
Repayments of borrowings on credit facilities(2,206)(1,780)
Net repayments on warehouse line of credit and repurchase agreements(76)(197)
Repurchases of Class A common stock and Class C capital stock(947)(302)
Settlement of long-term debt(1,158)(1)
Proceeds from exercise of stock options46 127 
Net cash provided by (used in) financing activities(4,341)3,148 
Net increase (decrease) in cash, cash equivalents and restricted cash during period(1,370)1,059 
Cash, cash equivalents and restricted cash at beginning of period2,838 1,779 
Cash, cash equivalents and restricted cash at end of period$1,468 $2,838 
Supplemental disclosures of cash flow information
Cash paid for interest$50 $109 
Cash paid for taxes— 
Noncash transactions:
Write-off of fully amortized intangible assets$203 $58 
Write-off of fully depreciated property and equipment53 49 
Capitalized share-based compensation51 30 
Issuance (settlement) of beneficial interests in securitizations(79)63 


Non-GAAP Net Income per Share
Our presentation of non-GAAP net income per share excludes the impact of the results of discontinued operations, share-based compensation, restructuring costs, acquisition-related costs, the loss on extinguishment of debt and income taxes. This measure is not a key metric used by our management and board of directors to measure operating performance or otherwise manage the business. However, we provide non-GAAP net income per share as supplemental information to investors, as we believe the exclusion of the results of discontinued operations, share-based compensation, restructuring costs, acquisition-related costs, the loss on extinguishment of debt and income taxes facilitates investors’ operating performance comparisons on a period-to-period basis. You should not consider non-GAAP net income per share in isolation or as a substitute for analysis of our results as reported under GAAP.

The following table sets forth a reconciliation of non-GAAP net income, adjusted, to net loss, as reported on a GAAP basis, and the calculation of non-GAAP net income per share - basic and diluted, for each of the periods presented (in millions, except share data, which are presented in thousands, and per share data, unaudited):
Three Months Ended
December 31,
Year Ended December 31,
 2022202120222021
Net loss, as reported$(72)$(261)$(101)$(528)
Net loss from discontinued operations, net of income taxes— 267 13 630 
Share-based compensation110 72 433 276 
Restructuring costs10 10 24 10 
Acquisition-related costs— — 
Loss on extinguishment of debt — — — 17 
Income tax expense (benefit)(1)(1)
Net income, adjusted$52 $88 $372 $413 
Non-GAAP net income per share:
Basic$0.22 $0.35 $1.54 $1.65 
Diluted$0.21 $0.34 $1.43 $1.58 
Weighted-average shares outstanding:
Basic236,246 254,013 242,163 249,937 
Diluted262,391 261,181 269,106 261,826 
Diluted non-GAAP net income per share - for the periods presented is calculated using diluted weighted-average shares outstanding, which includes potential shares of Class A common stock and Class C capital stock for the periods in which their effect would have been dilutive. The potential shares of Class A common stock and Class C capital stock were excluded from the calculation of non-GAAP net income per share for certain periods presented if their effect would have been antidilutive. The following table reconciles the denominators used in the basic and diluted non-GAAP net income per share calculations (in thousands, unaudited):
Three Months Ended
December 31,
Year Ended December 31,
 2022202120222021
Denominator for basic calculation236,246 254,013 242,163 249,937 
Effect of dilutive securities:
     Option awards457 5,515 1,118 9,304 
     Unvested restricted stock units242 1,653 379 2,585 
Convertible senior notes due in 2024 and 202625,446 — 25,446 — 
          Denominator for dilutive calculation262,391 261,181 269,106 261,826 


Segment Results of Operations
The following tables present our segment results for the periods presented (in millions, unaudited):
 Three Months Ended December 31, 2022Three Months Ended December 31, 2021
IMTMortgagesHomesIMTMortgagesHomes
Revenue:
Premier Agent$283 $— $— $354 $— $— 
Rentals68 — — 60 — — 
Other66 — — 70 — — 
Mortgages— 18 — — 51 — 
Total revenue417 18 — 484 51 — 
Cost of revenue72 14 62 22 11 
Gross profit (loss)345 (3)422 29 (11)
Operating expenses:
Sales and marketing142 18 139 28 16 
Technology and development115 13 74 20 
General and administrative101 22 69 19 23 
Restructuring costs— 
Acquisition-related costs— — — — — 
Integration costs— — — — — 
Total operating expenses364 55 10 284 56 68 
Income (loss) from continuing operations(19)(51)(13)138 (27)(79)
Segment other income (expense), net(3)— — — 
Segment interest expense — (1)— — (1)— 
Income (loss) from continuing operations before income taxes (1)$(22)$(51)$(13)$138 $(26)$(79)


 Year Ended December 31, 2022Year Ended December 31, 2021
IMTMortgagesHomesIMTMortgagesHomes
Revenue:
Premier Agent$1,291 $— $— $1,396 $— $— 
Rentals274 — — 264 — — 
Other274 — — 226 — — 
Mortgages— 119 — — 246 — 
Total revenue1,839 119 — 1,886 246 — 
Cost of revenue275 68 24 203 84 36 
Gross profit (loss)1,564 51 (24)1,683 162 (36)
Operating expenses:
Sales and marketing572 79 13 552 109 54 
Technology and development438 50 10 318 32 71 
General and administrative375 85 38 258 72 84 
Restructuring costs12 — 
Acquisition-related costs— — — — — 
Integration costs— — — — — 
Total operating expenses1,397 218 69 1,138 214 218 
Income (loss) from continuing operations167 (167)(93)545 (52)(254)
Segment other income (expense), net(7)— — — 
Segment interest expense — (3)— — (5)— 
Income (loss) from continuing operations before income taxes (1)$160 $(167)$(93)$545 $(52)$(254)
(1) The following table presents the reconciliation of total segment income (loss) from continuing operations before income taxes to consolidated income (loss) from continuing operations before income taxes for the periods presented (in millions, unaudited):
Three Months Ended
December 31,
Year Ended December 31,
2022202120222021
Total segment income (loss) from continuing operations before income taxes$(86)$33 $(100)$239 
Corporate interest expense(8)(28)(32)(123)
Corporate other income26 — 47 
Loss on extinguishment of debt— — — (17)
Consolidated income (loss) from continuing operations before income taxes$(68)$$(85)$101 
Certain corporate items are not directly attributable to any of our segments, including the loss on extinguishment of debt, interest income earned on our short-term investments included in other income, net and interest costs on our convertible senior notes included in interest expense.


Key Metrics
The following table presents our visits and average monthly unique users for each of the periods presented (in millions, except percentages):
 Three Months Ended
December 31,
2021 to 2022
% Change
 20222021
  
Visits (1)2,179 2,284 (5)%
Average monthly unique users (2)198 198 — %
(1)Visits includes visits to the Zillow, Trulia and StreetEasy mobile apps and websites. We measure Zillow and StreetEasy visits with Google Analytics and Trulia visits with Adobe Analytics.
(2)Zillow, StreetEasy and HotPads measure unique users with Google Analytics, and Trulia measures unique users with Adobe Analytics.

The following table presents loan origination volume by purpose and in total for Zillow Home Loans for the periods presented (in millions, except percentages):
Three Months Ended
December 31,
2021 to 2022
% Change
20222021
Purchase loan origination volume$237 $331 (28)%
Refinance loan origination volume559 (99)%
Total loan origination volume$242 $890 (73)%

Selected Historical Data

Beginning in the first quarter of 2023, we plan to report our financial results as a single reportable segment and will report revenue categories of Residential, Rentals, Mortgages and Other. The following tables set forth historical revenue from continuing operations by these revenue categories for each of the periods presented (in millions, unaudited):


Three Months EndedYear Ended December 31, 2022
 March 31, 2022June 30, 2022September 30, 2022December 31, 2022
Residential$418 $392 $372 $340 $1,522 
Rentals61 71 74 68 274 
Mortgages46 29 26 18 119 
Other111211943
Total revenue$536 $504 $483 $435 $1,958 
 Three Months EndedYear Ended December 31, 2021
 March 31, 2021June 30, 2021September 30, 2021December 31, 2021
Residential$373 $390 $398 $411 $1,572 
Rentals64 73 67 60 264 
Mortgages68 57 70 51 246 
Other913151350
Total revenue$514 $533 $550 $535 $2,132 


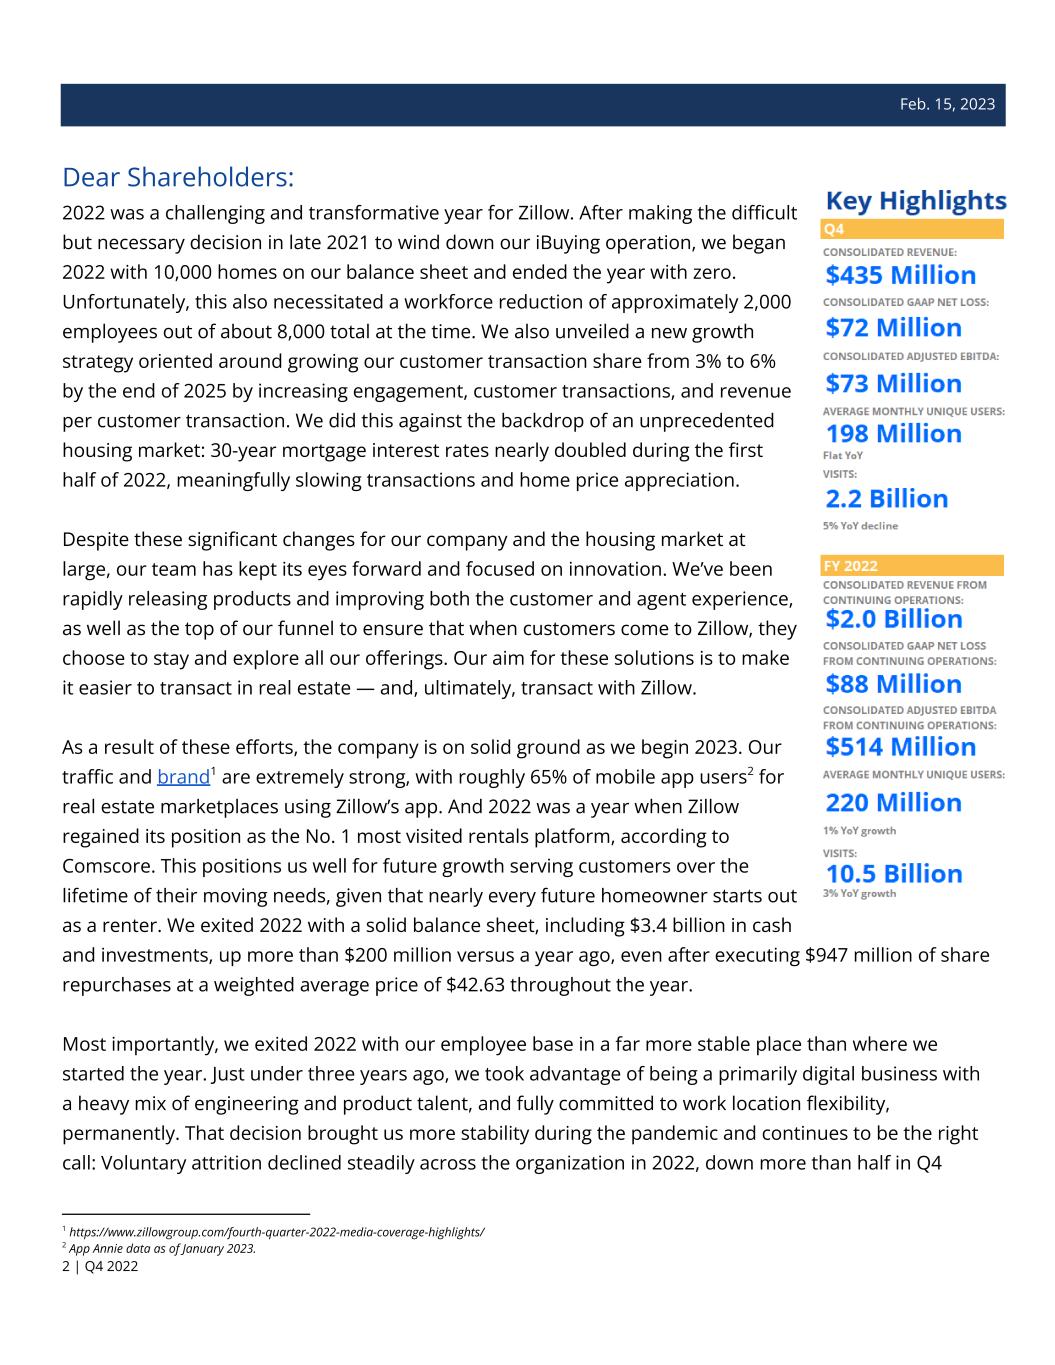
Feb. 15, 2023 Dear Shareholders: 2022 was a challenging and transformative year for Zillow. After making the difficult but necessary decision in late 2021 to wind down our iBuying operation, we began 2022 with 10,000 homes on our balance sheet and ended the year with zero. Unfortunately, this also necessitated a workforce reduction of approximately 2,000 employees out of about 8,000 total at the time. We also unveiled a new growth strategy oriented around growing our customer transaction share from 3% to 6% by the end of 2025 by increasing engagement, customer transactions, and revenue per customer transaction. We did this against the backdrop of an unprecedented housing market: 30-year mortgage interest rates nearly doubled during the first half of 2022, meaningfully slowing transactions and home price appreciation. Despite these significant changes for our company and the housing market at large, our team has kept its eyes forward and focused on innovation. We’ve been rapidly releasing products and improving both the customer and agent experience, as well as the top of our funnel to ensure that when customers come to Zillow, they choose to stay and explore all our offerings. Our aim for these solutions is to make it easier to transact in real estate — and, ultimately, transact with Zillow. As a result of these efforts, the company is on solid ground as we begin 2023. Our traffic and brand1 are extremely strong, with roughly 65% of mobile app users2 for real estate marketplaces using Zillow’s app. And 2022 was a year when Zillow regained its position as the No. 1 most visited rentals platform, according to Comscore. This positions us well for future growth serving customers over the lifetime of their moving needs, given that nearly every future homeowner starts out as a renter. We exited 2022 with a solid balance sheet, including $3.4 billion in cash and investments, up more than $200 million versus a year ago, even after executing $947 million of share repurchases at a weighted average price of $42.63 throughout the year. Most importantly, we exited 2022 with our employee base in a far more stable place than where we started the year. Just under three years ago, we took advantage of being a primarily digital business with a heavy mix of engineering and product talent, and fully committed to work location flexibility, permanently. That decision brought us more stability during the pandemic and continues to be the right call: Voluntary attrition declined steadily across the organization in 2022, down more than half in Q4 2 App Annie data as of January 2023. 1 https://www.zillowgroup.com/fourth-quarter-2022-media-coverage-highlights/ 2 | Q4 2022


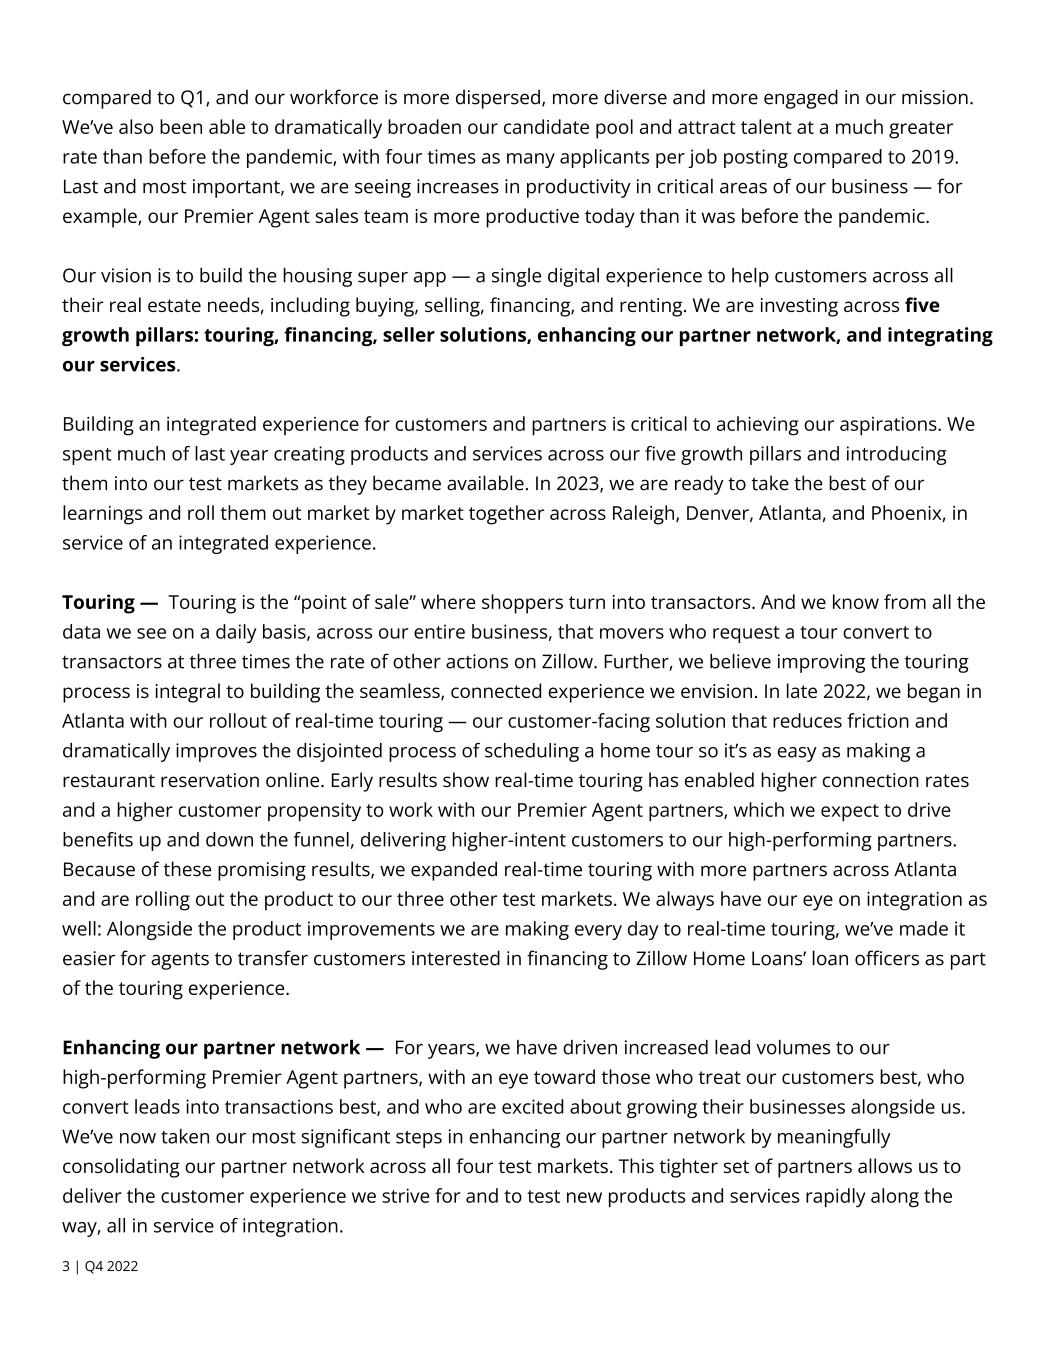
compared to Q1, and our workforce is more dispersed, more diverse and more engaged in our mission. We’ve also been able to dramatically broaden our candidate pool and attract talent at a much greater rate than before the pandemic, with four times as many applicants per job posting compared to 2019. Last and most important, we are seeing increases in productivity in critical areas of our business — for example, our Premier Agent sales team is more productive today than it was before the pandemic. Our vision is to build the housing super app — a single digital experience to help customers across all their real estate needs, including buying, selling, financing, and renting. We are investing across five growth pillars: touring, financing, seller solutions, enhancing our partner network, and integrating our services. Building an integrated experience for customers and partners is critical to achieving our aspirations. We spent much of last year creating products and services across our five growth pillars and introducing them into our test markets as they became available. In 2023, we are ready to take the best of our learnings and roll them out market by market together across Raleigh, Denver, Atlanta, and Phoenix, in service of an integrated experience. Touring — Touring is the “point of sale” where shoppers turn into transactors. And we know from all the data we see on a daily basis, across our entire business, that movers who request a tour convert to transactors at three times the rate of other actions on Zillow. Further, we believe improving the touring process is integral to building the seamless, connected experience we envision. In late 2022, we began in Atlanta with our rollout of real-time touring — our customer-facing solution that reduces friction and dramatically improves the disjointed process of scheduling a home tour so it’s as easy as making a restaurant reservation online. Early results show real-time touring has enabled higher connection rates and a higher customer propensity to work with our Premier Agent partners, which we expect to drive benefits up and down the funnel, delivering higher-intent customers to our high-performing partners. Because of these promising results, we expanded real-time touring with more partners across Atlanta and are rolling out the product to our three other test markets. We always have our eye on integration as well: Alongside the product improvements we are making every day to real-time touring, we’ve made it easier for agents to transfer customers interested in financing to Zillow Home Loans’ loan officers as part of the touring experience. Enhancing our partner network — For years, we have driven increased lead volumes to our high-performing Premier Agent partners, with an eye toward those who treat our customers best, who convert leads into transactions best, and who are excited about growing their businesses alongside us. We’ve now taken our most significant steps in enhancing our partner network by meaningfully consolidating our partner network across all four test markets. This tighter set of partners allows us to deliver the customer experience we strive for and to test new products and services rapidly along the way, all in service of integration. 3 | Q4 2022


One early success has come in our Raleigh test market. Last quarter, we were seeing roughly 15% customer adoption of Zillow Home Loans in Raleigh, and now, just three months later, we are seeing closer to 20% customer adoption. Based on our early successes in Raleigh, we have expanded our Zillow Home Loans adoption playbook to the rest of our test markets. Financing — We believe financing is crucial to the buyer's experience, and merging financing at strategic points in the buyer's journey is critical to the end-to-end experience we envision. In 2022, we turned our efforts toward building the foundation for a substantial direct-to-consumer purchase mortgage origination business. Last quarter, we spoke about the critical workstreams we’ve deployed to bolster our mortgage business. We are focused on building a better mortgage experience for our customers and partners by simplifying the entry points in our funnel; building awareness of Zillow Home Loans (even with relatively low awareness for Zillow Home Loans, millions of customers on Zillow raised their hand for financing help last year); bolstering loan officers’ capabilities so they can effectively handle our volume; and working with our Premier Agent partner base to build integrated processes with Zillow Home Loans. As a reminder, we are building two primary ways for customers to connect with Zillow Home Loans. The first way is “financing first.” It is when a customer starts their moving journey with financing and gets pre-qualified before they are connected with an agent. We know approximately 40% of all homebuyers start their journey this way, and roughly 80% of our prospective mortgage customers don’t yet have a real estate agent3. For so many customers, financing is opaque and intimidating, and we are helping to make it easier and more transparent on Zillow. We also know how valuable it is for our Premier Agent partners to be connected with a customer who already knows what they can afford to buy. We are beginning to test connecting pre-qualified customers with agents in multiple markets today, including all four test markets. The second way is “property first.” This is when a Zillow Home Loans lead comes back to us from a Premier Agent partner who is working with a buyer we sent them. Beyond the integration point with real-time touring, we’ve integrated Zillow Home Loans into all existing connection processes across all four test markets. Encouragingly, we are already seeing nearly one in five Premier Agent partners sending connections to Zillow Home Loans in those markets, and some agents outside of these markets are also proactively choosing to connect customers with us. From our perspective, the inherent value in integrated services has made our Premier Agent partners supportive of these efforts, and we are pleased with the early results. 3 Zillow Group internal data and estimates. 4 | Q4 2022


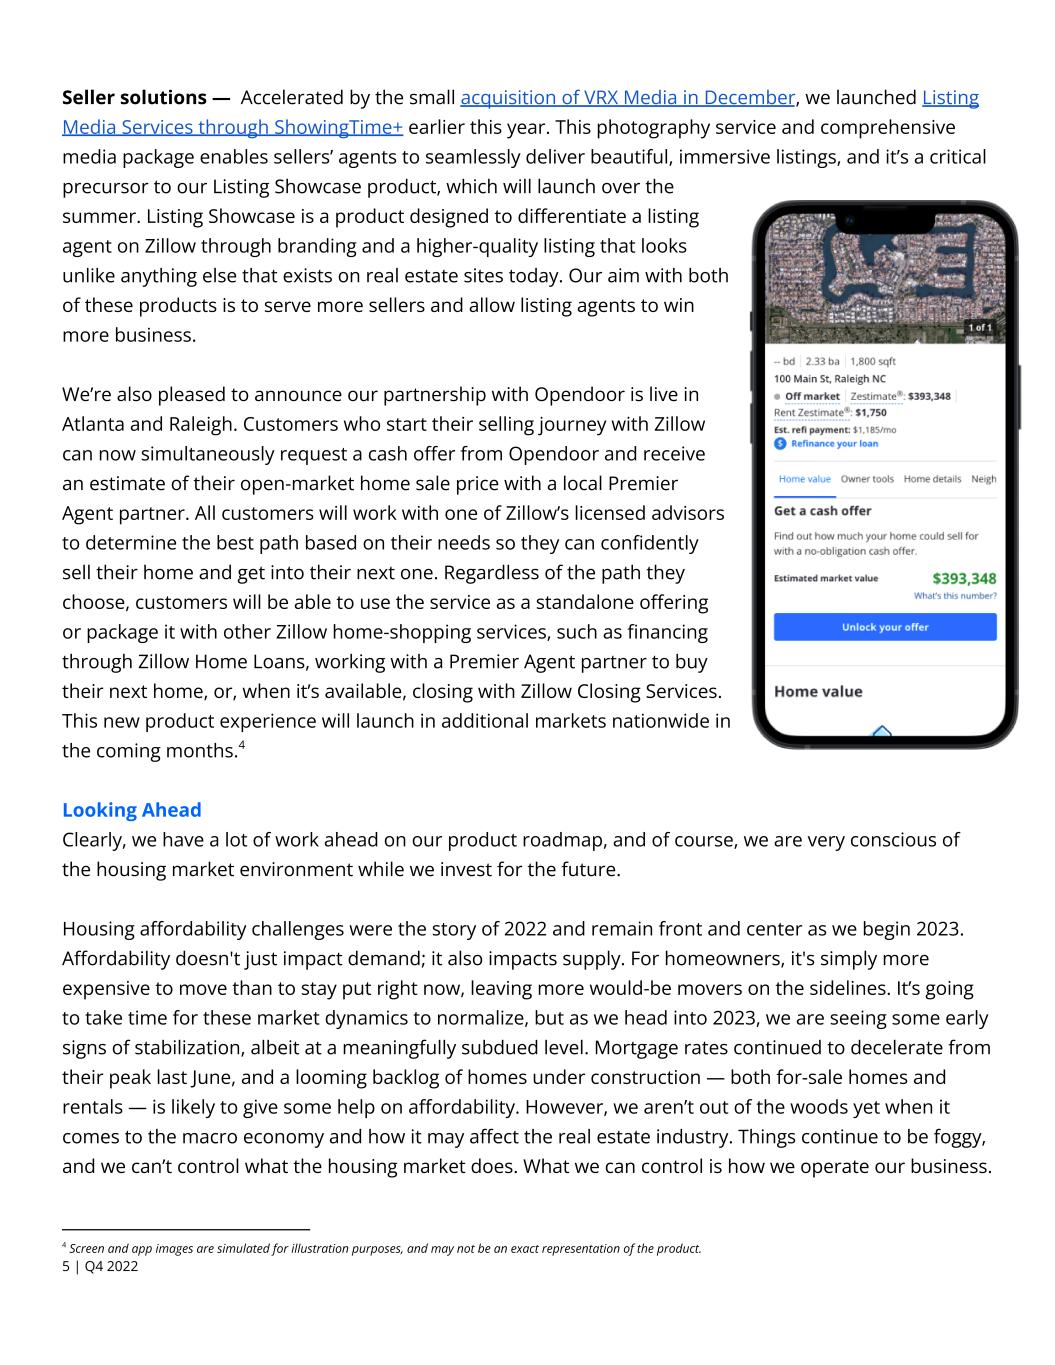
Seller solutions — Accelerated by the small acquisition of VRX Media in December, we launched Listing Media Services through ShowingTime+ earlier this year. This photography service and comprehensive media package enables sellers’ agents to seamlessly deliver beautiful, immersive listings, and it’s a critical precursor to our Listing Showcase product, which will launch over the summer. Listing Showcase is a product designed to differentiate a listing agent on Zillow through branding and a higher-quality listing that looks unlike anything else that exists on real estate sites today. Our aim with both of these products is to serve more sellers and allow listing agents to win more business. We’re also pleased to announce our partnership with Opendoor is live in Atlanta and Raleigh. Customers who start their selling journey with Zillow can now simultaneously request a cash offer from Opendoor and receive an estimate of their open-market home sale price with a local Premier Agent partner. All customers will work with one of Zillow’s licensed advisors to determine the best path based on their needs so they can confidently sell their home and get into their next one. Regardless of the path they choose, customers will be able to use the service as a standalone offering or package it with other Zillow home-shopping services, such as financing through Zillow Home Loans, working with a Premier Agent partner to buy their next home, or, when it’s available, closing with Zillow Closing Services. This new product experience will launch in additional markets nationwide in the coming months.4 Looking Ahead Clearly, we have a lot of work ahead on our product roadmap, and of course, we are very conscious of the housing market environment while we invest for the future. Housing affordability challenges were the story of 2022 and remain front and center as we begin 2023. Affordability doesn't just impact demand; it also impacts supply. For homeowners, it's simply more expensive to move than to stay put right now, leaving more would-be movers on the sidelines. It’s going to take time for these market dynamics to normalize, but as we head into 2023, we are seeing some early signs of stabilization, albeit at a meaningfully subdued level. Mortgage rates continued to decelerate from their peak last June, and a looming backlog of homes under construction — both for-sale homes and rentals — is likely to give some help on affordability. However, we aren’t out of the woods yet when it comes to the macro economy and how it may affect the real estate industry. Things continue to be foggy, and we can’t control what the housing market does. What we can control is how we operate our business. 4 Screen and app images are simulated for illustration purposes, and may not be an exact representation of the product. 5 | Q4 2022


Similar to many times in our history, including 2022, we are closely monitoring the situation and will be prudent in how we invest through this period. From our perspective, it’s clear that this past year we were simultaneously navigating the past and organizing for the future. Now, we are fully eyes-forward. 2023 is a consequential year for us, and it is all about making progress on our initiatives through product launches and market rollouts so we can further expand and scale into 2024. We see the same headlines you all see about tech companies cutting back their workforces to make up for staffing to accommodate unsustainable pandemic-level growth that is now normalizing. Our story is different. After a year of significant people-related and other expense reductions in 2022, we are now investing during a tough housing market while others retrench, as we see real opportunity for growth. We expect 60 million homes will trade hands over the next 10 years, which reflects a much more natural and healthy mover rate. And, given all the product and service innovation opportunities we see, we believe we can capture an increasing and meaningful share of those customer transactions and drive value for our customers, partners, employees, and shareholders. We will continue to share our progress and learnings along the way, and we appreciate your partnership on this journey. Sincerely, Rich Barton, Co-founder & CEO Allen Parker, CFO 6 | Q4 2022


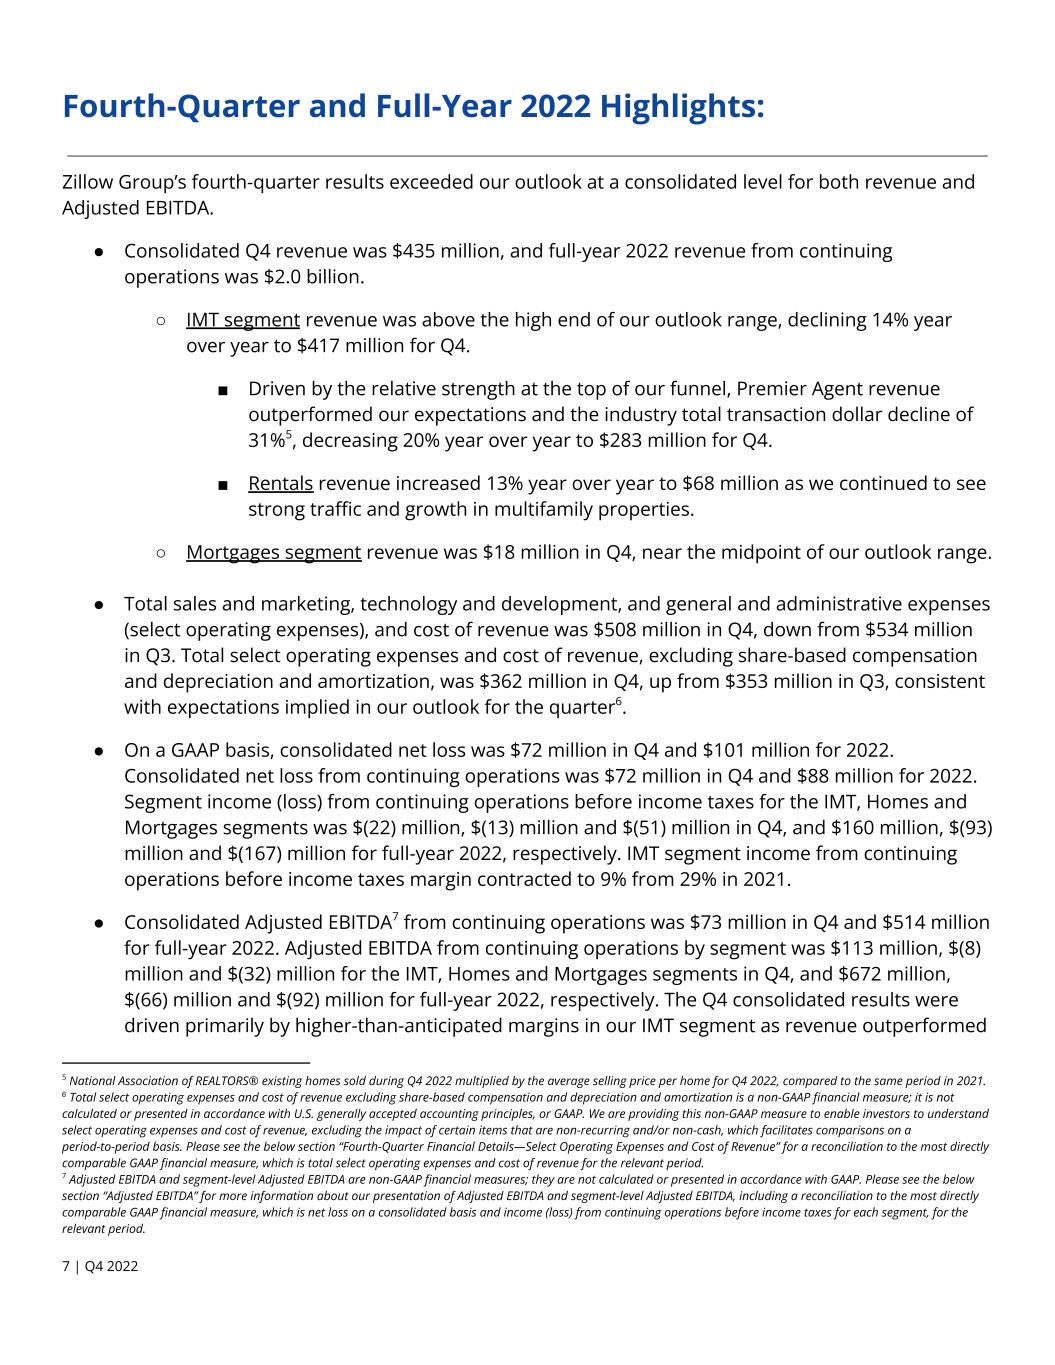
Fourth-Quarter and Full-Year 2022 Highlights: Zillow Group’s fourth-quarter results exceeded our outlook at a consolidated level for both revenue and Adjusted EBITDA. ● Consolidated Q4 revenue was $435 million, and full-year 2022 revenue from continuing operations was $2.0 billion. ○ IMT segment revenue was above the high end of our outlook range, declining 14% year over year to $417 million for Q4. ■ Driven by the relative strength at the top of our funnel, Premier Agent revenue outperformed our expectations and the industry total transaction dollar decline of 31%5, decreasing 20% year over year to $283 million for Q4. ■ Rentals revenue increased 13% year over year to $68 million as we continued to see strong traffic and growth in multifamily properties. ○ Mortgages segment revenue was $18 million in Q4, near the midpoint of our outlook range. ● Total sales and marketing, technology and development, and general and administrative expenses (select operating expenses), and cost of revenue was $508 million in Q4, down from $534 million in Q3. Total select operating expenses and cost of revenue, excluding share-based compensation and depreciation and amortization, was $362 million in Q4, up from $353 million in Q3, consistent with expectations implied in our outlook for the quarter6. ● On a GAAP basis, consolidated net loss was $72 million in Q4 and $101 million for 2022. Consolidated net loss from continuing operations was $72 million in Q4 and $88 million for 2022. Segment income (loss) from continuing operations before income taxes for the IMT, Homes and Mortgages segments was $(22) million, $(13) million and $(51) million in Q4, and $160 million, $(93) million and $(167) million for full-year 2022, respectively. IMT segment income from continuing operations before income taxes margin contracted to 9% from 29% in 2021. ● Consolidated Adjusted EBITDA7 from continuing operations was $73 million in Q4 and $514 million for full-year 2022. Adjusted EBITDA from continuing operations by segment was $113 million, $(8) million and $(32) million for the IMT, Homes and Mortgages segments in Q4, and $672 million, $(66) million and $(92) million for full-year 2022, respectively. The Q4 consolidated results were driven primarily by higher-than-anticipated margins in our IMT segment as revenue outperformed 7 Adjusted EBITDA and segment-level Adjusted EBITDA are non-GAAP financial measures; they are not calculated or presented in accordance with GAAP. Please see the below section “Adjusted EBITDA” for more information about our presentation of Adjusted EBITDA and segment-level Adjusted EBITDA, including a reconciliation to the most directly comparable GAAP financial measure, which is net loss on a consolidated basis and income (loss) from continuing operations before income taxes for each segment, for the relevant period. 6 Total select operating expenses and cost of revenue excluding share-based compensation and depreciation and amortization is a non-GAAP financial measure; it is not calculated or presented in accordance with U.S. generally accepted accounting principles, or GAAP. We are providing this non-GAAP measure to enable investors to understand select operating expenses and cost of revenue, excluding the impact of certain items that are non-recurring and/or non-cash, which facilitates comparisons on a period-to-period basis. Please see the below section “Fourth-Quarter Financial Details—Select Operating Expenses and Cost of Revenue” for a reconciliation to the most directly comparable GAAP financial measure, which is total select operating expenses and cost of revenue for the relevant period. 5 National Association of REALTORS® existing homes sold during Q4 2022 multiplied by the average selling price per home for Q4 2022, compared to the same period in 2021. 7 | Q4 2022


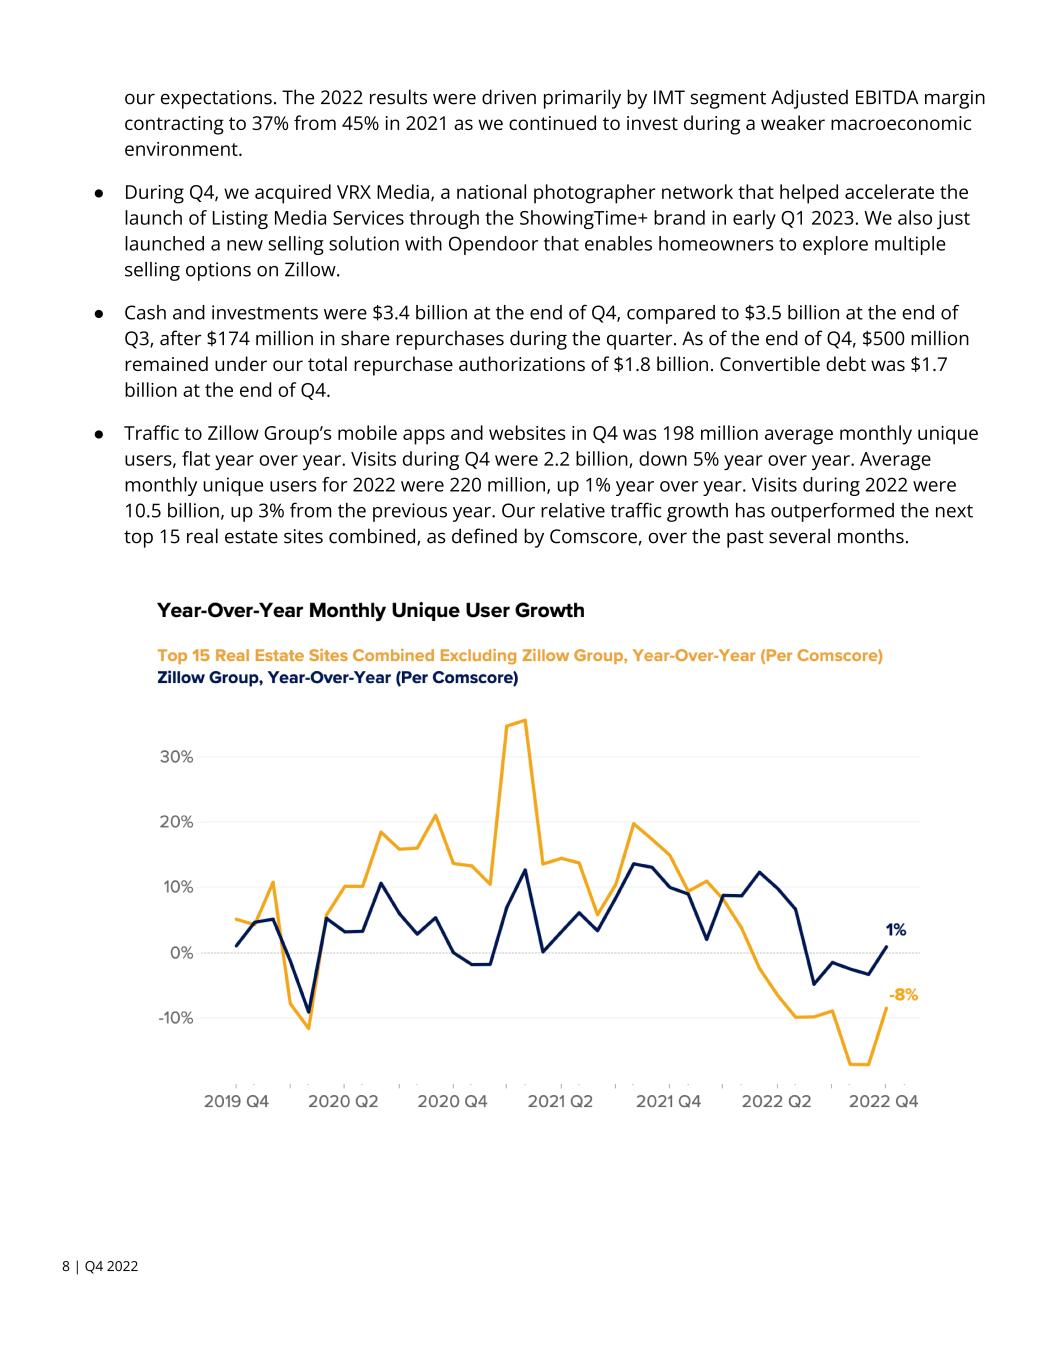
our expectations. The 2022 results were driven primarily by IMT segment Adjusted EBITDA margin contracting to 37% from 45% in 2021 as we continued to invest during a weaker macroeconomic environment. ● During Q4, we acquired VRX Media, a national photographer network that helped accelerate the launch of Listing Media Services through the ShowingTime+ brand in early Q1 2023. We also just launched a new selling solution with Opendoor that enables homeowners to explore multiple selling options on Zillow. ● Cash and investments were $3.4 billion at the end of Q4, compared to $3.5 billion at the end of Q3, after $174 million in share repurchases during the quarter. As of the end of Q4, $500 million remained under our total repurchase authorizations of $1.8 billion. Convertible debt was $1.7 billion at the end of Q4. ● Traffic to Zillow Group’s mobile apps and websites in Q4 was 198 million average monthly unique users, flat year over year. Visits during Q4 were 2.2 billion, down 5% year over year. Average monthly unique users for 2022 were 220 million, up 1% year over year. Visits during 2022 were 10.5 billion, up 3% from the previous year. Our relative traffic growth has outperformed the next top 15 real estate sites combined, as defined by Comscore, over the past several months. 8 | Q4 2022


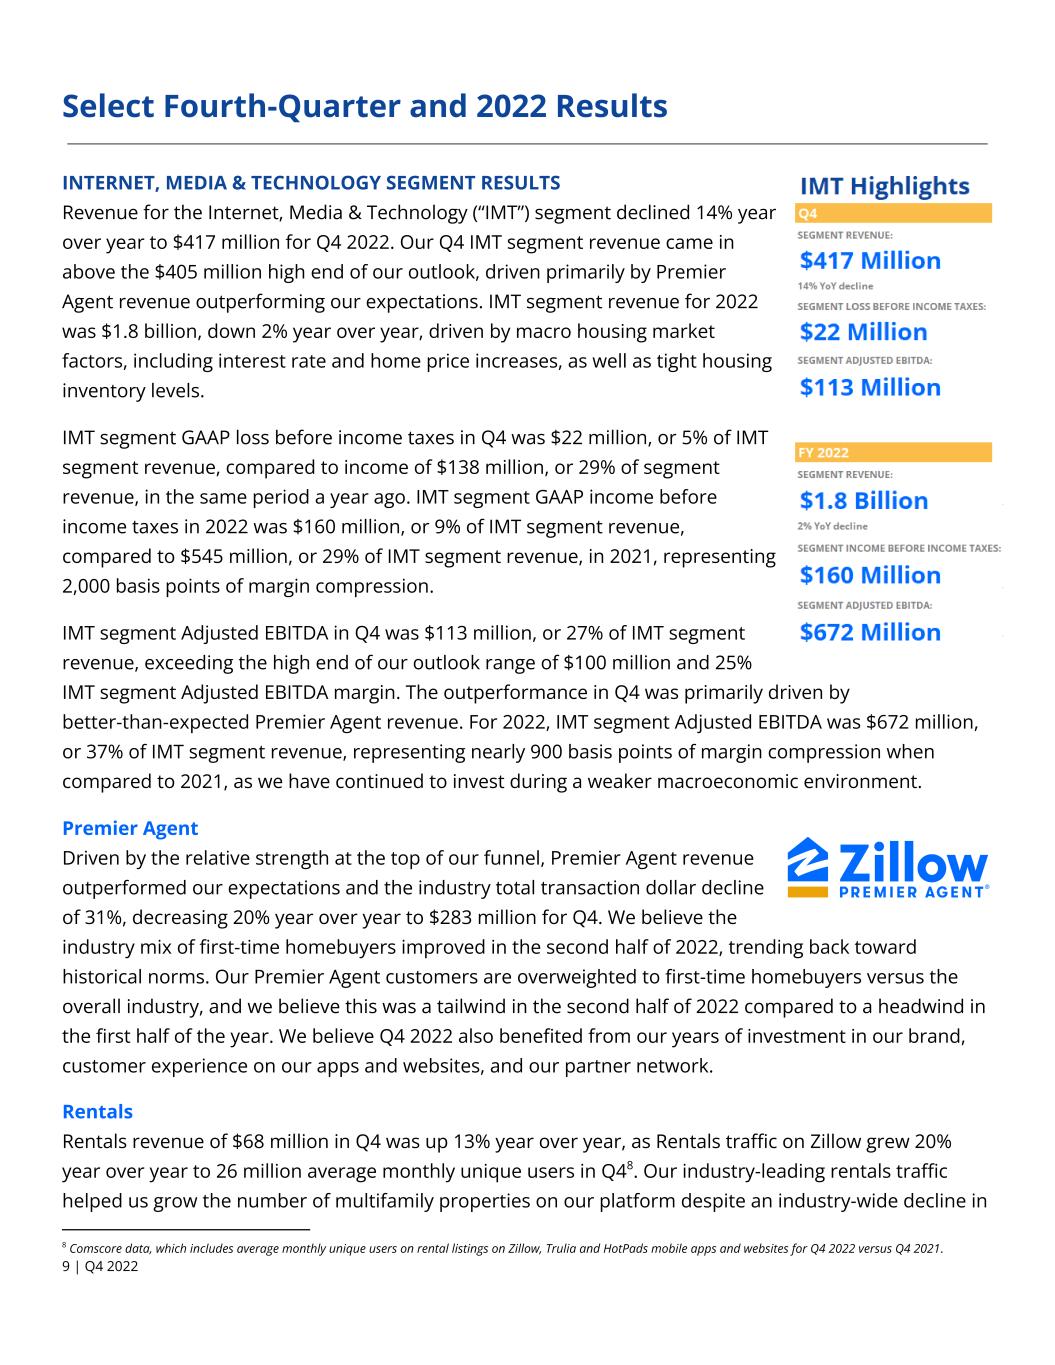
Select Fourth-Quarter and 2022 Results INTERNET, MEDIA & TECHNOLOGY SEGMENT RESULTS Revenue for the Internet, Media & Technology (“IMT”) segment declined 14% year over year to $417 million for Q4 2022. Our Q4 IMT segment revenue came in above the $405 million high end of our outlook, driven primarily by Premier Agent revenue outperforming our expectations. IMT segment revenue for 2022 was $1.8 billion, down 2% year over year, driven by macro housing market factors, including interest rate and home price increases, as well as tight housing inventory levels. IMT segment GAAP loss before income taxes in Q4 was $22 million, or 5% of IMT segment revenue, compared to income of $138 million, or 29% of segment revenue, in the same period a year ago. IMT segment GAAP income before income taxes in 2022 was $160 million, or 9% of IMT segment revenue, compared to $545 million, or 29% of IMT segment revenue, in 2021, representing 2,000 basis points of margin compression. IMT segment Adjusted EBITDA in Q4 was $113 million, or 27% of IMT segment revenue, exceeding the high end of our outlook range of $100 million and 25% IMT segment Adjusted EBITDA margin. The outperformance in Q4 was primarily driven by better-than-expected Premier Agent revenue. For 2022, IMT segment Adjusted EBITDA was $672 million, or 37% of IMT segment revenue, representing nearly 900 basis points of margin compression when compared to 2021, as we have continued to invest during a weaker macroeconomic environment. Premier Agent Driven by the relative strength at the top of our funnel, Premier Agent revenue outperformed our expectations and the industry total transaction dollar decline of 31%, decreasing 20% year over year to $283 million for Q4. We believe the industry mix of first-time homebuyers improved in the second half of 2022, trending back toward historical norms. Our Premier Agent customers are overweighted to first-time homebuyers versus the overall industry, and we believe this was a tailwind in the second half of 2022 compared to a headwind in the first half of the year. We believe Q4 2022 also benefited from our years of investment in our brand, customer experience on our apps and websites, and our partner network. Rentals Rentals revenue of $68 million in Q4 was up 13% year over year, as Rentals traffic on Zillow grew 20% year over year to 26 million average monthly unique users in Q48. Our industry-leading rentals traffic helped us grow the number of multifamily properties on our platform despite an industry-wide decline in 8 Comscore data, which includes average monthly unique users on rental listings on Zillow, Trulia and HotPads mobile apps and websites for Q4 2022 versus Q4 2021. 9 | Q4 2022


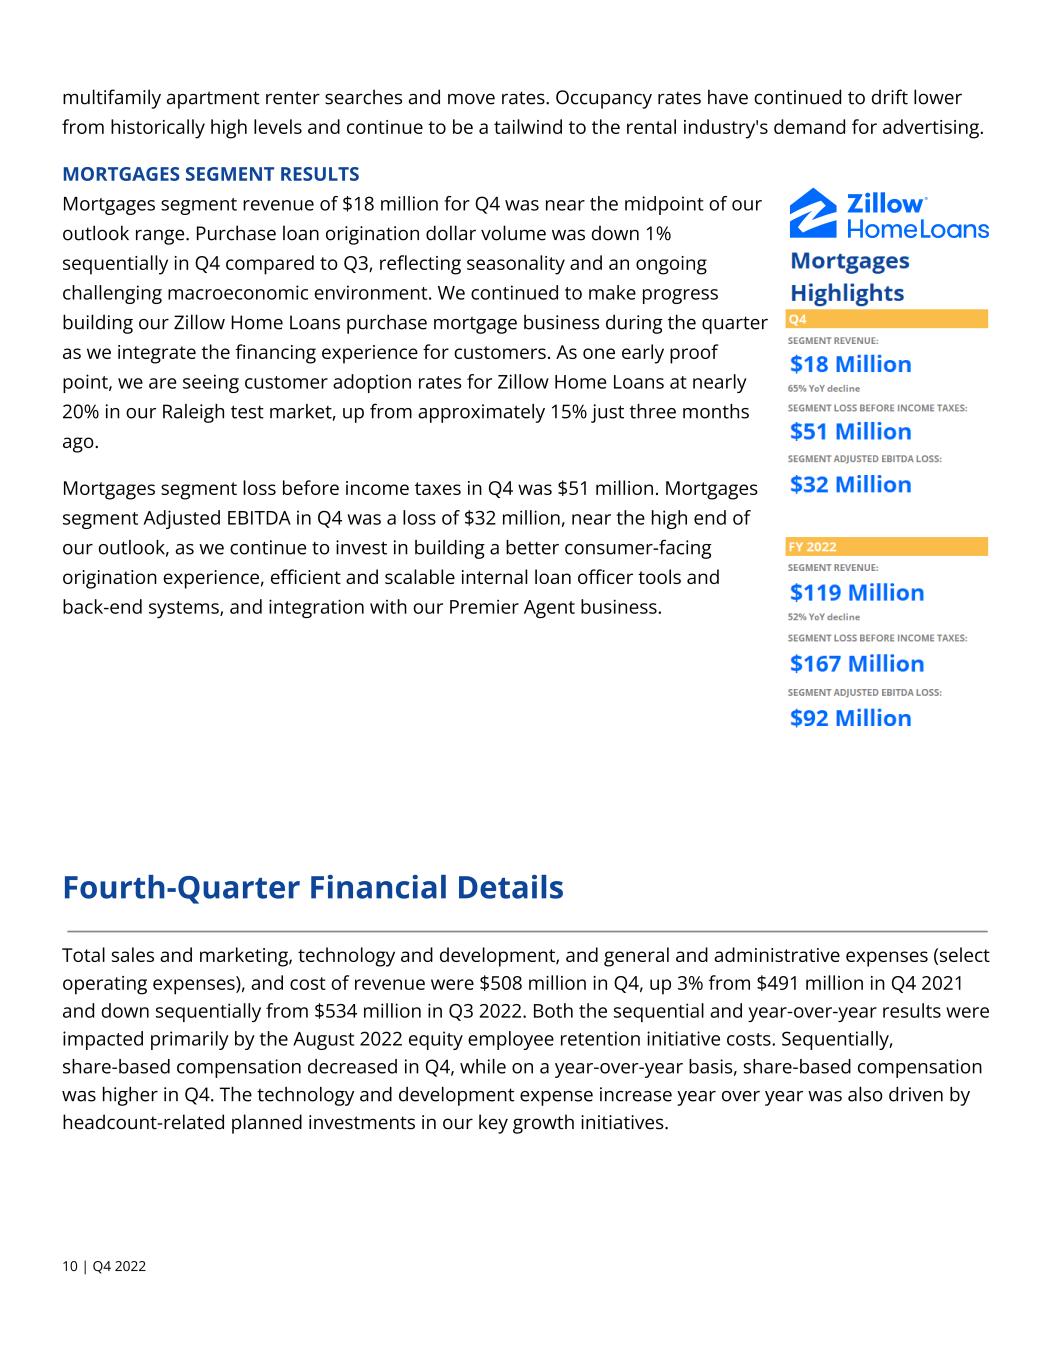
multifamily apartment renter searches and move rates. Occupancy rates have continued to drift lower from historically high levels and continue to be a tailwind to the rental industry's demand for advertising. MORTGAGES SEGMENT RESULTS Mortgages segment revenue of $18 million for Q4 was near the midpoint of our outlook range. Purchase loan origination dollar volume was down 1% sequentially in Q4 compared to Q3, reflecting seasonality and an ongoing challenging macroeconomic environment. We continued to make progress building our Zillow Home Loans purchase mortgage business during the quarter as we integrate the financing experience for customers. As one early proof point, we are seeing customer adoption rates for Zillow Home Loans at nearly 20% in our Raleigh test market, up from approximately 15% just three months ago. Mortgages segment loss before income taxes in Q4 was $51 million. Mortgages segment Adjusted EBITDA in Q4 was a loss of $32 million, near the high end of our outlook, as we continue to invest in building a better consumer-facing origination experience, efficient and scalable internal loan officer tools and back-end systems, and integration with our Premier Agent business. Fourth-Quarter Financial Details Total sales and marketing, technology and development, and general and administrative expenses (select operating expenses), and cost of revenue were $508 million in Q4, up 3% from $491 million in Q4 2021 and down sequentially from $534 million in Q3 2022. Both the sequential and year-over-year results were impacted primarily by the August 2022 equity employee retention initiative costs. Sequentially, share-based compensation decreased in Q4, while on a year-over-year basis, share-based compensation was higher in Q4. The technology and development expense increase year over year was also driven by headcount-related planned investments in our key growth initiatives. 10 | Q4 2022


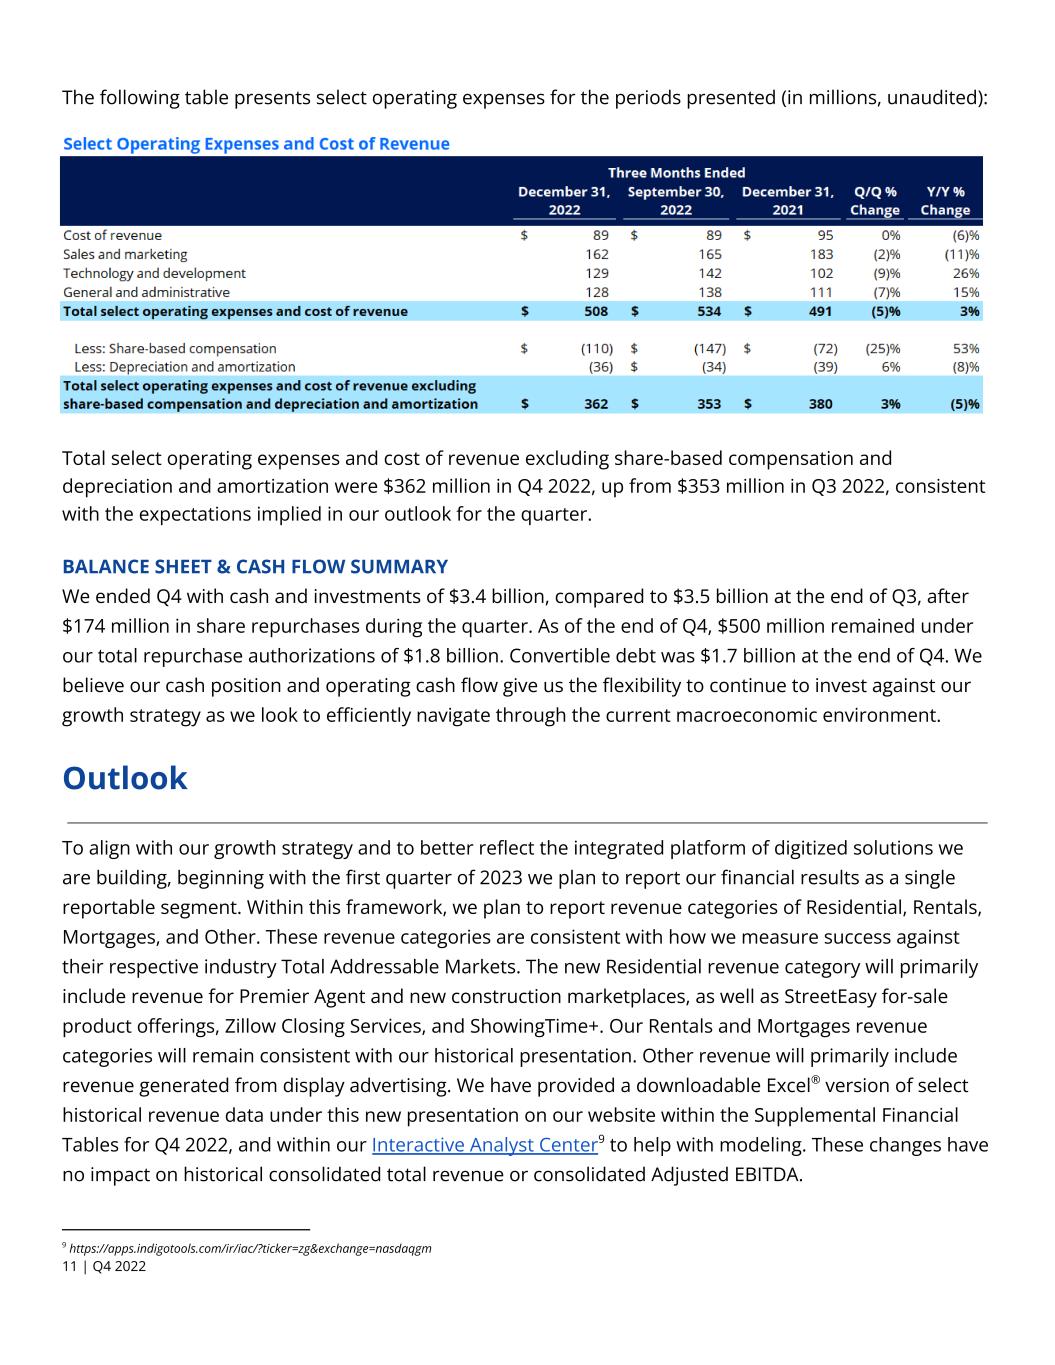
The following table presents select operating expenses for the periods presented (in millions, unaudited): Total select operating expenses and cost of revenue excluding share-based compensation and depreciation and amortization were $362 million in Q4 2022, up from $353 million in Q3 2022, consistent with the expectations implied in our outlook for the quarter. BALANCE SHEET & CASH FLOW SUMMARY We ended Q4 with cash and investments of $3.4 billion, compared to $3.5 billion at the end of Q3, after $174 million in share repurchases during the quarter. As of the end of Q4, $500 million remained under our total repurchase authorizations of $1.8 billion. Convertible debt was $1.7 billion at the end of Q4. We believe our cash position and operating cash flow give us the flexibility to continue to invest against our growth strategy as we look to efficiently navigate through the current macroeconomic environment. Outlook To align with our growth strategy and to better reflect the integrated platform of digitized solutions we are building, beginning with the first quarter of 2023 we plan to report our financial results as a single reportable segment. Within this framework, we plan to report revenue categories of Residential, Rentals, Mortgages, and Other. These revenue categories are consistent with how we measure success against their respective industry Total Addressable Markets. The new Residential revenue category will primarily include revenue for Premier Agent and new construction marketplaces, as well as StreetEasy for-sale product offerings, Zillow Closing Services, and ShowingTime+. Our Rentals and Mortgages revenue categories will remain consistent with our historical presentation. Other revenue will primarily include revenue generated from display advertising. We have provided a downloadable Excel® version of select historical revenue data under this new presentation on our website within the Supplemental Financial Tables for Q4 2022, and within our Interactive Analyst Center9 to help with modeling. These changes have no impact on historical consolidated total revenue or consolidated Adjusted EBITDA. 9 https://apps.indigotools.com/ir/iac/?ticker=zg&exchange=nasdaqgm 11 | Q4 2022


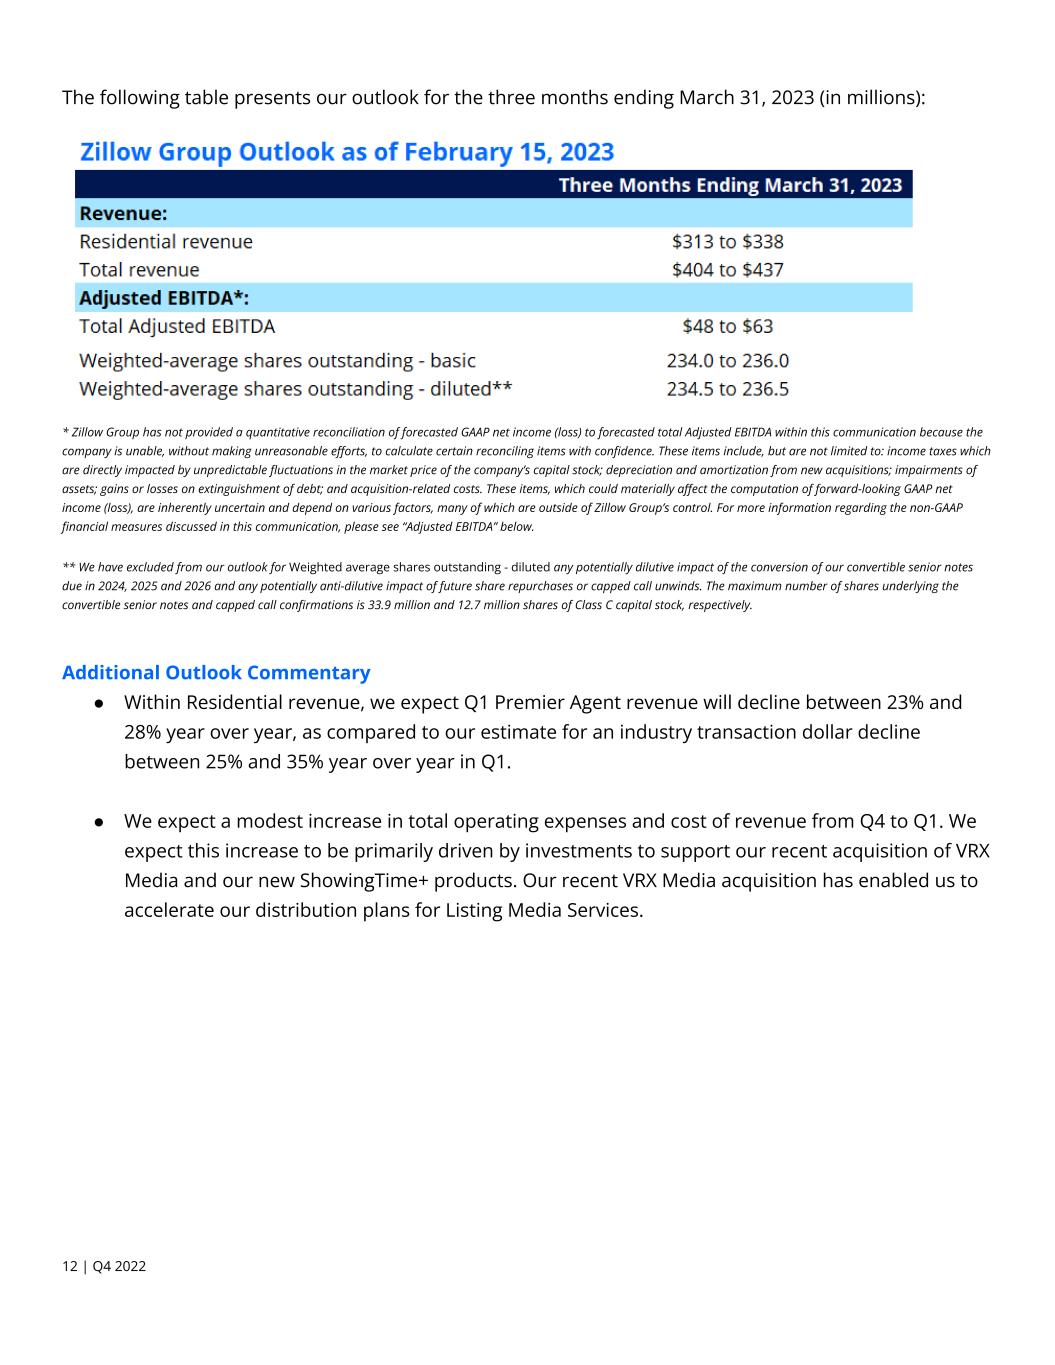
The following table presents our outlook for the three months ending March 31, 2023 (in millions): * Zillow Group has not provided a quantitative reconciliation of forecasted GAAP net income (loss) to forecasted total Adjusted EBITDA within this communication because the company is unable, without making unreasonable efforts, to calculate certain reconciling items with confidence. These items include, but are not limited to: income taxes which are directly impacted by unpredictable fluctuations in the market price of the company’s capital stock; depreciation and amortization from new acquisitions; impairments of assets; gains or losses on extinguishment of debt; and acquisition-related costs. These items, which could materially affect the computation of forward-looking GAAP net income (loss), are inherently uncertain and depend on various factors, many of which are outside of Zillow Group’s control. For more information regarding the non-GAAP financial measures discussed in this communication, please see “Adjusted EBITDA” below. ** We have excluded from our outlook for Weighted average shares outstanding - diluted any potentially dilutive impact of the conversion of our convertible senior notes due in 2024, 2025 and 2026 and any potentially anti-dilutive impact of future share repurchases or capped call unwinds. The maximum number of shares underlying the convertible senior notes and capped call confirmations is 33.9 million and 12.7 million shares of Class C capital stock, respectively. Additional Outlook Commentary ● Within Residential revenue, we expect Q1 Premier Agent revenue will decline between 23% and 28% year over year, as compared to our estimate for an industry transaction dollar decline between 25% and 35% year over year in Q1. ● We expect a modest increase in total operating expenses and cost of revenue from Q4 to Q1. We expect this increase to be primarily driven by investments to support our recent acquisition of VRX Media and our new ShowingTime+ products. Our recent VRX Media acquisition has enabled us to accelerate our distribution plans for Listing Media Services. 12 | Q4 2022


Forward-Looking Statements This communication contains forward-looking statements within the meaning of Section 27A of the Securities Act of 1933 and Section 21E of the Securities Exchange Act of 1934 that involve risks and uncertainties, including, without limitation, statements regarding our future targets, the future performance and operation of our business, changes to our financial reporting processes the current and future health and stability of the residential housing market and economy and our expectations regarding future shifts in behavior by consumers and employees. Statements containing words such as “may,” “believe,” “anticipate,” “expect,” “intend,” “plan,” “project,” “predict,” “will,” “projections,” “continue,” “estimate,” “outlook,” “guidance,” “would,” “could,” or similar expressions constitute forward-looking statements. Forward-looking statements are made based on assumptions as of Feb. 15, 2023, and although we believe the expectations reflected in the forward-looking statements are reasonable, we cannot guarantee these results. Differences in Zillow Group’s actual results from those described in these forward- looking statements may result from actions taken by Zillow Group as well as from risks and uncertainties beyond Zillow Group’s control. Factors that may contribute to such differences include, but are not limited to, the current and future health and stability of the economy, financial conditions and residential housing market, including any extended downturn or slowdown; changes in general economic and financial conditions (including federal monetary policy, interest rates, inflation, home price fluctuations, housing inventory, labor shortages and supply chain issues) that may reduce demand for our products and services, lower our profitability or reduce our access to financing; investment of resources to pursue strategies and develop new products and services that may not prove effective or that are not attractive to customers and real estate partners or that do not allow us to compete successfully; ability to comply with multiple listing service rules and requirements to access and use listing data, and to maintain or establish relationships with listings and data providers; ability to obtain or maintain licenses and permits to support our current and future businesses; ability to operate and grow our mortgage origination business, including the ability to obtain sufficient financing and resell originated mortgages on the secondary market; the duration and impact of natural disasters and other catastrophic events (including public health crises) on our ability to operate, on demand for our products or services, or on general economic conditions; acquisitions, strategic partnerships, joint ventures, capital-raising activities or other corporate transactions or commitments by us or our competitors; ability to manage advertising inventory and pricing; effectivity of our technology and information security systems, or those of third parties on which we rely; actual or anticipated fluctuations in our financial condition and results of operations; changes in projected operational and financial results; ability to protect the information and privacy of our customers and other third parties; ability to attract and retain qualified employees and key personnel; ability to protect our brand and intellectual property; changes in laws or government regulation affecting our business; and the impact of pending or future litigation or regulatory actions. The foregoing list of risks and uncertainties is illustrative but not exhaustive. For more information about potential factors that could affect Zillow Group’s business and financial results, please review the “Risk Factors” described in Zillow Group’s Annual Report on Form 10-K for the fiscal year ended December 31, 2022, filed with the SEC and in Zillow Group’s other filings with the SEC. Except as may be required by law, Zillow Group does not intend and undertakes no duty to update this information to reflect future events or circumstances. 13 | Q4 2022


No Incorporation by Reference This communication includes website addresses and references to additional materials found on those websites, including Zillow Group’s websites. These websites and materials are not incorporated by reference herein or our other filings with the Securities and Exchange Commission. Use of Estimates and Statistical Data This communication includes estimates and other statistical data made by independent third parties and by Zillow Group relating to the housing market, connection, engagement, growth, and other data about Zillow Group’s performance and the residential real estate industry. These data involve a number of assumptions and limitations, which may significantly impair their accuracy, and you are cautioned not to give undue weight to such estimates. Projections, assumptions and estimates of future performance are necessarily subject to a high degree of uncertainty and risk. Use of Operating Metrics Zillow Group reviews a number of operating metrics to evaluate its business, measure performance, identify trends, formulate business plans, and make strategic decisions. This communication includes Customer Transactions and current share of Customer Transactions as a percentage of total transactions. Zillow Group uses these operating metrics on a periodic basis to evaluate and provide investors with insight into the performance of Zillow Group’s transaction-based lines of business, which currently include Premier Agent, Zillow Home Loans and Zillow Closing Services. Revenue and transaction contributions from Zillow Offers have been excluded from the below calculations. Customer Transactions: Zillow Group calculates “Customer Transactions” as each unique purchase or sale transaction in which the homebuyer or seller uses Zillow Home Loans, Zillow Closing Services, and/or involves a Premier Agent with whom the buyer or seller connected through Zillow. In particular: • For Premier Agent, Zillow Group uses an internal approximation of the number of buy- and sell-side transactions that involve a Premier Agent with whom the buyer or seller connected through Zillow. Because of the challenges associated with measuring the conversion of connections to transactions outside of our Premier Agent Flex program, including reliance on the availability and quality of public records and data, these estimates may be inaccurate. • For Zillow Closing Services, Zillow Group counts each unique purchase or sale transaction in which the home buyer or seller uses Zillow Closing Services. • For Zillow Home Loans, Zillow Group counts each unique purchase or sale transaction in which the home buyer or seller uses Zillow Home Loans. Revenue Per Customer Transaction: Zillow Group calculates “Revenue Per Customer Transaction” as Premier Agent, Zillow Home Loans and Zillow Closing Services revenue divided by the number of Customer Transactions during the relevant period. Share of Customer Transactions: For purposes of estimating our historical share of customer transactions, Zillow Group assumed there were 12.2M buy and sell-side transactions in 2021, based on the estimated 6.1M home transactions reported by the National Association of REALTORS® in 2021. Adjusted EBITDA To provide investors with additional information regarding our financial results, this communication includes references to Adjusted EBITDA in total and for each segment, each a non-GAAP financial measure. We have provided a reconciliation below of Adjusted EBITDA in total to net loss and Adjusted EBITDA by segment to income (loss) from continuing operations before income taxes for each segment, the most directly comparable GAAP financial measures. 14 | Q4 2022


Adjusted EBITDA is a key metric used by our management and board of directors to measure operating performance and trends and to prepare and approve our annual budget. In particular, the exclusion of certain expenses in calculating Adjusted EBITDA facilitates operating performance comparisons on a period-to-period basis. Our use of Adjusted EBITDA in total and for each segment has limitations as an analytical tool, and you should not consider these measures in isolation or as a substitute for analysis of our results as reported under GAAP. Some of these limitations are: • Adjusted EBITDA does not reflect changes in, or cash requirements for, our working capital needs; • Adjusted EBITDA does not reflect the results of discontinued operations; • Adjusted EBITDA does not consider the potentially dilutive impact of share-based compensation; • Although depreciation and amortization are non-cash charges, the assets being depreciated and amortized may have to be replaced in the future, and Adjusted EBITDA does not reflect cash capital expenditure requirements for such replacements or for new capital expenditures or contractual commitments; • Adjusted EBITDA does not reflect restructuring costs; • Adjusted EBITDA does not reflect acquisition-related costs; • Adjusted EBITDA does not reflect loss on extinguishment of debt; • Adjusted EBITDA does not reflect interest expense or other income (expense), net; • Adjusted EBITDA does not reflect income taxes; and • Other companies, including companies in our own industry, may calculate Adjusted EBITDA differently from the way we do, limiting its usefulness as a comparative measure. Because of these limitations, you should consider Adjusted EBITDA in total and for each segment alongside other financial performance measures, including various cash flow metrics, net loss, income (loss) from continuing operations before income taxes for each segment and our other GAAP results. 15 | Q4 2022


The following tables present the calculation of Adjusted EBITDA margin and associated year-over-year growth rates and the most directly comparable GAAP financial measure and related year-over-year growth rates, which is net loss on a consolidated basis and income (loss) from continuing operations before income taxes margin for each segment, along with a reconciliation of Adjusted EBITDA to the most directly comparable GAAP financial measure, which is net loss on a consolidated basis and income (loss) from continuing operations before income taxes for each segment, for each of the periods presented (in millions, except percentages and margin change basis points, unaudited): Three Months Ended December 31, 2021 to 2022 % Change Year Ended December 31, 2021 to 2022 % Change2022 2021 2022 2021 Revenue: IMT segment: Premier Agent $ 283 $ 354 (20)% $ 1,291 $ 1,396 (8)% Rentals 68 60 13% 274 264 4% Other (1) 66 70 (6)% 274 226 21% Total IMT segment revenue 417 484 (14)% 1,839 1,886 (2)% Mortgages segment 18 51 (65)% 119 246 (52)% Total revenue $ 435 $ 535 (19)% $ 1,958 $ 2,132 (8)% Other Financial Data: Gross profit $ 346 $ 440 (21)% $ 1,591 $ 1,809 (12)% Income (loss) from continuing operations before income taxes: IMT segment $ (22) $ 138 (116)% $ 160 $ 545 (71)% Mortgages segment (51) (26) (96)% (167) (52) (221)% Homes segment (13) (79) 84% (93) (254) 63% Corporate items (2) 18 (28) 164% 15 (138) 111% Total income (loss) from continuing operations before income taxes $ (68) $ 5 (1,460)% $ (85) $ 101 (184)% Net loss $ (72) $ (261) 72% $ (101) $ (528) 81% Net income (loss) from continuing operations $ (72) $ 6 1,300% $ (88) $ 102 (186)% Adjusted EBITDA (3): IMT segment $ 113 $ 221 (49)% $ 672 $ 854 (21)% Mortgages segment (32) (14) (129)% (92) (9) (922)% Homes segment (8) (53) 85% (66) (191) 65% Total Adjusted EBITDA $ 73 $ 154 (53)% $ 514 $ 654 (21)% (1) Other IMT segment revenue includes revenue generated by our new construction marketplace and revenue from the sale of other advertising and business technology solutions for real estate professionals, including display, StreetEasy for-sale product offerings and ShowingTime+, which houses ShowingTime, Bridge Interactive, dotloop and interactive floor plans. (2) Certain corporate items are not directly attributable to any of our segments, including the loss on extinguishment of debt, interest income earned on our short-term investments included in other income, net and interest costs on our convertible senior notes included in interest expense. (3) Adjusted EBITDA is a non-GAAP financial measure; it is not calculated or presented in accordance with U.S. generally accepted accounting principles, or GAAP. See below for more information regarding our presentation of Adjusted EBITDA, including a reconciliation of Adjusted EBITDA to the most directly comparable GAAP financial measure, which is net loss on a consolidated basis and income (loss) from continuing operations before income taxes for each segment, for each of the periods presented. Adjusted EBITDA on a consolidated basis and for each segment excludes the impact of discontinued operations. 16 | Q4 2022


Three Months Ended December 31, 2021 to  2022 % Change 2021 to 2022 Margin Change Basis Points Year Ended December 31, 2021 to  2022 % Change 2021 to 2022 Margin Change Basis PointsPercentage of Revenue: 2022 2021 2022 2021 Gross profit 80 % 82 % (2) % (300) 81 % 85 % (5) % (400) Income (loss) from continuing operations before income taxes: IMT segment (5) % 29 % (117) % (3,400) 9 % 29 % (69) % (2,000) Mortgages segment (283) % (51) % (455) % (23,200) (140) % (21) % (567) % (11,900) Homes segment N/A N/A N/A N/A N/A N/A N/A N/A Corporate items (2) N/A N/A N/A N/A N/A N/A N/A N/A Total income (loss) from continuing operations before income taxes (16) % 1 % (1,700) % (1,700) (4) % 5 % (180) % (900) Net loss (17) % (49) % 65 % 3,200 (5) % (25) % 80 % 2,000 Net income (loss) from continuing operations (17) % 1 % (1,800) % (1,800) (4) % 5 % (180) % (900) Adjusted EBITDA (3): IMT segment 27 % 46 % (41) % (1,900) 37 % 45 % (18) % (900) Mortgages segment (178) % (27) % (559) % (15,000) (77) % (4) % (1,825) % (7,400) Homes segment N/A N/A N/A N/A N/A N/A N/A N/A Total Adjusted EBITDA 17 % 29 % (41) % (1,200) 26 % 31 % (16) % (400)   Three Months Ended December 31, 2022 IMT Mortgages Homes Corporate Items (2) Consolidated Reconciliation of Adjusted EBITDA to Net Loss and Income (Loss) From Continuing Operations Before Income Taxes: Net loss (1) N/A N/A N/A N/A $ (72) Income taxes N/A N/A N/A N/A 4 Income (loss) from continuing operations before income taxes $ (22) $ (51) $ (13) $ 18 $ (68) Other expense (income), net 3 (1) — (26) (24) Depreciation and amortization 33 3 — — 36 Share-based compensation 93 14 3 — 110 Restructuring costs 6 2 2 — 10 Interest expense — 1 — 8 9 Adjusted EBITDA $ 113 $ (32) $ (8) $ — $ 73 17 | Q4 2022


  Three Months Ended December 31, 2021 IMT Mortgages Homes Corporate Items (2) Consolidated Reconciliation of Adjusted EBITDA to Net Loss and Income (Loss) From Continuing Operations Before Income Taxes: Net loss (1) N/A N/A N/A N/A $ (261) Loss from discontinued operations, net of income taxes N/A N/A N/A N/A 267 Income taxes N/A N/A N/A N/A (1) Income (loss) from continuing operations before income taxes $ 138 $ (26) $ (79) $ (28) $ 5 Other income, net — (2) — — (2) Depreciation and amortization 31 3 5 — 39 Share-based compensation 51 9 12 — 72 Acquisition-related costs 1 — — — 1 Restructuring costs — 1 9 — 10 Interest expense — 1 — 28 29 Adjusted EBITDA $ 221 $ (14) $ (53) $ — $ 154   Year Ended December 31, 2022 IMT Mortgages Homes Corporate Items (2) Consolidated Reconciliation of Adjusted EBITDA to Net Loss and Income (Loss) From Continuing Operations Before Income Taxes: Net loss (1) N/A N/A N/A N/A $ (101) Loss from discontinued operations, net of income taxes N/A N/A N/A N/A 13 Income taxes N/A N/A N/A N/A 3 Income (loss) from continuing operations before income taxes $ 160 $ (167) $ (93) $ 15 $ (85) Other expense (income), net 7 (3) — (47) (43) Depreciation and amortization 137 11 2 — 150 Share-based compensation 356 60 17 — 433 Restructuring costs 12 4 8 — 24 Interest expense — 3 — 32 35 Adjusted EBITDA $ 672 $ (92) $ (66) $ — $ 514 18 | Q4 2022


  Year Ended December 31, 2021 IMT Mortgages Homes Corporate Items (2) Consolidated Reconciliation of Adjusted EBITDA to Net Loss and Income (Loss) From Continuing Operations Before Income Taxes: Net loss (1) N/A N/A N/A N/A $ (528) Loss from discontinued operations, net of income taxes N/A N/A N/A N/A 630 Income taxes N/A N/A N/A N/A (1) Income (loss) from continuing operations before income taxes $ 545 $ (52) $ (254) $ (138) $ 101 Other income, net — (5) — (2) (7) Depreciation and amortization 99 8 13 — 120 Share-based compensation 201 34 41 — 276 Acquisition-related costs 9 — — — 9 Loss on extinguishment of debt — — — 17 17 Restructuring costs — 1 9 — 10 Interest expense — 5 — 123 128 Adjusted EBITDA $ 854 $ (9) $ (191) $ — $ 654 (1) We use income (loss) from continuing operations before income taxes as our profitability measure in making operating decisions and assessing the performance of our segments; therefore, net loss and income taxes are calculated and presented only on a consolidated basis within our financial statements. (2) Certain corporate items are not directly attributable to any of our segments, including the loss on extinguishment of debt, interest income earned on our short-term investments included in other income, net, and interest costs on our convertible senior notes included in interest expense. 19 | Q4 2022