z-20230503
false000161764000016176402023-05-032023-05-030001617640us-gaap:CommonClassAMember2023-05-032023-05-030001617640us-gaap:CommonClassCMember2023-05-032023-05-03

UNITED STATES
SECURITIES AND EXCHANGE COMMISSION
Washington, D.C. 20549

FORM 8-K
CURRENT REPORT
Pursuant to Section 13 or 15(d)
of the Securities Exchange Act of 1934
Date of Report (Date of Earliest Event Reported): May 3, 2023
ZILLOW GROUP, INC.
(Exact name of registrant as specified in its charter)
Washington 001-36853 47-1645716
(State or other jurisdiction
of incorporation)
 (Commission
File Number)
 (I.R.S. Employer
Identification No.)
1301 Second Avenue, Floor 31, Seattle, Washington
 98101
(Address of principal executive offices) (Zip Code)
(206) 470-7000
(Registrant’s telephone number, including area code)
Check the appropriate box below if the Form 8-K filing is intended to simultaneously satisfy the filing obligation of the registrant under any of the following provisions:
Written communications pursuant to Rule 425 under the Securities Act (17 CFR 230.425)
Soliciting material pursuant to Rule 14a-12 under the Exchange Act (17 CFR 240.14a-12)
Pre-commencement communications pursuant to Rule 14d-2(b) under the Exchange Act (17 CFR 240.14d-2(b))
Pre-commencement communications pursuant to Rule 13e-4(c) under the Exchange Act (17 CFR 240.13e-4(c))

Securities registered pursuant to Section 12(b) of the Act:
Title of each classTrading Symbol(s)Name of each exchange on which registered
Class A Common Stock, par value $0.0001 per shareZGThe Nasdaq Global Select Market
Class C Capital Stock, par value $0.0001 per shareZThe Nasdaq Global Select Market
Indicate by check mark whether the registrant is an emerging growth company as defined in Rule 405 of the Securities Act of 1933 (§230.405 of this chapter) or Rule 12b-2 of the Securities Exchange Act of 1934 (§240.12b-2 of this chapter).
Emerging growth company     
If an emerging growth company, indicate by check mark if the registrant has elected not to use the extended transition period for complying with any new or revised financial accounting standards provided pursuant to Section 13(a) of the Exchange Act.    ☐


Item 2.02Results of Operations and Financial Condition.
Zillow Group, Inc. (“Zillow Group”) today issued a press release and a shareholder letter announcing its financial results for the fiscal quarter ended March 31, 2023. The full text of the press release issued in connection with the announcement is furnished as Exhibit 99.1, accompanying supporting tables as Exhibit 99.2, and the shareholder letter as Exhibit 99.3 to this Current Report on Form 8-K.
The information in this Item 2.02 and Exhibits 99.1, 99.2 and 99.3 of this Current Report on Form 8-K shall not be deemed to be “filed” for purposes of Section 18 of the Securities Exchange Act of 1934, as amended (the “Exchange Act”), or otherwise subject to the liabilities of that section, nor shall it be deemed incorporated by reference into any filing under the Securities Act of 1933, as amended, or the Exchange Act, except as expressly set forth by specific reference in such a filing.
Item 9.01Financial Statements and Exhibits.
(d) Exhibits.
Exhibit
Number
  Description
99.1
99.2
99.3
104Cover Page Interactive Data File (embedded within the Inline XBRL document).


SIGNATURES
Pursuant to the requirements of the Securities Exchange Act of 1934, the registrant has duly caused this report to be signed on its behalf by the undersigned hereunto duly authorized.
 
Dated: May 3, 2023 ZILLOW GROUP, INC.
 By:
/s/ JENNIFER ROCK
 Name:Jennifer Rock
 Title:Chief Accounting Officer


Exhibit 99.1
zglogoa04a.jpg
Contacts:
Investors
Brad Berning
[email protected]
Media
Chrissy Roebuck
[email protected]
Zillow Group Reports First-Quarter 2023 Financial Results
SEATTLE — May 3, 2023 — Zillow Group, Inc. (NASDAQ: Z and ZG), which is transforming the way people buy, sell, rent and finance homes, today announced its consolidated financial results for the three months ended March 31, 2023.
Complete financial results for the first quarter and outlook for the second quarter of 2023 can be found in our shareholder letter on the Investor Relations section of Zillow Group’s website at https://investors.zillowgroup.com/investors/financials/quarterly-results/default.aspx.
“We’re starting to see our investments pay off, with Q1 financial results that outperformed the top end of our outlook,” said Zillow co-founder and CEO Rich Barton. “We’re capturing more customer demand and connecting more of that demand to our strengthening partner network, and these numerous incremental improvements have added up to make a real impact on our business. Our powerful brand and strong balance sheet put us on solid footing as we build the housing super app and help get more and more people home.”
Recent highlights include:
Zillow Group’s first-quarter results exceeded the company’s outlook for both revenue and Adjusted EBITDA.
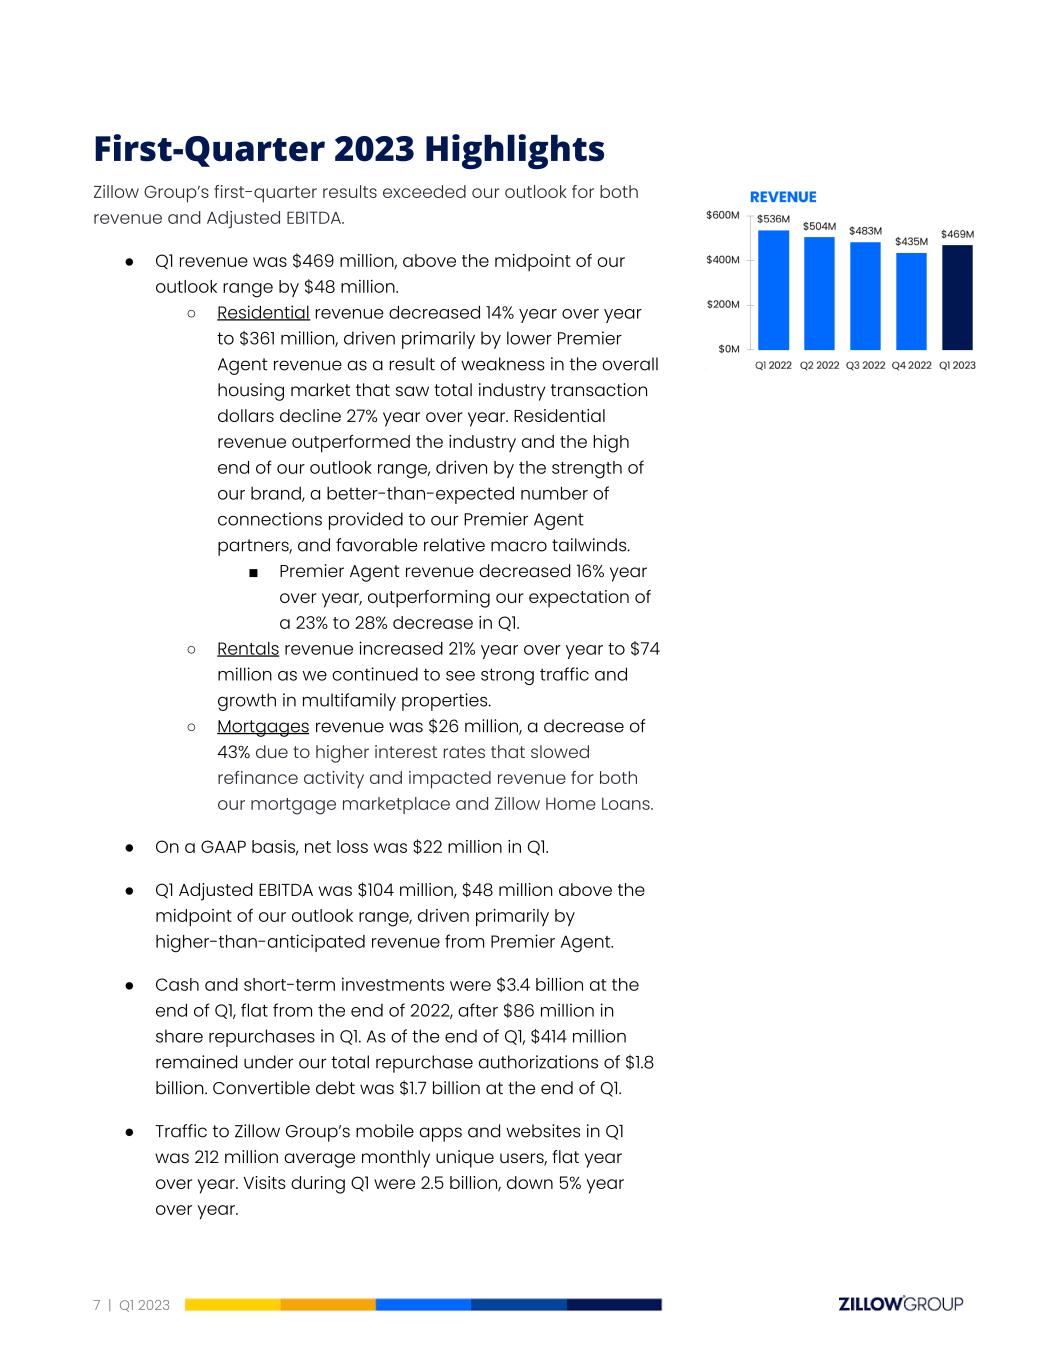
Q1 revenue was $469 million, above the midpoint of the company’s outlook range by $48 million.
Residential revenue decreased 14% year over year to $361 million, driven primarily by lower Premier Agent revenue as a result of weakness in the overall housing market that saw total industry transaction dollars1 decline 27% year over year. Residential revenue outperformed the industry in total transaction dollars and the high end of the company’s outlook range, driven by the strength of the company’s brand, a better-than-expected number of connections provided to Premier Agent partners, and favorable relative macro tailwinds.
Premier Agent revenue decreased 16% year over year, outperforming the company’s expectation of a 23% to 28% decrease in Q1.
Rentals revenue increased 21% year over year to $74 million as the company continued to see strong traffic and growth in multifamily properties.
Mortgages revenue was $26 million, a decrease of 43% due to higher interest rates that slowed refinance activity and impacted revenue for both our mortgage marketplace and Zillow Home Loans.
On a GAAP basis, net loss was $22 million in Q1.
Q1 Adjusted EBITDA was $104 million, $48 million above the midpoint of the company’s outlook range, driven primarily by higher-than-anticipated revenue from Premier Agent.
Cash and investments were $3.4 billion at the end of Q1, flat from the end of 2022, after $86 million in share repurchases in the quarter. As of the end of Q1, $414 million remained under the company’s total repurchase authorizations of $1.8 billion. Convertible debt was $1.7 billion at the end of Q1.
Traffic to Zillow Group’s mobile apps and websites in Q1 was 212 million average monthly unique users, flat year over year. Visits during Q1 were 2.5 billion, down 5% year over year.
1 National Association of REALTORS® existing homes sold during Q1 2023 multiplied by the average selling price per home for Q1 2023, compared to the same period in 2022.


First Quarter 2023 Financial Highlights

The following table sets forth Zillow Group’s financial highlights for the periods presented (in millions, except percentages, unaudited):

 Three Months Ended
March 31,
2022 to 2023
% Change
 20232022
Revenue:
Residential$361$418(14)%
Rentals746121%
Mortgages2646(43)%
Other811(27)%
Total revenue$469 $536 (13)%
Other Financial Data:
Gross profit$377$444
Net income (loss)$(22)$16
Adjusted EBITDA (1)$104$166
Percentage of Revenue:
Gross profit80%83%
Net income (loss)(5)%3%
Adjusted EBITDA22%31%
(1) Adjusted EBITDA is a non-GAAP financial measure; it is not calculated or presented in accordance with U.S. generally accepted accounting principles, or GAAP. See below for more information regarding our presentation of Adjusted EBITDA, including a reconciliation of Adjusted EBITDA to the most directly comparable GAAP financial measure, which is net income (loss) for each of the periods presented. Adjusted EBITDA excludes the impact of discontinued operations.
Conference Call and Webcast Information
The company will host a live conference call to discuss these results today at 2 p.m. Pacific Time (5 p.m. Eastern Time). A shareholder letter and link to both the live webcast and recorded replay of the call may be accessed in the Quarterly Results section of Zillow Group’s Investor Relations website. Participants must register for the live call in advance at https://www.netroadshow.com/events/login?show=20ec80c1&confId=45370 to receive emailed instructions. This pre-registration process is designed to reduce delays due to operator congestion when accessing the live call.
Forward-Looking Statements

This press release contains forward-looking statements within the meaning of Section 27A of the Securities Act of 1933 and Section 21E of the Securities Exchange Act of 1934 that involve risks and uncertainties, including, without limitation, statements regarding the future performance and operation of our business, the current and future health and stability of the residential housing market and economy, volatility of mortgage interest rates, and our expectations regarding future shifts in behavior by consumers and employees. Statements containing words such as “may,” “believe,” “anticipate,” “expect,” “intend,” “plan,” “project,” “predict,” “will,” “projections,” “continue,” “estimate,” “outlook,” “guidance,” “would,” “could,” “strive,” or similar expressions constitute forward-looking statements. Forward-looking statements are made based on assumptions as of May 3, 2023, and although we believe the expectations reflected in the forward-looking statements are reasonable, we cannot guarantee these results. Differences in Zillow Group’s actual results from those described in these forward-looking statements may result from actions taken by Zillow Group as well as from risks and uncertainties beyond Zillow Group’s control.


Factors that may contribute to such differences include, but are not limited to: the current and future health and stability of the economy and United States residential real estate industry, including changes in inflationary conditions, interest rates, housing availability and affordability, labor shortages and supply chain issues; our ability to manage advertising inventory and pricing and maintain relationships with our real estate partners; our ability to establish or maintain relationships with listing and data providers, which affects traffic to our mobile applications and websites; our ability to comply with current and future multiple listing service (“MLS”) rules and requirements; our ability to continue to innovate and compete successfully to attract customers and real estate partners; our ability to operate and grow Zillow Home Loans, our mortgage origination business, including the ability to obtain or maintain sufficient financing to fund its origination of mortgages, meet customers’ financing needs with its product offerings, continue to grow the origination business and resell originated mortgages on the secondary market; the duration and impact of natural disasters and other catastrophic events (including public health crises) on our ability to operate, demand for our products or services, or general economic conditions; our ability to maintain adequate security measures or technology systems, or those of third parties on which we rely, to protect data integrity and the information and privacy of our customers and other third parties; the impact of pending or future litigation and other disputes or enforcement actions; our ability to attract and retain a highly skilled workforce; acquisitions, investments, strategic partnerships, capital-raising activities, or other corporate transactions or commitments by us or our competitors; our ability to continue relying on third-party services to support critical functions of our business; our ability to protect and continue using our intellectual property and prevent others from copying, infringing upon, or developing similar intellectual property; our ability to comply with domestic and international laws, regulations, rules, contractual obligations, policies and other obligations, or to obtain or maintain required licenses to support our business and operations; our ability to pay debt, settle conversions of our convertible senior notes, or repurchase our convertible senior notes upon a fundamental change; our ability to raise additional capital or refinance on acceptable terms, or at all; actual or anticipated fluctuations in quarterly and annual results of operations and financial position; the assumptions, estimates and internal or third-party data that we use to calculate business, performance and operating metrics; and volatility of our Class A common stock and Class C capital stock prices.
The foregoing list of risks and uncertainties is illustrative but not exhaustive. For more information about potential factors that could affect Zillow Group’s business and financial results, please review the “Risk Factors” described in Zillow Group’s Annual Report on Form 10-K for the fiscal year ended December 31, 2022, and in future quarterly and annual reports. Except as may be required by law, Zillow Group does not intend and undertakes no duty to update this information to reflect future events or circumstances.
About Zillow Group, Inc.
Zillow Group, Inc. (NASDAQ: Z and ZG) is reimagining real estate to make home a reality for more and more people. As the most visited real estate website in the United States, Zillow and its affiliates help people find and get the home they want by connecting them with digital solutions, great partners, and easier buying, selling, financing and renting experiences.
Zillow Group’s affiliates, subsidiaries and brands include Zillow®; Zillow Premier Agent®; Zillow Home Loans℠; Zillow Closing Services℠; Trulia®; Out East®; StreetEasy®; HotPads®; and ShowingTime+SM, which includes ShowingTime®, Bridge Interactive®, and dotloop®. All marks herein are owned by MFTB Holdco, Inc., a Zillow affiliate. Zillow Home Loans, LLC is an Equal Housing Lender, NMLS #10287 (www.nmlsconsumeraccess.org). © 2023 MFTB Holdco, Inc., a Zillow affiliate.
Please visit https://investors.zillowgroup.com, www.zillowgroup.com/news, and www.twitter.com/zillowgroup, where Zillow Group discloses information about the company, its financial information and its business that may be deemed material.
The Zillow Group logo is available at https://zillowgroup.mediaroom.com/logos-photos.
(ZFIN)
Use of Non-GAAP Financial Measures
To provide investors with additional information regarding our financial results, this press release includes references to Adjusted EBITDA, a non-GAAP financial measure. We have provided a reconciliation below of Adjusted EBITDA to net income (loss), the most directly comparable U.S. generally accepted accounting principle (“GAAP”) financial measure.
Adjusted EBITDA is a key metric used by our management and board of directors to measure operating performance and trends and to prepare and approve our annual budget. In particular, the exclusion of certain expenses in calculating Adjusted EBITDA facilitates operating performance comparisons on a period-to-period basis.
Our use of Adjusted EBITDA has limitations as an analytical tool, and you should not consider this measure in isolation or as a substitute for analysis of our results as reported under GAAP. Some of these limitations are:
Adjusted EBITDA does not reflect changes in, or cash requirements for, our working capital needs;


Adjusted EBITDA does not reflect the results of discontinued operations;
Adjusted EBITDA does not consider the potentially dilutive impact of share-based compensation;
Although depreciation and amortization are non-cash charges, the assets being depreciated and amortized may have to be replaced in the future, and Adjusted EBITDA does not reflect cash capital expenditure requirements for such replacements or for new capital expenditures or contractual commitments;
Adjusted EBITDA does not reflect impairment and restructuring costs;
Adjusted EBITDA does not reflect interest expense or other income;
Adjusted EBITDA does not reflect income taxes; and
Other companies, including companies in our own industry, may calculate Adjusted EBITDA differently from the way we do, limiting its usefulness as a comparative measure.
Because of these limitations, you should consider Adjusted EBITDA alongside other financial performance measures, including various cash-flow metrics, net income (loss) and our other GAAP results.
Adjusted EBITDA
The following table presents a reconciliation of Adjusted EBITDA to the most directly comparable GAAP financial measure, which is net income (loss), for each of the periods presented (in millions, unaudited):

Three Months Ended
March 31,
20232022
Reconciliation of Adjusted EBITDA to Net Income (Loss):
Net income (loss)$(22)$16 
Loss from discontinued operations, net of income taxes— 
Income taxes— 
Other income(32)(2)
Depreciation and amortization40 39 
Share-based compensation103 77 
Impairment and restructuring costs14 
Interest expense
     Adjusted EBITDA$104 $166 


Exhibit 99.2


Reported Consolidated Results

ZILLOW GROUP, INC.
UNAUDITED CONDENSED CONSOLIDATED BALANCE SHEETS
(in millions)
March 31, 2023December 31, 2022
Assets
Current assets:
Cash and cash equivalents$1,394 $1,466 
Short-term investments1,975 1,896 
Accounts receivable, net
75 72 
Mortgage loans held for sale48 41 
Prepaid expenses and other current assets152 126 
Restricted cash
Total current assets3,646 3,603 
Contract cost assets23 23 
Property and equipment, net290 271 
Right of use assets114 126 
Goodwill2,374 2,374 
Intangible assets, net154 154 
Other assets13 12 
Total assets$6,614 $6,563 
Liabilities and shareholders’ equity
Current liabilities:
Accounts payable$21 $20 
Accrued expenses and other current liabilities101 90 
Accrued compensation and benefits45 48 
Borrowings under credit facilities42 37 
Deferred revenue49 44 
Lease liabilities, current portion29 31 
Total current liabilities287 270 
Lease liabilities, net of current portion133 139 
Convertible senior notes1,661 1,660 
Other long-term liabilities13 12 
Total liabilities2,094 2,081 
Shareholders’ equity:
Class A common stock
— — 
Class B common stock
— — 
Class C capital stock
— — 
Additional paid-in capital6,157 6,109 
Accumulated other comprehensive loss(3)(15)
Accumulated deficit(1,634)(1,612)
Total shareholders’ equity4,520 4,482 
Total liabilities and shareholders’ equity$6,614 $6,563 


ZILLOW GROUP, INC.
UNAUDITED CONDENSED CONSOLIDATED STATEMENTS OF OPERATIONS
(in millions, except share data, which are presented in thousands, and per share data)
 Three Months Ended
March 31,
 20232022
Revenue$469 $536 
Cost of revenue (1)92 92 
Gross profit377 444 
Operating expenses:
Sales and marketing (1) 156 174 
Technology and development (1)137 108 
General and administrative (1)123 112 
Impairment and restructuring costs14 
Total operating expenses422 408 
Income (loss) from continuing operations(45)36 
Other income32 
Interest expense(9)(8)
Income (loss) from continuing operations before income taxes(22)30 
Income tax expense— (5)
Net income (loss) from continuing operations(22)25 
Net loss from discontinued operations, net of income taxes— (9)
Net income (loss)$(22)$16 
Net income (loss) from continuing operations per share:
Basic$(0.09)$0.10 
Diluted$(0.09)$0.10 
Net income (loss) per share:
Basic$(0.09)$0.06 
Diluted$(0.09)$0.06 
Weighted-average shares outstanding:
Basic234,425 248,542 
Diluted234,425 265,945 
(1) Includes share-based compensation expense as follows:
Cost of revenue$$
Sales and marketing16 11 
Technology and development39 28 
General and administrative44 35 
Share-based compensation - continuing operations$103 $77 
Adjusted EBITDA (2)$104 $166 
(2) Adjusted EBITDA is a non-GAAP financial measure; it is not calculated or presented in accordance with U.S. generally accepted accounting principles, or GAAP. See Exhibit 99.1 for more information regarding our presentation of Adjusted EBITDA and for a reconciliation of Adjusted EBITDA to net income (loss), the most directly comparable GAAP financial measure, for each of the periods presented. Adjusted EBITDA excludes the impact of discontinued operations.


ZILLOW GROUP, INC.
UNAUDITED CONDENSED CONSOLIDATED STATEMENTS OF CASH FLOWS
(in millions)
 Three Months Ended
March 31,
 20232022
Operating activities
Net income (loss)$(22)$16 
Adjustments to reconcile net income (loss) to net cash provided by operating activities:
Depreciation and amortization40 43 
Share-based compensation103 91 
Amortization of right of use assets
Amortization of contract cost assets
Amortization of debt discount and debt issuance costs23 
Loss on extinguishment of debt— 14 
Other adjustments to reconcile net income (loss) to cash provided by operating activities (2)
Changes in operating assets and liabilities:
Accounts receivable(3)56 
Mortgage loans held for sale(7)14 
Inventory— 3,414 
Prepaid expenses and other assets(27)(247)
Contract cost assets(6)(4)
Lease liabilities(8)(9)
Accounts payable— 
Accrued expenses and other current liabilities10 (43)
Accrued compensation and benefits(3)(6)
Deferred revenue
Other long-term liabilities— 
Net cash provided by operating activities93 3,392 
Investing activities
Proceeds from maturities of investments433 — 
Purchases of investments(490)(525)
Purchases of property and equipment(31)(33)
Purchases of intangible assets(9)(5)
Net cash used in investing activities(97)(563)
Financing activities
Repayments of borrowings on credit facilities— (2,205)
Net borrowings (repayments) on warehouse line of credit and repurchase agreements(25)
Repurchases of Class A common stock and Class C capital stock(86)(348)
Settlement of long-term debt— (439)
Proceeds from exercise of stock options13 36 
Net cash used in financing activities(68)(2,981)
Net decrease in cash, cash equivalents and restricted cash during period(72)(152)
Cash, cash equivalents and restricted cash at beginning of period1,468 2,838 
Cash, cash equivalents and restricted cash at end of period$1,396 $2,686 
Supplemental disclosures of cash flow information
Noncash transactions:
Capitalized share-based compensation$18 $10 
Write-off of fully depreciated property and equipment18 
Write-off of fully amortized intangible assets168 
Recognition of operating right of use assets and lease liabilities— 16 


Non-GAAP Net Income per Share
Our presentation of non-GAAP net income per share excludes the impact of the results of discontinued operations, share-based compensation, impairment and restructuring costs and income taxes. This measure is not a key metric used by our management and board of directors to measure operating performance or otherwise manage the business. However, we provide non-GAAP net income per share as supplemental information to investors, as we believe the exclusion of the results of discontinued operations, share-based compensation, impairment and restructuring costs and income taxes facilitates investors’ operating performance comparisons on a period-to-period basis. You should not consider non-GAAP net income per share in isolation or as a substitute for analysis of our results as reported under GAAP.

The following table sets forth a reconciliation of non-GAAP net income, adjusted, to net income (loss), as reported on a GAAP basis, and the calculation of non-GAAP net income per share - basic and diluted, for each of the periods presented (in millions, except share data, which are presented in thousands, and per share data, unaudited):
Three Months Ended
March 31,
 20232022
Net income (loss), as reported
$(22)$16 
Loss from discontinued operations, net of income taxes— 
Share-based compensation103 77 
Impairment and restructuring costs14 
Income taxes— 
Net income, adjusted$87 $121 
Non-GAAP net income per share:
Basic$0.37 $0.49 
Diluted$0.35 $0.44 
Weighted-average shares outstanding:
Basic234,425 248,542 
Diluted262,665 285,817 
Diluted non-GAAP net income per share for the periods presented is calculated using diluted weighted-average shares outstanding, which includes potential shares of Class A common stock and Class C capital stock for the periods in which their effect would have been dilutive. The potential shares of Class A common stock and Class C capital stock were excluded from the calculation of non-GAAP net income per share for certain periods presented if their effect would have been antidilutive. The following table reconciles the denominators used in the basic and diluted non-GAAP net income per share calculations (in thousands, unaudited):
Three Months Ended
March 31,
 20232022
Denominator for basic calculation234,425 248,542 
Effect of dilutive securities:
     Option awards1,264 2,558 
     Unvested restricted stock units1,529 862 
Convertible senior notes due in 2024, 2025 and 202625,447 33,855 
          Denominator for dilutive calculation262,665 285,817 


Key Metrics
The following table presents our visits and average monthly unique users for each of the periods presented (in millions, except percentages):
 Three Months Ended
March 31,
2022 to 2023
% Change
 20232022
Visits (1)2,487 2,627 (5)%
Average monthly unique users (2)212 211 —%
(1) Visits includes visits to the Zillow, Trulia and StreetEasy mobile apps and websites. We measure Zillow and StreetEasy visits with Google Analytics and Trulia visits with Adobe Analytics.
(2) Zillow, StreetEasy and HotPads measure unique users with Google Analytics, and Trulia measures unique users with Adobe Analytics.

The following table presents loan origination volume by purpose and in total for Zillow Home Loans for the periods presented (in millions, except percentages):
Three Months Ended
March 31,
2022 to 2023
% Change
20232022
Purchase loan origination volume$259 $123 111%
Refinance loan origination volume578 (99)%
Total loan origination volume$262 $701 (63)%


May 3, 2023 Dear Shareholders, 2023 is a critical year for Zillow, and today, we can share how pleased we are with how we’ve started the year 1 . Zillow’s Q1 results included total revenue of $469 million, GAAP net loss of $22 million, and Adjusted EBITDA 2 of $104 million, with revenue and Adjusted EBITDA surpassing the top end of our outlook ranges. This outperformance is due to a combination of the work we’ve done since reorienting the company in early 2022 and favorable relative tailwinds in a tough housing environment. The numerous incremental changes we have made are adding up to make an impact on our business. Year-over-year Residential revenue outpaced the broader real estate market by 1,300 basis points as measured by total industry transaction dollars 3 , and we expect that trend to continue in Q2. The inherent profit leverage in our business model was demonstrated in Q1 by our Adjusted EBITDA outperformance. We couple these results with a strong balance sheet, ending the quarter with $3.4 billion in cash and short-term investments, after buying back $86 million of stock during the quarter. THE TECH LANDSCAPE The past few months have marked a tectonic shift in the broader technology landscape with the introduction of OpenAI’s ChatGPT-4. The arrival of conversational generative artificial intelligence (AI) may be a platform shift on par with the introduction of the graphical user interface or the touch interface on the first smartphones. AI, machine learning, computer vision, and the use of data have been core to Zillow since our earliest days. Our AI journey started in 2006 with the invention of the Zestimate, which was enabled by massive amounts of data and a machine-learning algorithm. 3 National Association of REALTORS® existing homes sold during Q1 2023 multiplied by the average selling price per home for Q1 2023, compared to the same period in 2022. 2 Adjusted EBITDA is a non-GAAP financial measure; it is not calculated or presented in accordance with GAAP. Please see the “Use of Non-GAAP Financial Measures” section below for more information about our presentation of Adjusted EBITDA, including a reconciliation to the most directly comparable GAAP financial measure, which is net income (loss) for the relevant period. 1 https://www.zillowgroup.com/first-quarter-2023-media-coverage-highlights/ 1 | Q1 2023


Advancements in our Neural Zestimate 4 , computer-vision-powered rich media experiences 5 , AI-generated immersive floor plans 6 , and natural language search 7 queries are four more recent examples of how these capabilities show up in our products and services today. ChatGPT, and now Google’s Bard℠ tool and Microsoft’s new Bing, have brought AI into the mainstream for us all to interact with. Yesterday, we launched 8 an alpha-version plugin to power Zillow real estate searches on ChatGPT — it’s a small sandbox in which we will learn and iterate rapidly. Ultimately, we believe Zillow is well positioned for whatever disruption will come, and we’re excited and confident in our ability to harness its power to drive growth. Delivering innovative products that empower, entertain, and engage our customers has earned us our position as the leading real estate app and website in the U.S. according to Comscore. The customer is our North Star, and from our perspective, the product itself is the most important marketing tool we have to capture the customer’s imagination. Today, more than 80% of our traffic comes to us directl y 9 . That is rare — and very good. We believe the direct, branded relationship we have with our customers will help us into the future. We own our customer demand, and for many years, we have been laying the groundwork to serve those customers throughout the end-to-end real estate transaction process. We also believe conversational AI has the potential to improve our customer and partner experiences, meaningfully increase the productivity of our workforce and the velocity of our output, and ultimately drive growth for both Zillow and our partners’ businesses. GROWTH STRATEGY As you all know, a few years ago we embarked on a new frontier: the tech-enablement of the real estate transaction itself. Our 9 Zillow internal estimates. 8 https://investors.zillowgroup.com/investors/news-and-events/news/news-details/2023/Zillow-builds-ChatGPT -plugin-for-real-estate-searches/default.aspx 7 https://zillow.mediaroom.com/2023-01-26-Zillows-new-AI-powered-natural-language-search-is-a-first-in-re al-estate 6 https://www.zillow.com/z/3d-home/floor-plans/ 5 https://zillow.mediaroom.com/2022-08-08-Zillows-AI-powered-interactive-home-tours-are-now-available-n ationwide 4 https://www.zillow.com/tech/building-the-neural-zestimate/ 2 | Q1 2023


growth investments are focused on improving the transaction experience, so we can not only help people search and find their homes, but also help them buy, sell, finance and rent, and ultimately, get into their next home with more ease, transparency and efficiency than ever before. This strategy of shifting our focus down-funnel to the transaction is manifested in our vision for what we call a housing super app — an integrated experience to help our customers move. Our goal is to increase engagement, customer transactions, and revenue per customer transaction by investing across five growth pillars: touring, financing, seller solutions, enhancing our partner network, and integrating our services. The expected output of this strategy is to grow our share of customer transactions from 3% to 6% by the end of 2025 10 . We are obviously excited about all the tech-enabled solutions we’re building to improve the gnarly process of moving, but we are clear-eyed about the importance of connecting that technology to our critical partners in the physical world, as well as the physical homes and apartments that are available for sale or rent. Rich, smart integration within our ecosystem is crucial to our housing super app vision — be it connecting with the Premier Agent partner that tours homes with you after you “book it with Showingtime,” or working with the Zillow Home Loans officer who secures your mortgage. This year is all about execution as we steadily roll out products across our five growth pillars. As we bring this seamless, connected experience to various markets throughout the country, we’ve started with Raleigh, Denver, Atlanta, and Phoenix, where we are seeing the early results of the big bets on our product road map. TOURING Stepping into a home, whether virtually or in person, is the “point of sale” moment when dreamers turn into transactors. Our data shows that movers who request a tour convert to buyers at three times the rate of other actions on Zillow. 10 Please see the “Use of Operating Metrics” section below for additional information about our calculations of customer transactions and share of customer transactions. 3 | Q1 2023


Enabled by ShowingTime’s integration with Zillow, real-time touring allows eligible buyers to get a tour confirmed in less than an hour and with much less friction. In February, we shared the early results we were seeing with real-time touring in Atlanta, including higher connection rates and increased customer propensity to work with our Premier Agent partners. Those trends have continued in Atlanta, along with meaningful improvement in tour fulfillment rates and early indications of higher transaction rates. We have now rolled out real-time touring in our three other enhanced markets: Raleigh, Denver, and Phoenix. Combined with the other initiatives we’re driving in our enhanced markets, real-time touring is helping improve our funnel, driving meaningful improvements in our ability to connect higher-intent customers to our Premier Agent partners. ENHANCING OUR PARTNER NETWORK Premier Agent partners are critical to delivering the integrated experience we envision, and helping our customers find and win their next home also helps agents grow their businesses. We are holding ourselves accountable to connect higher-intent customers to our Premier Agent partners, and we are holding our Premier Agent partners accountable to higher performance standards as well. Across all four enhanced markets, we have meaningfully consolidated our partner network, focusing on Premier Agent partners who most effectively convert leads into transactions, who treat our customers best, and who are motivated to grow their businesses alongside us. With this select group of partners, we can work more closely to deliver a brand-aligned experience to our shared customers, quickly test new products and services, and evaluate in real time how things are going before we scale. Most importantly, we are seeing improvements in customer satisfaction and engagement as we connect customers with our strongest partners in each market. FINANCING We’re building the foundation for a substantial direct-to-consumer purchase mortgage origination business. This 4 | Q1 2023


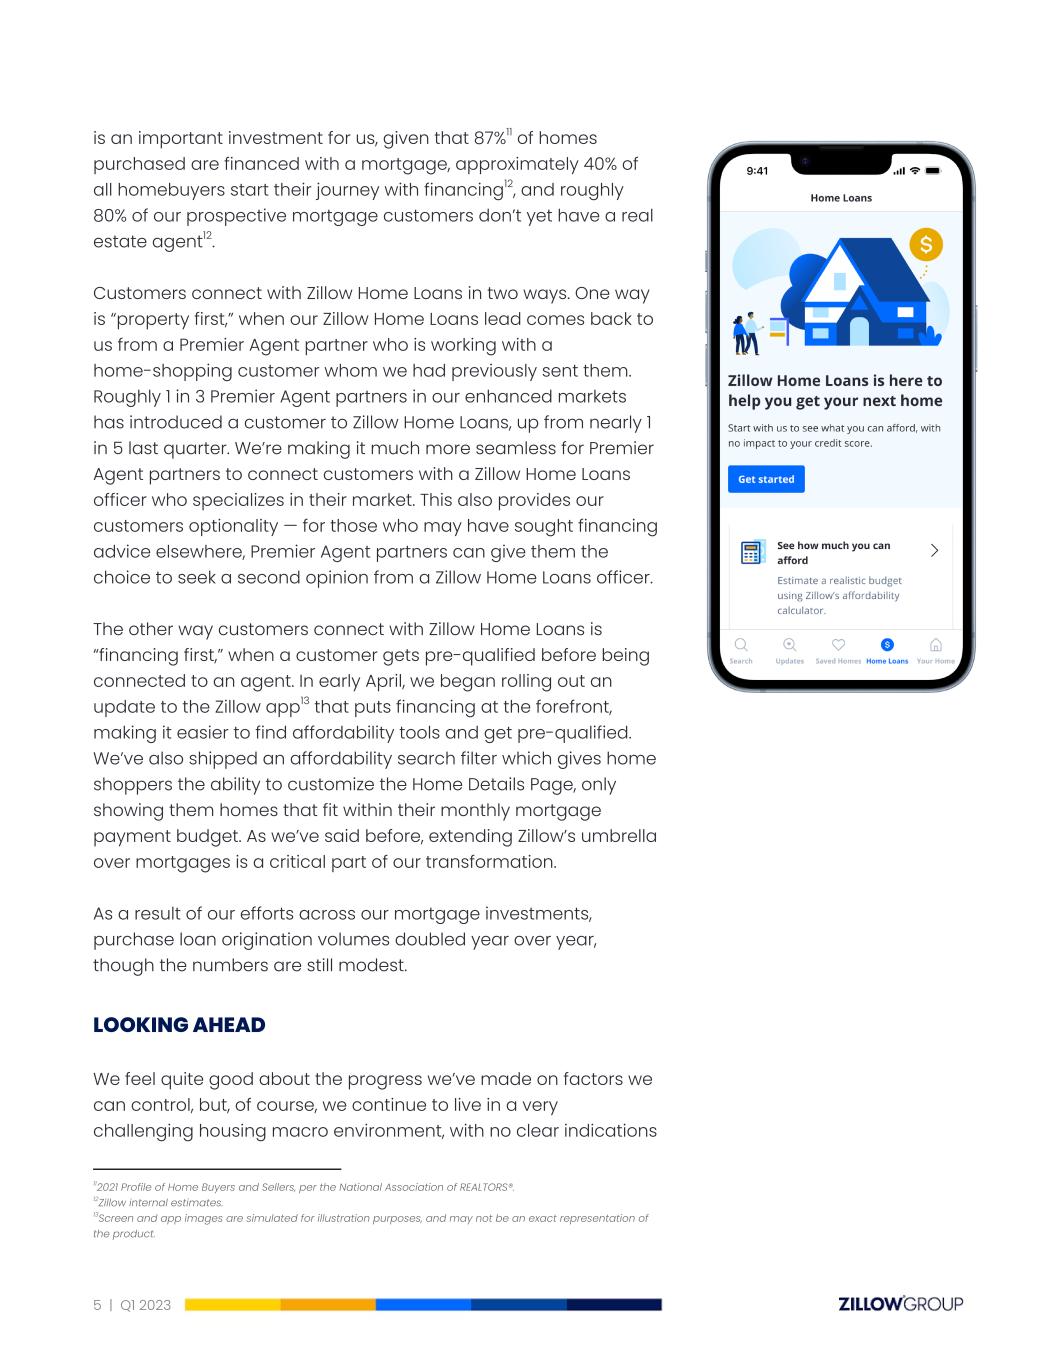
is an important investment for us, given that 87% 11 of homes purchased are financed with a mortgage, approximately 40% of all homebuyers start their journey with financing 12 , and roughly 80% of our prospective mortgage customers don’t yet have a real estate agent 12 . Customers connect with Zillow Home Loans in two ways. One way is “property first,” when our Zillow Home Loans lead comes back to us from a Premier Agent partner who is working with a home-shopping customer whom we had previously sent them. Roughly 1 in 3 Premier Agent partners in our enhanced markets has introduced a customer to Zillow Home Loans, up from nearly 1 in 5 last quarter. We’re making it much more seamless for Premier Agent partners to connect customers with a Zillow Home Loans officer who specializes in their market. This also provides our customers optionality — for those who may have sought financing advice elsewhere, Premier Agent partners can give them the choice to seek a second opinion from a Zillow Home Loans officer. The other way customers connect with Zillow Home Loans is “financing first,” when a customer gets pre-qualified before being connected to an agent. In early April, we began rolling out an update to the Zillow app 13 that puts financing at the forefront, making it easier to find affordability tools and get pre-qualified. We’ve also shipped an affordability search filter which gives home shoppers the ability to customize the Home Details Page, only showing them homes that fit within their monthly mortgage payment budget. As we’ve said before, extending Zillow’s umbrella over mortgages is a critical part of our transformation. As a result of our efforts across our mortgage investments, purchase loan origination volumes doubled year over year, though the numbers are still modest. LOOKING AHEAD We feel quite good about the progress we’ve made on factors we can control, but, of course, we continue to live in a very challenging housing macro environment, with no clear indications 13 Screen and app images are simulated for illustration purposes, and may not be an exact representation of the product. 12 Zillow internal estimates. 11 2021 Profile of Home Buyers and Sellers, per the National Association of REALTORS®. 5 | Q1 2023


of a turn. Transactions continue to be low. A high demand to move supports a stable pricing environment, but to a degree, high rates have locked sellers into their existing low-rate mortgages. Though we see record new inventory on the way, it will take some time for supply and demand to balance out. And, while we may see rates come down at any time, we are certainly not counting on it. Meanwhile, we are well capitalized, generating positive operating cash flow, and heads-down making progress on our growth plans. To close, we are pleased to have started the year with solid Q1 results. Moving forward, we have a lot of work to do to drive outsize gains in our share of customer transactions, and we are focused on serving our customers by delivering on our product road map and doing our part to bring more ease, security, transparency and efficiency to real estate. We appreciate you all being on the journey with us. Sincerely, Rich Barton Co-founder & CEO Allen Parker CFO 6 | Q1 2023


First-Quarter 2023 Highlights Zillow Group’s first-quarter results exceeded our outlook for both revenue and Adjusted EBITDA. ● Q1 revenue was $469 million, above the midpoint of our outlook range by $48 million. ○ Residential revenue decrea sed 14% year over year to $361 million, driven primarily by lower Premier Agent revenue as a result of weakness in the overall housing market that saw total industry transaction dollars decline 27% year over year. Residential revenue outperformed the industry and the high end of our outlook range, driven by the strength of our brand, a better-than-expected n umber of connections provided to our Premier Agent partners, and favorable relative macro tailwinds. ■ Premier Agent revenue decreased 16% year over year, outperforming our expectation of a 23% to 28% decrease in Q1. ○ Rentals revenue increased 21% year over year to $74 million as we continued to see strong traffic and growth in multifamily properties. ○ Mortgages revenue was $26 million, a decrease of 43% due to higher interest rates that slowed refinance activity and impacted revenue for both our mortgage marketplace and Zillow Home Loans. ● On a GAAP basis, net loss was $22 million in Q1. ● Q1 Adjusted EBITDA was $104 million, $48 million above the midpoint of our outlook range, driven primarily by higher-than-anticipated revenue from Premier Agent. ● Cash and short-term investments were $3.4 billion at the end of Q1, flat from the end of 2022, after $86 million in share repurchases in Q1. As of the end of Q1, $414 million remained under our total repurchase authorizations of $1.8 billion. Convertible debt was $1.7 billion at the end of Q1. ● Traffic to Zillow Group’s mobile apps and websites in Q1 was 212 million average monthly unique users, flat year over year. Visits during Q1 were 2.5 billion, down 5% year over year. 7 | Q1 2023


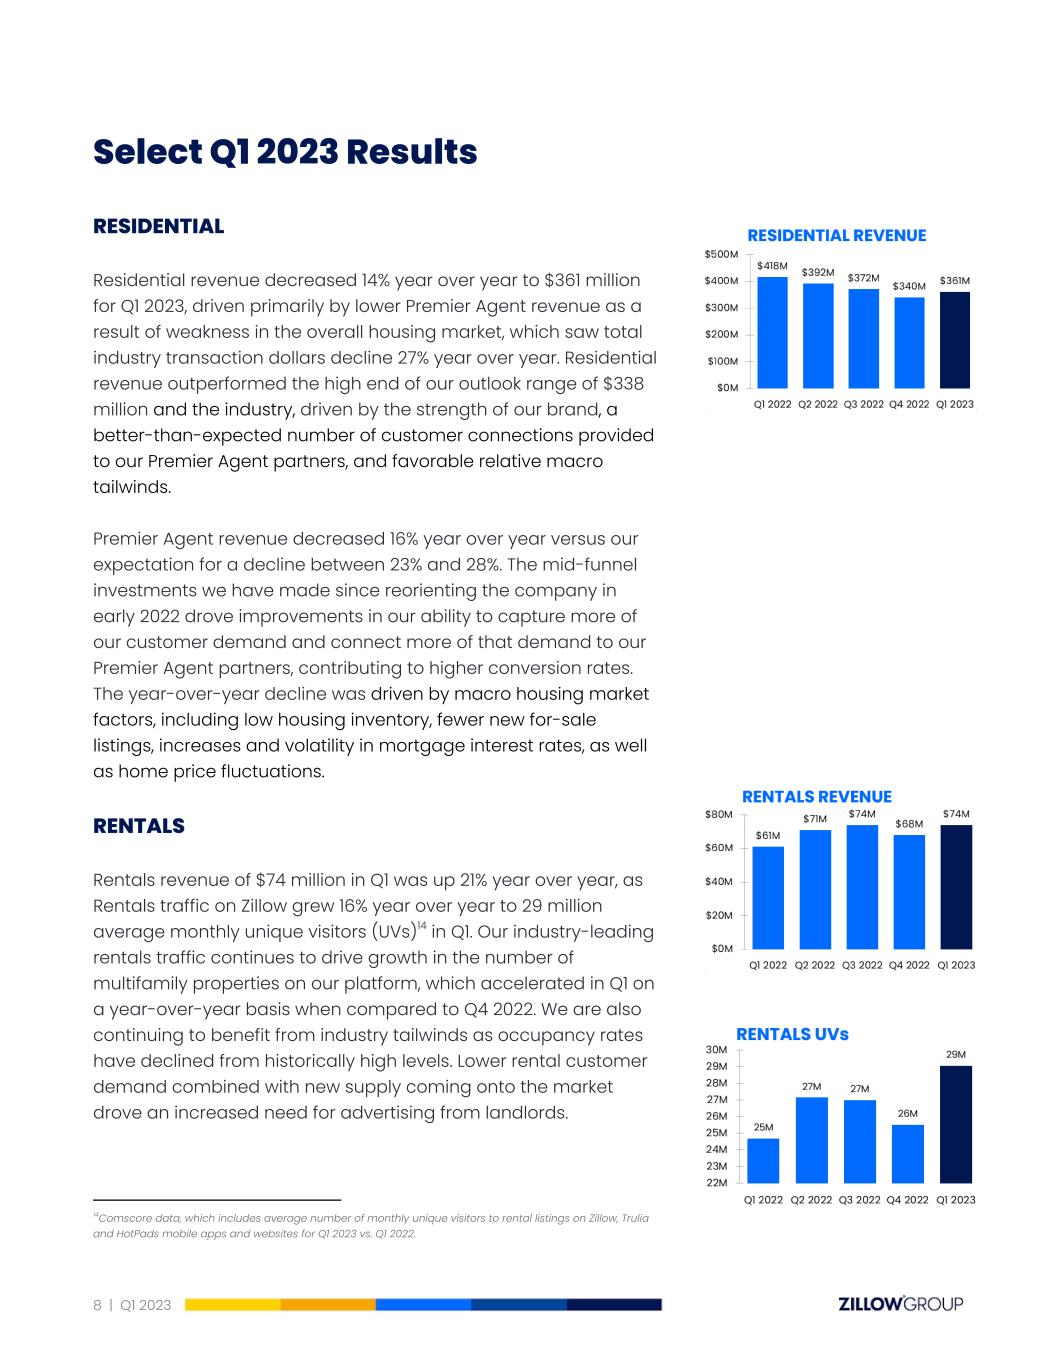
Select Q1 2023 Results RESIDENTIAL Residential revenue decreased 14% year over year to $361 million for Q1 2023, driven primarily by lower Premier Agent revenue as a result of weakness in the overall housing market, which saw total industry transaction dollars decline 27% year over year. Residential revenue outperformed the high end of our outlook range of $338 million and the industry, driven by the strength of our brand , a better-than-expected number of customer connections provided to our Premier Agent partners, and favorable relative macro tailwinds. Premier Agent revenue decreased 16% year over year versus our expectation for a decline between 23% and 28%. The mid-funnel investments we have made since reorienting the company in early 2022 drove improvements in our ability to capture more of our customer demand and connect more of that demand to our Premier Agent partners, contributing to higher conversion rates. The year-over-year decline was driven by macro housing market factors, including low housing inventory, fewer new for-sale listings, increases and volatility in mortgage interest rates, as well as home price fluctuations. RENTALS Rentals revenue of $74 million in Q1 was up 21% year over year, as Rentals traffic on Zillow gr ew 16% year over year to 29 mill ion average monthly unique visitors (UVs) 14 in Q1. Our industry-leading rentals traffic continues to drive growth in the number of multifamily properties on our platform, which accelerated in Q1 on a year-over-year basis when compared to Q4 2022. We are also continuing to benefit from industry tailwinds as occupancy rates have declined from historically high levels. Lower rental customer demand combined with new supply coming onto the market drove an increased need for advertising from landlords. 14 Comscore data, which includes average number of monthly unique visitors to rental listings on Zillow, Trulia and HotPads mobile apps and websites for Q1 2023 vs. Q1 2022. 8 | Q1 2023


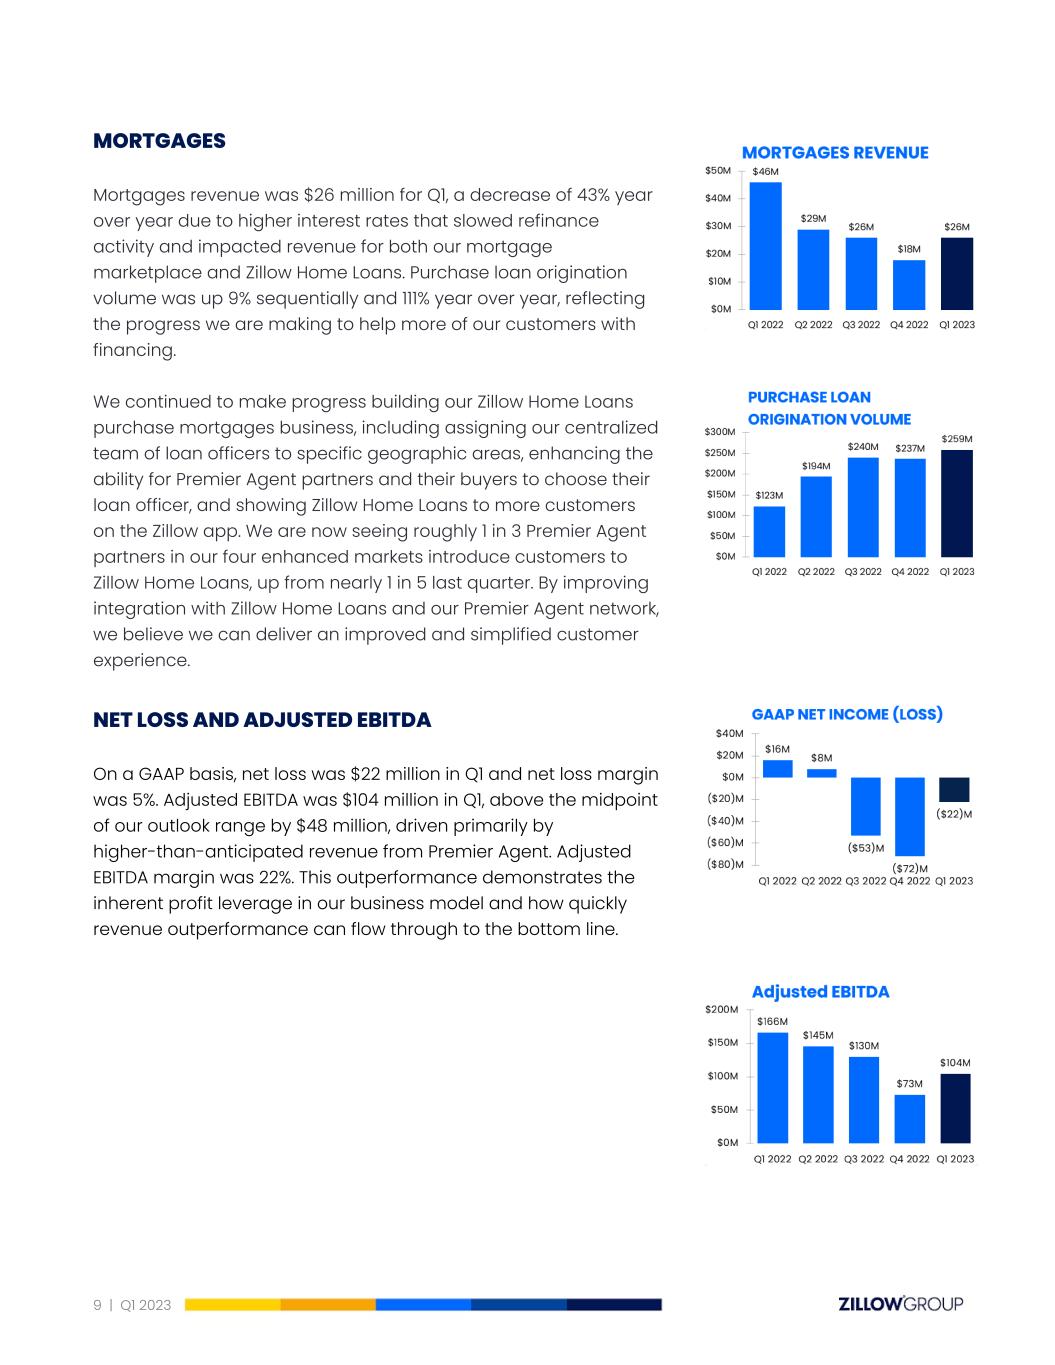
MORTGAGES Mortgages revenue was $26 million for Q1, a decrease of 43% year over year due to higher interest rates that slowed refinance activity and impacted revenue for both our mortgage marketplace and Zillow Home Loans. Purchase loan origination volume was up 9% sequentially and 111% year over year, reflecting the progress we are making to help more of our customers with financing. We continued to make progress building our Zillow Home Loans purchase mortgages business, including assigning our centralized team of loan officers to specific geographic areas, enhancing the ability for Premier Agent partners and their buyers to choose their loan officer, and showing Zillow Home Loans to more customers on the Zillow app. We are now seeing roughly 1 in 3 Premier Agent partners in our four enhanced markets introduce customers to Zillow Home Loans, up from nearly 1 in 5 last quarter. By improving integration with Zillow Home Loans and our Premier Agent network, we believe we can deliver an improved and simplified customer experience. NET LOSS AND ADJUSTED EBITDA On a GAAP basis, net loss was $22 million in Q1 and net loss margin was 5%. Adjusted EBITDA was $104 million in Q1, above the midpoint of our outlook range by $48 million, driven primarily by higher-than-anticipated revenue from Premier Agent. Adjusted EBITDA margin was 22%. This outperformance demonstrates the inherent profit leverage in our business model and how quickly revenue outperformance can flow through to the bottom line. 9 | Q1 2023


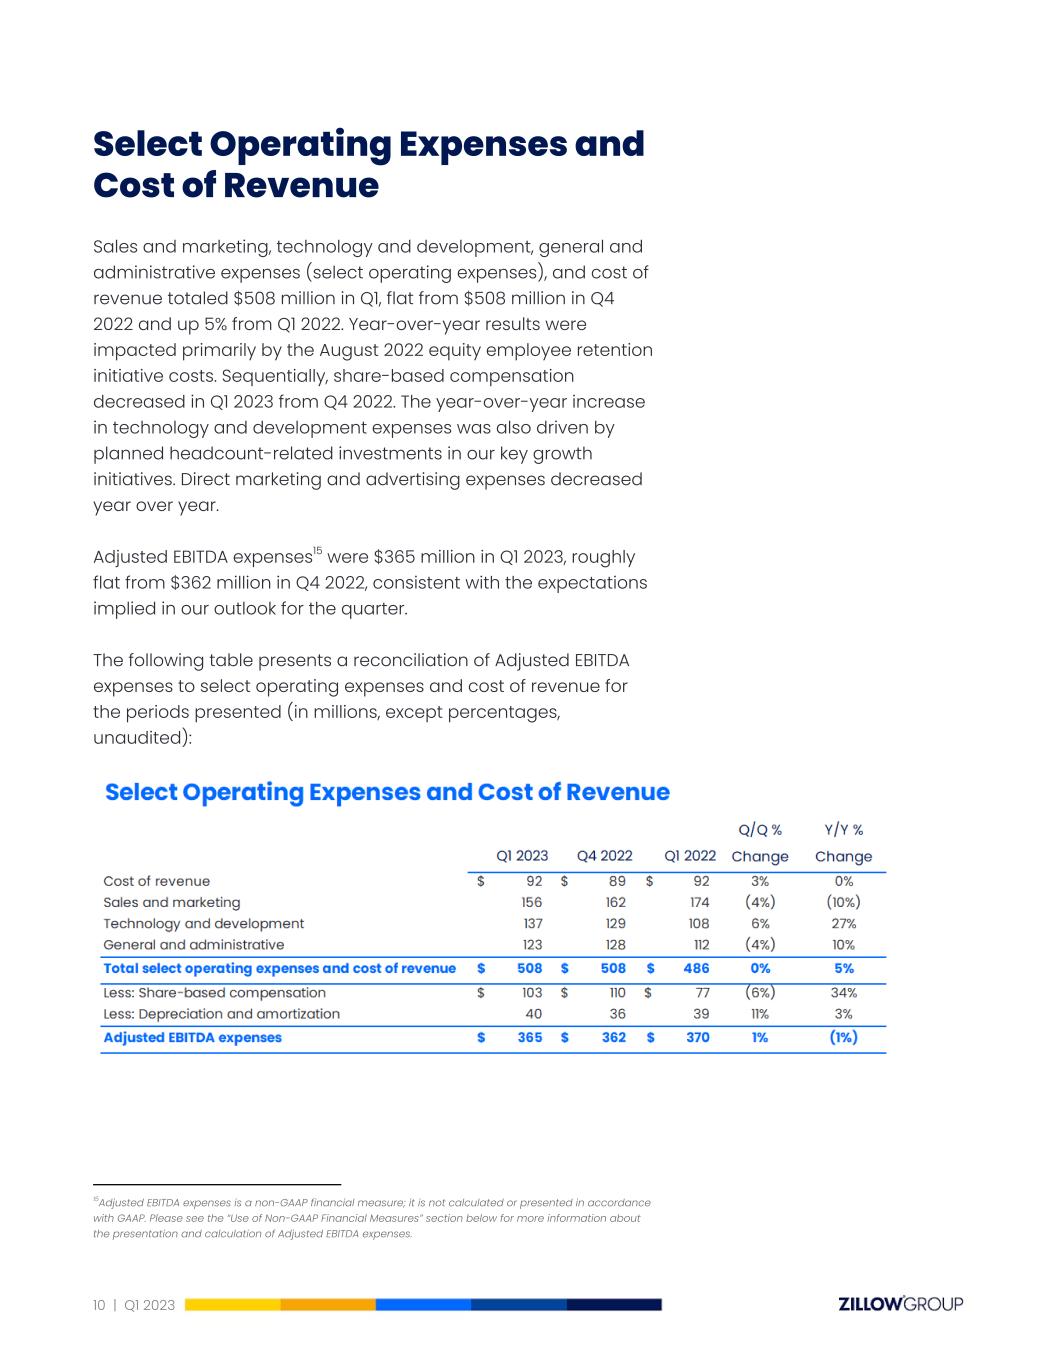
Select Operating Expenses and Cost of Revenue Sales and marketing, technology and development, general and administrative expenses (select operating expenses), and cost of revenue totaled $508 million in Q1, flat from $508 million in Q4 2022 and up 5% from Q1 2022. Year-over-year results were impacted primarily by the August 2022 equity employee retention initiative costs. Sequentially, share-based compensation decreased in Q1 2023 from Q4 2022. The year-over-year increase in technology and development expenses was also driven by planned headcount-related investments in our key growth initiatives. Direct marketing and advertising expenses decreased year over year. Adjusted EBITDA expenses 15 were $365 million in Q1 2023, roughly flat from $362 million in Q4 2022, consistent with the expectations implied in our outlook for the quarter. The following table presents a reconciliation of Adjusted EBITDA expenses to select operating expenses and cost of revenue for the periods presented (in millions, except percentages, unaudited): 15 Adjusted EBITDA expenses is a non-GAAP financial measure; it is not calculated or presented in accordance with GAAP. Please see the “Use of Non-GAAP Financial Measures” section below for more information about the presentation and calculation of Adjusted EBITDA expenses. 10 | Q1 2023


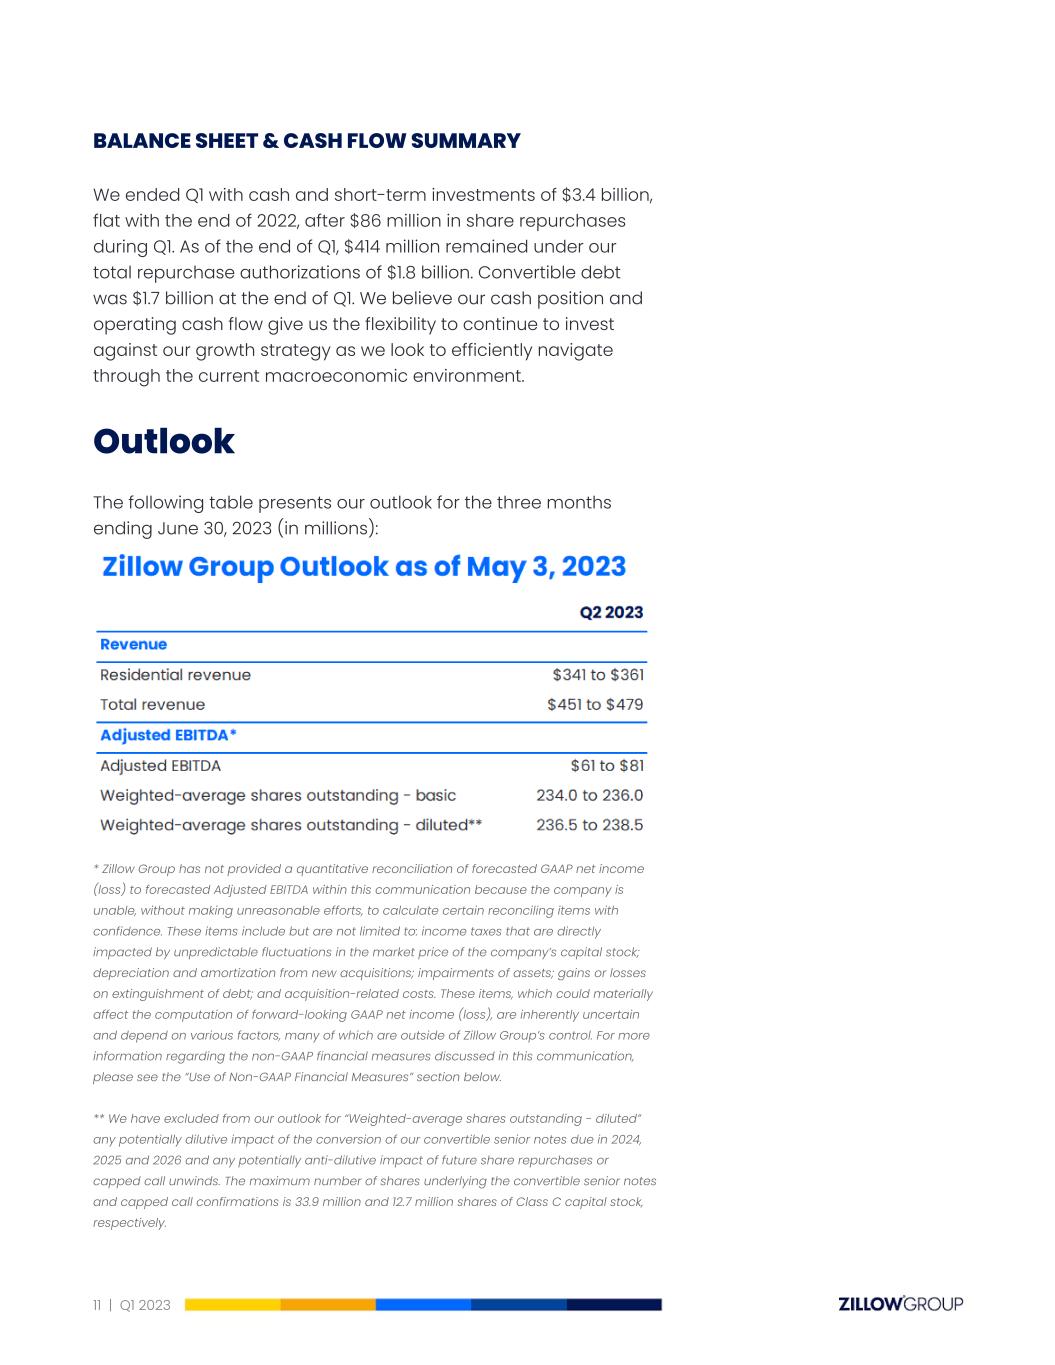
BALANCE SHEET & CASH FLOW SUMMARY We ended Q1 with cash and short-term investments of $3.4 billion, flat with the end of 2022, after $86 million in share repurchases during Q1. As of the end of Q1, $414 million remained under our total repurchase authorizations of $1.8 billion. Convertible debt was $1.7 billion at the end of Q1. We believe our cash position and operating cash flow give us the flexibility to continue to invest against our growth strategy as we look to efficiently navigate through the current macroeconomic environment. Outlook The following table presents our outlook for the three months ending June 30, 2023 (in millions): * Zillow Group has not provided a quantitative reconciliation of forecasted GAAP net income (loss) to forecasted Adjusted EBITDA within this communication because the company is unable, without making unreasonable efforts, to calculate certain reconciling items with confidence. These items include but are not limited to: income taxes that are directly impacted by unpredictable fluctuations in the market price of the company’s capital stock; depreciation and amortization from new acquisitions; impairments of assets; gains or losses on extinguishment of debt; and acquisition-related costs. These items, which could materially affect the computation of forward-looking GAAP net income (loss), are inherently uncertain and depend on various factors, many of which are outside of Zillow Group’s control. For more information regarding the non-GAAP financial measures discussed in this communication, please see the “Use of Non-GAAP Financial Measures” section below. ** We have excluded from our outlook for “Weighted-average shares outstanding - diluted” any potentially dilutive impact of the conversion of our convertible senior notes due in 2024, 2025 and 2026 and any potentially anti-dilutive impact of future share repurchases or capped call unwinds. The maximum number of shares underlying the convertible senior notes and capped call confirmations is 33.9 million and 12.7 million shares of Class C capital stock, respectively. 11 | Q1 2023


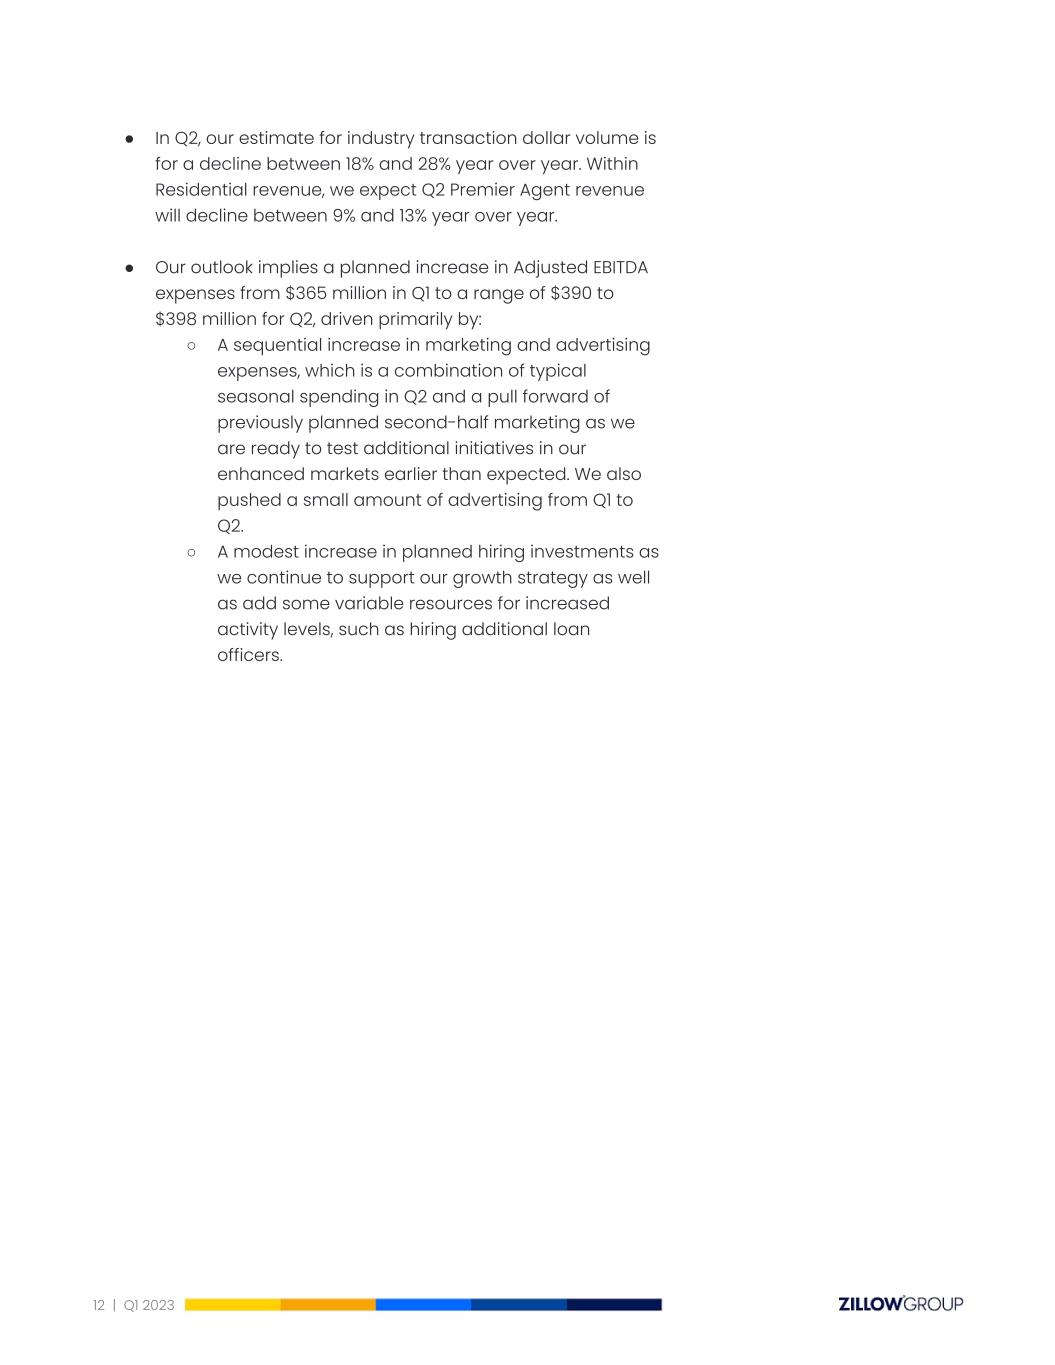
● In Q2, our estimate for industry transaction dollar volume is for a decline between 18% and 28% year over year. Within Residential revenue, we expect Q2 Premier Agent revenue will decline between 9% and 13% year over year. ● Our outlook implies a planned increase in Adjusted EBITDA expenses from $365 million in Q1 to a range of $390 to $398 million for Q2, driven primarily by: ○ A sequential increase in marketing and advertising expenses, which is a combination of typical seasonal spending in Q2 and a pull forward of previously planned second-half marketing as we are ready to test additional initiatives in our enhanced markets earlier than expected. We also pushed a small amount of advertising from Q1 to Q2. ○ A modest increase in planned hiring investments as we continue to support our growth strategy as well as add some variable resources for increased activity levels, such as hiring additional loan officers. 12 | Q1 2023


Forward-Looking Statements This communication contains forward-looking statements within the meaning of Section 27A of the Securities Act of 1933 and Section 21E of the Securities Exchange Act of 1934 that involve risks and uncertainties, including, without limitation, statements regarding our future targets, the future performance and operation of our business, the current and future health and stability of the residential housing market and economy, volatility of mortgage interest rates, and our expectations regarding future shifts in behavior by consumers and employees. Statements containing words such as “may,” “believe,” “anticipate,” “expect,” “intend,” “plan,” “project,” “predict,” “will,” “projections,” “continue,” “estimate,” “outlook,” “guidance,” “would,” “could,” “strive,” or similar expressions constitute forward-looking statements. Forward-looking statements are made based on assumptions as of May 3, 2023, and although we believe the expectations reflected in the forward-looking statements are reasonable, we cannot guarantee these results. Differences in Zillow Group’s actual results from those described in these forward-looking statements may result from actions taken by Zillow Group as well as from risks and uncertainties beyond Zillow Group’s control. Factors that may contribute to such differences include, but are not limited to: the current and future health and stability of the economy and United States residential real estate industry, including changes in inflationary conditions, interest rates, housing availability and affordability, labor shortages and supply chain issues; our ability to manage advertising inventory and pricing and maintain relationships with our real estate partners; our ability to establish or maintain relationships with listing and data providers, which affects traffic to our mobile applications and websites; our ability to comply with current and future multiple listing service (“MLS”) rules and requirements; our ability to continue to innovate and compete successfully to attract customers and real estate partners; our ability to operate and grow Zillow Home Loans, our mortgage origination business, including the ability to obtain or maintain sufficient financing to fund its origination of mortgages, meet customers’ financing needs with its product offerings, continue to grow the origination business and resell originated mortgages on the secondary market; the duration and impact of natural disasters and other catastrophic events (including public health crises) on our ability to operate, demand for our products or services, or general economic conditions; our ability to maintain adequate security measures or technology systems, or those of third parties on which we rely, to protect data integrity and the information and privacy of our customers and other third parties; the impact of pending or future litigation and other disputes or enforcement actions; our ability to attract and retain a highly skilled workforce; acquisitions, investments, strategic partnerships, capital-raising activities, or other corporate transactions or commitments by us or our competitors; our ability to continue relying on third-party services to support critical functions of our business; our ability to protect and continue using our intellectual property and prevent others from copying, infringing upon, or developing similar intellectual property; our ability to comply with domestic and international laws, regulations, rules, contractual obligations, policies and other obligations, or to obtain or maintain required licenses to support our business and operations; our ability to pay debt, settle conversions of our convertible senior notes, or repurchase our convertible senior notes upon a fundamental change; our ability to raise additional capital or refinance on acceptable terms, or at all; actual or anticipated fluctuations in quarterly and annual results of operations and financial position; the assumptions, estimates and internal or third-party data that we use to calculate business, performance and operating metrics; and volatility of our Class A common stock and Class C capital stock prices. The foregoing list of risks and uncertainties is illustrative but not exhaustive. For more information about potential factors that could affect Zillow Group’s business and financial results, please review the “Risk Factors” described in Zillow Group’s Annual Report on Form 10-K for the fiscal year ended Dec. 31, 2022, and in future quarterly and annual reports. Except as may be required by law, Zillow Group does not intend and undertakes no duty to update this information to reflect future events or circumstances. 13 | Q1 2023


No Incorporation by Reference This communication includes website addresses and references to additional materials found on those websites, including Zillow Group’s websites. These websites and materials are not incorporated by reference herein or our other filings with the Securities and Exchange Commission. Use of Estimates and Statistical Data This communication includes estimates and other statistical data made by independent third parties and by Zillow Group relating to the housing market, connection, engagement, growth, and other data about Zillow Group’s performance and the residential real estate industry. These data involve a number of assumptions and limitations, which may significantly impair their accuracy, and you are cautioned not to give undue weight to such estimates. Projections, assumptions and estimates of future performance are necessarily subject to a high degree of uncertainty and risk. Use of Operating Metrics Zillow Group reviews a number of operating metrics to evaluate its business, measure performance, identify trends, formulate business plans, and make strategic decisions. This communication includes Customer Transactions and current share of Customer Transactions as a percentage of total transactions. Zillow Group uses these operating metrics on a periodic basis to evaluate and provide investors with insight into the performance of Zillow Group’s transaction-based lines of business, which currently include Premier Agent, Zillow Home Loans and Zillow Closing Services. Customer Transactions: Zillow Group calculates “Customer Transactions” as each unique purchase or sale transaction in which the homebuyer or seller uses Zillow Home Loans, Zillow Closing Services, and/or involves a Premier Agent with whom the buyer or seller connected through Zillow. In particular: • For Premier Agent, Zillow Group uses an internal approximation of the number of buy- and sell- side transactions that involve a Premier Agent with whom the buyer or seller connected through Zillow. Because of the challenges associated with measuring the conversion of connections to transactions outside of our Premier Agent Flex program, including reliance on the availability and quality of public records and data, these estimates may be inaccurate. • For Zillow Closing Services, Zillow Group counts each unique purchase or sale transaction in which the home buyer or seller uses Zillow Closing Services. • For Zillow Home Loans, Zillow Group counts each unique purchase or sale transaction in which the home buyer or seller uses Zillow Home Loans. Revenue Per Customer Transaction: Zillow Group calculates “Revenue Per Customer Transaction” as Premier Agent, Zillow Home Loans and Zillow Closing Services revenue divided by the number of Customer Transactions during the relevant period. Share of Customer Transactions: For purposes of estimating our historical share of customer transactions, Zillow Group assumed there were 12.2M buy and sell-side transactions in 2021, based on the estimated 6.1M home transactions reported by the National Association of REALTORS® in 2021. Use of Non-GAAP Financial Measures To provide investors with additional information regarding our financial results, this communication includes references to non-GAAP financial measures, including Adjusted EBITDA, Adjusted EBITDA margin and Adjusted EBITDA expenses. • Adjusted EBITDA Reconciliation We have provided a reconciliation below of Adjusted EBITDA to net income (loss), the most directly comparable U.S. generally accepted accounting principle (“GAAP”) financial measure. • Adjusted EBITDA Margin Reconciliation We have provided a reconciliation below of Adjusted EBITDA margin to net income (loss) margin, the most directly comparable GAAP financial measure. 14 | Q1 2023


• Adjusted EBITDA Expenses Reconciliation We have provided a reconciliation above of Adjusted EBITDA expenses to total select operating expenses and cost of revenue, the most directly comparable GAAP financial measure, and a calculation below of Adjusted EBITDA expenses calculated as revenue less Adjusted EBITDA. Adjusted EBITDA, Adjusted EBITDA margin and Adjusted EBITDA expenses are key metrics used by our management and board of directors to measure operating performance and trends and to prepare and approve our annual budget. In particular, the exclusion of certain expenses in calculating these measures facilitates operating performance comparisons on a period-to-period basis. Our use of non-GAAP financial measures has limitations as analytical tools, and you should not consider these measures in isolation or as a substitute for analysis of our results as reported under GAAP. Some of these limitations include, but are not limited to, the fact that such non-GAAP financial measures: • Do not reflect changes in, or cash requirements for, our working capital needs; • Do not reflect the results of discontinued operations; • Do not consider the potentially dilutive impact of share-based compensation; • Although depreciation and amortization are non-cash charges, the assets being depreciated and amortized may have to be replaced in the future, and Adjusted EBITDA, Adjusted EBITDA margin and Adjusted EBITDA expenses do not reflect cash capital expenditure requirements for such replacements or for new capital expenditures or contractual commitments; • Do not reflect impairment and restructuring costs; • Do not reflect interest expense or other income; • Do not reflect income taxes; and • Other companies, including companies in our own industry, may calculate these non-GAAP financial measures differently from the way we do, limiting their usefulness as comparative measures. Because of these limitations, you should consider Adjusted EBITDA, Adjusted EBITDA margin and Adjusted EBITDA expenses alongside other financial performance measures, including various cash-flow metrics, net income (loss), and our other GAAP results. 15 | Q1 2023


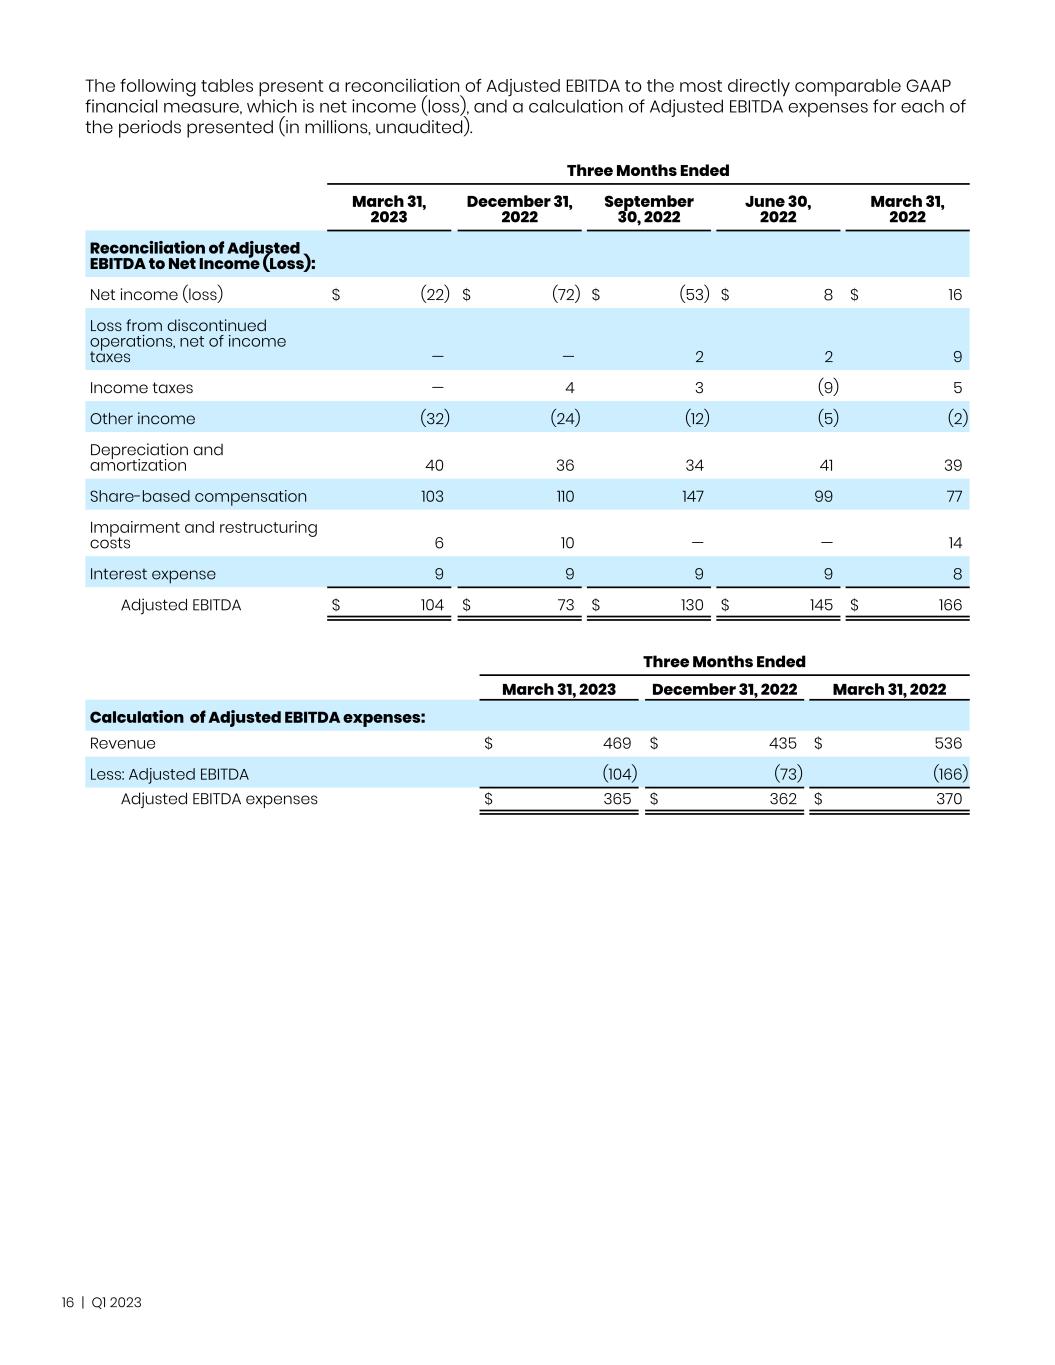
The following tables present a reconciliation of Adjusted EBITDA to the most directly comparable GAAP financial measure, which is net income (loss), and a calculation of Adjusted EBITDA expenses for each of the periods presented (in millions, unaudited). Three Months Ended March 31, 2023 December 31, 2022 September 30, 2022 June 30, 2022 March 31, 2022 Reconciliation of Adjusted EBITDA to Net Income (Loss): Net income (loss) $ (22) $ (72) $ (53) $ 8 $ 16 Loss from discontinued operations, net of income taxes — — 2 2 9 Income taxes — 4 3 (9) 5 Other income (32) (24) (12) (5) (2) Depreciation and amortization 40 36 34 41 39 Share-based compensation 103 110 147 99 77 Impairment and restructuring costs 6 10 — — 14 Interest expense 9 9 9 9 8 Adjusted EBITDA $ 104 $ 73 $ 130 $ 145 $ 166 Three Months Ended March 31, 2023 December 31, 2022 March 31, 2022 Calculation of Adjusted EBITDA expenses: Revenue $ 469 $ 435 $ 536 Less: Adjusted EBITDA (104) (73) (166) Adjusted EBITDA expenses $ 365 $ 362 $ 370 16 | Q1 2023


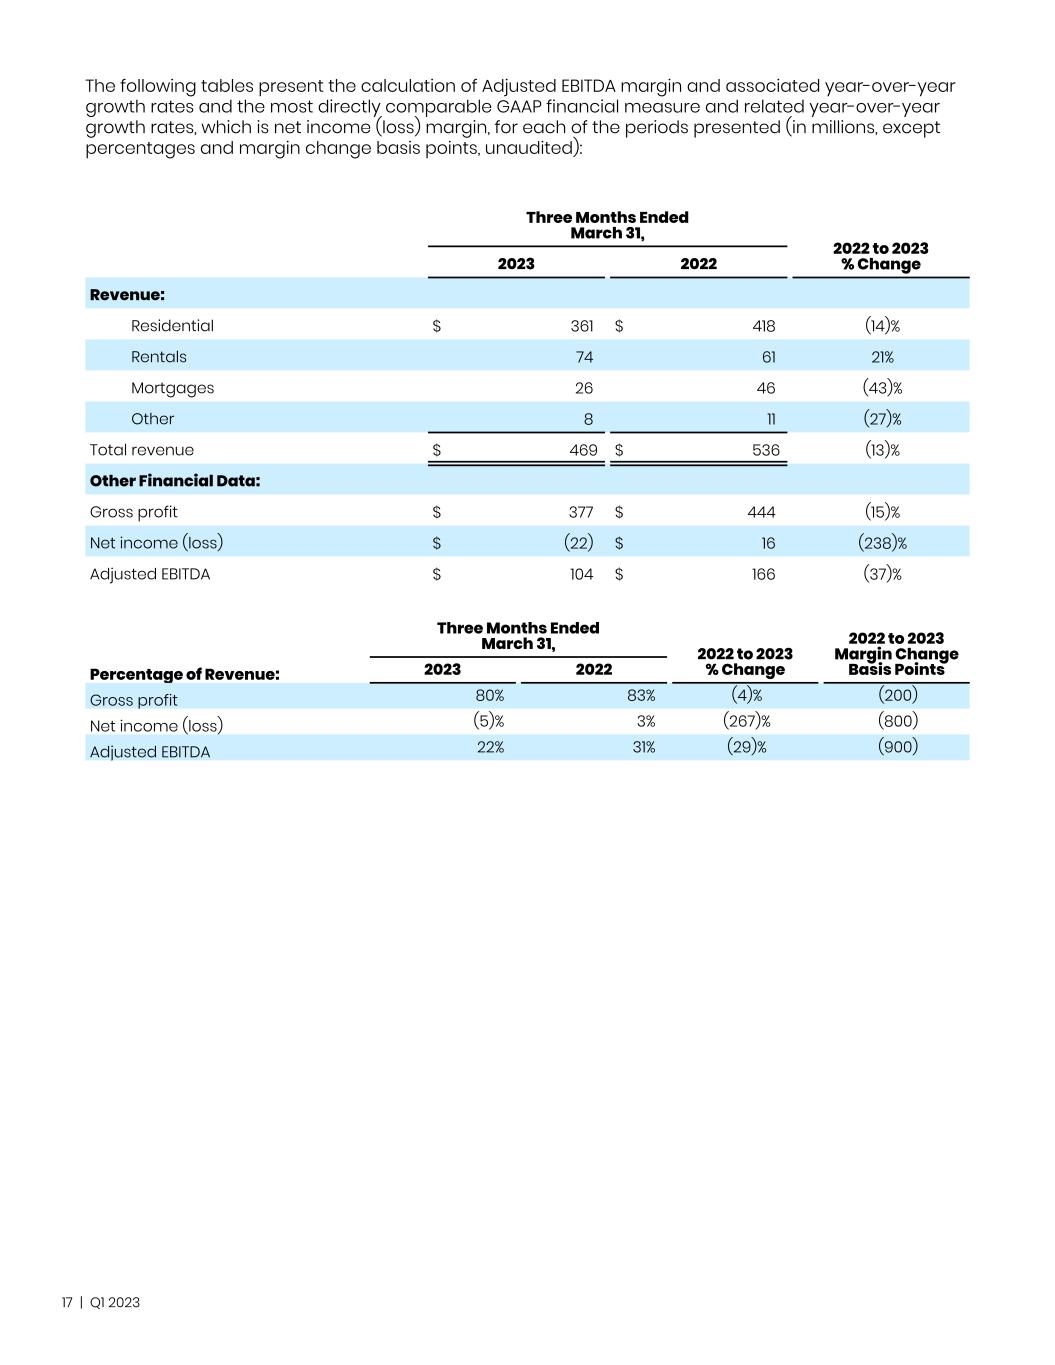
The following tables present the calculation of Adjusted EBITDA margin and associated year-over-year growth rates and the most directly comparable GAAP financial measure and related year-over-year growth rates, which is net income (loss) margin, for each of the periods presented (in millions, except percentages and margin change basis points, unaudited): Three Months Ended March 31, 2022 to 2023 % Change2023 2022 Revenue: Residential $ 361 $ 418 (14)% Rentals 74 61 21% Mortgages 26 46 (43)% Other 8 11 (27)% Total revenue $ 469 $ 536 (13)% Other Financial Data: Gross profit $ 377 $ 444 (15)% Net income (loss) $ (22) $ 16 (238)% Adjusted EBITDA $ 104 $ 166 (37)% Three Months Ended March 31, 2022 to 2023 % Change 2022 to 2023 Margin Change Basis PointsPercentage of Revenue: 2023 2022 Gross profit 80 % 83 % (4)% (200) Net income (loss) (5) % 3 % (267)% (800) Adjusted EBITDA 22 % 31 % (29)% (900) 17 | Q1 2023


https://investors.zillowgroup.com