Exhibit 99.1

| Contacts: | ||
| Investors | ||
| Brad Berning | ||
| [email protected] | ||
| Media | ||
| Chrissy Roebuck | ||
| [email protected] | ||
Zillow Group Reports First-Quarter 2022 Financial Results
SEATTLE — May 5, 2022 — Zillow Group, Inc. (NASDAQ: Z and ZG), which is transforming the way people buy, sell, rent and finance homes, today announced its consolidated financial results for the three months ended March 31, 2022.
Complete financial results for the first quarter and outlook for the second quarter of 2022 can be found in the company’s shareholder letter on the Investor Relations section of Zillow Group’s website at https://investors.zillowgroup.com/investors/financials/quarterly-results/default.aspx.
“While the housing market outlook may be choppy in the near term, today’s first-quarter results, together with our strong brand, audience, and balance sheet, demonstrate how well-positioned and prepared Zillow is to forge ahead,” says Zillow co-founder and CEO Rich Barton. “We are buoyed by a strong cash position and a high-margin, positive-cash-flow-generating core business. While mindful of macro challenges, our eyes are focused on the future as we develop new products and services that bring us closer to realizing the housing super app vision of delivering an integrated end-to-end experience for our customers and partners.”
Recent highlights include:
•Zillow Group’s Q1 results met or exceeded the company’s outlook at a consolidated level and for all three reportable segments.
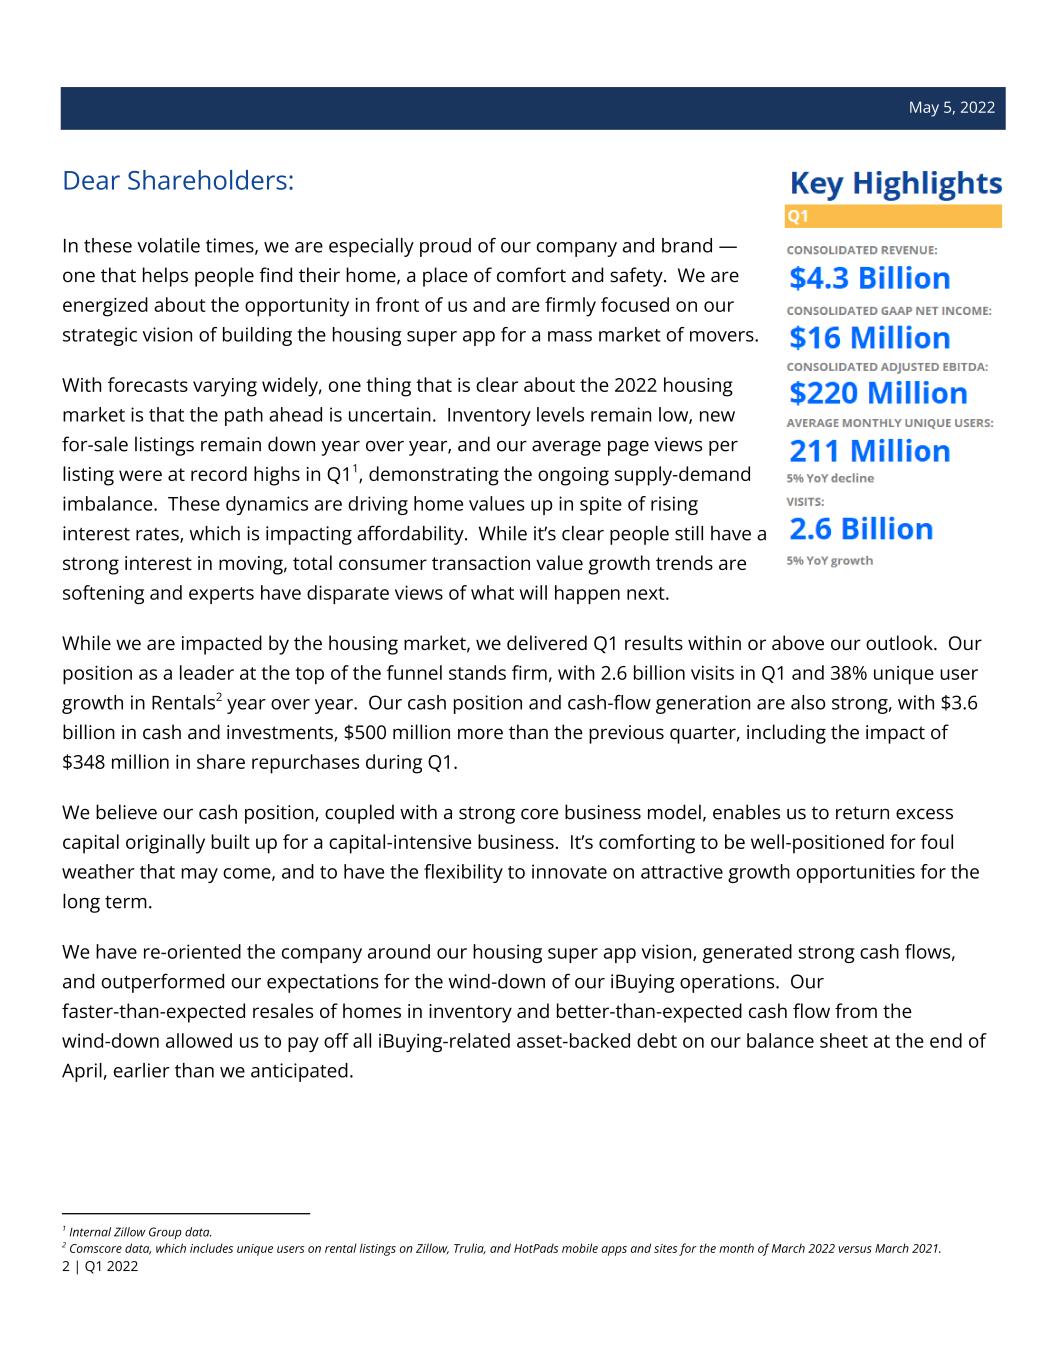
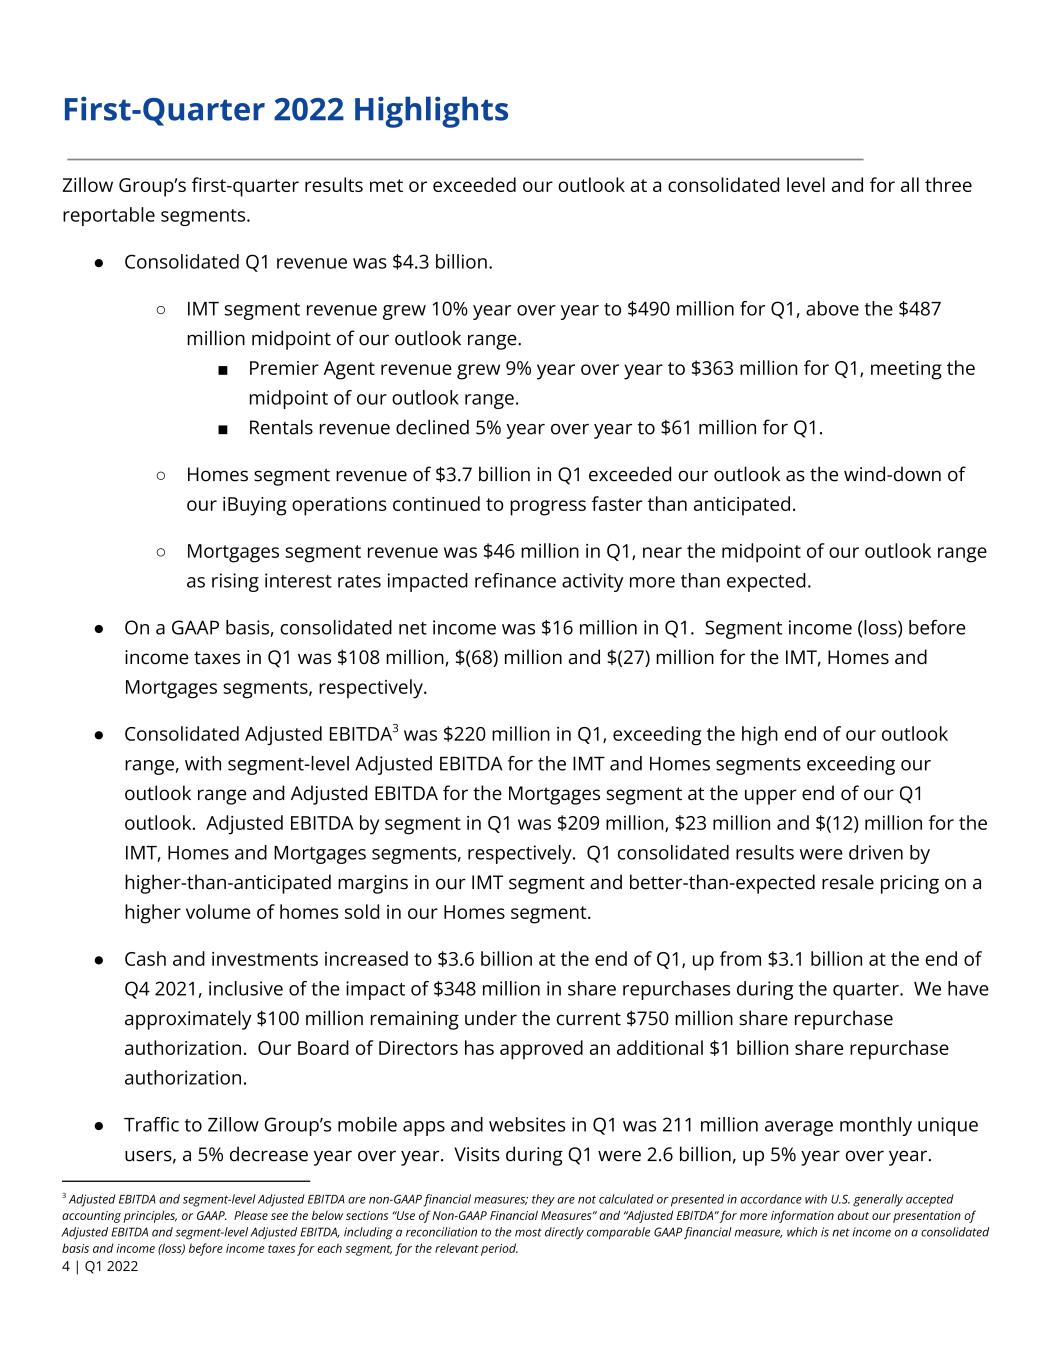
•Consolidated Q1 revenue was $4.3 billion.
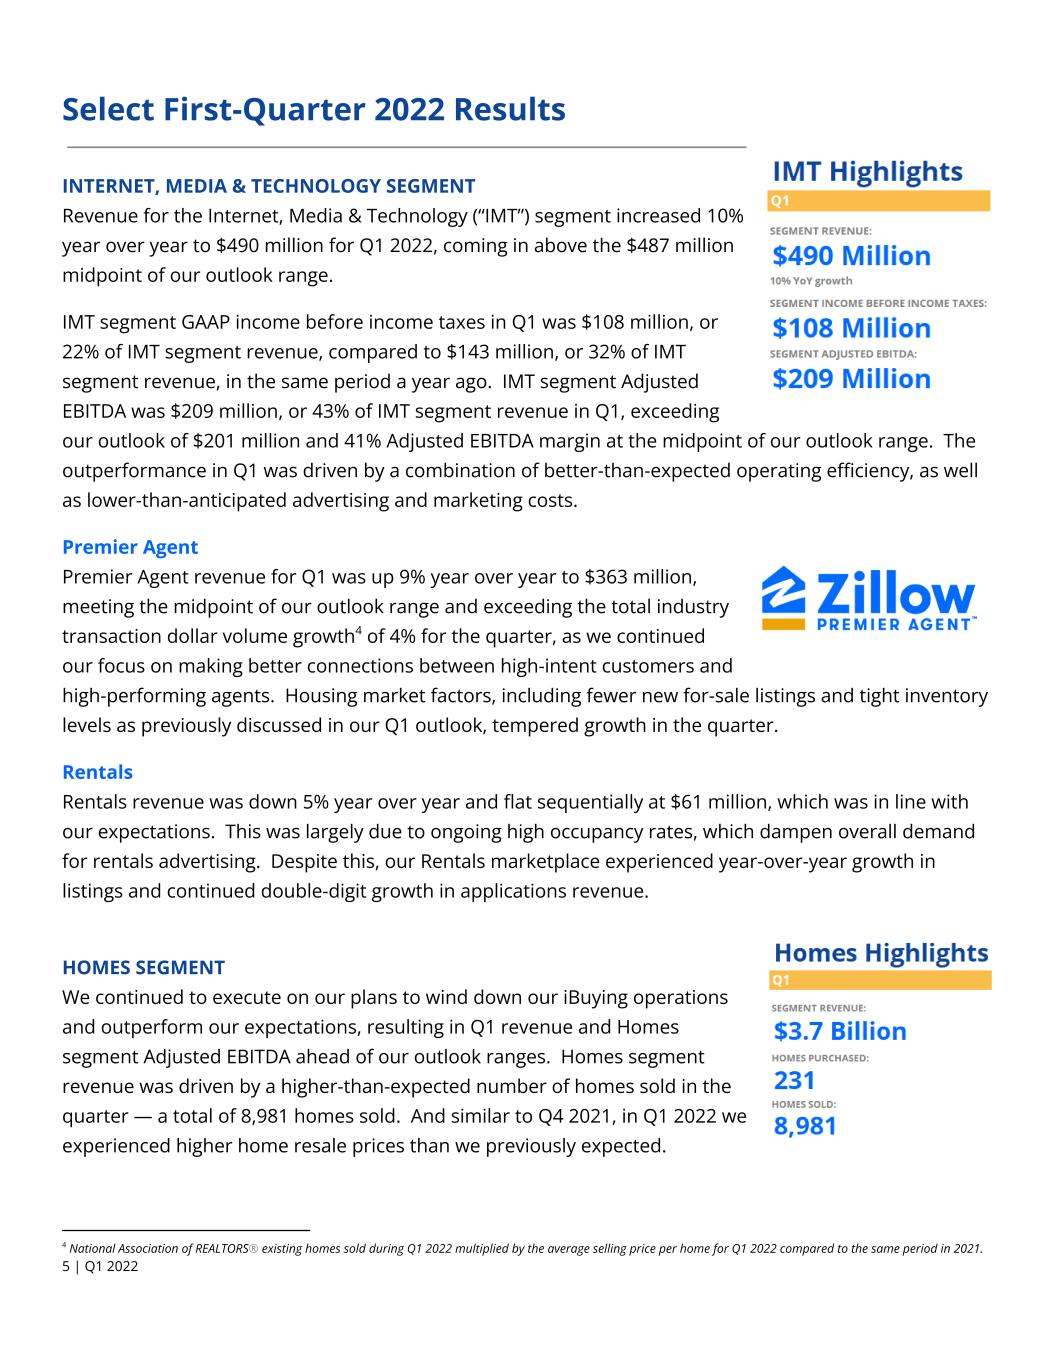
◦IMT segment revenue grew 10% year over year to $490 million, above the $487 million midpoint of the company’s outlook range.
▪Premier Agent revenue grew 9% year over year to $363 million, meeting the midpoint of the company’s outlook range.
▪Rentals revenue decreased 5% year over year to $61 million.
◦Homes segment revenue of $3.7 billion exceeded the company’s outlook as the wind-down of its iBuying operations continued to progress faster than anticipated.
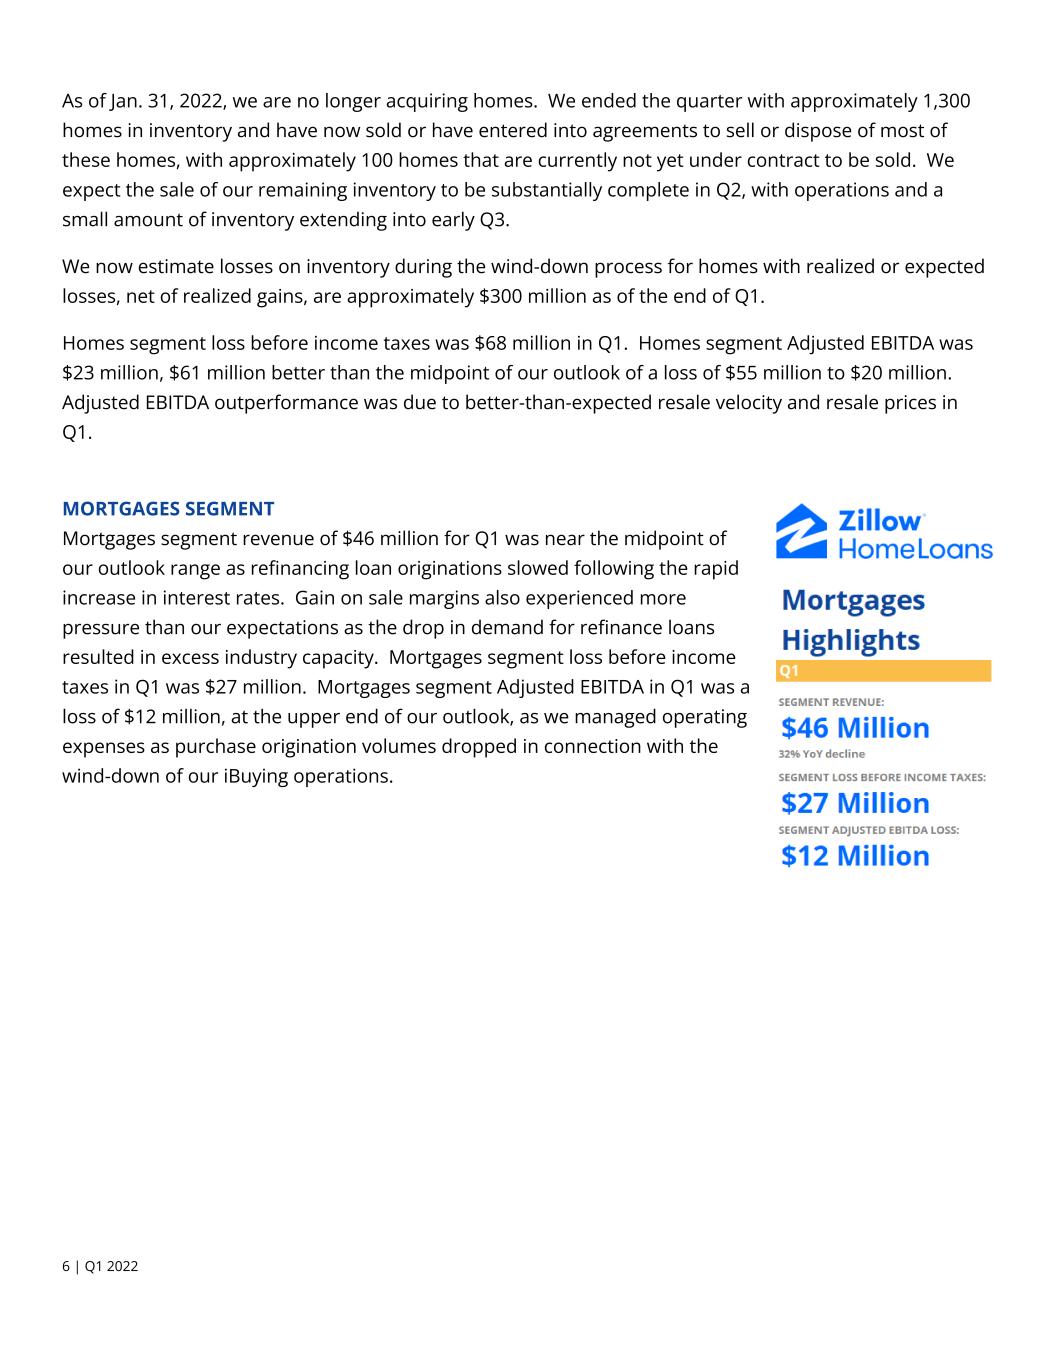
◦Mortgages segment revenue was $46 million, near the midpoint of the company’s outlook range, as rising interest rates impacted refinance activity more than expected.
•Consolidated GAAP net income was $16 million in Q1. Segment income (loss) before income taxes was $108 million, $(68) million and $(27) million for the IMT, Homes and Mortgages segments, respectively.
•Consolidated Adjusted EBITDA of $220 million exceeded the high end of the company’s Q1 outlook range, with segment-level Adjusted EBITDA for the IMT and Homes segments exceeding the company’s outlook range and Adjusted EBITDA for the Mortgages segment at the upper end of the company’s Q1 outlook. Adjusted EBITDA by segment was $209 million, $23 million and $(12) million for the IMT, Homes and Mortgages segments, respectively.
•Traffic to Zillow Group’s mobile apps and websites in Q1 was 211 million average monthly unique users, a decrease of 5% year over year. Visits during Q1 were 2.6 billion, up 5% year over year.
•The company ended the first quarter with cash and investments of $3.6 billion, up from $3.1 billion at the end of Q4 2021, inclusive of the impact of $348 million in share repurchases during the quarter.
•Our Board of Directors has approved an additional $1 billion share repurchase authorization. We have approximately $100 million remaining under the previously approved $750 million share repurchase authorization.
First Quarter 2022 Financial Highlights
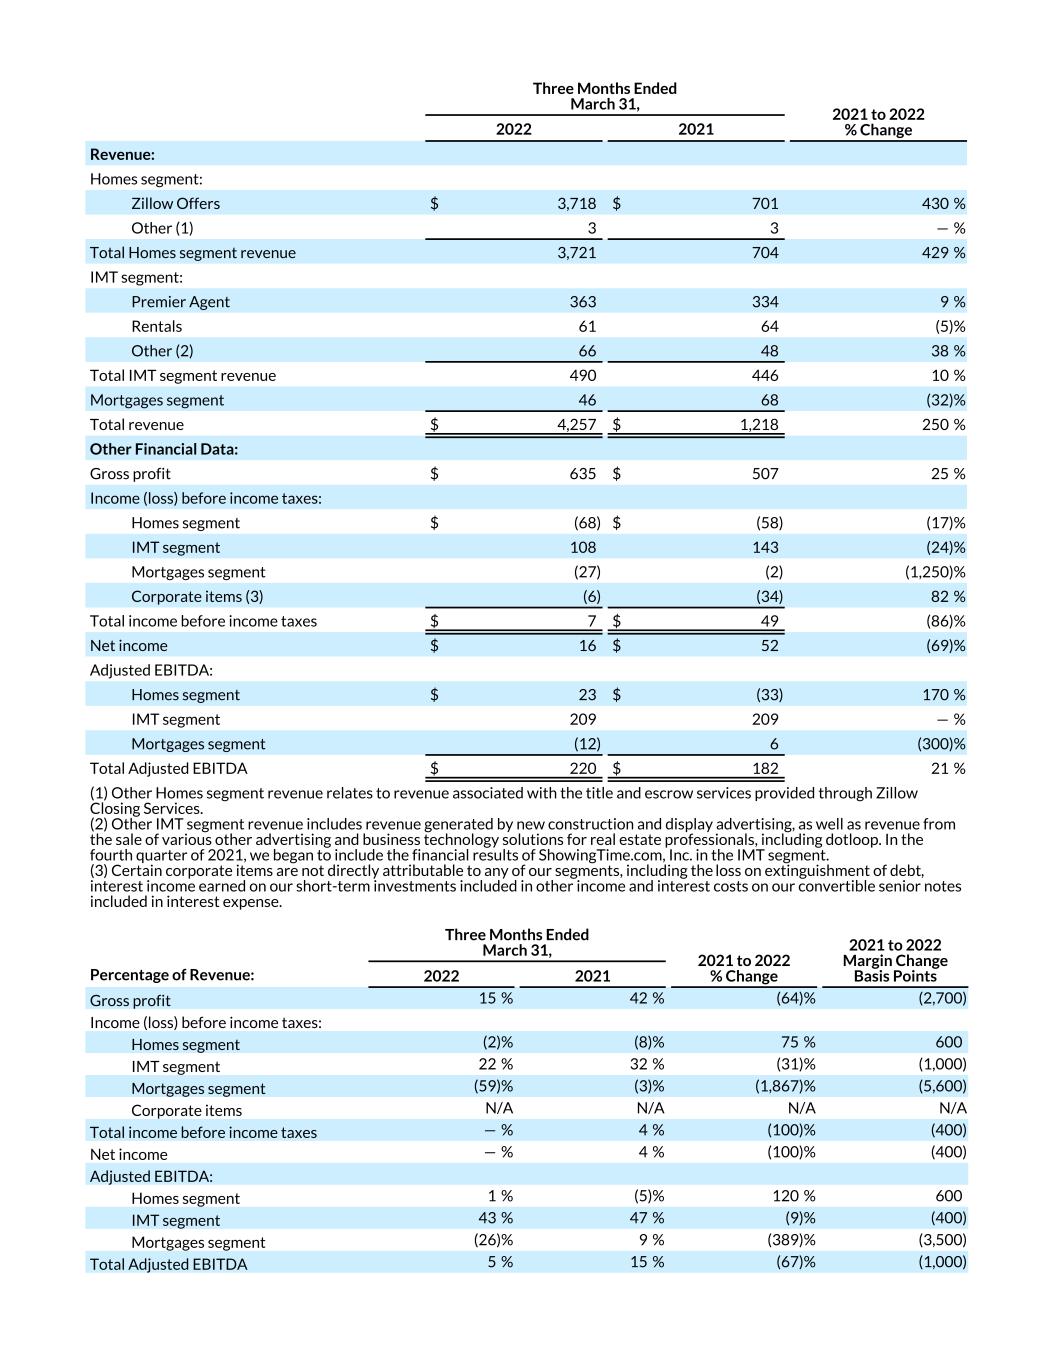
The following table sets forth Zillow Group’s financial highlights for the periods presented (in millions, unaudited):
| Three Months Ended March 31, | 2021 to 2022 % Change | ||||||||||||||||
| 2022 | 2021 | ||||||||||||||||
| Revenue: | |||||||||||||||||
| Homes segment: | |||||||||||||||||
| Zillow Offers | $ | 3,718 | $ | 701 | 430% | ||||||||||||
| Other (1) | 3 | 3 | —% | ||||||||||||||
| Total Homes segment revenue | 3,721 | 704 | 429% | ||||||||||||||
| IMT segment: | |||||||||||||||||
| Premier Agent | 363 | 334 | 9% | ||||||||||||||
| Rentals | 61 | 64 | (5)% | ||||||||||||||
| Other (2) | 66 | 48 | 38% | ||||||||||||||
| Total IMT segment revenue | 490 | 446 | 10% | ||||||||||||||
| Mortgages segment | 46 | 68 | (32)% | ||||||||||||||
| Total revenue | $ | 4,257 | $ | 1,218 | 250% | ||||||||||||
| Other Financial Data: | |||||||||||||||||
| Gross profit | $ | 635 | $ | 507 | |||||||||||||
Income (loss) before income taxes: | |||||||||||||||||
| Homes segment | $ | (68) | $ | (58) | |||||||||||||
| IMT segment | 108 | 143 | |||||||||||||||
| Mortgages segment | (27) | (2) | |||||||||||||||
| Corporate items (3) | (6) | (34) | |||||||||||||||
Total income before income taxes | $ | 7 | $ | 49 | |||||||||||||
Net income | $ | 16 | $ | 52 | |||||||||||||
| Adjusted EBITDA (4): | |||||||||||||||||
| Homes segment | $ | 23 | $ | (33) | |||||||||||||
| IMT segment | 209 | 209 | |||||||||||||||
| Mortgages segment | (12) | 6 | |||||||||||||||
| Total Adjusted EBITDA | $ | 220 | $ | 182 | |||||||||||||
| Percentage of Revenue: | |||||||||||||||||
| Gross profit | 15% | 42% | |||||||||||||||
Income (loss) before income taxes: | |||||||||||||||||
| Homes segment | (2)% | (8)% | |||||||||||||||
| IMT segment | 22% | 32% | |||||||||||||||
| Mortgages segment | (59)% | (3)% | |||||||||||||||
| Corporate items (3) | N/A | N/A | |||||||||||||||
Total income before income taxes | —% | 4% | |||||||||||||||
Net income | —% | 4% | |||||||||||||||
| Adjusted EBITDA: | |||||||||||||||||
| Homes segment | 1% | (5)% | |||||||||||||||
| IMT segment | 43% | 47% | |||||||||||||||
| Mortgages segment | (26)% | 9% | |||||||||||||||
| Total Adjusted EBITDA | 5% | 15% | |||||||||||||||
(1) Other Homes segment revenue relates to revenue associated with the title and escrow services provided through Zillow Closing Services. (2) Other IMT segment revenue includes revenue generated by new construction and display advertising, as well as revenue from the sale of various other advertising and business technology solutions for real estate professionals, including dotloop. In the fourth quarter of 2021, we began to include the financial results of ShowingTime.com, Inc. in the IMT segment. (3) Certain corporate items are not directly attributable to any of our segments, including the loss on extinguishment of debt, interest income earned on our short-term investments included in other income and interest costs on our convertible senior notes included in interest expense. (4) Adjusted EBITDA is a non-GAAP financial measure; it is not calculated or presented in accordance with U.S. generally accepted accounting principles, or GAAP. See below for more information regarding our presentation of Adjusted EBITDA, including a reconciliation of Adjusted EBITDA to the most directly comparable GAAP financial measure, which is net income on a consolidated basis and income (loss) before income taxes for each segment, for each of the periods presented. | |||||||||||||||||
Conference Call and Webcast Information
Zillow Group co-founder and CEO Rich Barton and CFO Allen Parker will host a live conference call to discuss these results today at 2 p.m. Pacific Time (5 p.m. Eastern Time). A shareholder letter and link to both the live webcast and recorded replay of the call may be accessed in the Quarterly Results section of Zillow Group’s investor relations website. Participants must register for the live call in advance at https://www.incommglobalevents.com/registration/q4inc/10587/zillow-group-first-quarter-2022-earnings-call/ to receive emailed instructions. This pre-registration process is designed to reduce delays due to operator congestion when accessing the live call.
Forward-Looking Statements
This press release contains forward-looking statements within the meaning of Section 27A of the Securities Act of 1933 and Section 21E of the Securities Exchange Act of 1934 that involve risks and uncertainties, including, without limitation, statements regarding the future performance and operation of our business, the expected amount and timing of charges, write-downs and cash expenditures and expected wind down plans of iBuying operations, the current and future health and stability of the residential housing market and economy and our expectations regarding future shifts in behavior by consumers and employees. Statements containing words such as “may,” “believe,” “anticipate,” “expect,” “intend,” “plan,” “project,” “predict,” “will,” “projections,” “continue,” “estimate,” “outlook,” “guidance,” “would,” “could,” or similar expressions constitute forward-looking statements. Forward-looking statements are made based on assumptions as of May 5, 2022, and although we believe the expectations reflected in the forward-looking statements are reasonable, we cannot guarantee these results. Differences in Zillow Group’s actual results from those described in these forward-looking statements may result from actions taken by Zillow Group as well as from risks and uncertainties beyond Zillow Group’s control.
Factors that may contribute to such differences include, but are not limited to, the current and future health and stability of the economy, financial conditions and residential housing market, including any extended downturn or slowdown; changes in general economic and financial conditions (including federal monetary policy, interest rate changes, inflation, home price appreciation, and housing inventory) that may reduce demand for our products and services, lower our profitability or reduce our access to financing; actual or anticipated changes in our rates of growth and innovation relative to that of our competitors; investment of resources to pursue strategies and develop new products and services that may not prove effective or that are not attractive to customers and real estate partners; the impact of the COVID-19 pandemic (including variants) or other public health crises on our ability to operate, demand for our products or services, or general economic conditions; disruptions in operations and relationships with customers, suppliers, vendors, broker partners, contractors, employees and lenders given our decision to wind down Zillow Offers, our iBuying operations; unanticipated developments that may prevent, delay or increase the costs associated with our wind down activities; actual or anticipated fluctuations in our financial condition and results of operations; changes in projected operational and financial results; addition or loss of a significant number of customers; acquisitions, strategic partnerships, joint ventures, capital-raising activities or other corporate transactions or commitments by us or our competitors; actual or anticipated changes in technology, products, markets or services by us or our competitors; ability to protect the information and privacy of our customers and other third parties; ability to protect our brand and intellectual property; ability to obtain or maintain licenses and permits to support our current and future businesses; ability to comply with MLS rules and requirements to access and use listing data, and to maintain or establish relationships with listings and data providers; ability to operate and grow our mortgage origination business, including the ability to obtain sufficient financing; the impact of natural disasters and other catastrophic events;changes in laws or government regulation affecting our business and the impact of pending or future litigation or regulatory actions.
The foregoing list of risks and uncertainties is illustrative but not exhaustive. For more information about potential factors that could affect Zillow Group’s business and financial results, please review the “Risk Factors” described in Zillow Group’s Annual Report on Form 10-K for the fiscal year ended December 31, 2021 and in future quarterly and annual reports. Except as may be required by law, Zillow Group does not intend and undertakes no duty to update this information to reflect future events or circumstances.
Use of Non-GAAP Financial Measures
To provide investors with additional information regarding our financial results, this press release includes references to Adjusted EBITDA in total and for each segment, each a non-GAAP financial measure. We have provided a reconciliation below of Adjusted EBITDA in total to net income and Adjusted EBITDA by segment to income (loss) before income taxes for each segment, the most directly comparable U.S. generally accepted accounting principles (“GAAP”) financial measures.
Adjusted EBITDA is a key metric used by our management and board of directors to measure operating performance and trends and to prepare and approve our annual budget. In particular, the exclusion of certain expenses in calculating Adjusted EBITDA facilitates operating performance comparisons on a period-to-period basis.
Our use of Adjusted EBITDA in total and for each segment has limitations as an analytical tool, and you should not consider these measures in isolation or as a substitute for analysis of our results as reported under GAAP. Some of these limitations are:
•Adjusted EBITDA does not reflect changes in, or cash requirements for, our working capital needs;
•Adjusted EBITDA does not consider the potentially dilutive impact of share-based compensation;
•Although depreciation and amortization are non-cash charges, the assets being depreciated and amortized may have to be replaced in the future, and Adjusted EBITDA does not reflect cash capital expenditure requirements for such replacements or for new capital expenditures or contractual commitments;
•Adjusted EBITDA does not reflect restructuring costs;
•Adjusted EBITDA does not reflect acquisition-related costs;
•Adjusted EBITDA does not reflect the loss on extinguishment of debt;
•Adjusted EBITDA does not reflect interest expense or other income;
•Adjusted EBITDA does not reflect income taxes; and
•Other companies, including companies in our own industry, may calculate Adjusted EBITDA differently than we do, limiting its usefulness as a comparative measure.
Because of these limitations, you should consider Adjusted EBITDA in total and for each segment alongside other financial performance measures, including various cash flow metrics, net income, income (loss) before income taxes for each segment, and our other GAAP results.
About Zillow Group, Inc.
Zillow Group, Inc. (NASDAQ: Z and ZG) is reimagining real estate to make it easier to unlock life’s next chapter. As the most visited real estate website in the United States, Zillow® and its affiliates offer customers an on-demand experience for selling, buying, renting or financing with transparency and ease.
Zillow Group’s affiliates and subsidiaries include Zillow®, Zillow Premier Agent®, Zillow Home Loans™, Zillow Closing Services™,., Trulia®, Out East®, ShowingTime®, Bridge Interactive®, dotloop®, StreetEasy® and HotPads®. Zillow Home Loans, LLC is an Equal Housing Lender, NMLS #10287 (www.nmlsconsumeraccess.org).
Please visit https://investors.zillowgroup.com, www.zillowgroup.com/news, and www.twitter.com/zillowgroup, where Zillow Group discloses information about the company, its financial information, and its business that may be deemed material.
The Zillow Group logo is available at https://zillowgroup.mediaroom.com/logos-photos.
(ZFIN)
Adjusted EBITDA
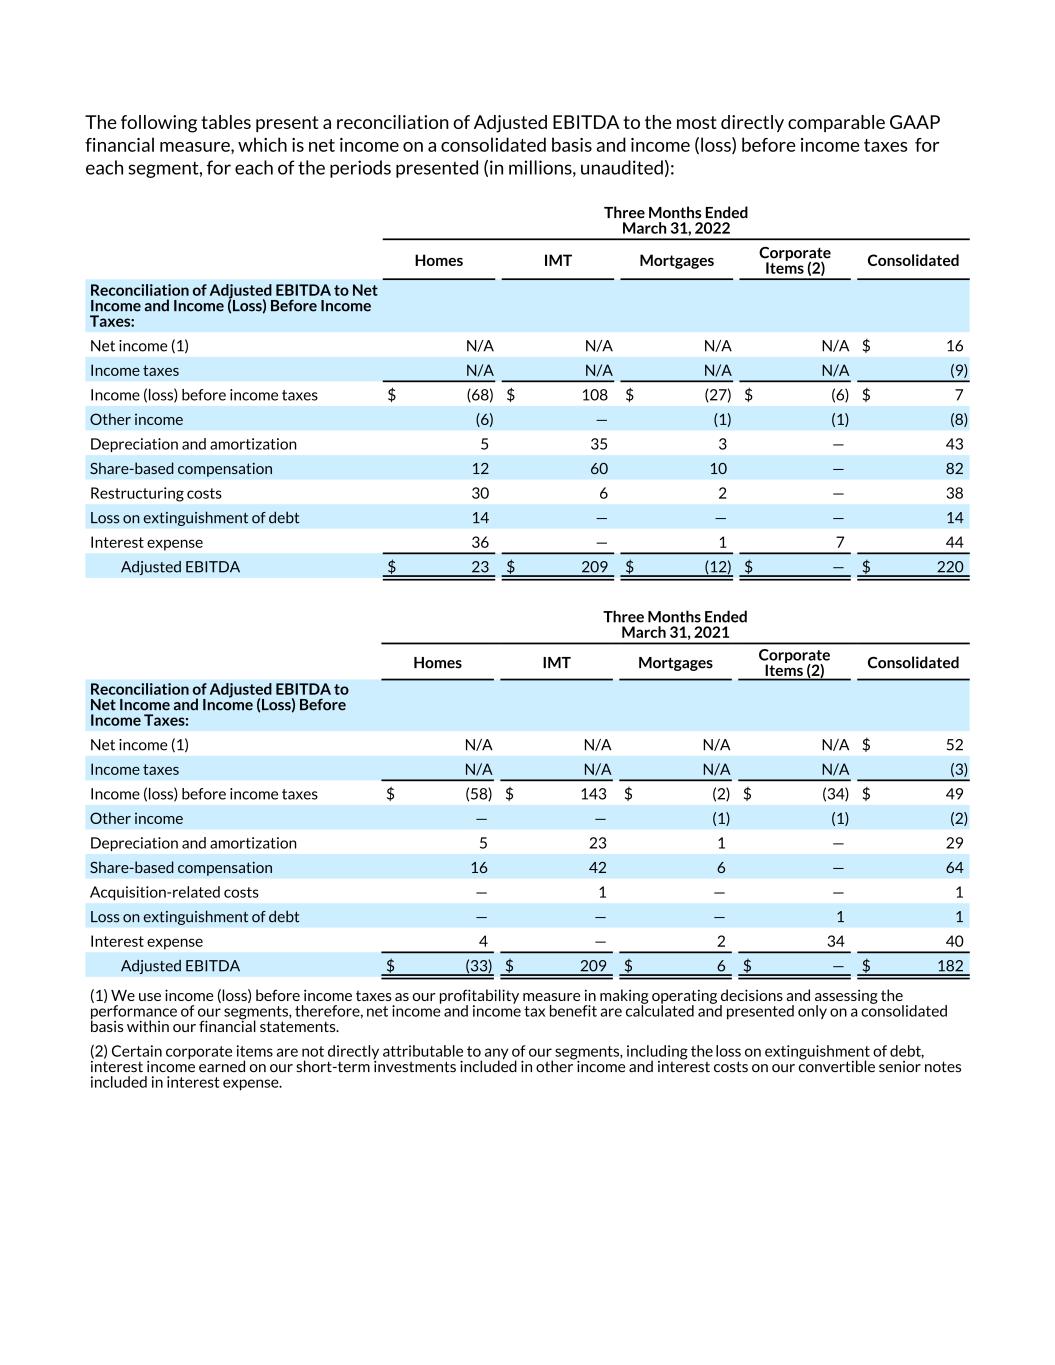
The following tables present a reconciliation of Adjusted EBITDA to the most directly comparable GAAP financial measure, which is net income on a consolidated basis and income (loss) before income taxes for each segment, for each of the periods presented (in millions, unaudited):
| Three Months Ended March 31, 2022 | |||||||||||||||||||||||||||||
| Homes | IMT | Mortgages | Corporate Items (2) | Consolidated | |||||||||||||||||||||||||
| Reconciliation of Adjusted EBITDA to Net Income and Income (Loss) Before Income Taxes: | |||||||||||||||||||||||||||||
| Net income (1) | N/A | N/A | N/A | N/A | $ | 16 | |||||||||||||||||||||||
| Income taxes | N/A | N/A | N/A | N/A | (9) | ||||||||||||||||||||||||
| Income (loss) before income taxes | $ | (68) | $ | 108 | $ | (27) | $ | (6) | $ | 7 | |||||||||||||||||||
| Other income | (6) | — | (1) | (1) | (8) | ||||||||||||||||||||||||
| Depreciation and amortization | 5 | 35 | 3 | — | 43 | ||||||||||||||||||||||||
| Share-based compensation | 12 | 60 | 10 | — | 82 | ||||||||||||||||||||||||
| Restructuring costs | 30 | 6 | 2 | — | 38 | ||||||||||||||||||||||||
| Loss on extinguishment of debt | 14 | — | — | — | 14 | ||||||||||||||||||||||||
| Interest expense | 36 | — | 1 | 7 | 44 | ||||||||||||||||||||||||
| Adjusted EBITDA | $ | 23 | $ | 209 | $ | (12) | $ | — | $ | 220 | |||||||||||||||||||
| Three Months Ended March 31, 2021 | |||||||||||||||||||||||||||||
| Homes | IMT | Mortgages | Corporate Items (2) | Consolidated | |||||||||||||||||||||||||
| Reconciliation of Adjusted EBITDA to Net Income and Income (Loss) Before Income Taxes: | |||||||||||||||||||||||||||||
| Net income (1) | N/A | N/A | N/A | N/A | $ | 52 | |||||||||||||||||||||||
| Income taxes | N/A | N/A | N/A | N/A | (3) | ||||||||||||||||||||||||
| Income (loss) before income taxes | $ | (58) | $ | 143 | $ | (2) | $ | (34) | $ | 49 | |||||||||||||||||||
| Other income | — | — | (1) | (1) | (2) | ||||||||||||||||||||||||
| Depreciation and amortization | 5 | 23 | 1 | — | 29 | ||||||||||||||||||||||||
| Share-based compensation | 16 | 42 | 6 | — | 64 | ||||||||||||||||||||||||
| Acquisition-related costs | — | 1 | — | — | 1 | ||||||||||||||||||||||||
| Loss on extinguishment of debt | — | — | — | 1 | 1 | ||||||||||||||||||||||||
| Interest expense | 4 | — | 2 | 34 | 40 | ||||||||||||||||||||||||
| Adjusted EBITDA | $ | (33) | $ | 209 | $ | 6 | $ | — | $ | 182 | |||||||||||||||||||
(1) We use income (loss) before income taxes as our profitability measure in making operating decisions and assessing the performance of our segments, therefore, net income and income tax benefit are calculated and presented only on a consolidated basis within our financial statements. | |||||||||||||||||||||||||||||
(2) Certain corporate items are not directly attributable to any of our segments, including the loss on extinguishment of debt, interest income earned on our short-term investments included in other income and interest costs on our convertible senior notes included in interest expense. | |||||||||||||||||||||||||||||