
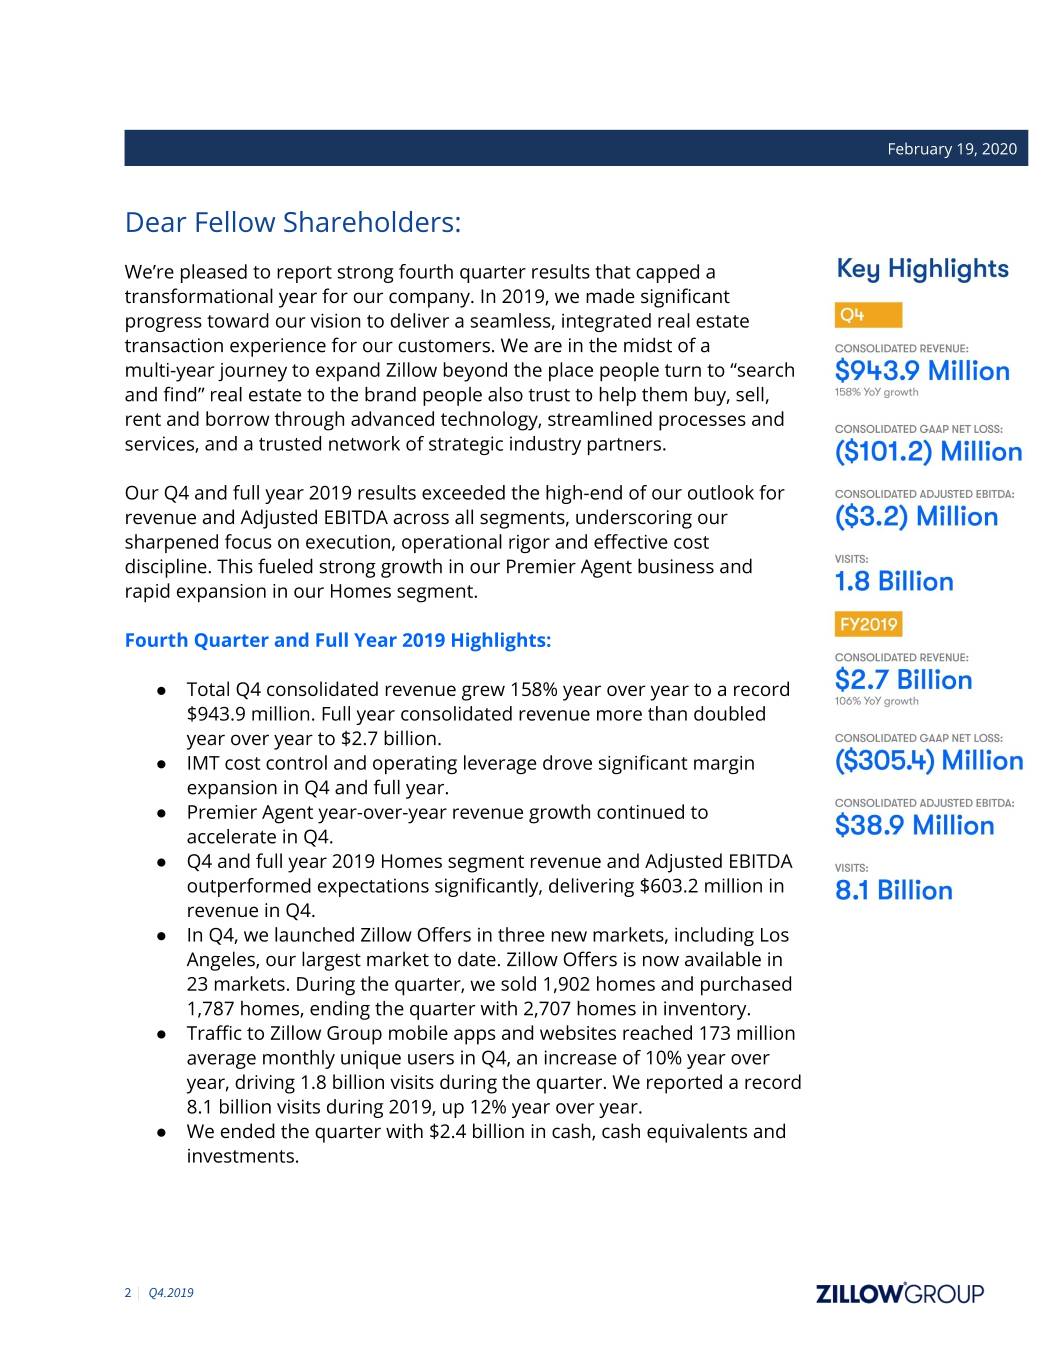
February 19, 2020 Dear Fellow Shareholders: We’re pleased to report strong fourth quarter results that capped a transformational year for our company. In 2019, we made significant progress toward our vision to deliver a seamless, integrated real estate transaction experience for our customers. We are in the midst of a multi-year journey to expand Zillow beyond the place people turn to “search and find” real estate to the brand people also trust to help them buy, sell, rent and borrow through advanced technology, streamlined processes and services, and a trusted network of strategic industry partners. Our Q4 and full year 2019 results exceeded the high-end of our outlook for revenue and Adjusted EBITDA across all segments, underscoring our sharpened focus on execution, operational rigor and effective cost discipline. This fueled strong growth in our Premier Agent business and rapid expansion in our Homes segment. Fourth Quarter and Full Year 2019 Highlights: ● Total Q4 consolidated revenue grew 158% year over year to a record $943.9 million. Full year consolidated revenue more than doubled year over year to $2.7 billion. ● IMT cost control and operating leverage drove significant margin expansion in Q4 and full year. ● Premier Agent year-over-year revenue growth continued to accelerate in Q4. ● Q4 and full year 2019 Homes segment revenue and Adjusted EBITDA outperformed expectations significantly, delivering $603.2 million in revenue in Q4. ● In Q4, we launched Zillow Offers in three new markets, including Los Angeles, our largest market to date. Zillow Offers is now available in 23 markets. During the quarter, we sold 1,902 homes and purchased 1,787 homes, ending the quarter with 2,707 homes in inventory. ● Traffic to Zillow Group mobile apps and websites reached 173 million average monthly unique users in Q4, an increase of 10% year over year, driving 1.8 billion visits during the quarter. We reported a record 8.1 billion visits during 2019, up 12% year over year. ● We ended the quarter with $2.4 billion in cash, cash equivalents and investments. 2 | Q4.2019
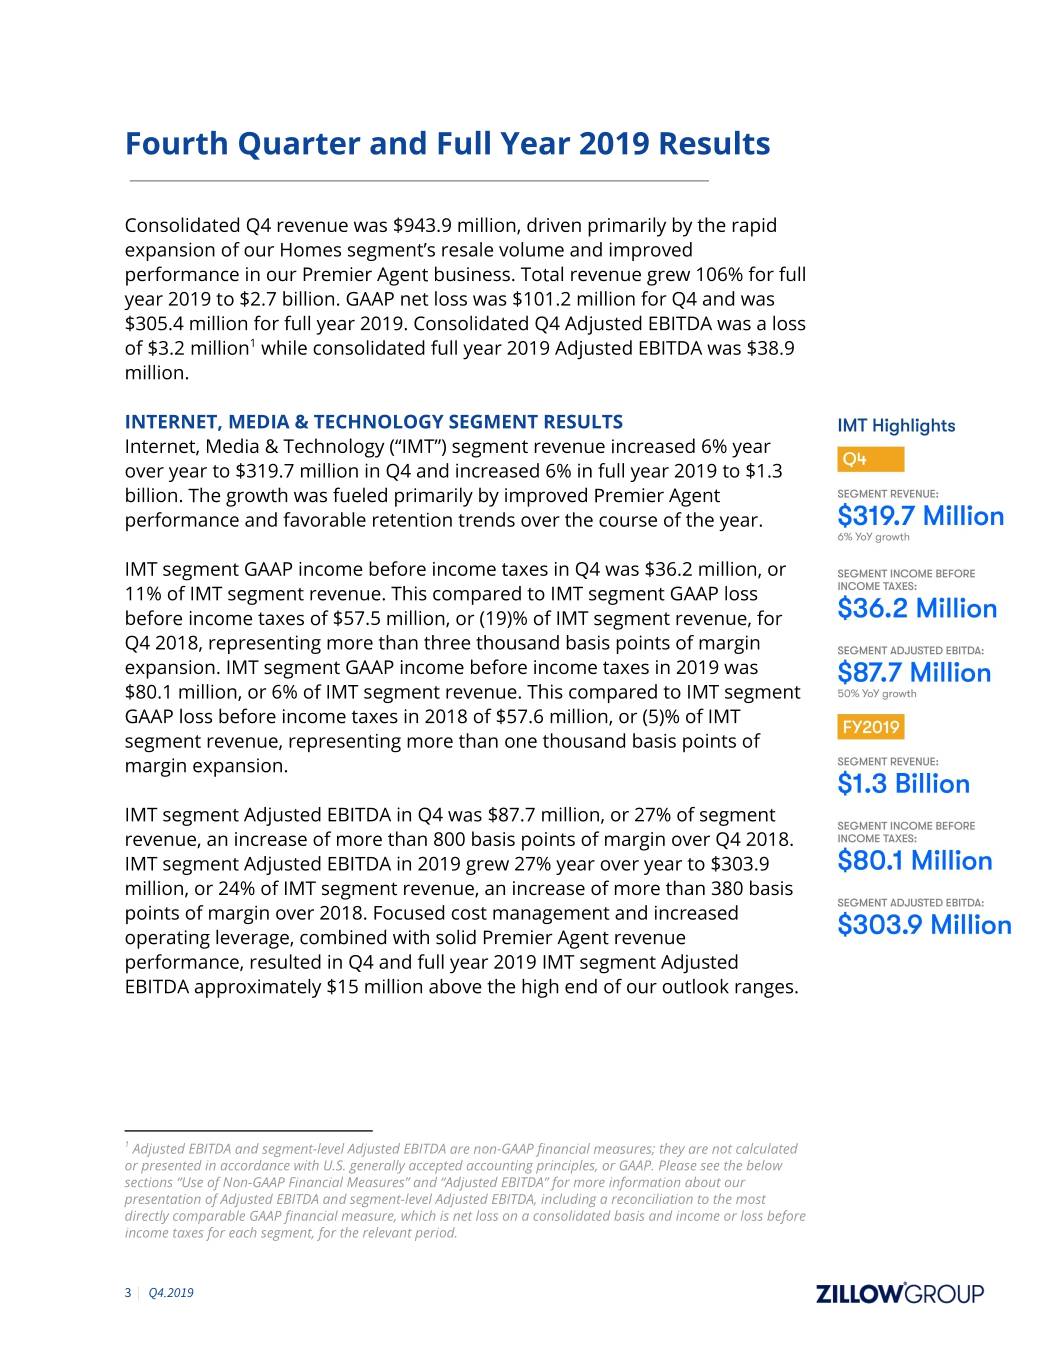
Fourth Quarter and Full Year 2019 Results Consolidated Q4 revenue was $943.9 million, driven primarily by the rapid expansion of our Homes segment’s resale volume and improved performance in our Premier Agent business. Total revenue grew 106% for full year 2019 to $2.7 billion. GAAP net loss was $101.2 million for Q4 and was $305.4 million for full year 2019. Consolidated Q4 Adjusted EBITDA was a loss of $3.2 million1 while consolidated full year 2019 Adjusted EBITDA was $38.9 million. INTERNET, MEDIA & TECHNOLOGY SEGMENT RESULTS Internet, Media & Technology (“IMT”) segment revenue increased 6% year over year to $319.7 million in Q4 and increased 6% in full year 2019 to $1.3 billion. The growth was fueled primarily by improved Premier Agent performance and favorable retention trends over the course of the year. IMT segment GAAP income before income taxes in Q4 was $36.2 million, or 11% of IMT segment revenue. This compared to IMT segment GAAP loss before income taxes of $57.5 million, or (19)% of IMT segment revenue, for Q4 2018, representing more than three thousand basis points of margin expansion. IMT segment GAAP income before income taxes in 2019 was $80.1 million, or 6% of IMT segment revenue. This compared to IMT segment GAAP loss before income taxes in 2018 of $57.6 million, or (5)% of IMT segment revenue, representing more than one thousand basis points of margin expansion. IMT segment Adjusted EBITDA in Q4 was $87.7 million, or 27% of segment revenue, an increase of more than 800 basis points of margin over Q4 2018. IMT segment Adjusted EBITDA in 2019 grew 27% year over year to $303.9 million, or 24% of IMT segment revenue, an increase of more than 380 basis points of margin over 2018. Focused cost management and increased operating leverage, combined with solid Premier Agent revenue performance, resulted in Q4 and full year 2019 IMT segment Adjusted EBITDA approximately $15 million above the high end of our outlook ranges. 1 Adjusted EBITDA and segment-level Adjusted EBITDA are non-GAAP financial measures; they are not calculated or presented in accordance with U.S. generally accepted accounting principles, or GAAP. Please see the below sections “Use of Non-GAAP Financial Measures” and “Adjusted EBITDA” for more information about our presentation of Adjusted EBITDA and segment-level Adjusted EBITDA, including a reconciliation to the most directly comparable GAAP financial measure, which is net loss on a consolidated basis and income or loss before income taxes for each segment, for the relevant period. 3 | Q4.2019
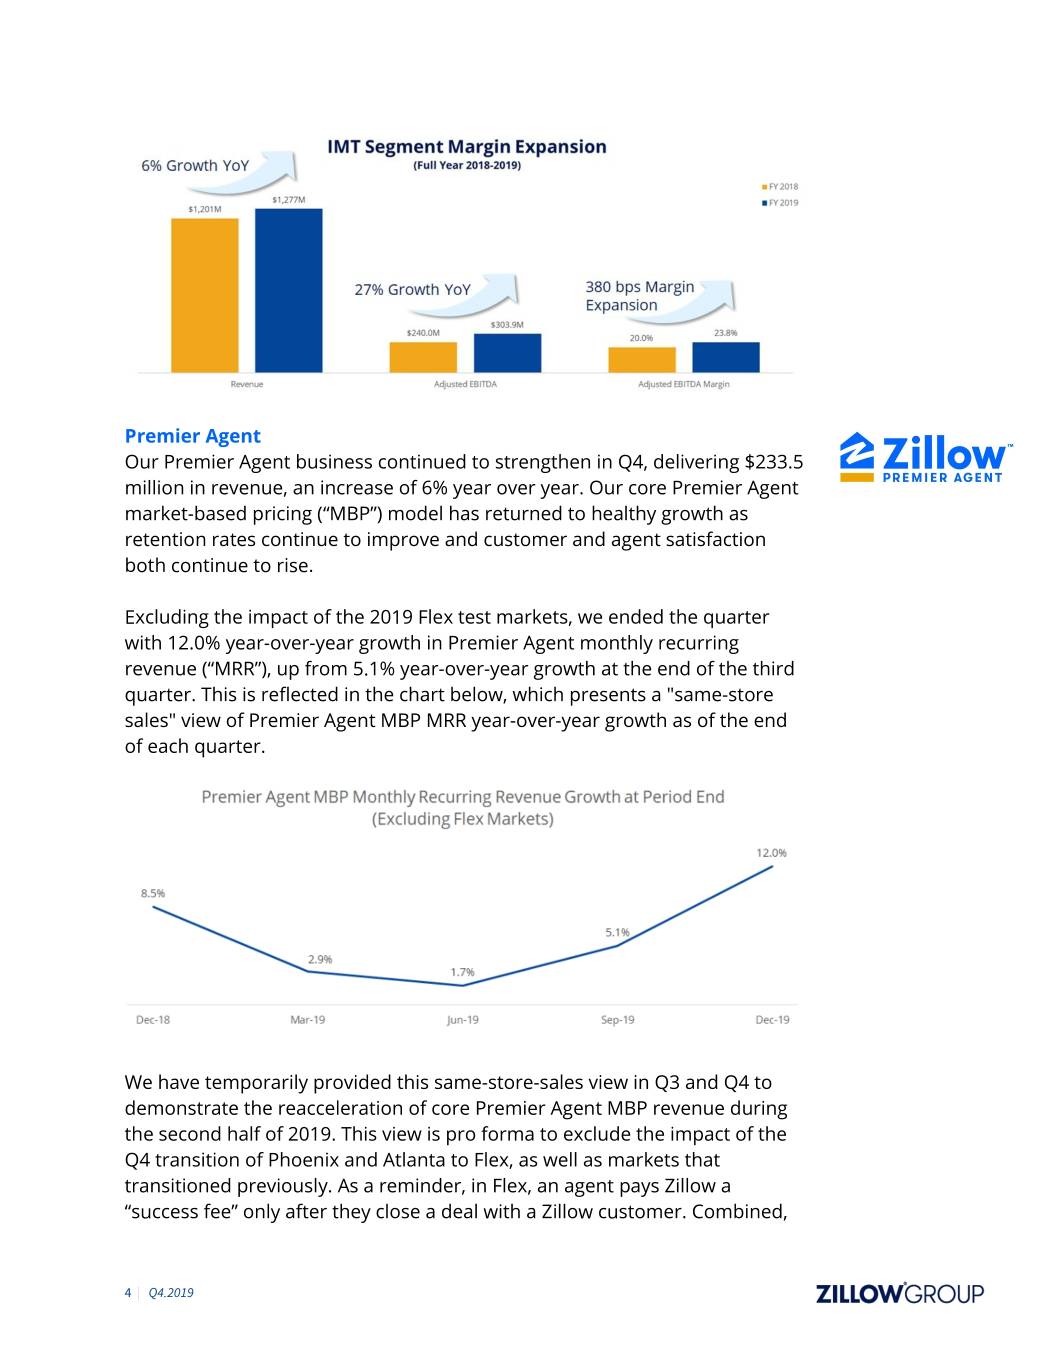
Premier Agent Our Premier Agent business continued to strengthen in Q4, delivering $233.5 million in revenue, an increase of 6% year over year. Our core Premier Agent market-based pricing (“MBP”) model has returned to healthy growth as retention rates continue to improve and customer and agent satisfaction both continue to rise. Excluding the impact of the 2019 Flex test markets, we ended the quarter with 12.0% year-over-year growth in Premier Agent monthly recurring revenue (“MRR”), up from 5.1% year-over-year growth at the end of the third quarter. This is reflected in the chart below, which presents a "same-store sales" view of Premier Agent MBP MRR year-over-year growth as of the end of each quarter. We have temporarily provided this same-store-sales view in Q3 and Q4 to demonstrate the reacceleration of core Premier Agent MBP revenue during the second half of 2019. This view is pro forma to exclude the impact of the Q4 transition of Phoenix and Atlanta to Flex, as well as markets that transitioned previously. As a reminder, in Flex, an agent pays Zillow a “success fee” only after they close a deal with a Zillow customer. Combined, 4 | Q4.2019
we estimate that these Flex tests represented approximately 5% of Premier Agent MRR at the end of 2019. We are also encouraged with the early results of our Flex tests, particularly with select high-performing agent partners. Not surprisingly, we are finding that the best agents and teams in the country tend to convert leads at higher rates than the general agent population. It's too early to know how extensible this model is given it must be accretive compared to our MBP model, but we are pleased enough with early results from our best partners to begin expanding our Flex testing with a select group of high-performing partners within a limited number of select markets in the second quarter of 2020. T he impact of these added Flex tests is included in our 2020 assumptions below in the Outlook section. Regardless of Premier Agent monetization model, our goal is to deliver the best experience for our customers while also maximizing revenue and profit yield per lead. We believe there is inherent value in partnering with the best agents where our interests are aligned to deliver exceptional service and results to our shared customers. Our belief is the future of Premier Agent is built through win-win-win outcomes in which we facilitate more transactions to delight our customers, our partners and Zillow. This may include iterating on a combination of monetization models that could co-exist over time. Rentals Rentals revenue in Q4 grew 12% year over year to $39.2 million. We continue to innovate and build tools that move us closer to the rental transaction and are pleased with our continued execution within this marketplace which grew revenue 22% year over year in 2019. Other Revenue Other revenue, which includes new construction, display and other advertising and business technology solutions for real estate professionals, grew 5% year over year to $46.9 million in Q4. 5 | Q4.2019
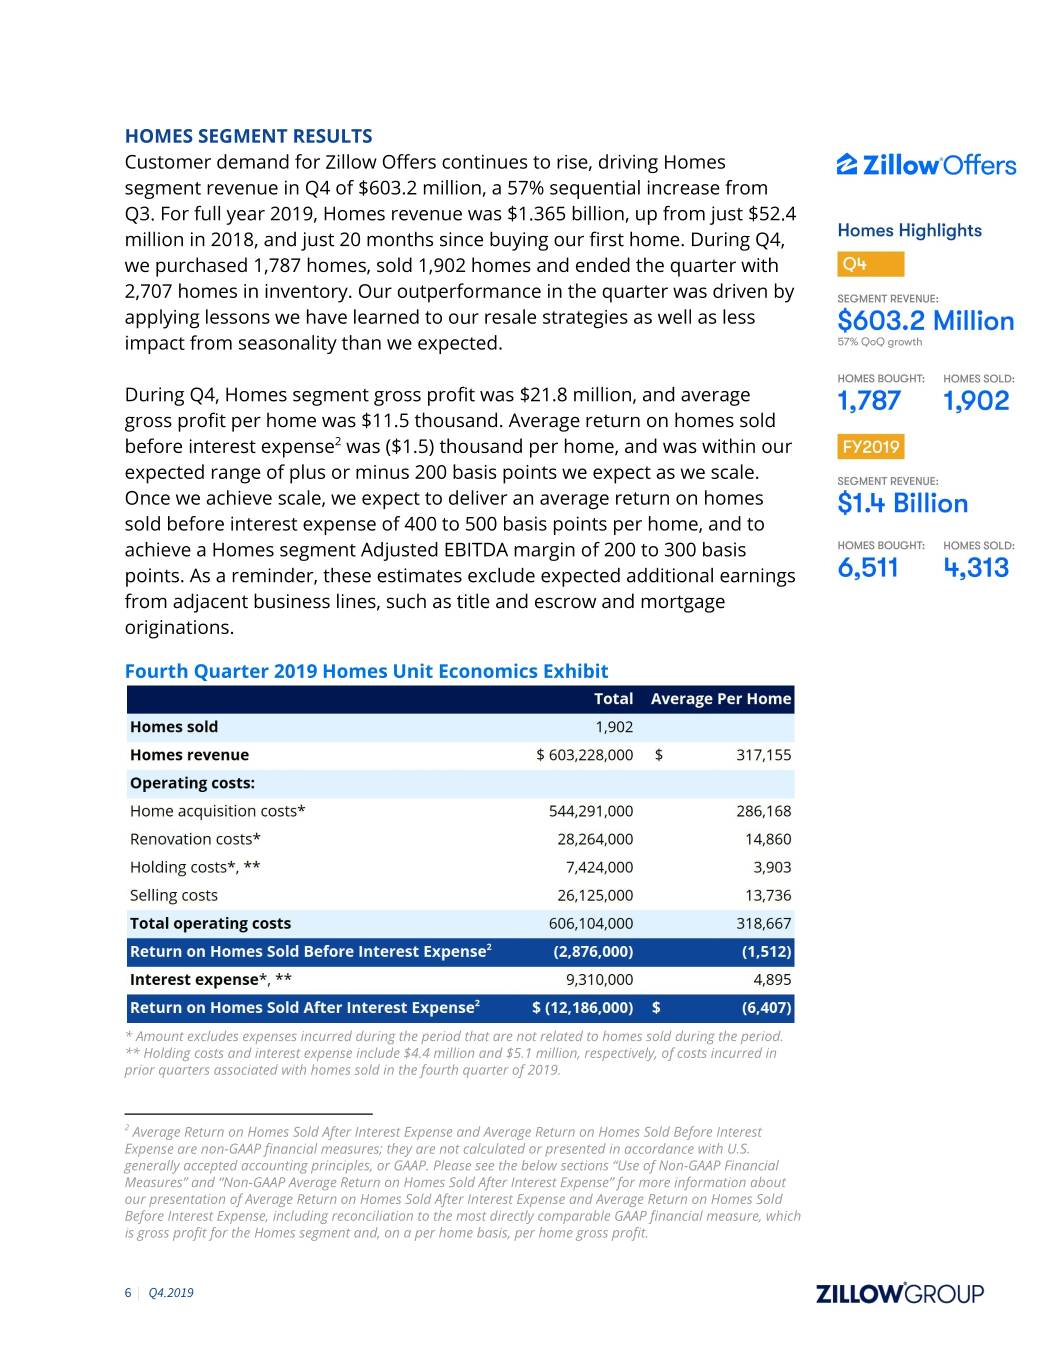
HOMES SEGMENT RESULTS Customer demand for Zillow Offers continues to rise, driving Homes segment revenue in Q4 of $603.2 million, a 57% sequential increase from Q3. For full year 2019, Homes revenue was $1.365 billion, up from just $52.4 million in 2018, and just 20 months since buying our first home. During Q4, we purchased 1,787 homes, sold 1,902 homes and ended the quarter with 2,707 homes in inventory. Our outperformance in the quarter was driven by applying lessons we have learned to our resale strategies as well as less impact from seasonality than we expected. During Q4, Homes segment gross profit was $21.8 million, and average gross profit per home was $11.5 thousand. Average return on homes sold before interest expense2 was ($1.5) thousand per home, and was within our expected range of plus or minus 200 basis points we expect as we scale. Once we achieve scale, we expect to deliver an average return on homes sold before interest expense of 400 to 500 basis points per home, and to achieve a Homes segment Adjusted EBITDA margin of 200 to 300 basis points. As a reminder, these estimates exclude expected additional earnings from adjacent business lines, such as title and escrow and mortgage originations. Fourth Quarter 2019 Homes Unit Economics Exhibit * Amount excludes expenses incurred during the period that are not related to homes sold during the period. ** Holding costs and interest expense include $4.4 million and $5.1 million, respectively, of costs incurred in prior quarters associated with homes sold in the fourth quarter of 2019. 2 Average Return on Homes Sold After Interest Expense and Average Return on Homes Sold Before Interest Expense are non-GAAP financial measures; they are not calculated or presented in accordance with U.S. generally accepted accounting principles, or GAAP. Please see the below sections “Use of Non-GAAP Financial Measures” and “Non-GAAP Average Return on Homes Sold After Interest Expense” for more information about our presentation of Average Return on Homes Sold After Interest Expense and Average Return on Homes Sold Before Interest Expense, including reconciliation to the most directly comparable GAAP financial measure, which is gross profit for the Homes segment and, on a per home basis, per home gross profit. 6 | Q4.2019

In Q4, we launched Zillow Offers in three markets, including Los Angeles, which is the second largest housing market in the U.S. In all, we launched 17 markets in 2019, which is an extraordinary rate, enabled by the underlying strength and experience of our Zillow Offers’ operations and field teams. Zillow Offers now operates in 23 markets nationally, including Tucson, which launched in the first quarter of 2020 and we plan to be in at least 26 markets by mid year, getting us closer to a national footprint. We are pleased with the early progress of our title and escrow services in 2019, as these services are a critical component in delivering a seamless, integrated transaction experience. Zillow Closing Services is now operating in several markets although its revenue contribution to Zillow Group in 2020 is not expected to be material. 7 | Q4.2019
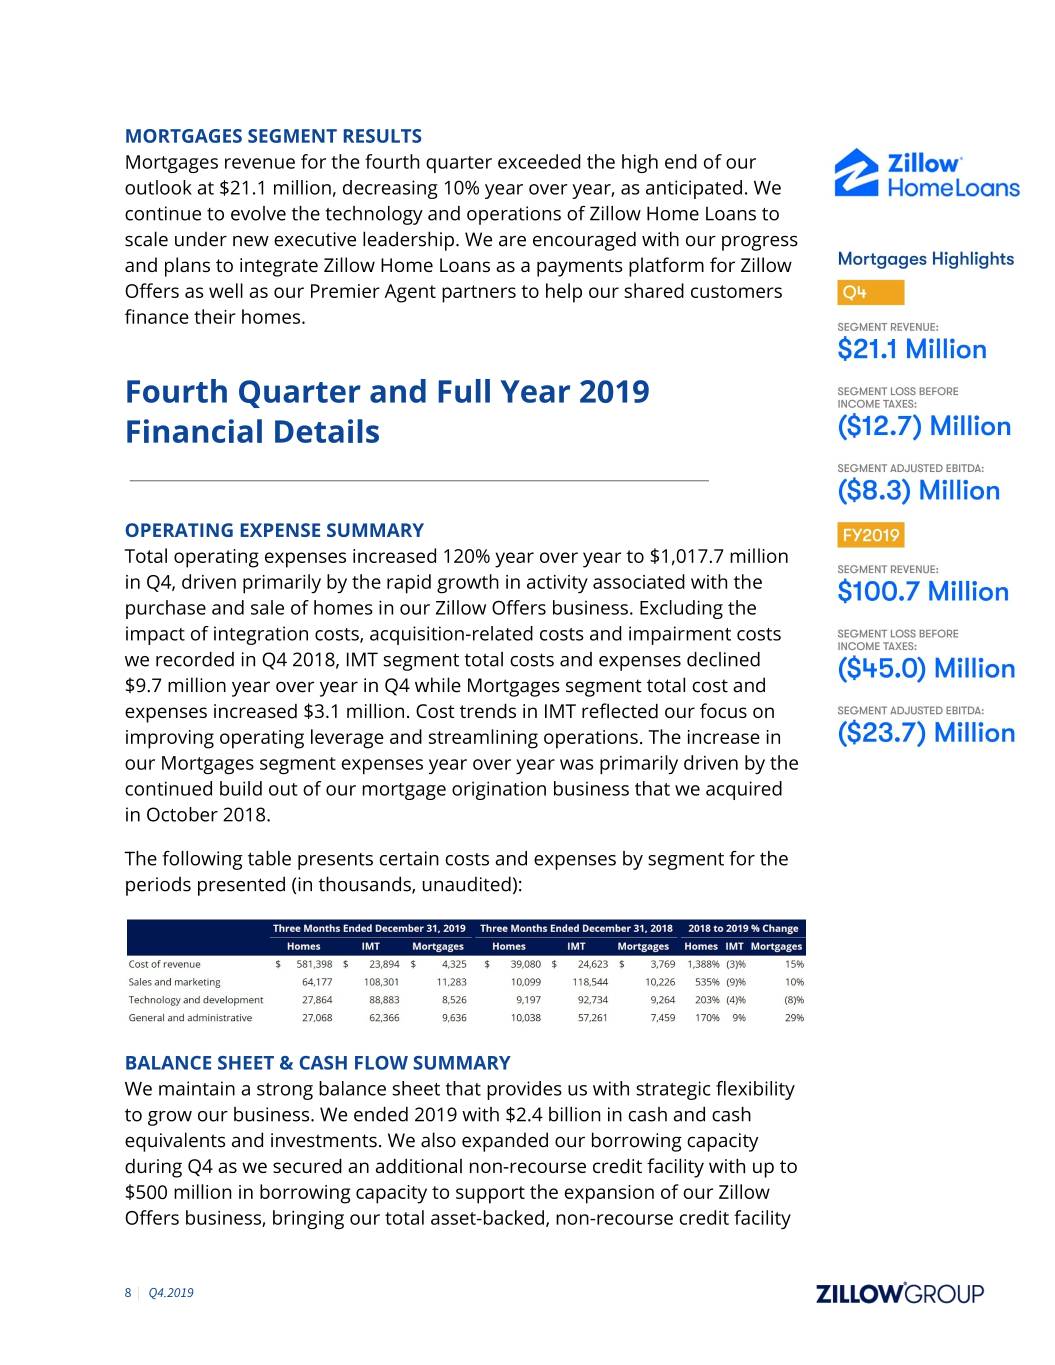
MORTGAGES SEGMENT RESULTS Mortgages revenue for the fourth quarter exceeded the high end of our outlook at $21.1 million, decreasing 10% year over year, as anticipated. We continue to evolve the technology and operations of Zillow Home Loans to scale under new executive leadership. We are encouraged with our progress and plans to integrate Zillow Home Loans as a payments platform for Zillow Offers as well as our Premier Agent partners to help our shared customers finance their homes. Fourth Quarter and Full Year 2019 Financial Details OPERATING EXPENSE SUMMARY Total operating expenses increased 120% year over year to $1,017.7 million in Q4, driven primarily by the rapid growth in activity associated with the purchase and sale of homes in our Zillow Offers business. Excluding the impact of integration costs, acquisition-related costs and impairment costs we recorded in Q4 2018, IMT segment total costs and expenses declined $9.7 million year over year in Q4 while Mortgages segment total cost and expenses increased $3.1 million. Cost trends in IMT reflected our focus on improving operating leverage and streamlining operations. The increase in our Mortgages segment expenses year over year was primarily driven by the continued build out of our mortgage origination business that we acquired in October 2018. The following table presents certain costs and expenses by segment for the periods presented (in thousands, unaudited): BALANCE SHEET & CASH FLOW SUMMARY We maintain a strong balance sheet that provides us with strategic flexibility to grow our business. We ended 2019 with $2.4 billion in cash and cash equivalents and investments. We also expanded our borrowing capacity during Q4 as we secured an additional non-recourse credit facility with up to $500 million in borrowing capacity to support the expansion of our Zillow Offers business, bringing our total asset-backed, non-recourse credit facility 8 | Q4.2019
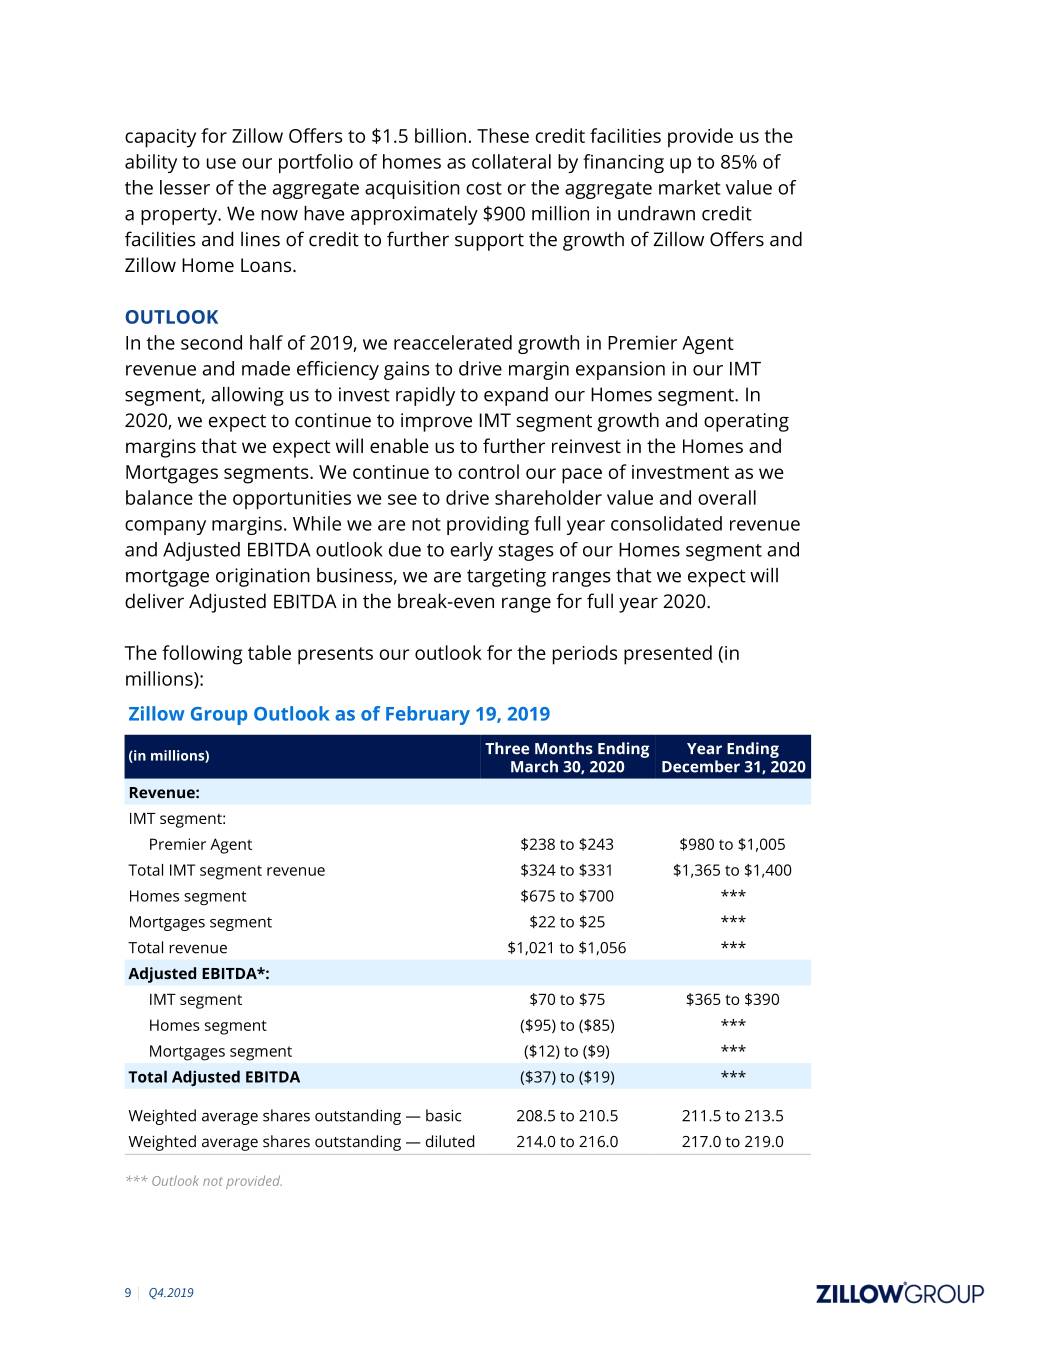
capacity for Zillow Offers to $1.5 billion. These credit facilities provide us the ability to use our portfolio of homes as collateral by financing up to 85% of the lesser of the aggregate acquisition cost or the aggregate market value of a property. We now have approximately $900 million in undrawn credit facilities and lines of credit to further support the growth of Zillow Offers and Zillow Home Loans. OUTLOOK In the second half of 2019, we reaccelerated growth in Premier Agent revenue and made efficiency gains to drive margin expansion in our IMT segment, allowing us to invest rapidly to expand our Homes segment. In 2020, we expect to continue to improve IMT segment growth and operating margins that we expect will enable us to further reinvest in the Homes and Mortgages segments. We continue to control our pace of investment as we balance the opportunities we see to drive shareholder value and overall company margins. While we are not providing full year consolidated revenue and Adjusted EBITDA outlook due to early stages of our Homes segment and mortgage origination business, we are targeting ranges that we expect will deliver Adjusted EBITDA in the break-even range for full year 2020. The following table presents our outlook for the periods presented (in millions): Zillow Group Outlook as of February 19, 2019 (in millions) Three Months Ending Year Ending March 30, 2020 December 31, 2020 Revenue: IMT segment: Premier Agent $238 to $243 $980 to $1,005 Total IMT segment revenue $324 to $331 $1,365 to $1,400 Homes segment $675 to $700 *** Mortgages segment $22 to $25 *** Total revenue $1,021 to $1,056 *** Adjusted EBITDA*: IMT segment $70 to $75 $365 to $390 Homes segment ($95) to ($85) *** Mortgages segment ($12) to ($9) *** Total Adjusted EBITDA ($37) to ($19) *** Weighted average shares outstanding — basic 208.5 to 210.5 211.5 to 213.5 Weighted average shares outstanding — diluted 214.0 to 216.0 217.0 to 219.0 *** Outlook not provided. 9 | Q4.2019
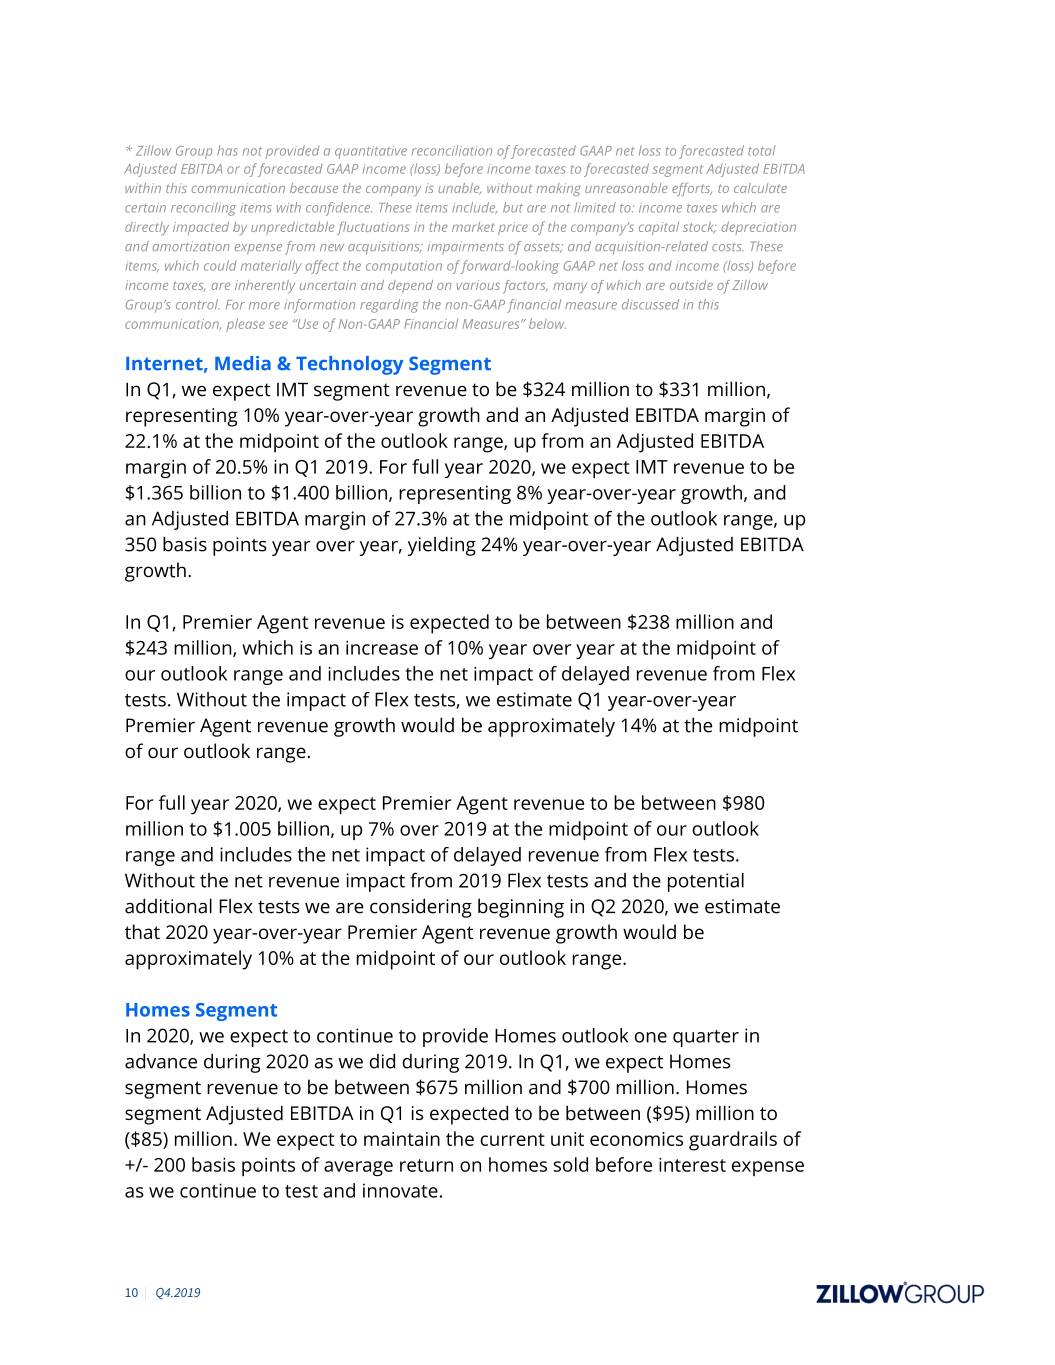
* Zillow Group has not provided a quantitative reconciliation of forecasted GAAP net loss to forecasted total Adjusted EBITDA or of forecasted GAAP income (loss) before income taxes to forecasted segment Adjusted EBITDA within this communication because the company is unable, without making unreasonable efforts, to calculate certain reconciling items with confidence. These items include, but are not limited to: income taxes which are directly impacted by unpredictable fluctuations in the market price of the company’s capital stock; depreciation and amortization expense from new acquisitions; impairments of assets; and acquisition-related costs. These items, which could materially affect the computation of forward-looking GAAP net loss and income (loss) before income taxes, are inherently uncertain and depend on various factors, many of which are outside of Zillow Group’s control. For more information regarding the non-GAAP financial measure discussed in this communication, please see “Use of Non-GAAP Financial Measures” below. Internet, Media & Technology Segment In Q1, we expect IMT segment revenue to be $324 million to $331 million, representing 10% year-over-year growth and an Adjusted EBITDA margin of 22.1% at the midpoint of the outlook range, up from an Adjusted EBITDA margin of 20.5% in Q1 2019. For full year 2020, we expect IMT revenue to be $1.365 billion to $1.400 billion, representing 8% year-over-year growth, and an Adjusted EBITDA margin of 27.3% at the midpoint of the outlook range, up 350 basis points year over year, yielding 24% year-over-year Adjusted EBITDA growth. In Q1, Premier Agent revenue is expected to be between $238 million and $243 million, which is an increase of 10% year over year at the midpoint of our outlook range and includes the net impact of delayed revenue from Flex tests. Without the impact of Flex tests, we estimate Q1 year-over-year Premier Agent revenue growth would be approximately 14% at the midpoint of our outlook range. For full year 2020, we expect Premier Agent revenue to be between $980 million to $1.005 billion, up 7% over 2019 at the midpoint of our outlook range and includes the net impact of delayed revenue from Flex tests. Without the net revenue impact from 2019 Flex tests and the potential additional Flex tests we are considering beginning in Q2 2020, we estimate that 2020 year-over-year Premier Agent revenue growth would be approximately 10% at the midpoint of our outlook range. Homes Segment In 2020, we expect to continue to provide Homes outlook one quarter in advance during 2020 as we did during 2019. In Q1, we expect Homes segment revenue to be between $675 million and $700 million. Homes segment Adjusted EBITDA in Q1 is expected to be between ($95) million to ($85) million. We expect to maintain the current unit economics guardrails of +/- 200 basis points of average return on homes sold before interest expense as we continue to test and innovate. 10 | Q4.2019
Mortgages Segment As we continue to innovate in our mortgages technology platform, we will provide quarterly guidance for the Mortgages segment in 2020. We expect Mortgages revenue in Q1 to be between $22 million and $25 million and Adjusted EBITDA to be between ($12) million to ($9) million. Our new mortgage leadership continues to focus on building the technology, processes and operations to deliver an integrated lending experience for our customers. HOUSING MARKET UPDATE The typical U.S. home is worth $244,054, up 3.7% from a year ago, according to Zillow’s December housing market report. We also note that total transaction values of homes sold in the U.S. were up 10.9% year over year in the December quarter as both the number of home sales and values improved from a year ago. We noted in our Q3 shareholder letter that after years of double-digit growth, the market appeared to be entering a period of stabilization, rather than a true slowdown. The U.S. housing market was stronger-than-expected as total transaction value growth accelerated in Q4 due to increased buyer demand and low mortgage rates. Inventory remains a constraint though as there are 7.5% fewer homes for sale than there were at the end of Q4 last year. Mortgage rates continue to hover near record lows at around 3.6% for a 30-year fixed-rate mortgage, keeping pressure on the lower end of the market. New home builders do appear to be responding to the combination of strong demand, tight existing housing inventory, and affordability challenges, especially on the low end of home values, with new community openings accelerating at lower price points. New home sales are off to a strong start in 2020. Meanwhile, rent growth continues to be stable across the U.S., up 2.6% year over year nationally to $1,600. SUMMARY We ended 2019 in a much stronger position than we started. The past year has been transformational for our company as we began a multi-year journey to replatform real estate in favor of our customers. Our results reflect a sound strategy, operational discipline, and are driven by the hard work of our entire Zillow Group team. Movers increasingly expect a tech-enabled, seamless real estate transaction experience, and we are proving we are best positioned to deliver it directly and in combination with our Premier Agent partners. The concept of trading in your home is one that is starting to be realized by Zillow customers in key markets around the country. For example, the Bowens, who recently sold their house to Zillow, said the process was so seamless it was “like a puzzle fitting together.” The Bowens are not novice movers and knew moving their 11 | Q4.2019
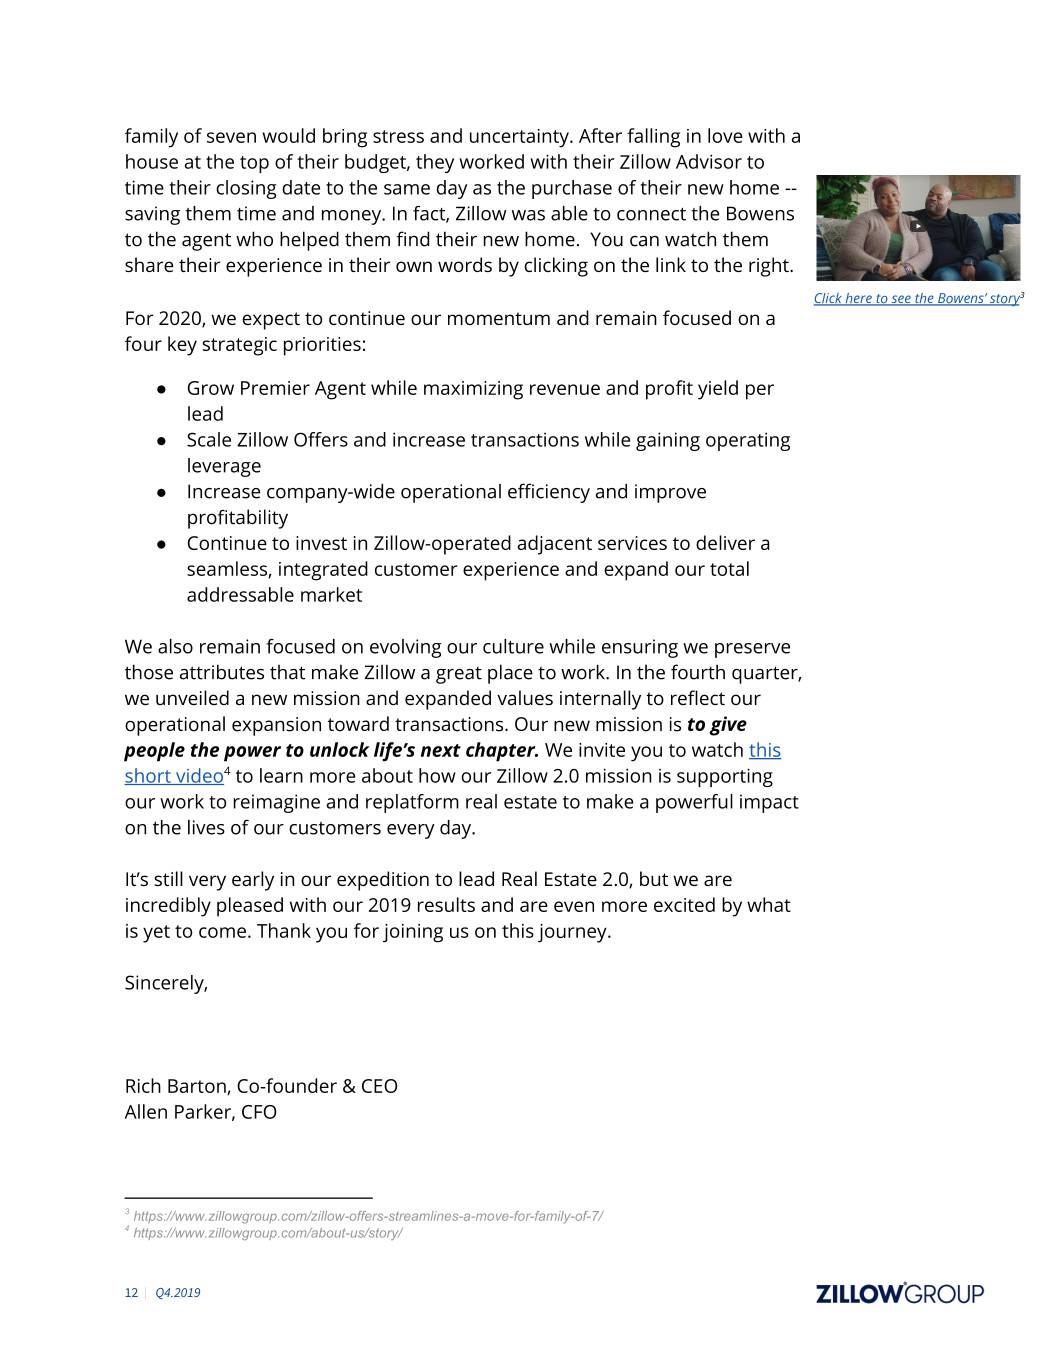
family of seven would bring stress and uncertainty. After falling in love with a house at the top of their budget, they worked with their Zillow Advisor to time their closing date to the same day as the purchase of their new home -- saving them time and money. In fact, Zillow was able to connect the Bowens to the agent who helped them find their new home. You can watch them share their experience in their own words by clicking on the link to the right. Click here to see the Bowens’ story3 For 2020, we expect to continue our momentum and remain focused on a four key strategic priorities: ● Grow Premier Agent while maximizing revenue and profit yield per lead ● Scale Zillow Offers and increase transactions while gaining operating leverage ● Increase company-wide operational efficiency and improve profitability ● Continue to invest in Zillow-operated adjacent services to deliver a seamless, integrated customer experience and expand our total addressable market We also remain focused on evolving our culture while ensuring we preserve those attributes that make Zillow a great place to work. In the fourth quarter, we unveiled a new mission and expanded values internally to reflect our operational expansion toward transactions. Our new mission is to give people the power to unlock life’s next chapter. We invite you to watch t his short video4 to learn more about how our Zillow 2.0 mission is supporting our work to reimagine and replatform real estate to make a powerful impact on the lives of our customers every day. It’s still very early in our expedition to lead Real Estate 2.0, but we are incredibly pleased with our 2019 results and are even more excited by what is yet to come. Thank you for joining us on this journey. Sincerely, Rich Barton, Co-founder & CEO Allen Parker, CFO 3 https://www.zillowgroup.com/zillow-offers-streamlines-a-move-for-family-of-7/ 4 https://www.zillowgroup.com/about-us/story/ 12 | Q4.2019
Forward-Looking Statements This shareholder letter contains forward-looking statements within the meaning of Section 27A of the Securities Act of 1933 and Section 21E of the Securities Exchange Act of 1934 that involve risks and uncertainties, including, without limitation, statements regarding the future of Zillow Offers, Premier Agent, Zillow Home Loans and other parts of our business. Statements containing words such as “may,” “believe,” “anticipate,” “expect,” “intend,” “plan,” “project,” “will,” “projections,” “continue,” “estimate,” “outlook,” “guidance,” or similar expressions, constitute forward-looking statements. Forward-looking statements are made based on assumptions as of February 19, 2020, and although we believe the expectations reflected in the forward-looking statements are reasonable, we cannot guarantee these results. Differences in Zillow Group’s actual results from those described in these forward-looking statements may result from actions taken by Zillow Group as well as from risks and uncertainties beyond Zillow Group’s control. Factors that may contribute to such differences include, but are not limited to, Zillow Group’s ability to execute on strategy; Zillow Group’s ability to maintain and effectively manage an adequate rate of growth; Zillow Group’s ability to innovate and provide products and services that are attractive to its users and advertisers; Zillow Group’s investment of resources to pursue strategies that may not prove effective; Zillow Group’s ability to compete successfully against existing or future competitors; the impact of the real estate industry on Zillow Group’s business; the impact of pending legal proceedings described in Zillow Group’s filings with the Securities and Exchange Commission, or SEC; Zillow Group’s ability to successfully integrate and realize the benefits of its past or future strategic acquisitions or investments; Zillow Group’s ability to maintain or establish relationships with listings and data providers; the reliable performance of Zillow Group’s network infrastructure and content delivery processes; Zillow Group’s ability to obtain or maintain licenses and permits to support our current and future businesses; actual or anticipated changes to our products and services; and Zillow Group’s ability to protect its intellectual property. The foregoing list of risks and uncertainties is illustrative but not exhaustive. For more information about potential factors that could affect Zillow Group’s business and financial results, please review the “Risk Factors” described in Zillow Group’s Annual Report on Form 10-K for the year ended December 31, 2019 filed with the SEC and in Zillow Group’s other filings with the SEC. Except as may be required by law, Zillow Group does not intend, and undertakes no duty to update this information to reflect future events or circumstances. Use of Non-GAAP Financial Measures This communication includes references to Adjusted EBITDA (in total and for each segment, and including forecasted Adjusted EBITDA and EBITDA margin), average return on homes sold before interest expense and Average Return on Homes Sold After Interest Expense, which are non-GAAP financial measures not prepared in conformity with accounting principles generally accepted in the United States (“GAAP”). These non-GAAP financial measures are not prepared under a comprehensive set of accounting rules and, therefore, should only be reviewed alongside results reported under GAAP. Adjusted EBITDA To provide investors with additional information regarding our financial results, this shareholder letter includes references to Adjusted EBITDA (in total and for each segment, and including forecasted Adjusted EBITDA and EBITDA margin), which is a non-GAAP financial measure. We have provided a reconciliation within this shareholder letter of Adjusted EBITDA in total to net loss and Adjusted EBITDA by segment to income (loss) before income taxes for each segment, the most directly comparable GAAP financial measures. Adjusted EBITDA is a key metric used by our management and board of directors to measure operating performance and trends, and to prepare and approve our annual budget. In particular, the exclusion of certain expenses in calculating Adjusted EBITDA facilitates operating performance comparisons on a period-to-period basis.
Our use of Adjusted EBITDA in total and for each segment has limitations as an analytical tool, and you should not consider these measures in isolation or as a substitute for analysis of our results as reported under GAAP. Some of these limitations are: ▪ Adjusted EBITDA does not reflect our cash expenditures or future requirements for capital expenditures or contractual commitments; ▪ Adjusted EBITDA does not reflect changes in, or cash requirements for, our working capital needs; ▪ Adjusted EBITDA does not consider the potentially dilutive impact of share-based compensation; ▪ Although depreciation and amortization are non-cash charges, the assets being depreciated and amortized may have to be replaced in the future, and Adjusted EBITDA does not reflect cash capital expenditure requirements for such replacements or for new capital expenditure requirements; ▪ Adjusted EBITDA does not reflect impairment costs; ▪ Adjusted EBITDA does not reflect acquisition-related costs; ▪ Adjusted EBITDA does not reflect interest expense or other income; ▪ Adjusted EBITDA does not reflect income taxes; and ▪ Other companies, including companies in our own industry, may calculate Adjusted EBITDA differently than we do, limiting its usefulness as a comparative measure. Because of these limitations, you should consider Adjusted EBITDA in total and for each segment alongside other financial performance measures, including various cash flow metrics, net loss and income (loss) before income taxes for each segment and our other GAAP results. The following tables present Adjusted EBITDA along with the most directly comparable GAAP financial measure, which is net loss on a consolidated basis and income (loss) before income taxes for each segment along with the calculation of EBITDA margin and associated year over year growth rates and the most directly comparable GAAP financial measure and related year over growth rates, which is net loss margin on a consolidated basis and income (loss) before income taxes margin for each segment, for the periods presented (in thousands, unaudited):
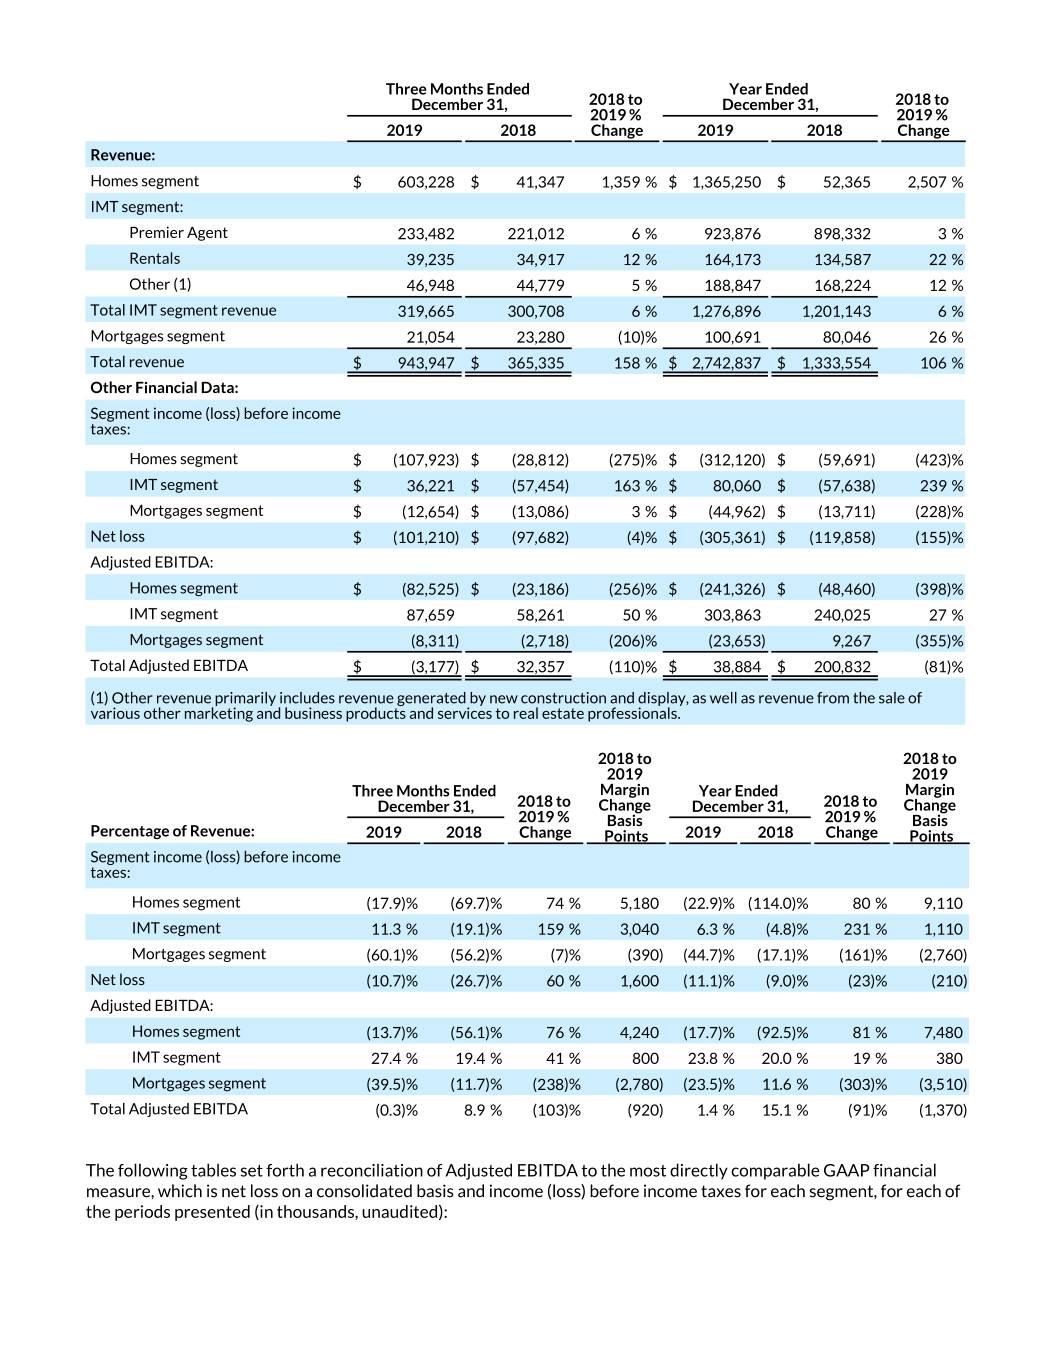
Three Months Ended Year Ended December 31, 2018 to December 31, 2018 to 2019 % 2019 % 2019 2018 Change 2019 2018 Change Revenue: Homes segment $ 603,228 $ 41,347 1,359 % $ 1,365,250 $ 52,365 2,507 % IMT segment: Premier Agent 233,482 221,012 6 % 923,876 898,332 3 % Rentals 39,235 34,917 12 % 164,173 134,587 22 % Other (1) 46,948 44,779 5 % 188,847 168,224 12 % Total IMT segment revenue 319,665 300,708 6 % 1,276,896 1,201,143 6 % Mortgages segment 21,054 23,280 (10)% 100,691 80,046 26 % Total revenue $ 943,947 $ 365,335 158 % $ 2,742,837 $ 1,333,554 106 % Other Financial Data: Segment income (loss) before income taxes: Homes segment $ (107,923) $ (28,812) (275)% $ (312,120) $ (59,691) (423)% IMT segment $ 36,221 $ (57,454) 163 % $ 80,060 $ (57,638) 239 % Mortgages segment $ (12,654) $ (13,086) 3 % $ (44,962) $ (13,711) (228)% Net loss $ (101,210) $ (97,682) (4)% $ (305,361) $ (119,858) (155)% Adjusted EBITDA: Homes segment $ (82,525) $ (23,186) (256)% $ (241,326) $ (48,460) (398)% IMT segment 87,659 58,261 50 % 303,863 240,025 27 % Mortgages segment (8,311) (2,718) (206)% (23,653) 9,267 (355)% Total Adjusted EBITDA $ (3,177) $ 32,357 (110)% $ 38,884 $ 200,832 (81)% (1) Other revenue primarily includes revenue generated by new construction and display, as well as revenue from the sale of various other marketing and business products and services to real estate professionals. 2018 to 2018 to 2019 2019 Three Months Ended Margin Year Ended Margin December 31, 2018 to Change December 31, 2018 to Change 2019 % Basis 2019 % Basis Percentage of Revenue: 2019 2018 Change Points 2019 2018 Change Points Segment income (loss) before income taxes: Homes segment (17.9)% (69.7)% 74 % 5,180 (22.9)% (114.0)% 80 % 9,110 IMT segment 11.3 % (19.1)% 159 % 3,040 6.3 % (4.8)% 231 % 1,110 Mortgages segment (60.1)% (56.2)% (7)% (390) (44.7)% (17.1)% (161)% (2,760) Net loss (10.7)% (26.7)% 60 % 1,600 (11.1)% (9.0)% (23)% (210) Adjusted EBITDA: Homes segment (13.7)% (56.1)% 76 % 4,240 (17.7)% (92.5)% 81 % 7,480 IMT segment 27.4 % 19.4 % 41 % 800 23.8 % 20.0 % 19 % 380 Mortgages segment (39.5)% (11.7)% (238)% (2,780) (23.5)% 11.6 % (303)% (3,510) Total Adjusted EBITDA (0.3)% 8.9 % (103)% (920) 1.4 % 15.1 % (91)% (1,370) The following tables set forth a reconciliation of Adjusted EBITDA to the most directly comparable GAAP financial measure, which is net loss on a consolidated basis and income (loss) before income taxes for each segment, for each of the periods presented (in thousands, unaudited):
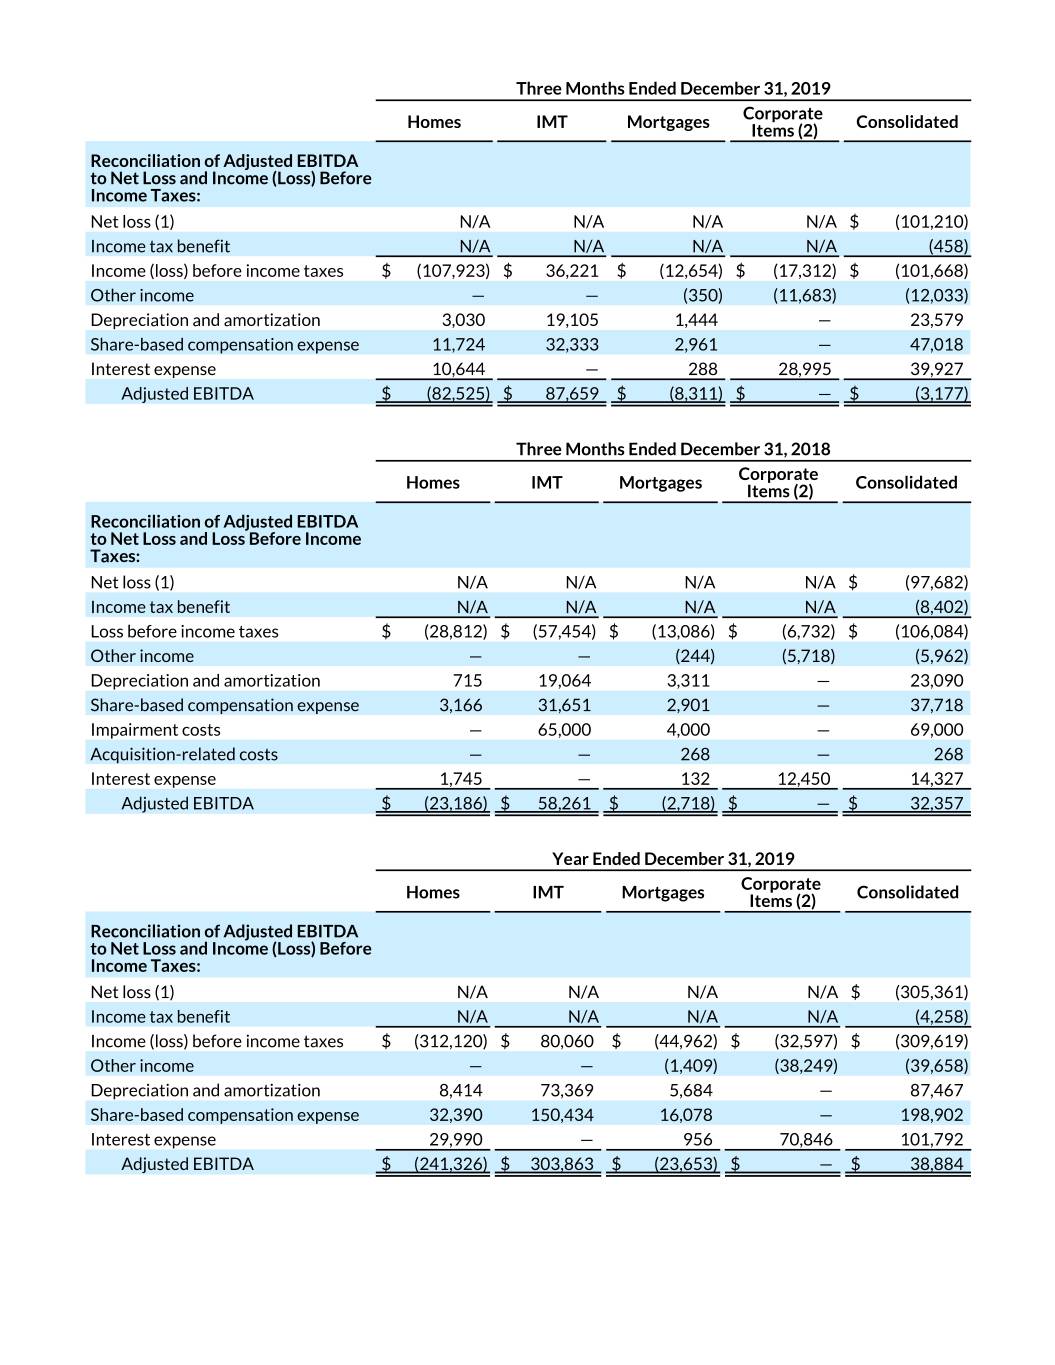
Three Months Ended December 31, 2019 Homes IMT Mortgages Corporate Consolidated Items (2) Reconciliation of Adjusted EBITDA to Net Loss and Income (Loss) Before Income Taxes: Net loss (1) N/A N/A N/A N/A $ (101,210) Income tax benefit N/A N/A N/A N/A (458) Income (loss) before income taxes $ (107,923) $ 36,221 $ (12,654) $ (17,312) $ (101,668) Other income — — (350) (11,683) (12,033) Depreciation and amortization 3,030 19,105 1,444 — 23,579 Share-basedexpense compensation expense 11,724 32,333 2,961 — 47,018 Interest expense 10,644 — 288 28,995 39,927 Adjusted EBITDA $ (82,525) $ 87,659 $ (8,311) $ — $ (3,177) Three Months Ended December 31, 2018 Homes IMT Mortgages Corporate Consolidated Items (2) Reconciliation of Adjusted EBITDA to Net Loss and Loss Before Income Taxes: Net loss (1) N/A N/A N/A N/A $ (97,682) Income tax benefit N/A N/A N/A N/A (8,402) Loss before income taxes $ (28,812) $ (57,454) $ (13,086) $ (6,732) $ (106,084) Other income — — (244) (5,718) (5,962) Depreciation and amortization 715 19,064 3,311 — 23,090 Share-basedexpense compensation expense 3,166 31,651 2,901 — 37,718 Impairment costs — 65,000 4,000 — 69,000 Acquisition-related costs — — 268 — 268 Interest expense 1,745 — 132 12,450 14,327 Adjusted EBITDA $ (23,186) $ 58,261 $ (2,718) $ — $ 32,357 Year Ended December 31, 2019 Homes IMT Mortgages Corporate Consolidated Items (2) Reconciliation of Adjusted EBITDA to Net Loss and Income (Loss) Before Income Taxes: Net loss (1) N/A N/A N/A N/A $ (305,361) Income tax benefit N/A N/A N/A N/A (4,258) Income (loss) before income taxes $ (312,120) $ 80,060 $ (44,962) $ (32,597) $ (309,619) Other income — — (1,409) (38,249) (39,658) Depreciation and amortization 8,414 73,369 5,684 — 87,467 Share-basedexpense compensation expense 32,390 150,434 16,078 — 198,902 Interest expense 29,990 — 956 70,846 101,792 Adjusted EBITDA $ (241,326) $ 303,863 $ (23,653) $ — $ 38,884
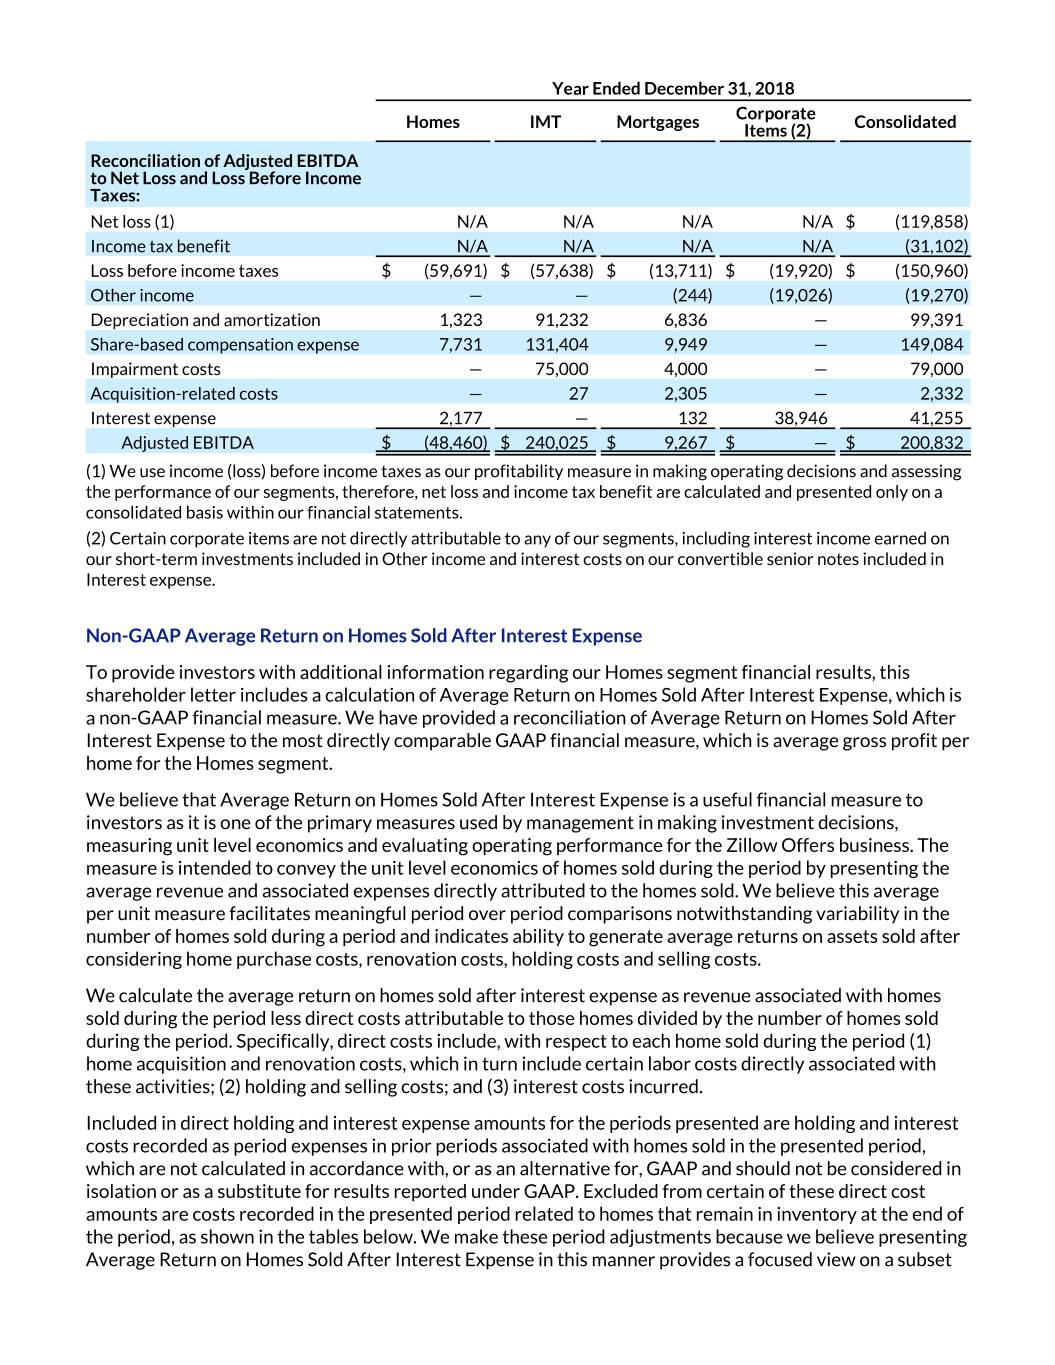
Year Ended December 31, 2018 Homes IMT Mortgages Corporate Consolidated Items (2) Reconciliation of Adjusted EBITDA to Net Loss and Loss Before Income Taxes: Net loss (1) N/A N/A N/A N/A $ (119,858) Income tax benefit N/A N/A N/A N/A (31,102) Loss before income taxes $ (59,691) $ (57,638) $ (13,711) $ (19,920) $ (150,960) Other income — — (244) (19,026) (19,270) Depreciation and amortization 1,323 91,232 6,836 — 99,391 Share-basedexpense compensation expense 7,731 131,404 9,949 — 149,084 Impairment costs — 75,000 4,000 — 79,000 Acquisition-related costs — 27 2,305 — 2,332 Interest expense 2,177 — 132 38,946 41,255 Adjusted EBITDA $ (48,460) $ 240,025 $ 9,267 $ — $ 200,832 (1) We use income (loss) before income taxes as our profitability measure in making operating decisions and assessing the performance of our segments, therefore, net loss and income tax benefit are calculated and presented only on a consolidated basis within our financial statements. (2) Certain corporate items are not directly attributable to any of our segments, including interest income earned on our short-term investments included in Other income and interest costs on our convertible senior notes included in Interest expense. Non-GAAP Average Return on Homes Sold After Interest Expense To provide investors with additional information regarding our Homes segment financial results, this shareholder letter includes a calculation of Average Return on Homes Sold After Interest Expense, which is a non-GAAP financial measure. We have provided a reconciliation of Average Return on Homes Sold After Interest Expense to the most directly comparable GAAP financial measure, which is average gross profit per home for the Homes segment. We believe that Average Return on Homes Sold After Interest Expense is a useful financial measure to investors as it is one of the primary measures used by management in making investment decisions, measuring unit level economics and evaluating operating performance for the Zillow Offers business. The measure is intended to convey the unit level economics of homes sold during the period by presenting the average revenue and associated expenses directly attributed to the homes sold. We believe this average per unit measure facilitates meaningful period over period comparisons notwithstanding variability in the number of homes sold during a period and indicates ability to generate average returns on assets sold after considering home purchase costs, renovation costs, holding costs and selling costs. We calculate the average return on homes sold after interest expense as revenue associated with homes sold during the period less direct costs attributable to those homes divided by the number of homes sold during the period. Specifically, direct costs include, with respect to each home sold during the period (1) home acquisition and renovation costs, which in turn include certain labor costs directly associated with these activities; (2) holding and selling costs; and (3) interest costs incurred. Included in direct holding and interest expense amounts for the periods presented are holding and interest costs recorded as period expenses in prior periods associated with homes sold in the presented period, which are not calculated in accordance with, or as an alternative for, GAAP and should not be considered in isolation or as a substitute for results reported under GAAP. Excluded from certain of these direct cost amounts are costs recorded in the presented period related to homes that remain in inventory at the end of the period, as shown in the tables below. We make these period adjustments because we believe presenting Average Return on Homes Sold After Interest Expense in this manner provides a focused view on a subset
of our assets - homes sold during the period - and reflecting costs associated with those homes sold from the time we acquire to the time we sell the home, which may be useful to investors. Average Return on Homes Sold After Interest Expense is intended to illustrate the performance of homes sold during the period and is not intended to be a segment or company performance metric. Average Return on Homes Sold After Interest Expense is a supplemental measure of operating performance for a subset of assets and has limitations as an analytical tool, and you should not consider it in isolation or as a substitute for analysis of our results as reported under GAAP. Some of these limitations are: • Although depreciation and amortization are non-cash charges, the assets being depreciated and amortized may have to be replaced in the future, and Average Return on Homes Sold After Interest Expense does not reflect capital expenditure requirements for such replacements or for new capital expenditure requirements; • Average Return on Homes Sold After Interest Expense does not consider the potentially dilutive impact of share-based compensation; • Average Return on Homes Sold After Interest Expense does not include period costs that were not eligible for inventory capitalization associated with homes held in inventory at the end of the period; • Average Return on Homes Sold After Interest Expense does not reflect indirect expenses included in cost of revenue, sales and marketing, technology and development, or general and administrative expenses, some of which are recurring cash expenditures necessary to operate the business; and • Average Return on Homes Sold After Interest Expense does not reflect income taxes. The calculation of Average Return on Homes Sold After Interest Expense includes only those expenses directly attributed to the homes sold during the period. To arrive at return on homes sold after interest expense, the Company deducts from Homes segment gross profit (1) holding costs incurred in the presented period and prior periods for homes sold during the presented period that are included in sales and marketing expense, (2) selling costs incurred in the presented period for homes sold during the presented period that are included in sales and marketing expense and (3) interest expense incurred in the presented and prior periods for homes sold during the presented period. The Company adds to Homes segment gross profit (1) inventory valuation adjustments recorded during the period associated with homes that remain in inventory at period end, net of inventory valuation adjustments recorded in prior periods related to homes sold in the presented period, and indirect expenses included in cost of revenue and (2) share-based compensation expense and depreciation and amortization expense included in cost of revenue. The following tables present the calculation of Homes segment average gross profit per home and Average Return on Homes Sold After Interest Expense and a reconciliation of return on homes sold after interest expense to Homes segment gross profit for the periods presented (unaudited):
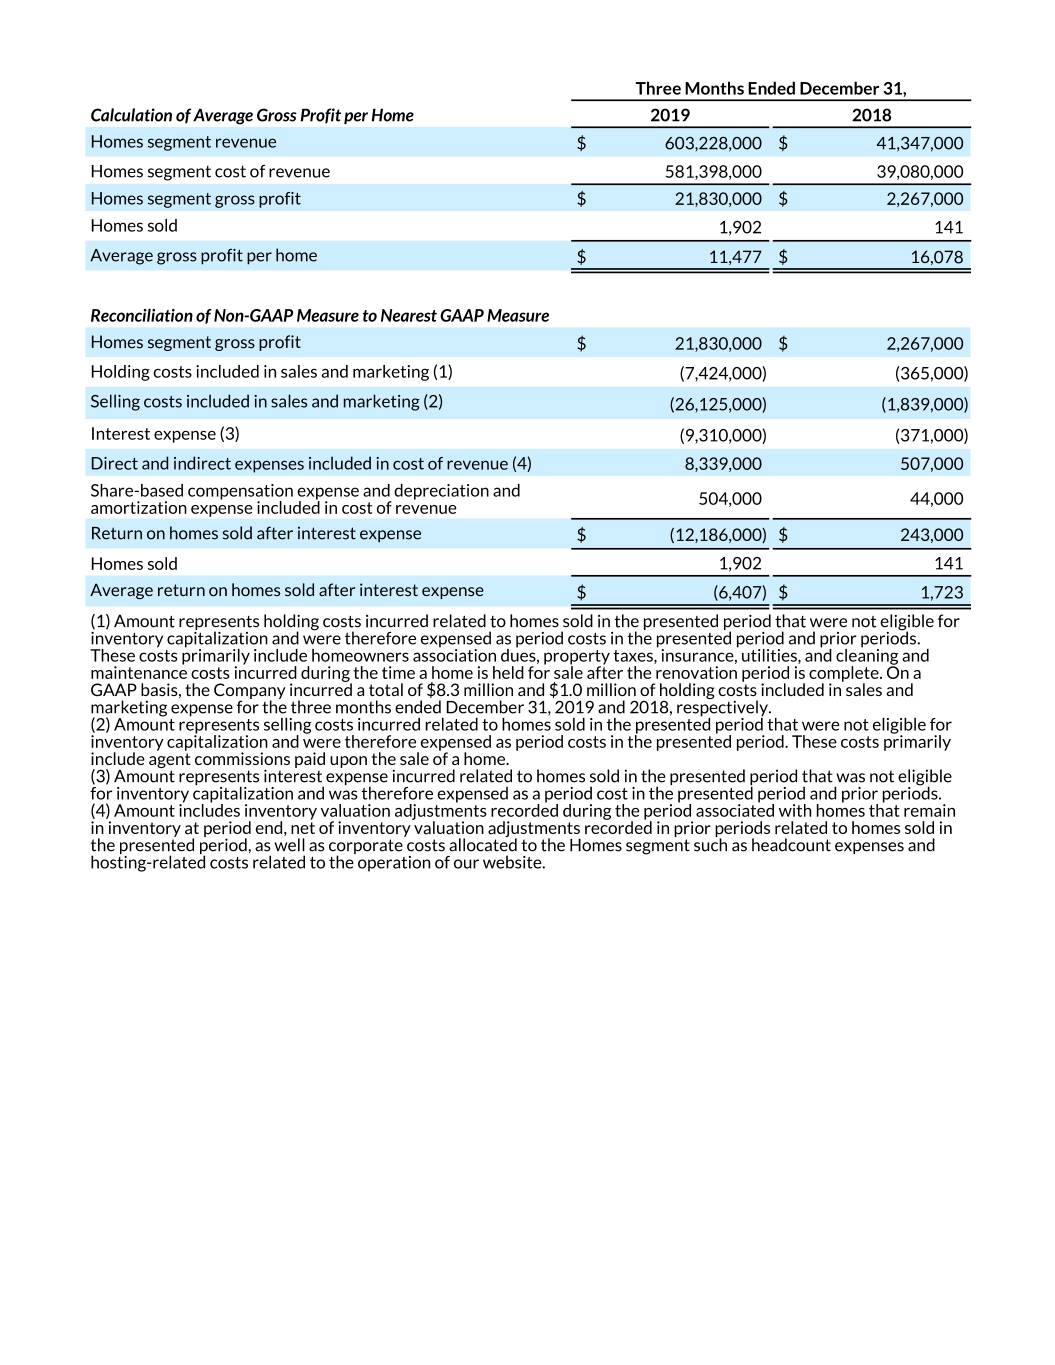
Three Months Ended December 31, Calculation of Average Gross Profit per Home 2019 2018 Homes segment revenue $ 603,228,000 $ 41,347,000 Homes segment cost of revenue 581,398,000 39,080,000 Homes segment gross profit $ 21,830,000 $ 2,267,000 Homes sold 1,902 141 Average gross profit per home $ 11,477 $ 16,078 Reconciliation of Non-GAAP Measure to Nearest GAAP Measure Homes segment gross profit $ 21,830,000 $ 2,267,000 Holding costs included in sales and marketing (1) (7,424,000) (365,000) Selling costs included in sales and marketing (2) (26,125,000) (1,839,000) Interest expense (3) (9,310,000) (371,000) Direct and indirect expenses included in cost of revenue (4) 8,339,000 507,000 Share-based compensation expense and depreciation and 504,000 44,000 amortization expense included in cost of revenue Return on homes sold after interest expense $ (12,186,000) $ 243,000 Homes sold 1,902 141 Average return on homes sold after interest expense $ (6,407) $ 1,723 (1) Amount represents holding costs incurred related to homes sold in the presented period that were not eligible for inventory capitalization and were therefore expensed as period costs in the presented period and prior periods. These costs primarily include homeowners association dues, property taxes, insurance, utilities, and cleaning and maintenance costs incurred during the time a home is held for sale after the renovation period is complete. On a GAAP basis, the Company incurred a total of $8.3 million and $1.0 million of holding costs included in sales and marketing expense for the three months ended December 31, 2019 and 2018, respectively. (2) Amount represents selling costs incurred related to homes sold in the presented period that were not eligible for inventory capitalization and were therefore expensed as period costs in the presented period. These costs primarily include agent commissions paid upon the sale of a home. (3) Amount represents interest expense incurred related to homes sold in the presented period that was not eligible for inventory capitalization and was therefore expensed as a period cost in the presented period and prior periods. (4) Amount includes inventory valuation adjustments recorded during the period associated with homes that remain in inventory at period end, net of inventory valuation adjustments recorded in prior periods related to homes sold in the presented period, as well as corporate costs allocated to the Homes segment such as headcount expenses and hosting-related costs related to the operation of our website.
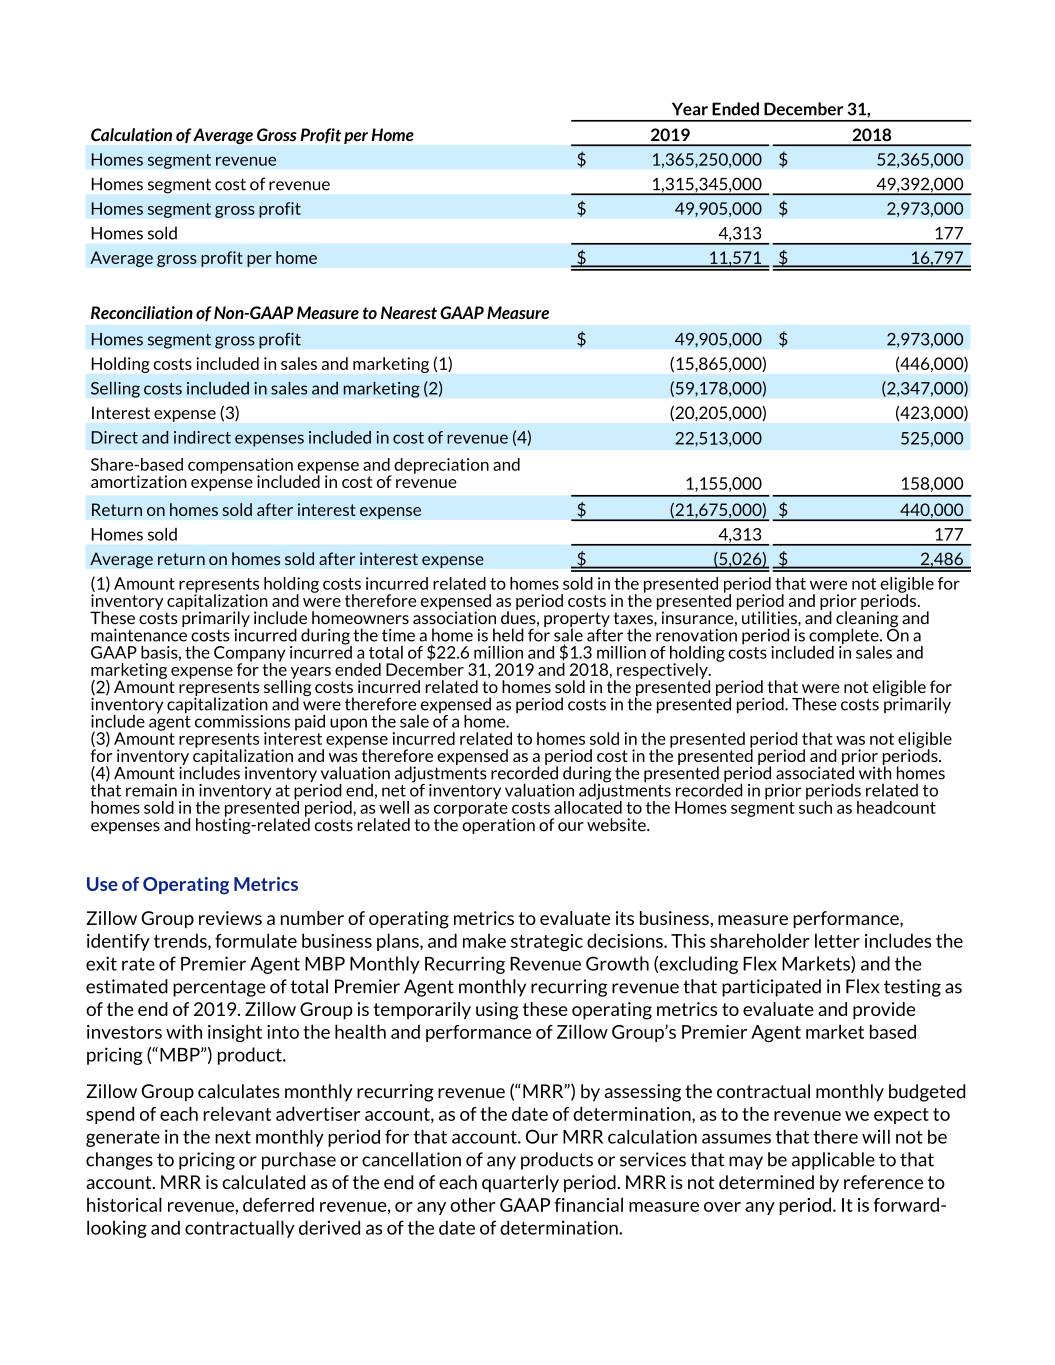
Year Ended December 31, Calculation of Average Gross Profit per Home 2019 2018 Homes segment revenue $ 1,365,250,000 $ 52,365,000 Homes segment cost of revenue 1,315,345,000 49,392,000 Homes segment gross profit $ 49,905,000 $ 2,973,000 Homes sold 4,313 177 Average gross profit per home $ 11,571 $ 16,797 Reconciliation of Non-GAAP Measure to Nearest GAAP Measure Homes segment gross profit $ 49,905,000 $ 2,973,000 Holding costs included in sales and marketing (1) (15,865,000) (446,000) Selling costs included in sales and marketing (2) (59,178,000) (2,347,000) Interest expense (3) (20,205,000) (423,000) Direct and indirect expenses included in cost of revenue (4) 22,513,000 525,000 Share-based compensation expense and depreciation and amortization expense included in cost of revenue 1,155,000 158,000 Return on homes sold after interest expense $ (21,675,000) $ 440,000 Homes sold 4,313 177 Average return on homes sold after interest expense $ (5,026) $ 2,486 (1) Amount represents holding costs incurred related to homes sold in the presented period that were not eligible for inventory capitalization and were therefore expensed as period costs in the presented period and prior periods. These costs primarily include homeowners association dues, property taxes, insurance, utilities, and cleaning and maintenance costs incurred during the time a home is held for sale after the renovation period is complete. On a GAAP basis, the Company incurred a total of $22.6 million and $1.3 million of holding costs included in sales and marketing expense for the years ended December 31, 2019 and 2018, respectively. (2) Amount represents selling costs incurred related to homes sold in the presented period that were not eligible for inventory capitalization and were therefore expensed as period costs in the presented period. These costs primarily include agent commissions paid upon the sale of a home. (3) Amount represents interest expense incurred related to homes sold in the presented period that was not eligible for inventory capitalization and was therefore expensed as a period cost in the presented period and prior periods. (4) Amount includes inventory valuation adjustments recorded during the presented period associated with homes that remain in inventory at period end, net of inventory valuation adjustments recorded in prior periods related to homes sold in the presented period, as well as corporate costs allocated to the Homes segment such as headcount expenses and hosting-related costs related to the operation of our website. Use of Operating Metrics Zillow Group reviews a number of operating metrics to evaluate its business, measure performance, identify trends, formulate business plans, and make strategic decisions. This shareholder letter includes the exit rate of Premier Agent MBP Monthly Recurring Revenue Growth (excluding Flex Markets) and the estimated percentage of total Premier Agent monthly recurring revenue that participated in Flex testing as of the end of 2019. Zillow Group is temporarily using these operating metrics to evaluate and provide investors with insight into the health and performance of Zillow Group’s Premier Agent market based pricing (“MBP”) product. Zillow Group calculates monthly recurring revenue (“MRR”) by assessing the contractual monthly budgeted spend of each relevant advertiser account, as of the date of determination, as to the revenue we expect to generate in the next monthly period for that account. Our MRR calculation assumes that there will not be changes to pricing or purchase or cancellation of any products or services that may be applicable to that account. MRR is calculated as of the end of each quarterly period. MRR is not determined by reference to historical revenue, deferred revenue, or any other GAAP financial measure over any period. It is forward- looking and contractually derived as of the date of determination.

For purposes of estimating the percentage of total Premier Agent MRR that was testing Flex as of the end of 2019, we used the total MRR for all Premier Agent and Premier Broker accounts. In order to isolate the performance of MBP, we calculate the Premier Agent MBP MRR Growth metric by excluding from all periods presented (i) ancillary and add-on products sold separately from MBP, (ii) seller leads, and (iii) the impact of MBP MRR attributable to accounts in markets that transitioned to our Flex pricing model as of the end of 2019. The percentage growth rates illustrate percentage change in MRR as of the end of a quarterly period compared to MRR for the same period in the prior year.
