Exhibit 99.1
Zillow Group Reports First Quarter 2020 Financial Results
Q1 results met or exceeded pre-COVID-19 outlook;
Customer signals show real estate’s resiliency as people still shopping and moving
SEATTLE – May 7, 2020 – Zillow Group, Inc. (NASDAQ:Z) (NASDAQ:ZG), which is transforming the way people buy, sell, rent and finance homes, today announced its consolidated financial results for the three months ended March 31, 2020. The company’s consolidated quarterly revenue grew by 148% year over year, driven by increasing Zillow Offers sales velocity and strong performance in the Premier Agent business, despite headwinds in March because of the coronavirus pandemic.
Complete financial results and outlook for the second quarter of 2020 can be found in our shareholder letter and in the investor relations section of Zillow Group’s website at https://investors.zillowgroup.com/investors/financials/quarterly-results/default.aspx.
“During Q1, we learned the true value of home. We also learned real estate is resilient as we’re seeing clear signals that people are still shopping for homes and want to move,” said Rich Barton, CEO and co-founder of Zillow Group. “Our Q1 results met or beat our outlook on all measures despite some volatility in the second half of March. We started the year strong, coming off a solid 2019 and ended the first quarter with an even stronger balance sheet, including a record cash balance. There is light on the horizon, and we’re well positioned to move faster to the future, offering our customers and partners innovative products and services, such as our proprietary 3D Home Tours, to enable seamless and safe transactions in a more virtual world. The virtual tools home shoppers need for safety today will become their expectations for convenience tomorrow.”
First quarter 2020 highlights include:
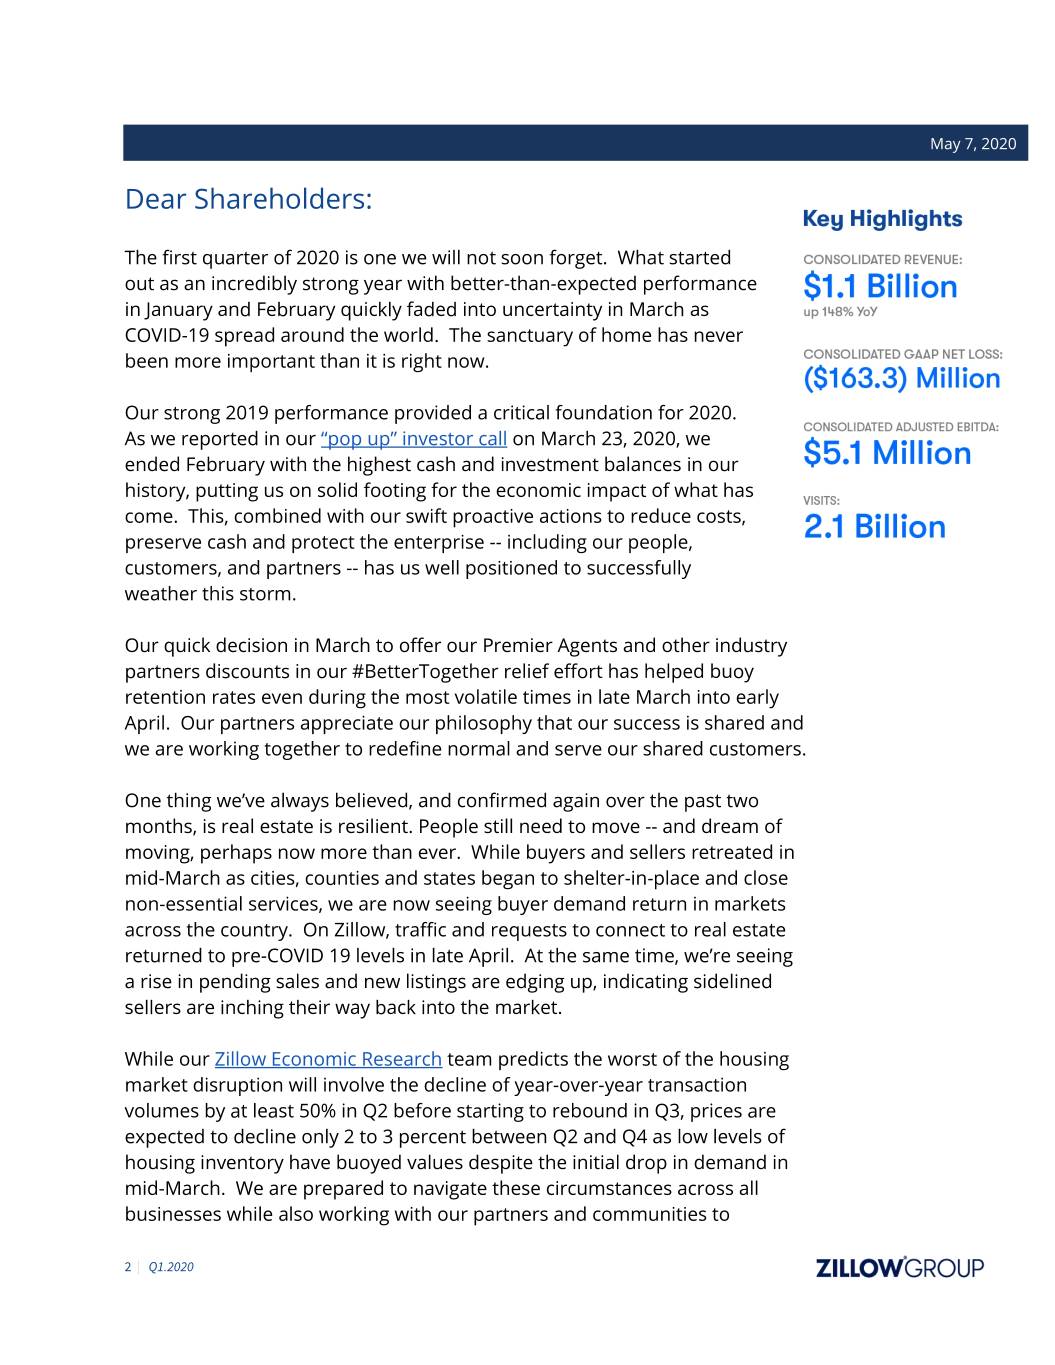
•Total consolidated revenue grew 148% year over year to $1.1 billion.
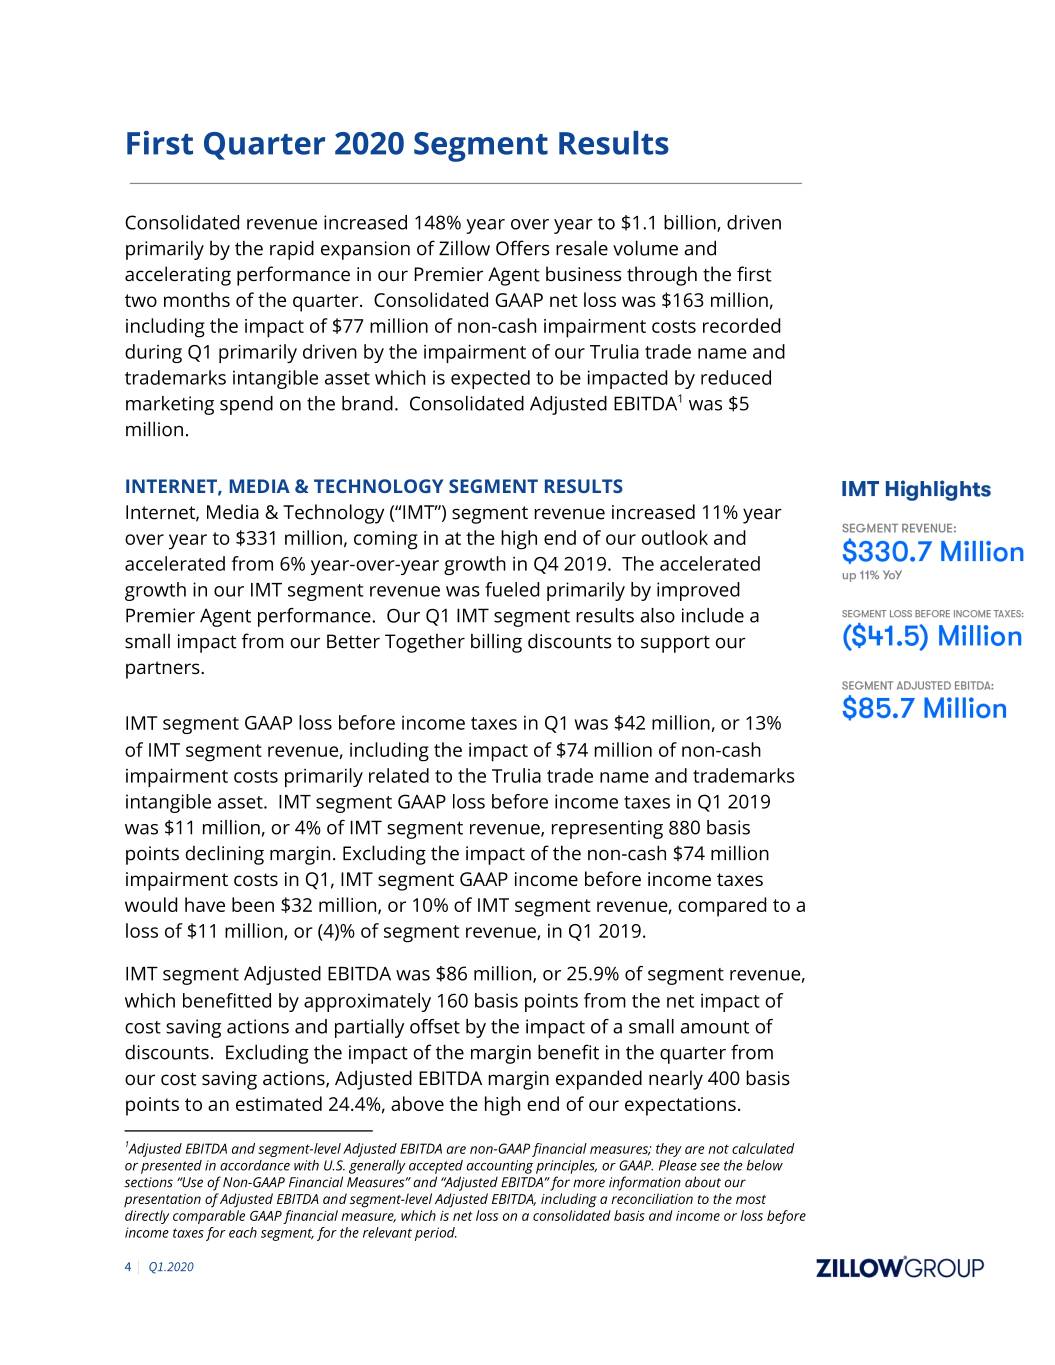
•Segment loss before income taxes was $41.5 million, $98 million and $13.1 million for the IMT, Homes and Mortgages segments, respectively.
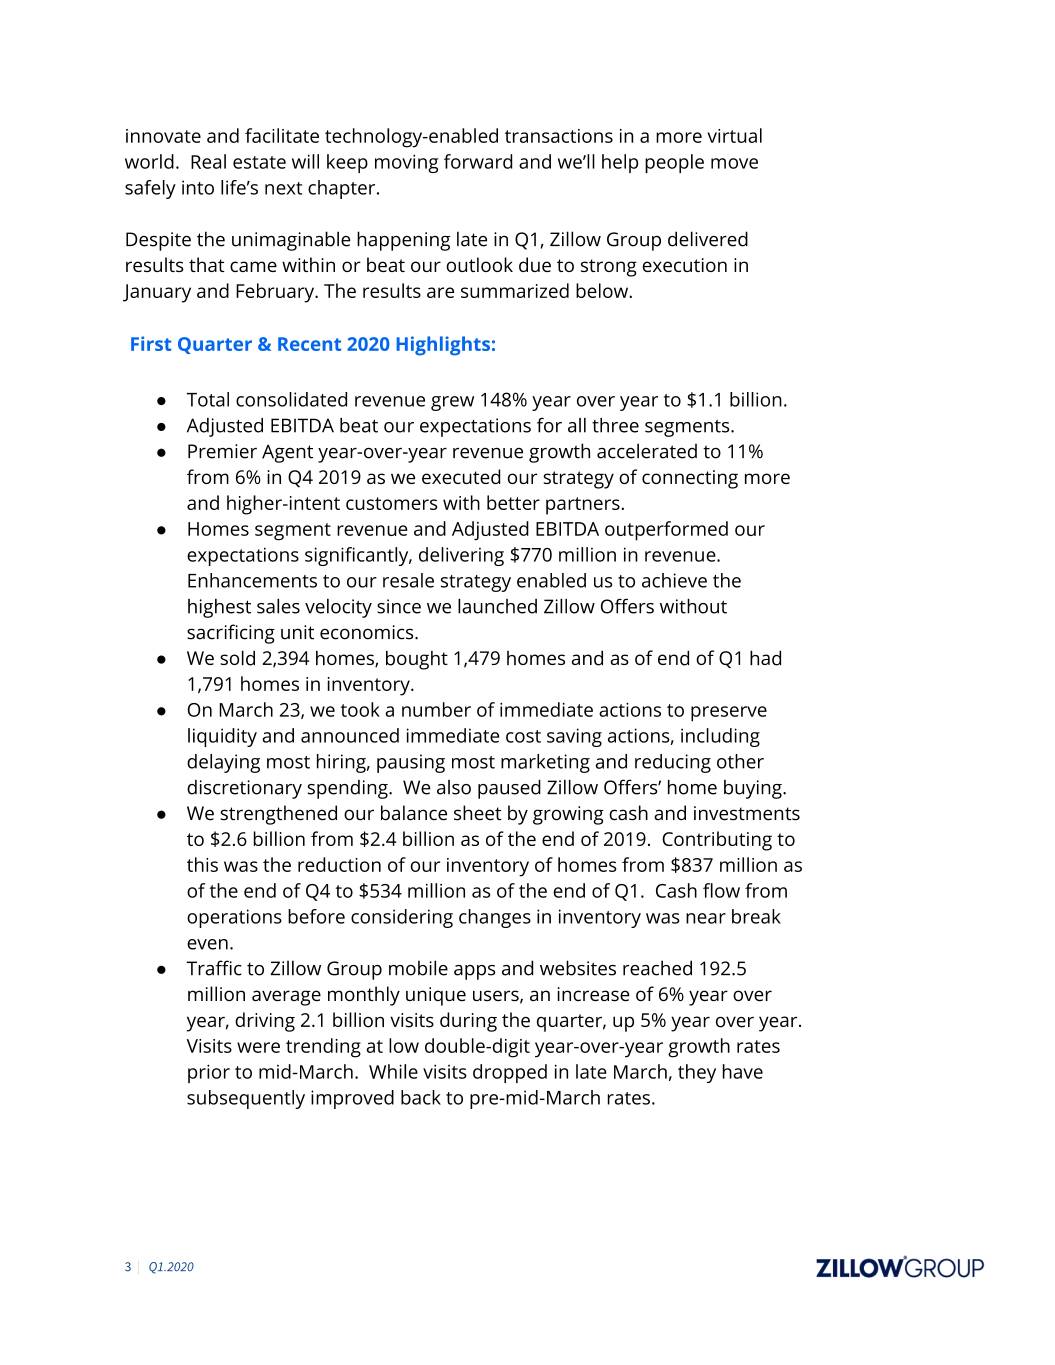
•Adjusted EBITDA beat company expectations for all three segments.
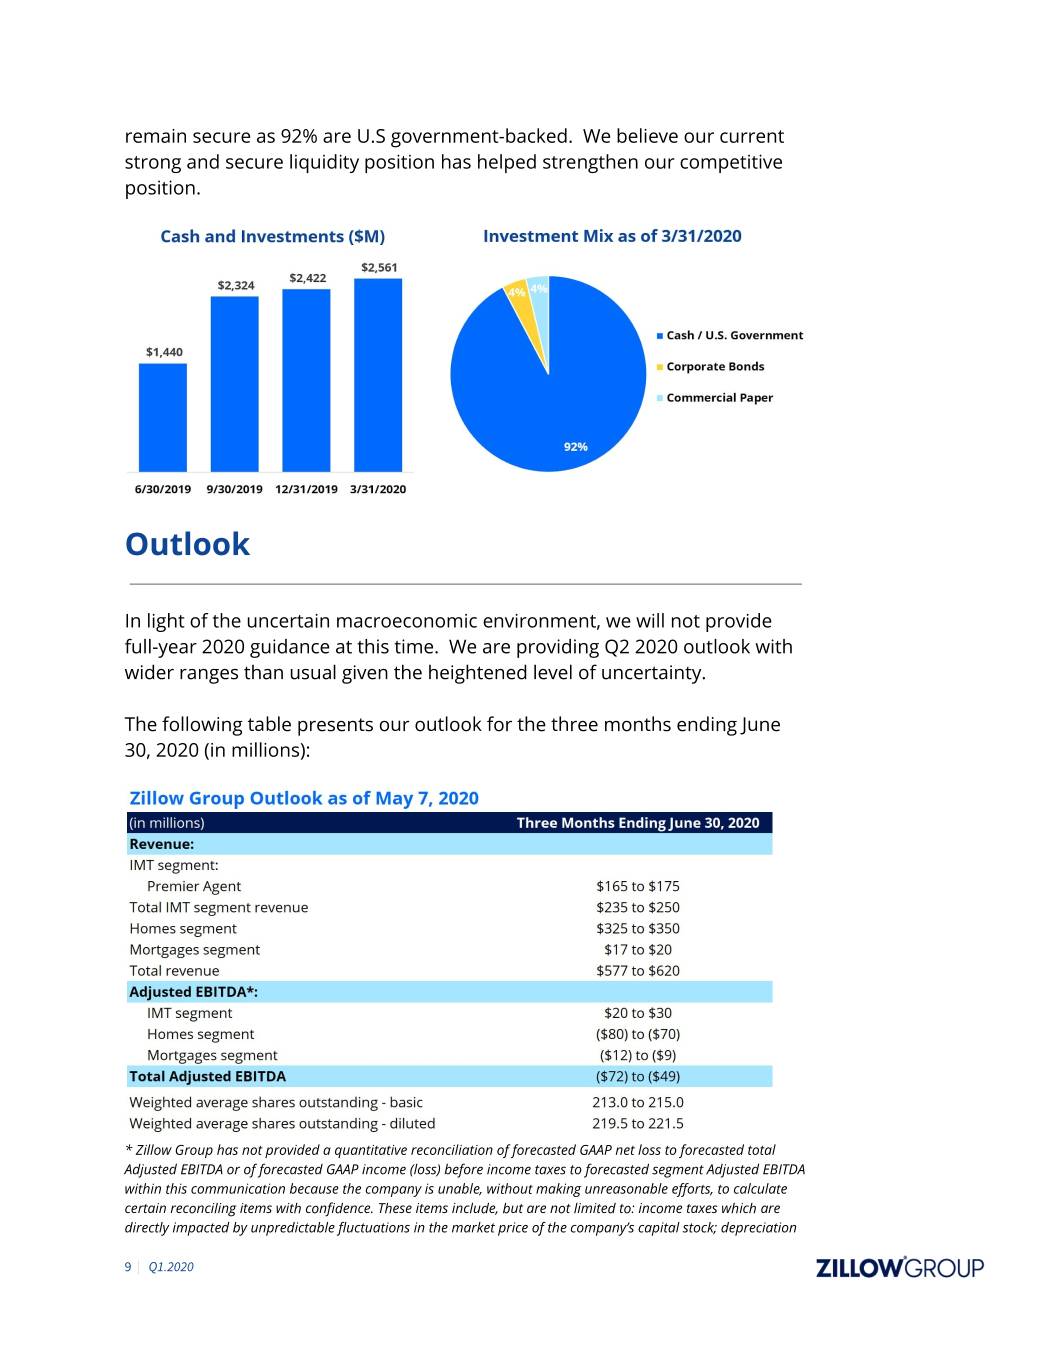
•The company exited the quarter with a strong balance sheet, growing cash and investments to $2.6 billion from $2.4 billion as of the end of 2019.
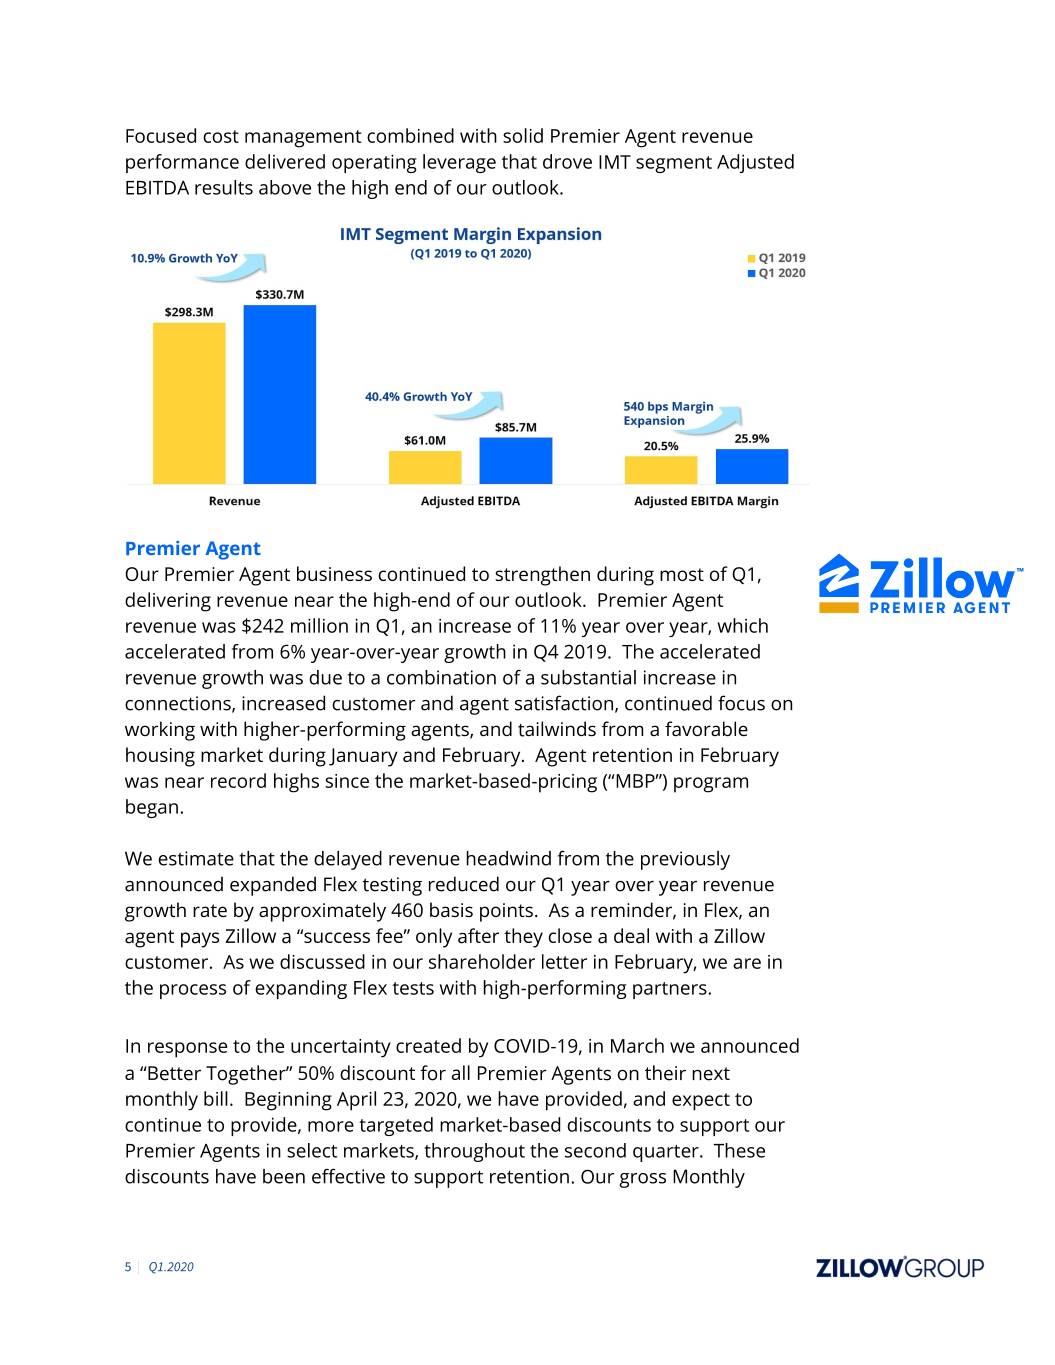
•Premier Agent year-over-year revenue growth accelerated to 11% from 6% in Q4 2019 driven by strategy execution to connect our customers with high-performing partners.
•Homes segment revenue and Adjusted EBITDA outperformed company expectations significantly, delivering nearly $770 million in revenue. The company achieved the highest sales velocity since Zillow Offers launched.*
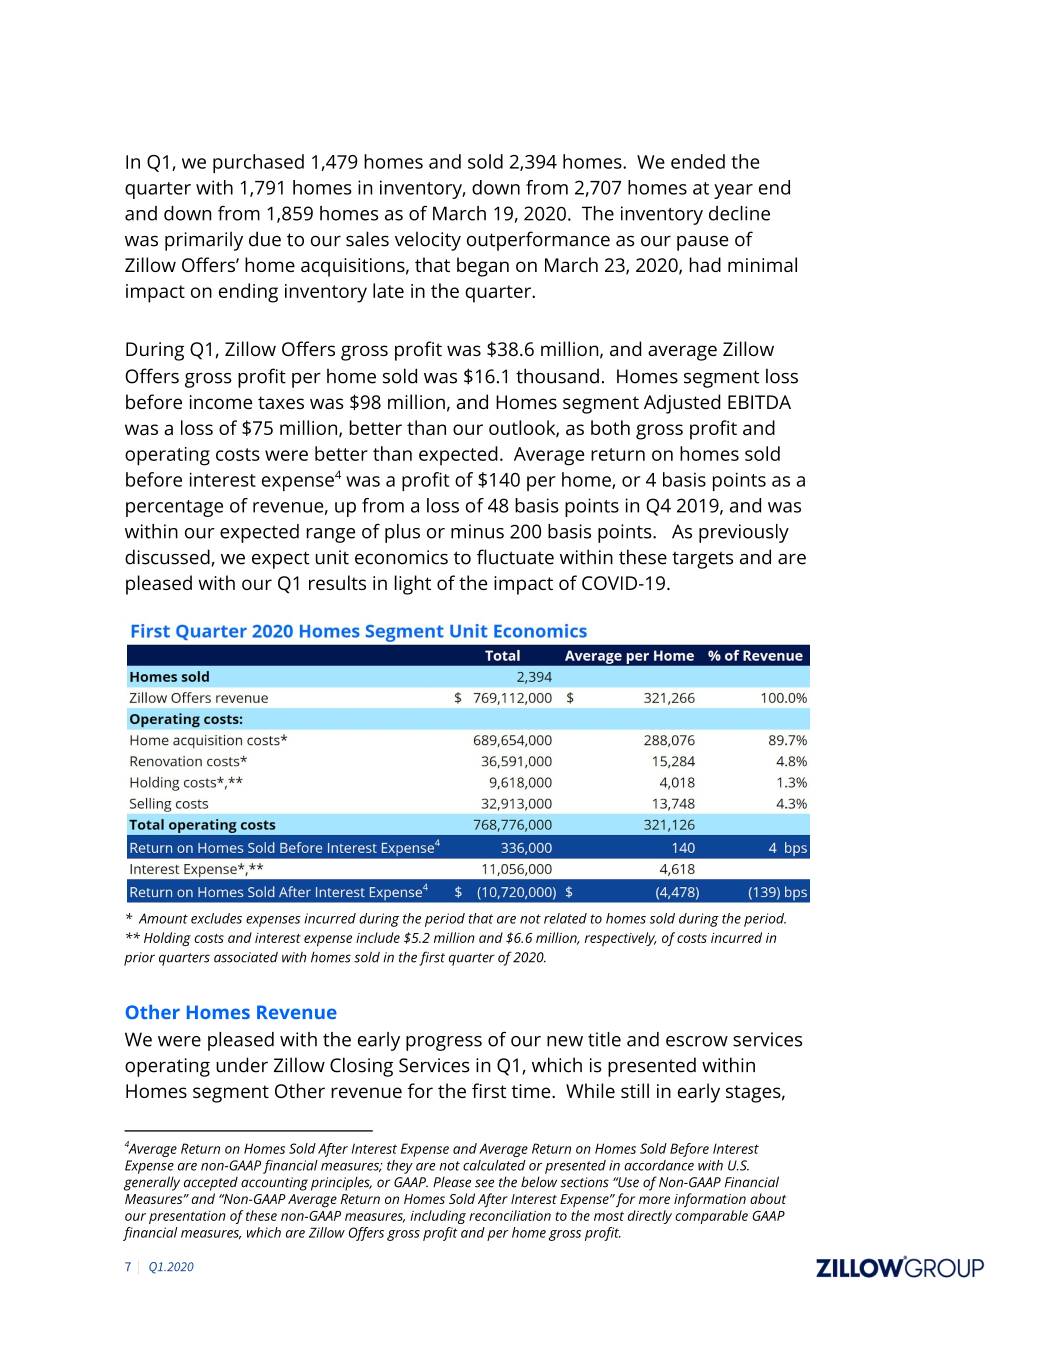
•During the quarter, the company sold 2,394 homes and purchased 1,479 homes through Zillow Offers, ending Q1 with 1,791 homes in inventory, intentionally down from 2,707 homes at the end of the fourth quarter.
•Traffic to Zillow Group’s mobile apps and websites reached 192.5 million average monthly unique users, an increase of 6% year over year, driving 2.1 billion visits during the quarter.
*Monthly sales velocity is calculated by dividing the number of homes sold in a given calendar month by the number of homes held in inventory as of the beginning of such calendar month. Quarterly sales velocity is calculated by averaging the monthly sales velocities during a given quarter.
First Quarter 2020 Financial Highlights
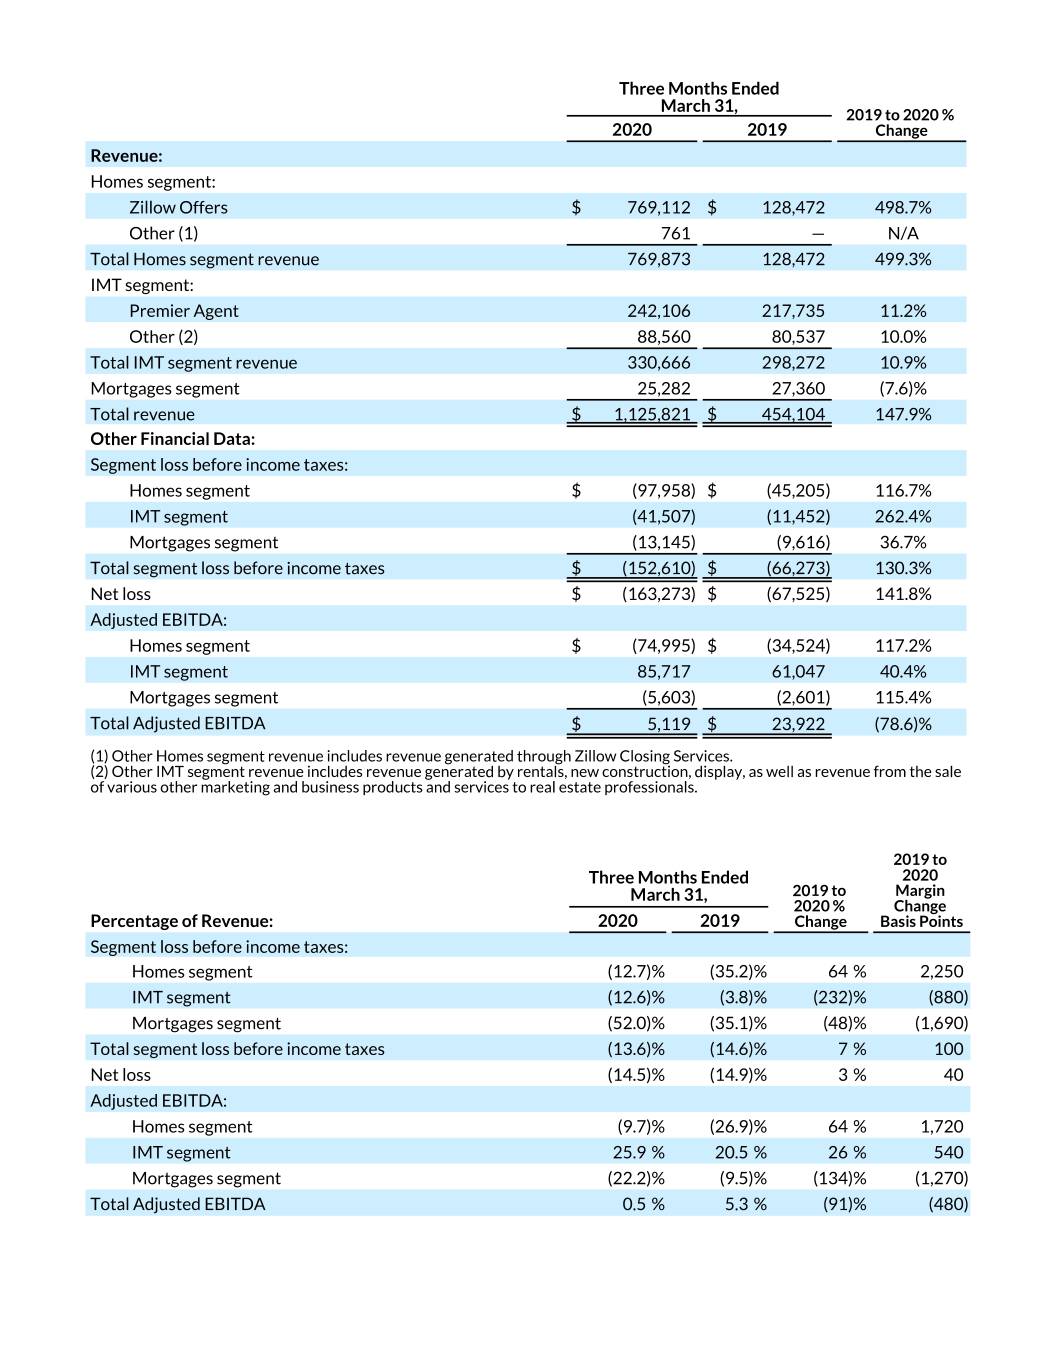
The following table sets forth Zillow Group’s financial highlights for the periods presented (in thousands, unaudited):
| | | | | | | | | | | | | | | | | |
| | Three Months Ended
March 31, | | | | 2019 to 2020
% Change |
| | 2020 | | 2019 | | |
| Revenue: | | | | | |
| Homes segment: | | | | | | | |
Zillow Offers | $ | 769,112 | | | $ | 128,472 | | | 499% |
Other (1) | 761 | | | — | | | N/A |
| Total Homes segment revenue | 769,873 | | | 128,472 | | | 499% |
| IMT segment: | | | | | |
Premier Agent | 242,106 | | | 217,735 | | | 11% |
Other (2) | 88,560 | | | 80,537 | | | 10% |
| Total IMT segment revenue | 330,666 | | | 298,272 | | | 11% |
| Mortgages segment | 25,282 | | | 27,360 | | | (8)% |
| Total revenue | $ | 1,125,821 | | | $ | 454,104 | | | 148% |
| Other Financial Data: | | | | | |
| Segment loss before income taxes: | | | | | |
Homes segment | $ | (97,958) | | | $ | (45,205) | | | |
IMT segment | (41,507) | | | (11,452) | | | |
Mortgages segment | (13,145) | | | (9,616) | | | |
| Total segment loss before income taxes | $ | (152,610) | | | $ | (66,273) | | | |
| Net loss | $ | (163,273) | | | $ | (67,525) | | | |
| Adjusted EBITDA (3): | | | | | |
Homes segment | $ | (74,995) | | | $ | (34,524) | | | |
IMT segment | 85,717 | | | 61,047 | | | |
Mortgages segment | (5,603) | | | (2,601) | | | |
| Total Adjusted EBITDA | $ | 5,119 | | | $ | 23,922 | | | |
| Percentage of Revenue: | | | | | |
| Segment loss before income taxes: | | | | | |
Homes segment | (13) | % | | (35) | % | | |
IMT segment | (13) | % | | (4) | % | | |
Mortgages segment | (52) | % | | (35) | % | | |
| Total segment loss before income taxes | (14) | % | | (15) | % | | |
| Net loss | (15) | % | | (15) | % | | |
| Adjusted EBITDA: | | | | | |
Homes segment | (10) | % | | (27) | % | | |
IMT segment | 26 | % | | 20 | % | | |
Mortgages segment | (22) | % | | (10) | % | | |
| Total Adjusted EBITDA | — | % | | 5 | % | | |
(1) Other Homes segment revenue includes revenue generated through Zillow Closing Services. (2) Other IMT segment revenue includes revenue generated by rentals, new construction and display, as well as revenue from the sale of various other marketing and business products and services to real estate professionals. (3) Adjusted EBITDA is a non-GAAP financial measure; it is not calculated or presented in accordance with U.S. generally accepted accounting principles, or GAAP. See below for more information regarding our presentation of Adjusted EBITDA, including a reconciliation of Adjusted EBITDA to the most directly comparable GAAP financial measure, which is net loss on a consolidated basis and loss before income taxes for each segment, for each of the periods presented. | | | | | |
Conference Call and Webcast Information
Zillow Group CEO & co-founder Rich Barton and CFO Allen Parker will host a live conference call and webcast to discuss the results today at 2 p.m. Pacific Time (5 p.m. Eastern Time). A Shareholder Letter is available on the Quarterly Results section of Zillow Group’s investor relations website at https://investors.zillowgroup.com/financials/quarterly-results/default.aspx prior to the live conference call and webcast.
A link to the live webcast and recorded replay of the conference call will be available on the investor relations section of Zillow Group’s website. The live call may also be accessed via telephone at (866) 324-3683 toll-free domestically and at (509) 844-0959 internationally. The conference ID number is 9294903 and can be used for both domestic and international callers.
Forward-Looking Statements
This press release contains forward-looking statements within the meaning of Section 27A of the Securities Act of 1933 and Section 21E of the Securities Exchange Act of 1934 that involve risks and uncertainties, including, without limitation, statements regarding our business outlook for 2020; the future performance and operation of the Homes, Mortgages and IMT segments in 2020 and beyond; and the current and future health and stability of the residential housing market and economy. Statements containing words such as “may,” “believe,” “anticipate,” “expect,” “intend,” “plan,” “project,” “predict,” “will,” “projections,” “continue,” “estimate,” “outlook,” “guidance,” or similar expressions constitute forward-looking statements. Forward-looking statements are made based on assumptions as of May 7, 2020, and although we believe the expectations reflected in the forward-looking statements are reasonable, we cannot guarantee these results. Differences in Zillow Group’s actual results from those described in these forward-looking statements may result from actions taken by Zillow Group as well as from risks and uncertainties beyond Zillow Group’s control. Factors that may contribute to such differences include, but are not limited to, the impact of the novel coronavirus (“COVID-19”) pandemic and any associated economic downturn on Zillow Group’s future financial position, operations and financial performance; the magnitude, duration and severity of the COVID-19 pandemic; the current and future health and stability of the economy and residential housing market, including any extended slowdown in the real estate markets as a result of COVID-19; Zillow Group’s ability to execute on strategy; Zillow Group’s ability to maintain and effectively manage an adequate rate of growth; Zillow Group’s ability to innovate and provide products and services that are attractive to its users and advertisers; Zillow Group’s investment of resources to pursue strategies that may not prove effective; Zillow Group’s ability to compete successfully against existing or future competitors; the impact of pending legal proceedings described in Zillow Group’s filings with the Securities and Exchange Commission, or SEC; Zillow Group’s ability to successfully integrate and realize the benefits of its past or future strategic acquisitions or investments; Zillow Group’s ability to maintain or establish relationships with listings and data providers; the reliable performance of Zillow Group’s network infrastructure and content delivery processes; Zillow Group’s ability to obtain or maintain licenses and permits to support our current and future businesses; actual or anticipated changes to our products and services; and Zillow Group’s ability to protect its intellectual property. The foregoing list of risks and uncertainties is illustrative but not exhaustive. For more information about potential factors that could affect Zillow Group’s business and financial results, please review the “Risk Factors” described in Zillow Group’s Annual Report on Form 10-K for the year ended December 31, 2019 and in Zillow Group’s Quarterly Report on Form 10-Q for the three months ended March 31, 2020 filed with the SEC and in Zillow Group’s other filings with the SEC. Except as may be required by law, Zillow Group does not intend and undertakes no duty to update this information to reflect future events or circumstances.
Use of Non-GAAP Financial Measures
To provide investors with additional information regarding our financial results, this press release includes references to Adjusted EBITDA in total and for each segment, each a non-GAAP financial measure. We have provided a reconciliation within this earnings release of Adjusted EBITDA in total to net loss and Adjusted EBITDA by segment to loss before income taxes for each segment, the most directly comparable GAAP financial measures.
Adjusted EBITDA is a key metric used by our management and board of directors to measure operating performance and trends and to prepare and approve our annual budget. In particular, the exclusion of certain expenses in calculating Adjusted EBITDA facilitates operating performance comparisons on a period-to-period basis.
Our use of Adjusted EBITDA in total and for each segment has limitations as an analytical tool, and you should not consider these measures in isolation or as a substitute for analysis of our results as reported under GAAP. Some of these limitations are:
▪Adjusted EBITDA does not reflect our cash expenditures or future requirements for capital expenditures or contractual commitments;
▪Adjusted EBITDA does not reflect changes in, or cash requirements for, our working capital needs;
▪Adjusted EBITDA does not consider the potentially dilutive impact of share-based compensation;
▪Although depreciation and amortization are non-cash charges, the assets being depreciated and amortized may have to be replaced in the future, and Adjusted EBITDA does not reflect cash capital expenditure requirements for such replacements or for new capital expenditure requirements;
▪Adjusted EBITDA does not reflect impairment costs;
▪Adjusted EBITDA does not reflect interest expense or other income;
▪Adjusted EBITDA does not reflect income taxes; and
▪Other companies, including companies in our own industry, may calculate Adjusted EBITDA differently than we do, limiting its usefulness as a comparative measure.
Because of these limitations, you should consider Adjusted EBITDA in total and for each segment alongside other financial performance measures, including various cash flow metrics, net loss, loss before income taxes for each segment and our other GAAP results.
About Zillow Group, Inc.
Zillow Group, Inc. (NASDAQ:Z) (NASDAQ:ZG), the largest portfolio of real estate brands on mobile and the web that attracted 192.5 million average monthly unique users during the first quarter of 2020, is building an on-demand real estate experience. Whether selling, buying, renting or financing, customers can turn to the businesses of its flagship brand, Zillow®, to find and get into their next home with speed, certainty and ease.
In addition to Zillow’s for-sale and rental listings, Zillow Offers™ buys and sells homes directly in dozens of markets across the country, allowing sellers control over their timeline. Zillow Closing Services now offers title and escrow services as another important step to unify the real estate transaction. Zillow Home Loans, our affiliate lender, provides our customers with an easy option to get pre-approved and secure financing for their next home purchase.
Other consumer brands include Trulia®, StreetEasy®, HotPads®, Naked Apartments® and Out East®. In addition, Zillow Group provides a comprehensive suite of marketing software and technology solutions which include Mortech®, dotloop®, Bridge Interactive® and New Home Feed®. The company is headquartered in Seattle, Washington.
Please visit http://investors.zillowgroup.com, www.zillowgroup.com/ir-blog, and www.twitter.com/zillowgroup, where Zillow Group discloses information about the company, its financial information, and its business which may be deemed material.
The Zillow Group logo is available at http://zillowgroup.mediaroom.com/logos-photos.
Zillow, Premier Agent, Mortech, Bridge Interactive, StreetEasy, HotPads, Out East and New Home Feed are registered trademarks of Zillow, Inc. Zillow Offers is a trademark of Zillow, Inc. Trulia is a registered trademark of Trulia, LLC. dotloop is a registered trademark of DotLoop, LLC. Naked Apartments is a registered trademark of Naked Apartments, LLC. Zillow Home Loans, LLC is an Equal Housing Lender; NMLS #10287.
(ZFIN)
Adjusted EBITDA
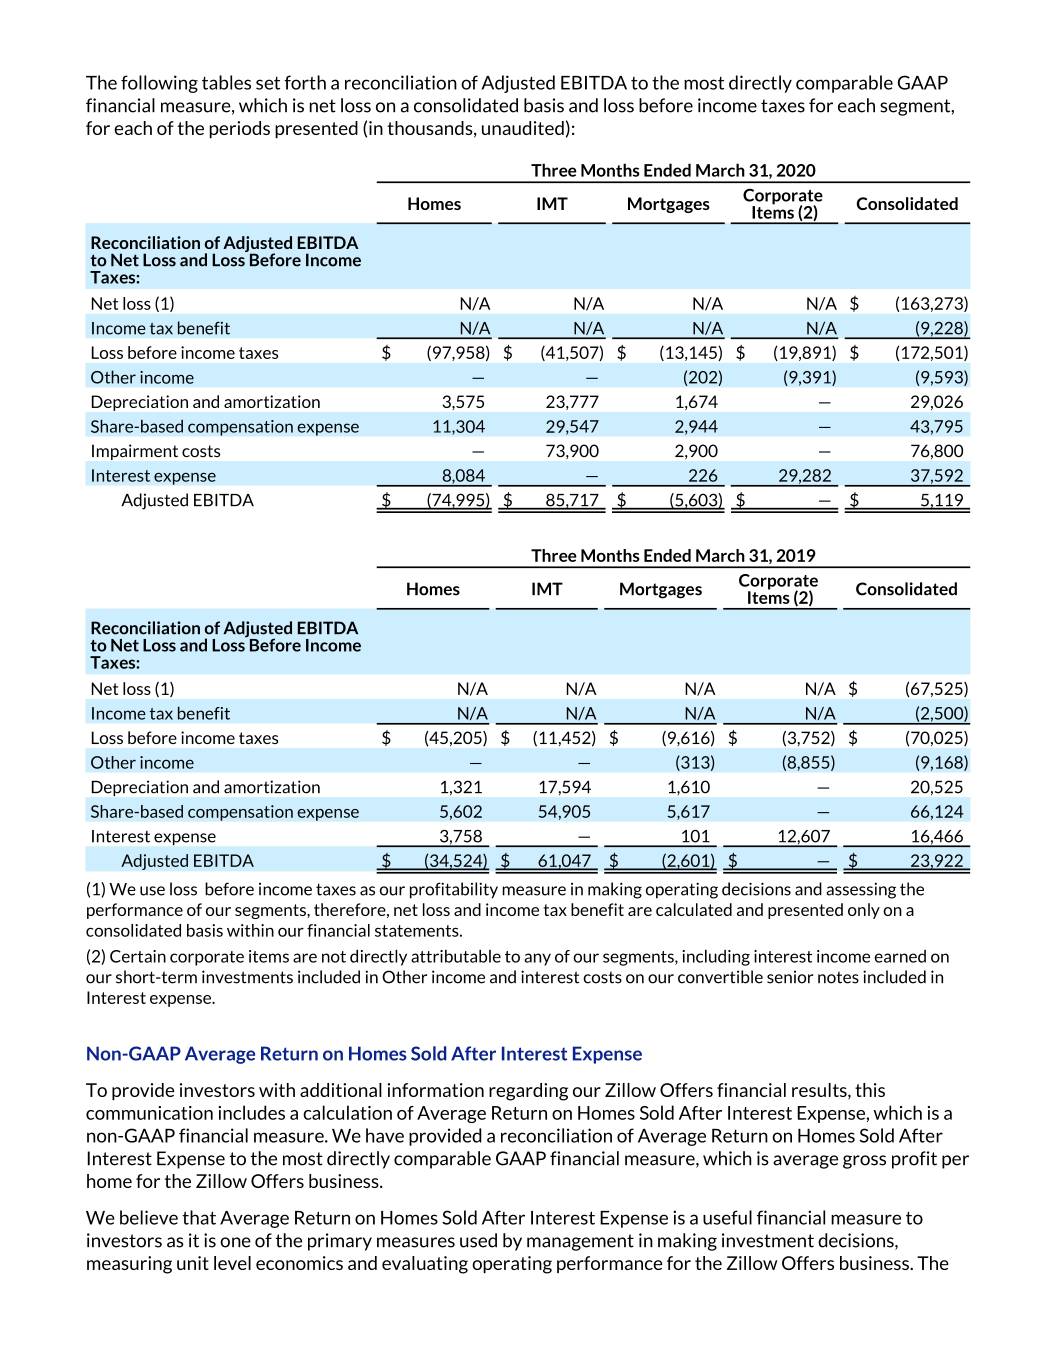
The following tables set forth a reconciliation of Adjusted EBITDA to the most directly comparable GAAP financial measure, which is net loss on a consolidated basis and loss before income taxes for each segment, for each of the periods presented (in thousands, unaudited):
| | | | | | | | | | | | | | | | | | | | | | | | | | | | | |
| | Three Months Ended March 31, 2020 | | | | | | | | |
| Homes | | IMT | | Mortgages | | Corporate Items (2) | | Consolidated |
| Reconciliation of Adjusted EBITDA to Net Loss and Loss Before Income Taxes: | | | | | | | | | |
| Net loss (1) | N/A | | | N/A | | | N/A | | | N/A | | | $ | (163,273) | |
| Income tax benefit | N/A | | | N/A | | | N/A | | | N/A | | | (9,228) | |
| Loss before income taxes | $ | (97,958) | | | $ | (41,507) | | | $ | (13,145) | | | $ | (19,891) | | | $ | (172,501) | |
| Other income | — | | | — | | | (202) | | | (9,391) | | | (9,593) | |
| Depreciation and amortization expense | 3,575 | | | 23,777 | | | 1,674 | | | — | | | 29,026 | |
| Share-based compensation expense | 11,304 | | | 29,547 | | | 2,944 | | | — | | | 43,795 | |
| Impairment costs | — | | | 73,900 | | | 2,900 | | | — | | | 76,800 | |
| Interest expense | 8,084 | | | — | | | 226 | | | 29,282 | | | 37,592 | |
| Adjusted EBITDA | $ | (74,995) | | | $ | 85,717 | | | $ | (5,603) | | | $ | — | | | $ | 5,119 | |
| | | | | | | | | | | | | | | | | | | | | | | | | | | | | |
| | Three Months Ended March 31, 2019 | | | | | | | | |
| Homes | | IMT | | Mortgages | | Corporate Items (2) | | Consolidated |
| Reconciliation of Adjusted EBITDA to Net Loss and Loss Before Income Taxes: | | | | | | | | | |
| Net loss (1) | N/A | | | N/A | | | N/A | | | N/A | | | $ | (67,525) | |
| Income tax benefit | N/A | | | N/A | | | N/A | | | N/A | | | (2,500) | |
| Loss before income taxes | $ | (45,205) | | | $ | (11,452) | | | $ | (9,616) | | | $ | (3,752) | | | $ | (70,025) | |
| Other income | — | | | — | | | (313) | | | (8,855) | | | (9,168) | |
| Depreciation and amortization expense | 1,321 | | | 17,594 | | | 1,610 | | | — | | | 20,525 | |
| Share-based compensation expense | 5,602 | | | 54,905 | | | 5,617 | | | — | | | 66,124 | |
| Interest expense | 3,758 | | | — | | | 101 | | | 12,607 | | | 16,466 | |
| Adjusted EBITDA | $ | (34,524) | | | $ | 61,047 | | | $ | (2,601) | | | $ | — | | | $ | 23,922 | |
(1) We use loss before income taxes as our profitability measure in making operating decisions and assessing the performance of our segments, therefore, net loss and income tax benefit are calculated and presented only on a consolidated basis within our financial statements.
(2) Certain corporate items are not directly attributable to any of our segments, including interest income earned on our short-term investments included in Other income and interest costs on our convertible senior notes included in Interest expense.
Exhibit 99.2
Reported Consolidated Results
ZILLOW GROUP, INC.
UNAUDITED CONDENSED CONSOLIDATED BALANCE SHEETS
(in thousands)
| | | | | | | | | | | |
| March 31,
2020 | | December 31,
2019 |
| Assets | | | |
| Current assets: | | | |
| Cash and cash equivalents | $ | 1,567,710 | | | $ | 1,141,263 | |
Short-term investments | 993,258 | | | 1,280,989 | |
Accounts receivable, net | 71,782 | | | 67,005 | |
| Mortgage loans held for sale | 36,848 | | | 36,507 | |
| Inventory | 533,989 | | | 836,627 | |
| Prepaid expenses and other current assets | 57,635 | | | 58,117 | |
| Restricted cash | 56,428 | | | 89,646 | |
| Total current assets | 3,317,650 | | | 3,510,154 | |
| Contract cost assets | 46,565 | | | 45,209 | |
| Property and equipment, net | 188,032 | | | 170,489 | |
| Right of use assets | 205,688 | | | 212,153 | |
| Goodwill | 1,984,907 | | | 1,984,907 | |
| Intangible assets, net | 112,274 | | | 190,567 | |
| Other assets | 16,624 | | | 18,494 | |
| Total assets | $ | 5,871,740 | | | $ | 6,131,973 | |
| Liabilities and shareholders’ equity | | | |
| Current liabilities: | | | |
| Accounts payable | $ | 17,819 | | | $ | 8,343 | |
| Accrued expenses and other current liabilities | 88,897 | | | 85,442 | |
| Accrued compensation and benefits | 32,838 | | | 37,805 | |
| Borrowings under credit facilities | 466,647 | | | 721,951 | |
| Deferred revenue | 35,347 | | | 39,747 | |
| Lease liabilities, current portion | 20,290 | | | 17,592 | |
| Convertible senior notes, current portion | 9,637 | | | 9,637 | |
| Total current liabilities | 671,475 | | | 920,517 | |
| Lease liabilities, net of current portion | 216,122 | | | 220,445 | |
| Long-term debt | 1,565,949 | | | 1,543,402 | |
| Deferred tax liabilities and other long-term liabilities | 2,433 | | | 12,188 | |
| Total liabilities | 2,455,979 | | | 2,696,552 | |
| Shareholders’ equity: | | | |
Class A common stock | 6 | | | 6 | |
Class B common stock | 1 | | | 1 | |
Class C capital stock | 15 | | | 14 | |
| Additional paid-in capital | 4,551,866 | | | 4,412,200 | |
| Accumulated other comprehensive income | 4,286 | | | 340 | |
| Accumulated deficit | (1,140,413) | | | (977,140) | |
| Total shareholders’ equity | 3,415,761 | | | 3,435,421 | |
| Total liabilities and shareholders’ equity | $ | 5,871,740 | | | $ | 6,131,973 | |
ZILLOW GROUP, INC.
UNAUDITED CONDENSED CONSOLIDATED STATEMENTS OF OPERATIONS
(in thousands, except per share data)
| | | | | | | | | | | |
| | Three Months Ended
March 31, | | |
| | 2020 | | 2019 |
| Revenue: | | | |
| Homes | $ | 769,873 | | | $ | 128,472 | |
| IMT | 330,666 | | | 298,272 | |
| Mortgages | 25,282 | | | 27,360 | |
| Total revenue | 1,125,821 | | | 454,104 | |
| Cost of revenue (exclusive of amortization) (1)(2): | | | |
| Homes | 732,199 | | | 122,419 | |
| IMT | 24,318 | | | 24,251 | |
| Mortgages | 5,155 | | | 4,678 | |
| Total cost of revenue | 761,672 | | | 151,348 | |
| Sales and marketing (2) | 204,648 | | | 161,587 | |
| Technology and development (2) | 134,918 | | | 107,770 | |
| General and administrative (2) | 92,285 | | | 95,774 | |
| Impairment costs | 76,800 | | | — | |
| Integration costs | — | | | 352 | |
| Total costs and expenses | 1,270,323 | | | 516,831 | |
| Loss from operations | (144,502) | | | (62,727) | |
| Other income | 9,593 | | | 9,168 | |
| Interest expense | (37,592) | | | (16,466) | |
| Loss before income taxes | (172,501) | | | (70,025) | |
| Income tax benefit | 9,228 | | | 2,500 | |
| Net loss | $ | (163,273) | | | $ | (67,525) | |
| Net loss per share — basic and diluted | $ | (0.78) | | | $ | (0.33) | |
| Weighted-average shares outstanding — basic and diluted | 210,674 | | | 204,514 | |
_________________
(1) Amortization of website development costs and intangible assets included in technology and development | $ | 17,184 | | | $ | 14,400 | |
| (2) Includes share-based compensation expense as follows: | | | |
| Cost of revenue | $ | 1,173 | | | $ | 881 | |
| Sales and marketing | 6,993 | | | 5,650 | |
| Technology and development | 18,917 | | | 15,508 | |
| General and administrative | 16,712 | | | 44,085 | |
| Total | $ | 43,795 | | | $ | 66,124 | |
| Other Financial Data: | | | |
| Segment loss before income taxes: | | | |
| Homes segment | $ | (97,958) | | | $ | (45,205) | |
| IMT segment | (41,507) | | | (11,452) | |
| Mortgages segment | (13,145) | | | (9,616) | |
| Total segment loss before income taxes | $ | (152,610) | | | $ | (66,273) | |
| Adjusted EBITDA (3): | | | |
| Homes segment | $ | (74,995) | | | $ | (34,524) | |
| IMT segment | 85,717 | | | 61,047 | |
| Mortgages segment | (5,603) | | | (2,601) | |
| Total Adjusted EBITDA | $ | 5,119 | | | $ | 23,922 | |
| (3) Adjusted EBITDA is a non-GAAP financial measure; it is not calculated or presented in accordance with U.S. generally accepted accounting principles, or GAAP. See Exhibit 99.1 for more information regarding our presentation of Adjusted EBITDA and for a reconciliation of Adjusted EBITDA to net loss on a consolidated basis and loss before income taxes for each segment, the most directly comparable GAAP financial measures, for each of the periods presented. | | | |
ZILLOW GROUP, INC.
UNAUDITED CONDENSED CONSOLIDATED STATEMENTS OF CASH FLOWS
(in thousands)
| | | | | | | | | | | |
| | Three Months Ended
March 31, | | |
| | 2020 | | 2019 |
| Operating activities | | | |
| Net loss | $ | (163,273) | | | $ | (67,525) | |
| Adjustments to reconcile net loss to net cash provided by (used in) operating activities: | | | |
| Depreciation and amortization | 29,026 | | | 20,525 | |
| Share-based compensation expense | 43,795 | | | 66,124 | |
| Amortization of right of use assets | 6,465 | | | 4,440 | |
| Amortization of contract cost assets | 8,415 | | | 8,746 | |
| Amortization of discount and issuance costs on convertible senior notes maturing in 2021, 2023, 2024 and 2026 | 22,547 | | | 8,840 | |
| Impairment costs | 76,800 | | | — | |
| Deferred income taxes | (9,228) | | | (2,500) | |
| Loss on disposal of property and equipment and other assets | 1,952 | | | 1,704 | |
| Credit loss expense | 558 | | | 128 | |
| Net loss on investment securities | 434 | | | — | |
| Accretion of bond discount | (473) | | | (1,733) | |
| Changes in operating assets and liabilities: | | | |
| Accounts receivable | (5,335) | | | (4,650) | |
| Mortgage loans held for sale | (341) | | | 5,940 | |
| Inventory | 302,593 | | | (162,325) | |
| Prepaid expenses and other assets | (2,916) | | | (8,537) | |
| Lease liabilities | (1,625) | | | (7,010) | |
| Contract cost assets | (9,771) | | | (9,103) | |
| Accounts payable | 7,673 | | | (133) | |
| Accrued expenses and other current liabilities | 4,588 | | | 328 | |
| Accrued compensation and benefits | (4,967) | | | (1,088) | |
| Deferred revenue | (4,400) | | | 2,025 | |
| Other long-term liabilities | (527) | | | 290 | |
| Net cash provided by (used in) operating activities | 301,990 | | | (145,514) | |
| Investing activities | | | |
| Proceeds from maturities of investments | 296,272 | | | 302,187 | |
| Proceeds from sales of investments | 53,997 | | | — | |
| Purchases of investments | (58,459) | | | (176,412) | |
| Purchases of property and equipment | (32,966) | | | (14,202) | |
| Purchases of intangible assets | (4,503) | | | (3,269) | |
| Net cash provided by investing activities | 254,341 | | | 108,304 | |
| Financing activities | | | |
| Proceeds from borrowings on credit facilities | 34,460 | | | 129,328 | |
| Repayments of borrowings on credit facilities | (294,150) | | | — | |
| Net borrowings (repayments) on warehouse lines of credit and repurchase agreement | 4,386 | | | (5,025) | |
| Proceeds from exercise of stock options | 92,202 | | | 13,564 | |
| Value of equity awards withheld for tax liability | — | | | 2 | |
| Net cash provided by (used in) financing activities | (163,102) | | | 137,869 | |
| Net increase in cash, cash equivalents and restricted cash during period | 393,229 | | | 100,659 | |
| Cash, cash equivalents and restricted cash at beginning of period | 1,230,909 | | | 663,443 | |
| Cash, cash equivalents and restricted cash at end of period | $ | 1,624,138 | | | $ | 764,102 | |
| Supplemental disclosures of cash flow information | | | |
| Cash paid for interest | $ | 17,038 | | | | $ | 4,956 | |
| Noncash transactions: | | | | | | |
| Capitalized share-based compensation | $ | 3,670 | | | | $ | 2,690 | |
| Write-off of fully depreciated property and equipment | $ | 4,143 | | | | $ | 6,269 | |
| Write-off of fully amortized intangible assets | $ | — | | | | $ | 3,200 | |
| Property and equipment purchased on account | $ | 9,445 | | | $ | 4,792 | |
Non-GAAP Net Loss per Share
Our presentation of non-GAAP net loss per share excludes the impact of share-based compensation expense, impairment costs and income taxes. This measure is not a key metric used by our management and board of directors to measure operating performance or otherwise manage the business. However, we provide non-GAAP net loss per share as supplemental information to investors, as we believe the exclusion of share-based compensation expense, impairment costs and income taxes facilitates investors’ operating performance comparisons on a period-to-period basis. You should not consider non-GAAP net loss per share in isolation or as a substitute for analysis of our results as reported under GAAP.
The following table sets forth a reconciliation of non-GAAP net loss, adjusted, to net loss, as reported on a GAAP basis, and the calculation of non-GAAP net loss per share - basic and diluted, for each of the periods presented (in thousands, except per share data, unaudited):
| | | | | | | | | | | |
| Three Months Ended
March 31, | | |
| | 2020 | | 2019 |
| Net loss, as reported | $ | (163,273) | | | $ | (67,525) | |
| Share-based compensation expense | 43,795 | | | 66,124 | |
| Impairment costs | 76,800 | | | — | |
| Income tax benefit | (9,228) | | | (2,500) | |
| Net loss, adjusted | $ | (51,906) | | | $ | (3,901) | |
| Non-GAAP net loss per share — basic and diluted | $ | (0.25) | | | $ | (0.02) | |
| Weighted-average shares outstanding — basic and diluted | 210,674 | | | 204,514 | |
Segment Results of Operations
The following table presents our segment results for the periods presented (in thousands, unaudited):
| | | | | | | | | | | | | | | | | | | | | | | | | | | | | | | | | | | |
| | Three Months Ended
March 31, 2020 | | | | | | Three Months Ended
March 31, 2019 | | | | |
| Homes | | IMT | | Mortgages | | Homes | | IMT | | Mortgages |
| Revenue | $ | 769,873 | | | $ | 330,666 | | | $ | 25,282 | | | $ | 128,472 | | | $ | 298,272 | | | $ | 27,360 | |
| Costs and expenses: | | | | | | | | | | | |
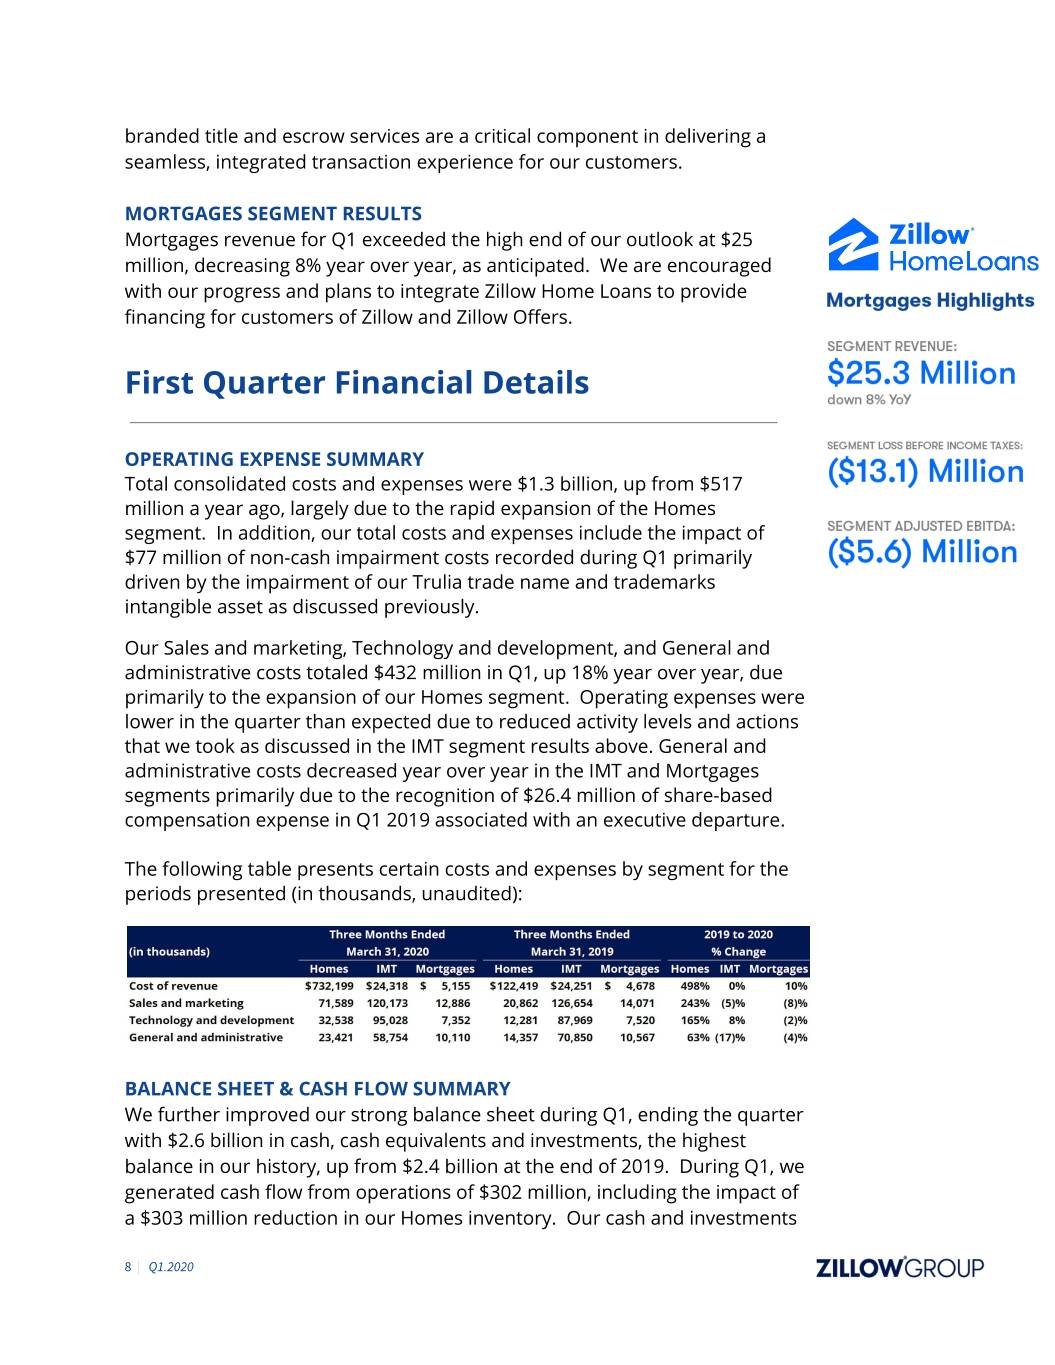
| Cost of revenue | 732,199 | | | 24,318 | | | 5,155 | | | 122,419 | | | 24,251 | | | 4,678 | |
| Sales and marketing | 71,589 | | | 120,173 | | | 12,886 | | | 20,862 | | | 126,654 | | | 14,071 | |
| Technology and development | 32,538 | | | 95,028 | | | 7,352 | | | 12,281 | | | 87,969 | | | 7,520 | |
| General and administrative | 23,421 | | | 58,754 | | | 10,110 | | | 14,357 | | | 70,850 | | | 10,567 | |
| Impairment costs | — | | | 73,900 | | | 2,900 | | | | — | | | — | | | — | |
| Integration costs | — | | | — | | | — | | | — | | | — | | | 352 | |
| Total costs and expenses | 859,747 | | | 372,173 | | | 38,403 | | | 169,919 | | | 309,724 | | | 37,188 | |
| Loss from operations | (89,874) | | | (41,507) | | | (13,121) | | | (41,447) | | | (11,452) | | | (9,828) | |
| Segment other income | — | | | — | | | 202 | | | — | | | — | | | 313 | |
| Segment interest expense | (8,084) | | | — | | | (226) | | | (3,758) | | | — | | | (101) | |
| Loss before income taxes (1) | $ | (97,958) | | | $ | (41,507) | | | $ | (13,145) | | | $ | (45,205) | | | $ | (11,452) | | | $ | (9,616) | |
(1) The following table presents the reconciliation of total segment loss before income taxes to consolidated loss before income taxes for the periods presented (in thousands, unaudited):
| | | | | | | | | | | |
| Three Months Ended
March 31, | | |
| 2020 | | 2019 |
| Total segment loss before income taxes | $ | (152,610) | | | $ | (66,273) | |
| Corporate interest expense | (29,282) | | | | (12,607) | |
| Corporate other income | 9,391 | | | 8,855 | |
| Consolidated loss before income taxes | $ | (172,501) | | | $ | (70,025) | |
Key Metrics
The following table sets forth our key metrics for each of the periods presented (in millions, except number of homes sold, unaudited):
| | | | | | | | | | | | | | | | | |
| | Three Months Ended
March 31, | | | | 2019 to 2020
% Change |
| | 2020 | | 2019 | | |
| | | | | | |
| Visits (1) | 2,117.6 | | | 2,019.8 | | | 5 | % |
| Average Monthly Unique Users (2) | 192.5 | | | 181.1 | | | 6 | % |
| Number of Homes Sold | 2,394 | | | 414 | | | 478 | % |
(1)Visits includes visits to the Zillow, Trulia and StreetEasy mobile apps and websites. We measure Zillow and StreetEasy visits with Google Analytics and Trulia visits with Adobe Analytics.
(2)Zillow, StreetEasy, HotPads and Naked Apartments measure unique users with Google Analytics, and Trulia measures unique users with Adobe Analytics.
Non-GAAP Average Return on Homes Sold After Interest Expense
To provide investors with additional information regarding our Zillow Offers financial results, this Exhibit includes a calculation of Average Return on Homes Sold After Interest Expense, which is a non-GAAP financial measure. We have provided a reconciliation of Average Return on Homes Sold After Interest Expense to the most directly comparable GAAP financial measure, which is average gross profit per home for the Zillow Offers business.
We believe that Average Return on Homes Sold After Interest Expense is a useful financial measure to investors as it is one of the primary measures used by management in making investment decisions, measuring unit level economics and evaluating operating performance for the Zillow Offers business. The measure is intended to convey the unit level economics of homes sold during the period by presenting the average revenue and associated expenses directly attributed to the homes sold. We believe this average per unit measure facilitates meaningful period over period comparisons notwithstanding variability in the number of homes sold during a period and indicates ability to generate average returns on assets sold after considering home purchase costs, renovation costs, holding costs and selling costs.
We calculate the average return on homes sold after interest expense as revenue associated with homes sold during the period less direct costs attributable to those homes divided by the number of homes sold during the period. Specifically, direct costs include, with respect to each home sold during the period (1) home acquisition and renovation costs, which in turn include certain labor costs directly associated with these activities; (2) holding and selling costs; and (3) interest costs incurred.
Included in direct holding and interest expense amounts for the periods presented are holding and interest costs recorded as period expenses in prior periods associated with homes sold in the presented period, which are not calculated in accordance with, or as an alternative for, GAAP and should not be considered in isolation or as a substitute for results reported under GAAP. Excluded from certain of these direct cost amounts are costs recorded in the presented period related to homes that remain in inventory at the end of the period, as shown in the tables below. We make these period adjustments because we believe presenting Average Return on Homes Sold After Interest Expense in this manner provides a focused view on a subset of our assets - homes sold during the period - and reflecting costs associated with those homes sold from the time we acquire to the time we sell the home, which may be useful to investors.
Average Return on Homes Sold After Interest Expense is intended to illustrate the performance of homes sold during the period and is not intended to be a segment or company performance metric. Average Return on Homes Sold After Interest Expense is a
supplemental measure of operating performance for a subset of assets and has limitations as an analytical tool, and you should not consider it in isolation or as a substitute for analysis of our results as reported under GAAP. Some of these limitations are:
•Although depreciation and amortization are non-cash charges, the assets being depreciated and amortized may have to be replaced in the future, and Average Return on Homes Sold After Interest Expense does not reflect capital expenditure requirements for such replacements or for new capital expenditure requirements;
•Average Return on Homes Sold After Interest Expense does not consider the potentially dilutive impact of share-based compensation;
•Average Return on Homes Sold After Interest Expense does not include period costs that were not eligible for inventory capitalization associated with homes held in inventory at the end of the period;
•Average Return on Homes Sold After Interest Expense does not reflect indirect expenses included in cost of revenue, sales and marketing, technology and development, or general and administrative expenses, some of which are recurring cash expenditures necessary to operate the business; and
•Average Return on Homes Sold After Interest Expense does not reflect income taxes.
On a GAAP basis, Zillow Offers average gross profit per home was $16,113 and $14,621, respectively, for the three months ended March 31, 2020 and 2019.
The following table presents the total return on homes sold after interest expense and the Average Return on Homes Sold After Interest Expense for the periods presented (unaudited):
| | | | | | | | | | | | | | | | | | | | | | | |
| Three Months Ended
March 31, 2020 | | | | Three Months Ended
March 31, 2019 | | |
| Total | | Average
Per Home | | Total | | Average
Per Home |
| Homes sold | 2,394 | | | | | 414 | | | |
| Zillow Offers revenue | $ | 769,112,000 | | | $ | 321,266 | | | $ | 128,472,000 | | | $ | 310,319 | |
| Operating costs: | | | | | | | |
| Home acquisition costs (1) | 689,654,000 | | | 288,076 | | | 116,709,000 | | | 281,906 | |
| Renovation costs (1) | 36,591,000 | | | 15,284 | | | 4,681,000 | | | 11,307 | |
| Holding costs (1)(2) | 9,618,000 | | | 4,018 | | | 1,238,000 | | | 2,990 | |
| Selling costs | 32,913,000 | | | 13,748 | | | 5,542,000 | | | 13,386 | |
| Total operating costs | 768,776,000 | | | 321,126 | | | 128,170,000 | | | 309,589 | |
| Interest expense (1)(2) | 11,056,000 | | | 4,618 | | | 1,655,000 | | | 3,998 | |
| Return on homes sold after interest expense | $ | (10,720,000) | | | $ | (4,478) | | | $ | (1,353,000) | | | $ | (3,268) | |
(1) Amount excludes expenses incurred during the period that are not related to homes sold during the period.
(2) Holding costs and interest expense include $5.2 million and $6.6 million, respectively, of costs incurred in prior periods associated with homes sold in the first quarter of 2020 and $0.6 million and $0.6 million, respectively, of costs incurred in prior periods associated with homes sold in the first quarter of 2019. | | | | | | | |
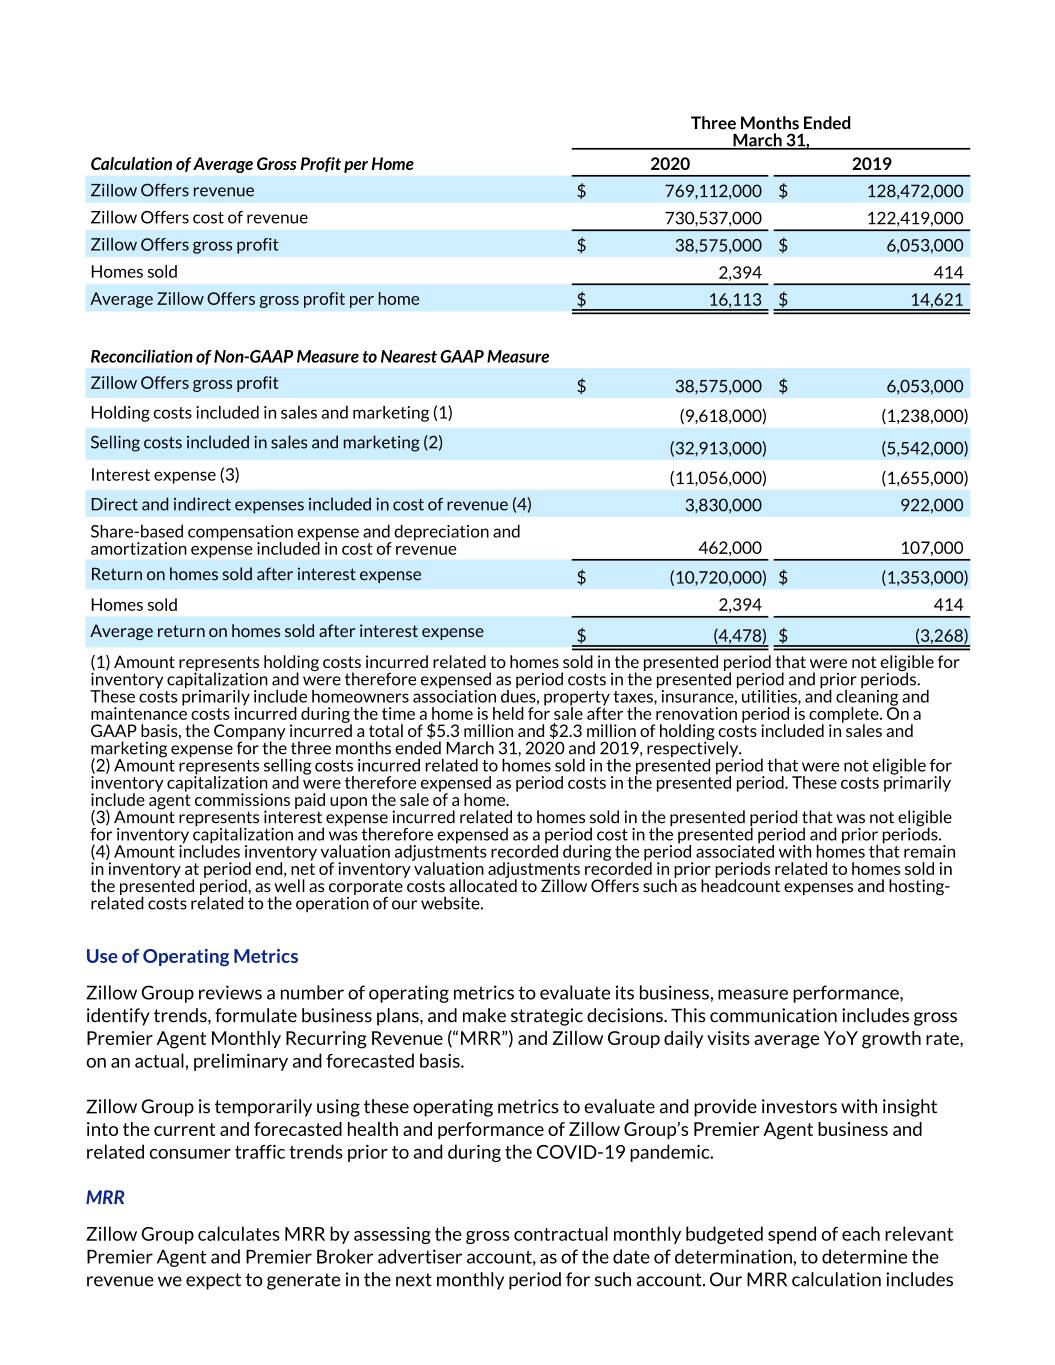
The calculation of Average Return on Homes Sold After Interest Expense includes only those expenses directly attributed to the homes sold during the period. To arrive at return on homes sold after interest expense, the Company deducts from Zillow Offers gross profit (1) holding costs incurred in the presented period and prior periods for homes sold during the presented period that are included in sales and marketing expense, (2) selling costs incurred in the presented period for homes sold during the presented period that are included in sales and marketing expense and (3) interest expense incurred in the presented period and prior periods for homes sold during the presented period. The Company adds to Zillow Offers gross profit (1) inventory valuation adjustments recorded during the presented period associated with homes that remain in inventory at period end, net of inventory valuation adjustments recorded in prior periods related to homes sold in the presented period, and indirect expenses included in cost of revenue and (2) share-based compensation expense and depreciation and amortization expense included in cost of revenue. The following table presents the calculation of Zillow Offers average gross profit per home and Average Return on Homes Sold After Interest Expense and a reconciliation of return on homes sold after interest expense to Zillow Offers gross profit for the periods presented (unaudited):
| | | | | | | | | | | |
| Three Months Ended
March 31, | | |
| Calculation of Average Gross Profit per Home | 2020 | | 2019 |
| Zillow Offers revenue | $ | 769,112,000 | | | | $ | 128,472,000 | |
| Zillow Offers cost of revenue | 730,537,000 | | | | 122,419,000 | |
| Zillow Offers gross profit | $ | 38,575,000 | | | | $ | 6,053,000 | |
| Homes sold | 2,394 | | | | 414 | |
| Average Zillow Offers gross profit per home | $ | 16,113 | | | | $ | 14,621 | |
| Reconciliation of Non-GAAP Measure to Nearest GAAP Measure | | | |
| Zillow Offers gross profit | $ | 38,575,000 | | | $ | 6,053,000 | |
| Holding costs included in sales and marketing (1) | (9,618,000) | | | (1,238,000) | |
| Selling costs included in sales and marketing (2) | (32,913,000) | | | (5,542,000) | |
| Interest expense (3) | (11,056,000) | | | (1,655,000) | |
| Direct and indirect expenses included in cost of revenue (4) | 3,830,000 | | | 922,000 | |
| Share-based compensation expense and depreciation and amortization expense included in cost of revenue | 462,000 | | | 107,000 | |
| Return on homes sold after interest expense | $ | (10,720,000) | | | $ | (1,353,000) | |
| Homes sold | 2,394 | | | 414 | |
| Average return on homes sold after interest expense | $ | (4,478) | | | $ | (3,268) | |
(1) Amount represents holding costs incurred related to homes sold in the presented period that were not eligible for inventory capitalization and were therefore expensed as period costs in the presented period and prior periods. These costs primarily include homeowners association dues, property taxes, insurance, utilities, and cleaning and maintenance costs incurred during the time a home is held for sale after the renovation period is complete. On a GAAP basis, the Company incurred a total of $5.3 million and $2.3 million of holding costs included in sales and marketing expense for the three months ended March 31, 2020 and 2019, respectively.
(2) Amount represents selling costs incurred related to homes sold in the presented period that were not eligible for inventory capitalization and were therefore expensed as period costs in the presented period. These costs primarily include agent commissions paid upon the sale of a home.
(3) Amount represents interest expense incurred related to homes sold in the presented period that was not eligible for inventory capitalization and was therefore expensed as a period cost in the presented period and prior periods.
(4) Amount includes inventory valuation adjustments recorded during the period associated with homes that remain in inventory at period end, net of inventory valuation adjustments recorded in prior periods related to homes sold in the presented period, as well as corporate costs allocated to Zillow Offers such as headcount expenses and hosting-related costs related to the operation of our website. | | | |