ZIONS BANCORPORATION, N.A.
Press Release – Page 1
July 20, 2020
Zions Bancorporation, N.A. One South Main Salt Lake City, UT 84133 July 20, 2020 |  |
www.zionsbancorporation.com | |
Second Quarter 2020 Financial Results: FOR IMMEDIATE RELEASE
Investor and Media Contact: James Abbott (801) 844-7637
Zions Bancorporation, N.A. Reports: 2Q20 Net Earnings¹ of $57 million, diluted EPS of $0.34 |
compared with 2Q19 Net Earnings¹ of $189 million, diluted EPS of $0.99, and 1Q20 Net Earnings¹ of $6 million, diluted EPS of $0.04 |
SECOND QUARTER RESULTS
$0.34 | $57 million | 3.23% | 10.2% | |||
Net earnings1 per diluted common share | Net Earnings 1 | Net interest margin (“NIM”) | Common Equity Tier 1 | |||
SECOND QUARTER HIGHLIGHTS² | ||
Net Interest Income and NIM | • | Net interest income was $563 million, compared with $569 million |
• | NIM was 3.23%, compared with 3.54% | |
Operating Performance | • | Pre-provision net revenue ("PPNR") was $256 million, down 10% |
• | Adjusted PPNR³ was $300 million, up 2% | |
• | Noninterest expense was $430 million, up 1% | |
• | Adjusted noninterest expense³ was $402 million, down 5% | |
• | Efficiency ratio³ was 57.3%, compared with 59.0% | |
Loans and Credit Quality | • | Net loans and leases were $55.1 billion, up $6.5 billion, or 13%, and includes SBA PPP loans of $6.7 billion. |
• | Nonperforming assets were $344 million, up 36% | |
• | The provision for credit losses was $168 million, compared with $21 million | |
• | Net charge-offs of 0.23% of average loans, compared with 0.12% | |
Capital | • | The CET1 Capital ratio was 10.2%, compared with 10.8% |
Notable items | • | Termination of the Bank’s pension plan resulted in a one-time expense of $28 million, or $0.13 per share4 |
• | Derivative valuation loss of $12 million, or $0.06 per share,4 on client-related interest rate swaps | |
• | During the quarter, the Bank repurchased and retired $429 million principal amount of its senior notes and recognized a net gain of less than $1 million | |
• | Weighted average diluted shares decreased 8.6 million from the first quarter of 2020, primarily due to a lower average Bank common share price and the expiration of 29.2 million ZIONW warrants on May 22, 2020 | |
CEO COMMENTARY |
Harris H. Simmons, Chairman and CEO of Zions Bancorporation, commented, “By most any measure, the past three months have been one of the most extraordinary periods in the Bank’s history. Despite having sent thousands of our employees to work from home through the pandemic, we swiftly responded to the urgent needs of over 46,000 small businesses - many of them new to the Bank - by providing them with Paycheck Protection Program loans totaling nearly $7 billion, making Zions one of the ten largest providers of PPP loans in the nation. At the same time, we’ve been conducting exhaustive credit reviews of our exposures in industries particularly hard hit by the economic impact of the pandemic and find ourselves generally quite encouraged by the resilience of our borrowers, the great majority of whom entered this time of stress with strong balance sheets and liquidity. We believe our tendency to engage in collateralized lending will further strengthen our ability to work with borrowers through this challenging time while moderating our credit losses. During the quarter we also maintained a strong focus on controlling operating expenses, which, when adjusted for the effects of the previously announced termination of our pension plan, decreased 5% from the second quarter a year ago.” |
OPERATING PERFORMANCE3 |
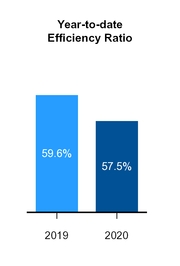
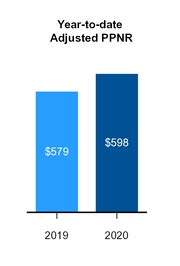
1 Net Earnings is net earnings applicable to common shareholders.
2 Comparisons noted in the bullet points are calculated for the current quarter versus the same prior-year period, unless otherwise specified.
3 For information on non-GAAP financial measures and the reasons for which the Bank presents these numbers, see pages 18-21.
4 EPS calculations assume a 24.7% statutory tax rate.
- more -
ZIONS BANCORPORATION, N.A.
Press Release – Page 2
July 20, 2020
Comparisons noted in the sections below are calculated for the current quarter versus the same prior-year period, unless otherwise specified. Growth rates of 100% or more are rendered as not meaningful as they are generally reflective of a low initial starting point.
RESULTS OF OPERATIONS
Net Interest Income and Margin | |||||||||||||||||||||||||
2Q20 - 1Q20 | 2Q20 - 2Q19 | ||||||||||||||||||||||||
(In millions) | 2Q20 | 1Q20 | 2Q19 | $ | % | $ | % | ||||||||||||||||||
Interest and fees on loans | $ | 514 | $ | 532 | $ | 581 | $ | (18 | ) | (3 | )% | $ | (67 | ) | (12 | )% | |||||||||
Interest on money market investments | 1 | 8 | 8 | (7 | ) | (88 | ) | (7 | ) | (88 | ) | ||||||||||||||
Interest on securities | 80 | 82 | 95 | (2 | ) | (2 | ) | (15 | ) | (16 | ) | ||||||||||||||
Total interest income | 595 | 622 | 684 | (27 | ) | (4 | ) | (89 | ) | (13 | ) | ||||||||||||||
Interest on deposits | 23 | 51 | 66 | (28 | ) | (55 | ) | (43 | ) | (65 | ) | ||||||||||||||
Interest on short and long-term borrowings | 9 | 23 | 49 | (14 | ) | (61 | ) | (40 | ) | (82 | ) | ||||||||||||||
Total interest expense | 32 | 74 | 115 | (42 | ) | (57 | ) | (83 | ) | (72 | ) | ||||||||||||||
Net interest income | $ | 563 | $ | 548 | $ | 569 | $ | 15 | 3 | $ | (6 | ) | (1 | ) | |||||||||||
bps | bps | ||||||||||||||||||||||||
Yield on interest-earning assets1 | 3.41 | % | 3.87 | % | 4.24 | % | (46 | ) | (83 | ) | |||||||||||||||
Rate paid on total deposits and interest-bearing liabilities1 | 0.19 | % | 0.48 | % | 0.75 | % | (29 | ) | (56 | ) | |||||||||||||||
Cost of total deposits1 | 0.15 | % | 0.36 | % | 0.49 | % | (21 | ) | (34 | ) | |||||||||||||||
Net interest margin1 | 3.23 | % | 3.41 | % | 3.54 | % | (18 | ) | (31 | ) | |||||||||||||||
1 Rates are calculated using amounts in thousands and taxable-equivalent rates are used where applicable.
Net interest income decreased $6 million, or 1%, to $563 million in the second quarter of 2020 from $569 million in the second quarter of 2019. Total interest income decreased $89 million, or 13%, due to a $67 million decrease in interest and fees on loans and a $15 million decrease in interest on securities, primarily resulting from lower yields on loans and securities, and a $700 million decline in the average securities balance. Interest expense decreased $83 million, or 72%, due to a $43 million decline in interest paid on deposits and a $40 million decline in interest paid on short and long-term borrowings attributable to both lower rates paid on both categories as well as reduced borrowings.
The yield on interest earning assets was 3.41%, a decrease of 46 basis points compared with the first quarter of 2020, and a decrease of 83 basis points compared with the second quarter of 2019. The yield on average interest earning assets includes $5.0 billion of Small Business Administration (“SBA”) Paycheck Protection Program (“PPP”) loans with a yield of 3.14%. As the SBA PPP program continues to evolve, changes to the loan terms and exercise of loan forgiveness may impact the effective yield. The yield on loans decreased 59 basis points relative to the first quarter of 2020 and 102 basis points from the year ago period, due to a sharp and significant decline in benchmark interest rates, which impacted all three of Zions’ major loan categories. The yield on securities decreased 14 basis points relative to the first quarter of 2020 and 31 basis points from the year ago period, primarily from lower yields on mortgage-backed securities, which were also attributable to lower benchmark interest rates.
The annualized cost of total deposits for the second quarter of 2020 was 0.15%, compared with 0.36% for the first quarter of 2020, and 0.49% for the second quarter of 2019. The rate paid on total deposits and interest-bearing
- more -
ZIONS BANCORPORATION, N.A.
Press Release – Page 3
July 20, 2020
liabilities was 0.19% for the second quarter of 2020, a decrease from 0.48% for the first quarter of 2020, and from 0.75% for the second quarter of 2019. The decline in the rate paid on total deposits and interest-bearing liabilities was due to lower benchmark interest rates, reduced use of exception pricing on deposits, strong deposit growth and less reliance on short-term borrowings when compared with the second quarter of 2019. The majority of SBA PPP loans were funded in deposit accounts, which contributed substantially to the deposit growth.
The net interest margin declined to 3.23% in the second quarter of 2020, compared with 3.41% in the first quarter of 2020, and 3.54% in the same prior year period. The factors contributing to the margin decline were primarily described in the preceding paragraphs.
Noninterest Income | |||||||||||||||||||||||||
2Q20 - 1Q20 | 2Q20 - 2Q19 | ||||||||||||||||||||||||
(In millions) | 2Q20 | 1Q20 | 2Q19 | $ | % | $ | % | ||||||||||||||||||
Commercial account fees | $ | 30 | $ | 31 | $ | 30 | $ | (1 | ) | (3 | )% | $ | — | — | % | ||||||||||
Card fees | 19 | 21 | 23 | (2 | ) | (10 | ) | (4 | ) | (17 | ) | ||||||||||||||
Retail and business banking fees | 15 | 19 | 20 | (4 | ) | (21 | ) | (5 | ) | (25 | ) | ||||||||||||||
Loan-related fees and income | 27 | 26 | 17 | 1 | 4 | 10 | 59 | ||||||||||||||||||
Capital markets and foreign exchange fees | 18 | 24 | 20 | (6 | ) | (25 | ) | (2 | ) | (10 | ) | ||||||||||||||
Wealth management and trust fees | 15 | 16 | 15 | (1 | ) | (6 | ) | — | — | ||||||||||||||||
Other customer-related fees | 6 | 6 | 5 | — | — | 1 | 20 | ||||||||||||||||||
Customer-related fees | 130 | 143 | 130 | (13 | ) | (9 | ) | — | — | ||||||||||||||||
Fair value and nonhedge derivative income (loss) | (12 | ) | (11 | ) | (6 | ) | (1 | ) | (9 | ) | (6 | ) | NM | ||||||||||||
Dividends and other income | 3 | 8 | 11 | (5 | ) | (63 | ) | (8 | ) | (73 | ) | ||||||||||||||
Securities gains (losses), net | (4 | ) | (6 | ) | (3 | ) | 2 | 33 | (1 | ) | (33 | ) | |||||||||||||
Total noninterest income | $ | 117 | $ | 134 | $ | 132 | $ | (17 | ) | (13 | ) | $ | (15 | ) | (11 | ) | |||||||||
Total noninterest income for the second quarter of 2020 decreased by $15 million, or 11%, to $117 million from $132 million for the second quarter of 2019. Total customer-related fees were unchanged at $130 million. Loan-related fees and income increased $10 million due to strength in residential mortgage banking activity, including loan sales, which benefited from the reduction in benchmark interest rates. Due to the waiving of fees for customers during the early stages of the COVID-19 pandemic, there was a $5 million decrease in retail and business banking fees, mostly attributable to lower insufficient fund fees, as well as a $4 million decrease in card fees from reduced economic activity and transaction volume in the second quarter of 2020. A $2 million decrease in capital markets and foreign exchange fees, due largely to reduced loan syndication fees, also adversely impacted customer-related fees.
In the second quarter of 2020, the Bank recognized a $12 million negative credit valuation adjustment (“CVA”) on client-related interest rate swaps, compared with a $6 million negative CVA in the prior year period. This change reflects the Bank’s growing credit exposure to interest rate swap counterparties. Dividends and other income decreased from $11 million in the second quarter of 2019, to $3 million in the second quarter of 2020, due to adverse market valuations on certain Small Business Investment Company (“SBIC”) investments and lower dividends received from the Federal Home Loan Bank (“FHLB”), reflecting less FHLB activity stock held by the Bank.
- more -
ZIONS BANCORPORATION, N.A.
Press Release – Page 4
July 20, 2020
Noninterest Expense | |||||||||||||||||||||||||
2Q20 - 1Q20 | 2Q20 - 2Q19 | ||||||||||||||||||||||||
(In millions) | 2Q20 | 1Q20 | 2Q19 | $ | % | $ | % | ||||||||||||||||||
Salaries and employee benefits | $ | 267 | $ | 274 | $ | 274 | $ | (7 | ) | (3 | )% | $ | (7 | ) | (3 | )% | |||||||||
Occupancy, net | 32 | 33 | 32 | (1 | ) | (3 | ) | — | — | ||||||||||||||||
Furniture, equipment and software, net | 32 | 32 | 35 | — | — | (3 | ) | (9 | ) | ||||||||||||||||
Other real estate expense, net | — | — | — | — | NM | — | NM | ||||||||||||||||||
Credit-related expense | 6 | 4 | 8 | 2 | 50 | (2 | ) | (25 | ) | ||||||||||||||||
Professional and legal services | 10 | 12 | 13 | (2 | ) | (17 | ) | (3 | ) | (23 | ) | ||||||||||||||
Advertising | 3 | 3 | 5 | — | — | (2 | ) | (40 | ) | ||||||||||||||||
FDIC premiums | 7 | 5 | 6 | 2 | 40 | 1 | 17 | ||||||||||||||||||
Other | 73 | 45 | 51 | 28 | 62 | 22 | 43 | ||||||||||||||||||
Total noninterest expense | $ | 430 | $ | 408 | $ | 424 | $ | 22 | 5 | $ | 6 | 1 | |||||||||||||
Adjusted noninterest expense 1 | $ | 402 | $ | 407 | $ | 423 | $ | (5 | ) | (1 | ) | $ | (21 | ) | (5 | ) | |||||||||
1 | For information on non-GAAP financial measures, see pages 18-21. |
Noninterest expense for the second quarter of 2020 was $430 million, an increase of $6 million, or 1%, when compared with $424 million for the second quarter of 2019, primarily as a result of a $28 million pension plan termination-related expense recognized in other noninterest expense. The pension plan termination expense included a loss of $17 million that was reclassified out of accumulated other comprehensive income, resulting in a pre-tax decrease in shareholders’ equity of $11 million. Salaries and employee benefits decreased by $7 million, primarily from lower overall incentive compensation, although there were increases for certain compensation pools, such as those related to SBA PPP loans.
Adjusted noninterest expense for the second quarter of 2020 decreased $21 million, or 5%, to $402 million, compared with $423 million for the same prior year period. The efficiency ratio was 57.3% in the second quarter of 2020, compared with 57.7% in the first quarter of 2020, and 59.0% in the second quarter of 2019. For information on non-GAAP financial measures, including differences between noninterest expense and adjusted noninterest expense, see pages 18-21.
- more -
ZIONS BANCORPORATION, N.A.
Press Release – Page 5
July 20, 2020
BALANCE SHEET ANALYSIS
Asset Quality | |||||||||||||||||||||||||
2Q20 - 1Q20 | 2Q20 - 2Q19 | ||||||||||||||||||||||||
(In millions) | 2Q20 | 1Q20 | 2Q19 | bps | bps | ||||||||||||||||||||
Ratio of nonperforming assets to loans and leases and other real estate owned | 0.62 | % | 0.56 | % | 0.52 | % | 6 | 10 | |||||||||||||||||
Annualized ratio of net loan and lease charge-offs to average loans | 0.23 | % | 0.06 | % | 0.12 | % | 17 | 11 | |||||||||||||||||
Ratio of total allowance for credit losses to loans1 and leases outstanding, at period end | 1.66 | % | 1.56 | % | 1.16 | % | 10 | 50 | |||||||||||||||||
Ratio of total allowance for credit losses to loans1 and leases outstanding (excluding SBA PPP loans), at period end | 1.88 | % | 1.56 | % | 1.16 | % | 32 | 72 | |||||||||||||||||
$ | % | $ | % | ||||||||||||||||||||||
Classified loans | $ | 1,477 | $ | 881 | $ | 770 | $ | 596 | 68 | % | $ | 707 | 92 | % | |||||||||||
Nonperforming assets | 344 | 280 | 253 | 64 | 23 | 91 | 36 | ||||||||||||||||||
Net loan and lease charge-offs | 31 | 7 | 14 | 24 | NM | 17 | NM | ||||||||||||||||||
Provision for credit losses | 168 | 258 | 21 | (90 | ) | (35 | ) | 147 | NM | ||||||||||||||||
1 Does not include loans held for sale.
Classified loans and nonperforming assets increased 92% and 36%, respectively, from the second quarter of 2019. The ratio of nonaccrual loans and accruing loans past due 90 days or more to loans and leases was 0.64%, compared with 0.54% in the second quarter of 2019.
The Bank recorded a $168 million provision for credit losses during the second quarter of 2020, compared with $258 million during the first quarter of 2020, and $21 million for the second quarter of 2019. The allowance for credit losses was $914 million at June 30, 2020, compared with $563 million at June 30, 2019 and equaled 1.66% of total loans, which included $6.7 billion of SBA PPP loans. Excluding the SBA PPP loans, the allowance for credit loss to adjusted total loans ratio was 1.88%, compared with 1.56% at March 31, 2020, and 1.16% at June 30, 2019. The increase in the allowance for credit losses is primarily due to experienced and expected economic deterioration caused by the COVID-19 pandemic.
- more -
ZIONS BANCORPORATION, N.A.
Press Release – Page 6
July 20, 2020
Loans and Leases | |||||||||||||||||||||||||
2Q20 - 1Q20 | 2Q20 - 2Q19 | ||||||||||||||||||||||||
(In millions) | 2Q20 | 1Q20 | 2Q19 | $ | % | $ | % | ||||||||||||||||||
Loans held for sale | $ | 105 | $ | 140 | $ | 105 | $ | (35 | ) | (25 | )% | $ | — | — | % | ||||||||||
Loans and leases: | |||||||||||||||||||||||||
Commercial - excluding SBA PPP loans | 25,018 | 26,392 | 25,107 | (1,374 | ) | (5 | ) | (89 | ) | — | |||||||||||||||
Commercial - SBA PPP loans | 6,690 | — | — | 6,690 | NM | 6,690 | NM | ||||||||||||||||||
Commercial real estate | 11,954 | 11,741 | 11,827 | 213 | 2 | 127 | 1 | ||||||||||||||||||
Consumer | 11,467 | 11,794 | 11,683 | (327 | ) | (3 | ) | (216 | ) | (2 | ) | ||||||||||||||
Loans and leases, net of unearned income and fees | 55,129 | 49,927 | 48,617 | 5,202 | 10 | 6,512 | 13 | ||||||||||||||||||
Less allowance for loan losses | 860 | 730 | 503 | 130 | 18 | 357 | 71 | ||||||||||||||||||
Loans and leases held for investment, net of allowance | $ | 54,269 | $ | 49,197 | $ | 48,114 | $ | 5,072 | 10 | $ | 6,155 | 13 | |||||||||||||
Loans and leases, net of unearned income and fees, increased $6.5 billion, or 13%, to $55.1 billion at June 30, 2020, from $48.6 billion at June 30, 2019, primarily due to the origination of SBA PPP loans. Excluding SBA PPP loans, a decrease of $807 million in commercial and industrial loans was partially offset by increases of $476 million in municipal loans and $255 million in owner-occupied loans. Term commercial real estate loans increased $369 million. Consumer loans decreased $216 million, which was spread across all consumer loan subcategories. Unfunded lending commitments and letters of credit increased $0.7 billion, or 3.0%, to $24.0 billion at June 30, 2020, from $23.3 billion at June 30, 2019.
Oil and Gas-Related Exposure1 | ||||||||||||||||
(In millions) | 2Q20 | 1Q20 | 2Q19 | 4Q14 | ||||||||||||
Loans and leases | ||||||||||||||||
Upstream | $ | 1,034 | $ | 1,025 | $ | 919 | $ | 1,107 | ||||||||
Midstream | 909 | 889 | 840 | 579 | ||||||||||||
Oil and gas services | 460 | 470 | 484 | 1,277 | ||||||||||||
Downstream | 226 | 195 | 188 | 110 | ||||||||||||
Total loan and lease balances | 2,629 | 2,579 | 2,431 | 3,073 | ||||||||||||
Unfunded lending commitments | 1,916 | 2,039 | 2,246 | 2,700 | ||||||||||||
Total oil and gas credit exposure | $ | 4,545 | $ | 4,618 | $ | 4,677 | $ | 5,773 | ||||||||
Credit quality measures | ||||||||||||||||
Nonaccrual loan ratio | 2.7 | % | 0.7 | % | 0.7 | % | 0.6 | % | ||||||||
Ratio of nonaccrual loans that are current | 69.4 | % | 70.6 | % | 58.8 | % | 58.8 | % | ||||||||
Net charge-off ratio, annualized2 | — | % | 0.2 | % | — | % | — | % | ||||||||
1Because many borrowers operate in multiple businesses, judgment has been applied in characterizing a borrower as oil and
gas-related, including a particular segment of oil and gas-related activity, e.g., upstream or midstream; typically, 50% of
revenues coming from the oil and gas sector is used as a guide.
2Calculated as the ratio of annualized net charge-offs for each respective period to loan balances at each period end.
At June 30, 2020, oil and gas-related loans represented 5% of the total loan portfolio, compared with 8% at December 31, 2014, or the beginning of the last energy cycle. Due to active risk management of the portfolio, the mix of oil and gas-related loans at June 30, 2020 consists of 39% upstream, 35% midstream, 17% oil and gas-related services, and
- more -
ZIONS BANCORPORATION, N.A.
Press Release – Page 7
July 20, 2020
9% downstream, compared with 36%, 19%, 42%, and 3%, respectively, at December 31, 2014. We use disciplined underwriting practices to mitigate the risk associated with upstream lending activities. Upstream loans are made to reserve-based borrowers, where approximately 84% of those loans are collateralized by the value of the borrower’s oil and gas reserves. For the second quarter of 2020, the oil and gas-related classified loan ratio was 8.3%, there were no oil and gas-related loan net charge-offs, and the allowance for credit losses related to oil and gas-related loans was 5.7%.
Deposits and Borrowed Funds | |||||||||||||||||||||||||
2Q20 - 1Q20 | 2Q20 - 2Q19 | ||||||||||||||||||||||||
(In millions) | 2Q20 | 1Q20 | 2Q19 | $ | % | $ | % | ||||||||||||||||||
Noninterest-bearing demand | $ | 30,714 | $ | 24,380 | $ | 22,947 | $ | 6,334 | 26 | % | $ | 7,767 | 34 | % | |||||||||||
Interest-bearing: | |||||||||||||||||||||||||
Savings and money market | 31,307 | 28,901 | 26,470 | 2,406 | 8 | 4,837 | 18 | ||||||||||||||||||
Time | 3,663 | 4,237 | 4,915 | (574 | ) | (14 | ) | (1,252 | ) | (25 | ) | ||||||||||||||
Total deposits | $ | 65,684 | $ | 57,518 | $ | 54,332 | $ | 8,166 | 14 | $ | 11,352 | 21 | |||||||||||||
Borrowed funds: | |||||||||||||||||||||||||
Federal funds purchased and other short-term borrowings | $ | 860 | $ | 3,765 | $ | 6,023 | $ | (2,905 | ) | (77 | ) | $ | (5,163 | ) | (86 | ) | |||||||||
Long-term debt | 1,353 | 1,795 | 1,236 | (442 | ) | (25 | ) | 117 | 9 | ||||||||||||||||
Total borrowed funds | $ | 2,213 | $ | 5,560 | $ | 7,259 | $ | (3,347 | ) | (60 | ) | $ | (5,046 | ) | (70 | ) | |||||||||
Total deposits increased by $11.4 billion, or 21%, to $65.7 billion as of June 30, 2020, primarily due to a $7.8 billion increase in noninterest-bearing deposits. The funding of SBA PPP loan proceeds into customer deposit accounts contributed meaningfully to overall deposit growth, in addition to deposit growth from non-SBA PPP loan program customers.
Average total deposits increased to $63.0 billion for the second quarter of 2020, compared with $54.3 billion for the second quarter of 2019. Average noninterest-bearing deposits increased 26% to $29.1 billion for the second quarter of 2020, compared with $23.1 billion for the second quarter of 2019, and were 46% and 42% of average total deposits, respectively, for the same periods.
Total borrowed funds decreased $5.0 billion, or 70%, to $2.2 billion as of June 30, 2020. Average borrowed funds decreased to $4.0 billion for the second quarter of 2020, compared with $7.0 billion for the second quarter of 2019. The decrease in both end-of-period and average borrowed funds reflects less reliance on wholesale borrowings due to the strength of deposit growth, which significantly exceeded earning asset growth over this period.
- more -
ZIONS BANCORPORATION, N.A.
Press Release – Page 8
July 20, 2020
Long-Term Debt and Shareholders’ Equity | |||||||||||||||||||||||||
2Q20 - 1Q20 | 2Q20 - 2Q19 | ||||||||||||||||||||||||
(In millions) | 2Q20 | 1Q20 | 2Q19 | $ | % | $ | % | ||||||||||||||||||
Shareholders’ equity: | |||||||||||||||||||||||||
Preferred stock | $ | 566 | $ | 566 | $ | 566 | $ | — | — | % | $ | — | — | % | |||||||||||
Common stock and additional paid-in capital | 2,675 | 2,668 | 3,271 | 7 | — | (596 | ) | (18 | ) | ||||||||||||||||
Retained earnings | 3,979 | 3,979 | 3,737 | — | — | 242 | 6 | ||||||||||||||||||
Accumulated other comprehensive income | 355 | 259 | 25 | 96 | 37 | 330 | NM | ||||||||||||||||||
Total shareholders' equity | $ | 7,575 | $ | 7,472 | $ | 7,599 | $ | 103 | 1 | $ | (24 | ) | — | ||||||||||||
Capital distributions: | |||||||||||||||||||||||||
Common dividends paid | $ | 56 | $ | 56 | $ | 54 | $ | — | — | $ | 2 | 4 | |||||||||||||
Bank common stock repurchased | — | 75 | 275 | (75 | ) | NM | (275 | ) | NM | ||||||||||||||||
Total capital distributed to common shareholders | $ | 56 | $ | 131 | $ | 329 | $ | (75 | ) | (57 | ) | $ | (273 | ) | (83 | ) | |||||||||
Long-term debt
During the second quarter of 2020, the Bank repurchased and retired $429 million principal amount of its senior notes and recognized a net gain of less than $1 million. This action was taken in order to manage changes in the balance sheet resulting from strong deposit growth.
Shareholder’s Equity
During the second quarter of 2020, the Bank’s common stock dividend was $0.34 per share, compared with $0.30 per share in the second quarter of 2019. Accumulated other comprehensive income improved $330 million, from $25 million as of June 30, 2019, to $355 million as of June 30, 2020. The improvement was primarily a result of increases in the fair value of available-for-sale securities due to changes in interest rates. Weighted average diluted shares outstanding decreased 8.6 million from the first quarter of 2020, primarily due to a lower average Bank common share price and the expiration of 29.2 million ZIONW warrants on May 22, 2020.
Tangible book value per common share increased to $36.56 at June 30, 2020, compared with $34.02 at June 30, 2019. Basel III common equity tier 1 (“CET1”) capital was $5.7 billion at June 30, 2020 and $6.0 billion at June 30, 2019. The estimated Basel III CET1 capital ratio was 10.2% at June 30, 2020, compared with 10.8% at June 30, 2019. For information on non-GAAP financial measures, see pages 18-21.
On January 1, 2020, we adopted Accounting Standards Update (“ASU”) 2016-13, Credit Losses (Topic 326): Measurement of Credit Losses on Financial Instruments, and its subsequent updates, often referred to as the Current Expected Credit Loss ("CECL") accounting standard. The OCC, Federal Reserve and FDIC issued a joint statement on March 27, 2020, revised on April 7, 2020, with proposed guidance for banking institutions that have adopted CECL in 2020. We have adopted the provisions of this interim final rule, which allows banks to add back, for regulatory capital purposes only, a transition adjustment related to CECL beginning with the first quarter 2020 financial statements. The adoption of these provisions improved our CET1 capital ratio at June 30, 2020 by 14 basis points.
- more -
ZIONS BANCORPORATION, N.A.
Press Release – Page 9
July 20, 2020
Supplemental Presentation and Conference Call
Zions has posted a supplemental presentation to its website, which will be used to discuss these second quarter results at 5:30 p.m. ET this afternoon (July 20, 2020). Media representatives, analysts, investors and the public are invited to join this discussion by calling (253) 237-1247 (domestic and international) and entering the passcode 5441419, or via on-demand webcast. A link to the webcast will be available on the Zions Bancorporation website at zionsbancorporation.com. The webcast of the conference call will also be archived and available for 30 days.
About Zions Bancorporation, N.A.
Zions Bancorporation, N.A. is one of the nation's premier financial services companies with annual net revenue of $2.8 billion in 2019 and more than $75 billion of total assets. Zions operates under local management teams and distinct brands in 11 western states: Arizona, California, Colorado, Idaho, Nevada, New Mexico, Oregon, Texas, Utah, Washington and Wyoming. The Bank is a consistent recipient of national and state-wide customer survey awards in small and middle-market banking, as well as a national leader in Small Business Administration lending and public finance advisory services. In addition, Zions is included in the S&P 500 and NASDAQ Financial 100 indices. Investor information and links to local banking brands can be accessed at zionsbancorporation.com.
Forward-Looking Information
This earnings release includes “forward-looking statements” as that term is defined in the Private Securities Litigation Reform Act of 1995. These statements are based on management’s current expectations and assumptions regarding future events or determinations, all of which are subject to known and unknown risks, uncertainties and other factors that may cause our actual results, performance or achievements, market trends, industry results or regulatory outcomes to differ materially from those expressed or implied by such forward-looking statements.
Without limiting the foregoing, the words “forecasts,” “targets,” “anticipates,” “believes,” “can,” “continue,” “could,” “estimates,” “expects,” “intends,” “may,” “might,” “plans,” “projects,” “should,” “would,” “will” and the negative thereof and similar words and expressions are intended to identify forward-looking statements. Forward-looking statements by their nature address matters that are, to different degrees, uncertain, such as statements about future financial and operating results. Actual results and outcomes may differ materially from those presented, either expressed or implied, in the release. Important risk factors that may cause such material differences include, but are not limited to, the effects of the spread of the virus commonly referred to as the coronavirus or COVID-19 (and other potentially similar pandemic situations) and associated impacts on general economic conditions on, among other things, our customers’ ability to make timely payments on obligations, fee income revenue due to reduced loan origination activity and card swipe income, operating expense due to alternative approaches to doing business, and so forth; the Bank’s ability to meet operating leverage goals; the rate of change of interest-sensitive assets and liabilities relative to changes in benchmark interest rates; the ability of the Bank to upgrade its core deposit system and implement new digital products in order to remain competitive; risks associated with information security, such as systems breaches and failures; and legislative, regulatory and economic developments. These risks, as well as other
- more -
ZIONS BANCORPORATION, N.A.
Press Release – Page 10
July 20, 2020
factors, are discussed in the Bank’s most recent Annual Report on Form 10-K and Quarterly Report on Form 10-Q, filed with the Securities and Exchange Commission (SEC) and available at the SEC’s Internet site (https://www.sec.gov/). In addition, you may obtain documents filed with the SEC by the Bank free of charge by contacting: Investor Relations, Zions Bancorporation, N.A., One South Main Street, 11th Floor, Salt Lake City, Utah 84133, (801) 844-7637.
We caution you against undue reliance on forward-looking statements, which reflect our views only as of the date they are made. Except as may be required by law, Zions Bancorporation, N.A. specifically disclaims any obligation to update any factors or to publicly announce the result of revisions to any of the forward-looking statements included herein to reflect future events or developments.
- more -
ZIONS BANCORPORATION, N.A.
Press Release – Page 11
July 20, 2020
FINANCIAL HIGHLIGHTS
(Unaudited)
Three Months Ended | |||||||||||||||||||
(In millions, except share, per share, and ratio data) | June 30, 2020 | March 31, 2020 | December 31, 2019 | September 30, 2019 | June 30, 2019 | ||||||||||||||
BALANCE SHEET 1 | |||||||||||||||||||
Loans held for investment, net of allowance | $ | 54,269 | $ | 49,197 | $ | 48,214 | $ | 48,325 | $ | 48,114 | |||||||||
Total assets | 76,447 | 71,467 | 69,172 | 70,361 | 70,065 | ||||||||||||||
Deposits | 65,684 | 57,518 | 57,085 | 56,139 | 54,332 | ||||||||||||||
Total shareholders’ equity | 7,575 | 7,472 | 7,353 | 7,509 | 7,599 | ||||||||||||||
STATEMENT OF INCOME | |||||||||||||||||||
Net earnings applicable to common shareholders | $ | 57 | $ | 6 | $ | 174 | $ | 214 | $ | 189 | |||||||||
Net interest income | 563 | 548 | 559 | 567 | 569 | ||||||||||||||
Taxable-equivalent net interest income 2 | 569 | 555 | 566 | 574 | 576 | ||||||||||||||
Total noninterest income | 117 | 134 | 152 | 146 | 132 | ||||||||||||||
Total noninterest expense | 430 | 408 | 472 | 415 | 424 | ||||||||||||||
Adjusted pre-provision net revenue 2 | 300 | 299 | 275 | 309 | 294 | ||||||||||||||
Provision for credit losses | 168 | 258 | 4 | 10 | 21 | ||||||||||||||
SHARE AND PER COMMON SHARE AMOUNTS | |||||||||||||||||||
Net earnings per diluted common share | $ | 0.34 | $ | 0.04 | $ | 0.97 | $ | 1.17 | $ | 0.99 | |||||||||
Dividends | 0.34 | 0.34 | 0.34 | 0.34 | 0.30 | ||||||||||||||
Book value per common share 1 | 42.74 | 42.15 | 41.12 | 40.75 | 39.75 | ||||||||||||||
Tangible book value per common share 1, 2 | 36.56 | 35.96 | 34.98 | 34.80 | 34.02 | ||||||||||||||
Weighted average share price | 31.53 | 41.02 | 48.39 | 43.04 | 46.11 | ||||||||||||||
Weighted average diluted common shares outstanding (in thousands) | 164,425 | 172,998 | 178,718 | 181,870 | 189,098 | ||||||||||||||
Common shares outstanding (in thousands) 1 | 163,978 | 163,852 | 165,057 | 170,373 | 176,935 | ||||||||||||||
SELECTED RATIOS AND OTHER DATA | |||||||||||||||||||
Return on average assets | 0.35 | % | 0.08 | % | 1.04 | % | 1.25 | % | 1.14 | % | |||||||||
Return on average common equity | 3.3 | % | 0.3 | % | 10.1 | % | 12.1 | % | 10.8 | % | |||||||||
Return on average tangible common equity 2 | 3.8 | % | 0.4 | % | 11.8 | % | 14.2 | % | 12.7 | % | |||||||||
Net interest margin | 3.23 | % | 3.41 | % | 3.46 | % | 3.48 | % | 3.54 | % | |||||||||
Cost of total deposits, annualized | 0.15 | % | 0.36 | % | 0.44 | % | 0.50 | % | 0.49 | % | |||||||||
Efficiency ratio 2 | 57.3 | % | 57.7 | % | 61.3 | % | 57.3 | % | 59.0 | % | |||||||||
Effective tax rate | 19.5 | % | 12.5 | % | 22.1 | % | 22.9 | % | 22.7 | % | |||||||||
Ratio of nonperforming assets to loans and leases and other real estate owned | 0.62 | % | 0.56 | % | 0.51 | % | 0.48 | % | 0.52 | % | |||||||||
Annualized ratio of net loan and lease charge-offs (recoveries) to average loans | 0.23 | % | 0.06 | % | 0.18 | % | 0.01 | % | 0.12 | % | |||||||||
Ratio of total allowance for credit losses to loans and leases outstanding 1 | 1.66 | % | 1.56 | % | 1.14 | % | 1.17 | % | 1.16 | % | |||||||||
Full-time equivalent employees | 9,859 | 9,879 | 10,188 | 10,255 | 10,326 | ||||||||||||||
CAPITAL RATIOS AND DATA 1 | |||||||||||||||||||
Common equity tier 1 capital | $ | 5,696 | $ | 5,667 | $ | 5,719 | $ | 5,871 | $ | 5,987 | |||||||||
Risk-weighted assets 3 | 55,878 | 56,861 | 56,039 | 56,298 | 55,499 | ||||||||||||||
Tangible common equity ratio | 7.9 | % | 8.4 | % | 8.5 | % | 8.5 | % | 8.7 | % | |||||||||
Common equity tier 1 capital ratio 3 | 10.2 | % | 10.0 | % | 10.2 | % | 10.4 | % | 10.8 | % | |||||||||
Tier 1 leverage ratio 3 | 8.4 | % | 9.0 | % | 9.2 | % | 9.3 | % | 9.5 | % | |||||||||
Tier 1 risk-based capital ratio 3 | 11.2 | % | 11.0 | % | 11.2 | % | 11.4 | % | 11.8 | % | |||||||||
Total risk-based capital ratio 3 | 13.5 | % | 13.2 | % | 13.2 | % | 12.6 | % | 13.0 | % | |||||||||
1 | At period end. |
2 | For information on non-GAAP financial measures, see pages 18-21. |
3 Current period ratios and amounts represent estimates.
- more -
ZIONS BANCORPORATION, N.A.
Press Release – Page 12
July 20, 2020
CONSOLIDATED BALANCE SHEETS
(In millions, shares in thousands) | June 30, 2020 | March 31, 2020 | December 31, 2019 | September 30, 2019 | June 30, 2019 | ||||||||||||||
(Unaudited) | (Unaudited) | (Unaudited) | (Unaudited) | ||||||||||||||||
ASSETS | |||||||||||||||||||
Cash and due from banks | $ | 570 | $ | 730 | $ | 705 | $ | 796 | $ | 538 | |||||||||
Money market investments: | |||||||||||||||||||
Interest-bearing deposits | 1,579 | 1,225 | 743 | 1,149 | 634 | ||||||||||||||
Federal funds sold and security resell agreements | 266 | 550 | 484 | 504 | 620 | ||||||||||||||
Investment securities: | |||||||||||||||||||
Held-to-maturity1, at amortized cost | 688 | 585 | 592 | 658 | 695 | ||||||||||||||
Available-for-sale, at fair value | 14,201 | 14,231 | 13,725 | 14,033 | 14,672 | ||||||||||||||
Trading account, at fair value | 160 | 160 | 182 | 280 | 148 | ||||||||||||||
Total securities, net of allowance | 15,049 | 14,976 | 14,499 | 14,971 | 15,515 | ||||||||||||||
Loans held for sale | 105 | 140 | 129 | 141 | 105 | ||||||||||||||
Loans and leases, net of unearned income and fees | 55,129 | 49,927 | 48,709 | 48,835 | 48,617 | ||||||||||||||
Less allowance for loan losses | 860 | 730 | 495 | 510 | 503 | ||||||||||||||
Loans held for investment, net of allowance | 54,269 | 49,197 | 48,214 | 48,325 | 48,114 | ||||||||||||||
Other noninterest-bearing investments | 813 | 916 | 898 | 982 | 1,056 | ||||||||||||||
Premises, equipment and software, net | 1,173 | 1,144 | 1,142 | 1,146 | 1,133 | ||||||||||||||
Goodwill and intangibles | 1,014 | 1,014 | 1,014 | 1,014 | 1,014 | ||||||||||||||
Other real estate owned | 5 | 6 | 8 | 4 | 5 | ||||||||||||||
Other assets | 1,604 | 1,569 | 1,336 | 1,329 | 1,331 | ||||||||||||||
Total assets | $ | 76,447 | $ | 71,467 | $ | 69,172 | $ | 70,361 | $ | 70,065 | |||||||||
LIABILITIES AND SHAREHOLDERS’ EQUITY | |||||||||||||||||||
Deposits: | |||||||||||||||||||
Noninterest-bearing demand | $ | 30,714 | $ | 24,380 | $ | 23,576 | $ | 23,770 | $ | 22,947 | |||||||||
Interest-bearing: | |||||||||||||||||||
Savings and money market | 31,307 | 28,901 | 28,790 | 27,427 | 26,470 | ||||||||||||||
Time | 3,663 | 4,237 | 4,719 | 4,942 | 4,915 | ||||||||||||||
Total deposits | 65,684 | 57,518 | 57,085 | 56,139 | 54,332 | ||||||||||||||
Federal funds purchased and other short-term borrowings | 860 | 3,765 | 2,053 | 4,579 | 6,023 | ||||||||||||||
Long-term debt | 1,353 | 1,795 | 1,723 | 1,242 | 1,236 | ||||||||||||||
Reserve for unfunded lending commitments | 54 | 47 | 59 | 62 | 60 | ||||||||||||||
Other liabilities | 921 | 870 | 899 | 830 | 815 | ||||||||||||||
Total liabilities | 68,872 | 63,995 | 61,819 | 62,852 | 62,466 | ||||||||||||||
Shareholders’ equity: | |||||||||||||||||||
Preferred stock, without par value; authorized 4,400 shares | 566 | 566 | 566 | 566 | 566 | ||||||||||||||
Common stock2 ($0.001 par value; authorized 350,000 shares) and additional paid-in capital | 2,675 | 2,668 | 2,735 | 3,002 | 3,271 | ||||||||||||||
Retained earnings | 3,979 | 3,979 | 4,009 | 3,892 | 3,737 | ||||||||||||||
Accumulated other comprehensive income | 355 | 259 | 43 | 49 | 25 | ||||||||||||||
Total shareholders’ equity | 7,575 | 7,472 | 7,353 | 7,509 | 7,599 | ||||||||||||||
Total liabilities and shareholders’ equity | $ | 76,447 | $ | 71,467 | $ | 69,172 | $ | 70,361 | $ | 70,065 | |||||||||
1 Held-to-maturity (approximate fair value) | $ | 691 | $ | 587 | $ | 597 | $ | 662 | $ | 698 | |||||||||
2 Common shares (issued and outstanding) | 163,978 | 163,852 | 165,057 | 170,373 | 176,935 | ||||||||||||||
- more -
ZIONS BANCORPORATION, N.A.
Press Release – Page 13
July 20, 2020
CONSOLIDATED STATEMENTS OF INCOME
(Unaudited)
Three Months Ended | |||||||||||||||||||
(In millions, except share and per share amounts) | June 30, 2020 | March 31, 2020 | December 31, 2019 | September 30, 2019 | June 30, 2019 | ||||||||||||||
Interest income: | |||||||||||||||||||
Interest and fees on loans | $ | 514 | $ | 532 | $ | 557 | $ | 581 | $ | 581 | |||||||||
Interest on money market investments | 1 | 8 | 7 | 8 | 8 | ||||||||||||||
Interest on securities | 80 | 82 | 83 | 88 | 95 | ||||||||||||||
Total interest income | 595 | 622 | 647 | 677 | 684 | ||||||||||||||
Interest expense: | |||||||||||||||||||
Interest on deposits | 23 | 51 | 62 | 69 | 66 | ||||||||||||||
Interest on short- and long-term borrowings | 9 | 23 | 26 | 41 | 49 | ||||||||||||||
Total interest expense | 32 | 74 | 88 | 110 | 115 | ||||||||||||||
Net interest income | 563 | 548 | 559 | 567 | 569 | ||||||||||||||
Provision for credit losses: | |||||||||||||||||||
Provision for loan losses | 161 | 240 | 7 | 8 | 20 | ||||||||||||||
Provision for unfunded lending commitments | 7 | 18 | (3 | ) | 2 | 1 | |||||||||||||
Total provision for credit losses | 168 | 258 | 4 | 10 | 21 | ||||||||||||||
Net interest income after provision for credit losses | 395 | 290 | 555 | 557 | 548 | ||||||||||||||
Noninterest income: | |||||||||||||||||||
Commercial account fees | 30 | 31 | 31 | 31 | 30 | ||||||||||||||
Card fees | 19 | 21 | 23 | 24 | 23 | ||||||||||||||
Retail and business banking fees | 15 | 19 | 20 | 20 | 20 | ||||||||||||||
Loan-related fees and income | 27 | 26 | 19 | 21 | 17 | ||||||||||||||
Capital markets and foreign exchange fees | 18 | 24 | 19 | 23 | 20 | ||||||||||||||
Wealth management and trust fees | 15 | 16 | 16 | 16 | 15 | ||||||||||||||
Other customer-related fees | 6 | 6 | 6 | 5 | 5 | ||||||||||||||
Customer-related fees | 130 | 143 | 134 | 140 | 130 | ||||||||||||||
Fair value and nonhedge derivative income (loss) | (12 | ) | (11 | ) | 6 | (6 | ) | (6 | ) | ||||||||||
Dividends and other income | 3 | 8 | 10 | 10 | 11 | ||||||||||||||
Securities gains (losses), net | (4 | ) | (6 | ) | 2 | 2 | (3 | ) | |||||||||||
Total noninterest income | 117 | 134 | 152 | 146 | 132 | ||||||||||||||
Noninterest expense: | |||||||||||||||||||
Salaries and employee benefits | 267 | 274 | 305 | 273 | 274 | ||||||||||||||
Occupancy, net | 32 | 33 | 34 | 34 | 32 | ||||||||||||||
Furniture, equipment and software, net | 32 | 32 | 34 | 34 | 35 | ||||||||||||||
Other real estate expense, net | — | — | — | (2 | ) | — | |||||||||||||
Credit-related expense | 6 | 4 | 5 | 2 | 8 | ||||||||||||||
Professional and legal services | 10 | 12 | 13 | 10 | 13 | ||||||||||||||
Advertising | 3 | 3 | 3 | 6 | 5 | ||||||||||||||
FDIC premiums | 7 | 5 | 6 | 7 | 6 | ||||||||||||||
Other | 73 | 45 | 72 | 51 | 51 | ||||||||||||||
Total noninterest expense | 430 | 408 | 472 | 415 | 424 | ||||||||||||||
Income before income taxes | 82 | 16 | 235 | 288 | 256 | ||||||||||||||
Income taxes | 16 | 2 | 52 | 66 | 58 | ||||||||||||||
Net income | 66 | 14 | 183 | 222 | 198 | ||||||||||||||
Preferred stock dividends | (9 | ) | (8 | ) | (9 | ) | (8 | ) | (9 | ) | |||||||||
Net earnings applicable to common shareholders | $ | 57 | $ | 6 | $ | 174 | $ | 214 | $ | 189 | |||||||||
Weighted average common shares outstanding during the period: | |||||||||||||||||||
Basic shares (in thousands) | 163,542 | 164,143 | 167,078 | 173,160 | 179,156 | ||||||||||||||
Diluted shares (in thousands) | 164,425 | 172,998 | 178,718 | 181,870 | 189,098 | ||||||||||||||
Net earnings per common share: | |||||||||||||||||||
Basic | $ | 0.34 | $ | 0.04 | $ | 1.03 | $ | 1.23 | $ | 1.05 | |||||||||
Diluted | 0.34 | 0.04 | 0.97 | 1.17 | 0.99 | ||||||||||||||
- more -
ZIONS BANCORPORATION, N.A.
Press Release – Page 14
July 20, 2020
Loan Balances Held for Investment by Portfolio Type
(Unaudited)
(In millions) | June 30, 2020 | March 31, 2020 | December 31, 2019 | September 30, 2019 | June 30, 2019 | ||||||||||||||
Commercial: | |||||||||||||||||||
Commercial and industrial | $ | 14,076 | $ | 15,533 | $ | 14,760 | $ | 14,846 | $ | 14,883 | |||||||||
SBA PPP | 6,690 | — | — | — | — | ||||||||||||||
Leasing | 324 | 331 | 334 | 332 | 337 | ||||||||||||||
Owner occupied | 8,083 | 8,045 | 7,901 | 7,924 | 7,828 | ||||||||||||||
Municipal | 2,535 | 2,483 | 2,393 | 2,185 | 2,059 | ||||||||||||||
Total commercial | 31,708 | 26,392 | 25,388 | 25,287 | 25,107 | ||||||||||||||
Commercial real estate: | |||||||||||||||||||
Construction and land development | 2,367 | 2,257 | 2,211 | 2,347 | 2,609 | ||||||||||||||
Term | 9,587 | 9,484 | 9,344 | 9,469 | 9,218 | ||||||||||||||
Total commercial real estate | 11,954 | 11,741 | 11,555 | 11,816 | 11,827 | ||||||||||||||
Consumer: | |||||||||||||||||||
Home equity credit line | 2,856 | 2,958 | 2,917 | 2,930 | 2,929 | ||||||||||||||
1-4 family residential | 7,393 | 7,567 | 7,568 | 7,506 | 7,440 | ||||||||||||||
Construction and other consumer real estate | 640 | 629 | 624 | 637 | 644 | ||||||||||||||
Bankcard and other revolving plans | 437 | 488 | 502 | 494 | 502 | ||||||||||||||
Other | 141 | 152 | 155 | 165 | 168 | ||||||||||||||
Total consumer | 11,467 | 11,794 | 11,766 | 11,732 | 11,683 | ||||||||||||||
Loans and leases, net of unearned income and fees | $ | 55,129 | $ | 49,927 | $ | 48,709 | $ | 48,835 | $ | 48,617 | |||||||||
Nonperforming Assets
(Unaudited)
(In millions) | June 30, 2020 | March 31, 2020 | December 31, 2019 | September 30, 2019 | June 30, 2019 | ||||||||||||||
Nonaccrual loans1 | $ | 339 | $ | 274 | $ | 243 | $ | 233 | $ | 248 | |||||||||
Other real estate owned | 5 | 6 | 8 | 4 | 5 | ||||||||||||||
Total nonperforming assets | $ | 344 | $ | 280 | $ | 251 | $ | 237 | $ | 253 | |||||||||
Ratio of nonperforming assets to loans1 and leases and other real estate owned | 0.62 | % | 0.56 | % | 0.51 | % | 0.48 | % | 0.52 | % | |||||||||
Accruing loans past due 90 days or more | $ | 16 | $ | 8 | $ | 10 | $ | 6 | $ | 17 | |||||||||
Ratio of accruing loans past due 90 days or more to loans1 and leases | 0.03 | % | 0.02 | % | 0.02 | % | 0.01 | % | 0.03 | % | |||||||||
Nonaccrual loans and accruing loans past due 90 days or more | $ | 355 | $ | 282 | $ | 253 | $ | 239 | $ | 265 | |||||||||
Ratio of nonaccrual loans and accruing loans past due 90 days or more to loans1 and leases | 0.64 | % | 0.56 | % | 0.52 | % | 0.49 | % | 0.54 | % | |||||||||
Accruing loans past due 30-89 days | $ | 168 | $ | 135 | $ | 75 | $ | 84 | $ | 99 | |||||||||
Restructured loans included in nonaccrual loans | 88 | 88 | 75 | 92 | 79 | ||||||||||||||
Restructured loans on accrual | 197 | 79 | 78 | 90 | 97 | ||||||||||||||
Classified loans | 1,477 | 881 | 803 | 799 | 770 | ||||||||||||||
1 Includes loans held for sale.
- more -
ZIONS BANCORPORATION, N.A.
Press Release – Page 15
July 20, 2020
Allowance for Credit Losses
(Unaudited)
Three Months Ended | |||||||||||||||||||
(In millions) | June 30, 2020 | March 31, 2020 | December 31, 2019 | September 30, 2019 | June 30, 2019 | ||||||||||||||
Allowance for Loan Losses | |||||||||||||||||||
Balance at beginning of period1 | $ | 730 | $ | 497 | $ | 510 | $ | 503 | $ | 497 | |||||||||
Provision for loan losses | 161 | 240 | 7 | 8 | 20 | ||||||||||||||
Loan and lease charge-offs | 36 | 13 | 32 | 11 | 23 | ||||||||||||||
Less: Recoveries | 5 | 6 | 10 | 10 | 9 | ||||||||||||||
Net loan and lease charge-offs | 31 | 7 | 22 | 1 | 14 | ||||||||||||||
Balance at end of period | $ | 860 | $ | 730 | $ | 495 | $ | 510 | $ | 503 | |||||||||
Ratio of allowance for loan losses to loans2 and leases, at period end | 1.56 | % | 1.46 | % | 1.02 | % | 1.04 | % | 1.03 | % | |||||||||
Ratio of allowance for loan losses to nonaccrual loans2 at period end | 254 | % | 266 | % | 204 | % | 219 | % | 203 | % | |||||||||
Annualized ratio of net loan and lease charge-offs to average loans | 0.23 | % | 0.06 | % | 0.18 | % | 0.01 | % | 0.12 | % | |||||||||
Reserve for Unfunded Lending Commitments | |||||||||||||||||||
Balance at beginning of period1 | $ | 47 | $ | 29 | $ | 62 | $ | 60 | $ | 59 | |||||||||
Provision for unfunded lending commitments | 7 | 18 | (3 | ) | 2 | 1 | |||||||||||||
Balance at end of period | $ | 54 | $ | 47 | $ | 59 | $ | 62 | $ | 60 | |||||||||
Allowance for Credit Losses | |||||||||||||||||||
Allowance for loan losses | $ | 860 | $ | 730 | $ | 495 | $ | 510 | $ | 503 | |||||||||
Reserve for unfunded lending commitments | 54 | 47 | 59 | 62 | 60 | ||||||||||||||
Total allowance for credit losses | $ | 914 | $ | 777 | $ | 554 | $ | 572 | $ | 563 | |||||||||
Ratio of total allowance for credit losses to loans2 and leases outstanding, at period end | 1.66 | % | 1.56 | % | 1.14 | % | 1.17 | % | 1.16 | % | |||||||||
Ratio of total allowance for credit losses to loans2 and leases outstanding (excluding SBA PPP loans), at period end | 1.88 | % | 1.56 | % | 1.14 | % | 1.17 | % | 1.16 | % | |||||||||
1 Beginning balances at March 31, 2020 for the allowance for loan losses and reserve for unfunded lending commitments do not agree to their respective ending balances at December 31, 2019 because of the adoption of the CECL accounting standard; the allowance for loan losses was adjusted to $497 million, the reserve for unfunded lending commitments was adjusted to $29 million on January 1, 2020.
2 Does not include loans held for sale.
- more -
ZIONS BANCORPORATION, N.A.
Press Release – Page 16
July 20, 2020
Nonaccrual Loans by Portfolio Type
(Unaudited)
(In millions) | June 30, 2020 | March 31, 2020 | December 31, 2019 | September 30, 2019 | June 30, 2019 | ||||||||||||||
Loans held for sale | $ | — | $ | — | $ | — | $ | — | $ | — | |||||||||
Commercial: | |||||||||||||||||||
Commercial and industrial | $ | 172 | $ | 135 | $ | 110 | $ | 97 | $ | 85 | |||||||||
Leasing | 1 | 1 | — | 1 | 1 | ||||||||||||||
Owner occupied | 68 | 65 | 65 | 49 | 69 | ||||||||||||||
Municipal | — | — | — | — | 1 | ||||||||||||||
Total commercial | 241 | 201 | 175 | 147 | 156 | ||||||||||||||
Commercial real estate: | |||||||||||||||||||
Construction and land development | — | — | — | — | 1 | ||||||||||||||
Term | 23 | 15 | 16 | 29 | 31 | ||||||||||||||
Total commercial real estate | 23 | 15 | 16 | 29 | 32 | ||||||||||||||
Consumer: | |||||||||||||||||||
Home equity credit line | 15 | 14 | 12 | 12 | 12 | ||||||||||||||
1-4 family residential | 59 | 43 | 40 | 44 | 44 | ||||||||||||||
Construction and other consumer real estate | — | — | — | 1 | 4 | ||||||||||||||
Bankcard and other revolving plans | 1 | 1 | — | — | — | ||||||||||||||
Other | — | — | — | — | — | ||||||||||||||
Total consumer | 75 | 58 | 52 | 57 | 60 | ||||||||||||||
Total nonaccrual loans | $ | 339 | $ | 274 | $ | 243 | $ | 233 | $ | 248 | |||||||||
Net Charge-Offs by Portfolio Type
(Unaudited)
(In millions) | June 30, 2020 | March 31, 2020 | December 31, 2019 | September 30, 2019 | June 30, 2019 | ||||||||||||||
Commercial: | |||||||||||||||||||
Commercial and industrial | $ | 26 | $ | 7 | $ | 19 | $ | — | $ | 13 | |||||||||
Leasing | — | — | — | — | — | ||||||||||||||
Owner occupied | 2 | (1 | ) | (1 | ) | (1 | ) | — | |||||||||||
Municipal | — | — | — | — | — | ||||||||||||||
Total commercial | 28 | 6 | 18 | (1 | ) | 13 | |||||||||||||
Commercial real estate: | |||||||||||||||||||
Construction and land development | — | — | (1 | ) | — | — | |||||||||||||
Term | — | — | 2 | (1 | ) | — | |||||||||||||
Total commercial real estate | — | — | 1 | (1 | ) | — | |||||||||||||
Consumer: | |||||||||||||||||||
Home equity credit line | — | — | 1 | — | — | ||||||||||||||
1-4 family residential | — | (1 | ) | (1 | ) | (1 | ) | (1 | ) | ||||||||||
Construction and other consumer real estate | — | — | — | — | — | ||||||||||||||
Bankcard and other revolving plans | 2 | 1 | 2 | 3 | 1 | ||||||||||||||
Other | 1 | 1 | 1 | 1 | 1 | ||||||||||||||
Total consumer loans | 3 | 1 | 3 | 3 | 1 | ||||||||||||||
Total net charge-offs (recoveries) | $ | 31 | $ | 7 | $ | 22 | $ | 1 | $ | 14 | |||||||||
- more -
ZIONS BANCORPORATION, N.A.
Press Release – Page 17
July 20, 2020
CONSOLIDATED AVERAGE BALANCE SHEETS, YIELDS AND RATES
(Unaudited) | Three Months Ended | |||||||||||||||||||
June 30, 2020 | March 31, 2020 | June 30, 2019 | ||||||||||||||||||
(In millions) | Average balance | Average yield/rate 1 | Average balance | Average yield/rate 1 | Average balance | Average yield/rate 1 | ||||||||||||||
ASSETS | ||||||||||||||||||||
Money market investments | $ | 1,610 | 0.35 | % | $ | 2,013 | 1.52 | % | $ | 1,261 | 2.64 | % | ||||||||
Securities: | ||||||||||||||||||||
Held-to-maturity | 632 | 3.58 | % | 593 | 3.72 | % | 687 | 3.69 | % | |||||||||||
Available-for-sale | 14,128 | 2.12 | % | 13,687 | 2.26 | % | 14,750 | 2.43 | % | |||||||||||
Trading account | 149 | 4.29 | % | 164 | 4.27 | % | 172 | 4.48 | % | |||||||||||
Total securities | 14,909 | 2.20 | % | 14,444 | 2.34 | % | 15,609 | 2.51 | % | |||||||||||
Loans held for sale | 125 | 5.02 | % | 109 | 3.14 | % | 71 | 2.18 | % | |||||||||||
Loans held for investment:2 | ||||||||||||||||||||
Commercial - excluding SBA PPP loans | 25,773 | 4.05 | % | 25,514 | 4.53 | % | 24,977 | 4.94 | % | |||||||||||
Commerical - SBA PPP loans | 5,016 | 3.14 | % | — | — | % | — | — | % | |||||||||||
Commercial real estate | 11,866 | 3.81 | % | 11,546 | 4.62 | % | 11,777 | 5.22 | % | |||||||||||
Consumer | 11,613 | 3.66 | % | 11,737 | 3.99 | % | 11,570 | 4.28 | % | |||||||||||
Total loans held for investment | 54,268 | 3.83 | % | 48,797 | 4.42 | % | 48,324 | 4.85 | % | |||||||||||
Total interest-earning assets | 70,912 | 3.41 | % | 65,363 | 3.87 | % | 65,265 | 4.24 | % | |||||||||||
Cash and due from banks | 617 | 676 | 592 | |||||||||||||||||
Allowance for credit losses on loans and debt securities | (724 | ) | (499 | ) | (496 | ) | ||||||||||||||
Goodwill and intangibles | 1,014 | 1,014 | 1,014 | |||||||||||||||||
Other assets | 4,095 | 3,651 | 3,480 | |||||||||||||||||
Total assets | $ | 75,914 | $ | 70,205 | $ | 69,855 | ||||||||||||||
LIABILITIES AND SHAREHOLDERS’ EQUITY | ||||||||||||||||||||
Interest-bearing deposits: | ||||||||||||||||||||
Savings and money market | $ | 30,094 | 0.13 | % | $ | 28,856 | 0.47 | % | $ | 26,262 | 0.63 | % | ||||||||
Time | 3,853 | 1.35 | % | 4,454 | 1.61 | % | 5,025 | 2.02 | % | |||||||||||
Total interest-bearing deposits | 33,947 | 0.27 | % | 33,310 | 0.62 | % | 31,287 | 0.85 | % | |||||||||||
Borrowed funds: | ||||||||||||||||||||
Federal funds purchased and other short-term borrowings | 2,230 | 0.11 | % | 2,922 | 1.19 | % | 5,795 | 2.53 | % | |||||||||||
Long-term debt | 1,736 | 1.93 | % | 1,747 | 3.21 | % | 1,230 | 3.84 | % | |||||||||||
Total borrowed funds | 3,966 | 0.91 | % | 4,669 | 1.95 | % | 7,025 | 2.76 | % | |||||||||||
Total interest-bearing funds | 37,913 | 0.34 | % | 37,979 | 0.78 | % | 38,312 | 1.20 | % | |||||||||||
Noninterest-bearing deposits | 29,053 | 23,599 | 23,060 | |||||||||||||||||
Other liabilities | 1,352 | 1,137 | 929 | |||||||||||||||||
Total liabilities | 68,318 | 62,715 | 62,301 | |||||||||||||||||
Shareholders’ equity: | ||||||||||||||||||||
Preferred equity | 566 | 566 | 566 | |||||||||||||||||
Common equity | 7,030 | 6,924 | 6,988 | |||||||||||||||||
Total shareholders’ equity | 7,596 | 7,490 | 7,554 | |||||||||||||||||
Total liabilities and shareholders’ equity | $ | 75,914 | $ | 70,205 | $ | 69,855 | ||||||||||||||
Spread on average interest-bearing funds | 3.07 | % | 3.09 | % | 3.04 | % | ||||||||||||||
Impact of net noninterest-bearing sources of funds | 0.16 | % | 0.32 | % | 0.50 | % | ||||||||||||||
Net interest margin | 3.23 | % | 3.41 | % | 3.54 | % | ||||||||||||||
Memo: total loans and leases, excluding SBA PPP loans | 49,252 | 3.90 | % | 48,797 | 4.42 | % | 48,324 | 4.85 | % | |||||||||||
Memo: total cost of deposits | 0.15 | % | 0.36 | % | 0.49 | % | ||||||||||||||
Memo: total deposits and interest-bearing liabilities | 66,966 | 0.19 | % | 61,578 | 0.48 | % | 61,372 | 0.75 | % | |||||||||||
1 Rates are calculated using amounts in thousands and the statutory taxable-equivalent rates where applicable.
2 Net of unearned income and fees, net of related costs. Loans include nonaccrual and restructured loans.
- more -
ZIONS BANCORPORATION, N.A.
Press Release – Page 18
July 20, 2020
GAAP to Non-GAAP Reconciliations
(Unaudited)
This press release presents non-GAAP financial measures, in addition to GAAP financial measures, to provide investors with additional information. The adjustments to reconcile from the applicable GAAP financial measures to the non-GAAP financial measures are presented in the following schedules. The Bank considers these adjustments to be relevant to ongoing operating results and provide a meaningful base for period-to-period and company-to-company comparisons. These non-GAAP financial measures are used by management to assess the performance and financial position of the Bank and for presentations of Bank performance to investors. The Bank further believes that presenting these non-GAAP financial measures will permit investors to assess the performance of the Bank on the same basis as that applied by management.
Non-GAAP financial measures have inherent limitations, and are not required to be uniformly applied by individual entities. Although non-GAAP financial measures are frequently used by stakeholders to evaluate a company, they have limitations as an analytical tool and should not be considered in isolation or as a substitute for analysis of results reported under GAAP.
The following are non-GAAP financial measures presented in this press release and a discussion of the reasons for which management uses these non-GAAP measures:
Tangible Book Value per Common Share – this schedule also includes “tangible common equity.” Tangible book value per common share is a non-GAAP financial measure that management believes provides additional useful information about the level of tangible equity in relation to outstanding shares of common stock. Management believes the use of ratios that utilize tangible equity provides additional useful information to management and others about capital adequacy because they present measures of those assets that can generate income.
(In millions, except shares and per share amounts) | June 30, 2020 | March 31, 2020 | December 31, 2019 | September 30, 2019 | June 30, 2019 | |||||||||||||||
Tangible Book Value per Common Share | ||||||||||||||||||||
Total shareholders’ equity (GAAP) | $ | 7,575 | $ | 7,472 | $ | 7,353 | $ | 7,509 | $ | 7,599 | ||||||||||
Preferred stock | (566 | ) | (566 | ) | (566 | ) | (566 | ) | (566 | ) | ||||||||||
Goodwill and intangibles | (1,014 | ) | (1,014 | ) | (1,014 | ) | (1,014 | ) | (1,014 | ) | ||||||||||
Tangible common equity (non-GAAP) | (a) | $ | 5,995 | $ | 5,892 | $ | 5,773 | $ | 5,929 | $ | 6,019 | |||||||||
Common shares outstanding (in thousands) | (b) | 163,978 | 163,852 | 165,057 | 170,373 | 176,935 | ||||||||||||||
Tangible book value per common share (non-GAAP) | (a/b) | $ | 36.56 | $ | 35.96 | $ | 34.98 | $ | 34.80 | $ | 34.02 | |||||||||
- more -
ZIONS BANCORPORATION, N.A.
Press Release – Page 19
July 20, 2020
GAAP to Non-GAAP Reconciliations
(Unaudited)
Return on Average Tangible Common Equity (“ROTCE”) – this schedule also includes “net earnings applicable to common shareholders, excluding the effects of the adjustments, net of tax” and “average tangible common equity.” ROTCE is a non-GAAP financial measure that management believes provides useful information to management and others about the Bank’s use of shareholders’ equity. Management believes the use of ratios that utilize tangible equity provides additional useful information about performance because they present measures of those assets that can generate income.
Three Months Ended | ||||||||||||||||||||
(Dollar amounts in millions) | June 30, 2020 | March 31, 2020 | December 31, 2019 | September 30, 2019 | June 30, 2019 | |||||||||||||||
Return on Average Tangible Common Equity | ||||||||||||||||||||
Net earnings applicable to common shareholders (GAAP) | $ | 57 | $ | 6 | $ | 174 | $ | 214 | $ | 189 | ||||||||||
Adjustments, net of tax: | ||||||||||||||||||||
Amortization of core deposit and other intangibles | — | — | — | — | — | |||||||||||||||
Net earnings applicable to common shareholders, excluding the effects of the adjustments, net of tax (non-GAAP) | (a) | $ | 57 | $ | 6 | $ | 174 | $ | 214 | $ | 189 | |||||||||
Average common equity (GAAP) | $ | 7,030 | $ | 6,924 | $ | 6,866 | $ | 7,002 | $ | 6,988 | ||||||||||
Average goodwill and intangibles | (1,014 | ) | (1,014 | ) | (1,014 | ) | (1,014 | ) | (1,014 | ) | ||||||||||
Average tangible common equity (non-GAAP) | (b) | $ | 6,016 | $ | 5,910 | $ | 5,852 | $ | 5,988 | $ | 5,974 | |||||||||
Number of days in quarter | (c) | 91 | 91 | 92 | 92 | 91 | ||||||||||||||
Number of days in year | (d) | 366 | 366 | 365 | 365 | 365 | ||||||||||||||
Return on average tangible common equity (non-GAAP) | (a/b/c)*d | 3.8 | % | 0.4 | % | 11.8 | % | 14.2 | % | 12.7 | % | |||||||||
- more -
ZIONS BANCORPORATION, N.A.
Press Release – Page 20
July 20, 2020
GAAP to Non-GAAP Reconciliations
(Unaudited)
Efficiency Ratio – this schedule also includes “adjusted noninterest expense,” “taxable-equivalent net interest income,” “adjusted taxable-equivalent revenue,” “pre-provision net revenue (PPNR)” and “adjusted PPNR.” The methodology of determining the efficiency ratio may differ among companies. Management makes adjustments to exclude certain items as identified in the subsequent schedule which it believes allows for more consistent comparability among periods. Management believes the efficiency ratio provides useful information regarding the cost of generating revenue. Adjusted noninterest expense provides a measure as to how well the Bank is managing its expenses, and adjusted PPNR enables management and others to assess the Bank’s ability to generate capital to cover credit losses through a credit cycle. Taxable-equivalent net interest income allows management to assess the comparability of revenue arising from both taxable and tax-exempt sources.
Three Months Ended | ||||||||||||||||||||
(In millions) | June 30, 2020 | March 31, 2020 | December 31, 2019 | September 30, 2019 | June 30, 2019 | |||||||||||||||
Efficiency Ratio | ||||||||||||||||||||
Noninterest expense (GAAP) | (a) | $ | 430 | $ | 408 | $ | 472 | $ | 415 | $ | 424 | |||||||||
Adjustments: | ||||||||||||||||||||
Severance costs | — | — | 22 | 2 | 1 | |||||||||||||||
Other real estate expense, net | — | — | — | (2 | ) | — | ||||||||||||||
Restructuring costs | — | 1 | 15 | — | — | |||||||||||||||
Pension termination-related expense | 28 | — | — | — | — | |||||||||||||||
Total adjustments | (b) | 28 | 1 | 37 | — | 1 | ||||||||||||||
Adjusted noninterest expense (non-GAAP) | (a-b)=(c) | $ | 402 | $ | 407 | $ | 435 | $ | 415 | $ | 423 | |||||||||
Net interest income (GAAP) | (d) | $ | 563 | $ | 548 | $ | 559 | $ | 567 | $ | 569 | |||||||||
Fully taxable-equivalent adjustments | (e) | 6 | 7 | 7 | 7 | 7 | ||||||||||||||
Taxable-equivalent net interest income (non-GAAP) | (d+e)=(f) | 569 | 555 | 566 | 574 | 576 | ||||||||||||||
Noninterest income (GAAP) | (g) | 117 | 134 | 152 | 146 | 132 | ||||||||||||||
Combined income (non-GAAP) | (f+g)=(h) | 686 | 689 | 718 | 720 | 708 | ||||||||||||||
Adjustments: | ||||||||||||||||||||
Fair value and nonhedge derivative loss | (12 | ) | (11 | ) | 6 | (6 | ) | (6 | ) | |||||||||||
Securities gains (losses), net | (4 | ) | (6 | ) | 2 | 2 | (3 | ) | ||||||||||||
Total adjustments | (i) | (16 | ) | (17 | ) | 8 | (4 | ) | (9 | ) | ||||||||||
Adjusted taxable-equivalent revenue (non-GAAP) | (h-i)=(j) | $ | 702 | $ | 706 | $ | 710 | $ | 724 | $ | 717 | |||||||||
Pre-provision net revenue (PPNR) (non-GAAP) | (h)-(a) | $ | 256 | $ | 281 | $ | 246 | $ | 305 | $ | 284 | |||||||||
Adjusted PPNR (non-GAAP) | (j)-(c) | 300 | 299 | 275 | 309 | 294 | ||||||||||||||
Efficiency ratio (non-GAAP) | (c/j) | 57.3 | % | 57.7 | % | 61.3 | % | 57.3 | % | 59.0 | % | |||||||||
- more -
ZIONS BANCORPORATION, N.A.
Press Release – Page 21
July 20, 2020
Six Months Ended | ||||||||
(In millions) | June 30, 2020 | June 30, 2019 | ||||||
Efficiency Ratio | ||||||||
Noninterest expense (GAAP) | (a) | $ | 837 | $ | 854 | |||
Adjustments: | ||||||||
Severance costs | — | 1 | ||||||
Other real estate expense | — | (1 | ) | |||||
Debt extinguishment cost | — | — | ||||||
Amortization of core deposit and other intangibles | — | 1 | ||||||
Restructuring costs | 1 | — | ||||||
Pension termination-related expense | 28 | — | ||||||
Total adjustments | (b) | 29 | 1 | |||||
Adjusted noninterest expense (non-GAAP) | (a-b)=(c) | $ | 808 | $ | 853 | |||
Net interest income (GAAP) | (d) | $ | 1,111 | $ | 1,145 | |||
Fully taxable-equivalent adjustments | (e) | 13 | 13 | |||||
Taxable-equivalent net interest income (non-GAAP) | (d+e)=(f) | 1,124 | 1,158 | |||||
Noninterest income (GAAP) | (g) | 250 | 264 | |||||
Combined income (non-GAAP) | (f+g)=(h) | 1,374 | 1,422 | |||||
Adjustments: | ||||||||
Fair value and nonhedge derivative income (loss) | (23 | ) | (8 | ) | ||||
Securities gains (losses), net | (9 | ) | (2 | ) | ||||
Total adjustments | (i) | (32 | ) | (10 | ) | |||
Adjusted taxable-equivalent revenue (non-GAAP) | (h-i)=(j) | $ | 1,406 | $ | 1,432 | |||
Pre-provision net revenue (PPNR) | (h)-(a) | $ | 537 | $ | 568 | |||
Adjusted PPNR (non-GAAP) | (j)-(c) | 598 | 579 | |||||
Efficiency ratio (non-GAAP) | (c/j) | 57.5 | % | 59.6 | % | |||
# # #