
CLW 8-K
Clearwater Paper Corp (CLW)
8-K
2020-08-04
For: 2020-08-04
View Original
Added on
April 06, 2026
UNITED STATES
SECURITIES AND EXCHANGE COMMISSION
Washington, D.C. 20549
FORM 8-K
CURRENT REPORT
Pursuant to Section 13 or 15(d) of the
Securities Exchange Act of 1934
Date of Report (Date of earliest event reported): August 4, 2020
CLEARWATER PAPER CORPORATION
(Exact name of registrant as specified in its charter)
Delaware (State or other jurisdiction of incorporation) | 001-34146 (Commission File Number) | 20-3594554 (IRS Employer Identification No.) | ||||||
601 West Riverside Ave., Suite 1100 Spokane, WA (Address of principal executive offices) | 99201 (Zip Code) | ||||
Registrant’s telephone number, including area code: (509) 344-5900
Not Applicable
(Former Name or Former Address, if Changed Since Last Report)
Check the appropriate box below if the Form 8-K filing is intended to simultaneously satisfy the filing obligation of the registrant under any of the following provisions (see General Instructions A.2. below):
¬ Written communications pursuant to Rule 425 under the Securities Act (17 CFR 230.425)
¬ Soliciting material pursuant to Rule 14a-12 under the Exchange Act (17 CFR 240.14a-12)
¬ Pre-commencement communications pursuant to Rule 14d-2(b) under the Exchange Act (17 CFR 240.14d-2(b))
¬ Pre-commencement communications pursuant to Rule 13e-4(c) under the Exchange Act (17 CFR 240.13e-4(c))
Securities registered pursuant to Section 12(b) of the Act:
| Title of each class | Trading Symbol(s) | Name of each exchanged on which registered | ||||||
| Common Stock, par value $0.0001 per share | CLW | New York Stock Exchange | ||||||
Indicate by check mark whether the registrant is an emerging growth company as defined in Rule 405 of the Securities Act of 1933 (§ 230.405 of this chapter) or Rule 12b-2 of the Securities Exchange Act of 1934 (§ 240.12b-2 of this chapter).
Emerging growth company
If an emerging growth company, indicate by check mark if the registrant has elected not to use the extended transition period for complying with any new or revised financial accounting standards provided pursuant to Section 13(a) of the Exchange Act.
Item 2.02. Results of Operations and Financial Condition.
On August 4, 2020, Clearwater Paper Corporation (the “Company”) announced its results of operations and financial condition for the second quarter ending June 30, 2020. A copy of the press release containing this announcement is furnished as Exhibit 99.1 hereto. In addition, a copy of the Company’s Second Quarter Supplemental Information is furnished as Exhibit 99.2 hereto.
The information in this Item 2.02, including Exhibits 99.1 and 99.2, shall not be deemed “filed” for purposes of Section 18 of the Securities Exchange Act of 1934, as amended (the “Exchange Act”), nor shall it be deemed incorporated by reference in any filing under the Securities Act of 1933, as amended, or the Exchange Act, except as shall be expressly set forth by specific reference in such filing.
Item 9.01. Financial Statements and Exhibits
(d) Exhibit Index
| Exhibit | Description | ||||
| 99.1 | |||||
| 99.2 | |||||
SIGNATURES
Pursuant to the requirements of the Securities Exchange Act of 1934, the registrant has duly caused this report to be signed on its behalf by the undersigned hereunto duly authorized.
Date: August 4, 2020
CLEARWATER PAPER CORPORATION
| By: | /s/ Rebecca A. Barckley | ||||
| Rebecca A. Barckley, Vice President, Corporate Controller | |||||
| (Principal Accounting Officer) | |||||
Exhibit 99.1
Clearwater Paper Reports Second Quarter 2020 Results
SPOKANE, Wash.--(BUSINESS WIRE)--August 4, 2020 --Clearwater Paper Corporation (NYSE:CLW), a premier supplier of quality tissue and bleached paperboard products, today reported financial results for the second quarter and first six months of 2020.
SECOND QUARTER HIGHLIGHTS
•Delivered strong performance due to continued elevated demand for tissue products and solid operational execution
•Net income of $23 million, or $1.36 per diluted share and Adjusted EBITDA of $79 million
•Net debt reduction of over $100 million and liquidity improved to $264 million
"We continue to remain focused on two priorities – the health and safety of our employees and continuing to safely operate our facilities to meet the needs of our customers,” said Arsen Kitch, president and chief executive officer. “In the second quarter, we achieved a quarterly record Adjusted EBITDA due to elevated demand and production in tissue, stable paperboard performance and lower input costs, which resulted in strong free cash flow used to reduce our net debt.”
OVERALL RESULTS
For the second quarter of 2020, Clearwater Paper reported net sales of $480 million, a 6% increase compared to net sales of $452 million for the second quarter of 2019. Net income for the second quarter of 2020 was $23 million, or $1.36 per diluted share, compared to net loss for the second quarter of 2019 of $0.4 million, or $0.03 per diluted share. On a non-GAAP basis, Clearwater Paper reported adjusted net income in the second quarter of 2020 of $28 million, or $1.67 per diluted share, compared to second quarter 2019 adjusted net income of $2 million, or $0.15 per diluted share. Adjusted EBITDA for the quarter was $79 million, compared to the second quarter of 2019 Adjusted EBITDA of $44 million.
For the first six months of 2020, Clearwater Paper reported net sales of $958 million, a 9% increase compared to net sales of $881 million for the first six months of 2019. Net income for the first six months of 2020 was $33 million, or $1.99 per diluted share, compared to net income for the first six months of 2019 of $3 million, or $0.21 per diluted share. On a non-GAAP basis, Clearwater Paper reported adjusted net income in the first six months of 2020 of $37 million, or $2.24 per diluted share, compared to the first six months of 2019 adjusted net income of $6 million, or $0.34 per diluted share. Adjusted EBITDA for the first six months of 2020 was $134 million, compared to the first six months of 2019 Adjusted EBITDA of $84 million.
Consumer Products Segment
Net sales in the Consumer Products segment were $275 million for the second quarter of 2020, up 23% compared to the second quarter 2019 net sales of $224 million. In the second quarter of 2020, converted case shipments reached 16.0 million cases, an increase of 28% compared to 12.5 million cases shipped in the second quarter of 2019. Segment operating income for the second quarter of 2020 was $37 million compared to operating loss of $5 million in the second quarter of 2019. Adjusted EBITDA for the segment was $54 million in the second quarter of 2020, up from $12 million in the second quarter of 2019. The increase in operating income and Adjusted EBITDA was primarily due to increased production and shipment volumes from elevated demand which drove improvement in fixed cost absorption. The company also realized benefits from lower external pulp prices and freight costs.
Net sales in the Consumer Products segment were $541 million for the first six months of 2020, up 21% compared to the first six months 2019 net sales of $448 million. In the first six months of 2020, converted case shipments reached 31.2 million cases, an increase of 26% compared to 24.8 million cases shipped in the first six months of 2019. Segment operating income for the first six months of 2020 was $51 million, compared to operating loss of $4 million in the first six months of 2019. Adjusted EBITDA for the segment was $85 million in the first six months of 2020, up from $28 million in the first six months of 2019.
Tissue Sales Volumes and Prices:
• Total tissue volumes sold were 101,244 tons in the second quarter of 2020, an increase of 22% compared to 82,798 tons in the second quarter of 2019. Retail volumes represented 94% of total volumes sold in the second quarter of 2020, an increase from 92% in the second quarter of 2019. Total tissue volumes sold were 201,037 tons in the first six months of 2020, an increase of 21% compared to 166,420 tons in the first six months of 2019. Retail volumes represented 93% of total volumes sold in the first six months of 2020, an increase from 90% in the first six months of 2019.
• Average tissue net selling prices decreased 1% to $2,672 per ton in the second quarter of 2020, compared to $2,691 per ton in the second quarter of 2019. Average tissue net selling prices decreased 1% to $2,649 per ton in the first six months of 2020, compared to $2,679 per ton in the first six months of 2019.
Paperboard Products Segment
Net sales in the Paperboard Products segment were $205 million for the second quarter of 2020, down 10% compared to second quarter 2019 net sales of $228 million. The decrease in sales was due to lower sales volume with a positive mix partially offset by lower pricing. Segment operating income for the second quarter of 2020 was $32 million compared to $34 million for the second quarter of 2019. Adjusted EBITDA for the segment was $41 million in the second quarter of 2020, compared to $43 million in the second quarter of 2019.
Net sales in the Paperboard Product segment were $418 million for the first six months of 2020, down 4% compared to the first six months 2019 net sales of $433 million. Segment operating income for the first six months of 2020 was $59 million compared to $63 million for the first six months of 2019. Adjusted EBITDA for the segment was $77 million in the first six months of 2020, compared to $82 million in the first six months of 2019.
Paperboard Sales Volumes and Prices:
• Paperboard sales volumes were 207,410 tons in the second quarter of 2020, a decrease of 8% compared to 225,188 tons in the second quarter of 2019 partially due to a one-time increase in the second quarter of 2019 based upon the treatment of our consigned inventory. Paperboard sales volumes were 418,706 tons in the first six months of 2020, a decrease of 2% compared to 428,022 tons in the first six months of 2019.
• Paperboard average net selling price decreased 2% to $984 per ton for the second quarter of 2020, compared to $1,004 per ton in the second quarter of 2019. Paperboard average net selling price decreased 1% to $991 per ton for the first six months of 2020, compared to $1,003 per ton in the first six months of 2019.
COMPANY OUTLOOK
"For the upcoming quarter, our primary focus will remain the health and safety of our employees while we continue to operate our facilities and service customers. Demand for tissue products is expected to remain at elevated levels due to COVID-19 but slowly normalize as retail in-stock conditions and inventories continue to improve. We are also closely monitoring economic conditions and assessing the impact on our business for the balance of the year,” Kitch concluded.
WEBCAST INFORMATION
Clearwater Paper Corporation will discuss these results during an earnings conference call that begins at 2:00 p.m. Pacific Time today. A live webcast and accompanying supplemental information will be available on the company's website at http://ir.clearwaterpaper.com. A replay of today's conference call will be available on the website at http://ir.clearwaterpaper.com/results.cfm beginning at 5:00 p.m. Pacific Time today.
ABOUT CLEARWATER PAPER
Clearwater Paper is a premier supplier of private label tissue to major retailers and wholesale distributors, including grocery, drug, mass merchants and discount stores. In addition, the company produces bleached paperboard used by quality-conscious printers and packaging converters, and offers services that include custom sheeting, slitting and cutting. Clearwater Paper's employees build shareholder value by developing strong relationships through quality and service.
USE OF NON-GAAP MEASURES
In this press release, the company presents certain non-GAAP financial information for the second quarter and first six months of 2020 and 2019, including adjusted income (loss) and Adjusted EBITDA. Because these amounts are not in accordance with GAAP, reconciliations to net income (loss) as determined in accordance with GAAP are included in the tables at the end of this press release. The company presents these non-GAAP amounts because management believes they assist investors and analysts in comparing the company's performance across reporting periods on a consistent basis by excluding items that the company does not believe are indicative of its core operating performance. In addition, the company uses Adjusted EBITDA: (i) as factors in evaluating management’s performance when determining incentive compensation, (ii) to evaluate the effectiveness of the company's business strategies, and (iii) because the company's credit agreement and the indentures governing the company's outstanding notes use metrics similar to Adjusted EBITDA to measure the company's compliance with certain covenants.
FORWARD-LOOKING STATEMENTS
This press release contains certain forward-looking statements within the meaning of the Private Securities Litigation Reform Act of 1995 as amended, including statements regarding the health and safety of company’s employees, product demand, retail in-stock conditions and inventories and general economic conditions. These forward-looking statements are based on
current expectations, estimates, assumptions, and projections that are subject to change, and actual results may differ materially from the forward-looking statements. Factors that could cause actual results to differ materially include, but are not limited to: the impacts of the COVID-19 pandemic on our business and operations; competitive pricing pressures for the company’s products, including as a result of increased capacity, as additional manufacturing facilities are operated by the company’s competitors; the loss of, changes in prices in regard to, or reduction in, orders from a significant customer; changes in the cost and availability of wood fiber and wood pulp; changes in transportation costs and disruptions in transportation services; changes in customer product preferences and competitors' product offerings; larger competitors having operational and other advantages; customer acceptance and timing and quantity of purchases of the company’s tissue products, including the existence of sufficient demand for and the quality of tissue produced by the company’s expanded Shelby, North Carolina operations; consolidation and vertical integration of converting operations in the paperboard industry; the company’s ability to successfully implement its operational efficiencies and cost savings strategies, along with related capital projects, and achieve the expected operational or financial results of those projects, including from the continuous digester at the company’s Lewiston, Idaho facility; changes in the U.S. and international economies and in general economic conditions in the regions and industries in which the company operates; manufacturing or operating disruptions, including IT system and IT system implementation failures, equipment malfunctions and damage to the company’s manufacturing facilities; cyber-security risks; changes in costs for and availability of packaging supplies, chemicals, energy, and maintenance and repairs; labor disruptions; cyclical industry conditions; changes in expenses, required contributions, and potential withdrawal costs associated with the company’s pension plans; environmental liabilities or expenditures; reliance on a limited number of third-party suppliers for raw materials; the company’s ability to attract, motivate, train and retain qualified and key personnel; material weaknesses in the company’s internal control over financial reporting; the company’s substantial indebtedness and ability to service its debt obligations; restrictions on the company’s business from debt covenants and terms; negative changes in the company’s credit agency ratings; changes in laws, regulations or industry standards affecting the company’s business; and other risks and uncertainties described from time to time in the company's public filings with the Securities and Exchange Commission, including its Annual Report on Form 10-K for the year ended December 31, 2019. The forward-looking statements are made as of the date of this press release and the company does not undertake to update any forward-looking statements based on new developments or changes in the company's expectations after the date of this press release
| Clearwater Paper Corporation | |||||||||||||||||||||||
| Consolidated Statements of Operations | |||||||||||||||||||||||
| (Unaudited) | |||||||||||||||||||||||
| Three Months Ended June 30, | Six Months Ended June 30, | ||||||||||||||||||||||
| (In millions, except per-share data) | 2020 | 2019 | 2020 | 2019 | |||||||||||||||||||
| Net sales | $ | 480.5 | $ | 452.0 | $ | 958.4 | $ | 880.8 | |||||||||||||||
| Costs and expenses: | |||||||||||||||||||||||
| Cost of sales | 396.7 | 409.8 | 819.7 | 794.1 | |||||||||||||||||||
| Selling, general and administrative expenses | 32.6 | 26.5 | 60.1 | 56.9 | |||||||||||||||||||
| Other operating charges, net | 3.0 | 0.4 | 11.5 | 0.1 | |||||||||||||||||||
| Total operating costs and expenses | 432.4 | 436.7 | 891.4 | 851.1 | |||||||||||||||||||
| Income from operations | 48.1 | 15.3 | 67.0 | 29.7 | |||||||||||||||||||
| Interest expense, net | (12.0) | (10.9) | (24.9) | (19.4) | |||||||||||||||||||
| Other non-operating expense | (2.0) | (1.5) | (3.8) | (2.8) | |||||||||||||||||||
| Debt retirement costs | (1.0) | — | (1.0) | — | |||||||||||||||||||
| Total non-operating expense | (14.9) | (12.4) | (29.6) | (22.2) | |||||||||||||||||||
| Income before income taxes | 33.2 | 2.9 | 37.3 | 7.5 | |||||||||||||||||||
| Income tax provision | 10.4 | 3.3 | 4.2 | 4.0 | |||||||||||||||||||
| Net income (loss) | $ | 22.8 | $ | (0.4) | $ | 33.1 | $ | 3.4 | |||||||||||||||
| Net income (loss) per common share: | |||||||||||||||||||||||
| Basic | $ | 1.37 | $ | (0.03) | $ | 2.00 | $ | 0.21 | |||||||||||||||
| Diluted | 1.36 | (0.03) | 1.99 | 0.21 | |||||||||||||||||||
| Average shares outstanding (in thousands): | |||||||||||||||||||||||
| Basic | 16,594 | 16,539 | 16,575 | 16,528 | |||||||||||||||||||
| Diluted | 16,686 | 16,539 | 16,644 | 16,552 | |||||||||||||||||||
| Clearwater Paper Corporation | |||||||||||
| Condensed Consolidated Balance Sheets | |||||||||||
| (Unaudited) | |||||||||||
| (In millions, except share data) | June 30, 2020 | December 31, 2019 | |||||||||
| ASSETS | |||||||||||
| Current assets: | |||||||||||
| Cash and cash equivalents | $ | 48.2 | $ | 20.0 | |||||||
| Restricted cash | — | 1.4 | |||||||||
| Receivables, net | 191.9 | 159.4 | |||||||||
| Inventories | 235.3 | 281.4 | |||||||||
| Other current assets | 9.0 | 3.6 | |||||||||
| Total current assets | 484.4 | 465.8 | |||||||||
| Property, plant and equipment, net | 1,219.7 | 1,257.7 | |||||||||
| Operating lease right-of-use assets | 68.2 | 73.1 | |||||||||
| Goodwill and intangibles, net | 50.4 | 52.0 | |||||||||
| Other assets, net | 18.7 | 29.1 | |||||||||
| TOTAL ASSETS | $ | 1,841.5 | $ | 1,877.7 | |||||||
| LIABILITIES AND STOCKHOLDERS' EQUITY | |||||||||||
| Current liabilities: | |||||||||||
| Short-term debt | $ | 1.6 | $ | 17.9 | |||||||
| Trade payables | 137.5 | 158.2 | |||||||||
| Accrued compensation | 47.3 | 45.0 | |||||||||
| Other accrued liabilities | 61.1 | 59.3 | |||||||||
| Total current liabilities | 247.5 | 280.4 | |||||||||
| Long-term debt | 827.9 | 884.5 | |||||||||
| Long-term operating lease liabilities | 60.1 | 65.6 | |||||||||
| Liability for pension and other postretirement employee benefits | 74.4 | 76.6 | |||||||||
| Other long-term obligations | 21.6 | 17.3 | |||||||||
| Deferred tax liabilities | 139.3 | 121.3 | |||||||||
| TOTAL LIABILITIES | 1,370.7 | 1,445.7 | |||||||||
| Common stock | — | — | |||||||||
| Paid in capital | 11.8 | 9.8 | |||||||||
| Retained earnings | 514.8 | 481.7 | |||||||||
| Accumulated other comprehensive loss, net of tax | (55.8) | (59.5) | |||||||||
| TOTAL STOCKHOLDERS' EQUITY | 470.8 | 432.0 | |||||||||
| TOTAL LIABILITIES AND STOCKHOLDERS' EQUITY | $ | 1,841.5 | $ | 1,877.7 | |||||||
| Clearwater Paper Corporation | ||||||||||||||||||||
| Consolidated Statements of Cash Flows | ||||||||||||||||||||
| (Unaudited) | ||||||||||||||||||||
| Three Months Ended June 30, | Six Months Ended June 30, | |||||||||||||||||||
| (In millions) | 2020 | 2019 | 2020 | 2019 | ||||||||||||||||
| CASH FLOWS FROM OPERATING ACTIVITIES | ||||||||||||||||||||
| Net income (loss) | $ | 22.8 | $ | (0.4) | $ | 33.1 | $ | 3.4 | ||||||||||||
| Adjustments to reconcile net income (loss) to net cash flows provided by operating activities: | ||||||||||||||||||||
| Depreciation and amortization | 27.8 | 28.5 | 55.8 | 54.3 | ||||||||||||||||
| Equity-based compensation expense | 3.4 | 1.2 | 4.8 | 2.1 | ||||||||||||||||
| Deferred taxes | 8.9 | 4.3 | 10.7 | 5.2 | ||||||||||||||||
| Pension and other post employment benefit plans | 1.2 | 0.3 | 2.0 | 0.3 | ||||||||||||||||
| Debt retirement costs | 1.0 | — | 1.0 | — | ||||||||||||||||
| Gain on divested assets | — | — | (1.4) | — | ||||||||||||||||
| Changes in operating assets and liabilities: | ||||||||||||||||||||
| (Increase) decrease in accounts receivable | 18.8 | (2.7) | (18.5) | (25.8) | ||||||||||||||||
| (Increase) decrease in inventory | 5.1 | (3.4) | 46.1 | (25.0) | ||||||||||||||||
| (Increase) decrease in other current assets | 3.6 | 3.1 | (5.4) | (5.7) | ||||||||||||||||
| Increase (decrease) in trade payables | (11.6) | 3.5 | (24.6) | (7.3) | ||||||||||||||||
| Increase (decrease) in accrued compensation | 16.5 | 7.7 | 5.6 | (4.2) | ||||||||||||||||
| Increase in other accrued liabilities | 10.4 | 2.8 | 10.3 | 16.3 | ||||||||||||||||
| Other, net | 1.2 | (0.8) | 1.6 | 1.2 | ||||||||||||||||
| Net cash flows provided by operating activities | 109.0 | 44.1 | 121.1 | 14.7 | ||||||||||||||||
| CASH FLOWS FROM INVESTING ACTIVITIES | ||||||||||||||||||||
| Additions to property, plant and equipment | (7.3) | (36.8) | (17.8) | (108.4) | ||||||||||||||||
| Net cash flows used in investing activities | (7.3) | (36.8) | (17.8) | (108.4) | ||||||||||||||||
| CASH FLOWS FROM FINANCING ACTIVITIES | ||||||||||||||||||||
| Borrowings of short-term debt | 20.0 | 146.6 | 108.5 | 436.9 | ||||||||||||||||
| Repayments of borrowings on short-term debt | (73.9) | (123.8) | (122.7) | (322.8) | ||||||||||||||||
| Repayments of long-term debt | (60.4) | — | (61.5) | — | ||||||||||||||||
| Other, net | — | (0.4) | (0.9) | (1.1) | ||||||||||||||||
| Net cash flows provided by (used in) financing activities | (114.3) | 22.4 | (76.5) | 113.0 | ||||||||||||||||
| Increase (decrease) in cash, cash equivalents and restricted cash | (12.6) | 29.7 | 26.7 | 19.3 | ||||||||||||||||
| Cash, cash equivalents and restricted cash at beginning of period | 61.8 | 14.6 | 22.4 | 24.9 | ||||||||||||||||
| Cash, cash equivalents and restricted cash at end of period | $ | 49.2 | $ | 44.3 | $ | 49.2 | $ | 44.3 | ||||||||||||
| Clearwater Paper Corporation | |||||||||||||||||||||||
| Segment Information | |||||||||||||||||||||||
| (Unaudited) | |||||||||||||||||||||||
| Three Months Ended June 30, | Six Months Ended June 30, | ||||||||||||||||||||||
| (In millions) | 2020 | 2019 | 2020 | 2019 | |||||||||||||||||||
| Segment net sales: | |||||||||||||||||||||||
| Consumer Products | $ | 275.1 | $ | 224.3 | $ | 540.8 | $ | 447.7 | |||||||||||||||
| Paperboard | 205.4 | 227.7 | 417.6 | 433.1 | |||||||||||||||||||
| Total segment net sales | $ | 480.5 | $ | 452.0 | $ | 958.4 | $ | 880.8 | |||||||||||||||
| Operating income: | |||||||||||||||||||||||
| Consumer Products | $ | 36.6 | $ | (5.1) | $ | 50.9 | $ | (3.9) | |||||||||||||||
| Paperboard | 32.2 | 33.6 | 58.7 | 63.0 | |||||||||||||||||||
| Corporate | (17.6) | (12.7) | (31.1) | (29.3) | |||||||||||||||||||
| Other operating charges, net | (3.0) | (0.4) | $ | (11.5) | (0.1) | ||||||||||||||||||
| Income from operations | $ | 48.1 | $ | 15.3 | $ | 67.0 | $ | 29.7 | |||||||||||||||
| Clearwater Paper Corporation | ||||||||||||||||||||||||||
| Reconciliation of Non-GAAP Financial Measures | ||||||||||||||||||||||||||
| Adjusted EBITDA | ||||||||||||||||||||||||||
| (Unaudited) | ||||||||||||||||||||||||||
| Three Months Ended June 30, | Six Months Ended June 30, | |||||||||||||||||||||||||
| (In millions) | 2020 | 2019 | 2020 | 2019 | ||||||||||||||||||||||
| Net income | $ | 22.8 | $ | (0.4) | $ | 33.1 | $ | 3.4 | ||||||||||||||||||
| Add back: | ||||||||||||||||||||||||||
| Income tax provision (benefit) | 10.4 | 3.3 | 4.2 | 4.0 | ||||||||||||||||||||||
| Interest expense, net | 12.0 | 10.9 | 24.9 | 19.4 | ||||||||||||||||||||||
| Depreciation and amortization expense | 27.8 | 28.5 | 55.8 | 54.3 | ||||||||||||||||||||||
Other operating charges, net1 | 3.0 | 0.4 | 11.5 | 0.1 | ||||||||||||||||||||||
| Other non-operating expense | 2.0 | 1.5 | 3.8 | 2.8 | ||||||||||||||||||||||
| Debt retirement costs | 1.0 | — | 1.0 | — | ||||||||||||||||||||||
| Adjusted EBITDA | $ | 79.0 | $ | 44.3 | $ | 134.3 | $ | 84.1 | ||||||||||||||||||
| Consumer Products income | $ | 36.6 | $ | (5.1) | $ | 50.9 | $ | (3.9) | ||||||||||||||||||
| Depreciation and amortization | 17.1 | 17.4 | 34.4 | 32.1 | ||||||||||||||||||||||
| Consumer Products Adjusted EBITDA | $ | 53.7 | $ | 12.3 | $ | 85.3 | $ | 28.2 | ||||||||||||||||||
| Paperboard income | $ | 32.2 | $ | 33.6 | $ | 58.7 | $ | 63.0 | ||||||||||||||||||
| Depreciation and amortization | 9.2 | 9.5 | 18.5 | 19.0 | ||||||||||||||||||||||
| Paperboard Adjusted EBITDA | $ | 41.4 | $ | 43.1 | $ | 77.2 | $ | 82.0 | ||||||||||||||||||
| Corporate expenses | $ | (17.6) | $ | (12.7) | $ | (31.1) | $ | (29.3) | ||||||||||||||||||
| Depreciation and amortization | 1.5 | 1.6 | 3.0 | 3.2 | ||||||||||||||||||||||
| Corporate Adjusted EBITDA | $ | (16.2) | $ | (11.1) | $ | (28.1) | $ | (26.1) | ||||||||||||||||||
| Consumer Products | $ | 53.7 | $ | 12.3 | $ | 85.3 | $ | 28.2 | ||||||||||||||||||
| Paperboard | 41.4 | 43.1 | 77.2 | 82.0 | ||||||||||||||||||||||
| Corporate | (16.2) | (11.1) | (28.1) | (26.1) | ||||||||||||||||||||||
| Adjusted EBITDA | $ | 79.0 | $ | 44.3 | $ | 134.3 | $ | 84.1 | ||||||||||||||||||
1 Other operating charges, net consist of amounts unrelated to ongoing core operating activities. Please refer to Footnote 9 within Clearwater Paper's Form 10-Q filed with the SEC for the period end June 30, 2020 for the detailed breakout of this amount.
| Clearwater Paper Corporation | ||||||||||||||||||||
| Reconciliation of Non-GAAP Financial Measures | ||||||||||||||||||||
| Adjusted Net Income | ||||||||||||||||||||
| (Unaudited) | ||||||||||||||||||||
| Three Months Ended June 30, | Six Months Ended June 30, | |||||||||||||||||||
| (In millions, except per-share data) | 2020 | 2019 | 2020 | 2019 | ||||||||||||||||
| Net income | $ | 22.8 | $ | (0.4) | $ | 33.1 | $ | 3.4 | ||||||||||||
| Add back: | ||||||||||||||||||||
| Income tax provision | 10.4 | 3.3 | 4.2 | 4.0 | ||||||||||||||||
| Income before income taxes | 33.2 | 2.9 | 37.3 | 7.4 | ||||||||||||||||
| Add back: | ||||||||||||||||||||
| Debt retirement costs | 1.0 | — | 1.0 | — | ||||||||||||||||
| Other operating charges, net | 3.0 | 0.4 | 11.5 | 0.1 | ||||||||||||||||
| Adjusted net income before tax | $ | 37.2 | $ | 3.3 | $ | 49.8 | $ | 7.5 | ||||||||||||
| Normalized income tax provision | 9.3 | 0.8 | 12.5 | 1.9 | ||||||||||||||||
| Adjusted net income | $ | 27.9 | $ | 2.5 | $ | 37.4 | $ | 5.6 | ||||||||||||
| Weighted average diluted shares | 16,686 | 16,539 | 16,644 | 16,552 | ||||||||||||||||
| Adjusted net income per diluted share | $ | 1.67 | $ | 0.15 | $ | 2.24 | $ | 0.34 | ||||||||||||
Clearwater Paper Corporation
Investors contact:
Sloan Bohlen
Solebury Trout
509.344.5906
News media:
Shannon Myers
509.344.5967
Clearwater Paper Corporation SECOND QUARTER 2020 EARNINGS RELEASE MATERIALS AUGUST 4, 2020 ARSEN S. KITCH PRESIDENT, CHIEF EXECUTIVE OFFICER AND DIRECTOR MICHAEL J. MURPHY SENIOR VICE PRESIDENT AND CHIEF FINANCIAL OFFICER
Forward-Looking Statements Cautionary Statement Regarding Forward Looking Statements This presentation of supplemental information contains, in addition to historical information, certain forward-looking statements within the meaning of the Private Securities Litigation Reform Act of 1995, including statements regarding our response to COVID-19 and the impact of COVID-19 on consumer behavior, our business and operations; industry trends in response to COVID-19; improvements to our cost structure; Q3 2020 outlook for Adjusted EBITDA; our assumptions for full year 2020 expenses including interest, capital, depreciation and amortization and income tax; the operational and financial benefits from the Shelby expansion; our capital structure and liquidity; our near-term capital allocation objectives; our scheduled debt maturity; and near-term strategic positioning and market assessment. These forward-looking statements are based on management’s current expectations, estimates, assumptions and projections that are subject to change. Our actual results of operations may differ materially from those expressed or implied by the forward-looking statements contained in this presentation. Important factors that could cause or contribute to such differences include the risks and uncertainties described from time to time in the company's public filings with the Securities and Exchange Commission, including but not limited to the following: impact of COVID-19 on our operations and our supplier’s operations and on customer demand; competitive pricing pressures for our products, including as a result of increased capacity as additional manufacturing facilities are operated by our competitors and the impact of foreign currency fluctuations on the pricing of products globally; the loss of, changes in prices in regard to, or reduction in, orders from a significant customer; changes in the cost and availability of wood fiber and wood pulp; changes in transportation costs and disruptions in transportation services; changes in customer product preferences and competitors' product offerings; larger competitors having operational and other advantages; customer acceptance and timing and quantity of purchases of our tissue products, including the existence of sufficient demand for and the quality of tissue produced by our expanded Shelby, North Carolina operations; consolidation and vertical integration of converting operations in the paperboard industry; our ability to successfully implement our operational efficiencies and cost savings strategies, along with related capital projects, and achieve the expected operational or financial results of those projects, including from the continuous digester at our Lewiston, Idaho facility; changes in the U.S. and international economies and in general economic conditions in the regions and industries in which we operate; manufacturing or operating disruptions, including IT system and IT system implementation failures, equipment malfunctions and damage to our manufacturing facilities; cyber-security risks; changes in costs for and availability of packaging supplies, chemicals, energy and maintenance and repairs; labor disruptions; cyclical industry conditions; changes in expenses, required contributions and potential withdrawal costs associated with our pension plans; environmental liabilities or expenditures; reliance on a limited number of third-party suppliers for raw materials; our ability to attract, motivate, train and retain qualified and key personnel; our substantial indebtedness and ability to service our debt obligations; restrictions on our business from debt covenants and terms; negative changes in our credit agency ratings; and changes in laws, regulations or industry standards affecting our business. Forward-looking statements contained in this presentation present management’s views only as of the date of this presentation. We undertake no obligation to publicly update forward-looking statements, to retract future revisions of management's views based on events or circumstances occurring after the date of this presentation. Non-GAAP Financial Measures This presentation include certain financial measures that are not calculated in accordance with GAAP, including Adjusted EBITDA, Adjusted Income, Net debt and Free Cash Flow. The Company’s management believes that the presentation of these financial measures provides useful information to investors because these measures are regularly used by management in assessing the Company’s performance. These financial measures should be considered in addition to results prepared in accordance with GAAP but should not be considered substitutes for or superior to GAAP results. In addition, these non-GAAP financial measures may not be comparable to similarly-titled measures utilized by other companies, since such other companies may not calculate such measure in the same manner as we do. A reconciliation of these measures (Adjusted EBITDA, Adjusted Income, Net debt and Free Cash flow) to the most relevant GAAP measure is available in the appendix of this presentation with the exception of forward looking non-GAAP measures contained in our Outlook, which the company cannot reconcile to forward-looking GAAP results without unreasonable effort. Page 2 © Clearwater Paper Corporation 2020
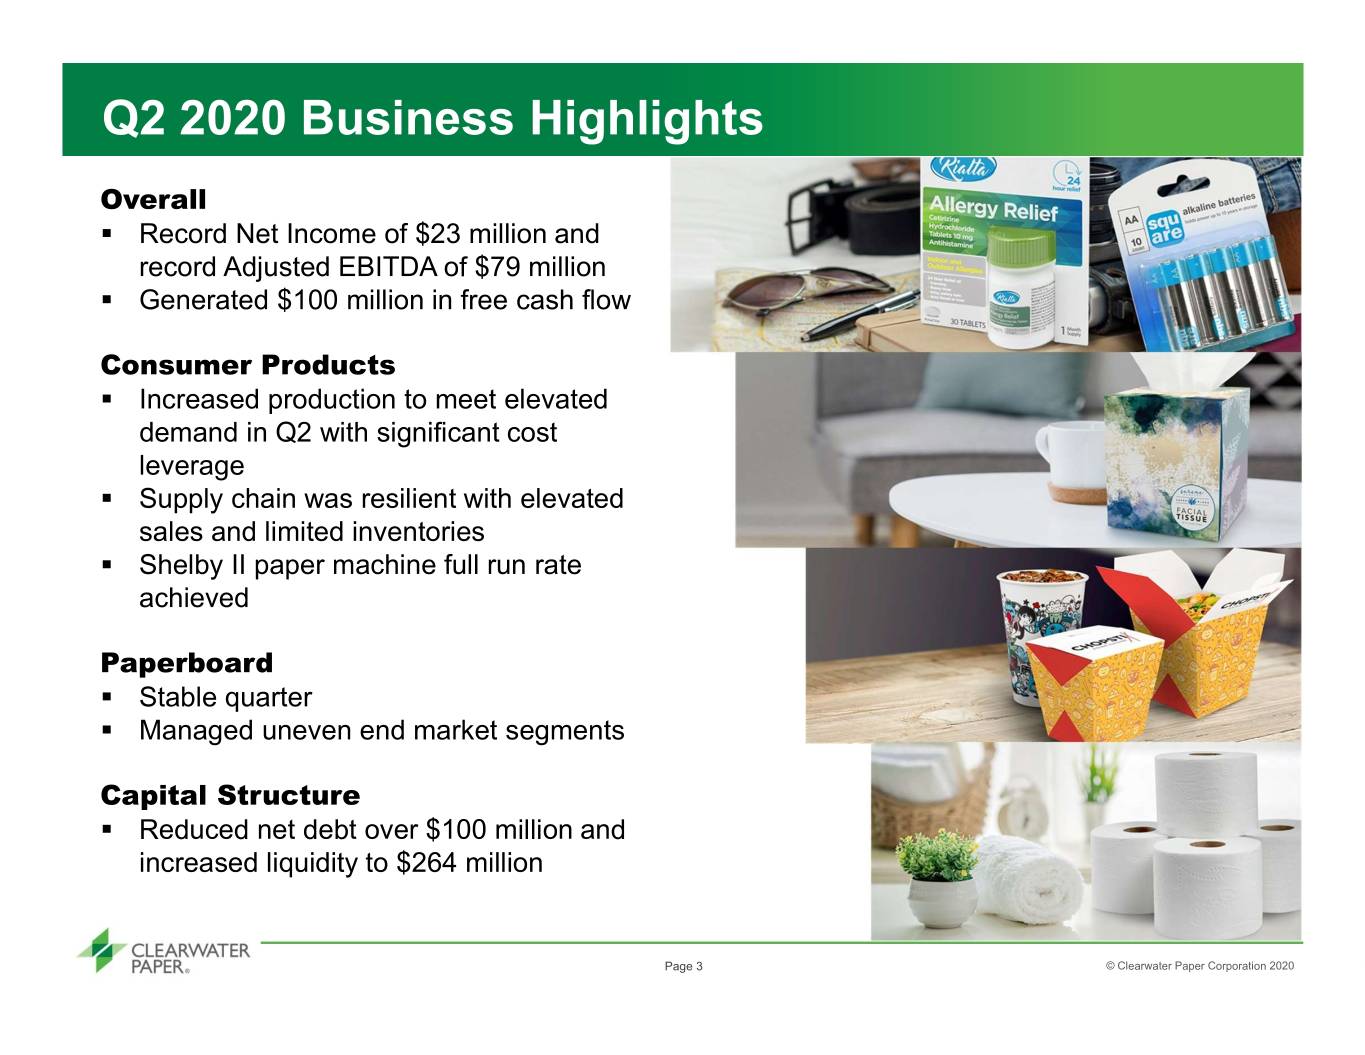
Q2 2020 Business Highlights Overall . Record Net Income of $23 million and record Adjusted EBITDA of $79 million . Generated $100 million in free cash flow Consumer Products . Increased production to meet elevated demand in Q2 with significant cost leverage . Supply chain was resilient with elevated sales and limited inventories . Shelby II paper machine full run rate achieved Paperboard . Stable quarter . Managed uneven end market segments Capital Structure . Reduced net debt over $100 million and increased liquidity to $264 million Page 3 © Clearwater Paper Corporation 2020
Q2 2020 Operational Update Committed to protecting our two most important assets: our employees and our customer relationships Taking care of our employees: . Temperature checks and sanitation practices . Social distancing and face covering requirements . Remote work access and travel restrictions . Enhanced benefits Focusing on business continuity and customer service: . Avoided material disruption in Q2 2020 production and supply chain . Creative solutions to optimize shipments were highly successful . Clearwater Paper’s reputation for reliability grew in Q2 2020 Page 4 © Clearwater Paper Corporation 2020
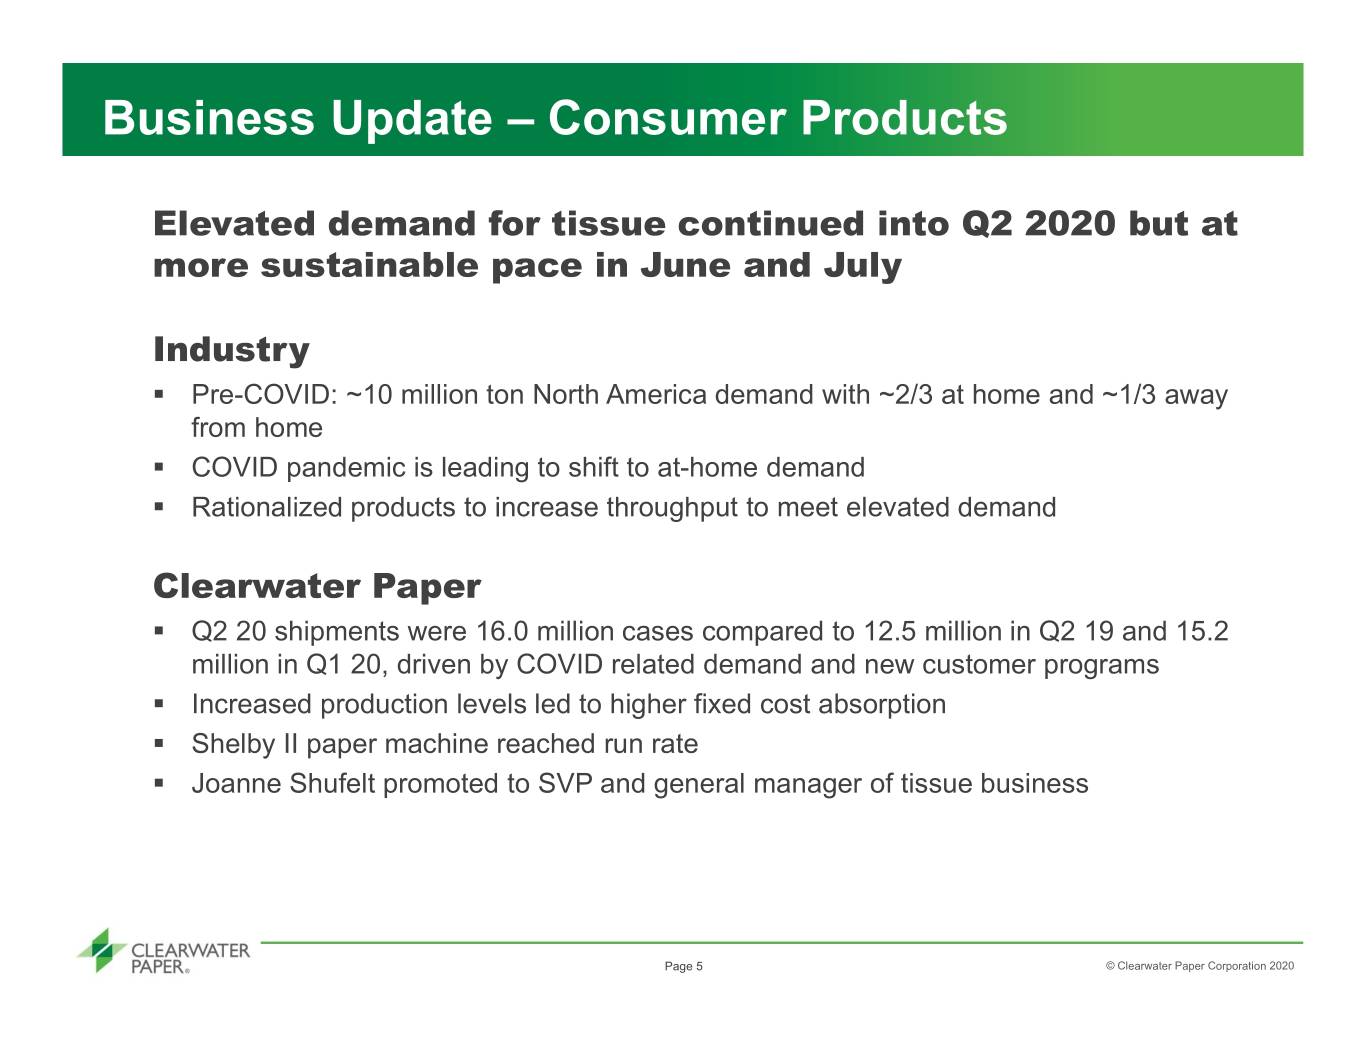
Business Update – Consumer Products Elevated demand for tissue continued into Q2 2020 but at more sustainable pace in June and July Industry . Pre-COVID: ~10 million ton North America demand with ~2/3 at home and ~1/3 away from home . COVID pandemic is leading to shift to at-home demand . Rationalized products to increase throughput to meet elevated demand Clearwater Paper . Q2 20 shipments were 16.0 million cases compared to 12.5 million in Q2 19 and 15.2 million in Q1 20, driven by COVID related demand and new customer programs . Increased production levels led to higher fixed cost absorption . Shelby II paper machine reached run rate . Joanne Shufelt promoted to SVP and general manager of tissue business Page 5 © Clearwater Paper Corporation 2020
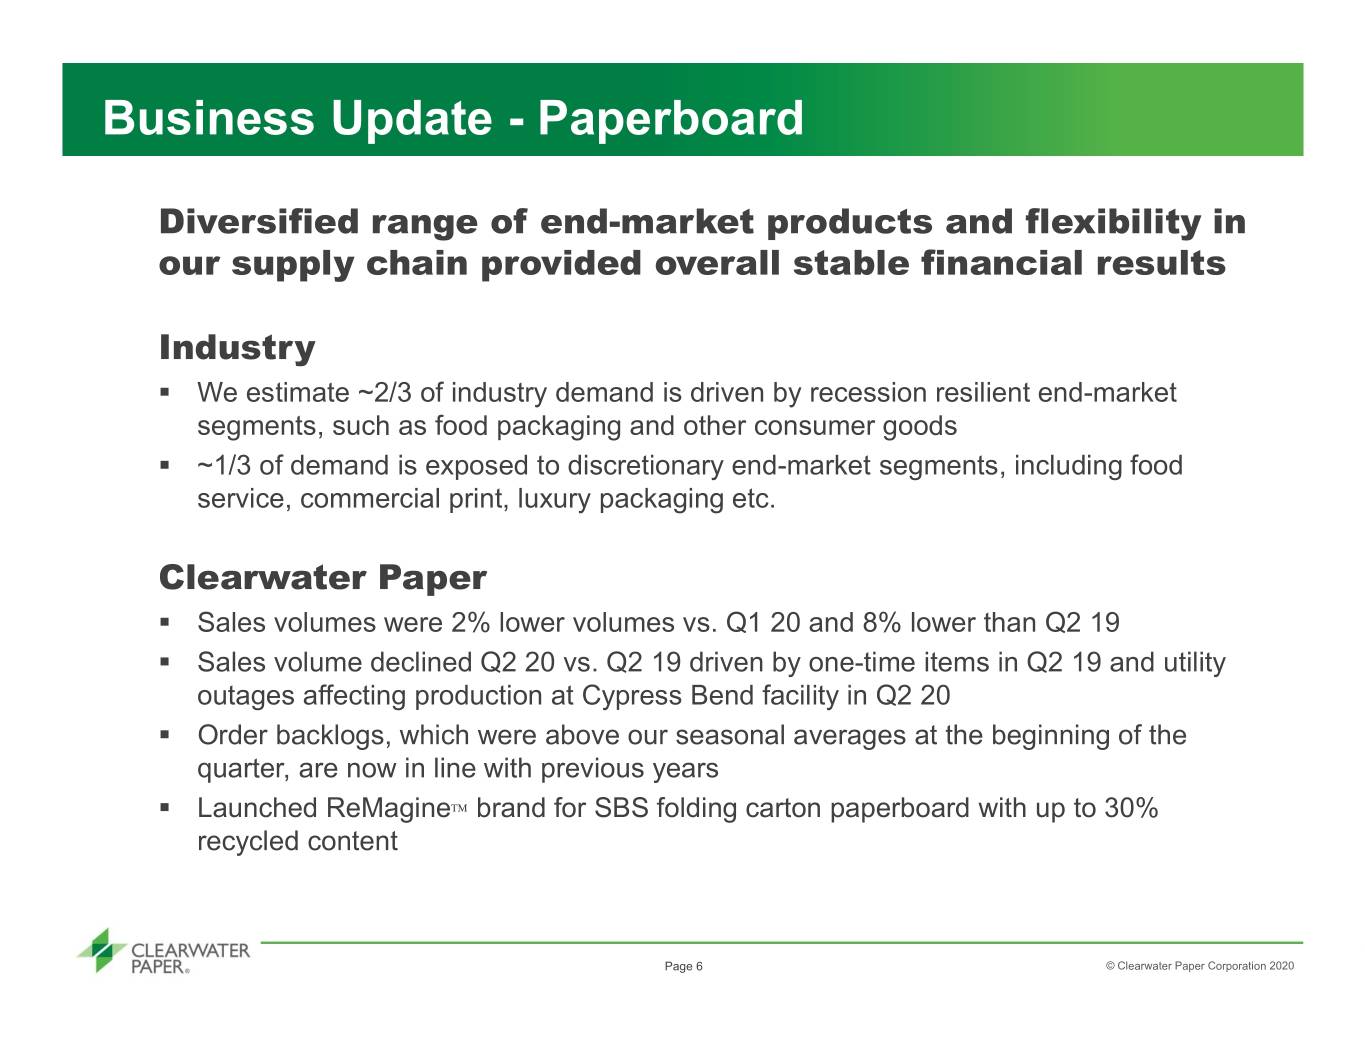
Business Update - Paperboard Diversified range of end-market products and flexibility in our supply chain provided overall stable financial results Industry . We estimate ~2/3 of industry demand is driven by recession resilient end-market segments, such as food packaging and other consumer goods . ~1/3 of demand is exposed to discretionary end-market segments, including food service, commercial print, luxury packaging etc. Clearwater Paper . Sales volumes were 2% lower volumes vs. Q1 20 and 8% lower than Q2 19 . Sales volume declined Q2 20 vs. Q2 19 driven by one-time items in Q2 19 and utility outages affecting production at Cypress Bend facility in Q2 20 . Order backlogs, which were above our seasonal averages at the beginning of the quarter, are now in line with previous years . Launched ReMagine brand for SBS folding carton paperboard with up to 30% recycled content Page 6 © Clearwater Paper Corporation 2020
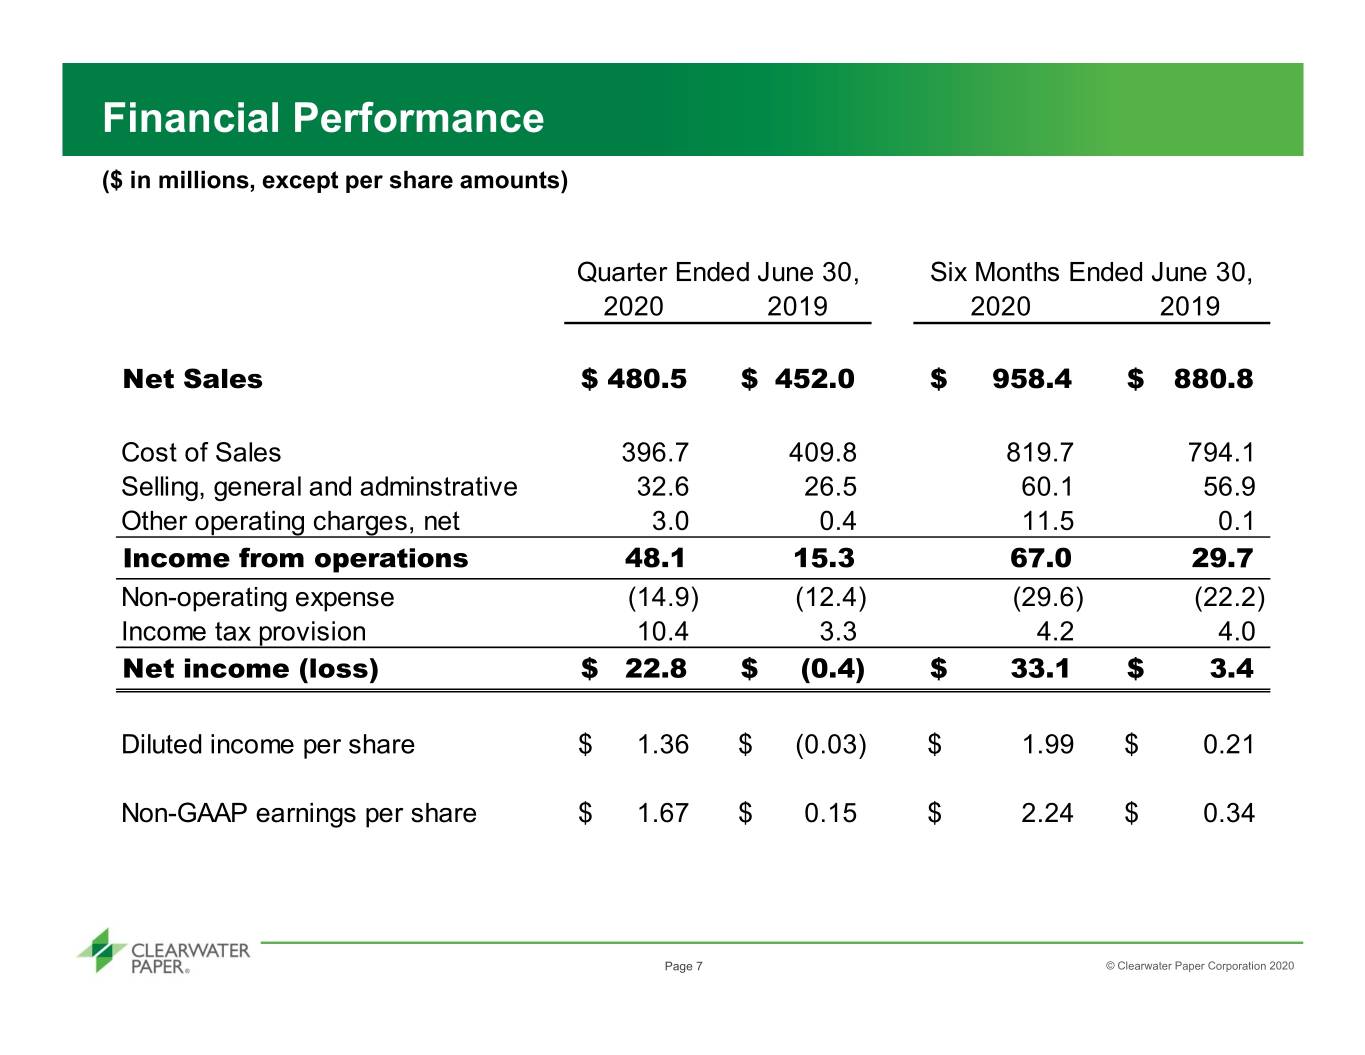
Financial Performance ($ in millions, except per share amounts) Quarter Ended June 30, Six Months Ended June 30, 2020 2019 2020 2019 Net Sales$ 480.5 $ 452.0 $ 958.4 $ 880.8 Cost of Sales 396.7 409.8 819.7 794.1 Selling, general and adminstrative 32.6 26.5 60.1 56.9 Other operating charges, net 3.0 0.4 11.5 0.1 Income from operations 48.1 15.3 67.0 29.7 Non-operating expense (14.9) (12.4) (29.6) (22.2) Income tax provision 10.4 3.3 4.2 4.0 Net income (loss)$ 22.8 $ (0.4) $ 33.1 $ 3.4 Diluted income per share$ 1.36 $ (0.03) $ 1.99 $ 0.21 Non-GAAP earnings per share$ 1.67 $ 0.15 $ 2.24 $ 0.34 Page 7 © Clearwater Paper Corporation 2020
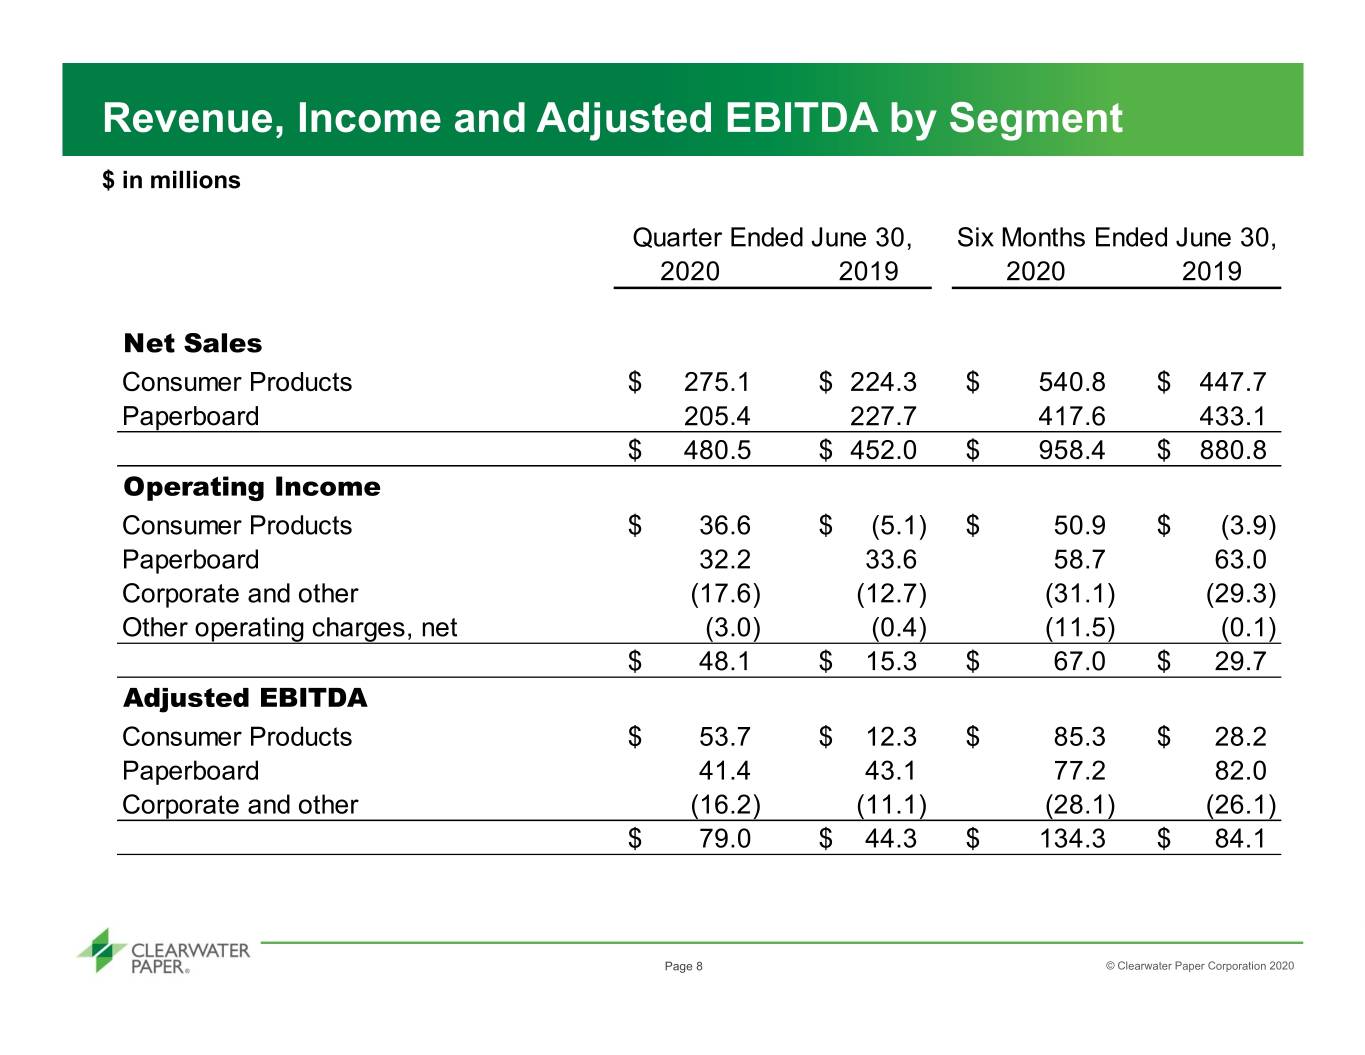
Revenue, Income and Adjusted EBITDA by Segment $ in millions Quarter Ended June 30, Six Months Ended June 30, 2020 2019 2020 2019 Net Sales Consumer Products$ 275.1 $ 224.3 $ 540.8 $ 447.7 Paperboard 205.4 227.7 417.6 433.1 $ 480.5 $ 452.0 $ 958.4 $ 880.8 Operating Income Consumer Products$ 36.6 $ (5.1) $ 50.9 $ (3.9) Paperboard 32.2 33.6 58.7 63.0 Corporate and other (17.6) (12.7) (31.1) (29.3) Other operating charges, net (3.0) (0.4) (11.5) (0.1) $ 48.1 $ 15.3 $ 67.0 $ 29.7 Adjusted EBITDA Consumer Products$ 53.7 $ 12.3 $ 85.3 $ 28.2 Paperboard 41.4 43.1 77.2 82.0 Corporate and other (16.2) (11.1) (28.1) (26.1) $ 79.0 $ 44.3 $ 134.3 $ 84.1 Page 8 © Clearwater Paper Corporation 2020
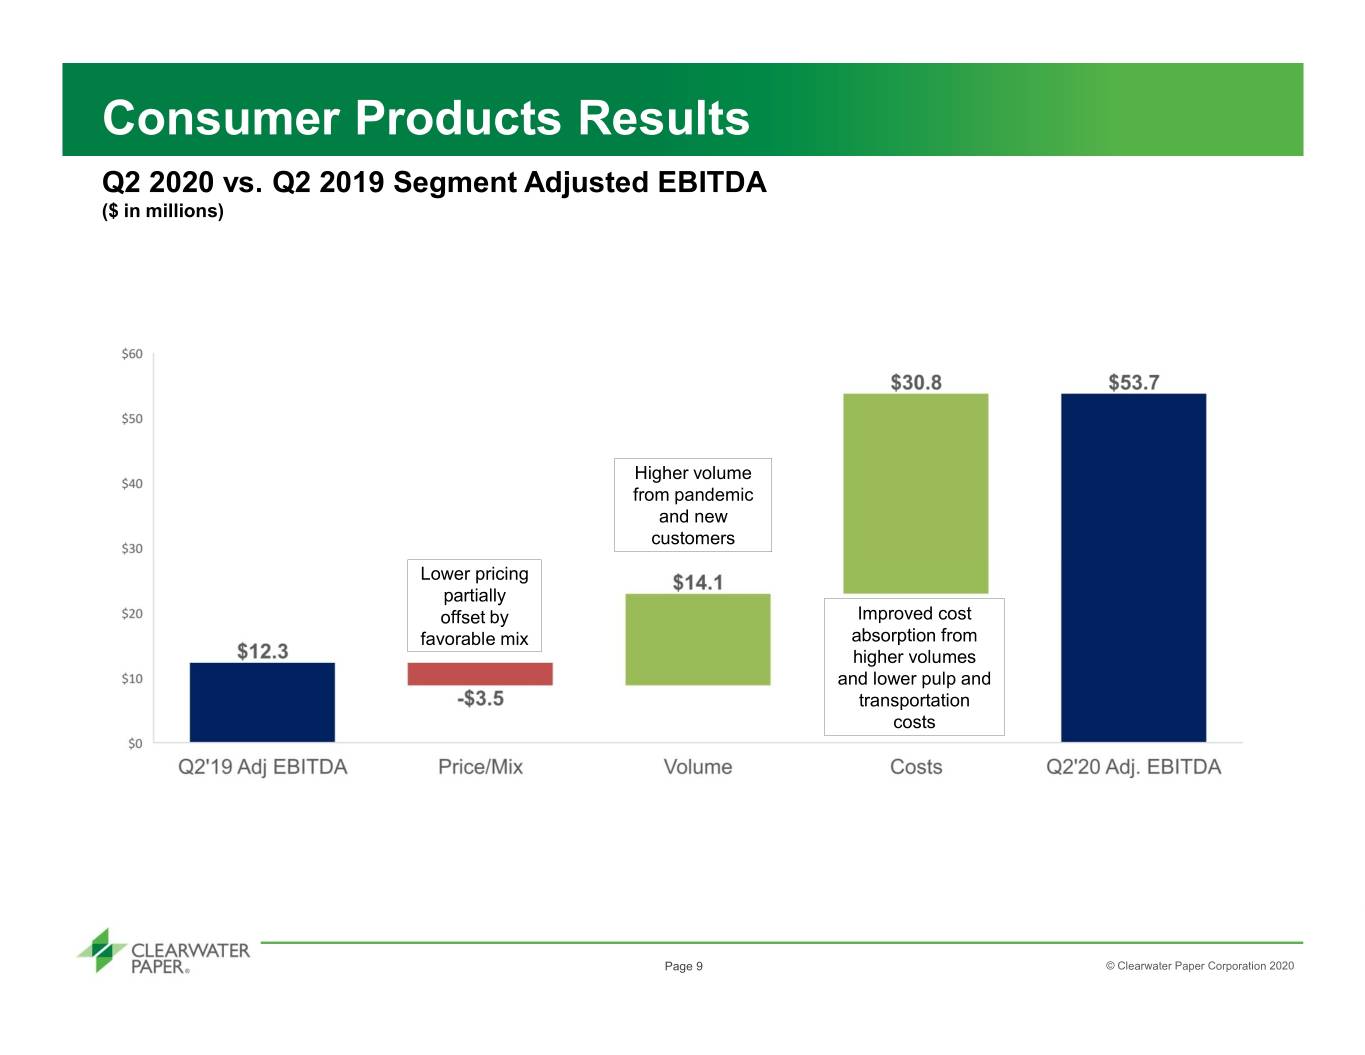
Consumer Products Results Q2 2020 vs. Q2 2019 Segment Adjusted EBITDA ($ in millions) Higher volume from pandemic and new customers Lower pricing partially offset by Improved cost favorable mix absorption from higher volumes and lower pulp and transportation costs Page 9 © Clearwater Paper Corporation 2020
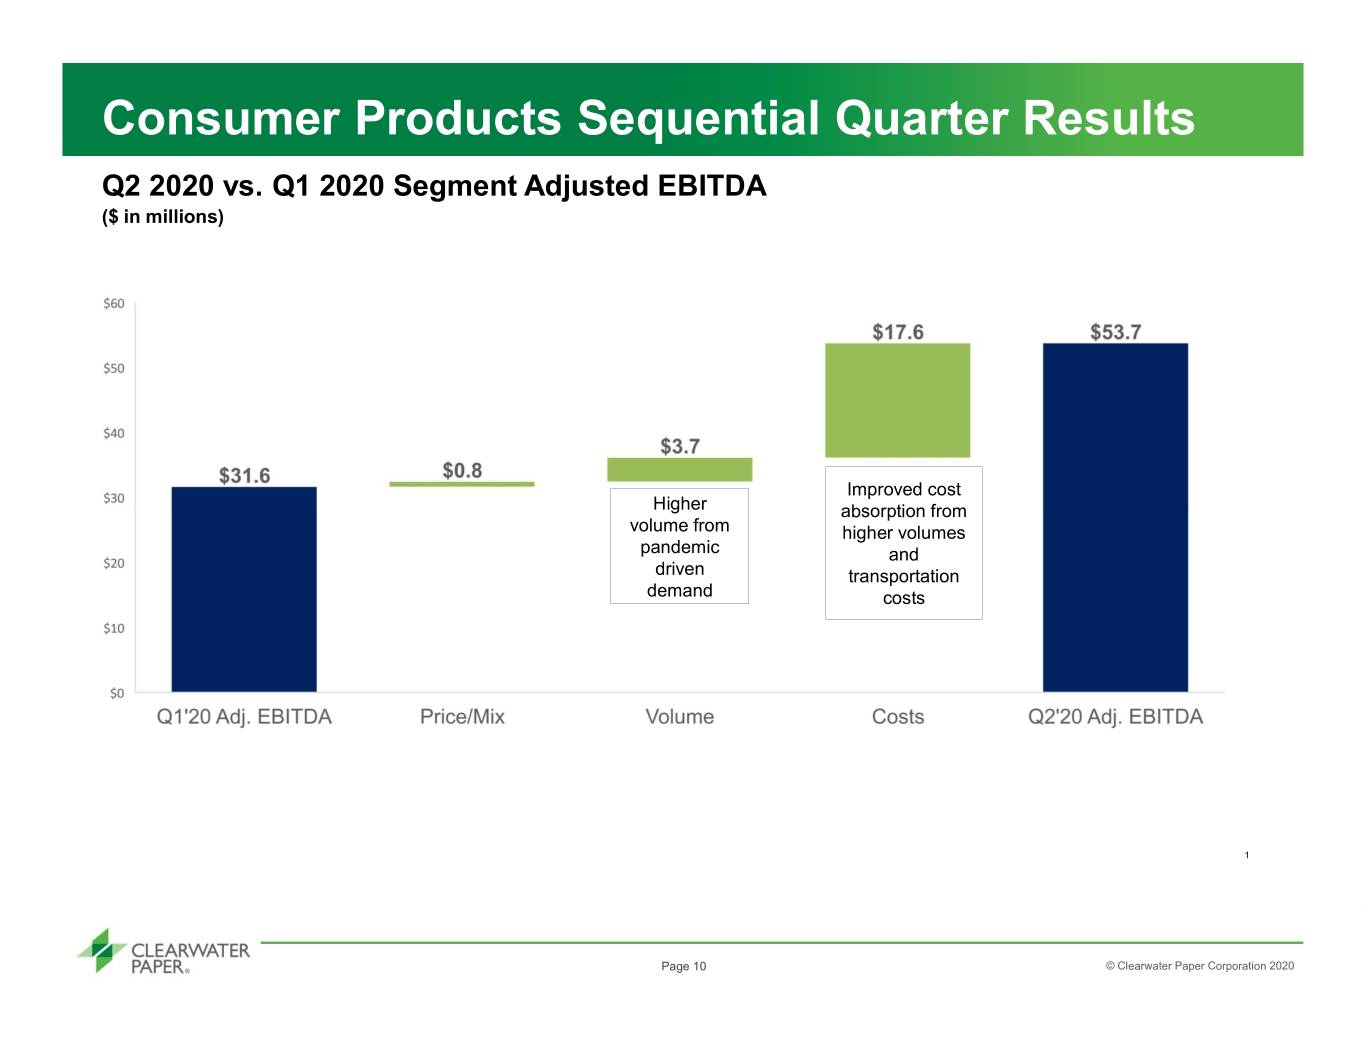
Consumer Products Sequential Quarter Results Q2 2020 vs. Q1 2020 Segment Adjusted EBITDA ($ in millions) Improved cost Higher absorption from volume from higher volumes pandemic and driven transportation demand costs 1 Page 10 © Clearwater Paper Corporation 2020
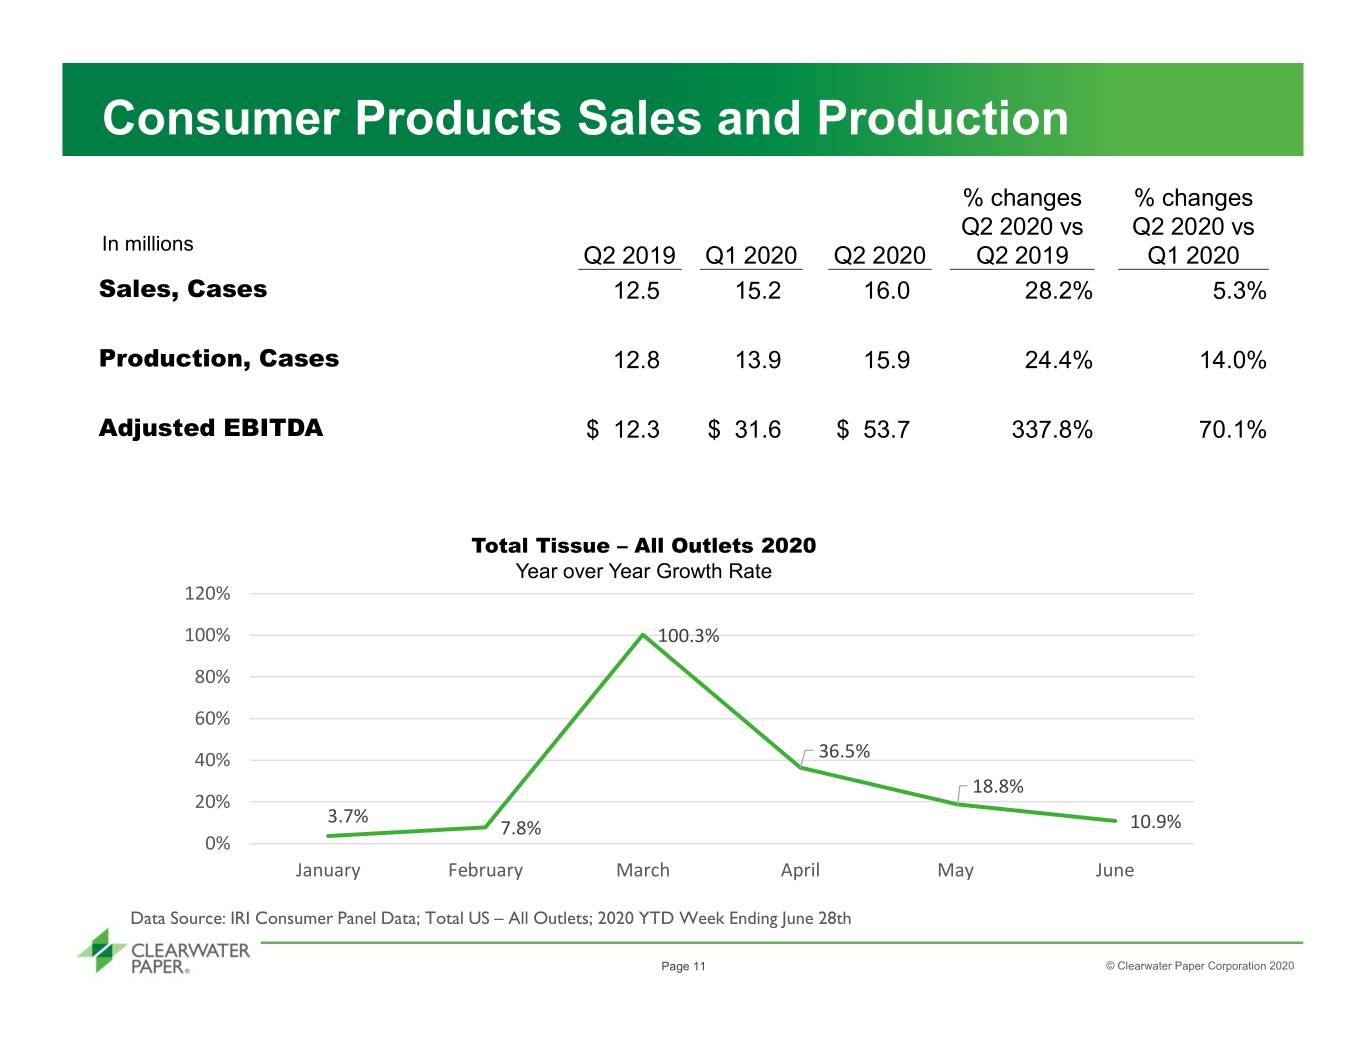
Consumer Products Sales and Production % changes % changes Q2 2020 vs Q2 2020 vs In millions Q2 2019 Q1 2020 Q2 2020 Q2 2019 Q1 2020 Sales, Cases 12.5 15.2 16.0 28.2% 5.3% Production, Cases 12.8 13.9 15.9 24.4% 14.0% Adjusted EBITDA $ 12.3 $ 31.6 $ 53.7 337.8% 70.1% Total Tissue – All Outlets 2020 Year over Year Growth Rate 120% 100% 100.3% 80% 60% 40% 36.5% 18.8% 20% 3.7% 7.8% 10.9% 0% January February March April May June Data Source: IRI Consumer Panel Data; Total US – All Outlets; 2020 YTD Week Ending June 28th Page 11 © Clearwater Paper Corporation 2020
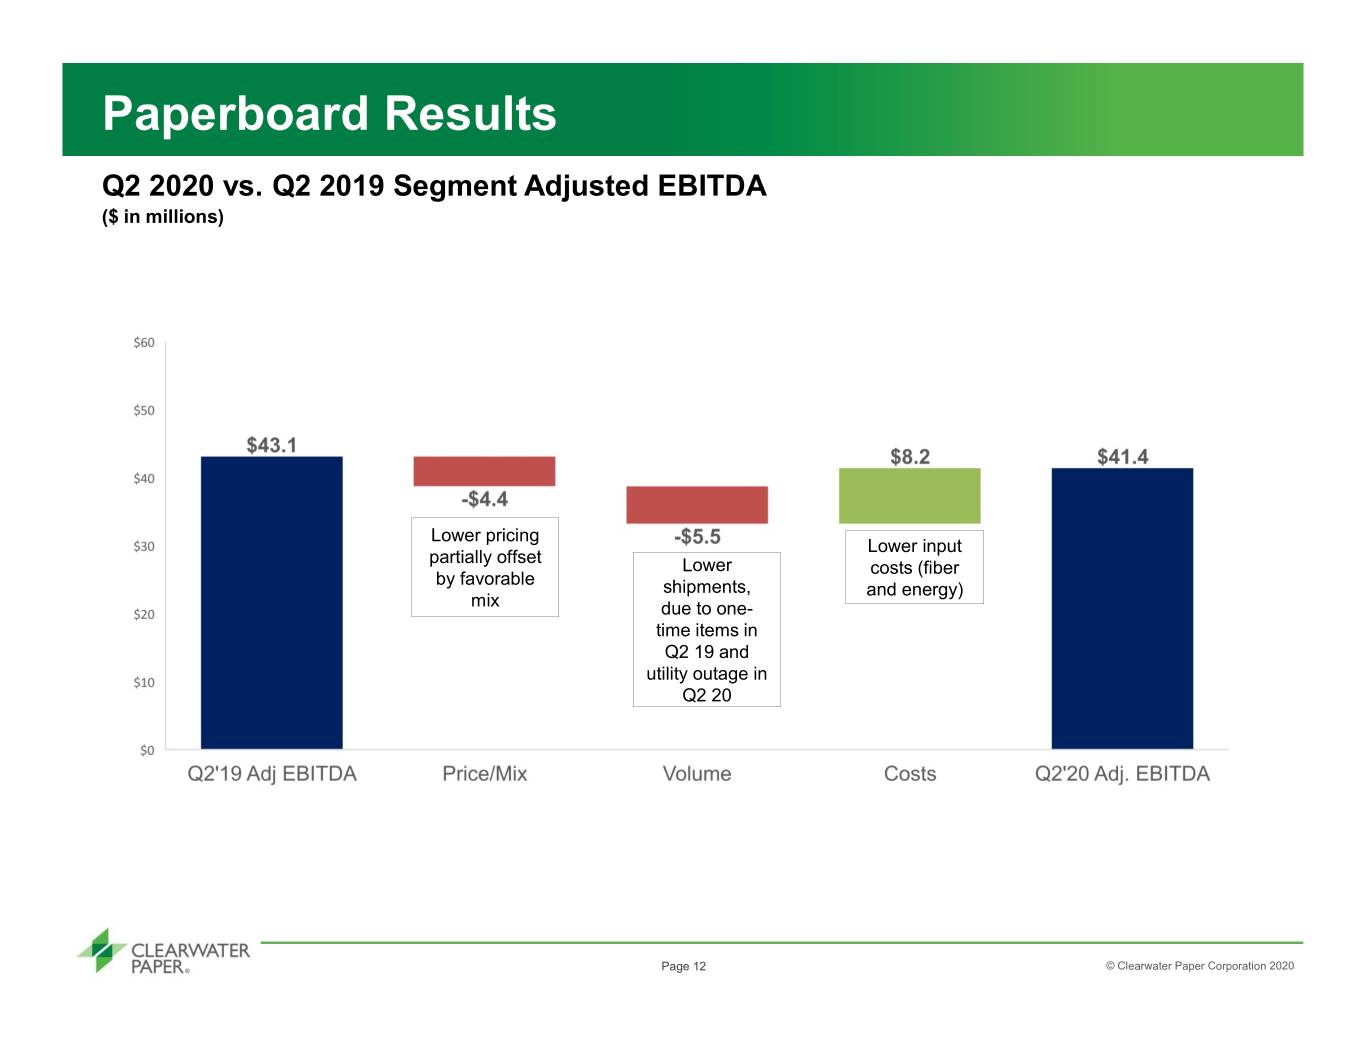
Paperboard Results Q2 2020 vs. Q2 2019 Segment Adjusted EBITDA ($ in millions) Lower pricing Lower input partially offset Lower costs (fiber by favorable shipments, and energy) mix due to one- time items in Q2 19 and utility outage in Q2 20 Page 12 © Clearwater Paper Corporation 2020
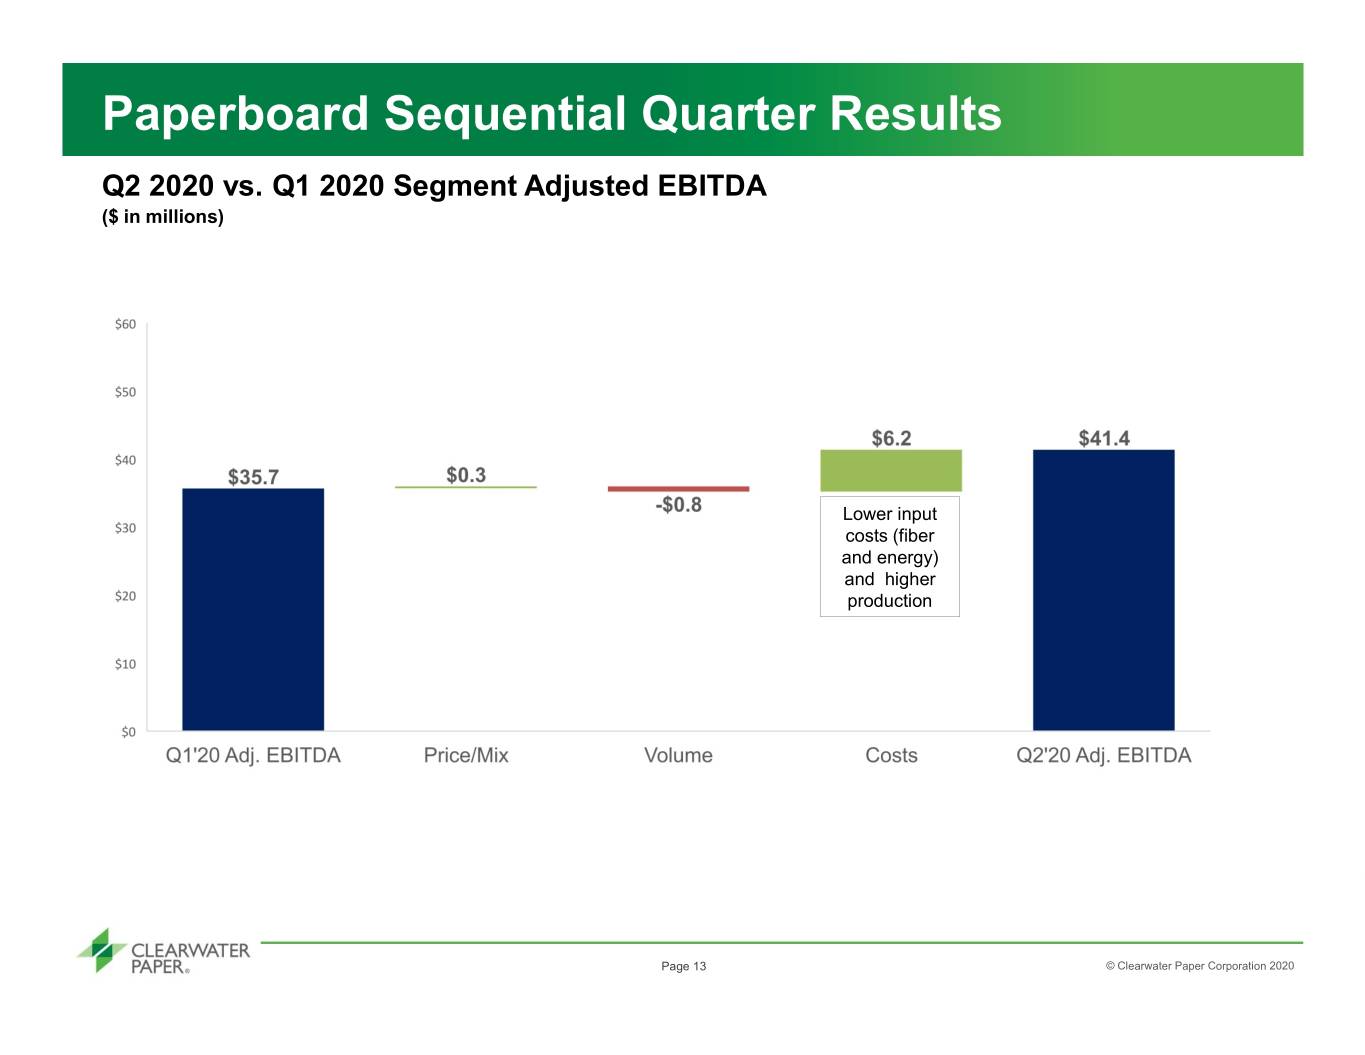
Paperboard Sequential Quarter Results Q2 2020 vs. Q1 2020 Segment Adjusted EBITDA ($ in millions) Lower input costs (fiber and energy) and higher production Page 13 © Clearwater Paper Corporation 2020
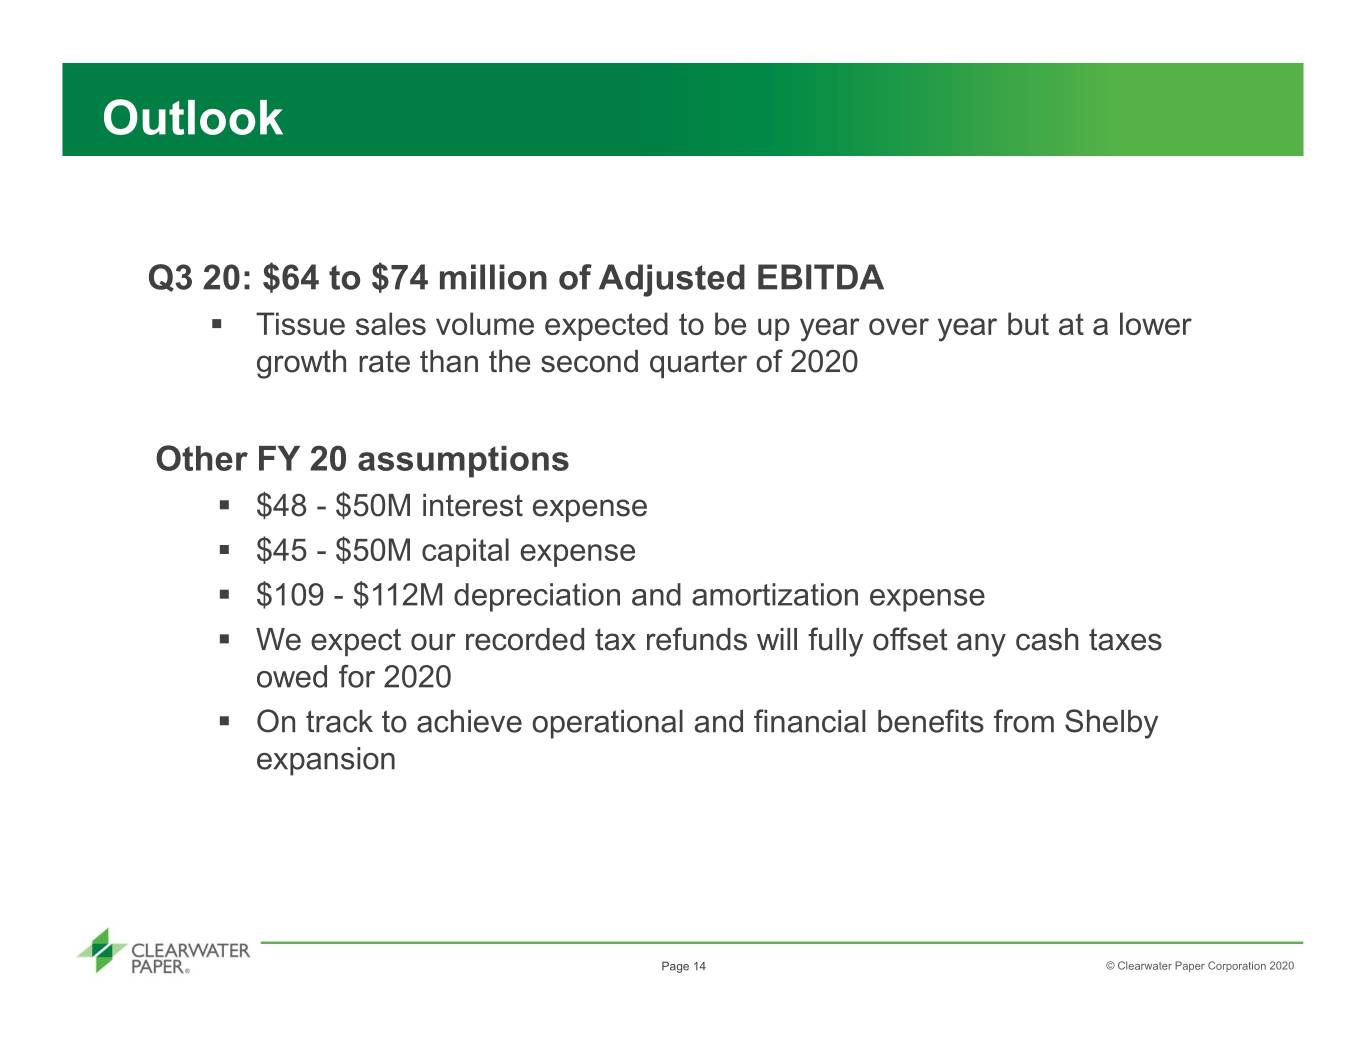
Outlook Q3 20: $64 to $74 million of Adjusted EBITDA . Tissue sales volume expected to be up year over year but at a lower growth rate than the second quarter of 2020 Other FY 20 assumptions . $48 - $50M interest expense . $45 - $50M capital expense . $109 - $112M depreciation and amortization expense . We expect our recorded tax refunds will fully offset any cash taxes owed for 2020 . On track to achieve operational and financial benefits from Shelby expansion Page 14 © Clearwater Paper Corporation 2020
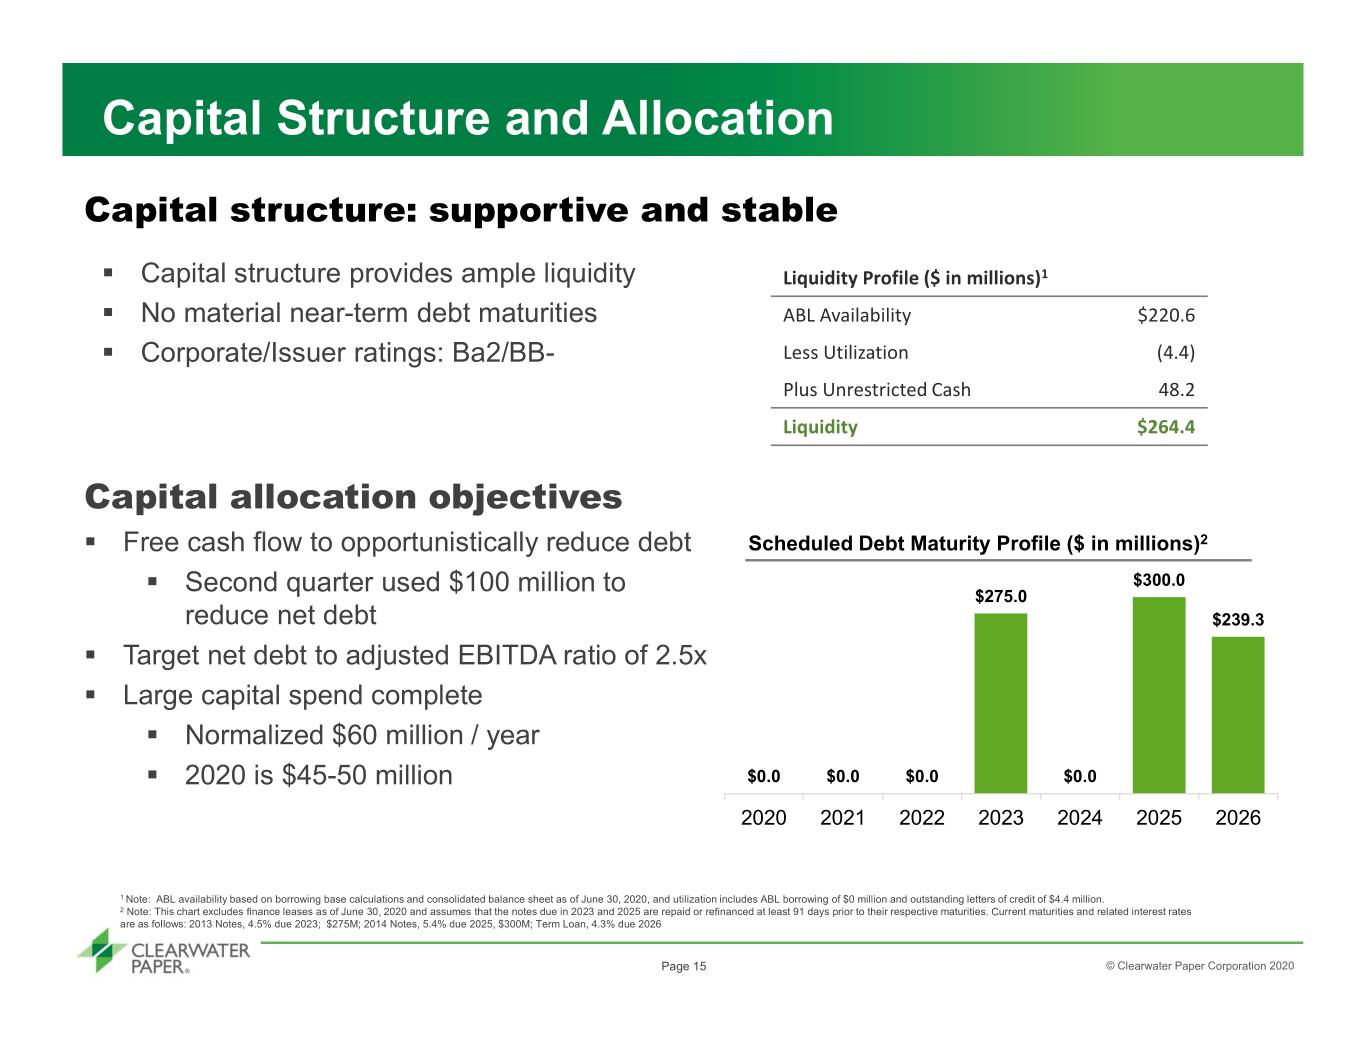
Capital Structure and Allocation Capital structure: supportive and stable . Capital structure provides ample liquidity Liquidity Profile ($ in millions)1 . No material near-term debt maturities ABL Availability $220.6 . Corporate/Issuer ratings: Ba2/BB- Less Utilization (4.4) Plus Unrestricted Cash 48.2 Liquidity $264.4 Capital allocation objectives . Free cash flow to opportunistically reduce debt Scheduled Debt Maturity Profile ($ in millions)2 . Second quarter used $100 million to $300.0 $275.0 reduce net debt $239.3 . Target net debt to adjusted EBITDA ratio of 2.5x . Large capital spend complete . Normalized $60 million / year . 2020 is $45-50 million $0.0 $0.0 $0.0 $0.0 2020 2021 2022 2023 2024 2025 2026 1 Note: ABL availability based on borrowing base calculations and consolidated balance sheet as of June 30, 2020, and utilization includes ABL borrowing of $0 million and outstanding letters of credit of $4.4 million. 2 Note: This chart excludes finance leases as of June 30, 2020 and assumes that the notes due in 2023 and 2025 are repaid or refinanced at least 91 days prior to their respective maturities. Current maturities and related interest rates are as follows: 2013 Notes, 4.5% due 2023; $275M; 2014 Notes, 5.4% due 2025, $300M; Term Loan, 4.3% due 2026 Page 15 © Clearwater Paper Corporation 2020
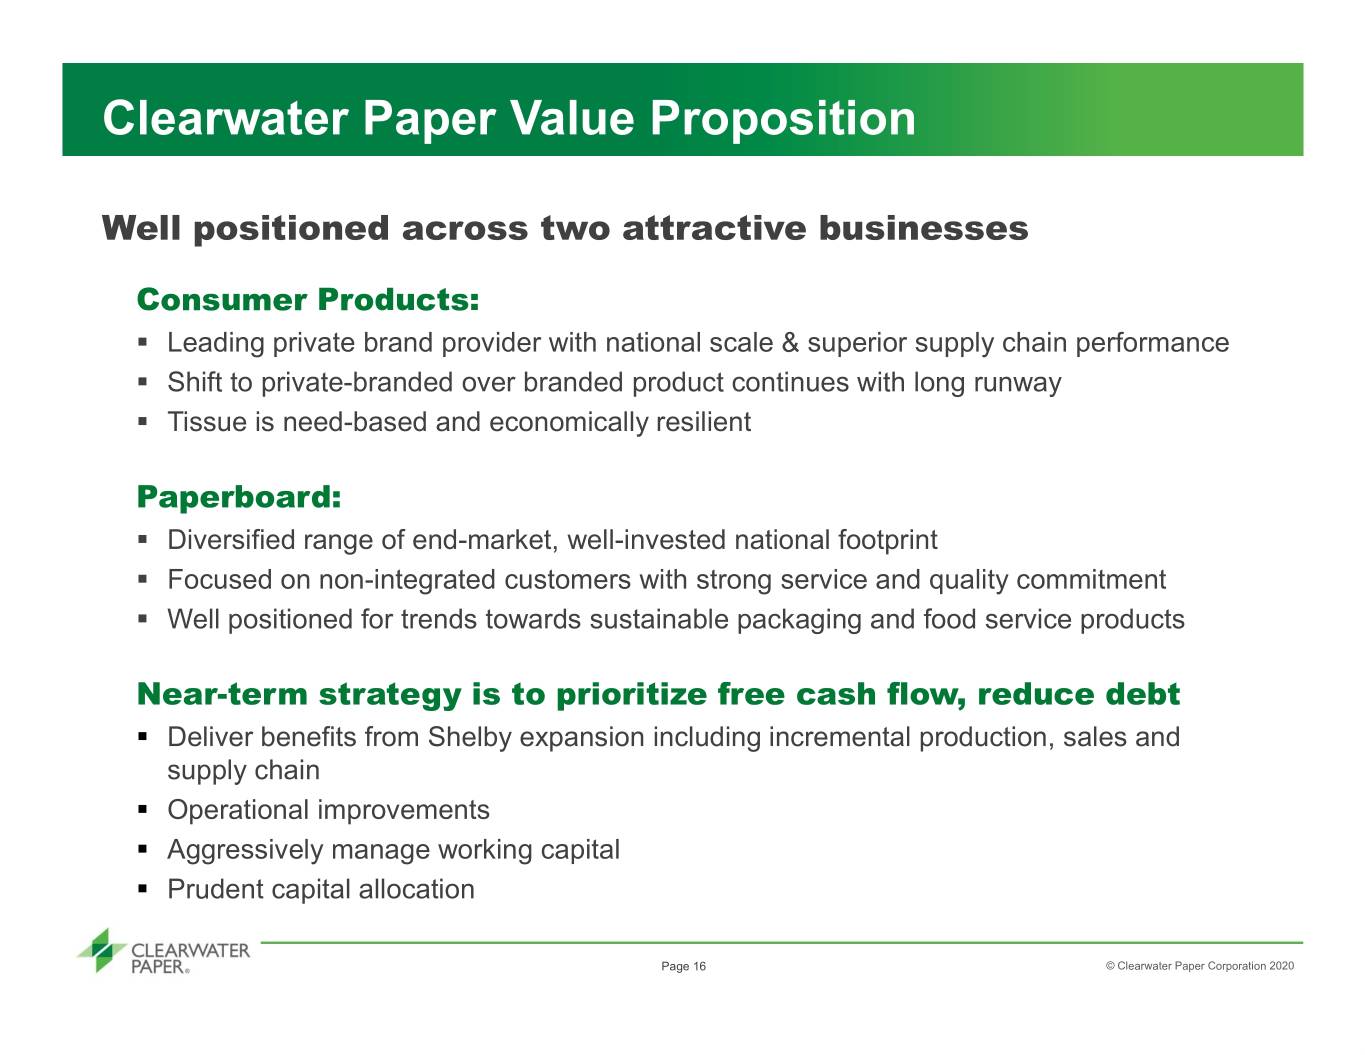
Clearwater Paper Value Proposition Well positioned across two attractive businesses Consumer Products: . Leading private brand provider with national scale & superior supply chain performance . Shift to private-branded over branded product continues with long runway . Tissue is need-based and economically resilient Paperboard: . Diversified range of end-market, well-invested national footprint . Focused on non-integrated customers with strong service and quality commitment . Well positioned for trends towards sustainable packaging and food service products Near-term strategy is to prioritize free cash flow, reduce debt . Deliver benefits from Shelby expansion including incremental production, sales and supply chain . Operational improvements . Aggressively manage working capital . Prudent capital allocation Page 16 © Clearwater Paper Corporation 2020
Appendix © Clearwater Paper Corporation 2020
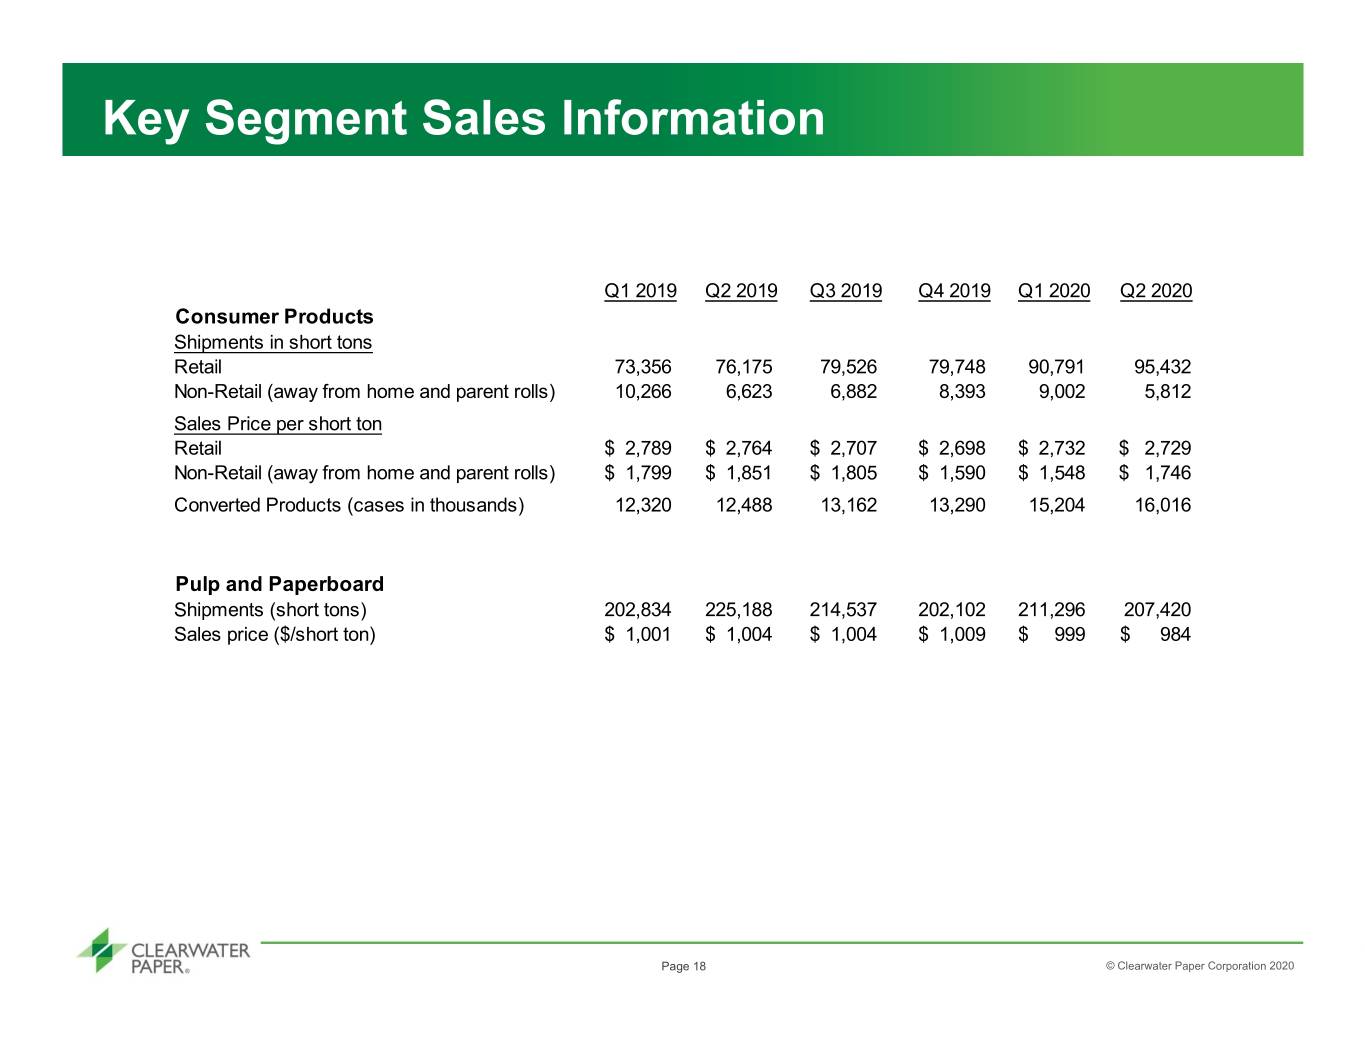
Key Segment Sales Information Q1 2019 Q2 2019 Q3 2019 Q4 2019 Q1 2020 Q2 2020 Consumer Products Shipments in short tons Retail 73,356 76,175 79,526 79,748 90,791 95,432 Non-Retail (away from home and parent rolls) 10,266 6,623 6,882 8,393 9,002 5,812 Sales Price per short ton Retail $ 2,789 $ 2,764 $ 2,707 $ 2,698 $ 2,732 $ 2,729 Non-Retail (away from home and parent rolls) $ 1,799 $ 1,851 $ 1,805 $ 1,590 $ 1,548 $ 1,746 Converted Products (cases in thousands) 12,320 12,488 13,162 13,290 15,204 16,016 Pulp and Paperboard Shipments (short tons) 202,834 225,188 214,537 202,102 211,296 207,420 Sales price ($/short ton) $ 1,001 $ 1,004 $ 1,004 $ 1,009 $ 999 $ 984 Page 18 © Clearwater Paper Corporation 2020
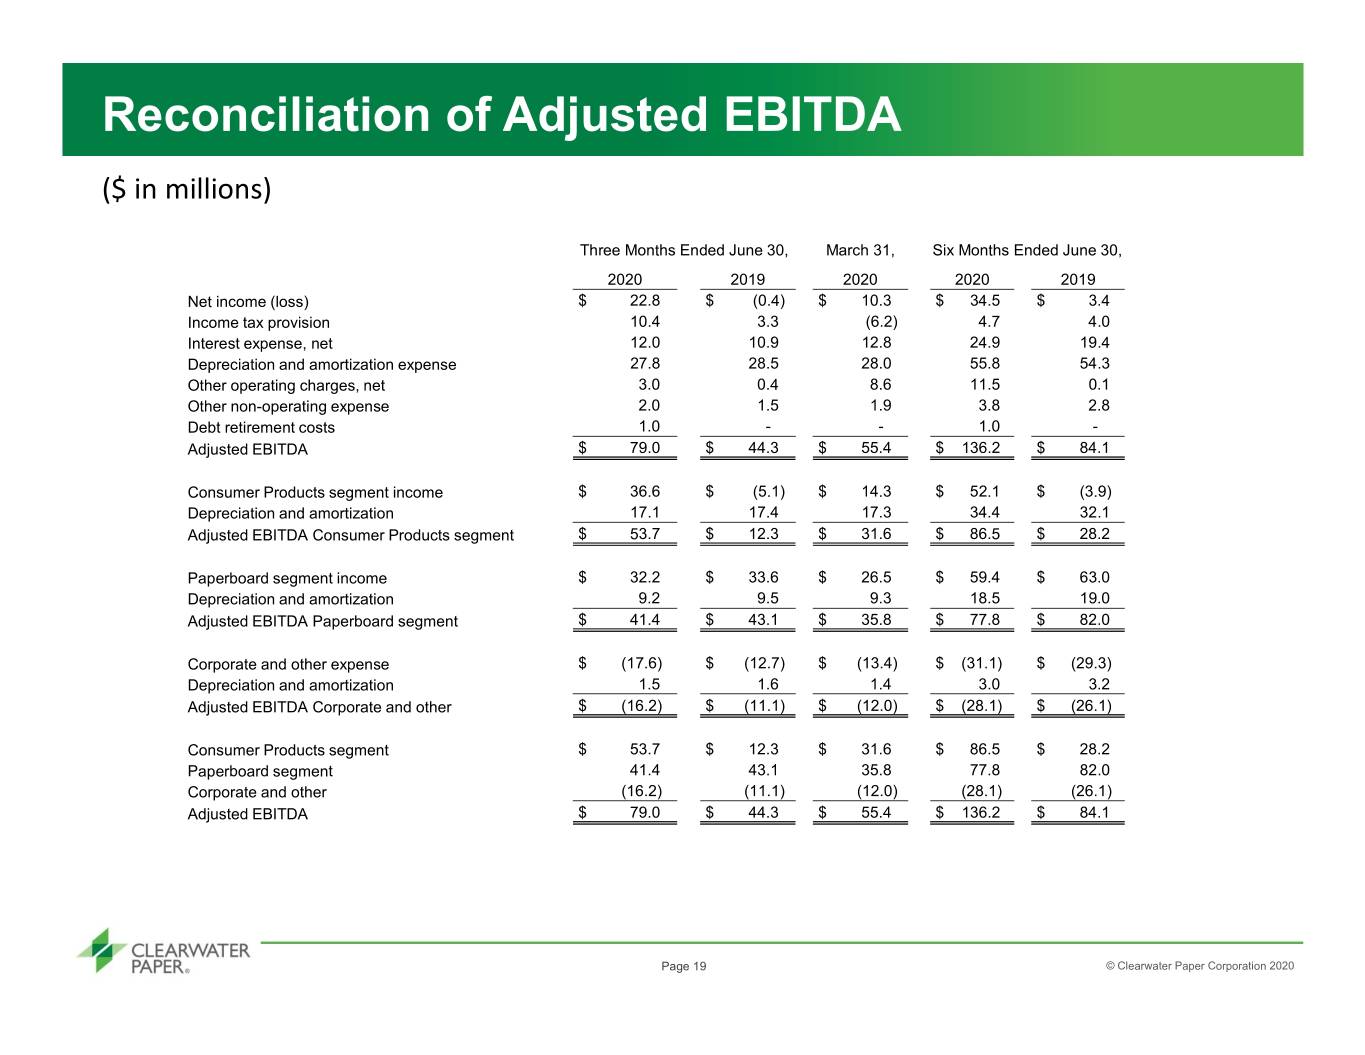
Reconciliation of Adjusted EBITDA ($ in millions) Three Months Ended June 30, March 31, Six Months Ended June 30, 2020 2019 2020 2020 2019 Net income (loss) $ 22.8 $ (0.4) $ 10.3 $ 34.5 $ 3.4 Income tax provision 10.4 3.3 (6.2) 4.7 4.0 Interest expense, net 12.0 10.9 12.8 24.9 19.4 Depreciation and amortization expense 27.8 28.5 28.0 55.8 54.3 Other operating charges, net 3.0 0.4 8.6 11.5 0.1 Other non-operating expense 2.0 1.5 1.9 3.8 2.8 Debt retirement costs 1.0 - - 1.0 - Adjusted EBITDA $ 79.0 $ 44.3 $ 55.4 $ 136.2 $ 84.1 Consumer Products segment income $ 36.6 $ (5.1) $ 14.3 $ 52.1 $ (3.9) Depreciation and amortization 17.1 17.4 17.3 34.4 32.1 Adjusted EBITDA Consumer Products segment $ 53.7 $ 12.3 $ 31.6 $ 86.5 $ 28.2 Paperboard segment income $ 32.2 $ 33.6 $ 26.5 $ 59.4 $ 63.0 Depreciation and amortization 9.2 9.5 9.3 18.5 19.0 Adjusted EBITDA Paperboard segment $ 41.4 $ 43.1 $ 35.8 $ 77.8 $ 82.0 Corporate and other expense $ (17.6) $ (12.7) $ (13.4) $ (31.1) $ (29.3) Depreciation and amortization 1.5 1.6 1.4 3.0 3.2 Adjusted EBITDA Corporate and other $ (16.2) $ (11.1) $ (12.0) $ (28.1) $ (26.1) Consumer Products segment $ 53.7 $ 12.3 $ 31.6 $ 86.5 $ 28.2 Paperboard segment 41.4 43.1 35.8 77.8 82.0 Corporate and other (16.2) (11.1) (12.0) (28.1) (26.1) Adjusted EBITDA $ 79.0 $ 44.3 $ 55.4 $ 136.2 $ 84.1 Page 19 © Clearwater Paper Corporation 2020
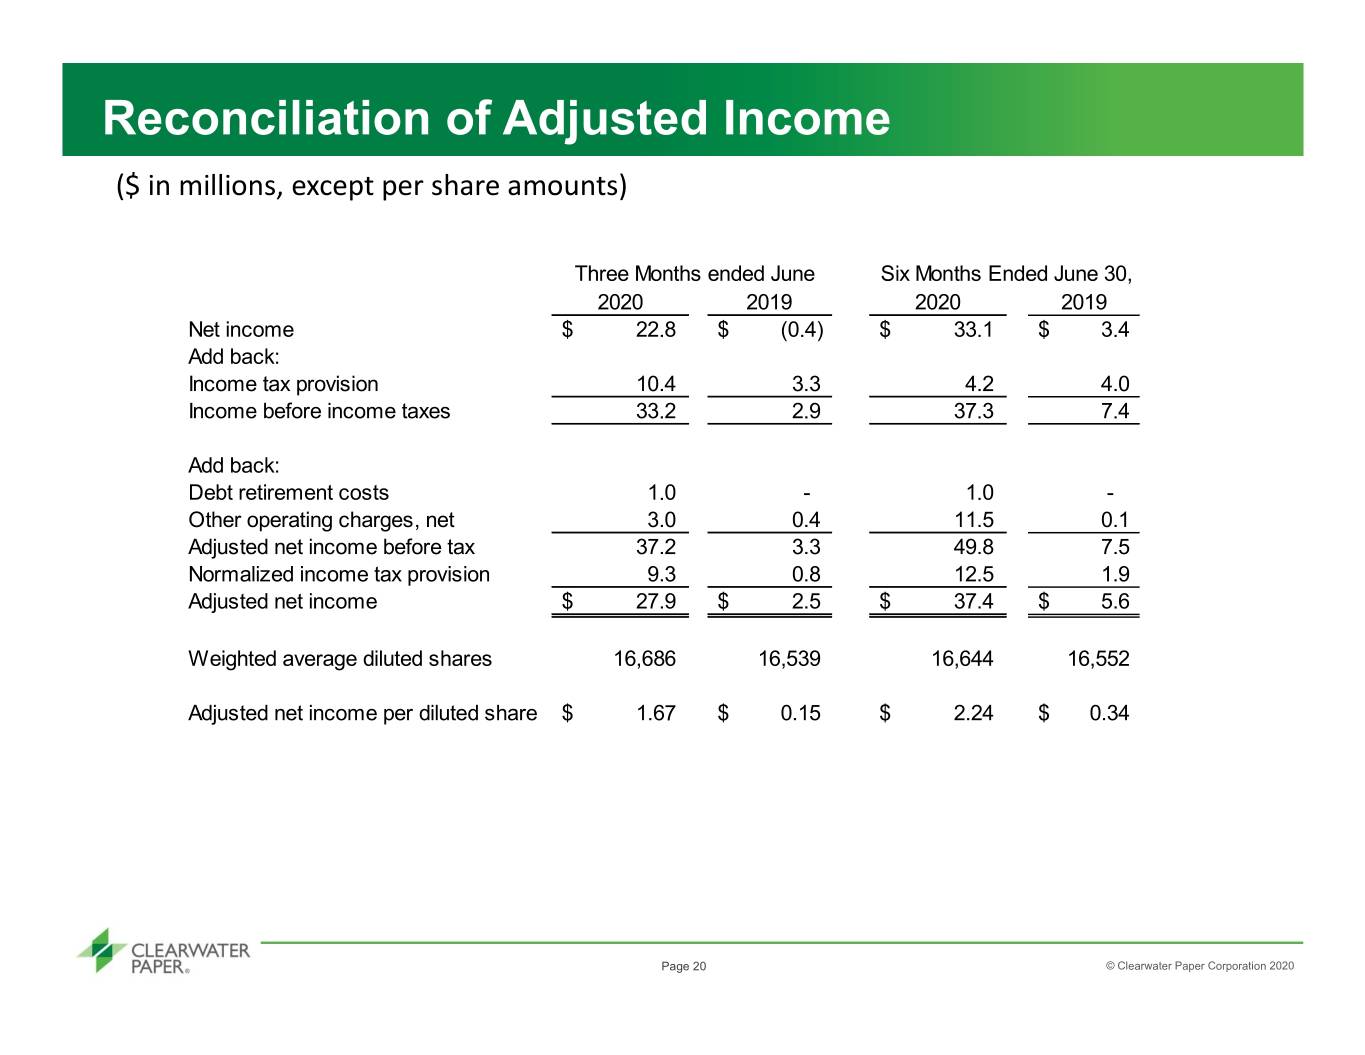
Reconciliation of Adjusted Income ($ in millions, except per share amounts) Three Months ended June Six Months Ended June 30, 2020 2019 2020 2019 Net income $ 22.8 $ (0.4) $ 33.1 $ 3.4 Add back: Income tax provision 10.4 3.3 4.2 4.0 Income before income taxes 33.2 2.9 37.3 7.4 Add back: Debt retirement costs 1.0 - 1.0 - Other operating charges, net 3.0 0.4 11.5 0.1 Adjusted net income before tax 37.2 3.3 49.8 7.5 Normalized income tax provision 9.3 0.8 12.5 1.9 Adjusted net income $ 27.9 $ 2.5 $ 37.4 $ 5.6 Weighted average diluted shares 16,686 16,539 16,644 16,552 Adjusted net income per diluted share $ 1.67 $ 0.15 $ 2.24 $ 0.34 Page 20 © Clearwater Paper Corporation 2020
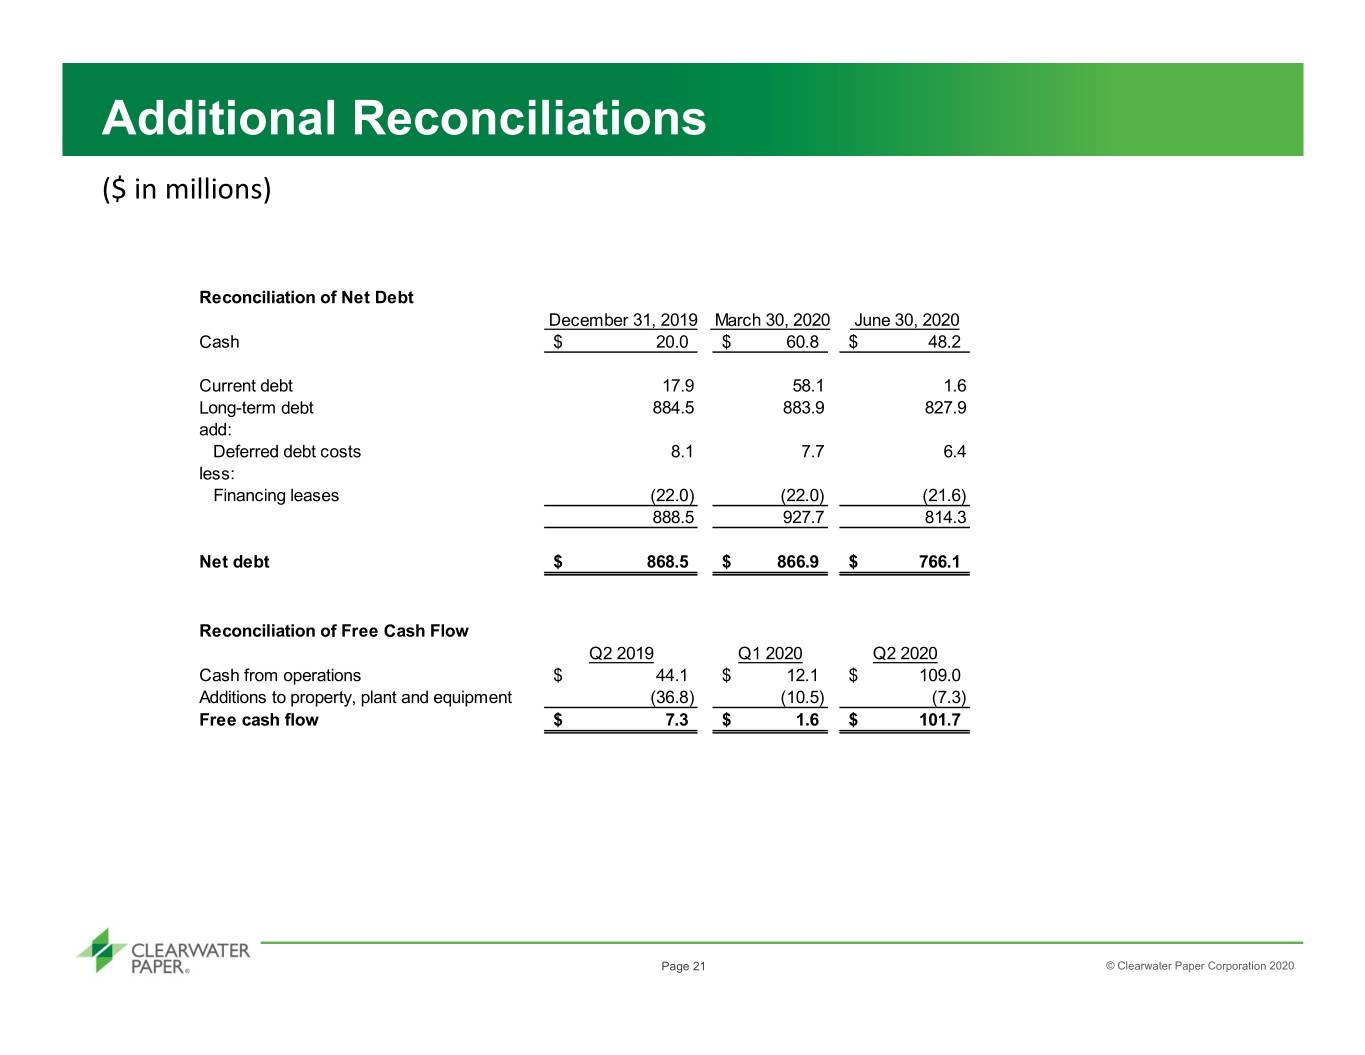
Additional Reconciliations ($ in millions) Reconciliation of Net Debt December 31, 2019 March 30, 2020 June 30, 2020 Cash$ 20.0 $ 60.8 $ 48.2 Current debt 17.9 58.1 1.6 Long-term debt 884.5 883.9 827.9 add: Deferred debt costs 8.1 7.7 6.4 less: Financing leases (22.0) (22.0) (21.6) 888.5 927.7 814.3 Net debt$ 868.5 $ 866.9 $ 766.1 Reconciliation of Free Cash Flow Q2 2019 Q1 2020 Q2 2020 Cash from operations$ 44.1 $ 12.1 $ 109.0 Additions to property, plant and equipment (36.8) (10.5) (7.3) Free cash flow$ 7.3 $ 1.6 $ 101.7 Page 21 © Clearwater Paper Corporation 2020
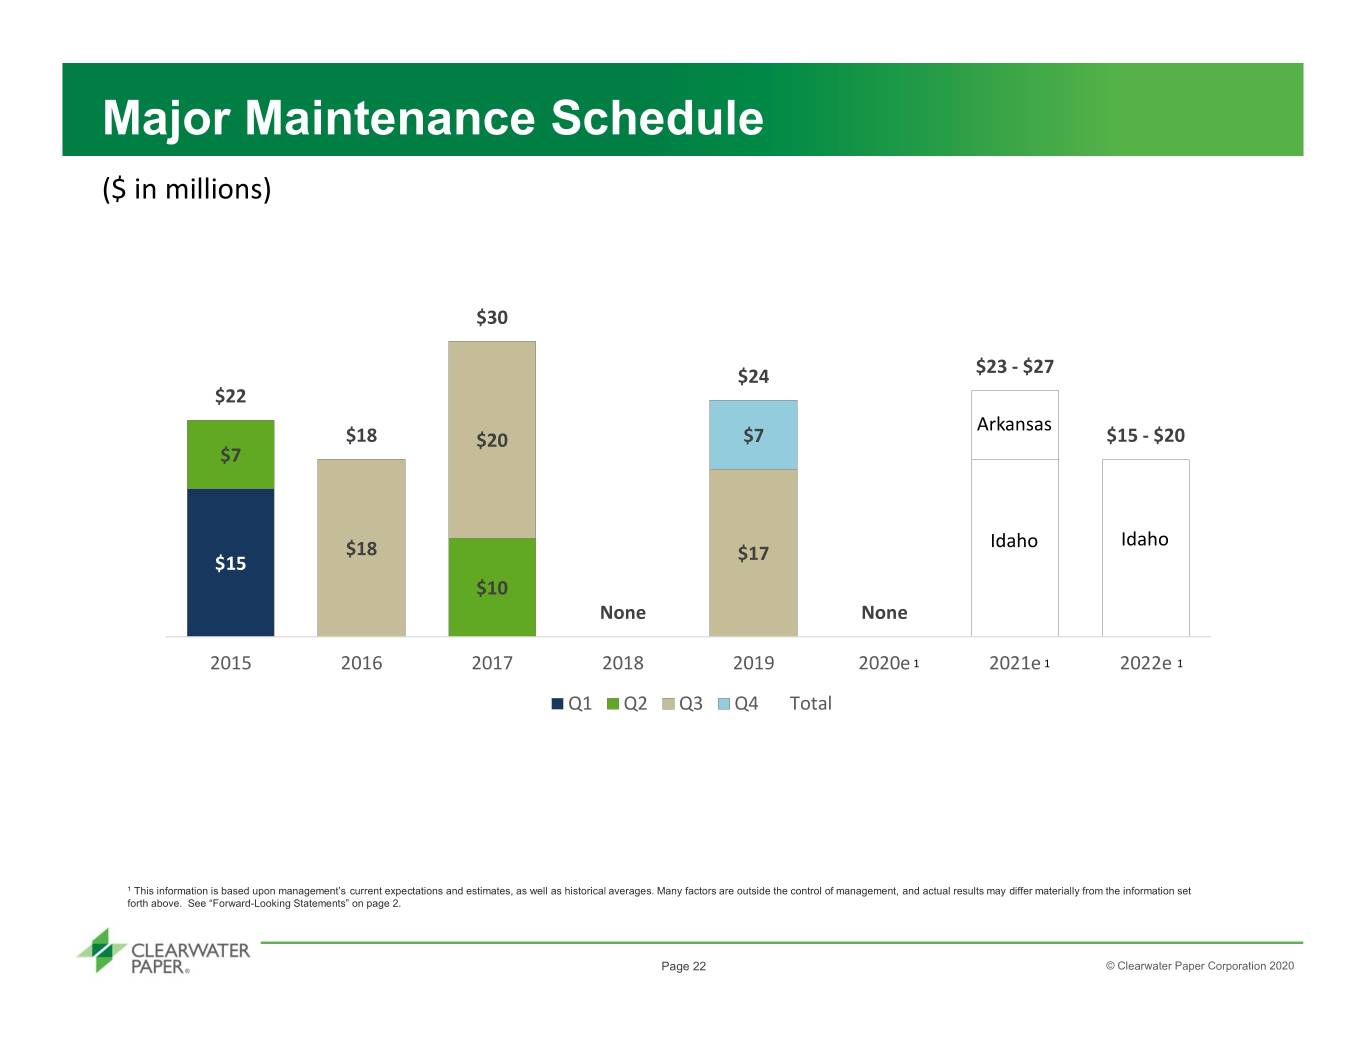
Major Maintenance Schedule ($ in millions) $30 $24 $23 - $27 $22 Arkansas $18 $20 $7 $15 - $20 $7 $18 Idaho Idaho $15 $17 $10 None None 2015 2016 2017 2018 2019 2020e1 2021e 1 2022e 1 Q1 Q2 Q3 Q4 Total 1 This information is based upon management’s current expectations and estimates, as well as historical averages. Many factors are outside the control of management, and actual results may differ materially from the information set forth above. See “Forward-Looking Statements” on page 2. Page 22 © Clearwater Paper Corporation 2020