
CVGI 8-K
Commercial Vehicle Group, Inc. (CVGI)
8-K
2020-05-18
For: 2020-05-18
View Original
Added on
April 07, 2026
UNITED STATES
SECURITIES AND EXCHANGE COMMISSION
WASHINGTON, D.C. 20549
Pursuant to Section 13 or 15(d)
of the Securities Exchange Act of 1934
Date of Report (Date of Earliest Event Reported): May 18, 2020
Commercial Vehicle Group, Inc.
(Exact name of registrant as specified in its charter)
Delaware | 001-34365 | 41-1990662 | ||
(State or other jurisdiction | (Commission | (I.R.S. Employer | ||
of incorporation) | File Number) | Identification No.) | ||
7800 Walton Parkway, New Albany, Ohio | 43054 | |
(Address of principal executive offices) | (Zip Code) | |
Registrant’s telephone number, including area code: 614-289-5360
Not Applicable
Former name or former address, if changed since last report
Securities registered pursuant to Section 12(b) of the Act:
Title of each class | Trading Symbol(s) | Name of each exchange on which registered |
Common Stock, par value $0.1 per share | CVGI | The NASDAQ Global Select Market |
Check the appropriate box below if the Form 8-K filing is intended to simultaneously satisfy the filing obligation of the registrant under any of the following provisions:
¨ | Written communications pursuant to Rule 425 under the Securities Act (17 CFR 230.425) |
¨ | Soliciting material pursuant to Rule 14a-12 under the Exchange Act (17 CFR 240.14a-12) |
¨ | Pre-commencement communications pursuant to Rule 14d-2(b) under the Exchange Act (17 CFR 240.14d-2(b)) |
¨ | Pre-commencement communications pursuant to Rule 13e-4(c) under the Exchange Act (17 CFR 240.13e-4(c)) |
Indicate by check mark whether the registrant is an emerging growth company as defined in as defined in Rule 405 of the Securities Act of 1933 (§230.405 of this chapter) or Rule 12b-2 of the Securities Exchange Act of 1934 (§240.12b-2 of this chapter).
Emerging growth company | ¨ |
If an emerging growth company, indicate by check mark if the registrant has elected not to use the extended transition period for complying with any new or revised financial accounting standards provided pursuant to Section 13(a) of the Exchange Act. | ¨ |
Item 2.02. Results of Operations and Financial Condition.
On May 18, 2020, Commercial Vehicle Group, Inc. (the “Company”) issued the press release attached hereto as Exhibit 99.1 announcing earnings for the first quarter ended March 31, 2020. Additionally, the Company filed a presentation attached hereto as Exhibit 99.2.
The information, including exhibit 99.1 hereto, the registrant furnished in this report is not deemed “filed” for purposes of Section 18 of the Securities Exchange Act of 1934, as amended, or otherwise subject to the liabilities of that section. Registration statements or other documents filed with the Securities and Exchange Commission shall not incorporate this information by reference, except as otherwise expressly stated in such filing.
Item 9.01. Financial Statements and Exhibits.
(d) Exhibits
SIGNATURES
Pursuant to the requirements of the Securities Exchange Act of 1934, the registrant has duly caused this report to be signed on its behalf by the undersigned hereunto duly authorized.
COMMERCIAL VEHICLE GROUP, INC. | ||||||
May 18, 2020 | By: | /s/ C. Timothy Trenary | ||||
Name: | C. Timothy Trenary | |||||
Title: | Chief Financial Officer | |||||

Exhibit 99.1
CONTACT: Kirk Feiler, Investor Relations
Commercial Vehicle Group, Inc.
(614) 289-0195
FOR IMMEDIATE RELEASE
COMMERCIAL VEHICLE GROUP ANNOUNCES FIRST QUARTER 2020 RESULTS
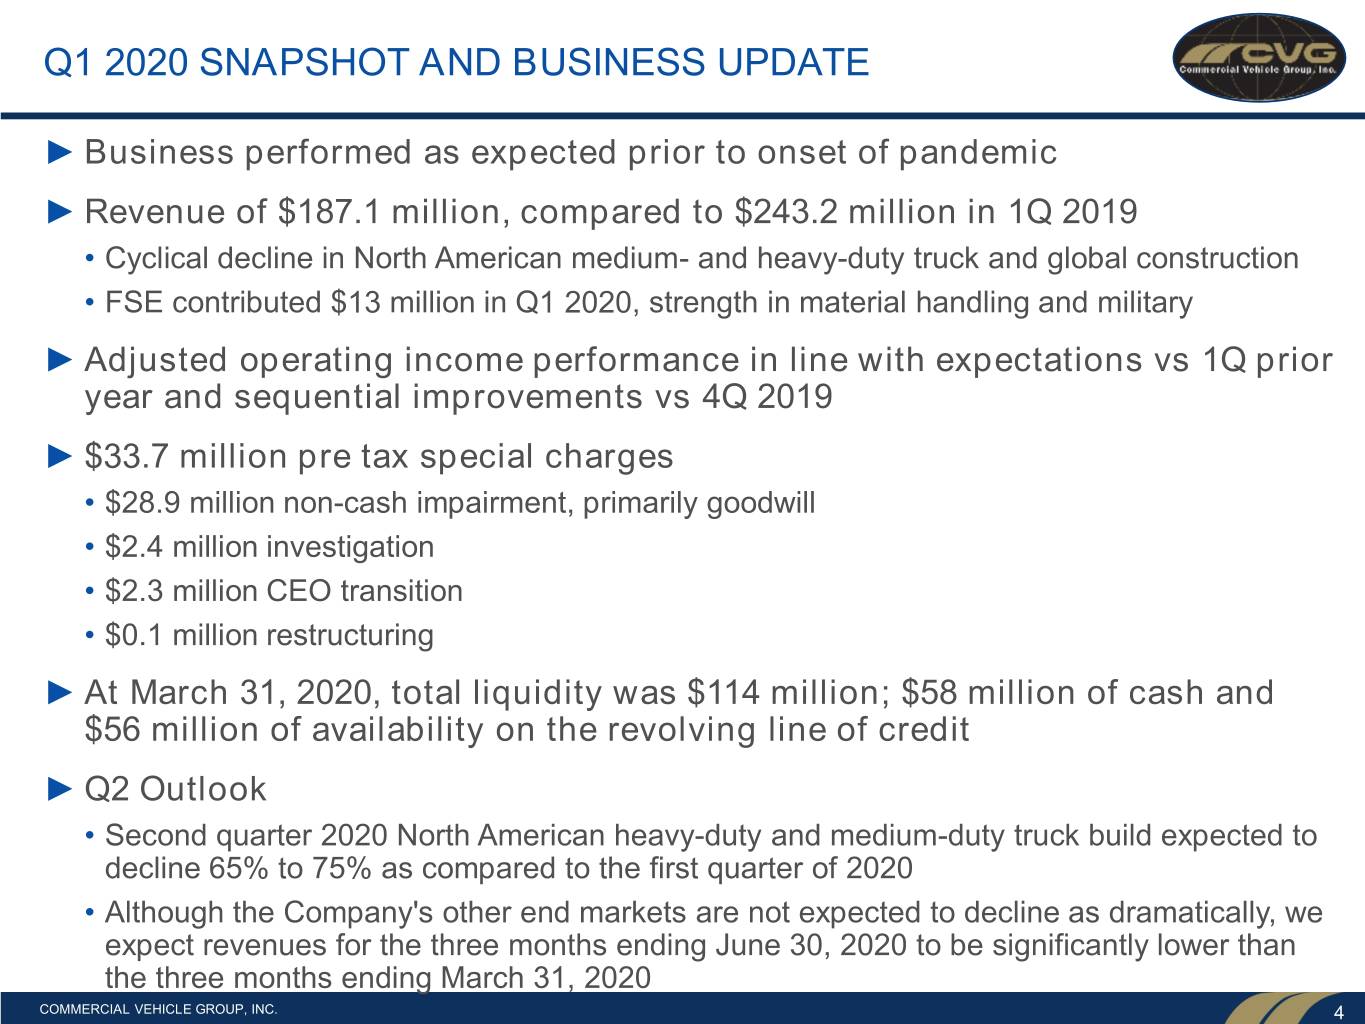
NEW ALBANY, OHIO, May 18, 2020 /PRNewswire/ – Commercial Vehicle Group, Inc. (the “Company”) (NASDAQ: CVGI) today reported financial results for the first quarter ended March 31, 2020, including revenues of $187.1 million, net loss of $24.6 million, EPS of $(0.80), pre-tax special charges of 33.7 million, and adjusted EPS of $0.02.
First Quarter | |||
($ in millions except EPS) | 2020 | 2019 | |
Revenues | $187.1 | $243.2 | |
Operating (Loss) Income | $(26.5) | $17.6 | |
Adjusted Operating Income 1 | $7.1 | $17.6 | |
Net (Loss) Income | $(24.6) | $10.0 | |
Basic and Diluted EPS | $(0.80) | $0.33 | |
Adjusted Basic and Diluted EPS 1 | $0.02 | $0.33 | |
Adjusted EBITDA 1 | $11.0 | $21.4 | |
1 See Appendix A for GAAP to Non-GAAP reconciliation | |||
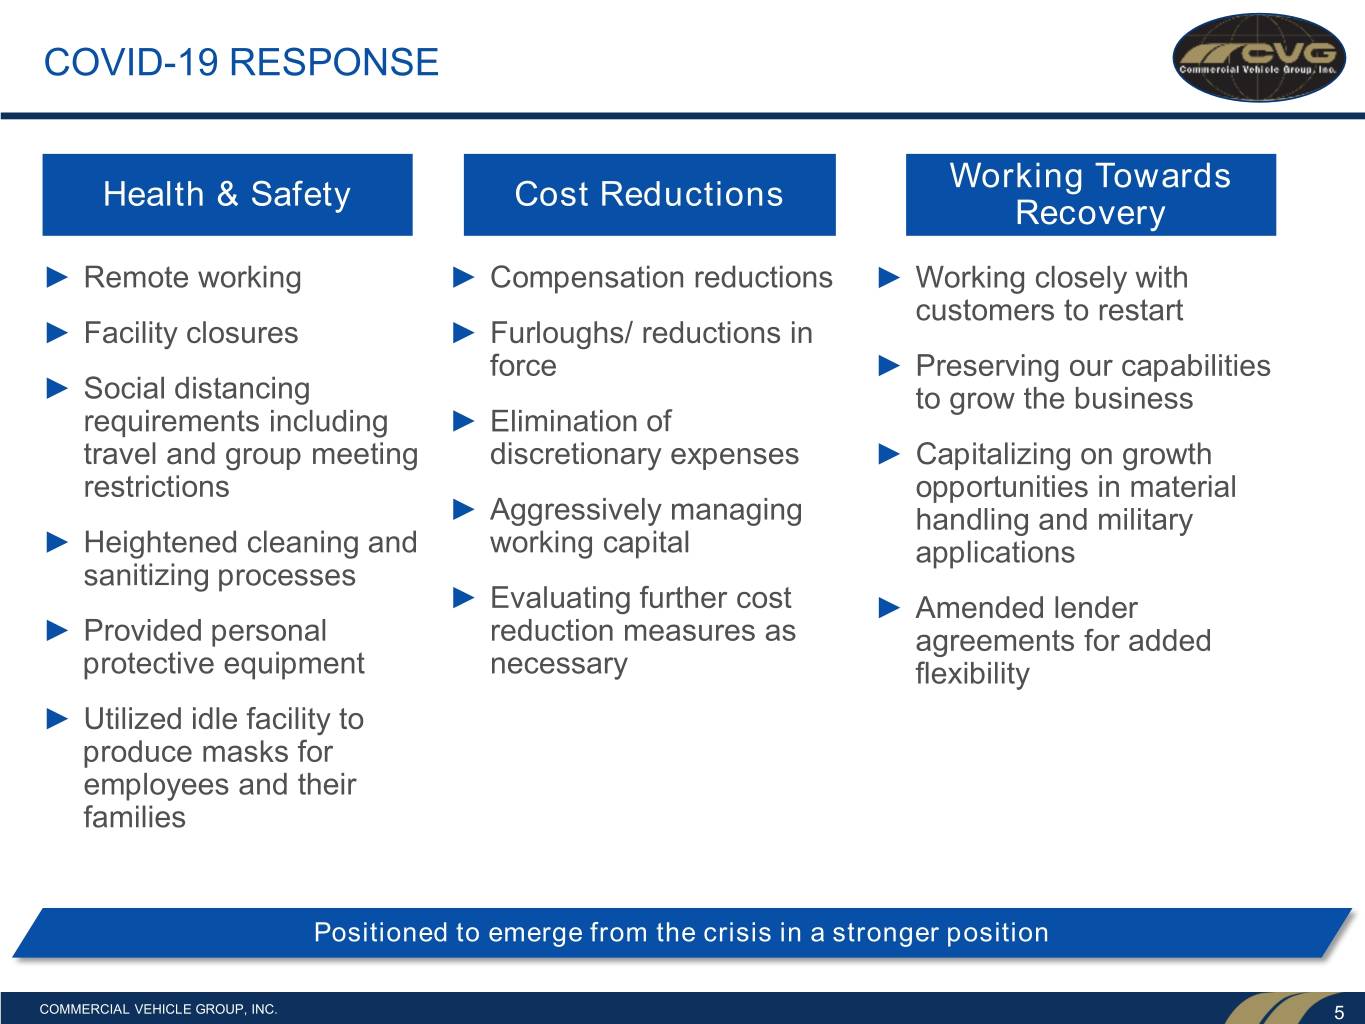
“Absent special charges during the first quarter, we successfully adjusted our cost structure to achieve an 18% pull through rate year over year and made more significant improvements as compared to the fourth quarter. In addition, we achieved $114 million of liquidity, reflecting our focus on disciplined cash management. In the face of an already substantially lower production environment, which was exacerbated by the COVID-19 pandemic in late-March, we took swift actions to align our business to our new operational realities. Further, we are continuing to make adjustments to right-size the business and maintain liquidity based on current demand trends. We have been purposeful in our approach to cost optimization to preserve our capabilities, ensure we are ready to restart production efficiently, and preserve core growth initiatives,” commented Harold Bevis, President and Chief Executive Officer of Commercial Vehicle Group. “Importantly, last week we announced that we had reached a new agreement to amend our Term Loan with our lenders and asset-based Revolving Credit Facility with the banks, which provides covena
nt relief and increased flexibility to right-size certain parts of the Company.”
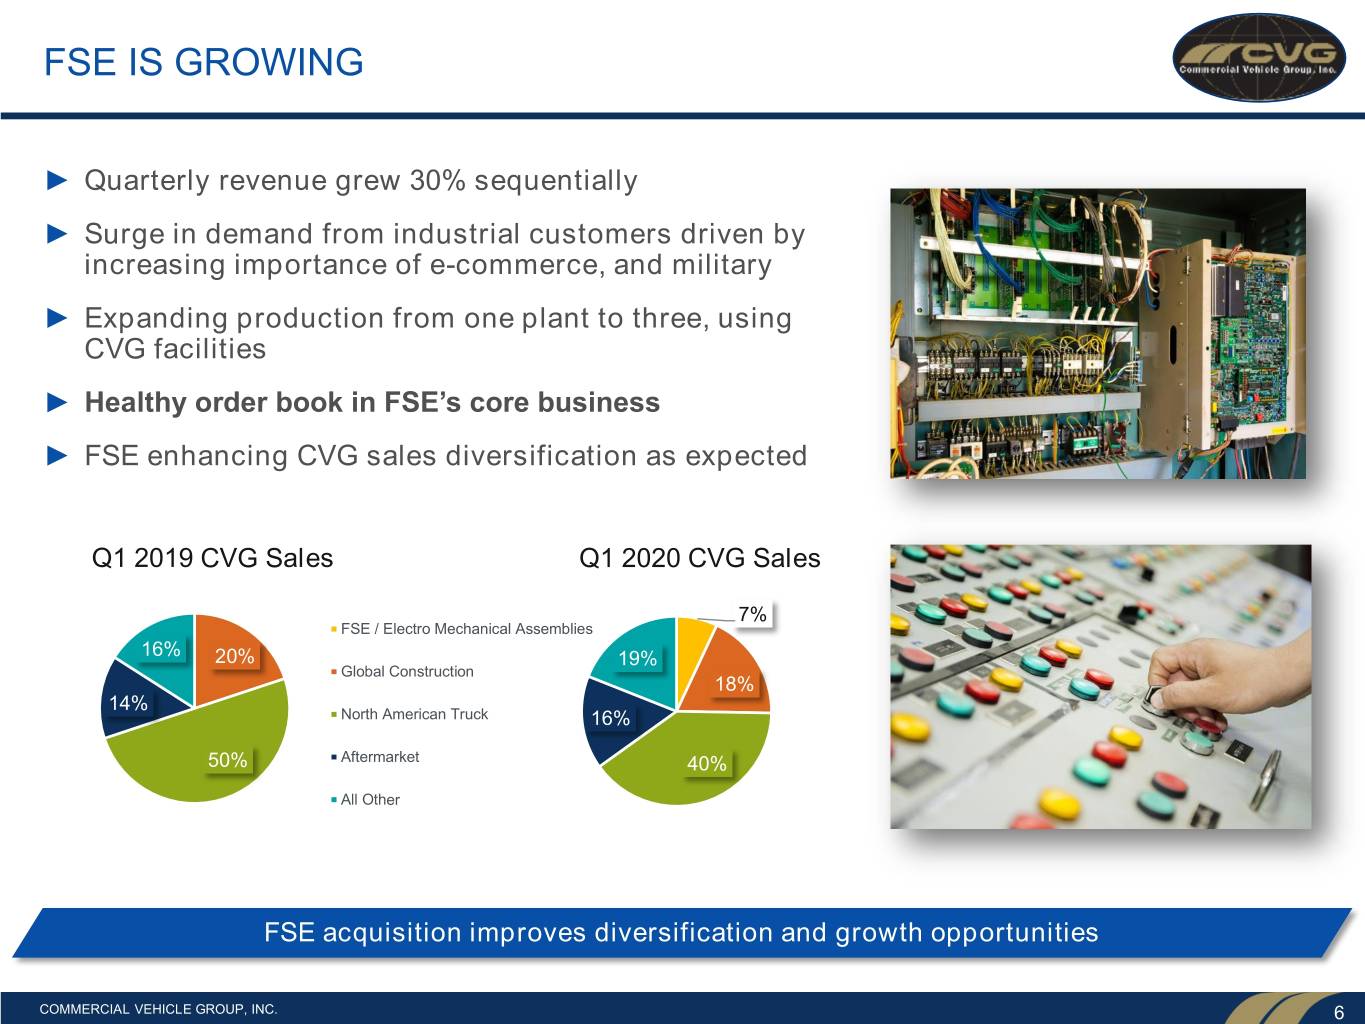
“First Source Electronics (FSE) continues to be a bright spot during this difficult business environment. With e-commerce applications growing in importance, we are well positioned to respond to the robust demand, and we are proud to play a small part in helping the global economy continue to run. As a result of the increased demand, we expanded production for FSE from one facility to three, utilizing two additional CVG facilities,” Mr. Bevis concluded.
Consolidated Results
First Quarter 2020 Results
• | First quarter 2020 revenues were $187.1 million compared to $243.2 million in the prior year period, a decrease of 23.1%. The decrease in revenues reflects lower heavy-duty truck production in North America and in the global construction markets we serve. Foreign currency translation adversely impacted first quarter 2020 revenues by $1.2 million, or by 0.5%. |
• | Operating loss for the first quarter 2020 was $26.5 million compared to operating income of $17.6 million in the prior year period. The operating loss is primarily attributable to lower sales volume, $28.9 million of impairment expenses, $2.4 million in costs associated with the investigation into the restatement of the Company’s financial statements and $2.3 million in costs associated with the CEO transition. The first quarter of 2020 adjusted operating income was $7.1 million when excluding special charges. The impact of the decline in sales and first quarter specific costs were partially offset by cost reduction initiatives. |
• | Interest, associated with our debt, and other expense was $5.4 million and $4.4 million for the three months ended March 31, 2020 and 2019, respectively. The increase reflects unfavorable foreign exchange translation. |
• | Net loss was $24.6 million for the first quarter 2020, or $0.80 per diluted share, compared to net income of $10.0 million in the prior year period, or $0.33 per diluted share. |
At March 31, 2020, the Company had $15.0 million outstanding under its revolving credit facility and liquidity of $114.2 million; $58.1 million of cash and $56.1 million of availability from the revolving credit facility.
Segment Results
Electrical Systems Segment
First Quarter 2020 Results
• | Revenues for the Electrical Systems Segment in the first quarter 2020 were $112.1 million compared to $143.6 million for the prior year period, a decrease of 21.9% primarily resulting from lower heavy-duty truck production in North America and in the global construction markets we serve, partially offset by an increase in industrial and military revenues primarily attributable to the First Source Electronics acquisition. Foreign currency translation adversely impacted first quarter 2020 revenue by $0.4 million, or by 0.2%. |
• | Operating loss for the first quarter 2020 was $17.1 million compared to operating income of $15.0 million in the prior year period. The operating loss is primarily attributable to lower sales volume and $23.4 million of impairment expenses. The first quarter of 2020 adjusted operating income was $6.3 million when excluding special charges. The impact of the decline in sales and impairment expenses were partially offset by cost reduction initiatives. |
Global Seating Segment
First Quarter 2020 Results
• | Revenues for the Global Seating Segment in the first quarter 2020 were $76.0 million compared to $104.1 million in the prior year period, a decrease of 27.0%, primarily resulting from lower heavy-duty truck production in North America and in the global construction markets we serve. Foreign currency translation adversely impacted first quarter 2020 revenues by $0.9 million, or by 0.8%. |
• | Operating loss for the first quarter 2020 was $0.4 million compared to operating income of $8.3 million in the prior year period. The operating loss is primarily attributable to lower sales volume and $4.8 million of impairment expenses. The first quarter of 2020 adjusted operating income was $4.6 million when excluding special charges. The impact of the decline in sales and impairment expenses were partially offset by cost reduction initiatives. |
Second Quarter Outlook
According to ACT Research, second quarter 2020 North American heavy-duty and medium-duty truck build is expected to decline 65% to 75% as compared to the first quarter of 2020, as the North American Truck OEMs respond to COVID-19 and overall market conditions. Although the Company's other end markets are not expected to decline as dramatically, we expect revenues for the three months ending June 30, 2020 to be significantly lower than the three months ending March 31, 2020.
As a result of the rapid changes in our end market conditions, our OEM customer ordering patterns and general uncertainties around the impacts of COVID-19 on businesses such as government-mandated shut downs, the Company will not be providing 2020 guidance related to North American Class 5-8 truck and global construction production.
GAAP to Non-GAAP Reconciliation
A reconciliation of GAAP to non-GAAP financial measures referenced in this release is included as Appendix A to this release.
Conference Call
A conference call to discuss this press release is scheduled for Tuesday, May 19, 2020, at 8:00 a.m. ET. To participate, dial (844) 743-2497 using conference code 5874827.
This call is being webcast by NASDAQ. The webcast, as well as a supplemental earnings presentation, can be accessed through the “Investors” section of Commercial Vehicle Group’s Web site at www.cvgrp.com, where it will be archived for one year.
A telephonic replay of the conference call will be available for a period of two weeks following the call. To access the replay, dial (855) 859-2056 using access code 5874827.
About Commercial Vehicle Group, Inc.
Commercial Vehicle Group, Inc. (through its subsidiaries) is a leading supplier of electrical wire harnesses, seating systems, and a full range of other cab related products for the global commercial vehicle markets, including the medium- and heavy-duty truck, medium- and heavy-construction vehicle, military, bus, agriculture, specialty transportation, mining, industrial equipment and off-road recreational markets. Information about the Company and its products is available on the internet at www.cvgrp.com.
Forward-Looking Statements
This press release contains forward-looking statements that are subject to risks and uncertainties. These statements often include words such as “believe”, “anticipate”, “plan”, “expect”, “intend”, “will”, “should”, “could”, “would”, “project”, “continue”, “likely”, and similar expressions. In particular, this press release may contain forward-looking statements about Company expectations for future periods with respect to its plans to improve financial results and enhance the Company, the future of the Company’s end markets, including the short-term and potential longer-term impact of the COVID-19 pandemic on Class 8 and Class 5-7 North America truck build rates and performance of the global construction equipment business, expected cost savings, the Company’s initiatives to address customer needs, organic growth, the Company’s plans to focus on certain segments and markets and the Company’s financial position or other financial information. These statements are based on certain assumptions that the Company has made in light of its experience as well as its perspective on historical trends, current conditions, expected future developments and other factors it believes are appropriate under the circumstances. Actual results may differ materially from the anticipated results because of certain risks and uncertainties, including but not limited to: (i) a material weakness in our internal control over financial reporting which could, if not remediated, result in material misstatements in our financial statements; (ii) future financial restatements affecting the company; (iii) general economic or business conditions affecting the markets in which the Company serves; (iv) the Company's ability to develop or successfully introduce new products; (v) risks associated with conducting business in foreign countries and currencies; (vi) increased competition in the medium- and heavy-duty truck markets, construction, agriculture, aftermarket, military, bus and other markets; (vii) the Company’s failure to complete or successfully integrate strategic acquisitions and the impact of such acquisitions on business relationships; (viii) the Company’s ability to recognize synergies from the reorganization of the segments; (ix) the Company’s failure to successfully manage any divestitures; (x) the impact of changes in governmental regulations on the Company's customers or on its business; (xi) the loss of business from a major customer, a collection of smaller customers or the discontinuation of particular commercial vehicle platforms; (xii) the Company’s ability to obtain future financing due to changes in the lending markets or its financial position; (xiii) the Company’s ability to comply with the financial covenants in its debt facilities; (xiv) fluctuation in interest rates or change in the reference interest rate relating to the Company’s debt facilities; (xv) the Company’s ability to realize the benefits of its cost reduction and strategic initiatives and address rising labor and material costs; (xvi) volatility and cyclicality in the commercial vehicle market adversely affecting us, including the impact of the current COVID-19 pandemic; (xvii) the geographic profile of our taxable income and changes in valuation of our deferred tax assets and liabilities impacting our effective tax rate; (xviii) changes to domestic manufacturing initiatives; (xix) implementation of tax or other changes, by the United States or other international jurisdictions, related to products manufactured in one or more
jurisdictions where the Company does business (xx) security breaches and other disruptions that could compromise our information systems; (xxi) the impact of disruptions in our supply chain or delivery chains; (xxii) litigation against us; (xxiii) the impact of health epidemics or widespread outbreak of contagious disease; and (xxiv) various other risks as outlined under the heading "Risk Factors" in the Company's Annual Report on Form 10-K for fiscal year ending December 31, 2019. There can be no assurance that statements made in this press release relating to future events will be achieved. The Company undertakes no obligation to update or revise forward-looking statements to reflect changed assumptions, the occurrence of unanticipated events or changes to future operating results over time. All subsequent written and oral forward-looking statements attributable to the Company or persons acting on behalf of the Company are expressly qualified in their entirety by such cautionary statements.
###
COMMERCIAL VEHICLE GROUP, INC. AND SUBSIDIARIES
CONDENSED CONSOLIDATED STATEMENTS OF OPERATIONS
(Unaudited)
(Amounts in thousands, except per share amounts)
Three Months Ended March 31, | |||||||
2020 | 2019 (as restated) | ||||||
(Unaudited) | (Unaudited) | ||||||
(In thousands, except per share amounts) | |||||||
Revenues | $ | 187,105 | $ | 243,164 | |||
Cost of Revenues | 166,802 | 210,075 | |||||
Gross Profit | 20,303 | 33,089 | |||||
Selling, General and Administrative Expenses | 17,099 | 15,199 | |||||
Amortization Expense | 860 | 321 | |||||
Impairment Expense | 28,867 | — | |||||
Operating (Loss) Income | (26,523 | ) | 17,569 | ||||
Interest and Other Expense | 5,365 | 4,396 | |||||
(Loss) Income Before Provision for Income Taxes | (31,888 | ) | 13,173 | ||||
(Benefit) Provision for Income Taxes | (7,294 | ) | 3,187 | ||||
Net (Loss) Income | $ | (24,594 | ) | $ | 9,986 | ||
(Loss) earnings per Common Share: | |||||||
Basic | $ | (0.80 | ) | $ | 0.33 | ||
Diluted | $ | (0.80 | ) | $ | 0.33 | ||
Weighted Average Shares Outstanding: | |||||||
Basic | 30,806 | 30,513 | |||||
Diluted | 30,806 | 30,694 | |||||
COMMERCIAL VEHICLE GROUP, INC. AND SUBSIDIARIES
CONDENSED CONSOLIDATED BALANCE SHEETS
(Unaudited)
CONDENSED CONSOLIDATED BALANCE SHEETS
(Unaudited)
(Amounts in thousands)
March 31, 2020 | December 31, 2019 | ||||||
(Unaudited) | |||||||
(In thousands, except per share amounts) | |||||||
Assets | |||||||
Current Assets: | |||||||
Cash | $ | 58,055 | $ | 39,511 | |||
Accounts receivable, net of allowances of $477 and $432, respectively | 123,293 | 115,099 | |||||
Inventories | 84,459 | 82,872 | |||||
Other current assets | 14,043 | 18,490 | |||||
Total current assets | 279,850 | 255,972 | |||||
Property, plant and equipment, net of accumulated depreciation of $155,718 and $154,939, respectively | 70,022 | 73,686 | |||||
Operating lease right-of-use assets, net | 31,645 | 34,960 | |||||
Goodwill | — | 27,816 | |||||
Intangible assets, net of accumulated amortization of $12,099 and $11,440, respectively | 24,160 | 25,258 | |||||
Deferred income taxes | 22,795 | 14,654 | |||||
Other assets, net | 2,716 | 3,480 | |||||
Total assets | $ | 431,188 | $ | 435,826 | |||
Liabilities and Stockholders’ Equity | |||||||
Current Liabilities: | |||||||
Accounts payable | $ | 73,640 | $ | 63,058 | |||
Revolving credit facility | 15,000 | — | |||||
Current operating lease liabilities | 7,730 | 7,620 | |||||
Accrued liabilities and other | 39,266 | 32,673 | |||||
Current portion of long-term debt | 3,268 | 3,256 | |||||
Total current liabilities | 138,904 | 106,607 | |||||
Long-term debt | 152,304 | 153,128 | |||||
Operating lease liabilities | 26,248 | 29,414 | |||||
Pension and other post-retirement benefits | 10,072 | 10,666 | |||||
Other long-term liabilities | 6,734 | 7,323 | |||||
Total liabilities | 334,262 | 307,138 | |||||
Stockholders’ Equity: | |||||||
Preferred stock, $0.01 par value (5,000,000 shares authorized; no shares issued and outstanding) | — | — | |||||
Common stock, $0.01 par value (60,000,000 shares authorized; 30,847,269 and 30,801,255 shares issued and outstanding respectively) | 323 | 323 | |||||
Treasury stock, at cost: 1,334,251 shares, as of March 2019 and December 2018 | (11,230 | ) | (11,230 | ) | |||
Additional paid-in capital | 246,714 | 245,852 | |||||
Retained deficit | (84,901 | ) | (60,307 | ) | |||
Accumulated other comprehensive loss | (53,980 | ) | (45,950 | ) | |||
Total stockholders’ equity | 96,926 | 128,688 | |||||
Total liabilities and stockholders’ equity | $ | 431,188 | $ | 435,826 | |||
COMMERCIAL VEHICLE GROUP, INC. AND SUBSIDIARIES
BUSINESS SEGMENT FINANCIAL INFORMATION
(Unaudited)
(Amounts in thousands)
Three Months Ended March 31, 2020 | |||||||||||||||||||||||||||||||
Electrical Systems | Global Seating | Corporate / Other | Total | ||||||||||||||||||||||||||||
2020 | 2019 (as restated) | 2020 | 2019 | 2020 | 2019 (as restated) | 2020 | 2019 (as restated) | ||||||||||||||||||||||||
Revenues | |||||||||||||||||||||||||||||||
External Revenues | $ | 111,167 | $ | 140,672 | $ | 75,938 | $ | 102,492 | $ | — | $ | — | $ | 187,105 | $ | 243,164 | |||||||||||||||
Intersegment Revenues | 931 | 2,939 | 43 | 1,569 | (974 | ) | (4,508 | ) | — | — | |||||||||||||||||||||
Total Revenues | $ | 112,098 | $ | 143,611 | $ | 75,981 | $ | 104,061 | $ | (974 | ) | $ | (4,508 | ) | $ | 187,105 | $ | 243,164 | |||||||||||||
Gross Profit | 10,946 | 19,331 | 9,371 | 13,779 | (14 | ) | (21 | ) | 20,303 | 33,089 | |||||||||||||||||||||
Amortization Expense | 729 | 187 | 131 | 134 | — | — | 860 | 321 | |||||||||||||||||||||||
Selling, General & Administrative Expenses | 3,950 | 4,149 | 4,792 | 5,337 | 8,357 | 5,713 | 17,099 | 15,199 | |||||||||||||||||||||||
Impairment Expense | 23,415 | — | 4,809 | — | 643 | — | 28,867 | — | |||||||||||||||||||||||
Operating (Loss) Income | $ | (17,148 | ) | $ | 14,995 | $ | (361 | ) | $ | 8,308 | $ | (9,014 | ) | $ | (5,734 | ) | $ | (26,523 | ) | $ | 17,569 | ||||||||||
COMMERCIAL VEHICLE GROUP, INC. AND SUBSIDIARIES
Appendix A: Reconciliation of GAAP to Non-GAAP Financial Measures (Unaudited)
(Amounts in thousands, except per share data)
For the Three Months Ended | |||||||
March 31, 2020 | March 31, 2019 | ||||||
Operating (Loss) Income | $ | (26,523 | ) | $ | 17,569 | ||
CEO Transition | 2,256 | — | |||||
Restructuring | 171 | — | |||||
Investigation | 2,376 | — | |||||
Impairment of Goodwill and Long-Lived Assets | 28,867 | — | |||||
Adjusted Operating Income | $ | 7,147 | $ | 17,569 | |||
% of Revenues | 3.8 | % | 7.2 | % | |||
Interest Expense | 4,624 | 4,552 | |||||
Other Income / Expense | 741 | (156 | ) | ||||
Income Before Provision for Income Taxes | $ | 1,782 | $ | 13,173 | |||
Adjusted Provision for Income Taxes1 | 1,123 | 3,187 | |||||
Adjusted Net Income | $ | 659 | $ | 9,986 | |||
Adjusted Basic and Diluted EPS | $ | 0.02 | $ | 0.33 | |||
Adjusted Operating Income | $ | 7,147 | $ | 17,569 | |||
Depreciation Expense | 3,780 | 3,360 | |||||
Amortization Expense | 860 | 321 | |||||
Non Interest Other Income / Expense | (741 | ) | 156 | ||||
Adjusted EBITDA | $ | 11,046 | $ | 21,406 | |||
% of Revenues | 5.9 | % | 8.8 | % | |||
1. | Reported Tax (Benefit) Provision adjusted for tax effect of special charges at 25% |
COMMERCIAL VEHICLE GROUP, INC. AND SUBSIDIARIES
Appendix B: Segment Reconciliation of GAAP to Non-GAAP Financial Measures (Unaudited)
(Amounts in thousands)
For the Three Months Ended March 31, 2020 | |||||||||||||||
Electrical Systems | Global Seating | Corporate | Total | ||||||||||||
Operating (Loss) Income | $ | (17,148 | ) | $ | (362 | ) | $ | (9,013 | ) | $ | (26,523 | ) | |||
CEO Transition | — | — | 2,256 | 2,256 | |||||||||||
Restructuring | — | 131 | 40 | 171 | |||||||||||
Investigation | — | — | 2,376 | 2,376 | |||||||||||
Impairment of Goodwill and Long-Lived Assets | 23,415 | 4,809 | 643 | 28,867 | |||||||||||
Adjusted Operating Income | $ | 6,267 | $ | 4,578 | $ | (3,698 | ) | $ | 7,147 | ||||||
% of Revenues | 5.6 | % | 6.0 | % | 3.8 | % | |||||||||
Use of Non-GAAP Measures
This earnings release contains financial measures that are not calculated in accordance with U.S. generally accepted accounting principles (“GAAP”). In general, the non-GAAP measures exclude items that (i) management believes reflect the Company’s multi-year corporate activities; or (ii) relate to activities or actions that may have occurred over multiple or in prior periods without predictable trends. Management uses these non-GAAP financial measures internally to evaluate the Company’s performance, engage in financial and operational planning and to determine incentive compensation.
Management provides these non-GAAP financial measures to investors as supplemental metrics to assist readers in assessing the effects of items and events on the Company’s financial and operating results and in comparing the Company’s performance to that of its competitors and to comparable reporting periods. The non-GAAP financial measures used by the Company may be calculated differently from, and therefore may not be comparable to, similarly titled measures used by other companies.
The non-GAAP financial measures disclosed by the Company should not be considered a substitute for, or superior to, financial measures calculated in accordance with GAAP. The financial results calculated in accordance with GAAP and reconciliations to those financial statements set forth above should be carefully evaluated.

EXHIBIT 99.2

Q1 2020 EARNINGS CONFERENCE CALL May 18, 2020 Harold Bevis President & CEO Tim Trenary CFO & Treasurer Kirk Feiler VP Finance & Investor Relations
FORWARD LOOKING STATEMENTS This presentation contains forward-looking statements that are subject to risks and uncertainties. These statements often include words such as “believe”, “anticipate”, “plan”, “expect”, “intend”, “will”, “should”, “could”, “would”, “project”, “continue”, “likely”, and similar expressions. In particular, this press release may contain forward-looking statements about Company expectations for future periods with respect to its plans to improve financial results and enhance the Company, the future of the Company’s end markets, including the short-term and potential longer- term impact of the COVID-19 pandemic on Class 8 and Class 5-7 North America truck build rates and performance of the global construction equipment business, expected cost savings, the Company’s initiatives to address customer needs, organic growth, the Company’s plans to focus on certain segments and markets and the Company’s financial position or other financial information. These statements are based on certain assumptions that the Company has made in light of its experience as well as its perspective on historical trends, current conditions, expected future developments and other factors it believes are appropriate under the circumstances. Actual results may differ materially from the anticipated results because of certain risks and uncertainties, including but not limited to: (i) a material weakness in our internal control over financial reporting which could, if not remediated, result in material misstatements in our financial statements; (ii) future financial restatements affecting the company; (iii) general economic or business conditions affecting the markets in which the Company serves; (iv) the Company's ability to develop or successfully introduce new products; (v) risks associated with conducting business in foreign countries and currencies; (vi) increased competition in the medium- and heavy-duty truck markets, construction, agriculture, aftermarket, military, bus and other markets; (vii) the Company’s failure to complete or successfully integrate strategic acquisitions and the impact of such acquisitions on business relationships; (viii) the Company’s ability to recognize synergies from the reorganization of the segments; (ix) the Company’s failure to successfully manage any divestitures; (x) the impact of changes in governmental regulations on the Company's customers or on its business; (xi) the loss of business from a major customer, a collection of smaller customers or the discontinuation of particular commercial vehicle platforms; (xii) the Company’s ability to obtain future financing due to changes in the lending markets or its financial position; (xiii) the Company’s ability to comply with the financial covenants in its debt facilities; (xiv) fluctuation in interest rates or change in the reference interest rate relating to the Company’s debt facilities; (xv) the Company’s ability to realize the benefits of its cost reduction and strategic initiatives and address rising labor and material costs; (xvi) volatility and cyclicality in the commercial vehicle market adversely affecting us, including the impact of the current COVID-19 pandemic; (xvii) the geographic profile of our taxable income and changes in valuation of our deferred tax assets and liabilities impacting our effective tax rate; (xviii) changes to domestic manufacturing initiatives; (xix) implementation of tax or other changes, by the United States or other international jurisdictions, related to products manufactured in one or more jurisdictions where the Company does business (xx) security breaches and other disruptions that could compromise our information systems; (xxi) the impact of disruptions in our supply chain or delivery chains; (xxii) litigation against us; (xxiii) the impact of health epidemics or widespread outbreak of contagious disease; and (xxiv) various other risks as outlined under the heading "Risk Factors" in the Company's Annual Report on Form 10-K for fiscal year ending December 31, 2019. There can be no assurance that statements made in this press release relating to future events will be achieved. The Company undertakes no obligation to update or revise forward-looking statements to reflect changed assumptions, the occurrence of unanticipated events or changes to future operating results over time. All subsequent written and oral forward-looking statements attributable to the Company or persons acting on behalf of the Company are expressly qualified in their entirety by such cautionary statements. COMMERCIAL VEHICLE GROUP, INC. 3
Q1 2020 SNAPSHOT AND BUSINESS UPDATE ► Business performed as expected prior to onset of pandemic ► Revenue of $187.1 million, compared to $243.2 million in 1Q 2019 • Cyclical decline in North American medium- and heavy-duty truck and global construction • FSE contributed $13 million in Q1 2020, strength in material handling and military ► Adjusted operating income performance in line with expectations vs 1Q prior year and sequential improvements vs 4Q 2019 ► $33.7 million pre tax special charges • $28.9 million non-cash impairment, primarily goodwill • $2.4 million investigation • $2.3 million CEO transition • $0.1 million restructuring ► At March 31, 2020, total liquidity was $114 million; $58 million of cash and $56 million of availability on the revolving line of credit ► Q2 Outlook • Second quarter 2020 North American heavy-duty and medium-duty truck build expected to decline 65% to 75% as compared to the first quarter of 2020 • Although the Company's other end markets are not expected to decline as dramatically, we expect revenues for the three months ending June 30, 2020 to be significantly lower than the three months ending March 31, 2020 COMMERCIAL VEHICLE GROUP, INC. 4
COVID-19 RESPONSE Working Towards Health & Safety Cost Reductions Recovery ► Remote working ► Compensation reductions ► Working closely with customers to restart ► Facility closures ► Furloughs/ reductions in force ► Preserving our capabilities ► Social distancing to grow the business requirements including ► Elimination of travel and group meeting discretionary expenses ► Capitalizing on growth restrictions opportunities in material ► Aggressively managing handling and military ► Heightened cleaning and working capital applications sanitizing processes ► Evaluating further cost ► Amended lender ► Provided personal reduction measures as agreements for added protective equipment necessary flexibility ► Utilized idle facility to produce masks for employees and their families Positioned to emerge from the crisis in a stronger position COMMERCIAL VEHICLE GROUP, INC. 5
FSE IS GROWING ► Quarterly revenue grew 30% sequentially ► Surge in demand from industrial customers driven by increasing importance of e-commerce, and military ► Expanding production from one plant to three, using CVG facilities ► Healthy order book in FSE’s core business ► FSE enhancing CVG sales diversification as expected Q1 2019 CVG Sales Q1 2020 CVG Sales 7% FSE / Electro Mechanical Assemblies 16% 20% 19% Global Construction 18% 14% North American Truck 16% 50% Aftermarket 40% All Other FSE acquisition improves diversification and growth opportunities COMMERCIAL VEHICLE GROUP, INC. 6
REMAIN COMMITTED TO STRATEGY ► Optimize performance of core business ► Capitalize on growth opportunities for parts of the business not as severely impacted by COVID-19 ► Organic growth initiatives targeted at electric vehicles, last mile delivery, non-commercial vehicles ► Grow and expand material handling, military and other non-cyclical end markets Focused on navigating near-term challenges, while positioning the business for long- term opportunities COMMERCIAL VEHICLE GROUP, INC. 7

FINANCE UPDATE COMMERCIAL VEHICLE GROUP, INC. 8
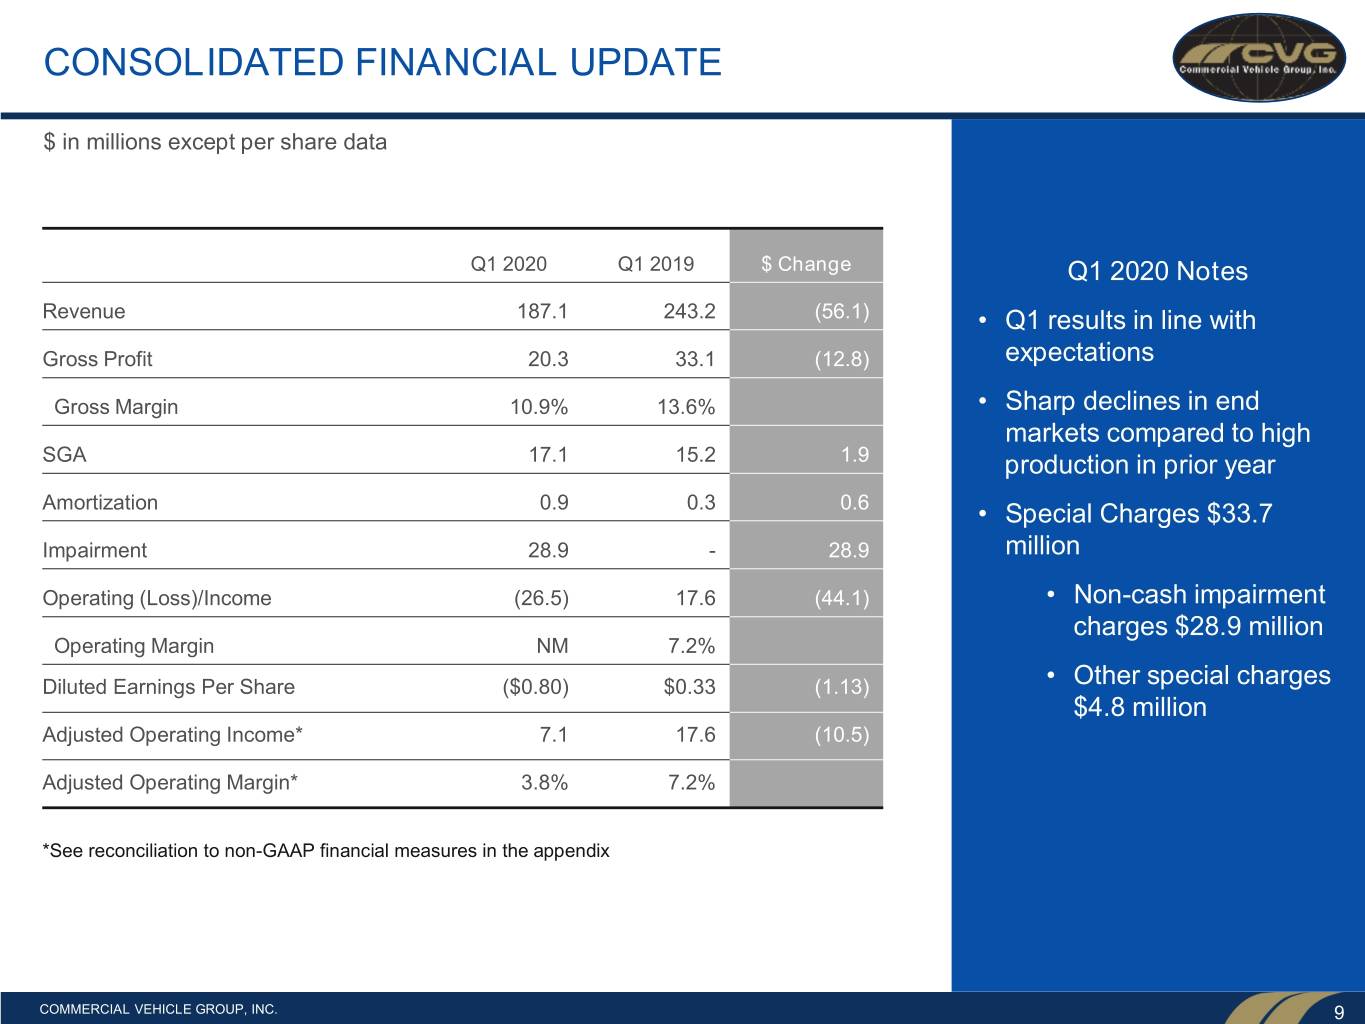
CONSOLIDATED FINANCIAL UPDATE $ in millions except per share data Q1 2020 Q1 2019 $ Change Q1 2020 Notes Revenue 187.1 243.2 (56.1) • Q1 results in line with Gross Profit 20.3 33.1 (12.8) expectations Gross Margin 10.9% 13.6% • Sharp declines in end markets compared to high SGA 17.1 15.2 1.9 production in prior year Amortization 0.9 0.3 0.6 • Special Charges $33.7 Impairment 28.9 - 28.9 million Operating (Loss)/Income (26.5) 17.6 (44.1) • Non-cash impairment charges $28.9 million Operating Margin NM 7.2% Diluted Earnings Per Share ($0.80) $0.33 (1.13) • Other special charges $4.8 million Adjusted Operating Income* 7.1 17.6 (10.5) Adjusted Operating Margin* 3.8% 7.2% *See reconciliation to non-GAAP financial measures in the appendix COMMERCIAL VEHICLE GROUP, INC. 9
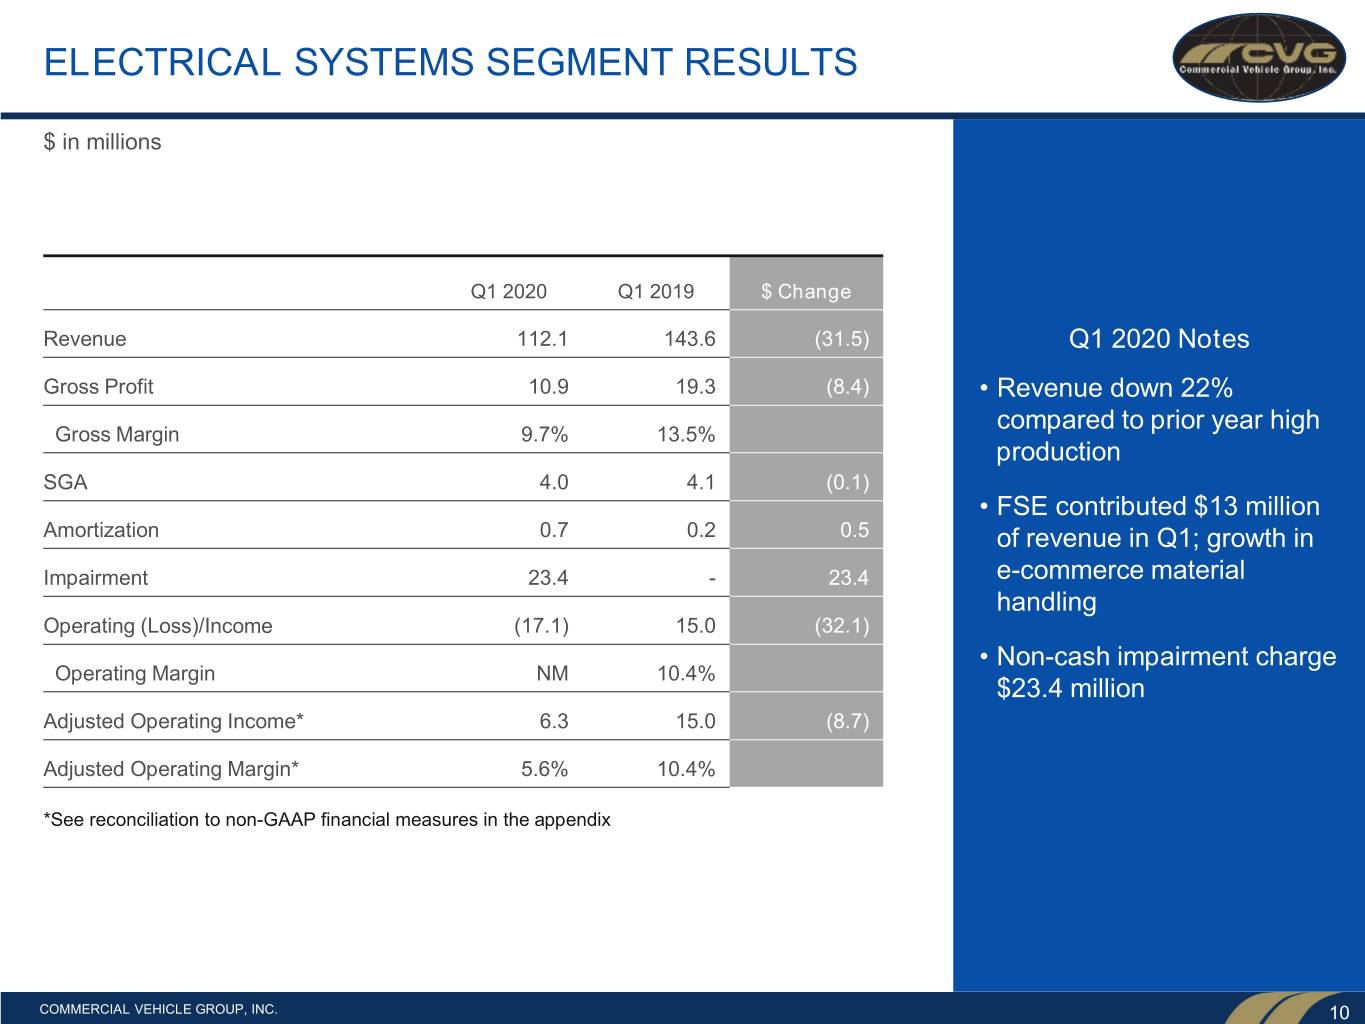
ELECTRICAL SYSTEMS SEGMENT RESULTS $ in millions Q1 2020 Q1 2019 $ Change Revenue 112.1 143.6 (31.5) Q1 2020 Notes Gross Profit 10.9 19.3 (8.4) • Revenue down 22% compared to prior year high Gross Margin 9.7% 13.5% production SGA 4.0 4.1 (0.1) • FSE contributed $13 million Amortization 0.7 0.2 0.5 of revenue in Q1; growth in Impairment 23.4 - 23.4 e-commerce material handling Operating (Loss)/Income (17.1) 15.0 (32.1) • Non-cash impairment charge Operating Margin NM 10.4% $23.4 million Adjusted Operating Income* 6.3 15.0 (8.7) Adjusted Operating Margin* 5.6% 10.4% *See reconciliation to non-GAAP financial measures in the appendix COMMERCIAL VEHICLE GROUP, INC. 10
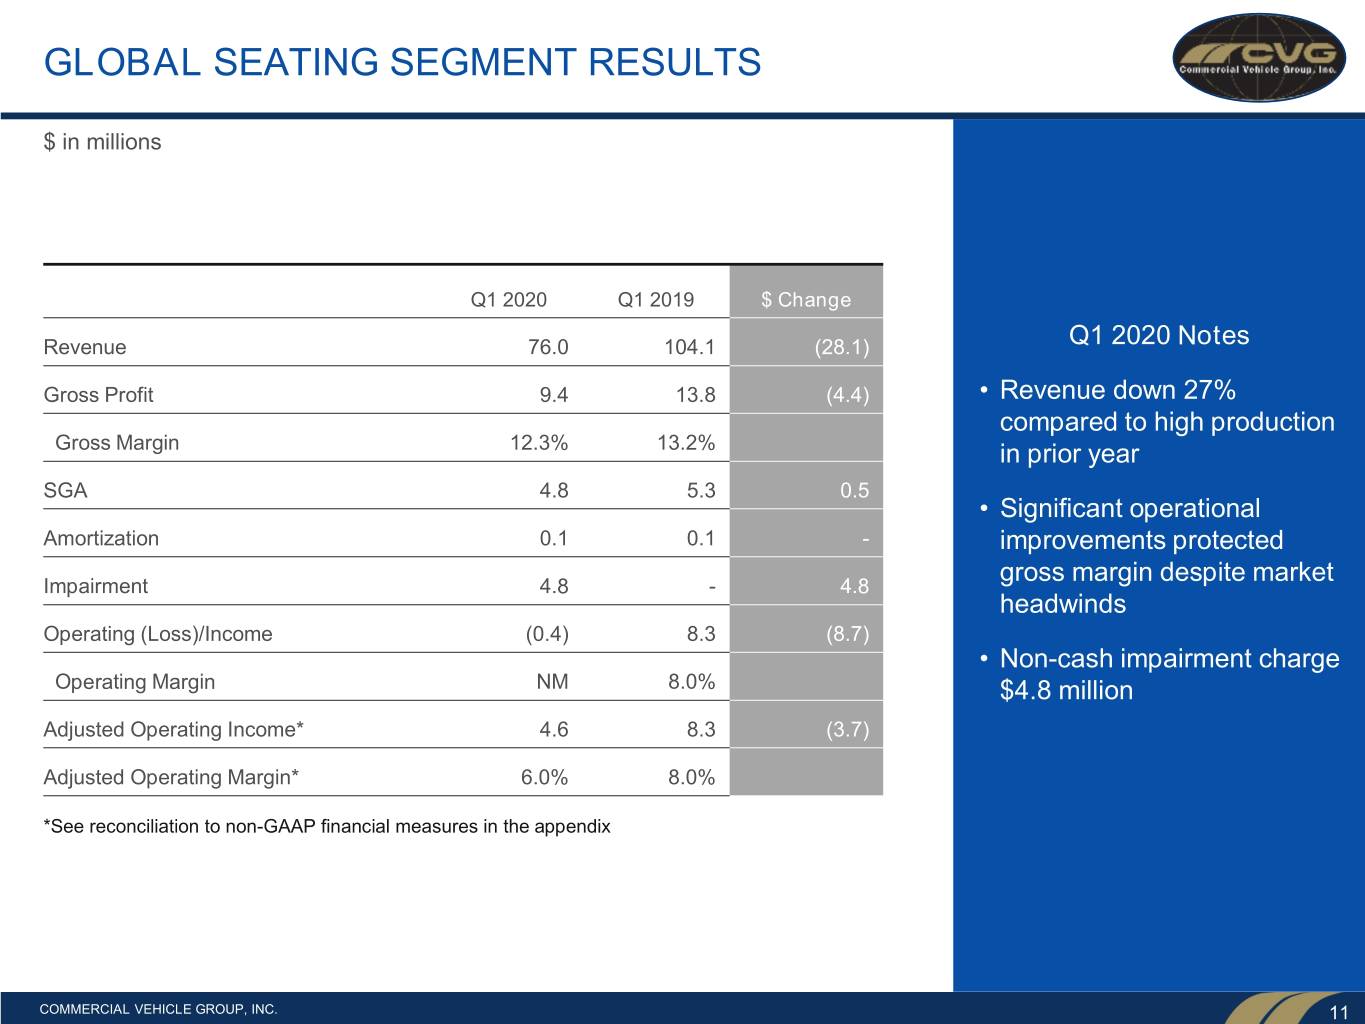
GLOBAL SEATING SEGMENT RESULTS $ in millions Q1 2020 Q1 2019 $ Change Revenue 76.0 104.1 (28.1) Q1 2020 Notes Gross Profit 9.4 13.8 (4.4) • Revenue down 27% compared to high production Gross Margin 12.3% 13.2% in prior year SGA 4.8 5.3 0.5 • Significant operational Amortization 0.1 0.1 - improvements protected gross margin despite market Impairment 4.8 - 4.8 headwinds Operating (Loss)/Income (0.4) 8.3 (8.7) • Non-cash impairment charge Operating Margin NM 8.0% $4.8 million Adjusted Operating Income* 4.6 8.3 (3.7) Adjusted Operating Margin* 6.0% 8.0% *See reconciliation to non-GAAP financial measures in the appendix COMMERCIAL VEHICLE GROUP, INC. 11
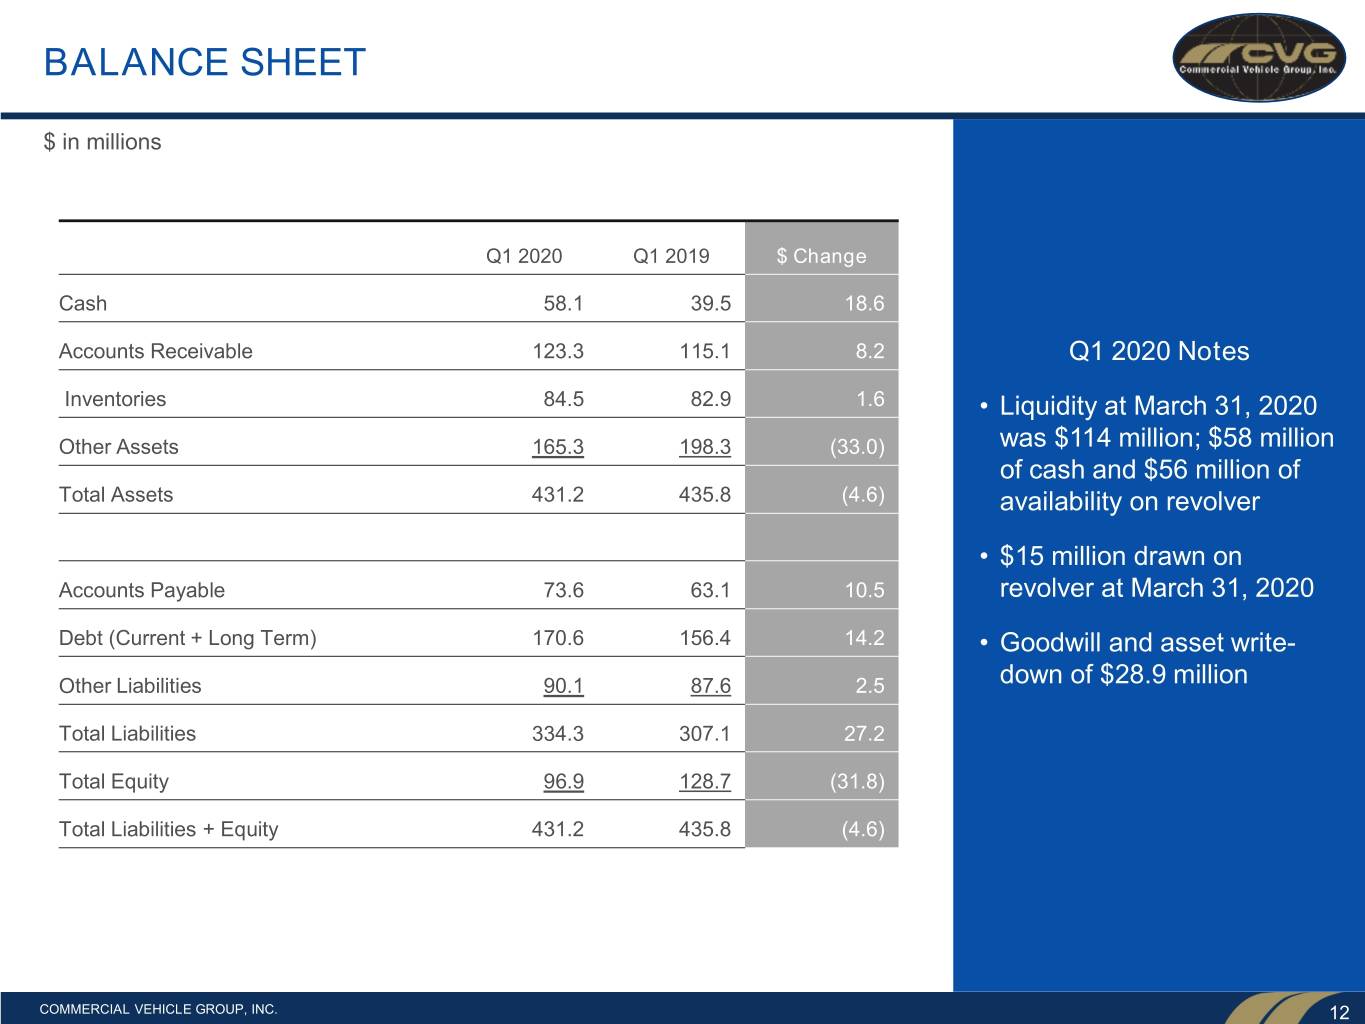
BALANCE SHEET $ in millions Q1 2020 Q1 2019 $ Change Cash 58.1 39.5 18.6 Accounts Receivable 123.3 115.1 8.2 Q1 2020 Notes Inventories 84.5 82.9 1.6 • Liquidity at March 31, 2020 Other Assets 165.3 198.3 (33.0) was $114 million; $58 million of cash and $56 million of Total Assets 431.2 435.8 (4.6) availability on revolver • $15 million drawn on Accounts Payable 73.6 63.1 10.5 revolver at March 31, 2020 Debt (Current + Long Term) 170.6 156.4 14.2 • Goodwill and asset write- Other Liabilities 90.1 87.6 2.5 down of $28.9 million Total Liabilities 334.3 307.1 27.2 Total Equity 96.9 128.7 (31.8) Total Liabilities + Equity 431.2 435.8 (4.6) COMMERCIAL VEHICLE GROUP, INC. 12

APPENDIX COMMERCIAL VEHICLE GROUP, INC. 13
USE OF NON-GAAP FINANCIAL MEASURES This earnings presentation contains financial measures that are not calculated in accordance with U.S. generally accepted accounting principles (“GAAP”). In general, the non-GAAP measures exclude items that (i) management believes reflect the Company’s multi-year corporate activities; or (ii) relate to activities or actions that may have occurred over multiple or in prior periods without predictable trends. Management uses these non-GAAP financial measures internally to evaluate the Company’s performance, engage in financial and operational planning and to determine incentive compensation. Management provides these non-GAAP financial measures to investors as supplemental metrics to assist readers in assessing the effects of items and events on the Company’s financial and operating results and in comparing the Company’s performance to that of its competitors and to comparable reporting periods. The non-GAAP financial measures used by the Company may be calculated differently from, and therefore may not be comparable to, similarly titled measures used by other companies. The non-GAAP financial measures disclosed by the Company should not be considered a substitute for, or superior to, financial measures calculated in accordance with GAAP. The financial results calculated in accordance with GAAP and reconciliations to those financial statements set forth above should be carefully evaluated. COMMERCIAL VEHICLE GROUP, INC. 14
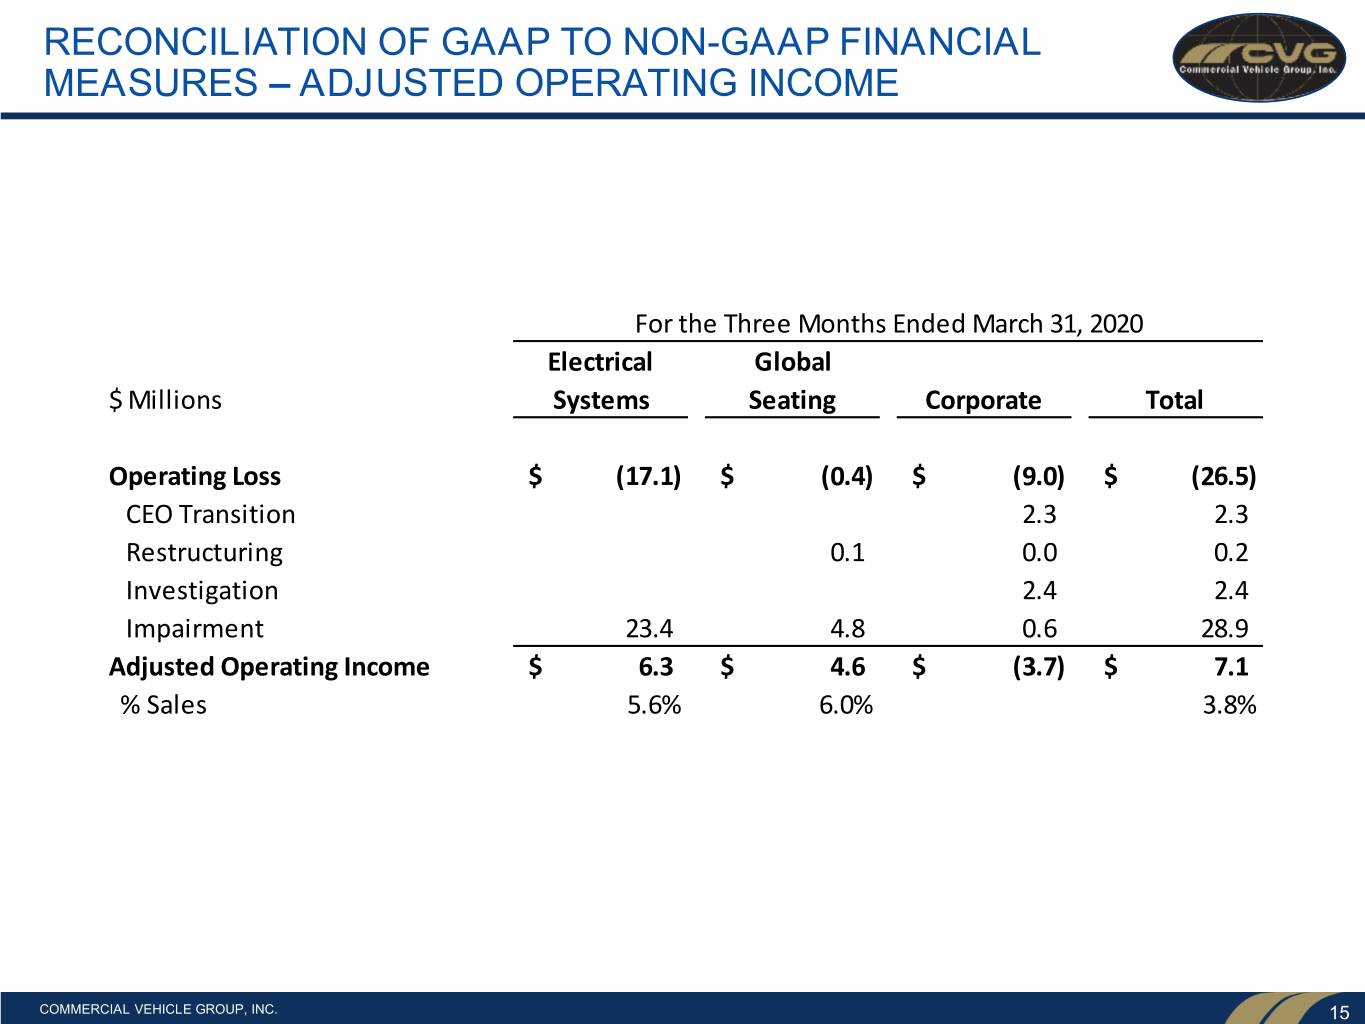
RECONCILIATION OF GAAP TO NON-GAAP FINANCIAL MEASURES – ADJUSTED OPERATING INCOME For the Three Months Ended March 31, 2020 Electrical Global $ Millions Systems Seating Corporate Total Operating Loss $ (17.1) $ (0.4) $ (9.0) $ (26.5) CEO Transition 2.3 2.3 Restructuring 0.1 0.0 0.2 Investigation 2.4 2.4 Impairment 23.4 4.8 0.6 28.9 Adjusted Operating Income $ 6.3 $ 4.6 $ (3.7) $ 7.1 % Sales 5.6% 6.0% 3.8% COMMERCIAL VEHICLE GROUP, INC. 15
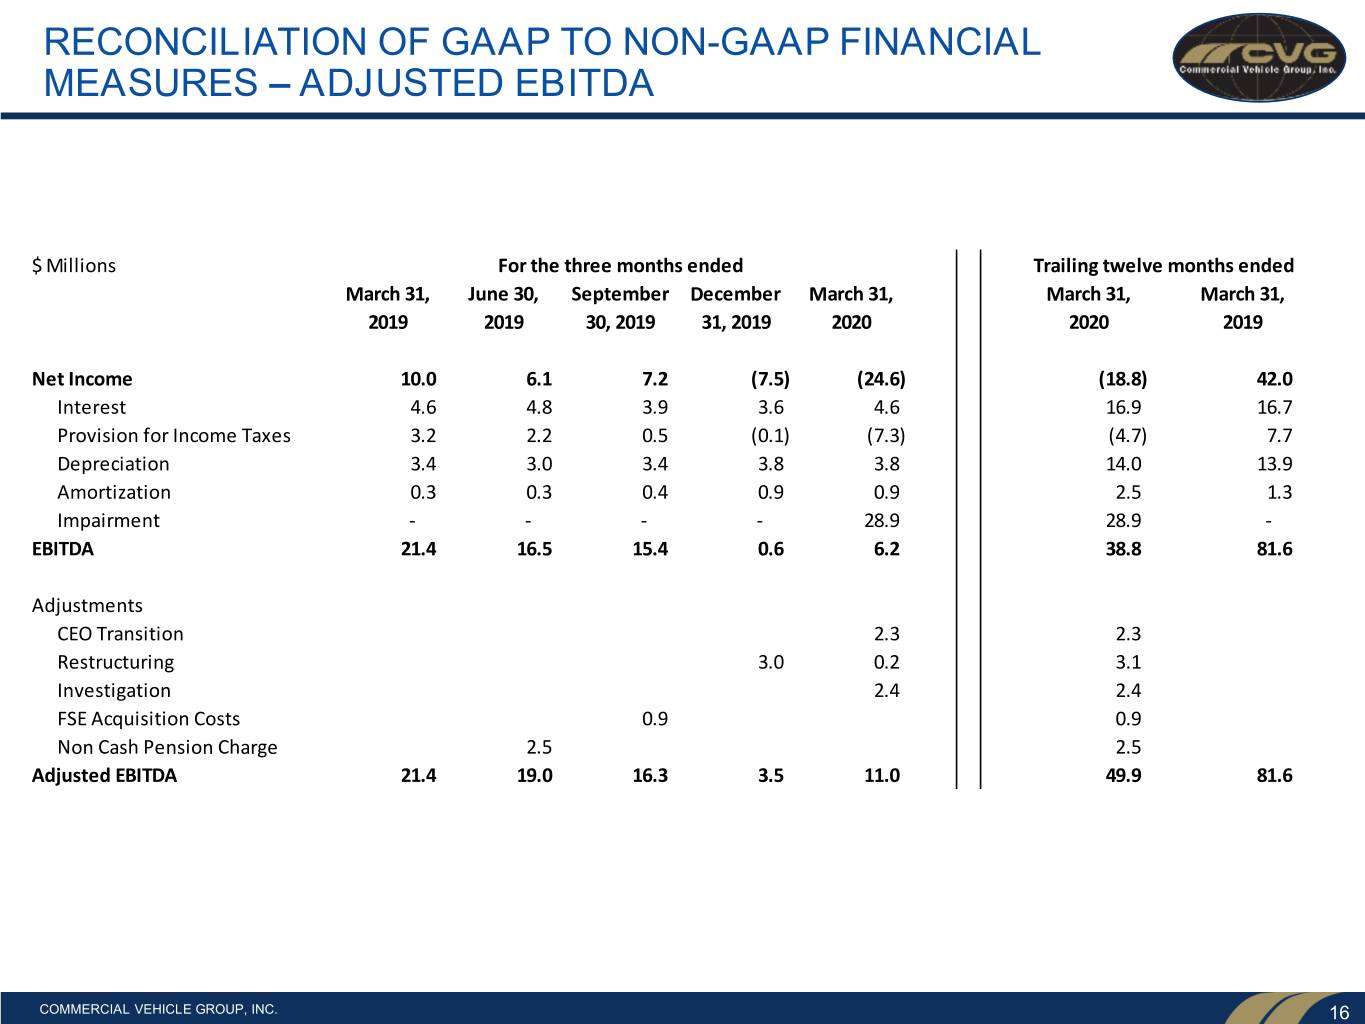
RECONCILIATION OF GAAP TO NON-GAAP FINANCIAL MEASURES – ADJUSTED EBITDA $ Millions For the three months ended Trailing twelve months ended March 31, June 30, September December March 31, March 31, March 31, 2019 2019 30, 2019 31, 2019 2020 2020 2019 Net Income 10.0 6.1 7.2 (7.5) (24.6) (18.8) 42.0 Interest 4.6 4.8 3.9 3.6 4.6 16.9 16.7 Provision for Income Taxes 3.2 2.2 0.5 (0.1) (7.3) (4.7) 7.7 Depreciation 3.4 3.0 3.4 3.8 3.8 14.0 13.9 Amortization 0.3 0.3 0.4 0.9 0.9 2.5 1.3 Impairment - - - - 28.9 28.9 - EBITDA 21.4 16.5 15.4 0.6 6.2 38.8 81.6 Adjustments CEO Transition 2.3 2.3 Restructuring 3.0 0.2 3.1 Investigation 2.4 2.4 FSE Acquisition Costs 0.9 0.9 Non Cash Pension Charge 2.5 2.5 Adjusted EBITDA 21.4 19.0 16.3 3.5 11.0 49.9 81.6 COMMERCIAL VEHICLE GROUP, INC. 16