
First United Corp 8-K, filed Jan 29, 2020
First United Corp/Md/ (FUNC)
About this 8-K
First United Corp filed this 8-K on January 29, 2020.
Items reported
- Item 2.02: Financial results
- Item 7.01: Regulation FD disclosure
- Item 9.01: Financial statements and exhibits
UNITED STATES
SECURITIES AND EXCHANGE COMMISSION
Washington, D.C. 20549
FORM 8-K
CURRENT REPORT
PURSUANT TO SECTION 13 OR 15(d) OF THE
SECURITIES EXCHANGE ACT OF 1934
Date of Report (Date of earliest event reported): January 29, 2020
First United Corporation
(Exact name of registrant as specified in its charter)
| Maryland | 0-14237 | 52-1380770 |
| (State or other jurisdiction of | (Commission file number) | (IRS Employer |
| incorporation or organization) | Identification No.) |
19 South Second Street, Oakland, Maryland 21550
(Address of principal executive offices) (Zip Code)
(301) 334-9471
(Registrant’s telephone number, including area code)
N/A
(Former Name or Former Address, if Changed Since Last Report)
Check the appropriate box below if the Form 8-K filing is intended to simultaneously satisfy the filing obligations of the registrant under any of the following provisions:
| ¨ | Written communications pursuant to Rule 425 under the Securities Act (17 CFR 230.425) |
| ¨ | Soliciting material pursuant to Rule 14a-12 under the Exchange Act (17 CFR 240.14a-12) |
| ¨ | Pre-commencement communications pursuant to Rule 14d-2(b) under the Exchange Act (17 CFR 240.14d-2(b)) |
| ¨ | Pre-commencement communications pursuant to Rule 13e-4(c) under the Exchange Act (17 CFR 240.13e-4(c)) |
Securities registered pursuant to Section 12(b) of the Act:
| Title of each class | Trading Symbol(s) | Name of each exchange on which registered |
| Common stock | FUNC | Nasdaq Stock Market |
Indicate by check mark whether the registrant is an emerging growth company as defined in Rule 405 of the Securities Act of 1933 (17 CFR §230.405) or Rule 12b-2 of the Securities Exchange Act of 1934 (17 CFR §240.12b-2).
Emerging growth company ¨
If an emerging growth company, indicate by check mark if the registrant has elected not to use the extended transition period for complying with any new or revised financial accounting standards provided pursuant to Section 13(a) of the Exchange Act. ¨
INFORMATION TO BE INCLUDED IN THE REPORT
Item 2.02. Results of Operation and Financial Condition.
On January 29, 2020, First United Corporation (the “Corporation”) issued a press release describing its financial results for the three months and year ended December 31, 2019. A copy of the press release is furnished herewith as Exhibit 99.1.
The information contained in this Item 2.02 and in Exhibit 99.1 shall not be deemed “filed” for purposes of Section 18 of the Securities Exchange Act of 1934, as amended (the “Exchange Act”), or incorporated by reference in any filing under the Securities Act of 1933, as amended (the “Securities Act”), or the Exchange Act, except as shall be expressly set forth by specific reference in such a filing.
Item 7.01. Regulation FD Disclosure.
On January 30, 2020, the Corporation’s Chairman, President and Chief Executive Officer and its Chief Financial Officer, will meet with various investors to discuss the financial results for the three months and year ended December 31, 2019, as well as certain additional financial information contained in an updated investor presentation. The investor presentation is furnished herewith as Exhibit 99.2.
The information contained in this Item 7.01 and in Exhibit 99.2 shall not be deemed “filed” for purposes of Section 18 of the Exchange Act or incorporated by reference in any filing under the Securities Act or the Exchange Act, except as shall be expressly set forth by specific reference in such a filing.
Item 9.01. Financial Statements and Exhibits.
| (d) | Exhibits. |
The exhibits filed or furnished with this report are listed in the following Exhibit Index:
| Exhibit No. | Description |
| 99.1 | Press release dated January 29, 2020 (furnished herewith) |
| 99.2 | Investor Presentation dated January 29, 2020 (furnished herewith) |
| - 2 - |
SIGNATURES
Pursuant to the requirements of the Securities Exchange Act of 1934, the registrant has duly caused this report to be signed on its behalf by the undersigned hereunto duly authorized.
| FIRST UNITED CORPORATION | |||
| Dated: January 29, 2020 | By: | /s/ Tonya K. Sturm | |
| Tonya K. Sturm | |||
| Senior Vice President & CFO | |||
| - 3 - |
Exhibit 99.1
FIRST UNITED CORPORATION ANNOUNCES
FOURTH QUARTER and YEAR TO DATE 2019 EARNINGS
Execution of Strategy Drives Strong Earnings Per Share Growth of 23%, Year-Over-Year
Generated Loan Growth Across Regions Helping to Drive Future Net Interest Income
Company Files Supplemental Presentation with Additional Financial and Strategic Information
OAKLAND, MARYLAND—January 29, 2020: First United Corporation (NASDAQ: FUNC), a bank holding company and the parent company of First United Bank & Trust (the “Bank”), today announced earnings results for the three- and 12-month periods ended December 31, 2019.
Fourth Quarter 2019 Highlights:
| · | Consolidated net income increased 21% to $2.9 million compared to $2.4 million for the fourth quarter of 2018 |
| · | Basic and diluted net income per common share were both $.41 compared to $.34 for the fourth quarter of 2018, a 21% increase year-over-year |
| · | Robust loan growth of $55.0 million during the quarter was spread throughout all regions and was driven by commercial production, positioning the Bank for increased net interest income in 2020 |
| · | Wealth management assets under management continued to grow and were $1.2 billion at December 31, 2019 due to expansion of customer relationships and favorable market returns |
| · | Asset quality remains strong, with low delinquency and low net charge-offs |
Commenting on the Bank’s results, Carissa L. Rodeheaver, Chairman, President and Chief Executive Officer, said, “Through ongoing focus on more profitable banking segments, continuing to meet the needs of our growing customer base, and implementing cost-saving and efficiency initiatives, we grew our 2019 earnings per share (“EPS”) 23% over 2018. In addition, loan production demonstrated momentum throughout the year, culminating with strong fourth quarter loan growth. Deposit growth was robust in 2019, which allowed us to fully fund loans and to repay $55.0 million in wholesale deposits and borrowings. We continued to see solid growth in wealth management revenue as we capitalized on our differentiated capabilities in this highly-attractive segment of our business. The Bank is well-positioned for 2020 with a sound loan pipeline and plans to deepen relationships with our existing customers and to expand the customer base through our focus on technology and providing an excellent customer experience.”
Financial Highlights for the Comparable Periods of 2019 and 2018:
| · | Increased net interest income of $2.2 million for the year ended December 31, 2019, when compared to the same time period of 2018. |
| o | Stable margin despite pricing pressure, declining only 6 basis points year-over-year despite a 75 basis points decline in Federal rates |
| o | Controlled loan pricing while maintaining disciplined loan underwriting |
| o | Continued focus and execution growing non-interest bearing and low-cost core deposits |
| · | The ratio of the allowance for loan losses (“ALL”) to loans outstanding was 1.19% at December 31, 2019 and 1.10% at December 31, 2018. |
| o | A specific allocation on one commercial loan relationship in 2019 drove the increased level of the allowance |
| o | Total provision expense was $1.3 million as compared to $2.1 million for each of the years ended December 31, 2019 and 2018 |
| o | Improved asset quality, reduced historical loss factors and net loan recoveries offset the loan growth provision |
| · | Other operating income increased during 2019 when compared to 2018. |
| o | $1.1 million gain of Bank Owned Life Insurance (“BOLI”) proceeds in the third quarter of 2019 |
| o | A robust wealth management income increase of $.3 million due to expansion of customer relationships and favorable market returns |
| o | Debit card income increased $.2 million due to continued marketing promotions that encouraged electronic payment methods |
| · | Other operating expenses increased in 2019 when compared to 2018. |
| o | Salaries and benefits increased less than 2%, or $.5 million, when compared to 2018 |
| § | Annual merit increases, net severance expense and increased life and health insurance costs were the primary contributors to the increased expense |
| § | A voluntary employee separation program that became effective in the fourth quarter of 2019 resulted in the recognition of $.2 million in net severance expense in the fourth quarter of 2019 and is projected to provide salary and benefit savings in 2020 of approximately $1.4 million |
| o | Equipment, occupancy and technology expenses increased $1.1 million when compared to 2018 due to the upgrade of technology equipment and services and the associated maintenance costs, as well as the implementation of the final stages of branch modernization |
| - 2 - |
| o | Other real estate owned (“OREO”) expenses remained consistent with 2018 and were primarily due to valuation allowances from updated appraisals as we continue to work out OREO properties |
| o | Other miscellaneous expenses remained flat when compared to 2018 due to heightened focus on expense control. Increased legal and professional, fraud expenses, Visa processing fees, employee benefits expense and investor relations expense were offset by reductions in marketing, directors’ fees, consulting, dues and licenses, postage, office supplies, contract labor, trust department expenses and miscellaneous loan fees |
Balance Sheet Overview
Total assets at December 31, 2019 remained stable at $1.4 billion, with an increase of $58.5 million from December 31, 2018. During the year ended December 31, 2019, cash and interest-bearing deposits in other banks increased $26.4 million, the investment portfolio decreased $6.4 million and gross loans increased $44.4 million. The increase in cash was due to strong deposit growth, calls on the investment portfolio and commercial loan payoffs. Premises and equipment increased slightly by $.9 million due to modernization of our branch network, offset by normal depreciation during the year ended December 31, 2019. OREO balances decreased $2.5 million due to $2.6 million in sales of properties and $1.5 million in write-downs as a result of appraisals and lower selling prices, offset by additions of new properties of $1.6 million. Other assets decreased by $4.3 million, primarily due to a valuation adjustment in the pension asset as a result of the reduction in the pension plan’s discount rate. Total liabilities increased $49.6 million. This increase was attributable to the strong deposit growth of $74.5 million in 2019, offset by a decline in short-term borrowings of $29.0 million. The deposit growth during 2019 enabled the full repayment of the $40.0 million in overnight borrowings with correspondent banks that were on our balance sheet at December 31, 2018. Our Treasury Management overnight investment sweep increased $11.0 million as existing and new customers, particularly municipalities, grew their balances during the fourth quarter of 2019. Total shareholders’ equity increased $9.0 million in 2019 due to the increase in retained earnings.
Outstanding loans increased $44.4 million to $1.1 billion at December 31, 2019 when compared to December 31, 2018. Commercial real estate (“CRE”) loans increased $28.6 million due to expansion of customer relationships as well as an increase in small business loans, primarily in the fourth quarter of 2019, despite large payoffs during the first nine months of 2019. Acquisition and development (“A&D”) loans remained stable as new production offset amortization and payoffs. Commercial and industrial (“C&I”) loans increased $10.9 million, as new production of $22.8 million in the fourth quarter of 2019 offset amortization and payoffs received during the year. Residential mortgage loans increased $3.3 million, as construction loans converted into term loans. The consumer loan portfolio increased by $2.1 million due to new originations in our student loan portfolio.
| - 3 - |
2019 was a record year for commercial loan production at approximately $177.0 million. The production was offset by amortization and higher than normal payoffs, resulting in commercial and small business growth of approximately $44.0 million. Some of the larger loan payoffs from competitors resulted from borrowers refinancing as we maintained our underwriting and pricing standards. In addition, a portion of the production was in the commercial construction portfolio of which approximately $16.0 million remains to be funded during 2020. The commercial loan pipeline at December 31, 2019 remains strong at $61.0 million.
Total deposits at December 31, 2019 increased $74.5 million when compared to deposits at December 31, 2018. During 2019, non-interest bearing deposits increased $32.4 million. This growth was driven by both our retail market and our commercial market, as we continued to grow existing relationships as well as cultivate new relationships. Traditional savings accounts increased $2.7 million, as our Prime Saver product continued to be the savings product of choice. Total demand deposits decreased $3.8 million and total money market accounts increased $41.0 million, due primarily to growth in our variable rate Value money market account introduced in late 2018. Time deposits less than $100,000 decreased $2.9 million and time deposits greater than $100,000 increased $5.1 million. Growth in time deposits greater than $100,000 was primarily related to new deposits for a local municipality as well as new deposits in CDARs for a local hospital. In the fourth quarter of 2018, two brokered certificates of deposit (“CD”) were purchased to shift $25.0 million of overnight borrowings as a tool to manage interest rate risk. A $15.0 million brokered CD was fully repaid in November 2019 at its maturity, and the remaining $10.0 million brokered CD matures in May 2020.
The book value of the Corporation’s common stock was $17.71 per share at December 31, 2019, compared to $16.52 per share at December 31, 2018. At December 31, 2019, there were 7,110,022 outstanding shares of the Corporation’s common stock.
Income Statement Overview
Consolidated net income was $13.1 million for the year ended December 31, 2019, compared to $10.7 million for 2018. Basic and diluted net income per share for 2019 were both $1.85, compared to basic and diluted net income per share of $1.51 for 2018, a 23% increase. The increase in earnings was primarily due to an increase in net interest income of $2.2 million, a decrease in the provision for loan losses of $.8 million, an increase of $1.6 million in other operating income, and gains, offset by a $1.6 million increase in other operating expenses and an increase of $.6 million in income taxes. The net interest margins, on a fully tax equivalent (“FTE”) basis, for the years ended December 31, 2019 and 2018 were 3.68% and 3.74%, respectively.
Consolidated net income was $2.9 million for the fourth quarter of 2019, compared to $2.4 million for the same period of 2018, an increase of 21%. Basic and diluted net income per common share for the fourth quarter of 2019 were both $.41, compared to basic and diluted net income per common share of $.34 for the same period of 2018, also up 21%. The increase in earnings was primarily attributable to a $.4 million increase in net interest income, a decrease of $.3 million in provision for loan losses and an increase of $.3 million in other operating income, offset by a $.3 million increase in other operating expenses. Tax expense was up $.2 million as compared to the same quarter in 2018 due to the increase in earnings. The net interest margins, on an FTE basis, for the fourth quarter of 2019 and the fourth quarter of 2018 were 3.70% and 3.74%, respectively.
| - 4 - |
Net-Interest Income (Tax-Equivalent Basis -Non-GAAP)
Net interest income, on an non-GAAP, FTE basis, increased $2.3 million (5.1%) during the year ended December 31, 2019 when compared to the year ended December 31, 2018 due to a $5.7 million (10.7%) increase in interest income, offset by a $3.4 million (42.1%) increase in interest expense. The net interest margin for the year ended December 31, 2019 was 3.68%, compared to 3.74% for the year ended December 31, 2018, declining only 6 basis points despite a 75 basis point drop in the Fed rates.
Comparing 2019 to 2018, the increase in interest income was due to a $5.1 million increase in interest and fees on loans. The increase in interest and fees on loans was due primarily to an increase in average balances of $57.0 million related to the strong loan growth in 2018 and an increase in the rate earned of 24 basis points attributable to loans repricing early in 2019, prior to the start of the declining interest rate environment. Excess cash balances due to deposit growth early in the year were invested at the lower Fed Funds rate until deployed in the fourth quarter for loan growth. This negatively impacted interest income for the year ended December 31, 2019.
Interest expense on our interest-bearing liabilities increased $3.4 million during the year ended December 31, 2019 when compared to 2018, due primarily to increased rates implemented during 2018 and the first two quarters of 2019. Additionally, we experienced growth in our deposit products, primarily our money market and special rate certificates of deposit. In the latter half of 2019, deposit rates were reduced as a result of the Fed rate cuts and sales of a higher cost CD product was discontinued. Average growth of $31.0 million in our non-interest bearing accounts offset the higher interest expense and allowed us to effectively control our cost of deposits.
Net interest income, on a non-GAAP, FTE basis, increased $.5 million (3.9%) during the fourth quarter of 2019 over the same period in 2018 due to a $.9 million (6.4%) increase in interest income, offset by a $.4 million (18.2%) increase in interest expense. The net interest margin for the fourth quarter of 2019 was 3.70%, compared to 3.74% for the fourth quarter of 2018.
Comparing the fourth quarter of 2019 to the same period of 2018, the increase in interest income was primarily due to a $.8 million increase in interest and fees on loans. The increase in interest and fees on loans was due primarily to an increase in average balances of $25.7 million related to the strong loan growth in 2018 and an increase in the rate earned of 20 basis points attributable to loans repricing at higher rates early in 2019, prior to the start of the declining interest rate environment. Excess cash balances related to deposit growth and loan payoffs during the first nine months of 2019 negatively impacted interest income until deployed into higher yielding loans in the fourth quarter.
| - 5 - |
Interest expense on our interest-bearing liabilities increased $.4 million during the fourth quarter of 2019 when compared to the same period of 2018, due primarily to increased interest expense on deposits due to the strong deposit growth as well as the increased rates early in 2019, as we offered product specials and increased pricing on the full relationship customer.
The average balance on interest-bearing deposits increased $65.2 million when comparing 2019 to 2018. The rate paid on these deposits increased by 38 basis points during the same time due to increased rates on a special money market product in response to the rising interest rate environment in 2018. The rate paid on short-term borrowings decreased 41 basis points as a result of the repayment of $40.0 million of higher-rate overnight borrowings in the first quarter of 2019. As a result of this repayment, the average balance on short-term borrowings comparing year-over-year decreased by $19 million. The average balance on long-term borrowings decreased $5.3 million when compared to 2018 as a result of the shift of $15.0 million of an FHLB advance from long-term to short-term borrowings at its maturity in April 2018. In the fourth quarter of 2018, two brokered CDs were purchased to shift $25.0 million of overnight borrowings as a tool to manage interest rate risk. As noted above, $15.0 million in brokered CDs were fully repaid in November 2019 at maturity and the remaining $10.0 million brokered CD matures in May 2020.
During December 2019, a $30 million FHLB advance was restructured to lower the interest rate by 38 basis points, with a slight extension of the maturity date. This restructuring will reduce future interest expense on long-term borrowings and serve to complement our interest sensitivity position.
Asset Quality
The ALL was $12.5 million at December 31, 2019 and $11.0 million at December 31, 2018. The provision for loan losses was $1.3 million for the year ended December 31, 2019 and $2.1 million for year ended December 31, 2018. Net recoveries of $.2 million were recorded for 2019, compared to net charge offs of $1.0 million for 2018. The ratio of the ALL to loans outstanding was 1.19% at December 31, 2019 and 1.10% at December 31, 2018.
The ratio of net recoveries to average loans for the year ended December 31, 2019 was an annualized .02%, compared to a net charge-off to average loans of .11% for the year ended December 31, 2018. The CRE portfolio had an annualized net recovery rate of .03% as of December 31, 2019, compared to a net charge-off rate of .33% as of December 31, 2018. The A&D loans had an annualized net recovery rate of .12% as of December 31, 2019, compared to a net recovery rate of .15% as of December 31, 2018. The C&I portfolio had net charge-offs to average loans of .04% as of December 31, 2019, compared to a net recovery rate of .06% as of December 31, 2018. The residential mortgage ratios were a net recovery rate of .03% as of December 31, 2019, compared to a net charge-off rate of .01% as of December 31, 2018, and the consumer loan ratios were net charge-off rates of .49% and .95% as of December 31, 2019 and December 31, 2018, respectively. Our special assets team continues to aggressively collect on charged-off loans.
| - 6 - |
Non-accrual loans totaled $10.8 million at December 31, 2019, compared to $4.9 million at December 31, 2018. The increase in non-accrual balances at December 31, 2019 was primarily related to one large A&D loan totaling $7.9 million that is a participation development loan originally booked in 2013. This loan is serviced by another lender and is now under a forbearance agreement. Management believes that the specific allocation for this loan of $2.1 million at December 31, 2019 is adequate based upon an appraisal obtained in the second quarter of 2019. Discussions are underway for the sale of the property or notes and management expects resolution in the near future.
Non-accrual loans that have been subject to partial charge-offs totaled $.1 million at December 31, 2019, compared to $.3 million at December 31, 2018. Loans secured by 1-4 family residential real estate properties in the process of foreclosure were $.1 million at both December 31, 2019 and December 31, 2018.
As a percentage of the loan portfolio, accruing loans past due 30 days or more decreased to .33%, compared to 1.10% at December 31, 2018. The decrease for 2019 was primarily related to the one large relationship in the commercial A&D portfolio that moved to non-accrual status in the first quarter of 2019 as mentioned above.
Non-Interest Income and Non-Interest Expense
Other operating income, including gains, increased $1.6 million for the year ended December 31, 2019 when compared to 2018. The increase was primarily attributable to the $1.1 million gain from BOLI death benefit proceeds in the third quarter of 2019. Trust and brokerage income increased $.3 million due to expansion of customer relationships and favorable market returns and debit card income increased $.2 million due to increased usage resulting from our new technology and marketing promotions when comparing 2019 to 2018. Service charge income remained flat for the year ended December 31, 2019 when compared to 2018.
Other operating expenses increased $1.6 million for the year ended December 31, 2019 when compared to 2018. Salaries and benefits increased $.5 million due to annual merit increases, increased life and health insurance costs related to increased claims, and severance expenses related to a voluntary employee separation program that became effective in the fourth quarter of 2019. These increases were partially offset by decreases in incentives and pension and 401(k) plan expenses. The voluntary employee separation program resulted in the recognition of $.2 million in net severance expense in the fourth quarter of 2019 and is projected to provide salary and benefit savings in 2020 of approximately $1.4 million. FDIC premiums decreased $.2 million due to credits received on our quarterly assessments. Equipment, occupancy and technology expenses increased $1.1 million when compared to 2018, due to the upgrade of technology equipment and services and the associated maintenance costs, as well as the implementation of the final stages of branch modernization. OREO expenses remained consistent with 2018 and were primarily due to valuation allowances from updated appraisals and reduced prices to encourage quicker sales. Other miscellaneous expenses remained flat when compared to 2018 due to heightened focus on expense control. Increased legal and professional, fraud expenses, Visa processing fees, employee benefits expense and investor relations expense were offset by reductions in marketing, directors’ fees, consulting, dues and licenses, postage, office supplies, contract labor, trust department expenses and miscellaneous loan fees.
| - 7 - |
The effective income tax rate as a percentage of income for the year ended December 31, 2019 decreased from 20.6% to 20.3% when compared to 2018, primarily due to the tax exempt BOLI death benefit gain of $1.1 million received in the third quarter of 2019.
Total other operating income, including gains, increased $.3 million during the fourth quarter of 2019 when compared to the same period of 2018. This increase was primarily attributable to a $.1 million increase in trust and brokerage income due to expansion of customer relationships and favorable market returns and an increase of $.1 million in gains when comparing the two periods.
Other operating expenses for the fourth quarter of 2019 increased slightly by $.3 million when compared to the fourth quarter of 2018. This increase resulted from a $.3 million increase in equipment, occupancy and data processing expenses and a $.5 million increase in other miscellaneous expenses, such as marketing, legal and professional, consulting, dues and licenses, contract labor, trust department expense and miscellaneous loan fees. These increases were offset by a $.5 million decrease in OREO expenses due to lower OREO balances.
On January 30, 2020, Company representatives will meet with various investors to discuss the foregoing results, as well as certain additional financial information about the Company that is contained in an updated investor presentation. The investor presentation is available to all investors through the Company’s investor relations webpage at http://investors.mybank.com/.
ABOUT FIRST UNITED CORPORATION
First United Corporation is the parent company of First United Bank & Trust, a Maryland trust company with commercial banking powers, and two statutory trusts that were used as financing vehicles. The Bank has four wholly-owned subsidiaries: OakFirst Loan Center, Inc., a West Virginia finance company; OakFirst Loan Center, LLC, a Maryland finance company; First OREO Trust, a Maryland statutory trust that holds and services real estate acquired by the Bank through foreclosure or by deed in lieu of foreclosure; and FUBT OREO I, LLC, a Maryland company that likewise holds and services real estate acquired by the Bank through foreclosure or by deed in lieu of foreclosure. The Bank also owns 99.9% of the limited partnership interests in Liberty Mews Limited Partnership; a Maryland limited partnership formed for the purpose of acquiring, developing and operating low-income housing units in Garrett County, Maryland. The Corporation’s website is www.mybank.com.
| - 8 - |
FORWARD-LOOKING STATEMENTS
This press release contains forward-looking statements as defined by the Private Securities Litigation Reform Act of 1995. Forward-looking statements do not represent historical facts, but are statements about management’s beliefs, plans and objectives about the future, as well as its assumptions and judgments concerning such beliefs, plans and objectives. These statements are evidenced by terms such as “anticipate,” “estimate,” “should,” “expect,” “believe,” “intend,” and similar expressions. Although these statements reflect management’s good faith beliefs and projections, they are not guarantees of future performance and they may not prove true. These projections involve risk and uncertainties that could cause actual results to differ materially from those addressed in the forward-looking statements. For a discussion of these risks and uncertainties, see the section of the periodic reports that First United Corporation files with the Securities and Exchange Commission entitled “Risk Factors”.
| - 9 - |
| FIRST UNITED CORPORATION |
| Oakland, MD |
| Stock Symbol : FUNC |
| Financial Highlights - Unaudited |
(Dollars in thousands, except per share data)
| Three Months Ended | Twelve Months Ended | ||||||||||||||||||||
| December 31, | December 31, | September 30, | June 30, | March 31, | December 31, | ||||||||||||||||
| 2019 | 2018 | 2019 | 2019 | 2019 | 2019 | 2018 | |||||||||||||||
| Results of Operations: | |||||||||||||||||||||
| Interest income | $ | 14,837 | $ | 13,944 | $ | 14,600 | $ | 14,411 | $ | 14,072 | $ | 57,920 | $ | 52,294 | |||||||
| Interest expense | 2,915 | 2,468 | 3,004 | 2,884 | 2,726 | $ | 11,529 | 8,112 | |||||||||||||
| Net interest income | 11,922 | 11,476 | 11,596 | 11,527 | 11,346 | $ | 46,391 | 44,182 | |||||||||||||
| Provision for loan losses | 651 | 924 | (13 | ) | 333 | 349 | $ | 1,320 | 2,111 | ||||||||||||
| Other operating income | 3,992 | 3,833 | 5,028 | 3,909 | 3,707 | $ | 16,636 | 15,041 | |||||||||||||
| Net gains/(losses) | 63 | (63 | ) | 40 | 30 | 14 | $ | 147 | 127 | ||||||||||||
| Other operating expense | 11,712 | 11,403 | 11,246 | 11,741 | 10,690 | $ | 45,389 | 43,808 | |||||||||||||
| Income before taxes | $ | 3,614 | $ | 2,919 | $ | 5,431 | $ | 3,392 | $ | 4,028 | $ | 16,465 | $ | 13,431 | |||||||
| Income tax expense | 731 | 537 | 938 | 790 | 877 | $ | 3,358 | 2,764 | |||||||||||||
| Net income | $ | 2,883 | $ | 2,382 | $ | 4,493 | $ | 2,602 | $ | 3,151 | $ | 13,129 | $ | 10,667 | |||||||
| Per share data: | |||||||||||||||||||||
| Basic/ Diluted Net Income | $ | 0.41 | $ | 0.34 | $ | 0.63 | $ | 0.37 | $ | 0.44 | |||||||||||
| Dividends declared per share | $ | 0.13 | $ | 0.09 | $ | 0.13 | $ | 0.09 | $ | 0.09 | |||||||||||
| Book value | $ | 17.71 | $ | 16.52 | $ | 18.20 | $ | 17.75 | $ | 17.27 | |||||||||||
| Tangible book value per share | $ | 16.17 | $ | 15.34 | $ | 16.65 | $ | 16.20 | $ | 15.71 | |||||||||||
| Closing market value | $ | 24.09 | $ | 15.92 | $ | 22.00 | $ | 19.71 | $ | 17.26 | |||||||||||
| Market Range: | |||||||||||||||||||||
| High | $ | 24.80 | $ | 19.91 | $ | 23.24 | $ | 20.49 | $ | 17.99 | |||||||||||
| Low | $ | 21.82 | $ | 14.75 | $ | 19.03 | $ | 17.10 | $ | 15.45 | |||||||||||
| Shares outstanding at period end | 7,110,022 | 7,086,632 | 7,107,666 | 7,105,775 | 7,088,987 | ||||||||||||||||
| Performance ratios: (Year to Date Period End, annualized) | |||||||||||||||||||||
| Return on average assets | 0.93 | % | 0.81 | % | 0.97 | % | 0.83 | % | 0.91 | % | |||||||||||
| Return on average shareholders' equity | 10.44 | % | 9.39 | % | 10.96 | % | 9.47 | % | 10.64 | % | |||||||||||
| Net interest margin | 3.70 | % | 3.74 | % | 3.67 | % | 3.70 | % | 3.72 | % | |||||||||||
| Efficiency ratio | 69.04 | % | 71.20 | % | 68.30 | % | 69.93 | % | 69.40 | % | |||||||||||
| - 10 - |
| December 31, | December 31, | |||||||
| 2019 | 2018 | |||||||
| Financial Condition at period end: | ||||||||
| Assets | $ | 1,442,966 | $ | 1,384,516 | ||||
| Earning assets | $ | 1,270,747 | $ | 1,235,066 | ||||
| Gross loans | $ | 1,052,118 | $ | 1,007,714 | ||||
| Commercial Real Estate | $ | 335,504 | $ | 306,921 | ||||
| Acquisition and Development | $ | 117,890 | $ | 118,360 | ||||
| Commercial and Industrial | $ | 122,352 | $ | 111,466 | ||||
| Residential Mortgage | $ | 440,173 | $ | 436,907 | ||||
| Consumer | $ | 36,199 | $ | 34,060 | ||||
| Investment securities | $ | 225,284 | $ | 231,651 | ||||
| Total deposits | $ | 1,142,031 | $ | 1,067,527 | ||||
| Noninterest bearing | $ | 294,649 | $ | 262,250 | ||||
| Interest bearing | $ | 847,382 | $ | 805,277 | ||||
| Shareholders' equity | $ | 125,940 | $ | 117,066 | ||||
| Capital ratios: | ||||||||
| Tier 1 to risk weighted assets | 15.17 | % | 14.87 | % | ||||
| Common Equity Tier 1 to risk weighted assets | 12.79 | % | 12.45 | % | ||||
| Tier 1 Leverage | 11.77 | % | 11.47 | % | ||||
| Total risk based capital | 16.29 | % | 15.91 | % | ||||
| Asset quality: | ||||||||
| Net charge-offs/(recoveries) for the quarter | $ | 85 | $ | 200 | ||||
| Nonperforming assets: (Period End) | ||||||||
| Nonaccrual loans | $ | 10,849 | $ | 4,922 | ||||
| Loans 90 days past due and accruing | 725 | 430 | ||||||
| Total nonperforming loans and 90 day past due | $ | 11,574 | $ | 5,352 | ||||
| Restructured loans | $ | 4,166 | $ | 4,864 | ||||
| Other real estate owned | $ | 4,127 | $ | 6,598 | ||||
| Allowance for loan losses to gross loans | 1.19 | % | 1.10 | % | ||||
| Nonperforming and 90 day past due loans to total loans | 1.10 | % | 0.54 | % | ||||
| Nonperforming loans and 90 day past due loans to total assets | 0.80 | % | 0.39 | % | ||||
| - 11 - |
Exhibit 99.2
Investor Presentation January 29, 2020
2 2 Forward looking statements This presentation contains “forward - looking statements” within the meaning of The Private Securities Litigation Reform Act of 1995 relating to, among other things, First United Corporation’s plans, strategies, objectives, expectations, intentions and adequacy of resources. You should be aware of the speculative nature of forward - looking statements. Statements that are not historical in nature, including those that include the words “anticipate”, “estimate”, “will”, “should”, “expect”, “believe”, “intend”, and similar expressions, are based on current expectations, estimates and projections about, among other things, the industry and the markets in which we operate, and they are not guarantees of future performance. Whether actual results will conform to expectations and predictions is subject to known and unknown risks and uncertainties. Actual results could be materially different from management’s expectations. This presentation should be read in conjunction with our Annual Report on Form 10 - K for the year ended December 31, 2018 including the sections of the report entitled “Risk Factors”, as well as the subsequent reports and other documents that we have filed, and that we file in the future, with the Securities and Exchange Commission (“SEC”), which are or will be available on the SEC’s website at www.sec.gov or at our website at www.mybank.com . Except as required by law, we do not intend to publish updates or revisions of any forward - looking statements we make to reflect new information, future events or otherwise.
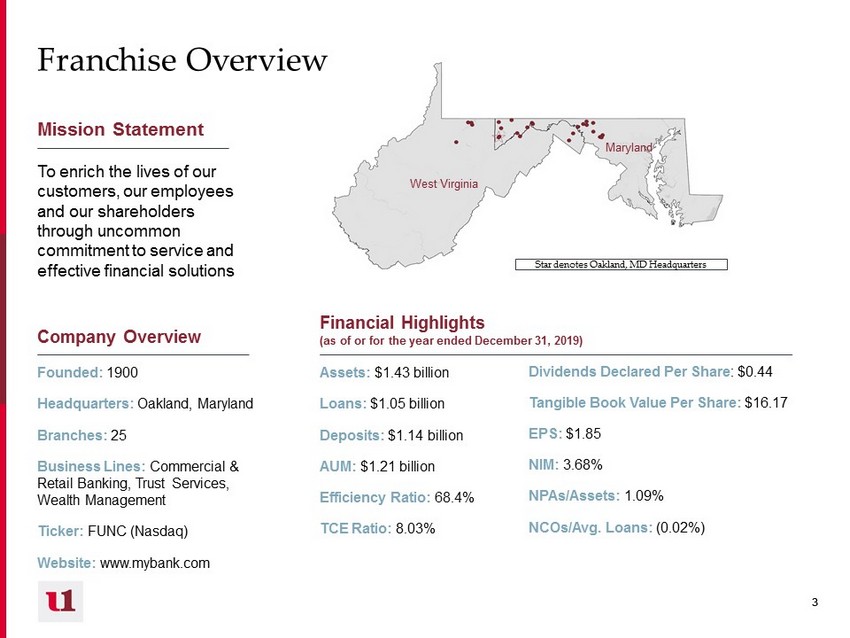
3 3 Mission Statement To enrich the lives of our customers, our employees and our shareholders through uncommon commitment to service and effective financial solutions Company Overview Founded: 1900 Headquarters: Oakland, Maryland Branches: 25 Business Lines: Commercial & Retail Banking, Trust Services, Wealth Management Ticker: FUNC (Nasdaq) Website: www.mybank.com Financial Highlights (as of or for the year ended December 31, 2019) Assets: $ 1.43 billion Loans: $ 1.05 billion Deposits: $1.14 billion AUM: $1.21 billion Efficiency Ratio: 68.4 % TCE Ratio: 8.03% Dividends Declared Per Share : $ 0.44 Tangible Book Value Per Share: $ 16.17 EPS: $ 1.85 NIM: 3.68% NPAs/Assets: 1.09% NCOs/Avg. Loans: ( 0.02%) West Virginia Maryland Star denotes Oakland, MD Headquarters Franchise Overview
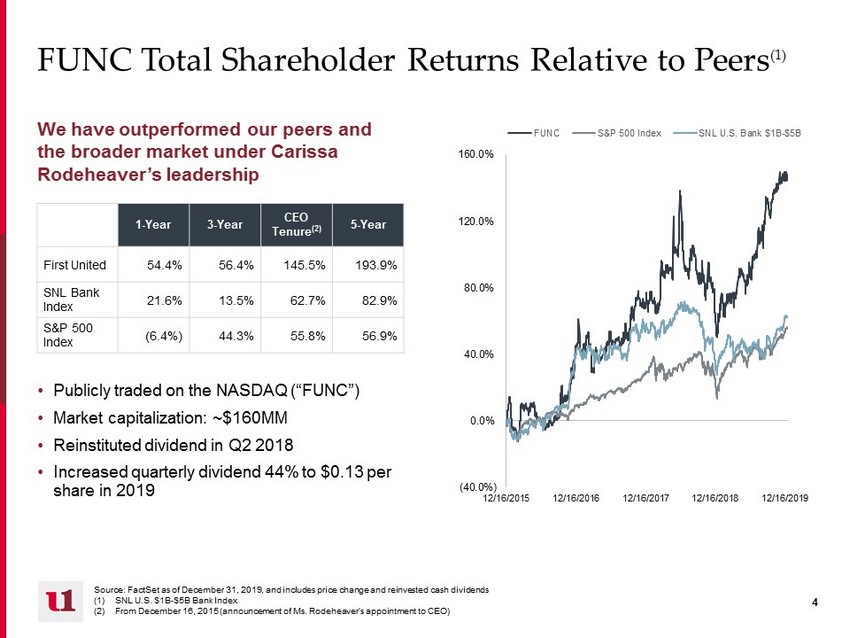
4 4 FUNC Total Shareholder Returns Relative to Peers (1) (40.0%) 0.0% 40.0% 80.0% 120.0% 160.0% 12/16/2015 12/16/2016 12/16/2017 12/16/2018 12/16/2019 FUNC S&P 500 Index SNL U.S. Bank $1B-$5B We have outperformed our peers and the broader market under Carissa Rodeheaver’s leadership Source: FactSet as of December 31, 2019, and includes price change and reinvested cash dividends (1) SNL U.S. $1B - $5B Bank Index (2) From December 16, 2015 (announcement of Ms. Rodeheaver’s appointment to CEO) 1 - Year 3 - Year CEO Tenure (2) 5 - Year First United 54.4 % 56.4% 145.5% 193.9% SNL Bank Index 21.6% 13.5% 62.7% 82.9% S&P 500 Index (6.4%) 44.3% 55.8% 56.9% • Publicly traded on the NASDAQ (“FUNC”) • Market capitalization: ~$160MM • Reinstituted dividend in Q2 2018 • Increased quarterly dividend 44% to $0.13 per share in 2019

5 5 Company History 1900 Founded as First National Bank of Oakland (MD) 1960 Acquired First National Bank of Friendsville (Garrett County, MD) 1963 Trust and Wealth Management Services first offered Late ‘60s Entered Allegany County, MD through acquisition of Cumberland Savings Bank 1988 Entered Mineral County, WV through acquisition of First National Bank of Piedmont 1993 Acquired Myersville Bank, entering Frederick and Washington counties (MD) 2003 Acquired 4 branches in Berkeley County, WV from Huntington Bank 2004 • Expanded into Monongalia County, WV • Issued $30.9 million Trust Preferred debentures 2009 Issued $30 million preferred stock (TARP), $7.2 million Trust Preferred debentures 2010 Issued $3.6 million Trust Preferred debentures 2015 Carissa Rodeheaver appointed to Chairman and CEO roles 2016 • Began branch transformation, opened office in Frederick County, MD using Relationship Advisor model • Redeemed $10 million of preferred stock 2017 • Expanded into Harrison County, WV with financial center • Completed $9.2 million rights offering, redeemed remaining $20 million preferred stock and $10.8 million Trust Preferred debentures 2018 Reinstituted quarterly dividend
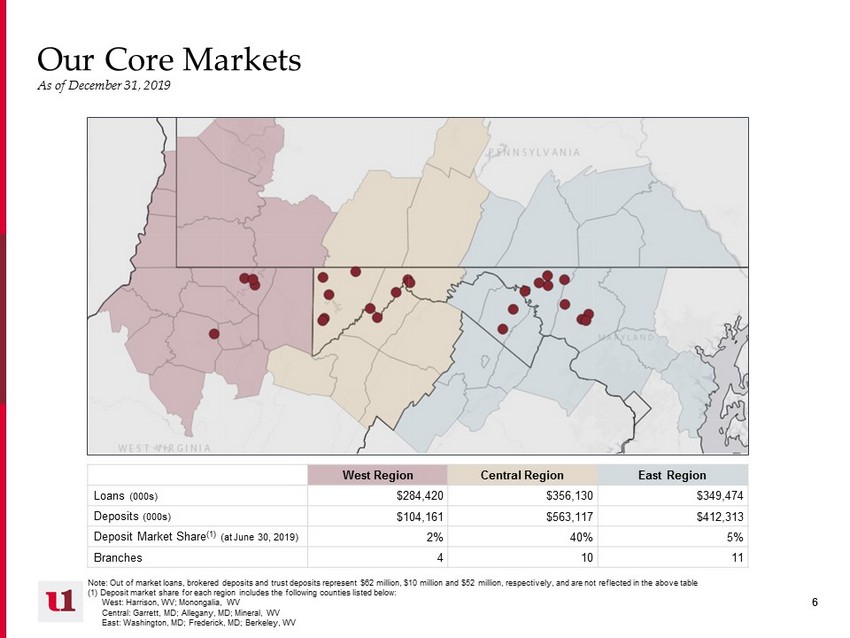
6 6 Our Core Markets As of December 31, 2019 Note: Out of market loans, brokered deposits and trust deposits represent $ 62 million, $10 million and $52 million, respectively, and are not reflected in the above table (1) Deposit market share for each region includes the following counties listed below: West: Harrison, WV; Monongalia, WV Central: Garrett, MD; Allegany, MD; Mineral, WV East: Washington, MD; Frederick, MD; Berkeley, WV West Region Central Region East Region Loans (000s) $ 284,420 $ 356,130 $349,474 Deposits (000s) $ 104,161 $563,117 $412,313 Deposit Market Share (1) (at June 30, 2019) 2% 40% 5% Branches 4 10 11
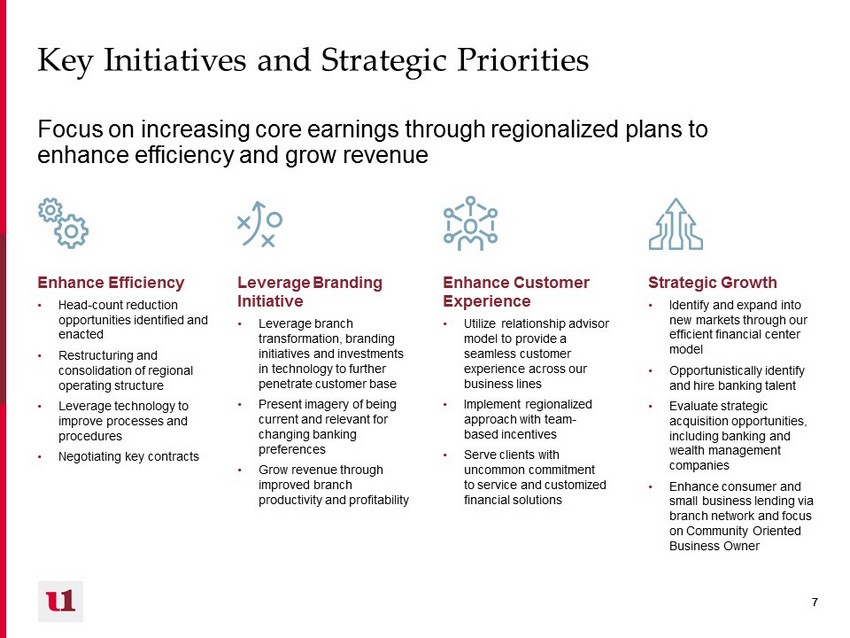
7 7 Key Initiatives and Strategic Priorities Focus on increasing core earnings through regionalized plans to enhance efficiency and grow revenue Enhance Efficiency • Head - count reduction opportunities identified and enacted • Restructuring and consolidation of regional operating structure • Leverage technology to improve processes and procedures • Negotiating key contracts Enhance Customer Experience • Utilize relationship advisor model to provide a seamless customer experience across our business lines • Implement regionalized approach with team - based incentives • Serve clients with uncommon commitment to service and customized financial solutions Strategic Growth • Identify and expand into new markets through our efficient financial center model • Opportunistically identify and hire banking talent • Evaluate strategic acquisition opportunities, including banking and wealth management companies • Enhance consumer and small business lending via branch network and focus on Community Oriented Business Owner Leverage Branding Initiative • Leverage branch transformation, branding initiatives and investments in technology to further penetrate customer base • Present imagery of being current and relevant for changing banking preferences • Grow revenue through improved branch productivity and profitability
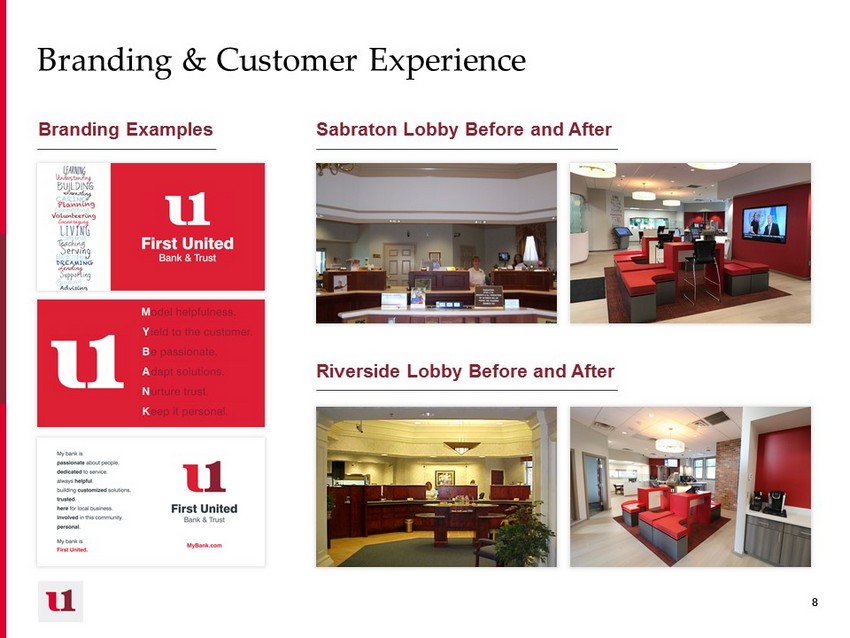
8 8 Branding & Customer Experience Branding Examples Sabraton Lobby Before and After Riverside Lobby Before and After
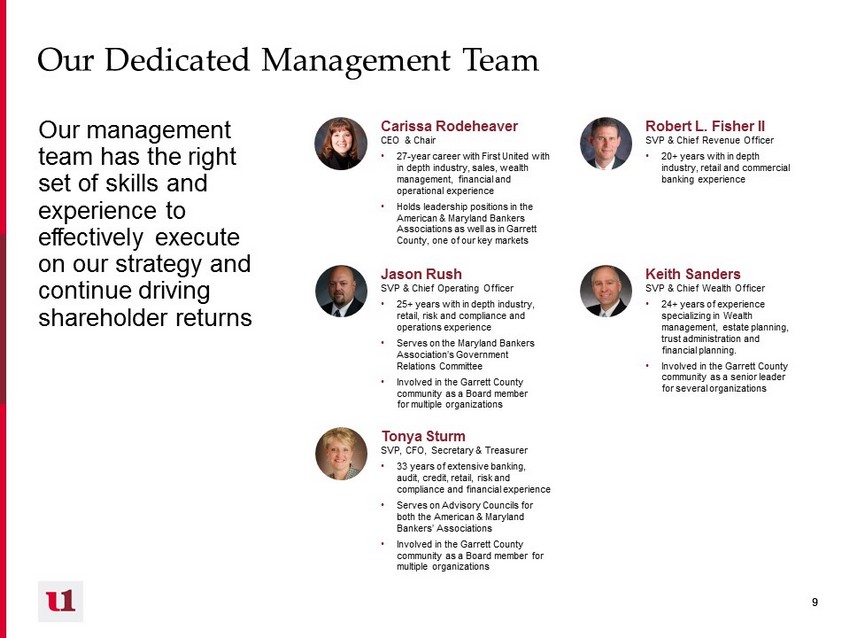
9 9 Our Dedicated Management Team Our management team has the right set of skills and experience to effectively execute on our strategy and continue driving shareholder returns Carissa Rodeheaver CEO & Chair • 27 - year career with First United with in depth industry, sales, wealth management, financial and operational experience • Holds leadership positions in the American & Maryland Bankers Associations as well as in Garrett County, one of our key markets Robert L. Fisher II SVP & Chief Revenue Officer • 20+ years with in depth industry, retail and commercial banking experience Jason Rush SVP & Chief Operating Officer • 25+ years with in depth industry, retail, risk and compliance and operations experience • Serves on the Maryland Bankers Association’s Government Relations Committee • Involved in the Garrett County community as a Board member for multiple organizations Keith Sanders SVP & Chief Wealth Officer • 24+ years of experience specializing in Wealth management, estate planning, trust administration and financial planning. • Involved in the Garrett County community as a senior leader for several organizations Tonya Sturm SVP, CFO, Secretary & Treasurer • 33 years of extensive banking, audit, credit, retail, risk and compliance and financial experience • Serves on Advisory Councils for both the American & Maryland Bankers’ Associations • Involved in the Garrett County community as a Board member for multiple organizations
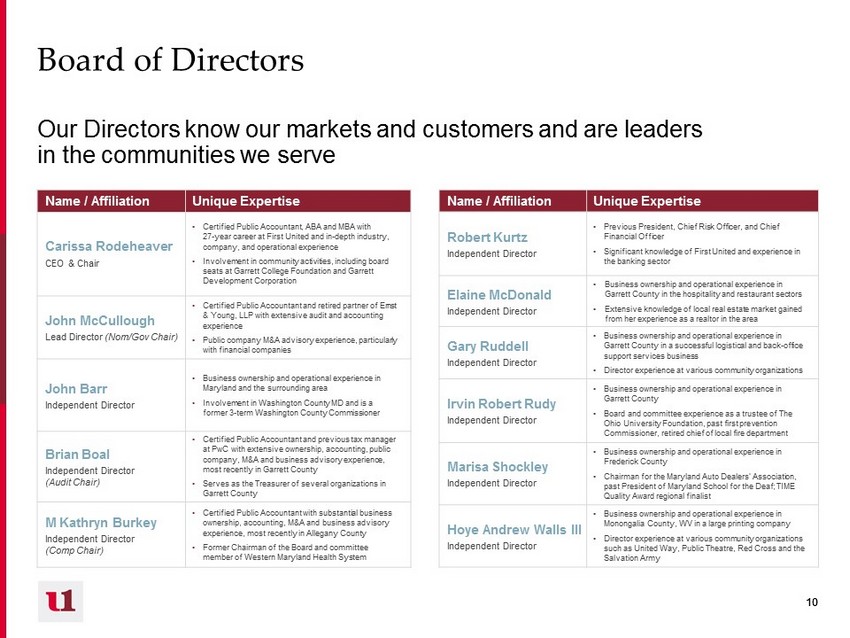
10 10 Board of Directors Our Directors know our markets and customers and are leaders in the communities we serve Name / Affiliation Unique Expertise Carissa Rodeheaver CEO & Chair • Certified Public Accountant, ABA and MBA with 27 - year career at First United and in - depth industry, company, and operational experience • Involvement in community activities, including board seats at Garrett College Foundation and Garrett Development Corporation John McCullough Lead Director (Nom/ Gov Chair) • Certified Public Accountant and retired partner of Ernst & Young, LLP with extensive audit and accounting experience • Public company M&A advisory experience, particularly with financial companies John Barr Independent Director • Business ownership and operational experience in Maryland and the surrounding area • Involvement in Washington County MD and is a former 3 - term Washington County Commissioner Brian Boal Independent Director (Audit Chair) • Certified Public Accountant and previous tax manager at PwC with extensive ownership, accounting, public company, M&A and business advisory experience, most recently in Garrett County • Serves as the Treasurer of several organizations in Garrett County M Kathryn Burkey Independent Director (Comp Chair) • Certified Public Accountant with substantial business ownership, accounting, M&A and business advisory experience, most recently in Allegany County • Former Chairman of the Board and committee member of Western Maryland Health System Name / Affiliation Unique Expertise Robert Kurtz Independent Director • Previous President, Chief Risk Officer, and Chief Financial Officer • Significant knowledge of First United and experience in the banking sector Elaine McDonald Independent Director • Business ownership and operational experience in Garrett County in the hospitality and restaurant sectors • Extensive knowledge of local real estate market gained from her experience as a realtor in the area Gary Ruddell Independent Director • Business ownership and operational experience in Garrett County in a successful logistical and back - office support services business • Director experience at various community organizations Irvin Robert Rudy Independent Director • Business ownership and operational experience in Garrett County • Board and committee experience as a trustee of The Ohio University Foundation, past first prevention Commissioner, retired chief of local fire department Marisa Shockley Independent Director • Business ownership and operational experience in Frederick County • Chairman for the Maryland Auto Dealers’ Association, past President of Maryland School for the Deaf; TIME Quality Award regional finalist Hoye Andrew Walls III Independent Director • Business ownership and operational experience in Monongalia County, WV in a large printing company • Director experience at various community organizations such as United Way, Public Theatre, Red Cross and the Salvation Army

11 11 Core Strengths Engaged and experienced board and management team with significant ties to our communities served Attractive core deposit franchise producing stable low - cost funding Diversified revenue stream driven by trust and brokerage fee income Innovative and forward thinking approach to attracting and retaining clients Robust Enterprise Risk Management system Passionate and engaged employees committed to customers and community
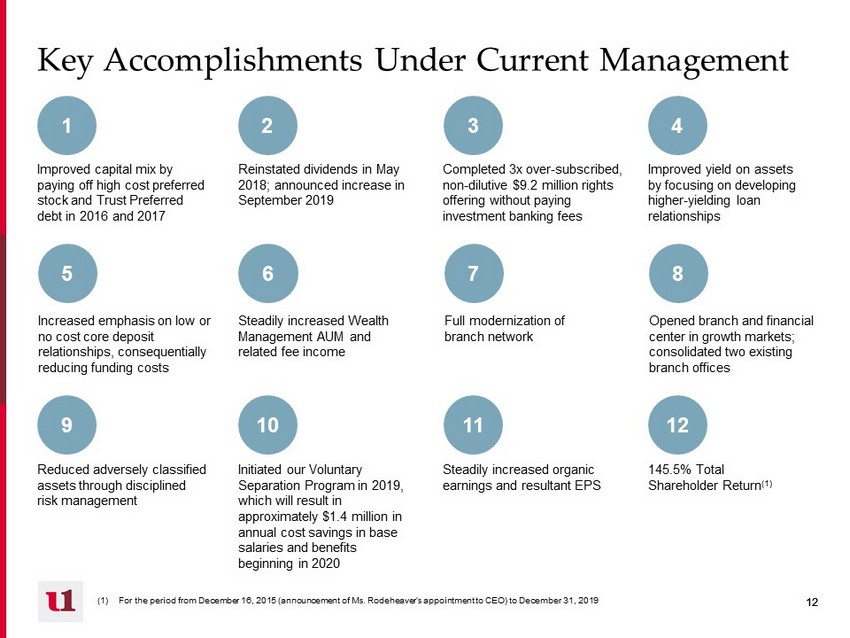
12 12 Key Accomplishments Under Current Management Improved capital mix by paying off high cost preferred stock and Trust Preferred debt in 2016 and 2017 Increased emphasis on low or no cost core deposit relationships, consequentially reducing funding costs Reinstated dividends in May 2018; announced increase in September 2019 Completed 3x over - subscribed, non - dilutive $9.2 million rights offering without paying investment banking fees Improved yield on assets by focusing on developing higher - yielding loan relationships Steadily increased Wealth Management AUM and related fee income Full modernization of branch network 1 2 3 4 5 6 7 Opened branch and financial center in growth markets; consolidated two existing branch offices 8 Reduced adversely classified assets through disciplined risk management Initiated our Voluntary Separation Program in 2019, which will result in approximately $1.4 million in annual cost savings in base salaries and benefits beginning in 2020 Steadily increased organic earnings and resultant EPS 145.5% Total Shareholder Return (1) 9 10 11 12 (1) For the period from December 16, 2015 (announcement of Ms. Rodeheaver’s appointment to CEO) to December 31, 2019

13 13 $839 $1,052 12/31/14 12/31/19 Financial Highlights Loans (MMs) 3.01% 3.68% 12/31/14 12/31/19 NIM (LTM) 5.15% 8.03% 12/31/14 12/31/19 TCE/TA $981 $1,142 12/31/14 12/31/19 Deposits (MMs) 74.2% 68.4% 12/31/14 12/31/19 Efficiency Ratio (LTM) 3.07% 1.09% 12/31/14 12/31/19 NPAs/Assets $10.92 $16.17 12/31/14 12/31/19 TBV Per Share $0.48 $1.85 12/31/14 12/31/19 Earnings Per Share (LTM) 0.49% - 0.02% 12/31/14 12/31/19 NCOs/Avg. Loans (LTM)
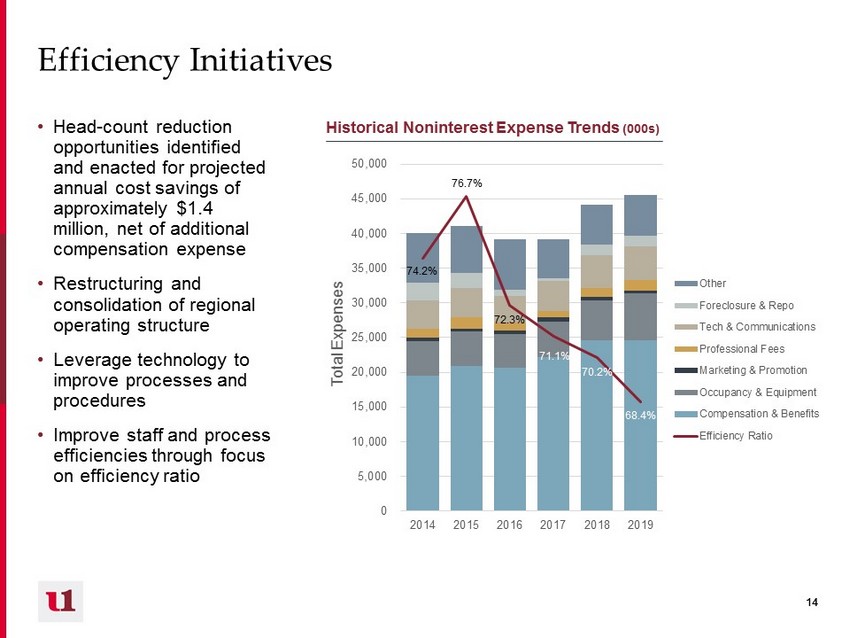
14 14 Efficiency Initiatives • Head - count reduction opportunities identified and enacted for projected annual cost savings of approximately $1.4 million, net of additional compensation expense • Restructuring and consolidation of regional operating structure • Leverage technology to improve processes and procedures • Improve staff and process efficiencies through focus on efficiency ratio Historical Noninterest Expense Trends (000s) 74.2% 76.7% 72.3% 71.1% 70.2% 68.4% 0 5,000 10,000 15,000 20,000 25,000 30,000 35,000 40,000 45,000 50,000 2014 2015 2016 2017 2018 2019 Total Expenses Other Foreclosure & Repo Tech & Communications Professional Fees Marketing & Promotion Occupancy & Equipment Compensation & Benefits Efficiency Ratio

15 15 2019 Highlights Highlights • Increased net interest income over 2018 through continued additions of a diversified mix of product and rate characteristics • Net interest margin remains stable despite declining rate environment • First United remains neutral to slightly asset sensitive • Slightly higher yield on earning assets; continued cost control on deposits • Reduced provision for loan losses based on loan balances and improved credit quality $13.1 million Net Income $ 1 .85 EPS 0.93% ROAA 10.44% ROAE 11.44% ROATCE • Fee income boosted by the receipt of $1.1 million in death benefit proceeds • Marginal increase in salaries and benefits over 2018 due to merit - based increases and increased health insurance costs; offset by reduced head - count and incentive pay • Loan production continues to be strong; partially offset by payoffs, amortization and disciplined underwriting standards • Strong liquidity position • Increased quarterly dividend from $0.09 per share to $0.13 per share Key Facts
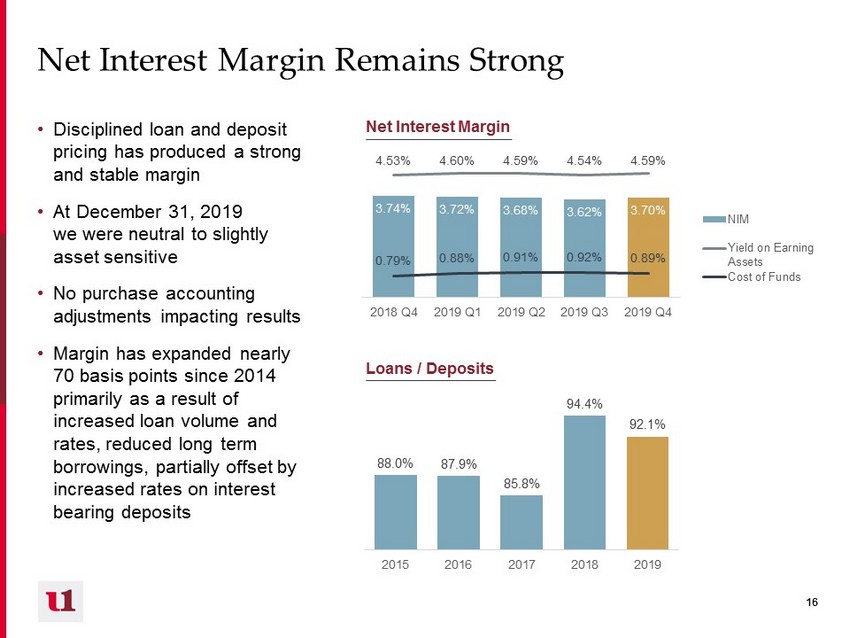
16 16 Net Interest Margin Remains Strong • Disciplined loan and deposit pricing has produced a strong and stable margin • At December 31, 2019 we were neutral to slightly asset sensitive • No purchase accounting adjustments impacting results • Margin has expanded nearly 70 basis points since 2014 primarily as a result of increased loan volume and rates, reduced long term borrowings, partially offset by increased rates on interest bearing deposits Net Interest Margin 88.0% 87.9% 85.8% 94.4% 92.1% 2015 2016 2017 2018 2019 Loans / Deposits 3.74% 3.72% 3.68% 3.62% 3.70% 4.53% 4.60% 4.59% 4.54% 4.59% 0.79% 0.88% 0.91% 0.92% 0.89% 2018 Q4 2019 Q1 2019 Q2 2019 Q3 2019 Q4 NIM Yield on Earning Assets Cost of Funds

17 17 Well Diversified Loan Portfolio • Balanced portfolio with growing focus on commercial credits, including small business loans • Geographically diverse construction and development portfolio with decreased concentration (down from over 20% in 2009) • Robust pipeline of $ 84 million as of 12/31/2019 • Decreased reliance on participations (reduced to 2.5% of portfolio from high of 10% in 2010) • Legal lending limit approximately $ 25 million per aggregate borrowing relationship Loan Portfolio Composition (12/31/19 ) Commercial / CRE Breakdown (12/31/19 ) Loan Type Balance (MMs) % Total 1 - 4 Family $ 440 42% CRE – OO $135 13% CRE – NOO $169 16% Multi - family $ 32 3% C&D $ 118 11% C&I $ 122 12% Other consumer $36 3 % Loan Type Balance (MMs) % Commercial Rentals $ 163 28% Residential Rentals $64 11% Subdividers , Developers, Builders $76 13% Medical and health services $29 5 % Hotels and lodging $38 7% Building materials $ 24 4% Services $72 13% Energy $7 1 % Retail $52 9 % All other $51 9%

18 18 Asset Quality • Management has diligently worked to improve asset quality while maintaining strong reserve levels • Underwriting guidelines and risk management framework have been enhanced • Focus on risk mitigation and managing of concentrations – CRE / Total Capital: 206% – ADC / Total Capital: 83% • Recent net recoveries a result of conservative and proactive credit culture 2.32% 2.44% 1.67% 1.17% 1.09% 2015 2016 2017 2018 2019 NPAs / Total Assets 0.14% 0.57% 0.28% 0.11% - 0.02% 2015 2016 2017 2018 12/31/19 NCOs (Recoveries)/Average Loans (LTM) 1.36% 1.11% 1.12% 1.10% 1.19% 2015 2016 2017 2018 12/31/19 ALLL/Loans Excluding one non - performing loan added in Q1 of $8.0 million, NPAs to TA would be 0.53%
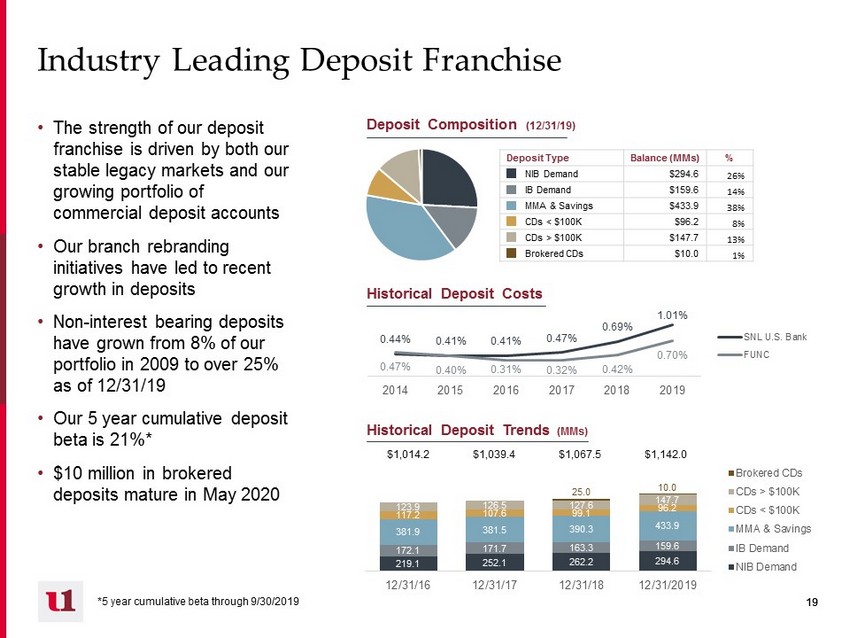
19 19 Industry Leading Deposit Franchise • The strength of our deposit franchise is driven by both our stable legacy markets and our growing portfolio of commercial deposit accounts • Our branch rebranding initiatives have led to recent growth in deposits • Non - interest bearing deposits have grown from 8% of our portfolio in 2009 to over 25% as of 12/31/19 • Our 5 year cumulative deposit beta is 21 %* • $ 10 million in brokered deposits mature in May 2020 Deposit Composition (12/31/19 ) 0.44% 0.41% 0.41% 0.47% 0.69% 1.01% 0.47% 0.40% 0.31% 0.32% 0.42% 0.70% 2014 2015 2016 2017 2018 2019 SNL U.S. Bank FUNC Historical Deposit Costs 219.1 252.1 262.2 294.6 172.1 171.7 163.3 159.6 381.9 381.5 390.3 433.9 117.2 107.6 99.1 96.2 123.9 126.5 127.6 147.7 25.0 10.0 12/31/16 12/31/17 12/31/18 12/31/2019 Brokered CDs CDs > $100K CDs < $100K MMA & Savings IB Demand NIB Demand Historical Deposit Trends (MMs) $1,014.2 $1,039.4 $1,067.5 $ 1,142.0 Deposit Type Balance (MMs) % NIB Demand $294.6 26% IB Demand $ 159.6 14% MMA & Savings $ 433.9 38% CDs < $100K $ 96.2 8 % CDs > $100K $ 147.7 13% Brokered CDs $10.0 1 % *5 year cumulative beta through 9/30/2019

20 20 Diversified Revenue Stream • Approximately 27% of revenues are derived from non - interest income • Brokerage and trust represent 48% of fee income • Implemented regional team approach and relationship advisor model to further focus on diversifying revenues and engaging our clients with our full suite of products and services Revenue Breakdown ($000s) Net Interest Income $46,391 Trust Revenue $7,148 Service Charges $3,158 Net Gain on Sales $147 Debit Card Income $2,706 Bank - owned Life Insurance $2,257 Brokerage $919 Other Noninterest Income $448 Revenue Mix – 2019 Revenues * Revenue Breakdown Trust Revenue 43% Service Charges 19% Net Gain on Sales 1% Debit Card Income 16% Bank - owned Life Insurance 13% Brokerage 5% Other Noninterest Income 3% Revenue Mix – 2019 NII* 73% 27% Total Non - Interest Income, excluding gains (MMs) AUM Trends (MMs) $13.5 $14.1 $14.3 $15.0 $16.6 2015 2016 2017 2018 2019 $958 $997 $1,104 $1,084 $1,212 2015 2016 2017 2018 2019 *Bank - owned life insurance includes $1.1 million in insurance benefit proceeds

21 21 Prudential Capital Management $12.75 $13.19 $13.78 $14.97 $16.17 2015 2016 2017 2018 2019 Growing Tangible Book – TBV/Share 6.08% 6.33% 7.35% 7.72% 8.03% 2015 2016 2017 2018 2019 Historical Capital Trends – TCE/TA 17.21% 16.71% 15.98% 15.91% 16.29% 2015 2016 2017 2018 2019 Historical Capital Trends – Total RBC Ratio* Regulatory Capital Composition (12/31/19 ) Loan Type Balance (MMs) % Tier 1 Common (CET1) 144 79% Additional Tier 1 Capital 27 15% Tier 2 Capital 12 6 % *2016 and 2017 capital ratios impacted by repayment of preferred stock (2016 and 2017) and Trust Preferred debentures (2017)
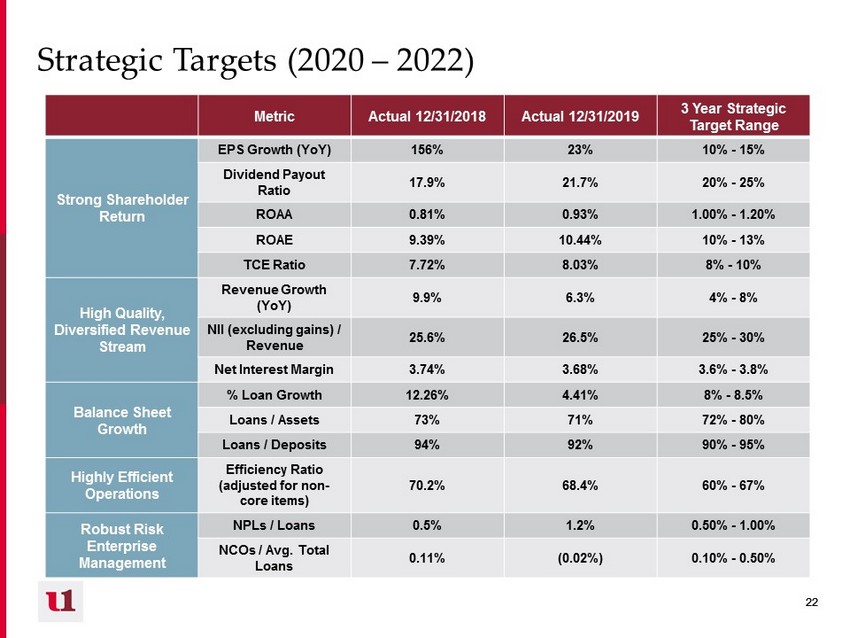
22 22 Strategic Targets (2020 – 2022) Metric Actual 12/31/2018 Actual 12/31/2019 3 Year Strategic Target Range Strong Shareholder Return EPS Growth (YoY) 156% 23% 10% - 15% Dividend Payout Ratio 17.9% 21.7% 20% - 25% ROAA 0.81% 0.93% 1.00% - 1.20% ROAE 9.39% 10.44% 10% - 13% TCE Ratio 7.72% 8.03% 8% - 10% High Quality, Diversified Revenue Stream Revenue Growth (YoY) 9.9% 6.3% 4% - 8% NII (excluding gains) / Revenue 25.6% 26.5% 25% - 30% Net Interest Margin 3.74% 3.68% 3.6% - 3.8% Balance Sheet Growth % Loan Growth 12.26% 4.41% 8% - 8.5% Loans / Assets 73% 71% 72% - 80% Loans / Deposits 94% 92% 90% - 95% Highly Efficient Operations Efficiency Ratio (adjusted for non - core items) 70.2% 68.4% 60% - 67% Robust Risk Enterprise Management NPLs / Loans 0.5% 1.2% 0.50% - 1.00% NCOs / Avg. Total Loans 0.11% (0.02%) 0.10% - 0.50%
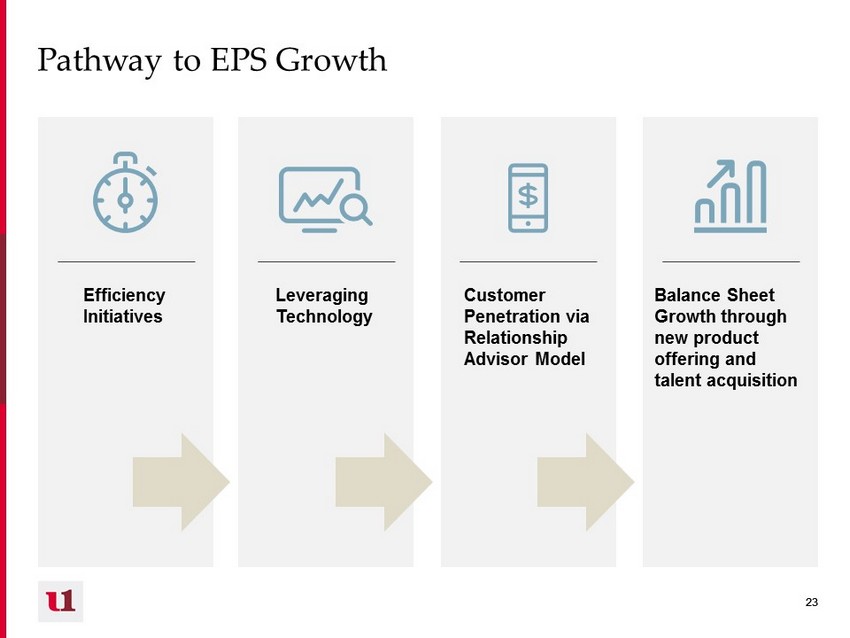
23 23 Pathway to EPS Growth Efficiency Initiatives Leveraging Technology Customer Penetration via Relationship Advisor Model Balance Sheet Growth through new product offering and talent acquisition
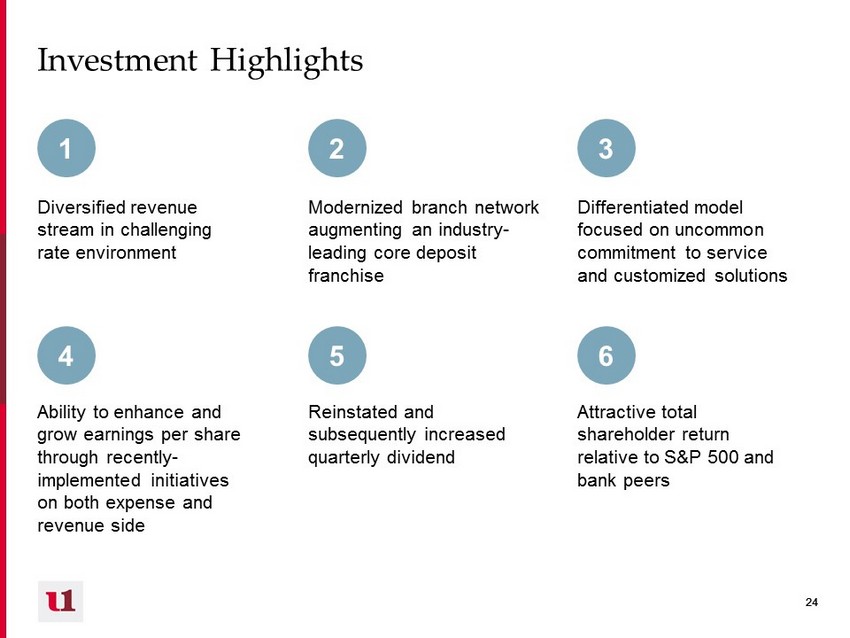
24 24 Investment Highlights Diversified revenue stream in challenging rate environment Modernized branch network augmenting an industry - leading core deposit franchise Differentiated model focused on uncommon commitment to service and customized solutions Ability to enhance and grow earnings per share through recently - implemented initiatives on both expense and revenue side Reinstated and subsequently increased quarterly dividend 1 2 3 4 5 Attractive total shareholder return relative to S&P 500 and bank peers 6
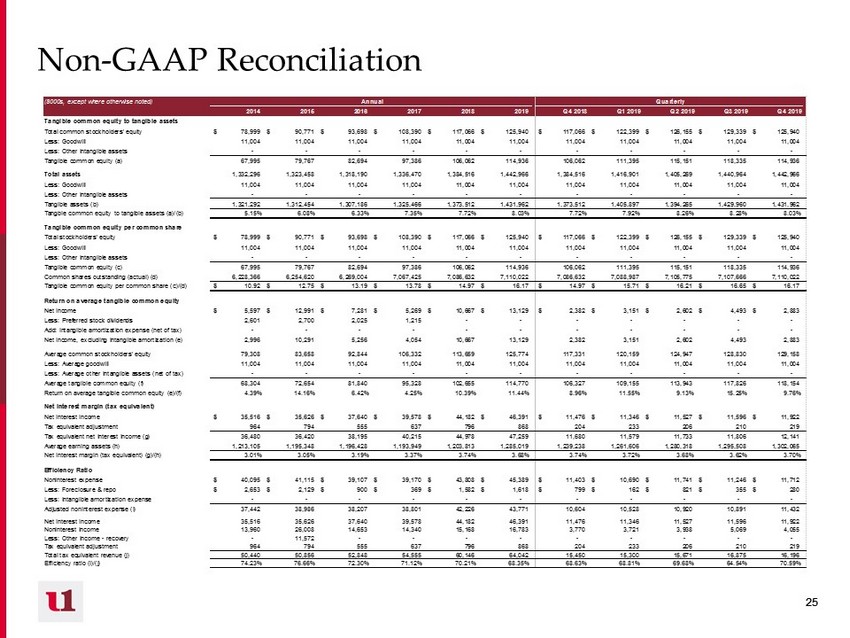
25 25 Non - GAAP Reconciliation ($000s, except where otherwise noted) Annual Quarterly 2014 2015 2016 2017 2018 2019 Q4 2018 Q1 2019 Q2 2019 Q3 2019 Q4 2019 Tangible common equity to tangible assets Total common stockholders' equity 78,999$ 90,771$ 93,698$ 108,390$ 117,066$ 125,940$ 117,066$ 122,399$ 126,155$ 129,339$ 125,940$ Less: Goodwill 11,004 11,004 11,004 11,004 11,004 11,004 11,004 11,004 11,004 11,004 11,004 Less: Other intangible assets - - - - - - - - - - - Tangible common equity (a) 67,995 79,767 82,694 97,386 106,062 114,936 106,062 111,395 115,151 118,335 114,936 Total assets 1,332,296 1,323,458 1,318,190 1,336,470 1,384,516 1,442,966 1,384,516 1,416,901 1,405,269 1,440,964 1,442,966 Less: Goodwill 11,004 11,004 11,004 11,004 11,004 11,004 11,004 11,004 11,004 11,004 11,004 Less: Other intangible assets - - - - - - - - - - - Tangible assets (b) 1,321,292 1,312,454 1,307,186 1,325,466 1,373,512 1,431,962 1,373,512 1,405,897 1,394,265 1,429,960 1,431,962 Tangble common equity to tangible assets (a)/(b) 5.15% 6.08% 6.33% 7.35% 7.72% 8.03% 7.72% 7.92% 8.26% 8.28% 8.03% Tangible common equity per common share Total stockholders' equity 78,999$ 90,771$ 93,698$ 108,390$ 117,066$ 125,940$ 117,066$ 122,399$ 126,155$ 129,339$ 125,940$ Less: Goodwill 11,004 11,004 11,004 11,004 11,004 11,004 11,004 11,004 11,004 11,004 11,004 Less: Other intangible assets - - - - - - - - - - - Tangible common equity (c) 67,995 79,767 82,694 97,386 106,062 114,936 106,062 111,395 115,151 118,335 114,936 Common shares outstanding (actual) (d) 6,228,366 6,254,620 6,269,004 7,067,425 7,086,632 7,110,022 7,086,632 7,088,987 7,105,775 7,107,666 7,110,022 Tangible common equity per common share (c)/(d) 10.92$ 12.75$ 13.19$ 13.78$ 14.97$ 16.17$ 14.97$ 15.71$ 16.21$ 16.65$ 16.17$ Return on average tangible common equity Net income 5,597$ 12,991$ 7,281$ 5,269$ 10,667$ 13,129$ 2,382$ 3,151$ 2,602$ 4,493$ 2,883$ Less: Preferred stock dividends 2,601 2,700 2,025 1,215 - - - - - - - Add: Intangible amortization expense (net of tax) - - - - - - - - - - - Net income, excluding intangible amortization (e) 2,996 10,291 5,256 4,054 10,667 13,129 2,382 3,151 2,602 4,493 2,883 Average common stockholders' equity 79,308 83,658 92,844 106,332 113,659 125,774 117,331 120,159 124,947 128,830 129,158 Less: Average goodwill 11,004 11,004 11,004 11,004 11,004 11,004 11,004 11,004 11,004 11,004 11,004 Less: Average other intangible assets (net of tax) - - - - - - - - - - - Average tangible common equity (f) 68,304 72,654 81,840 95,328 102,655 114,770 106,327 109,155 113,943 117,826 118,154 Return on average tangible common equity (e)/(f) 4.39% 14.16% 6.42% 4.25% 10.39% 11.44% 8.96% 11.55% 9.13% 15.25% 9.76% Net interest margin (tax equivalent) Net interest income 35,516$ 35,626$ 37,640$ 39,578$ 44,182$ 46,391$ 11,476$ 11,346$ 11,527$ 11,596$ 11,922$ Tax equivalent adjustment 964 794 555 637 796 868 204 233 206 210 219 Tax equivalent net interest income (g) 36,480 36,420 38,195 40,215 44,978 47,259 11,680 11,579 11,733 11,806 12,141 Average earning assets (h) 1,213,105 1,195,348 1,196,428 1,193,949 1,203,813 1,285,019 1,239,238 1,261,606 1,280,318 1,295,508 1,302,065 Net interest margin (tax equivalent) (g)/(h) 3.01% 3.05% 3.19% 3.37% 3.74% 3.68% 3.74% 3.72% 3.68% 3.62% 3.70% Efficiency Ratio Noninterest expense 40,095$ 41,115$ 39,107$ 39,170$ 43,808$ 45,389$ 11,403$ 10,690$ 11,741$ 11,246$ 11,712$ Less: Foreclosure & repo 2,653$ 2,129$ 900$ 369$ 1,582$ 1,618$ 799$ 162$ 821$ 355$ 280$ Less: Intangible amortization expense - - - - - - - - - - - Adjusted noninterest expense (i) 37,442 38,986 38,207 38,801 42,226 43,771 10,604 10,528 10,920 10,891 11,432 Net interest income 35,516 35,626 37,640 39,578 44,182 46,391 11,476 11,346 11,527 11,596 11,922 Noninterest income 13,960 26,008 14,653 14,340 15,168 16,783 3,770 3,721 3,938 5,069 4,055 Less: Other income - recovery - 11,572 - - - - - - - - - Tax equivalent adjustment 964 794 555 637 796 868 204 233 206 210 219 Total tax equivalent revenue (j) 50,440 50,856 52,848 54,555 60,146 64,042 15,450 15,300 15,671 16,875 16,196 Efficiency ratio (i)/(j) 74.23% 76.66% 72.30% 71.12% 70.21% 68.35% 68.63% 68.81% 69.68% 64.54% 70.59%