
GFAI 6-K
Guardforce AI Co., Ltd. (GFAI)
UNITED STATES
SECURITIES AND EXCHANGE COMMISSION
WASHINGTON, D.C. 20549
FORM 6-K
REPORT OF FOREIGN PRIVATE ISSUER
PURSUANT TO RULE 13a-16 OR 15d-16 OF THE
SECURITIES EXCHANGE ACT OF 1934
For the month of, April 2026
Commission File Number 001-40848
GUARDFORCE AI CO., LIMITED
(Translation of registrant’s name into English)
10 Anson Road, #28-01 International Plaza
Singapore 079903
(Address of principal executive offices)
Indicate by check mark whether the registrant files or will file annual reports under cover of Form 20-F or Form 40-F:
Form 20-F ☒ Form 40-F ☐
Issuance of Press Release
On April 21, 2026, Guardforce AI Co., Limited (the “Company”) issued a press release announcing its financial results and providing a business update for the fiscal year ended December 31, 2025. A copy of that press release is attached as Exhibit 99.1 hereto.
On the same day, the Company posted an updated investor presentation, on its website at https://ir.guardforceai.com/news-events/company-presentation/ in the “News & Events – Company Presentation” section. A copy of that investor presentation is attached as Exhibit 99.2 hereto.
The information furnished in this Report on Form 6-K, including Exhibit 99.1 and Exhibit 99.2 attached hereto, shall not be deemed “filed” for purposes of Section 18 of the Securities Exchange Act of 1934 (the “Exchange Act”) or otherwise subject to the liabilities of such section, nor shall such information be deemed incorporated by reference in any filing under the Securities Act of 1933, as amended, or the Exchange Act, except as shall be set forth expressly by specific reference in such filing.
This report on Form 6-K is incorporated by reference into (i) the prospectus contained in the Company’s registration statement on Form F-3 (SEC File No. 333-261881) declared effective by the Securities and Exchange Commission (the “Commission”) on January 5, 2022; (ii) the prospectus dated February 9, 2022 contained in the Company’s registration statement on Form F-3 (SEC File No. 333-262441) declared effective by the Commission on February 9, 2022; (iii) the prospectus contained in the Company’s Post-Effective Amendment No. 1 to Form F-1 on Form F-3 (SEC File No. 333-258054) declared effective by the Commission on June 14, 2022; and (iv) the prospectus contained in the Company’s registration statement on Form F-3 (SEC File No. 333-284261) declared effective by the Securities and Exchange Commission (the “Commission”) on January 24, 2025.
1
EXHIBIT INDEX
2
SIGNATURES
Pursuant to the requirements of the Securities Exchange Act of 1934, the registrant has duly caused this report to be signed on its behalf by the undersigned, thereunto duly authorized.
| Date: April 21, 2026 | Guardforce AI Co., Limited | |
| By: | /s/ Lei Wang | |
| Lei Wang | ||
| Chief Executive Officer | ||
3
Exhibit 99.1
Guardforce AI Reports Full Year 2025 Financial Results
Achieved 15.3% growth in AI, RaaS & Smart Solutions
NEW YORK, April 21, 2026 -- Guardforce AI Co., Limited (“Guardforce AI” or the “Company”) (NASDAQ: GFAI, GFAIW), an AI-driven technology company providing Agentic AI, smart solutions in automation, robotics, and secured logistics, today announced financial results for the year ended December 31, 2025. The Company also updated its business metrics to better reflect its strategic growth strategy and evolving revenue mix.
2025 Operational Highlights
In 2025, Guardforce AI advanced its AI transformation by launching self-developed AI agent solutions and driving expansion in smart solutions in Thailand. In the meantime, the Company further strengthened its Secured Logistics business by increasing its client retention rate and improving client mix.
| ● | Launched self-developed AI Agent, DeepVoyage Go (“DVGO”), an AI tool that helps create customized itineraries in minutes and converts individual experience into shareable digital assets, in April 2025 (beta) and publicly in January 2026. The platform enables intelligent decision-making, planning, and service matching—capabilities that are highly transferable to other sectors such as banking, hospitality, education, and healthcare. |
| ● | In March 2026, acquired MGAI, a pioneer in AI-driven solutions for pediatric speech therapy and rehabilitation in Asia. This acquisition captures a validated market opportunity in this sector, with strong potential for cross-sector scalability and synergy. |
| ● | Launched Smart Solutions in Thailand with over 13 retail store deployments in 2025 and established a partnership with an international chain retailer in 2026, extending services from cash management to integrated in-store asset and merchandise security. |
| ● | Secured Logistics business revenue was increasingly driven by retail clients, reflecting a strategic shift from a bank-dominated to a more diversified customer base, enhancing business stability and supporting future growth. |
Updated Business Metrics
Starting from 2025, we have introduced new business metrics to provide a more insightful and actionable understanding of our evolving business.
The current business metrics are:
| ● | AI, Robotics-as-a-Service (RaaS), and Smart Solutions (including Smart Cash Solution and Smart Retail Solution). This metric empowers business through technology upgrades, AI and Robotics. |
| ● | Legacy Secured Logistics, which encompasses traditional services like cash management operations, coin processing, ATM management and others. |
Smart Cash Solution has been reclassified from the Legacy Secured Logistics metric into the AI , Robotics-as-a-Service (RaaS), and Smart Solutions metric.
2025 Financial Highlights
| ● | Total Revenue Increased |
Total revenue was $35,232,701, an increase of 8.0% compared to $32,635,191 for the year ended December 31, 2024.
The AI, RaaS, and Smart Solutions metric, which accounted for 13.4% of total revenue in 2025, grew at 15.3% during the year mainly due to increased demand by retail customers for Smart Cash Solution.
Legacy Secured Logistics metric, which accounted for 86.6% of total revenue in 2025, achieved 99.96% recurring revenue and grew at 6.9%, mainly due to growth of the Company’s retail-focused service lines in Thailand.
| ● | Consecutive Gross Profit Grew |
Gross profit, which has grown in each year since 2022, increased by $369,527, or 7.5%, to $5,285,668, compared with gross profit of $4,916,141 for 2024, with gross margin remaining stable year-over-year.
| ● | Net Loss from Continuing Operations Narrowed |
Net loss for the year from continuing operations was $5,286,128, a 10.1% improvement on the $5,882,647 for this item in 2024.
| ● | Lowest Negative EBITDA since 2022 |
Negative EBITDA improved by approximately $753,233, or 23.3%, year-over-year, to negative $2,478,012 in 2025, compared to negative $3,231,245 in 2024, reflecting significant operational progress in 2025.
| ● | R&D Investment for AI Development Increased |
Strategic R&D investment was $837,719, an increase of $448,831, or 115.4%, compared to $388,888 for 2024, reflecting the Company’s commitment to advancing AI capabilities and product innovation.
| ● | Stronger Balance Sheet for Future AI Development |
At December 31, 2025 and December 31, 2024, cash and cash equivalents was $24,545,290 and $21,936,422. This asset is mainly reserved for future AI investment, including R&D expenses, talent recruitment and strategic acquisitions.
Note: Certain figures from the Company’s statement of operations for 2024 have been restated in order to present the results of discontinued operations separately from continuing operations. This restatement ensures comparability of continuing business performance across all periods presented.
2
Management Commentary and Future Outlook
“2025 was a pivotal year for Guardforce AI,” said Chairwoman and Chief Executive Officer Lei (Olivia) Wang. “We accelerated the commercialization and revenue growth of our AI and Smart Solutions while maintaining a stable operating and revenue foundation for our Legacy Secured Logistics business. We also advanced AI application strategy through the launch of DVGO, extended traditional cash management services into broader in-store assets and merchandise security by implementing Smart Solutions, and continued to strengthen our retail customer base while sustaining our long-standing client relationships. These achievements reinforce the stability of our core business and create a stronger foundation for future solution-driven growth.
“Looking ahead to the remainder of 2026, we intend to pursue several strategic goals and create long-term value for investors. First, we will continue to deepen our investment in AI, leveraging DVGO as a core, technology-driven engine for organic growth, enabling us to achieve scalable market expansion across key verticals.
“Second, we will accelerate the expansion of Smart Solutions across our existing retail client base, leveraging long-standing trusted relationships to evolve from service delivery to trusted solution partnerships, thereby unlocking incremental revenue through customer-driven synergies.
“Third, following up our acquisition of MGAI in early 2026, we will continue to selectively pursue strategic mergers and acquisitions to expand our business roadmap, enhance capital efficiency and drive long-term value creation across our platform.
“Lastly, we will continue to enhance our operational efficiency by increasing investment in technology and strengthening our execution capabilities, driving sustainable cost optimization and improved operating income across all business segments.”
Conference Call
Guardforce AI will host a conference call at 8:00 a.m. Eastern Time on Tuesday, April 21, 2026. The conference call will be available via telephone by dialing toll-free 1-877-407-0792 for U.S. callers or 1-201-689-8263 for international callers and entering access code GUARDFORCE AI.
A webcast of the call may be accessed at: https://viavid.webcasts.com/viewer/event.jsp?ei=1759794&tp_key=9ce7c9e4b1 or on the company’s Investor Relations section of the website, ir.guardforceai.com/news-events/company-events.
A webcast replay will be available on this website through April 21, 2027 on the company’s Investor Relations section of the website. A telephone replay of the call will be available approximately three hours following the call and may be accessed until April 28, 2026, at 11:00 a.m. ET by dialing 1- 844-512-2921 for U.S. callers or 1-412-317-6671 for international callers and entering access code 13760045.
3
About Guardforce AI Co., Ltd.
Guardforce AI (Nasdaq: GFAI, GFAIW) is an AI-driven technology company with a solid operational foundation in the cash logistics and retail sectors. Through its proprietary Intelligent Cloud Platform (ICP), Guardforce AI delivers next generation smart solutions and AI applications spanning cash management, retail automation, robotics, and Agentic AI. Expanding into areas such as travel planning, the Company is demonstrating how scalable AI can drive industry transformation, balancing stable, recurring revenues with high-growth, future-ready innovations. For more information, visit www.guardforceai.com Twitter: @Guardforceai.
Safe Harbor Statement
This press release contains statements that do not relate to historical facts but are “forward-looking statements” within the meaning of the safe harbor provisions of the U.S. Private Securities Litigation Reform Act of 1995. These statements can generally (although not always) be identified by their use of terms and phrases such as anticipate, appear, believe, continue, could, estimate, expect, indicate, intend, may, plan, possible, predict, project, pursue, will, would and other similar terms and phrases, as well as the use of the future tense. Forward-looking statements are neither historical facts nor assurances of future performance. Instead, they are based only on current beliefs, expectations and assumptions regarding the future of the business of the Company, future plans and strategies, projections, anticipated events and trends, the economy and other future conditions. Because forward-looking statements relate to the future, they are subject to inherent uncertainties, risks and changes in circumstances that are difficult to predict and many of which are outside of our control, including the risks described in our registration statements and reports under the heading “Risk Factors” as filed with the Securities and Exchange Commission. Actual results and financial condition may differ materially from those indicated in the forward-looking statements. Therefore, you should not rely on any of these forward-looking statements. Forward-looking statements in this press release speak only as of the date hereof. Unless otherwise required by law, we undertake no obligation to publicly update or revise these forward-looking statements, whether because of new information, future events or otherwise.
Guardforce AI Corporate Communications:
Hu Yu
Email: [email protected]
Investor Relations Inquiries:
Skyline Corporate Communications Group, LLC
Scott Powell, President
Office: (646) 893-5835
Email: [email protected]
4
Guardforce AI Co., Limited
Consolidated Statements of Profit or Loss
(Expressed in U.S. Dollars)
| For the years ended December 31, | ||||||||||||
| 2025 | 2024 | 2023 | ||||||||||
| (Restated) | (Restated) | |||||||||||
| Continuing operations: | ||||||||||||
| Revenue | $ | 35,232,701 | $ | 32,635,191 | $ | 32,649,834 | ||||||
| Cost of sales | (29,947,033 | ) | (27,719,050 | ) | (28,513,107 | ) | ||||||
| Gross profit | 5,285,668 | 4,916,141 | 4,136,727 | |||||||||
| Provision for expected credit loss on trade receivables and other receivables | (16,995 | ) | (210,437 | ) | (96,877 | ) | ||||||
| Allowance for expected credit losses on a related party receivable | - | - | (5,637,527 | ) | ||||||||
| Impairment loss on goodwill | - | (30,575 | ) | (2,267,583 | ) | |||||||
| Impairment loss on intangible assets | - | (188,797 | ) | (3,713,551 | ) | |||||||
| Provision for withholding taxes receivable | (149,838 | ) | (4,339 | ) | (683,344 | ) | ||||||
| Provision for obsolete inventory | - | - | (3,797,552 | ) | ||||||||
| Impairment loss on fixed assets | - | - | (3,682,789 | ) | ||||||||
| Stock-based compensation expense | (1,350,800 | ) | (1,849,356 | ) | (1,101,800 | ) | ||||||
| Research and development expense | (837,719 | ) | (388,888 | ) | - | |||||||
| Selling, general and administrative expenses | (8,807,640 | ) | (8,950,790 | ) | (11,553,779 | ) | ||||||
| Operating loss | (5,877,324 | ) | (6,707,041 | ) | (28,398,075 | ) | ||||||
| Other income, net | 133,253 | 353,822 | 437,608 | |||||||||
| Foreign exchange (losses)/gains, net | (19,825 | ) | 5,760 | 305,026 | ||||||||
| Finance income/(costs), net | 471,374 | 338,887 | (652,517 | ) | ||||||||
| Loss before income tax from continuing operations | (5,292,522 | ) | (6,008,572 | ) | (28,307,958 | ) | ||||||
| Provision for income tax benefit/(expense) | 6,394 | 125,925 | (434,320 | ) | ||||||||
| Net loss for the year from continuing operations | (5,286,128 | ) | (5,882,647 | ) | (28,742,278 | ) | ||||||
| Discontinued operations: | ||||||||||||
| Net (loss)/profit for the year from discontinued operations | (1,356,923 | ) | 37,947 | (847,104 | ) | |||||||
| Net loss for the year | (6,643,051 | ) | (5,844,700 | ) | (29,589,382 | ) | ||||||
| Net loss for the year attributable to: | ||||||||||||
| Net loss attributable to equity holders of the Company | (6,657,185 | ) | (5,864,165 | ) | (29,571,661 | ) | ||||||
| Net profit/(loss) attributable to non-controlling interests | 14,134 | 19,465 | (17,721 | ) | ||||||||
| Net loss for the year | (6,643,051 | ) | (5,844,700 | ) | (29,589,382 | ) | ||||||
| Loss per share | ||||||||||||
| Basic and diluted loss attributable to the equity holders of the Company | $ | (0.30 | ) | $ | (0.53 | ) | $ | (4.53 | ) | |||
| Loss per share | ||||||||||||
| Basic and diluted loss attributable to the equity holders of the Company from continuing operations | $ | (0.24 | ) | $ | (0.53 | ) | $ | (4.40 | ) | |||
| Basic and diluted loss attributable to the equity holders of the Company from discontinued operations | $ | (0.06 | ) | $ | 0.00 | $ | (0.13 | ) | ||||
| Weighted average number of shares used in computation: | ||||||||||||
| Basic and diluted | 21,921,204 | 11,161,053 | 6,531,918 | |||||||||
5
Guardforce AI Co., Limited
Consolidated Balance Sheets
(Expressed in U.S. Dollars)
| As of December 31, | ||||||||
| 2025 | 2024 | |||||||
| Assets | ||||||||
| Current assets: | ||||||||
| Cash and cash equivalents | $ | 24,545,290 | $ | 21,936,422 | ||||
| Restricted cash | - | 27,642 | ||||||
| Trade receivables, net | 4,947,264 | 5,922,345 | ||||||
| Other current assets | 2,441,038 | 2,291,439 | ||||||
| Withholding taxes receivable, net | 902,845 | 393,960 | ||||||
| Inventories | 21,519 | 274,854 | ||||||
| Other financial assets at amortized cost | 77,100 | - | ||||||
| Assets held for sale | 1,150,324 | - | ||||||
| Total current assets | 34,085,380 | 30,846,662 | ||||||
| Non-current assets: | ||||||||
| Restricted cash | 2,322,790 | 1,432,738 | ||||||
| Property, plant and equipment | 3,088,905 | 3,183,856 | ||||||
| Right-of-use assets | 4,523,309 | 2,268,022 | ||||||
| Intangible assets, net | 1,057,144 | 2,300,951 | ||||||
| Goodwill | - | 411,862 | ||||||
| Withholding taxes receivable, net | 2,325,281 | 1,967,826 | ||||||
| Deferred tax assets, net | 1,418,174 | 1,281,531 | ||||||
| Other non-current assets | 272,827 | 998,971 | ||||||
| Total non-current assets | 15,008,430 | 13,845,757 | ||||||
| Total assets | $ | 49,093,810 | $ | 44,692,419 | ||||
| Liabilities and equity | ||||||||
| Current liabilities: | ||||||||
| Trade payables and other current liabilities | $ | 3,158,254 | $ | 4,549,364 | ||||
| Borrowings | - | 44,232 | ||||||
| Lease liabilities | 2,141,509 | 1,670,909 | ||||||
| Liabilities directly associated with the assets held for sale | 1,111,804 | - | ||||||
| Total current liabilities | 6,411,567 | 6,264,505 | ||||||
| Non-current liabilities: | ||||||||
| Lease liabilities | 2,081,431 | 889,920 | ||||||
| Provision for employee benefits | 6,493,677 | 5,548,726 | ||||||
| Total non-current liabilities | 8,575,108 | 6,438,646 | ||||||
| Total liabilities | 14,986,675 | 12,703,151 | ||||||
| Equity | ||||||||
| Ordinary shares – par value $0.12 authorized 300,000,000 shares, issued and outstanding 24,353,539 shares at December 31, 2025; issued and outstanding 17,808,947 shares at December 31, 2024 | 2,922,460 | 2,137,108 | ||||||
| Subscription receivable | (50,000 | ) | (50,000 | ) | ||||
| Additional paid in capital | 100,271,584 | 93,102,042 | ||||||
| Legal reserve | 223,500 | 223,500 | ||||||
| Warrants reserve | 251,036 | 251,036 | ||||||
| Accumulated deficit | (70,862,025 | ) | (64,204,840 | ) | ||||
| Accumulated other comprehensive income | 1,397,005 | 590,981 | ||||||
| Capital & reserves attributable to equity holders of the Company | 34,153,560 | 32,049,827 | ||||||
| Non-controlling interests | (46,425 | ) | (60,559 | ) | ||||
| Total equity | 34,107,135 | 31,989,268 | ||||||
| Total liabilities and equity | $ | 49,093,810 | $ | 44,692,419 | ||||
6
Guardforce AI Co., Limited
Consolidated Statements of Cash Flows
(Expressed in U.S. Dollars)
| For the years ended December 31, | ||||||||||||
| 2025 | 2024 | 2023 | ||||||||||
| (Restated) | (Restated) | |||||||||||
| Cash flows from operating activities | ||||||||||||
| Net loss from continuing operations | $ | (5,286,128 | ) | $ | (5,882,647 | ) | $ | (28,742,278 | ) | |||
| Adjustments for: | ||||||||||||
| Depreciation | 3,114,211 | 2,922,509 | 4,242,246 | |||||||||
| Amortization of intangible assets | 171,673 | 193,705 | 752,453 | |||||||||
| Provision for obsolete inventories | - | - | 3,797,552 | |||||||||
| Impairment loss on fixed assets | - | - | 3,682,789 | |||||||||
| Stock-based compensation expense | 1,350,800 | 1,849,356 | 1,101,800 | |||||||||
| Impairment loss on intangible assets | - | 188,797 | 3,713,551 | |||||||||
| Impairment loss on goodwill | - | 30,575 | 2,267,583 | |||||||||
| Allowance for expected credit losses on a related party receivable | - | - | 5,637,527 | |||||||||
| Netting off related parties’ balances | - | (690,487 | ) | - | ||||||||
| Finance (income)/costs, net | (471,374 | ) | (338,887 | ) | 649,517 | |||||||
| Deferred income taxes | (78,792 | ) | (125,925 | ) | 434,315 | |||||||
| Provision for expected credit loss on trade receivables and other receivables, net | 16,995 | 210,437 | 96,877 | |||||||||
| Increase in provision for withholding tax receivables | 149,838 | 4,339 | 683,344 | |||||||||
| Loss/(Gain) from fixed assets disposal | 12,273 | (21,644 | ) | 208,093 | ||||||||
| Changes in operating assets and liabilities: | ||||||||||||
| Decrease/(Increase) in trade and other receivables | 739,667 | (323,718 | ) | (395,602 | ) | |||||||
| Increase in other current assets | (88,241 | ) | (629,406 | ) | (242,706 | ) | ||||||
| (Increase)/Decrease in restricted cash | (705,069 | ) | 249,146 | (409,521 | ) | |||||||
| (Increase)/Decrease in inventories | (14,411 | ) | (6,528 | ) | 675,763 | |||||||
| Decrease in amount due from related parties | - | - | 424,979 | |||||||||
| Decrease/(Increase) in other non-current assets | 724,026 | (582,712 | ) | 33,924 | ||||||||
| (Decrease)/Increase in trade payables and other current liabilities | (46,130 | ) | (597,155 | ) | 713,513 | |||||||
| Decrease in amount due to related parties | - | - | (956,294 | ) | ||||||||
| Decrease in withholding taxes receivable | (780,352 | ) | (146,855 | ) | (192,502 | ) | ||||||
| Increase in provision for employee benefits | 163,559 | 275,265 | 34,534 | |||||||||
| Net cash used in operating activities - continuing operations | (1,027,455 | ) | (3,421,835 | ) | (1,788,543 | ) | ||||||
| Net cash (used in)/provided by operating activities - discontinued operations | (277,741 | ) | 96,236 | 187,321 | ||||||||
| Net cash used in operating activities | (1,305,196 | ) | (3,325,599 | ) | (1,601,222 | ) | ||||||
| Cash flows from investing activities | ||||||||||||
| Acquisition of property, plant and equipment | (345,149 | ) | (237,367 | ) | (2,095,319 | ) | ||||||
| Proceeds from disposal of property, plant and equipment | 33,717 | 23,647 | - | |||||||||
| Acquisition of intangible assets | (2,837 | ) | (61,995 | ) | (18,476 | ) | ||||||
| Interest received | 627,845 | 511,292 | - | |||||||||
| Payments for financial assets at amortized cost | (77,100 | ) | - | - | ||||||||
| Net cash provided by/(used in) investing activities - continuing operations | 236,476 | 235,577 | (2,113,795 | ) | ||||||||
| Net cash used in investing activities - discontinued operations | (4,886 | ) | (35,191 | ) | (11,750 | ) | ||||||
| Net cash provided by/ (used in) investing activities | 231,590 | 200,386 | (2,125,545 | ) | ||||||||
| Cash flows from financing activities | ||||||||||||
| Proceeds from issue of shares | 6,604,094 | 10,399,732 | 20,867,386 | |||||||||
| Proceeds from exercise of warrants | - | - | 506,692 | |||||||||
| Cash repayment of a convertible note | - | - | (554,238 | ) | ||||||||
| Cash paid for the cancellation of fractional shares | - | - | (49,664 | ) | ||||||||
| Proceeds from borrowings | - | - | 1,725,465 | |||||||||
| Repayment of borrowings | (46,884 | ) | (3,506,646 | ) | (2,860,585 | ) | ||||||
| Payment of lease liabilities | (3,257,910 | ) | (2,043,529 | ) | (2,652,150 | ) | ||||||
| Net cash provided by financing activities - continuing operations | 3,299,300 | 4,849,557 | 16,982,906 | |||||||||
| Net cash used in financing activities - discontinued operations | - | (141,707 | ) | 140,019 | ||||||||
| Net cash provided by financing activities | 3,299,300 | 4,707,850 | 17,122,925 | |||||||||
| Net increase in cash and cash equivalents | 2,225,694 | 1,582,637 | 13,396,158 | |||||||||
| Effect of movements in exchange rates on cash held | 415,306 | 89,916 | (62,928 | ) | ||||||||
| Cash and cash equivalents at beginning of year | 21,936,422 | 20,263,869 | 6,930,639 | |||||||||
| Cash and cash equivalents at end of year (Note 4) | $ | 24,577,422 | $ | 21,936,422 | $ | 20,263,869 | ||||||
| Non-cash investing and financing activities | ||||||||||||
| Equity portion of the settlement of a borrowing from a third party | - | - | 15,914,615 | |||||||||
| Equity portion of purchase consideration paid for acquisition of fixed and intangible assets | - | - | 1,848,000 | |||||||||
7
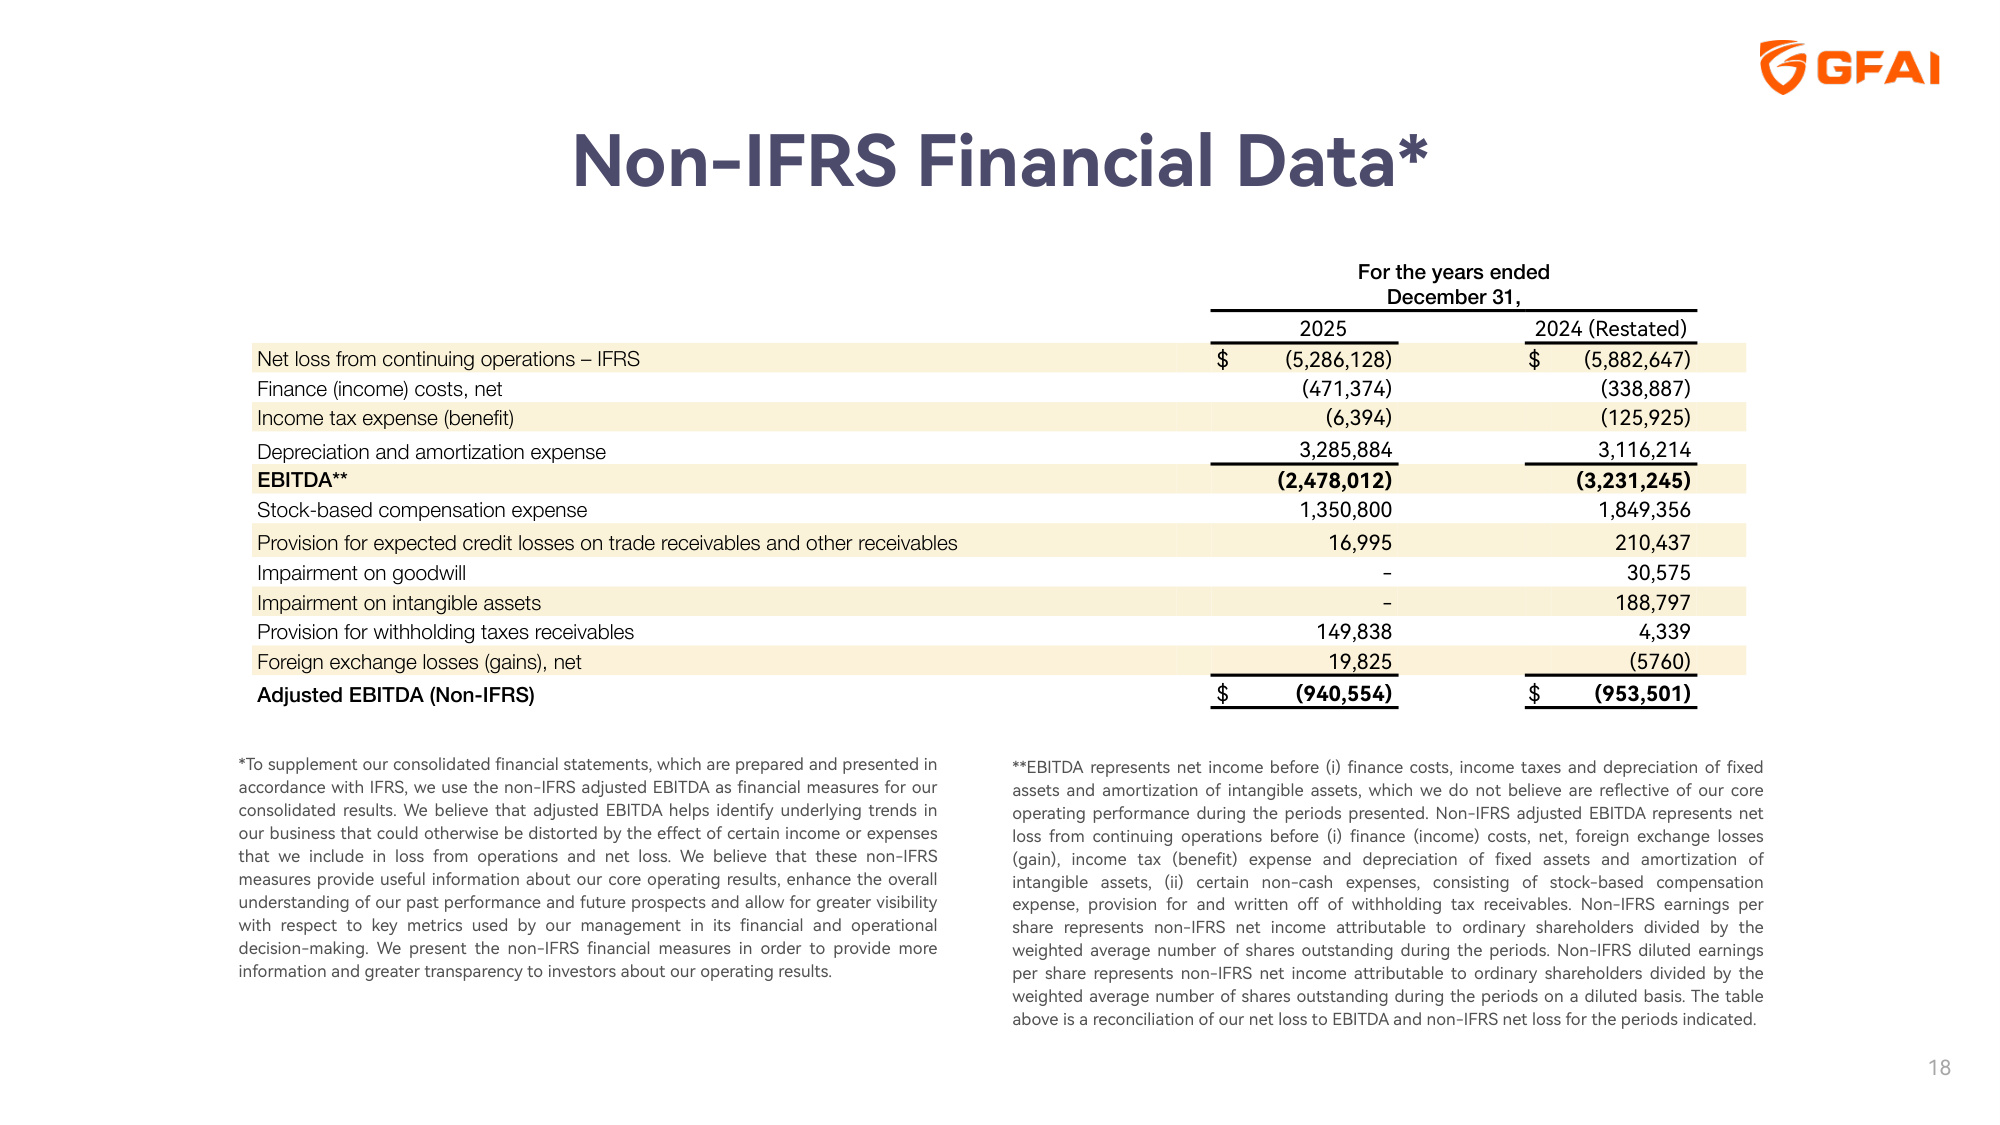
Non-IFRS financial data
To supplement our consolidated financial statements, which are prepared and presented in accordance with IFRS, we use the non-IFRS adjusted EBITDA as financial measures for our consolidated results.
We believe that adjusted EBITDA helps identify underlying trends in our business that could otherwise be distorted by the effect of certain income or expenses that we include in loss from operations and net loss. We believe that these non-IFRS measures provide useful information about our core operating results, enhance the overall understanding of our past performance and future prospects and allow for greater visibility with respect to key metrics used by our management in its financial and operational decision-making. We present the non-IFRS financial measures in order to provide more information and greater transparency to investors about our operating results.
EBITDA represents net loss from continuing operations before (i) finance costs, income taxes and depreciation of fixed assets and amortization of intangible assets, which we do not believe are reflective of our core operating performance during the periods presented.
Non-IFRS adjusted EBITDA represents net (loss) income from continuing operations before (i) finance (income) costs, net, foreign exchange (gains) losses, income tax expense (benefit) and depreciation of fixed assets and amortization of intangible assets, (ii) certain non-cash expenses, consisting of stock-based compensation expense, provision for expected credit loss on trade receivables and other receivables, allowance for doubtful debts on a related party receivable, impairment on goodwill, impairment on intangible assets, written off for withholding tax receivables, provision for obsolete inventory and impairment loss on fixed assets.
Non-IFRS (loss) earnings per share represents non-IFRS net (loss) income from continuing operations attributable to ordinary shareholders divided by the weighted average number of shares outstanding during the periods.
Non-IFRS diluted earnings per share represents non-IFRS net income from continuing operations attributable to ordinary shareholders divided by the weighted average number of shares outstanding during the periods on a diluted basis.
The table below is a reconciliation of our net loss from continuing operations to EBITDA and non-IFRS adjusted EBITDA from continuing operations for the periods indicated:
| For the years ended December 31, | ||||||||||||
| 2025 | 2024 | 2023 | ||||||||||
| (Restated) | (Restated) | |||||||||||
| Net loss from continuing operations – IFRS | $ | (5,286,128 | ) | $ | (5,882,647 | ) | $ | (28,742,278 | ) | |||
| Finance (income) costs, net | (471,374 | ) | (338,887 | ) | 652,517 | |||||||
| Income tax expense (benefit) | (6,394 | ) | (125,925 | ) | 434,320 | |||||||
| Depreciation and amortization expense | 3,285,884 | 3,116,214 | 4,994,699 | |||||||||
| EBITDA | (2,478,012 | ) | (3,231,245 | ) | (22,660,742 | ) | ||||||
| Stock-based compensation expense | 1,350,800 | 1,849,356 | 1,101,800 | |||||||||
| Provision for expected credit losses on trade receivables and other receivables | 16,995 | 210,437 | 96,877 | |||||||||
| Allowance for doubtful debts on a related party receivable | - | - | 5,637,527 | |||||||||
| Impairment loss on goodwill | - | 30,575 | 2,267,583 | |||||||||
| Impairment loss on intangible assets | - | 188,797 | 3,713,551 | |||||||||
| Provision for withholding taxes receivables | 149,838 | 4,339 | 683,344 | |||||||||
| Provision for obsolete inventory | - | - | 3,797,552 | |||||||||
| Impairment loss on fixed assets | - | - | 3,682,789 | |||||||||
| Foreign exchange losses (gains), net | 19,825 | (5,760 | ) | (305,026 | ) | |||||||
| Adjusted EBITDA (Non-IFRS) | $ | (940,554 | ) | $ | (953,501 | ) | $ | (1,984,745 | ) | |||
| Non-IFRS loss per share | ||||||||||||
| Basic and diluted loss for the year attributable to ordinary equity holders of the Company | $ | (0.04 | ) | $ | (0.09 | ) | $ | (0.30 | ) | |||
| Weighted average number of shares used in computation: | ||||||||||||
| Basic and diluted | 21,921,204 | 11,161,053 | 6,534,918 | * | ||||||||
8
Exhibit 99.2

1
Forward-Looking Disclosures This presentation contains forward-looking statements that are based on our management's beliefs and assumptions and on information currently available to us. In addition, statements that "we believe" and similar statements reflect our beliefs and opinions on the relevant subject. These statements are based upon information available to us as of the date on which the statements are made in this presentation, and while we believe such information forms a reasonable basis for such statements, such information may be limited or incomplete, and our statements should not be read to indicate that we have conducted an exhaustive inquiry into, or review of, all potentially available relevant information. These statements are inherently uncertain and investors are cautioned not to unduly rely upon these statements. The forward-looking statements made in this presentation relate only to events or information as of the date on which the statements are made in this presentation. Although we have ongoing disclosure obligations under United States federal securities laws, we do not intend to update or otherwise revise the forward-looking statements in this presentation, whether as a result of new information, future events or otherwise. This presentation also contains estimates and other statistical data made by independent parties and by us relating to market size and other data about our industry. This data involves a number of assumptions and limitations, and you are cautioned not to give undue weight to such data and estimates. In addition, projections, assumptions and estimates of our future performance and the future performance of the markets in which we operate are necessarily subject to a high degree of uncertainty and risk. Neither we nor our affiliates, advisors or representatives make any representation as to the accuracy or completeness of that data or undertake to update such data after the date of this presentation. These statements relate to future events or to our future financial performance and involve known and unknown risks, uncertainties, and other factors that may cause our actual results, levels of activity, performance or achievements to be materially different from any future results, levels of activity, performance or achievements expressed or implied by these forward-looking statements. Forward- looking statements include, but are not limited to, statements about: our goals and strategies; our future business development, financial condition and results of operations; expected changes in our revenue, costs or expenditures; growth of and competition trends in our industry; our expectations regarding demand for, and market acceptance of, our products; our expectations regarding our relationships with investors, institutional funding partners and other parties we collaborate with; our expectation regarding the use of proceeds from the offering; fluctuations in general economic and business conditions in the markets in which we operate; relevant government policies and regulations relating to our industry; and key personnel continuing their employment with us. In some cases, you can identify forward-looking statements by terms such as "may," "could," "will," "should," "would," "expect," "plan," "intend," "anticipate," "believe," "estimate," "predict," "potential," "project" or "continue" or the negative of these terms or other comparable terminology. These statements are only predictions. You should not place undue reliance on forward-looking statements because they involve known and unknown risks, uncertainties and other factors, which are, in some cases, beyond our control and which could materially affect results. Factors that may cause actual results to differ materially from current expectations include, among other things, those listed under the heading "Risk Factors" and in our annual report for our fiscal year ended December 31, 2025, on Form 20-F. If one or more of these risks or uncertainties occur, or if our underlying assumptions prove to be incorrect, actual events or results may vary significantly from those implied or projected by the forward-looking statements. No forward-looking statement is a guarantee of future performance. 2
Guardforce AI (Nasdaq: GFAI, GFAIW) is an AI-driven technology company with over 43 years of growth and leadership experience in the Legacy Secured Logistics, and retail sectors in Thailand and across the Asia- Pacific region. Through our proprietary Intelligent Cloud Platform (ICP), the Company delivers next-generation Smart Solutions and AI applications spanning cash management, retail automation, robotics, and Agentic AI. Who We Are Our Mission To demonstrate how our unique agentic AI platform, paired with proprietary robotics and AI hardware and software tools, can drive innovation and facilitate growth in a wide array of major industrial applications. 3
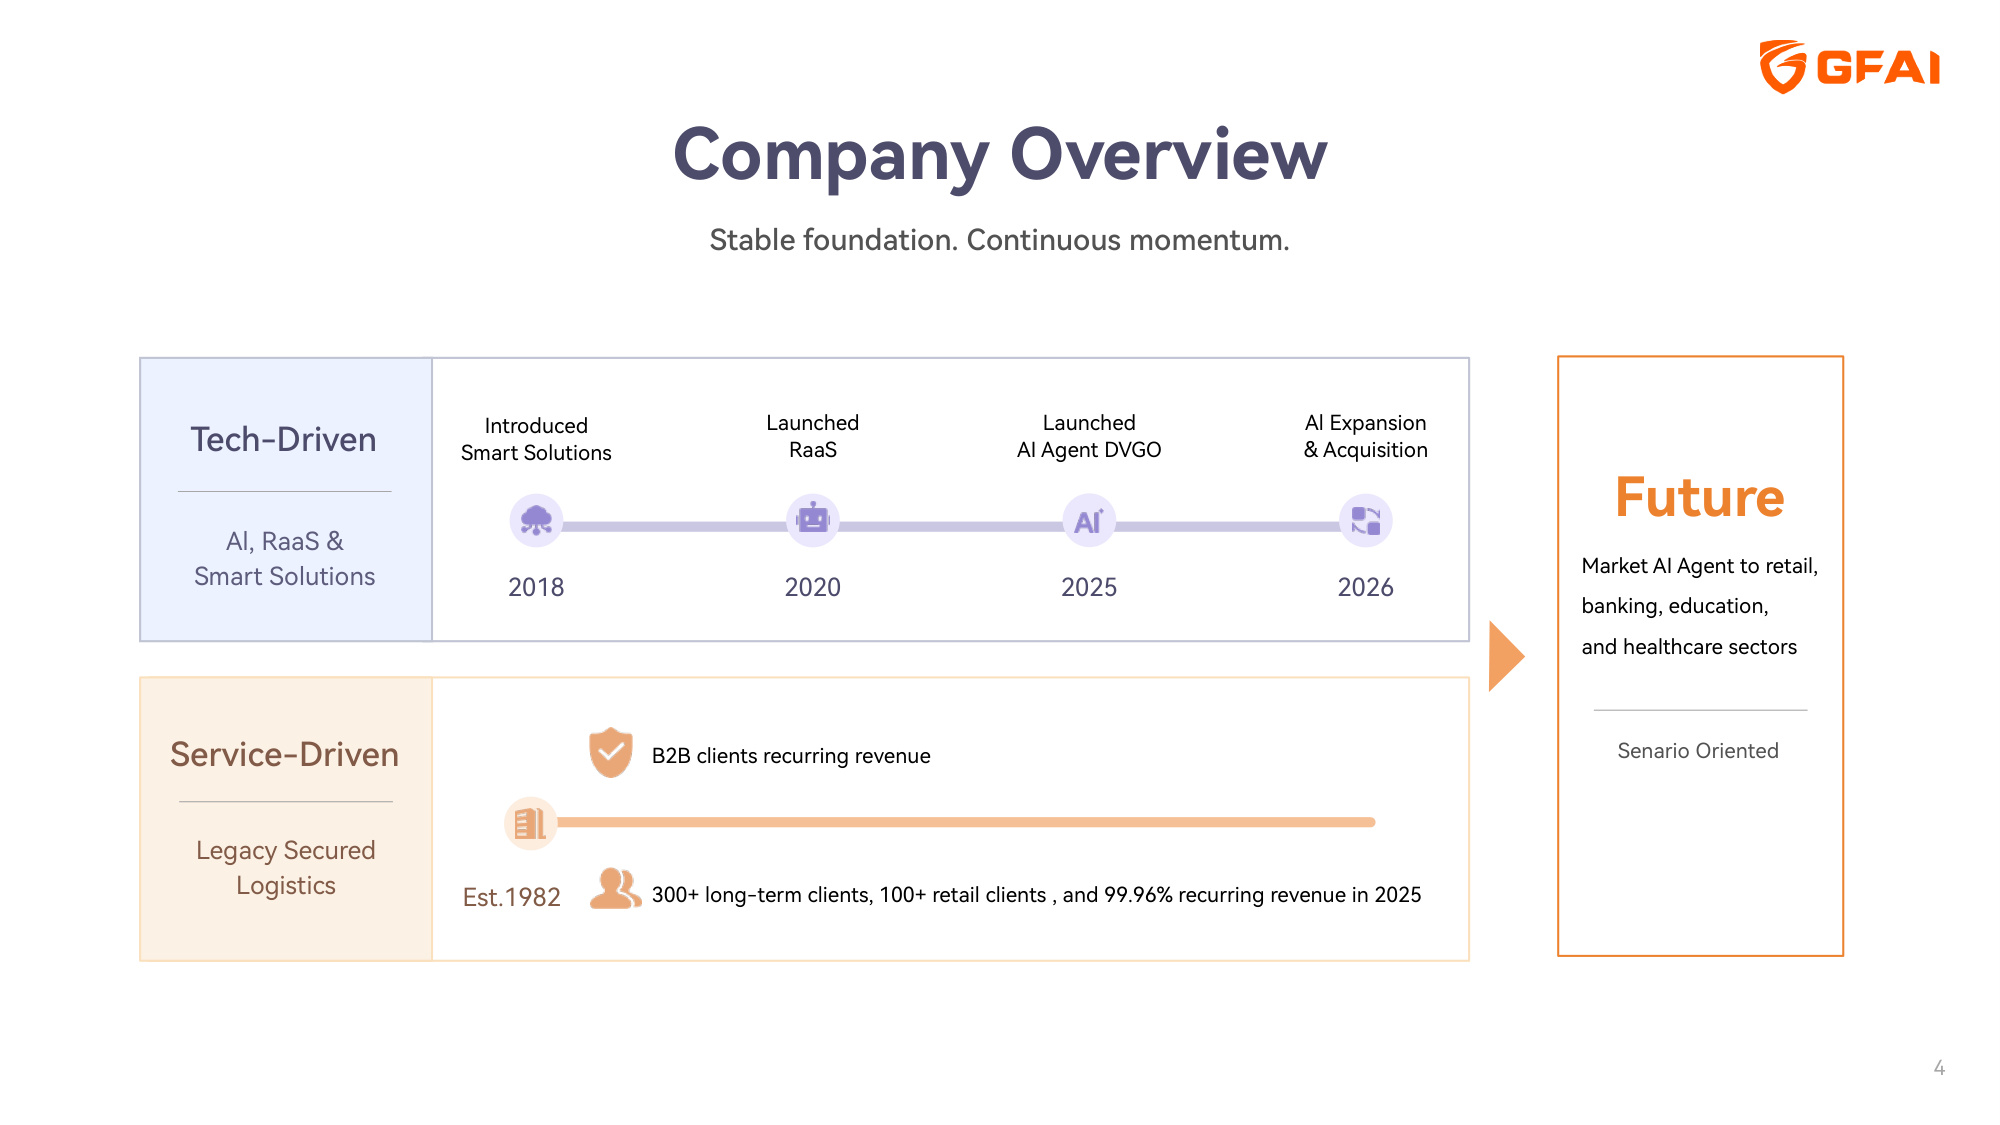
4 Company Overview Introduced Smart Solutions Launched RaaS Launched AI Agent DVGO Al Expansion & Acquisition B2B clients recurring revenue 300+ long-term clients, 100+ retail clients , and 99.96% recurring revenue in 2025 2018 2020 2025 2026 Est.1982 Stable foundation. Continuous momentum. Tech-Driven Al, RaaS & Smart Solutions Service-Driven Legacy Secured Logistics Future Market AI Agent to retail, banking, education, and healthcare sectors Senario Oriented
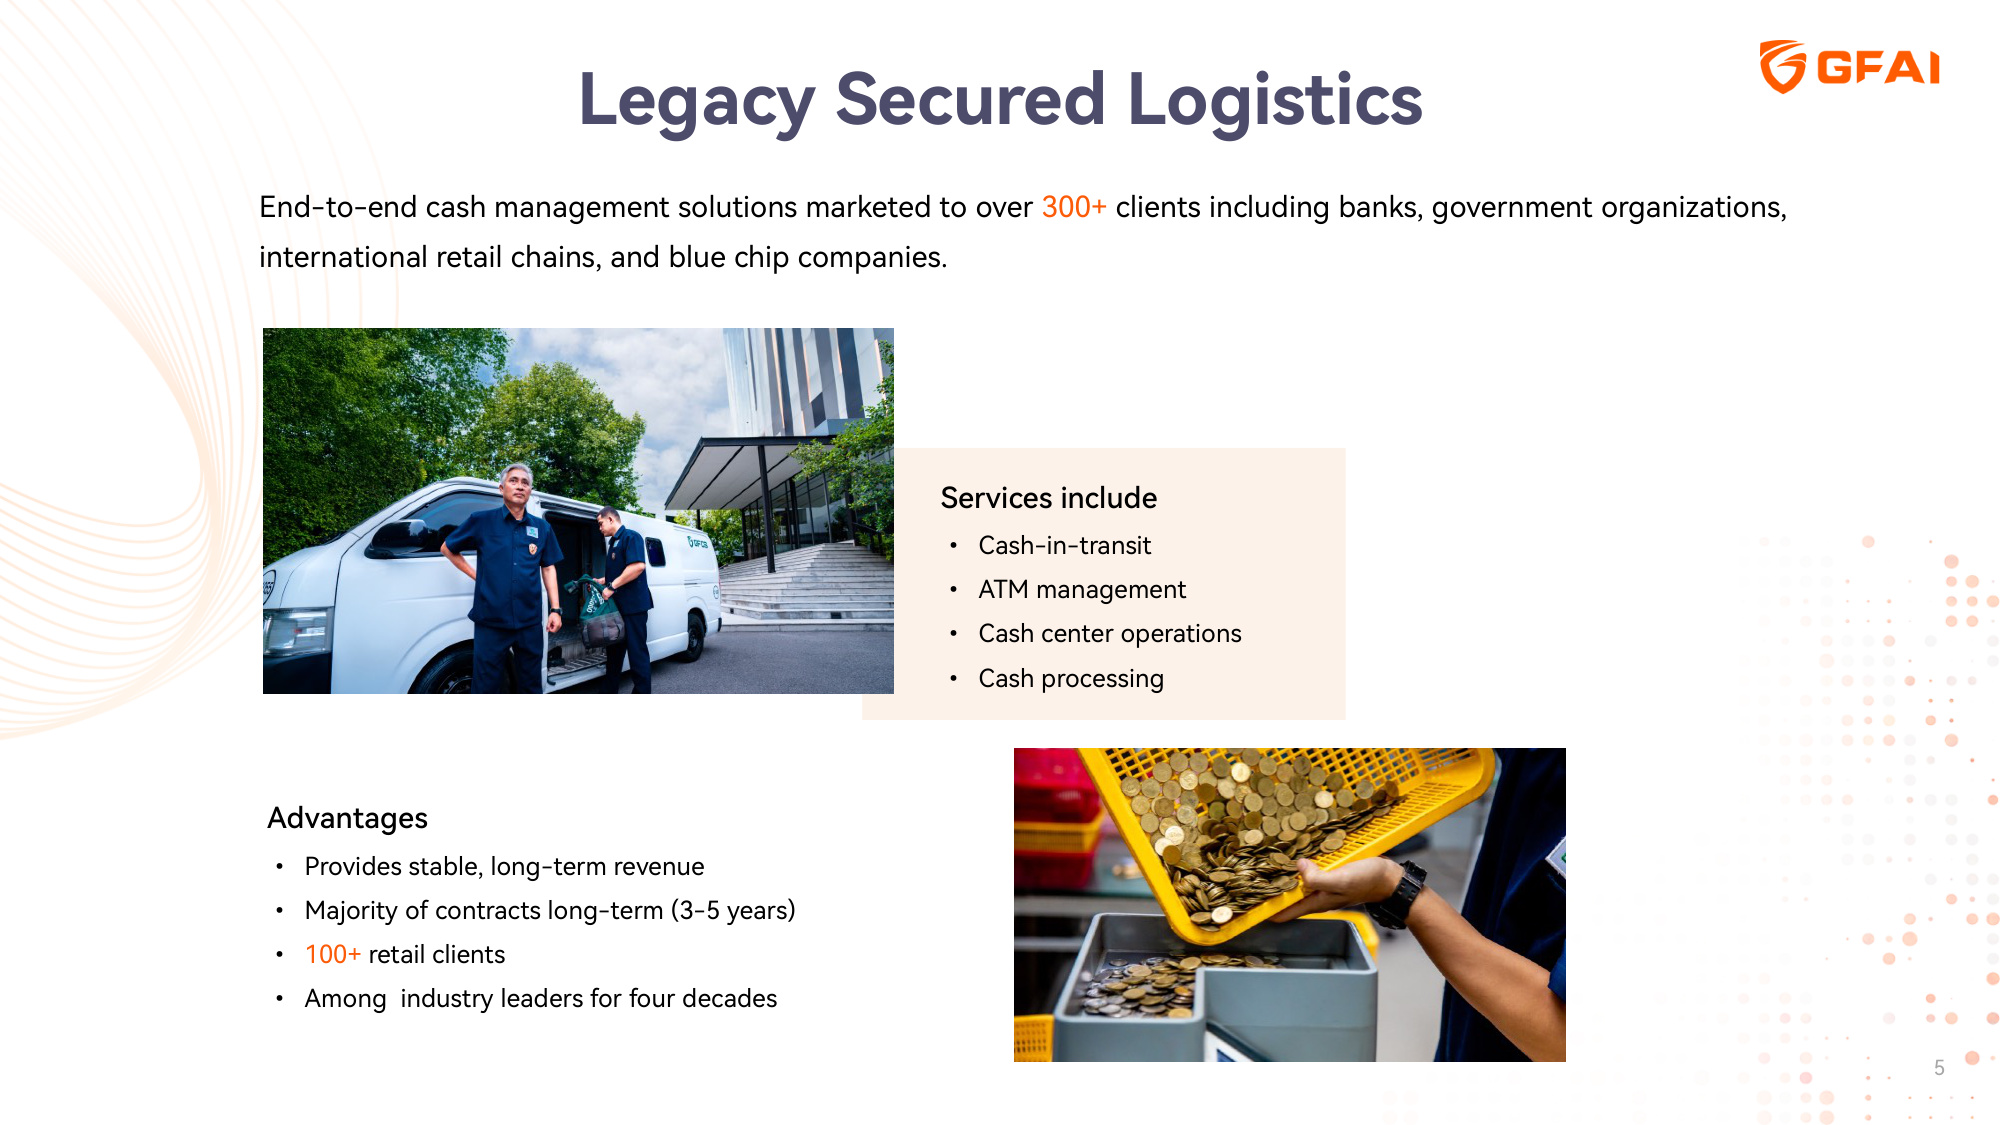
5 Legacy Secured Logistics Advantages • Provides stable, long-term revenue • Majority of contracts long-term (3-5 years) • 100+ retail clients • Among industry leaders for four decades End-to-end cash management solutions marketed to over 300+ clients including banks, government organizations, international retail chains, and blue chip companies. Services include • Cash-in-transit • ATM management • Cash center operations • Cash processing
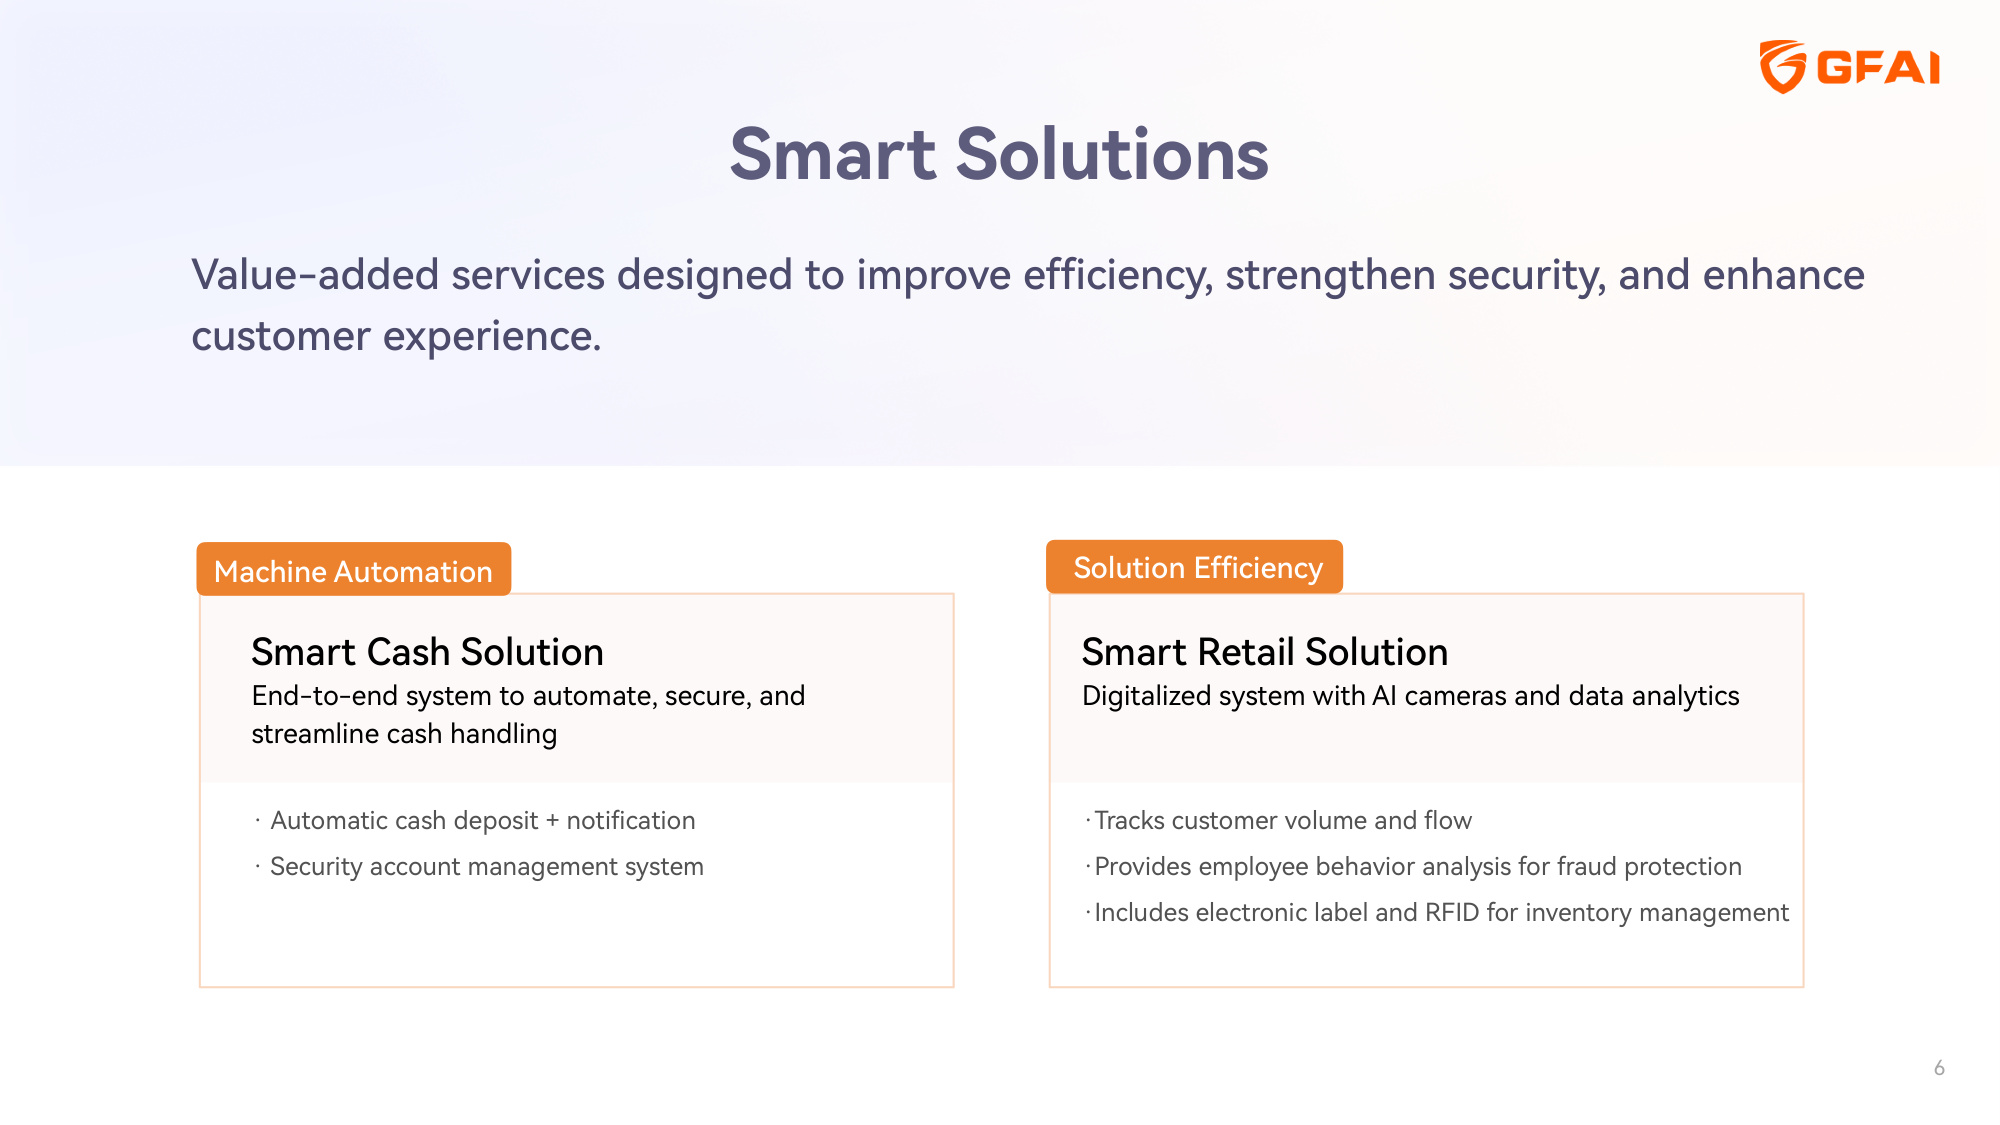
6 Smart Solutions · Automatic cash deposit + notification · Security account management system Smart Cash Solution End-to-end system to automate, secure, and streamline cash handling ·Tracks customer volume and flow ·Provides employee behavior analysis for fraud protection ·Includes electronic label and RFID for inventory management Smart Retail Solution Digitalized system with AI cameras and data analytics Machine Automation Value-added services designed to improve efficiency, strengthen security, and enhance customer experience. Solution Efficiency
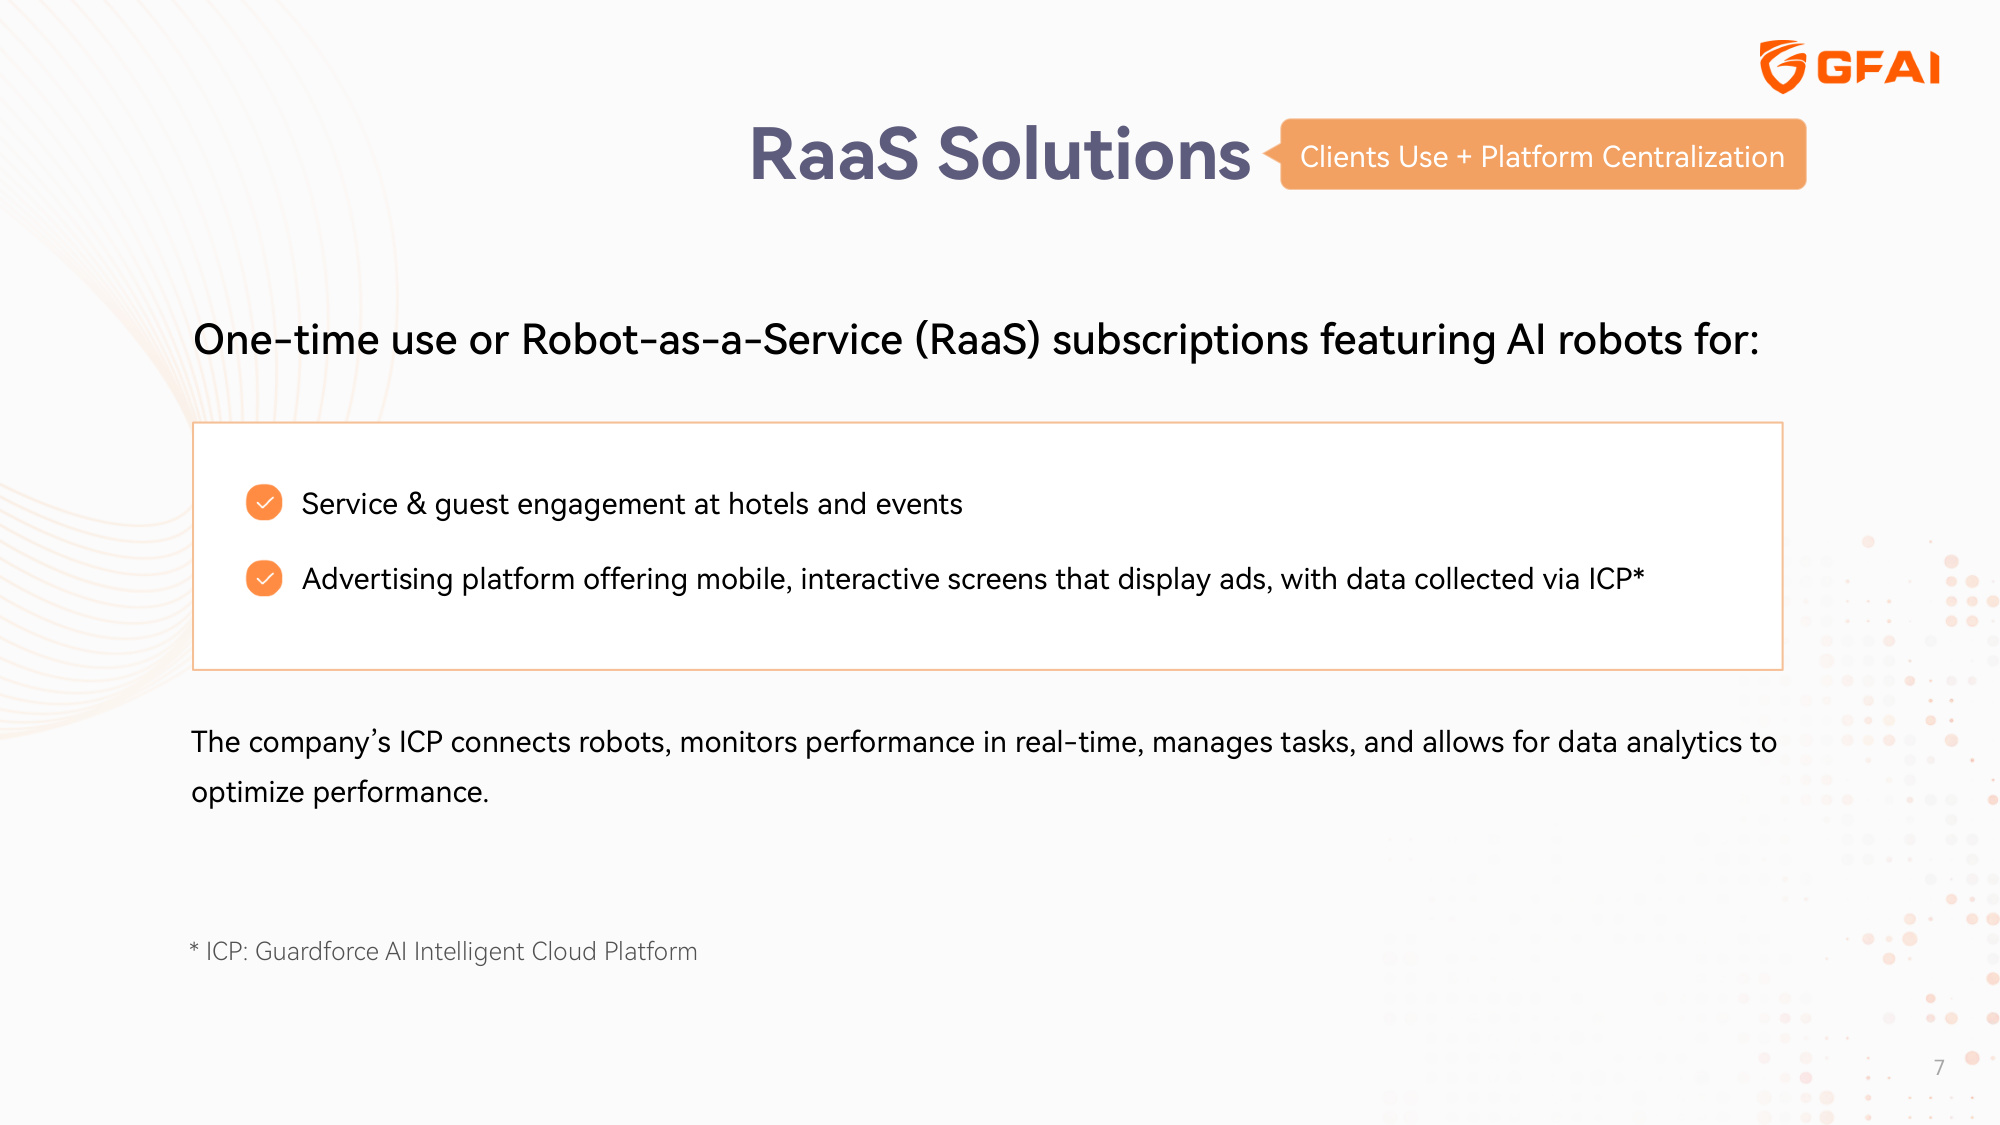
One-time use or Robot-as-a-Service (RaaS) subscriptions featuring AI robots for: Service & guest engagement at hotels and events Advertising platform offering mobile, interactive screens that display ads, with data collected via ICP* The company's ICP connects robots, monitors performance in real-time, manages tasks, and allows for data analytics to optimize performance. RaaS Solutions * ICP: Guardforce AI Intelligent Cloud Platform 7 Clients Use + Platform Centralization
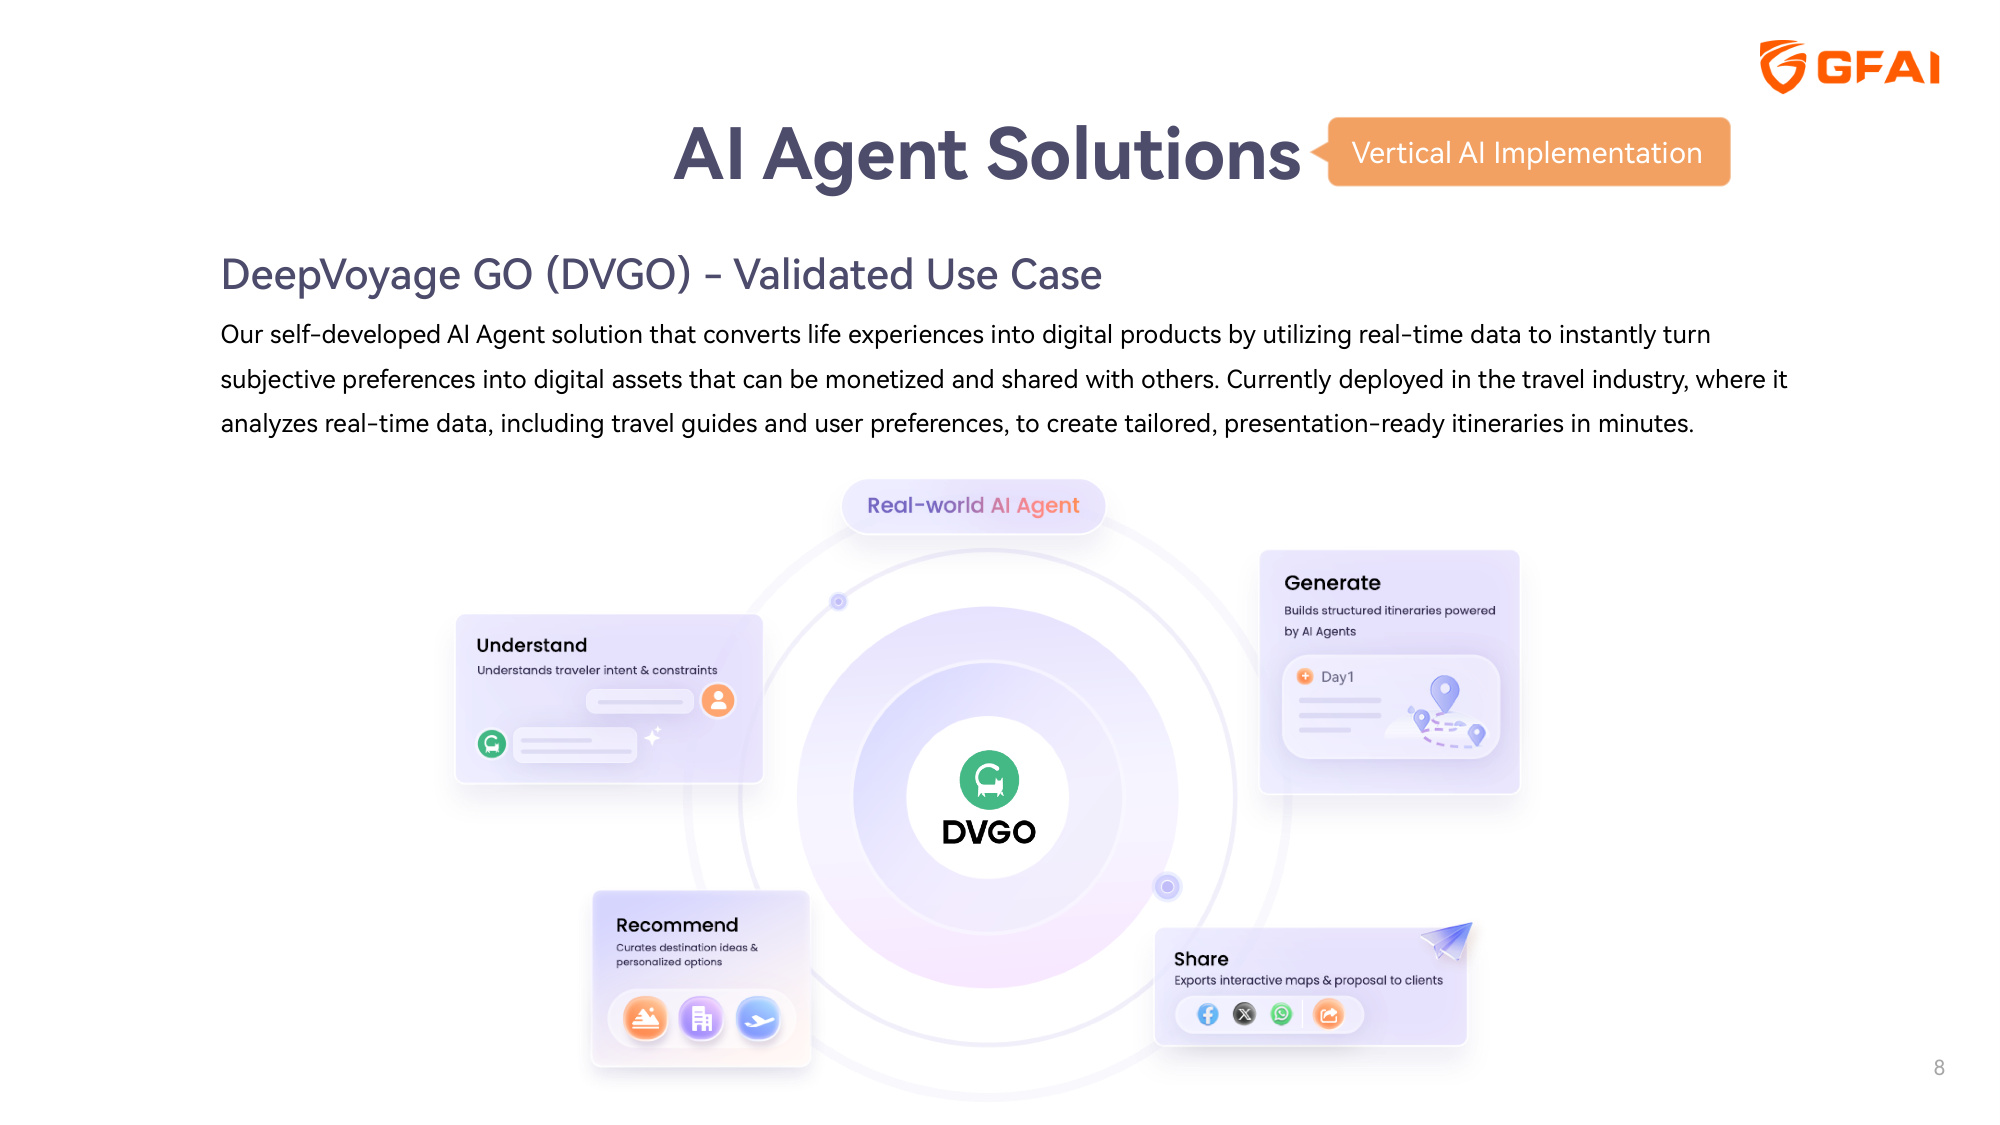
8 AI Agent Solutions DeepVoyage GO (DVGO) - Validated Use Case Our self-developed AI Agent solution that converts life experiences into digital products by utilizing real-time data to instantly turn subjective preferences into digital assets that can be monetized and shared with others. Currently deployed in the travel industry, where it analyzes real-time data, including travel guides and user preferences, to create tailored, presentation-ready itineraries in minutes. Vertical AI Implementation
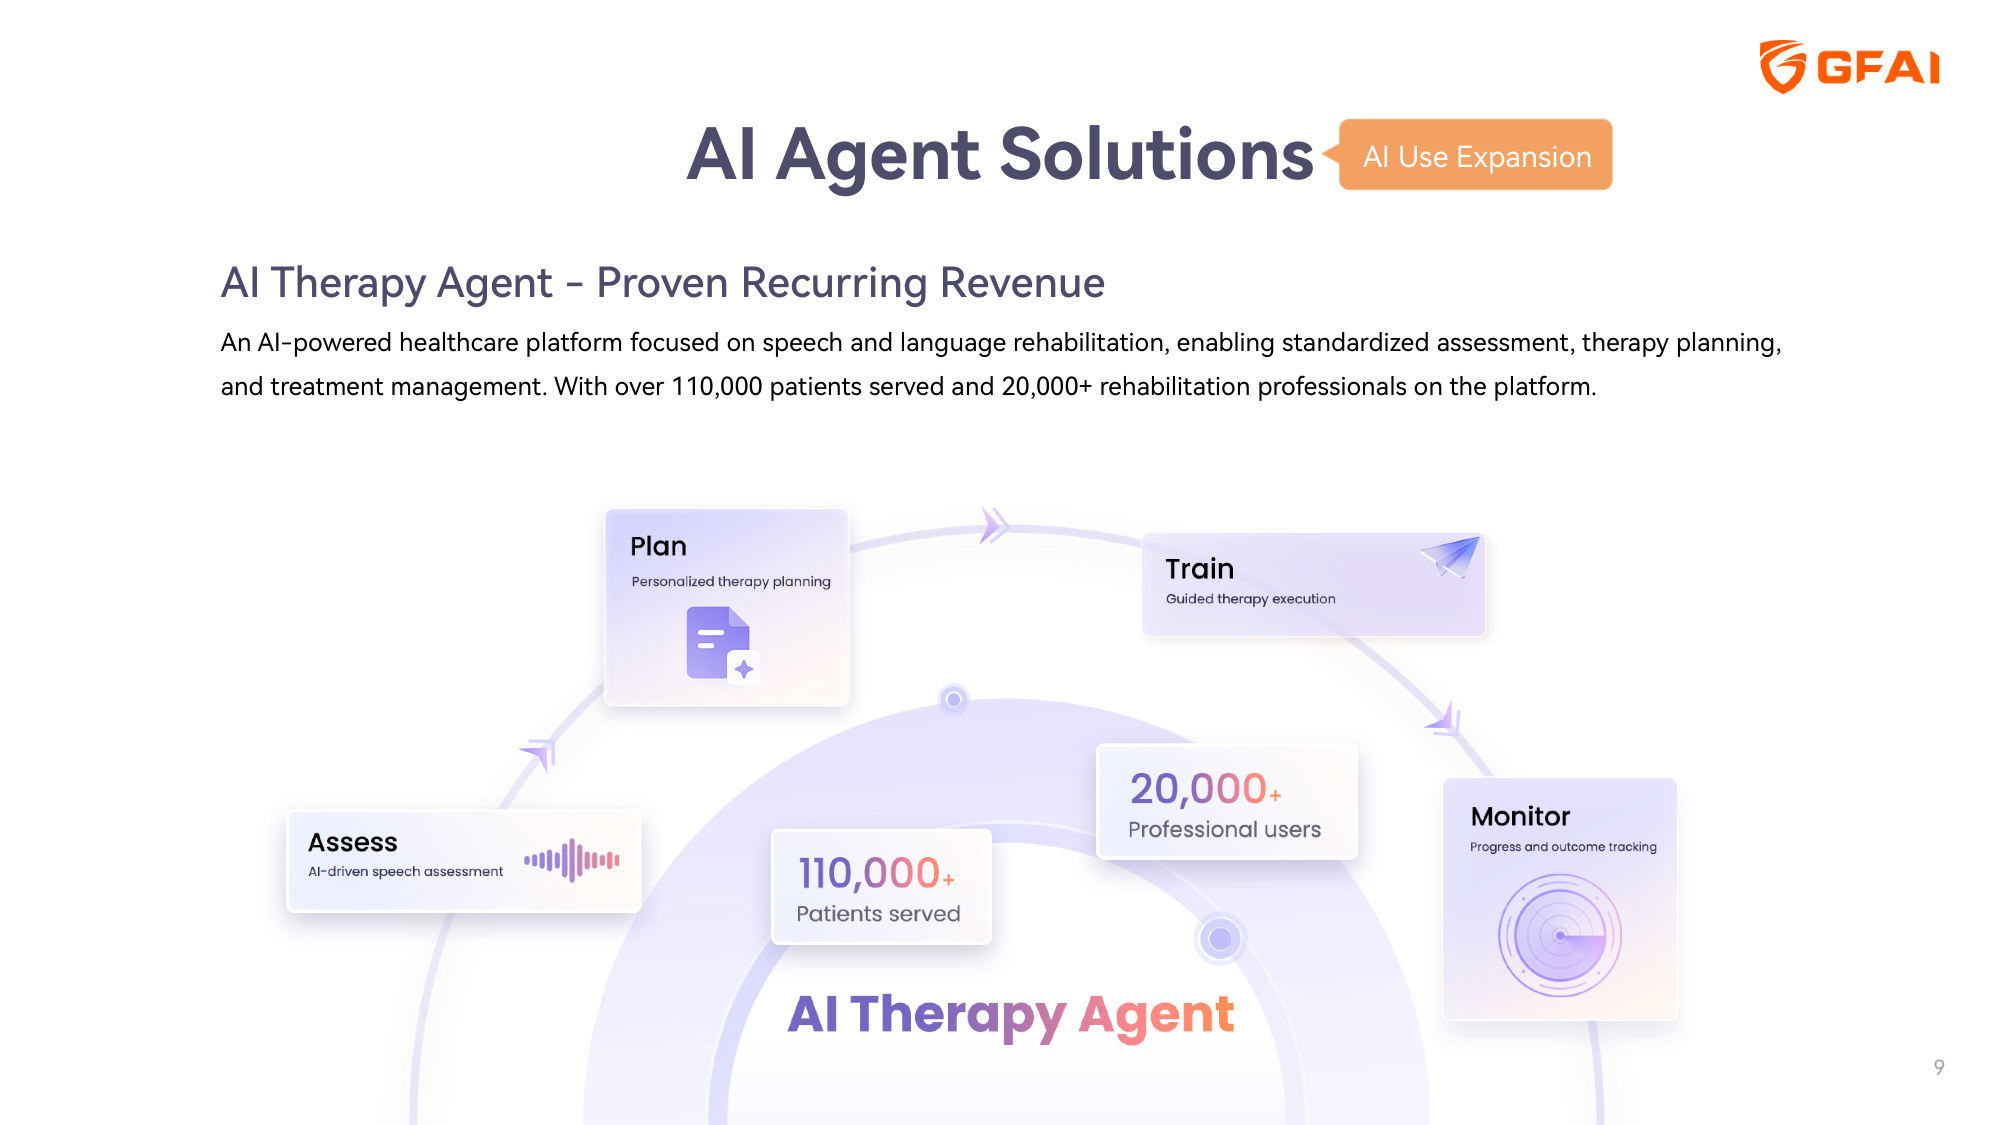
9 AI Therapy Agent - Proven Recurring Revenue An AI-powered healthcare platform focused on speech and language rehabilitation, enabling standardized assessment, therapy planning, and treatment management. With over 110,000 patients served and 20,000+ rehabilitation professionals on the platform. AI Agent Solutions AI Use Expansion
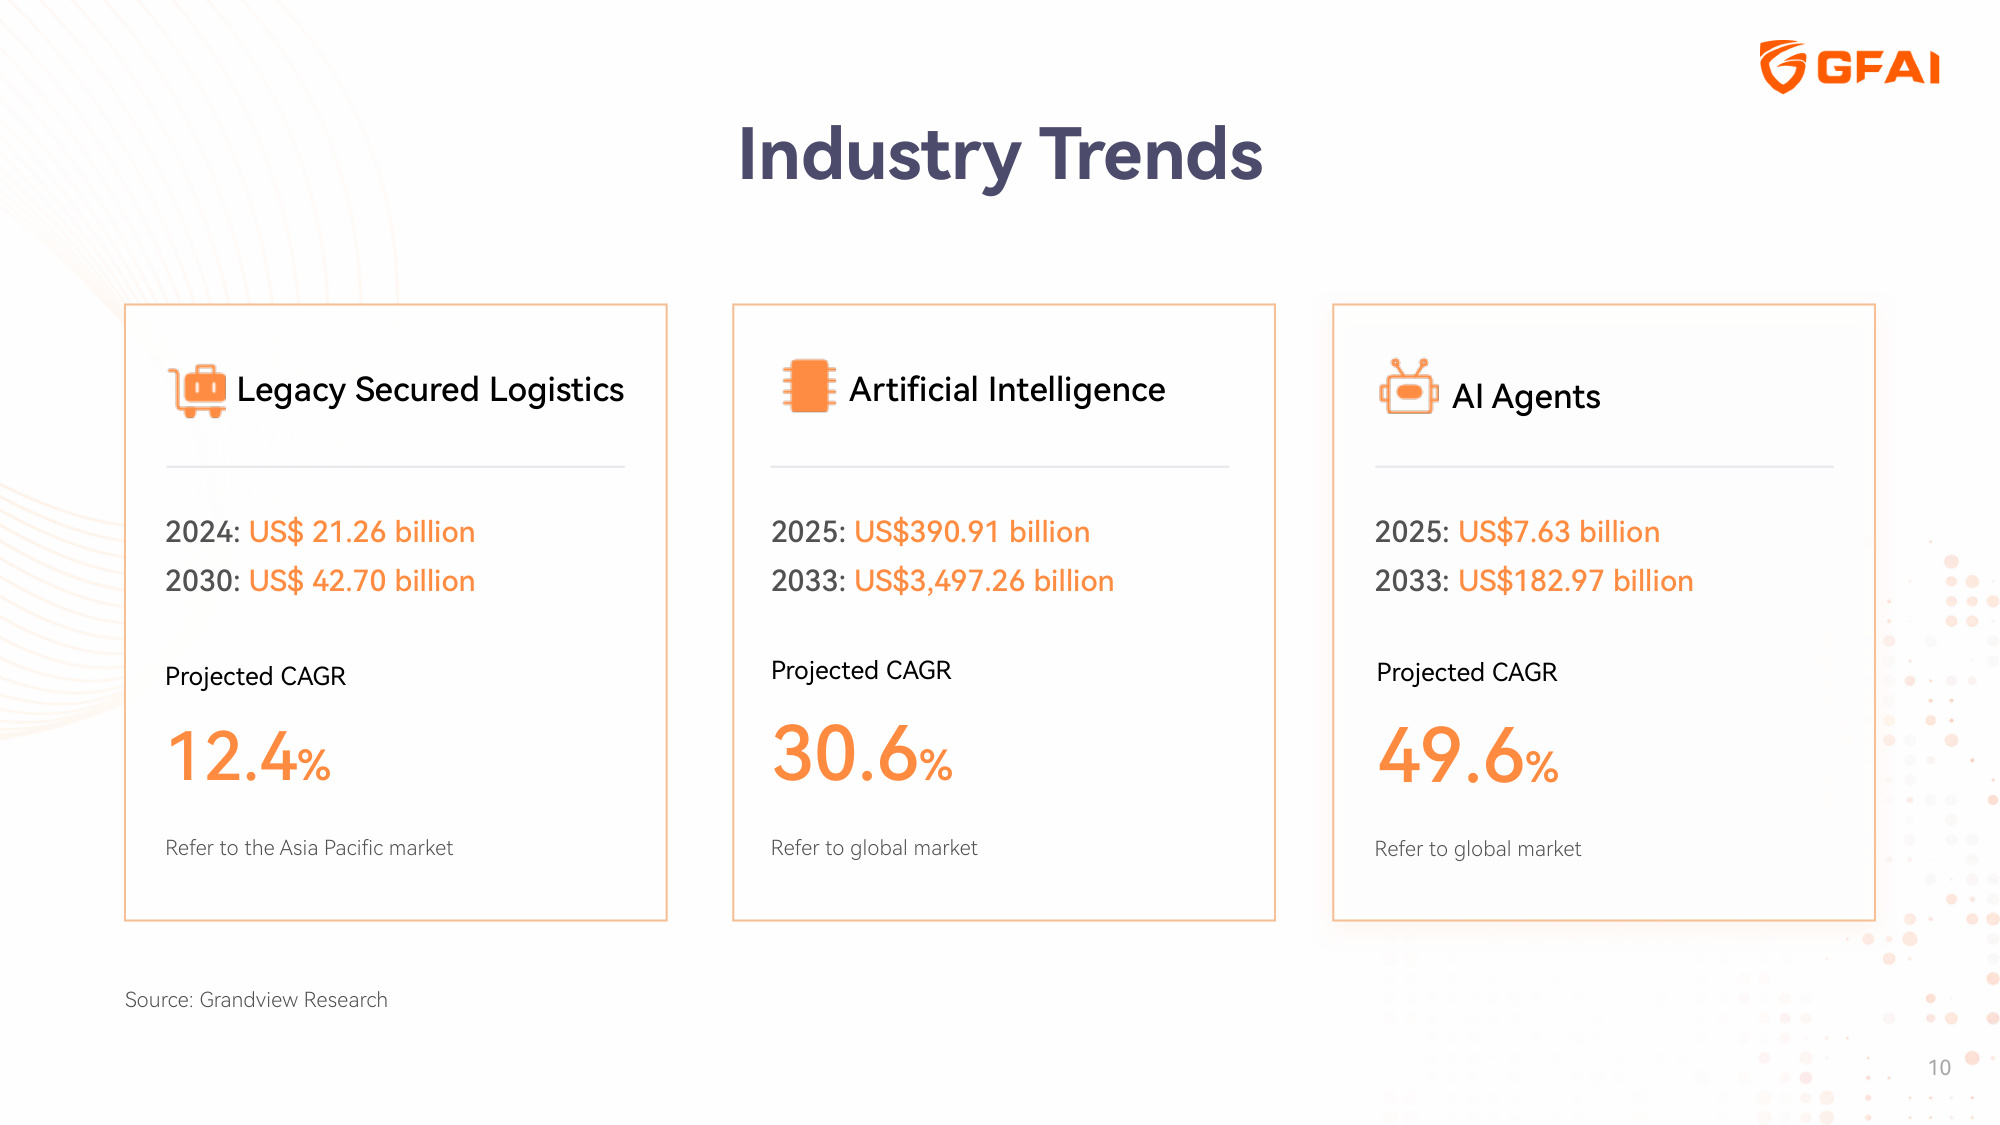
10 Industry Trends Legacy Secured Logistics Projected CAGR 12.4% 2024: US$ 21.26 billion 2030: US$ 42.70 billion Refer to the Asia Pacific market Artificial Intelligence Projected CAGR 30.6% 2025: US$390.91 billion 2033: US$3,497.26 billion Refer to global market AI Agents Projected CAGR 49.6% 2025: US$7.63 billion 2033: US$182.97 billion Refer to global market Source: Grandview Research
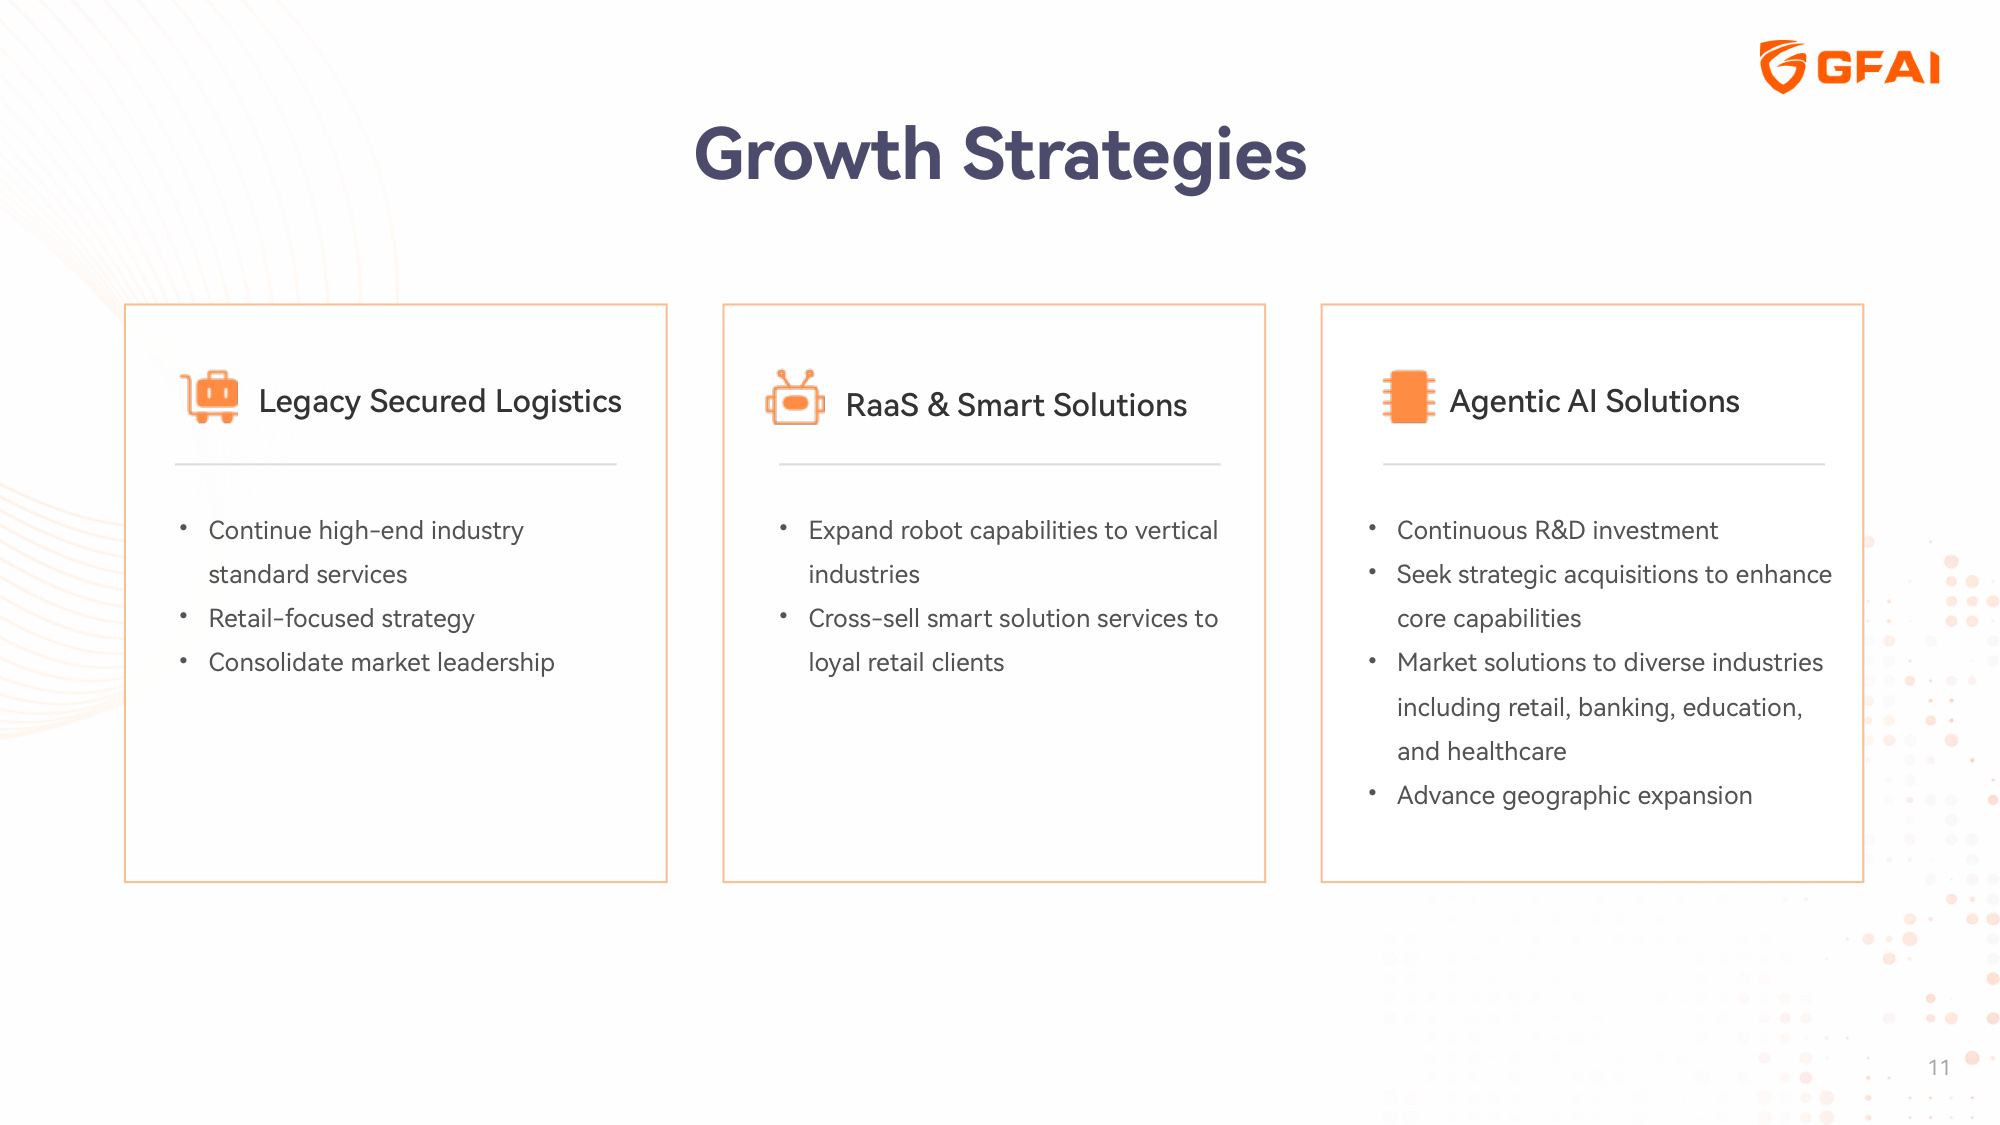
11 Growth Strategies Legacy Secured Logistics • Continue high-end industry standard services • Retail-focused strategy • Consolidate market leadership RaaS & Smart Solutions • Expand robot capabilities to vertical industries • Cross-sell smart solution services to loyal retail clients Agentic AI Solutions • Continuous R&D investment • Seek strategic acquisitions to enhance core capabilities • Market solutions to diverse industries including retail, banking, education, and healthcare • Advance geographic expansion
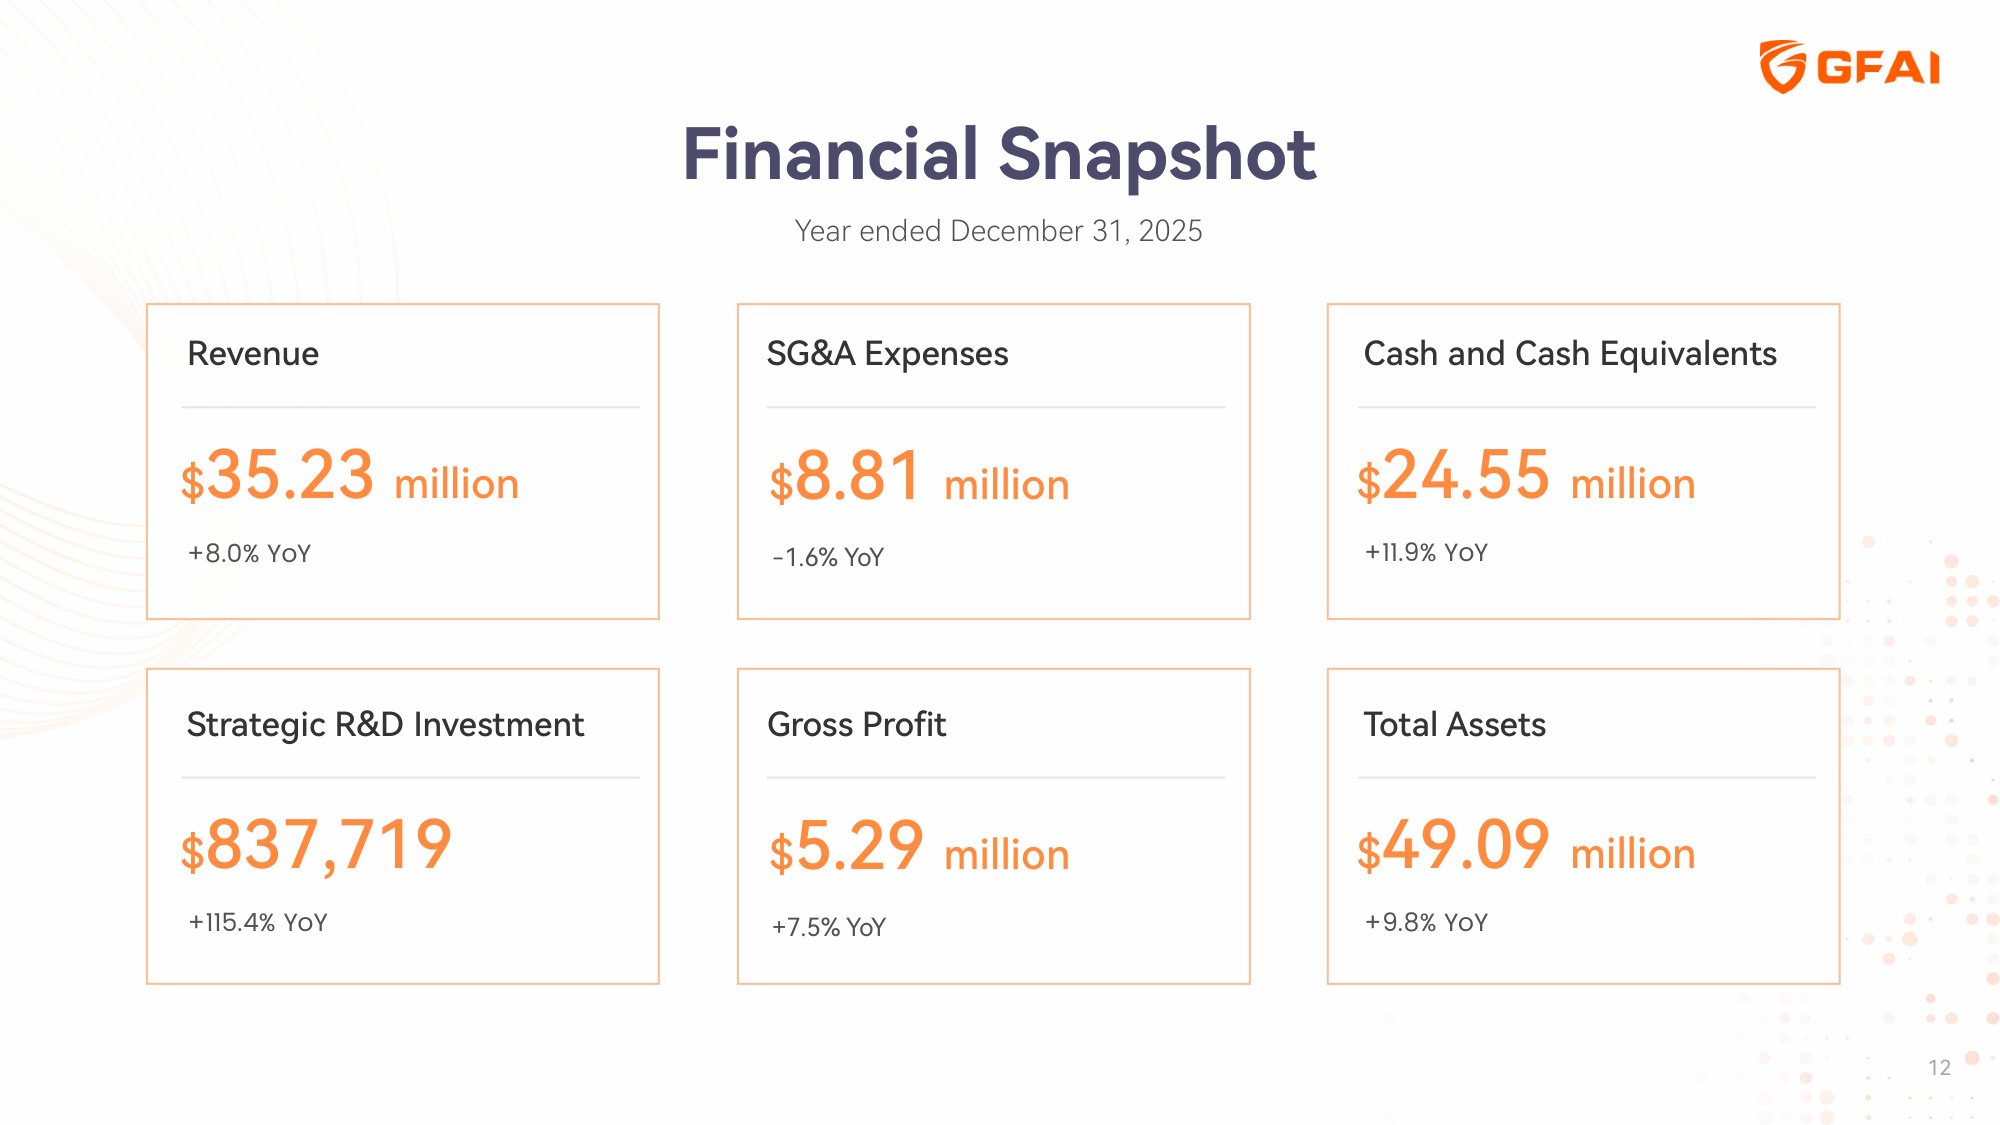
12 Financial Snapshot Year ended December 31, 2025 Revenue $35.23 million +8.0% YoY SG&A Expenses $8.81 million -1.6% YoY Cash and Cash Equivalents $24.55 million +11.9% YoY Strategic R&D Investment $837,719 +115.4% YoY Gross Profit $5.29 million +7.5% YoY Total Assets $49.09 million +9.8% YoY
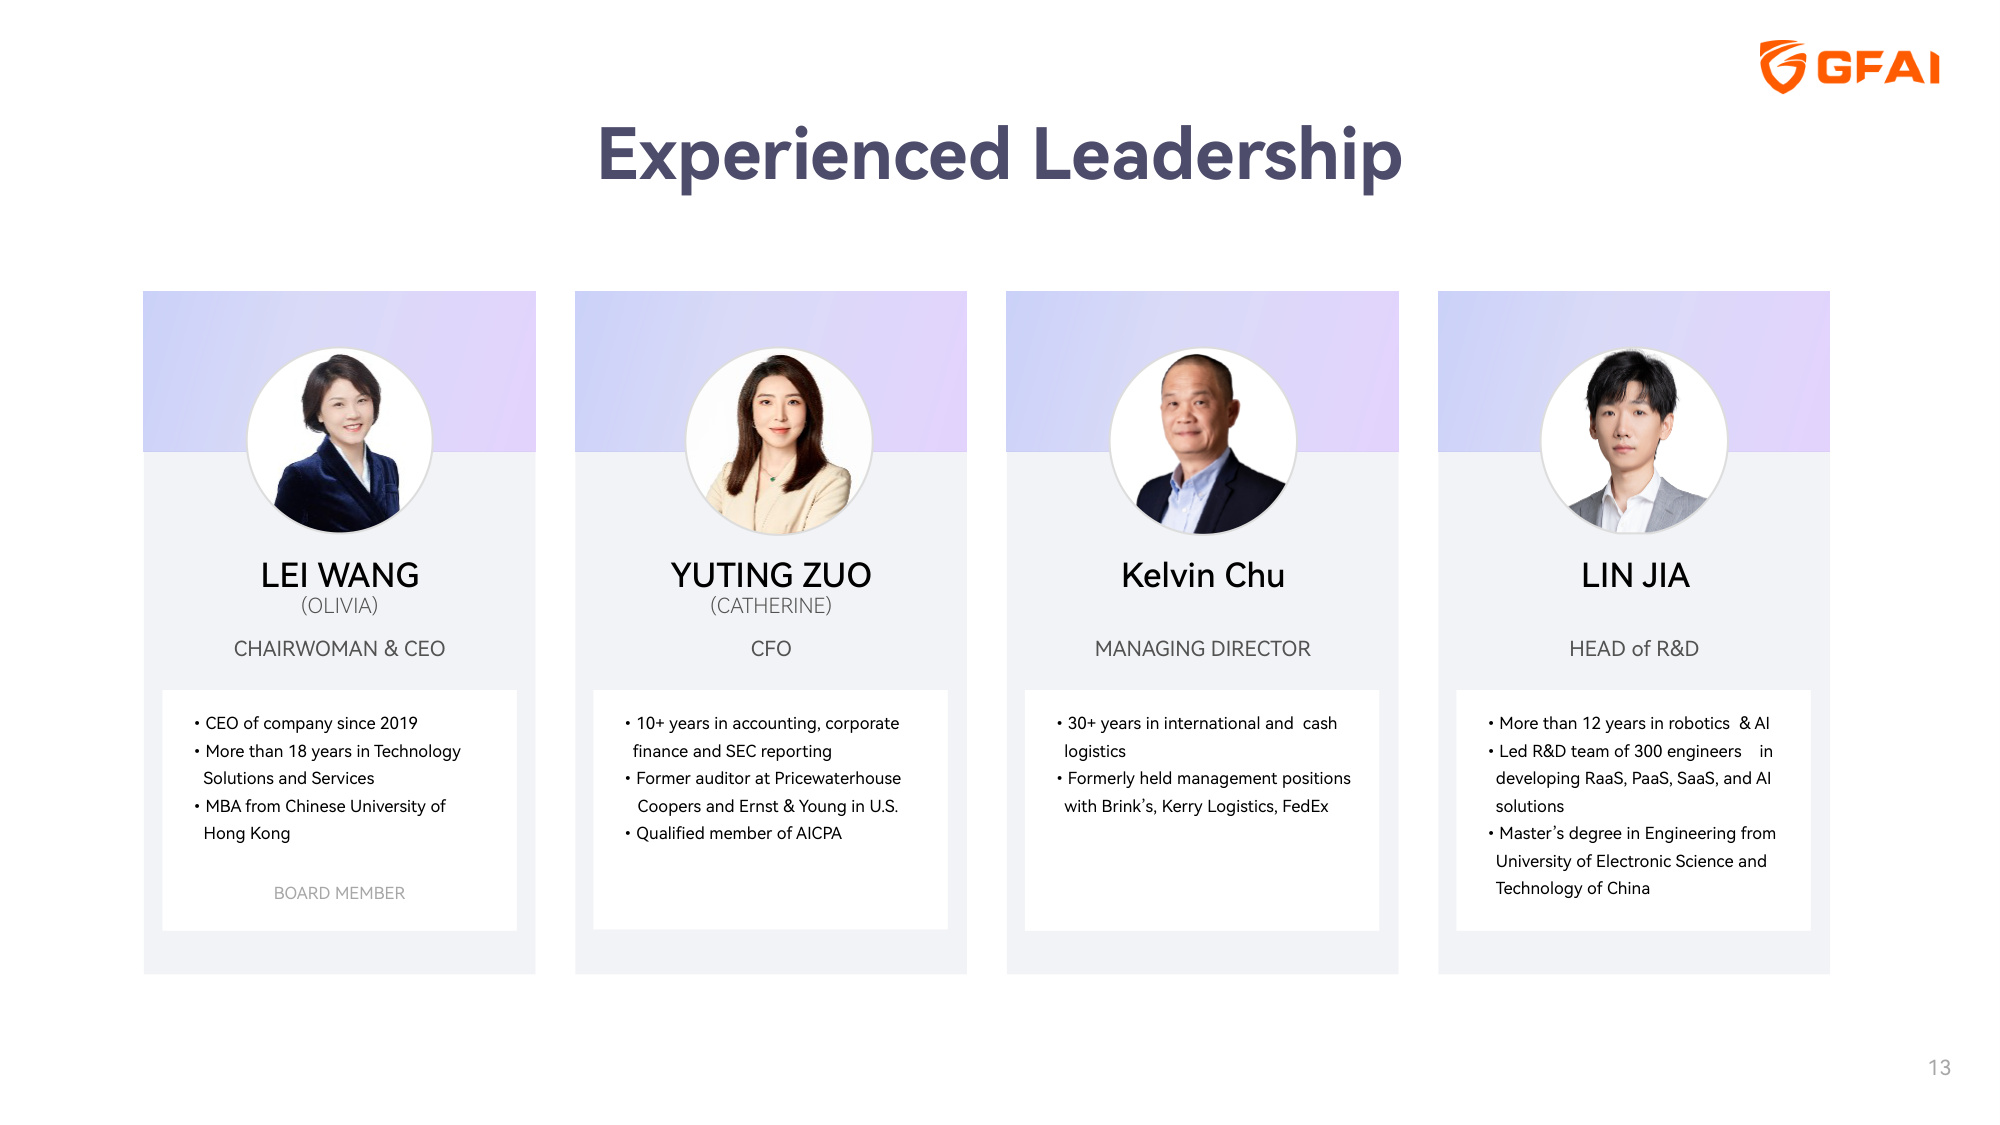
13 Experienced Leadership BOARD MEMBER LEI WANG (OLIVIA) •CEO of company since 2019 •More than 18 years in Technology Solutions and Services •MBA from Chinese University of Hong Kong CHAIRWOMAN & CEO YUTING ZUO (CATHERINE) •10+ years in accounting, corporate finance and SEC reporting •Former auditor at Pricewaterhouse Coopers and Ernst & Young in U.S. •Qualified member of AICPA CFO Kelvin Chu •30+ years in international and cash logistics •Formerly held management positions with Brink's, Kerry Logistics, FedEx MANAGING DIRECTOR LIN JIA •More than 12 years in robotics & AI •Led R&D team of 300 engineers in developing RaaS, PaaS, SaaS, and AI solutions •Master's degree in Engineering from University of Electronic Science and Technology of China HEAD of R&D BOARD MEMBER
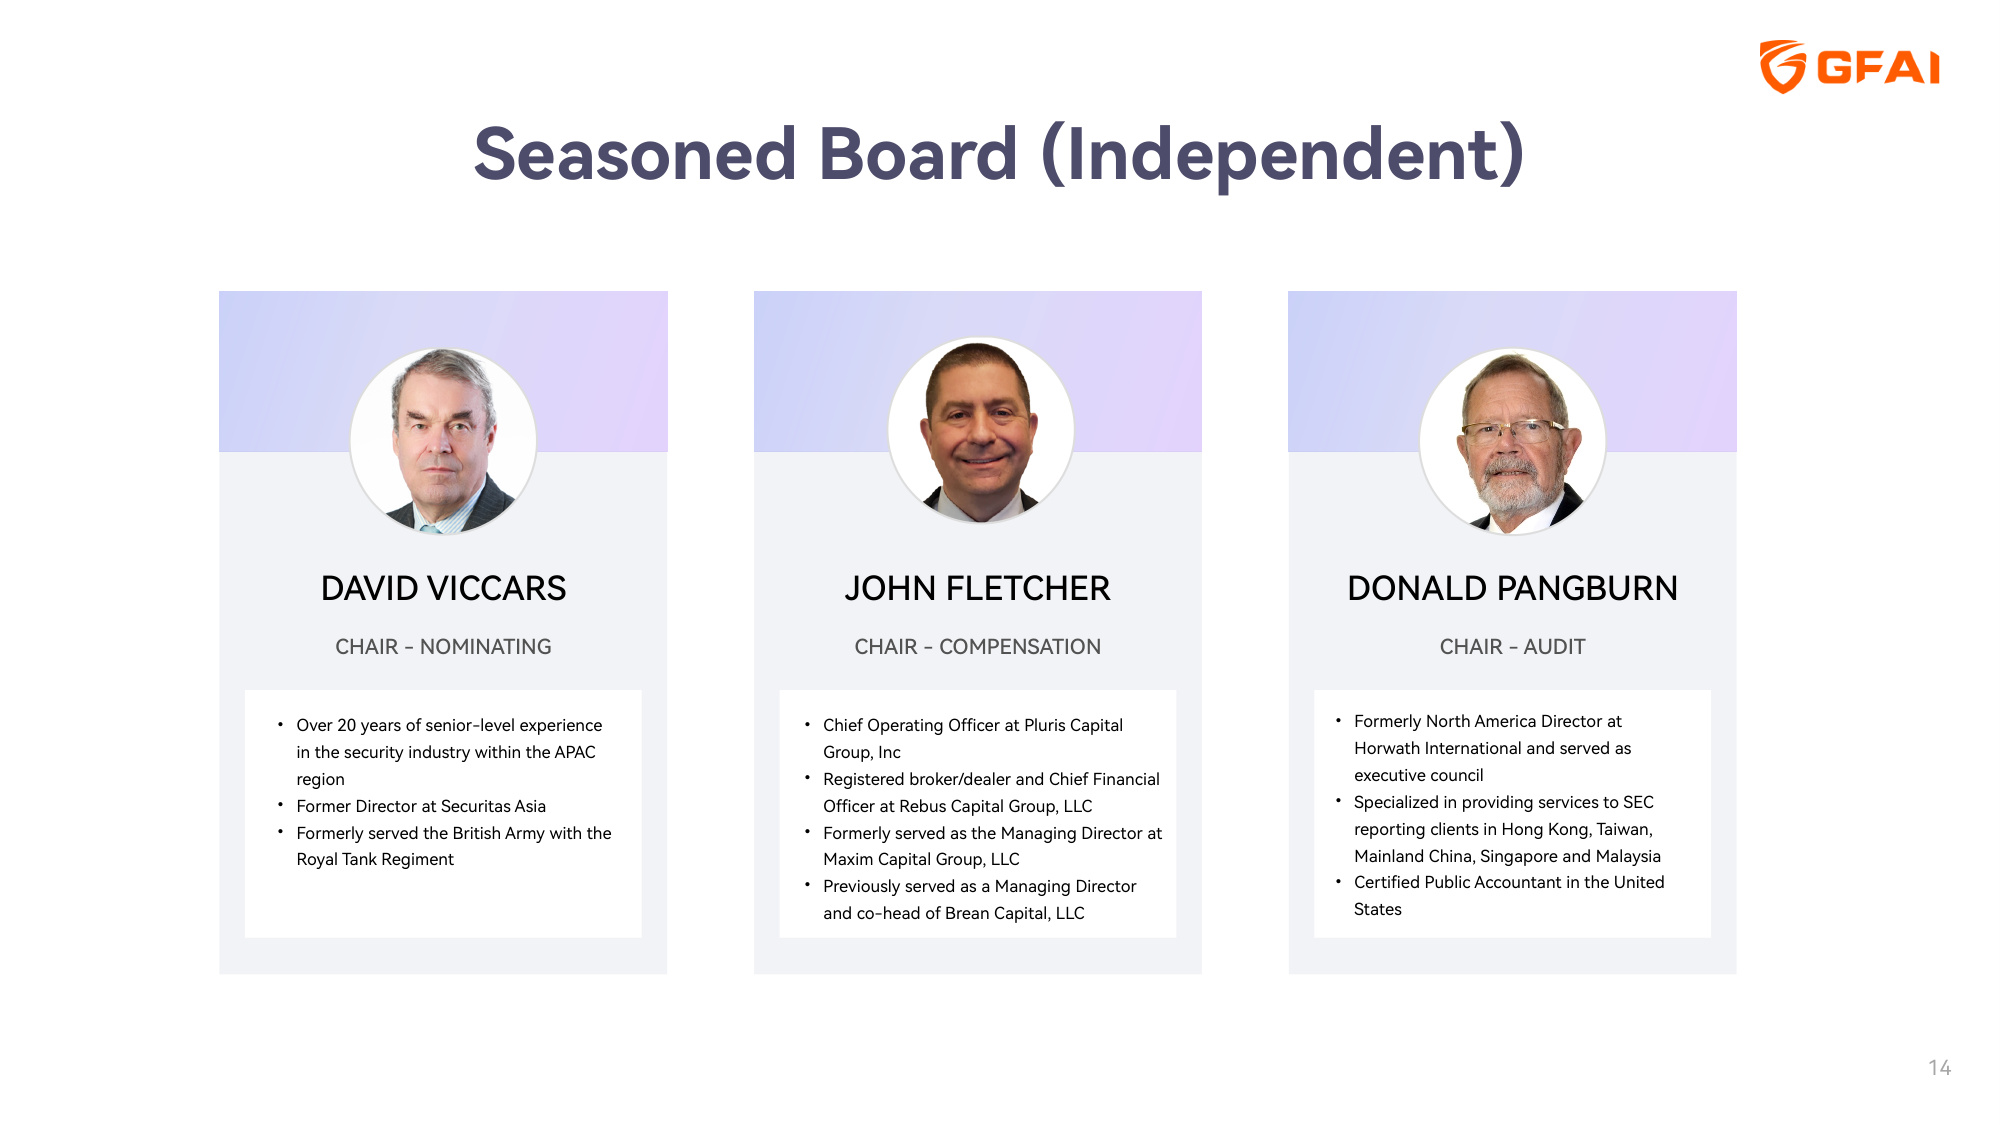
14 Seasoned Board (Independent) BOARD MEMBER BOARD MEMBER BOARD MEMBER DAVID VICCARS • Over 20 years of senior-level experience in the security industry within the APAC region • Former Director at Securitas Asia • Formerly served the British Army with the Royal Tank Regiment CHAIR - NOMINATING JOHN FLETCHER • Chief Operating Officer at Pluris Capital Group, Inc • Registered broker/dealer and Chief Financial Officer at Rebus Capital Group, LLC • Formerly served as the Managing Director at Maxim Capital Group, LLC • Previously served as a Managing Director and co-head of Brean Capital, LLC CHAIR - COMPENSATION DONALD PANGBURN CHAIR - AUDIT • Formerly North America Director at Horwath International and served as executive council • Specialized in providing services to SEC reporting clients in Hong Kong, Taiwan, Mainland China, Singapore and Malaysia • Certified Public Accountant in the United States
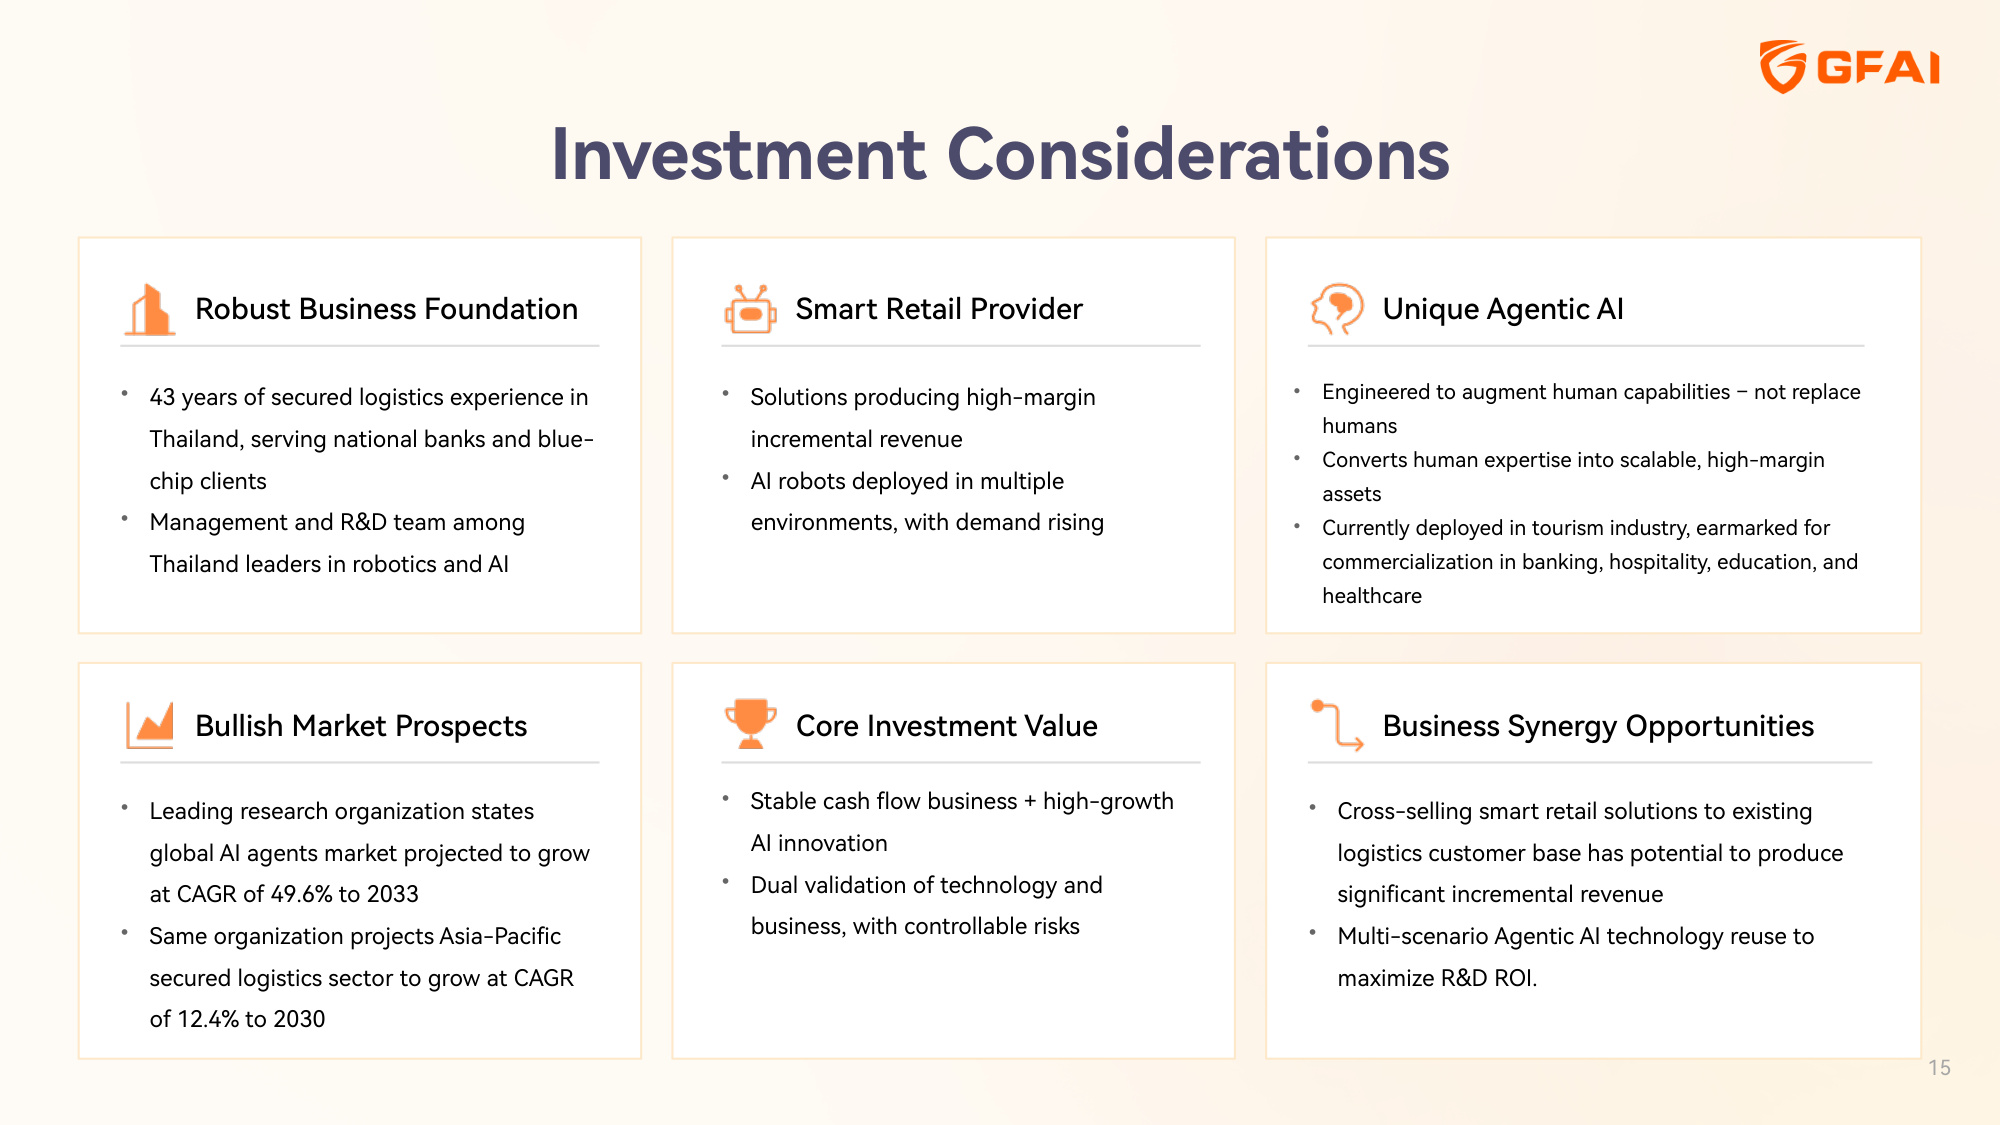
15 Investment Considerations Robust Business Foundation Bullish Market Prospects • 43 years of secured logistics experience in Thailand, serving national banks and blue- chip clients • Management and R&D team among Thailand leaders in robotics and AI • Leading research organization states global AI agents market projected to grow at CAGR of 49.6% to 2033 • Same organization projects Asia-Pacific secured logistics sector to grow at CAGR of 12.4% to 2030 Smart Retail Provider Core Investment Value • Solutions producing high-margin incremental revenue • AI robots deployed in multiple environments, with demand rising • Stable cash flow business + high-growth AI innovation • Dual validation of technology and business, with controllable risks Unique Agentic AI Business Synergy Opportunities • Engineered to augment human capabilities – not replace humans • Converts human expertise into scalable, high-margin assets • Currently deployed in tourism industry, earmarked for commercialization in banking, hospitality, education, and healthcare • Cross-selling smart retail solutions to existing logistics customer base has potential to produce significant incremental revenue • Multi-scenario Agentic AI technology reuse to maximize R&D ROI.
16 Investor Relations Skyline Corporate Communications Group, LLC President Office: (646) 893-5835 Office: (646) 893-5835 Email: [email protected] Guardforce AI Corporate Communications Hu Yu Email: [email protected] @Guardforceai https://www.guardforceai.com

Appendix Check out our progress 17
Non-IFRS Financial Data* *To supplement our consolidated financial statements, which are prepared and presented in accordance with IFRS, we use the non-IFRS adjusted EBITDA as financial measures for our consolidated results. We believe that adjusted EBITDA helps identify underlying trends in our business that could otherwise be distorted by the effect of certain income or expenses that we include in loss from operations and net loss. We believe that these non-IFRS measures provide useful information about our core operating results, enhance the overall understanding of our past performance and future prospects and allow for greater visibility with respect to key metrics used by our management in its financial and operational decision-making. We present the non-IFRS financial measures in order to provide more information and greater transparency to investors about our operating results. **EBITDA represents net income before (i) finance costs, income taxes and depreciation of fixed assets and amortization of intangible assets, which we do not believe are reflective of our core operating performance during the periods presented. Non-IFRS adjusted EBITDA represents net loss from continuing operations before (i) finance (income) costs, net, foreign exchange losses (gain), income tax (benefit) expense and depreciation of fixed assets and amortization of intangible assets, (ii) certain non-cash expenses, consisting of stock-based compensation expense, provision for and written off of withholding tax receivables. Non-IFRS earnings per share represents non-IFRS net income attributable to ordinary shareholders divided by the weighted average number of shares outstanding during the periods. Non-IFRS diluted earnings per share represents non-IFRS net income attributable to ordinary shareholders divided by the weighted average number of shares outstanding during the periods on a diluted basis. The table above is a reconciliation of our net loss to EBITDA and non-IFRS net loss for the periods indicated. For the years ended December 31, 2025 2024 (Restated) Net loss from continuing operations – IFRS $ (5,286,128) $ (5,882,647) Finance (income) costs, net (471,374) (338,887) Income tax expense (benefit) (6,394) (125,925) Depreciation and amortization expense 3,285,884 3,116,214 EBITDA** (2,478,012) (3,231,245) Stock-based compensation expense 1,350,800 1,849,356 Provision for expected credit losses on trade receivables and other receivables 16,995 210,437 Impairment on goodwill - 30,575 Impairment on intangible assets - 188,797 Provision for withholding taxes receivables 149,838 4,339 Foreign exchange losses (gains), net 19,825 (5760) Adjusted EBITDA (Non-IFRS) $ (940,554) $ (953,501) 18