JMSB 8-K
John Marshall Bancorp, Inc. (JMSB)
UNITED STATES
SECURITIES AND EXCHANGE COMMISSION
Washington, D.C. 20549
FORM
CURRENT REPORT
Pursuant to Section 13 or 15(d) of the Securities Exchange Act of 1934
Date of Report (Date of earliest event reported):
(Exact name of registrant as specified in its charter)
|
| |||
(State or other jurisdiction of incorporation) |
| (Commission File Number) |
| (IRS Employer Identification No.) |
(Address, including zip code, of principal executive offices)
Registrant’s telephone number, including area code: (
Check the appropriate box below if the Form 8-K filing is intended to simultaneously satisfy the filing obligation of the registrant under any of the following provisions (see General Instruction A.2. below):
Written communications pursuant to Rule 425 under the Securities Act (17 CFR 230.425) | ||
Soliciting material pursuant to Rule 14a-12 under the Exchange Act (17 CFR 240.14a-12) | ||
Pre-commencement communications pursuant to Rule 14d-2(b) under the Exchange Act (17 CFR 240.14d-2(b)) | ||
Pre-commencement communications pursuant to Rule 13e-4(c) under the Exchange Act (17 CFR 240.13e-4(c)) |
Securities registered pursuant to Section 12(b) of the Act:
Title of each class registered |
| Trading symbol(s) |
| Name of each exchange on which registered |
|
|
Indicate by check mark whether the registrant is an emerging growth company as defined in Rule 405 of the Securities Act of 1933 (§230.405 of this chapter) or Rule 12b-2 of the Securities Exchange Act of 1934 (§240.12b-2 of this chapter).
Emerging growth company
If an emerging growth company, indicate by check mark if the registrant has elected not to use the extended transition period for complying with any new or revised financial accounting standards provided pursuant to Section 13(a) of the Exchange Act.
Item 5.07 Submission of Matters to a Vote of Security Holders.
John Marshall Bancorp, Inc. (the “Company”) held its Annual Meeting of Shareholders on June 18, 2024 (the “Annual Meeting”). At the Annual Meeting, the shareholders of the Company voted on the proposals below, each of which was described in the Company’s proxy statement for the Annual Meeting. The voting results for each proposal are as follows:
Proposal 1 – Election of Directors
The shareholders elected the nine nominees named in the Company’s proxy statement for the Annual Meeting, to serve until the 2025 Annual Meeting of Shareholders and until their successors are elected and qualified. There were no nominees other than those listed below. The voting results were as follows:
For | Withhold | Broker Non-Vote | |||
Philip W. Allin | 6,009,591 | 1,706,760 | 2,283,699 | ||
Christopher W. Bergstrom | 6,976,050 | 740,301 | 2,283,699 | ||
Philip R. Chase | 6,691,827 | 1,024,524 | 2,283,699 | ||
Michael T. Foster | 7,340,336 | 376,015 | 2,283,699 | ||
Michael A. Garcia | 7,309,143 | 407,205 | 2,283,702 | ||
Subhash K. Garg | 7,658,751 | 57,600 | 2,283,699 | ||
Jonathan C. Kinney | 7,569,464 | 146,887 | 2,283,699 | ||
O. Leland Mahan | 7,664,324 | 52,027 | 2,283,699 | ||
Lim P. Nguonly | 6,704,458 | 1,011,893 | 2,283,699 |
Proposal 2 - Ratification of the Appointment of Independent Registered Public Accounting Firm
The shareholders voted to ratify the appointment of Yount, Hyde & Barbour, P.C. as the Company’s independent registered public accounting firm for the fiscal year ending December 31, 2024. The voting results were as follows:
For | Against | Abstain | Broker | |||
9,955,559 | 31,938 | 12,553 | - |
Item 9.01 Financial Statements and Exhibits.
Exhibit No. |
| Description |
99.1 | ||
104 | Cover Page Interactive Data File (embedded within the Inline XBRL document). | |
SIGNATURES
Pursuant to the requirements of the Securities Exchange Act of 1934, the registrant has duly caused this report to be signed on its behalf by the undersigned hereunto duly authorized.
|
| JOHN MARSHALL BANCORP, INC. | ||||
Date: June 21, 2024 |
|
| By: |
| /s/ Kent D. Carstater | |
|
|
| Kent D. Carstater Senior Executive Vice President, Chief Financial Officer | |||
| June 18, 2024 Annual Shareholders’ Meeting 1 |

| Forward Looking Statements 2 In addition to historical information, this presentation contains forward-looking statements within the meaning of the Private Securities Litigation Reform Act of 1995 that are based on certain assumptions and describe future plans, strategies and expectations of John Marshall Bancorp, Inc. (the “Company”). These forward-looking statements are generally identified by use of the words “believe,” “expect,” “intend,” “anticipate,” “estimate,” “project,” “will,” “should,” “may,” “view,” “opportunity,” “potential,” or similar expressions. Our ability to predict results or the actual effect of future plans or strategies is inherently uncertain. These forward-looking statements are based on our beliefs and assumptions and on the information available to us at the time that these disclosures were prepared, and involve known and unknown risks, uncertainties and other factors that may cause our actual results to differ materially from any future results expressed or implied by such forward-looking statements. Although we believe the expectations reflected in such forward-looking statements are reasonable, we can give no assurance such expectations will prove to have been correct. Should any known or unknown risks and uncertainties develop into actual events, those developments could have material adverse effects on our business, financial condition and results of operations. Factors that could have a material adverse effect on the operations of the Company and John Marshall Bank include, but are not limited to, the following: the concentration of our business in the Washington, D.C. metropolitan area and the effect of changes in the economic, political and environmental conditions on this market; adequacy of our allowance for loan credit losses, allowance for unfunded commitments credit losses, and allowance for credit losses associated with our held-to-maturity and available-for-sale securities portfolios; deterioration of our asset quality; future performance of our loan portfolio with respect to recently originated loans; the level of prepayments on loans and mortgage-backed securities; liquidity, interest rate and operational risks associated with our business; changes in our financial condition or results of operations that reduce capital; our ability to maintain existing deposit relationships or attract new deposit relationships; changes in consumer spending, borrowing and savings habits; inflation and changes in interest rates that may reduce our margins or reduce the fair value of financial instruments; changes in the monetary and fiscal policies of the U.S. Government, including policies of the U.S. Treasury and the Federal Reserve; additional risks related to new lines of business, products, product enhancements or services; increased competition with other financial institutions and fintech companies; adverse changes in the securities markets; changes in the financial condition or future prospects of issuers of securities that we own; our ability to maintain an effective risk management framework; changes in laws or government regulations or policies affecting financial institutions, including changes in regulatory structure and in regulatory fees and capital requirements; compliance with legislative or regulatory requirements; results of examination of us by our regulators, including the possibility that our regulators may require us to increase our allowance for credit losses or to write-down assets or take similar actions; potential claims, damages, and fines related to litigation or government actions; the effectiveness of our internal controls over financial reporting and our ability to remediate any future material weakness in our internal controls over financial reporting; geopolitical conditions, including acts or threats of terrorism and/or military conflicts, or actions taken by the U.S. or other governments in response to acts or threats of terrorism and/or military conflicts, negatively impacting business and economic conditions in the U.S. and abroad; the effects of weather-related or natural disasters, which may negatively affect our operations and/or our loan portfolio and increase our cost of conducting business; public health events (such as the COVID-19 pandemic) an d governmental and societal responses thereto; technological risks and developments, and cyber threats, attacks, or events; the additional requirements of being a public company; changes in accounting policies and practices; our ability to successfully capitalize on growth opportunities; our ability to retain key employees; deteriorating economic conditions, either nationally or in our market area, including higher unemployment and lower real estate values; implications of our status as a smaller reporting company and as an emerging growth company; and other factors discussed in Item 1A. Risk Factors in the Company’s 2023 Annual Report on Form 10-K filed with the SEC on March 20, 2024. These risks and uncertainties should be considered in evaluating forward-looking statements and undue reliance should not be placed on such statements. We do not undertake, and specifically disclaim any obligation, to publicly release the result of any revisions which may be made to any forward-looking statements to reflect events or circumstances after the date of such statements or to reflect the occurrence of anticipated or unanticipated events. All written or oral forward-looking statements attributable to us are expressly qualified in their entirety by this cautionary note. Use of Non-GAAP Financial Measures This presentation contains certain financial information determined by methods other than in accordance with generally accepted accounting principles in the United States (“GAAP”). These non-GAAP financial measures are a supplement to GAAP, which is used to prepare the Company’s financial statements, and should not be considered in isolation or as a substitute for comparable measures calculated in accordance with GAAP. In addition, the Company’s non-GAAP financial measures may not be comparable to non-GAAP financial measures of other companies. The Company uses the non-GAAP financial measures discussed herein in its analysis of the Company’s performance. Management believes this information is utilized by regulators and market analysts to evaluate a company’s financial condition and therefore, such information is useful to investors. |
| Agenda 3 Company Overview 2023 Economic Conditions Year in Review First Quarter Highlights and Outlook |
| 4 Company Overview |

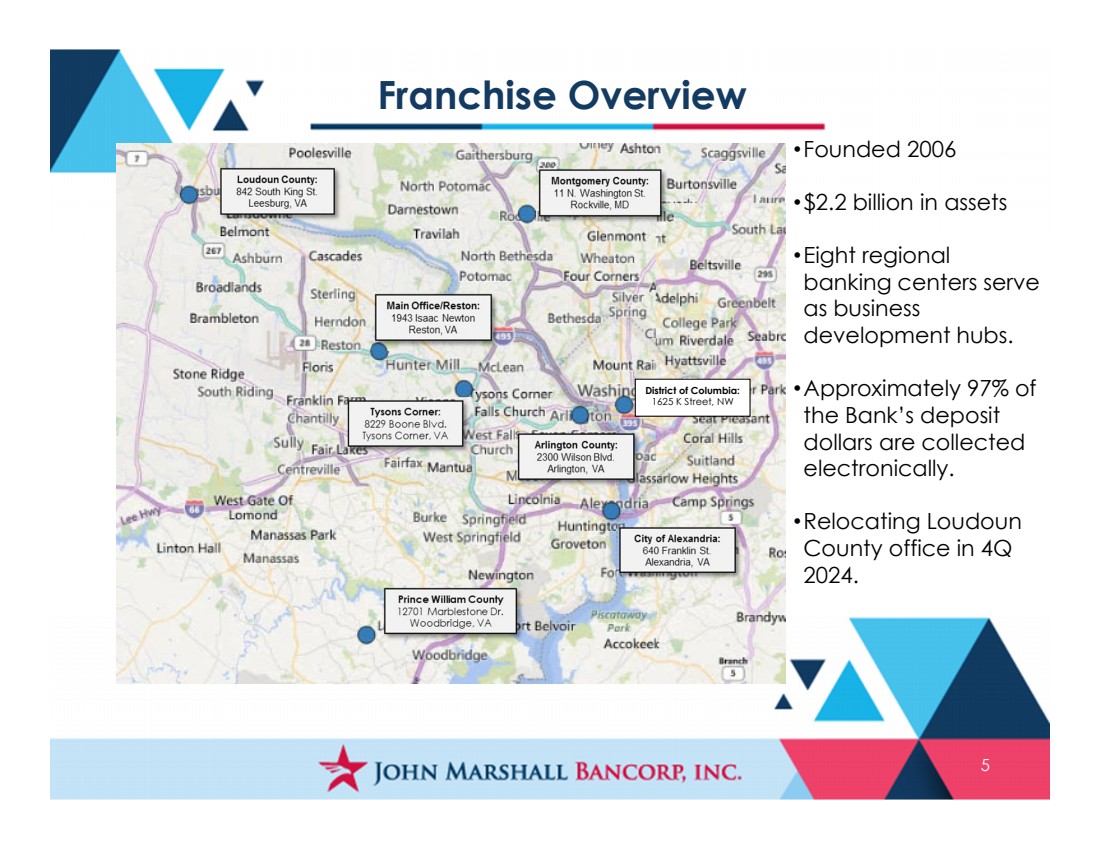
| 5 Franchise Overview •Founded 2006 •$2.2 billion in assets •Eight regional banking centers serve as business development hubs. •Approximately 97% of the Bank’s deposit dollars are collected electronically. •Relocating Loudoun County office in 4Q 2024. District of Columbia: 1625 K Street, NW |
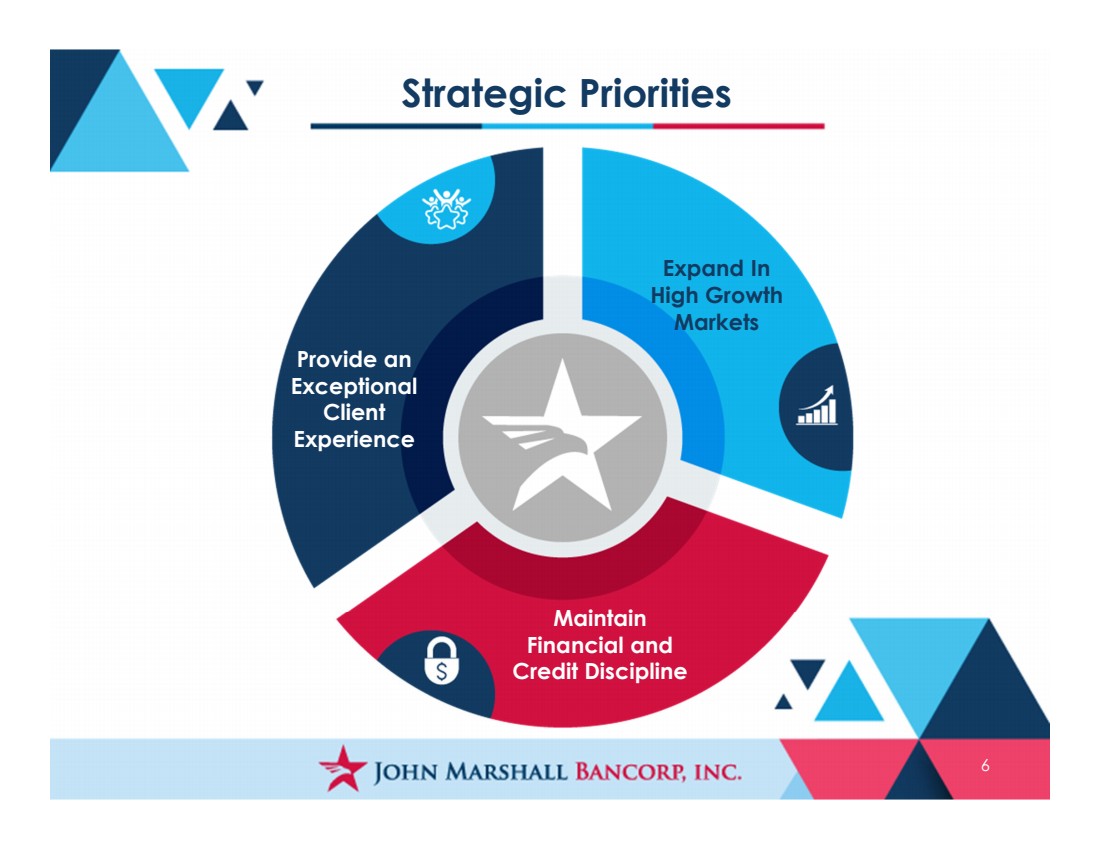
| Strategic Priorities 6 Provide an Exceptional Client Experience Expand In High Growth Markets Maintain Financial and Credit Discipline |
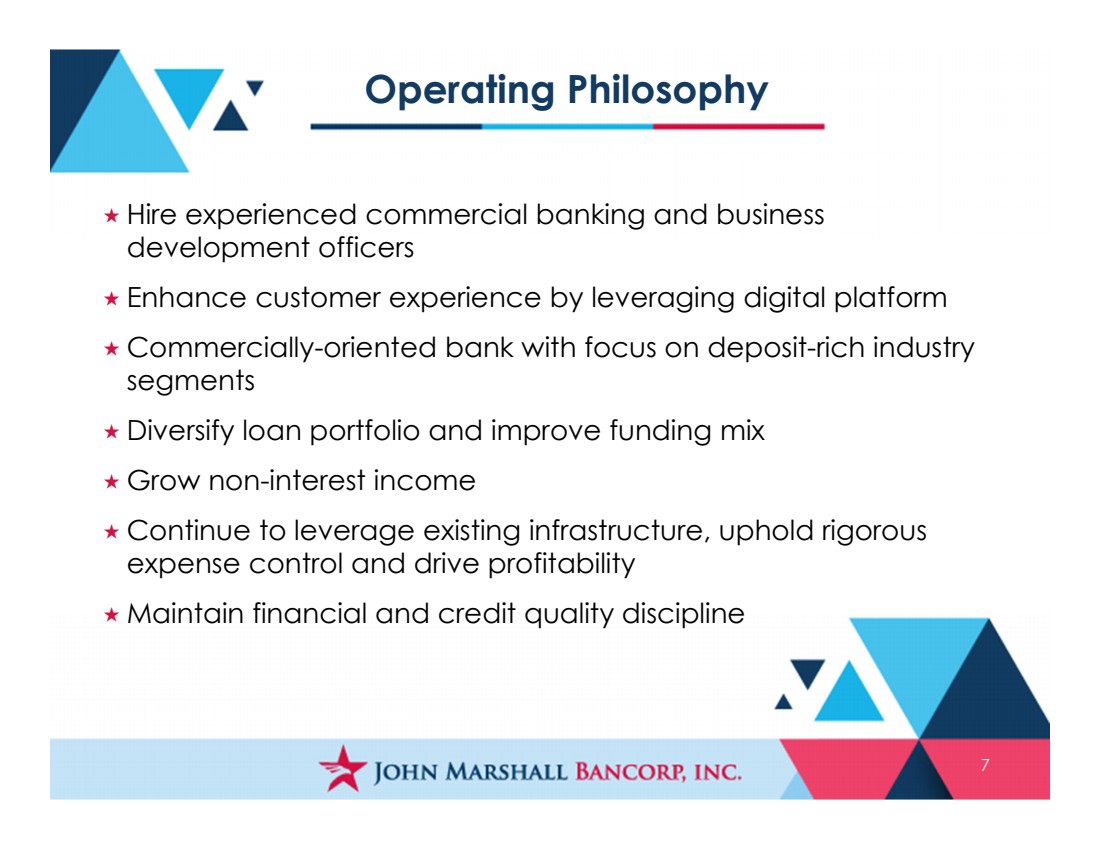
| Operating Philosophy 7 Hire experienced commercial banking and business development officers Enhance customer experience by leveraging digital platform Commercially-oriented bank with focus on deposit-rich industry segments Diversify loan portfolio and improve funding mix Grow non-interest income Continue to leverage existing infrastructure, uphold rigorous expense control and drive profitability Maintain financial and credit quality discipline |
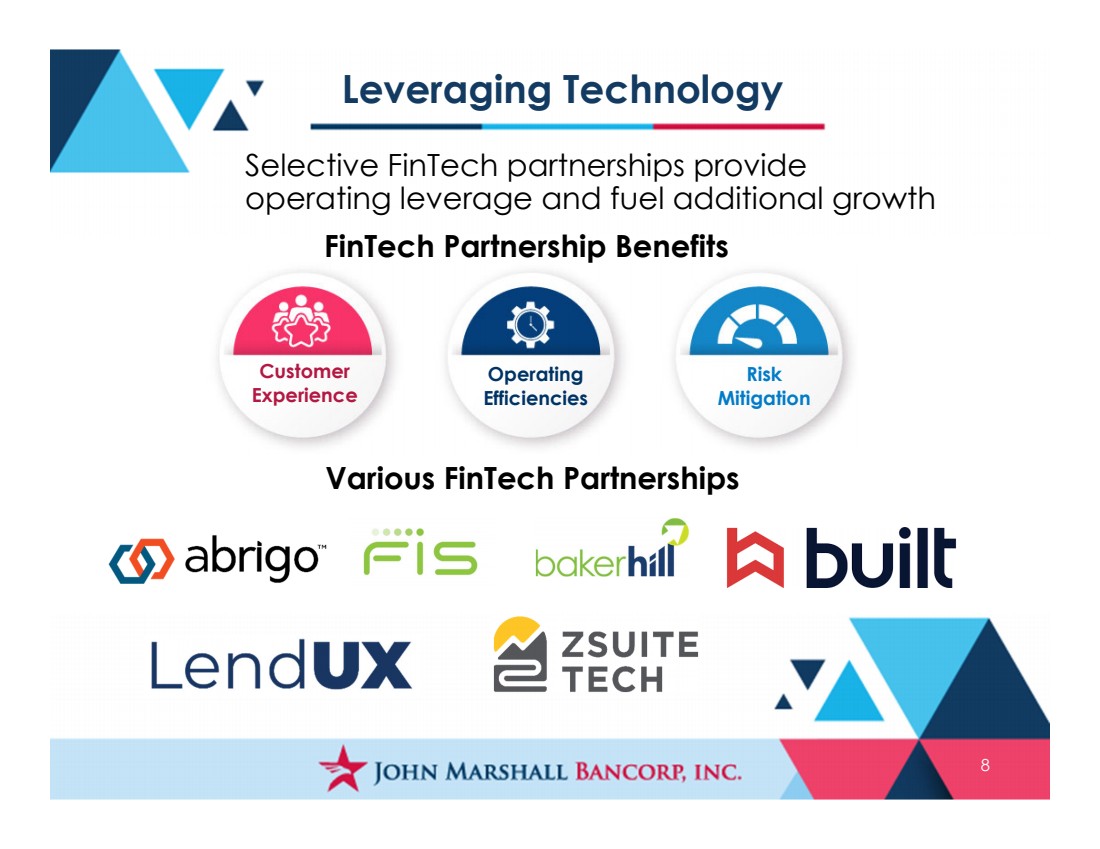
| 8 Selective FinTech partnerships provide operating leverage and fuel additional growth Customer Experience Operating Efficiencies Risk Mitigation FinTech Partnership Benefits Various FinTech Partnerships Leveraging Technology |
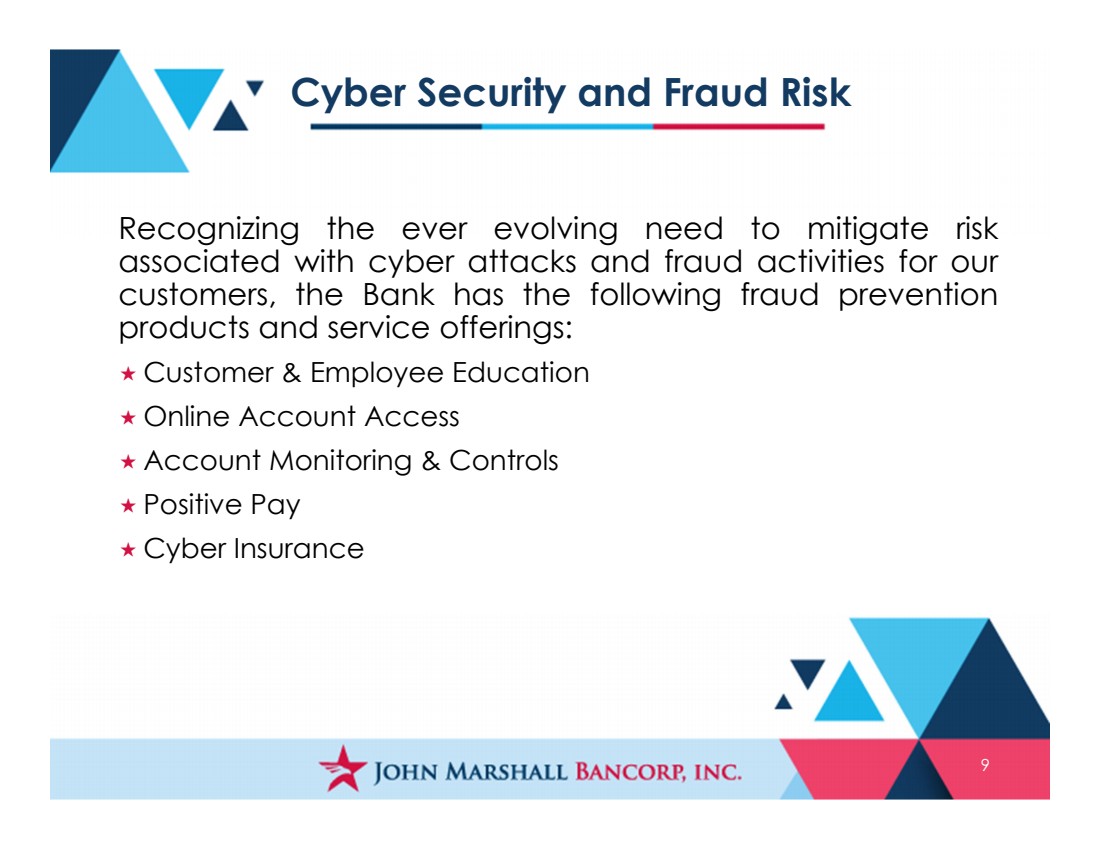
| 9 Recognizing the ever evolving need to mitigate risk associated with cyber attacks and fraud activities for our customers, the Bank has the following fraud prevention products and service offerings: Customer & Employee Education Online Account Access Account Monitoring & Controls Positive Pay Cyber Insurance Cyber Security and Fraud Risk |
| Core Values 10 |

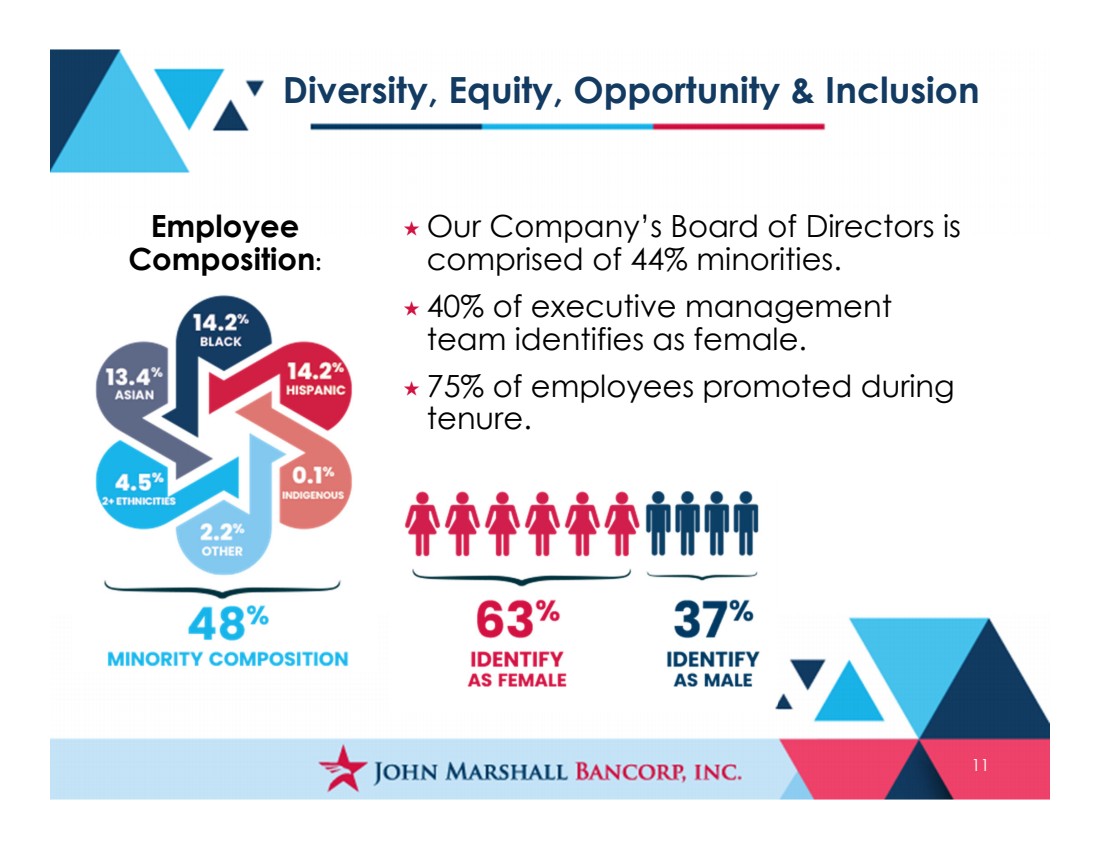
| Diversity, Equity, Opportunity & Inclusion 11 Our Company’s Board of Directors is comprised of 44% minorities. 40% of executive management team identifies as female. 75% of employees promoted during tenure. Employee Composition: |
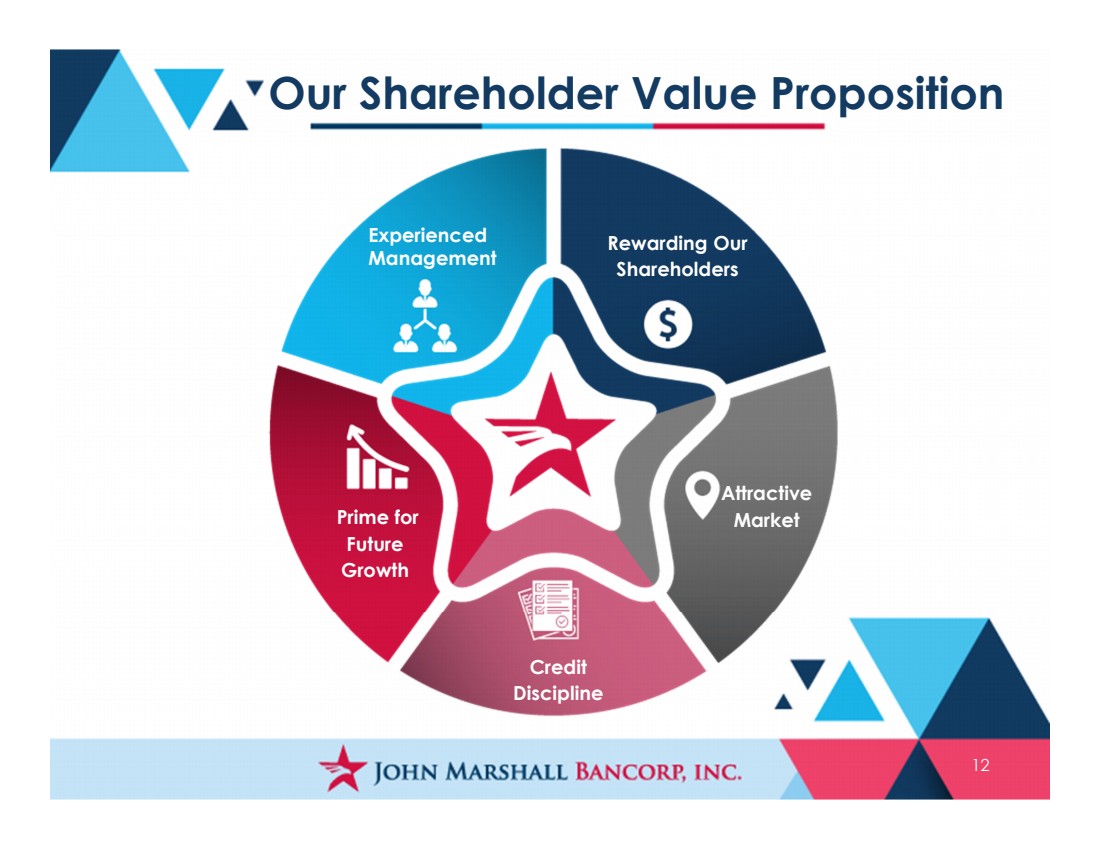
| Our Shareholder Value Proposition Rewarding Our Shareholders Attractive Market Credit Discipline Prime for Future Growth Experienced Management 12 |
| 13 2023 Economic Conditions |

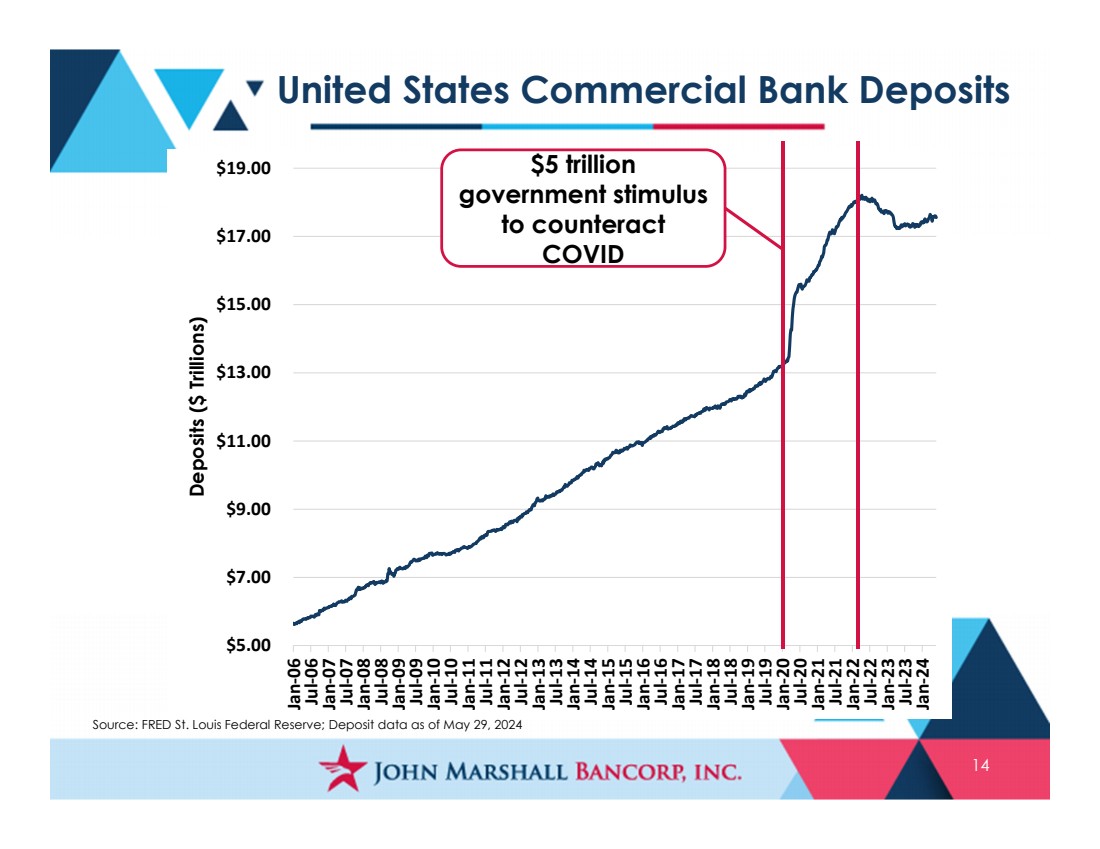
| United States Commercial Bank Deposits 14 $5.00 $7.00 $9.00 $11.00 $13.00 $15.00 $17.00 $19.00 Jan‐06 Jul‐06 Jan‐07 Jul‐07 Jan‐08 Jul‐08 Jan‐09 Jul‐09 Jan‐10 Jul‐10 Jan‐11 Jul‐11 Jan‐12 Jul‐12 Jan‐13 Jul‐13 Jan‐14 Jul‐14 Jan‐15 Jul‐15 Jan‐16 Jul‐16 Jan‐17 Jul‐17 Jan‐18 Jul‐18 Jan‐19 Jul‐19 Jan‐20 Jul‐20 Jan‐21 Jul‐21 Jan‐22 Jul‐22 Jan‐23 Jul‐23 Jan‐24 Deposits ($ Trillions) $5 trillion government stimulus to counteract COVID Source: FRED St. Louis Federal Reserve; Deposit data as of May 29, 2024 |
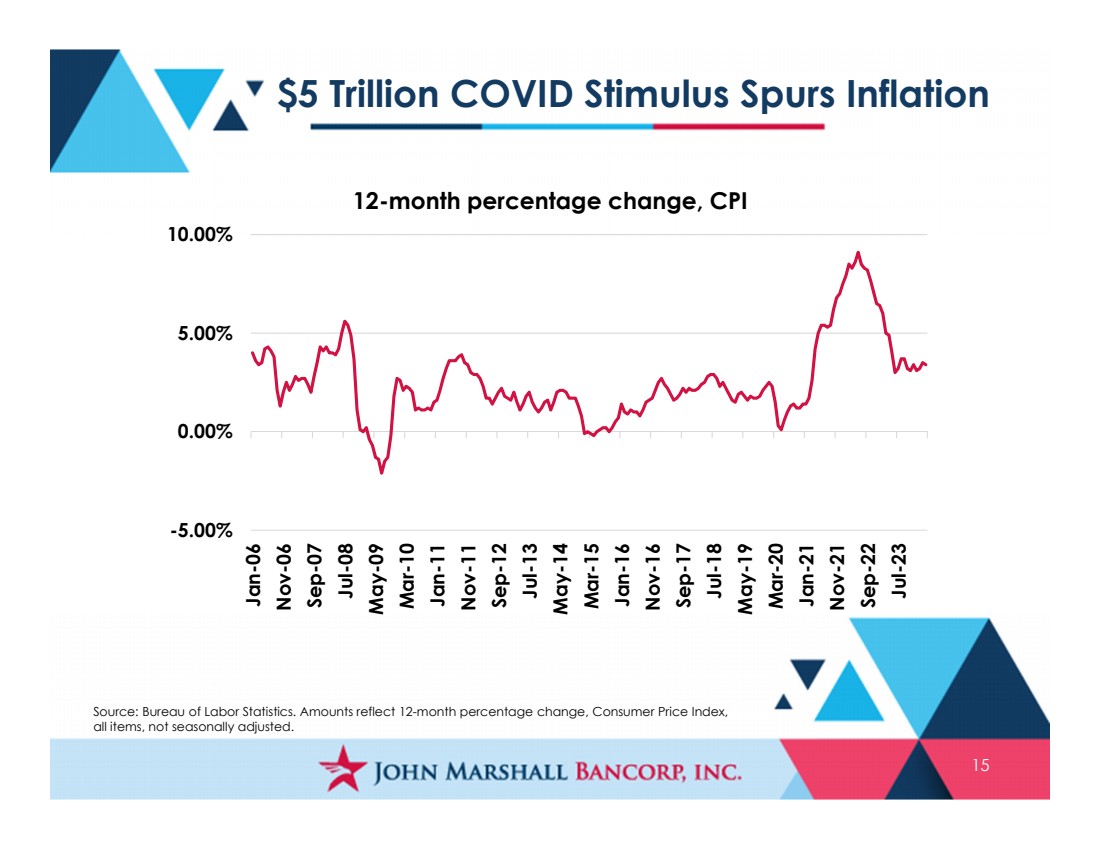
| $5 Trillion COVID Stimulus Spurs Inflation 15 Source: Bureau of Labor Statistics. Amounts reflect 12-month percentage change, Consumer Price Index, all items, not seasonally adjusted. -5.00% 0.00% 5.00% 10.00% Jan-06 Nov-06 Sep-07 Jul-08 May-09 Mar-10 Jan-11 Nov-11 Sep-12 Jul-13 May-14 Mar-15 Jan-16 Nov-16 Sep-17 Jul-18 May-19 Mar-20 Jan-21 Nov-21 Sep-22 Jul-23 12-month percentage change, CPI |
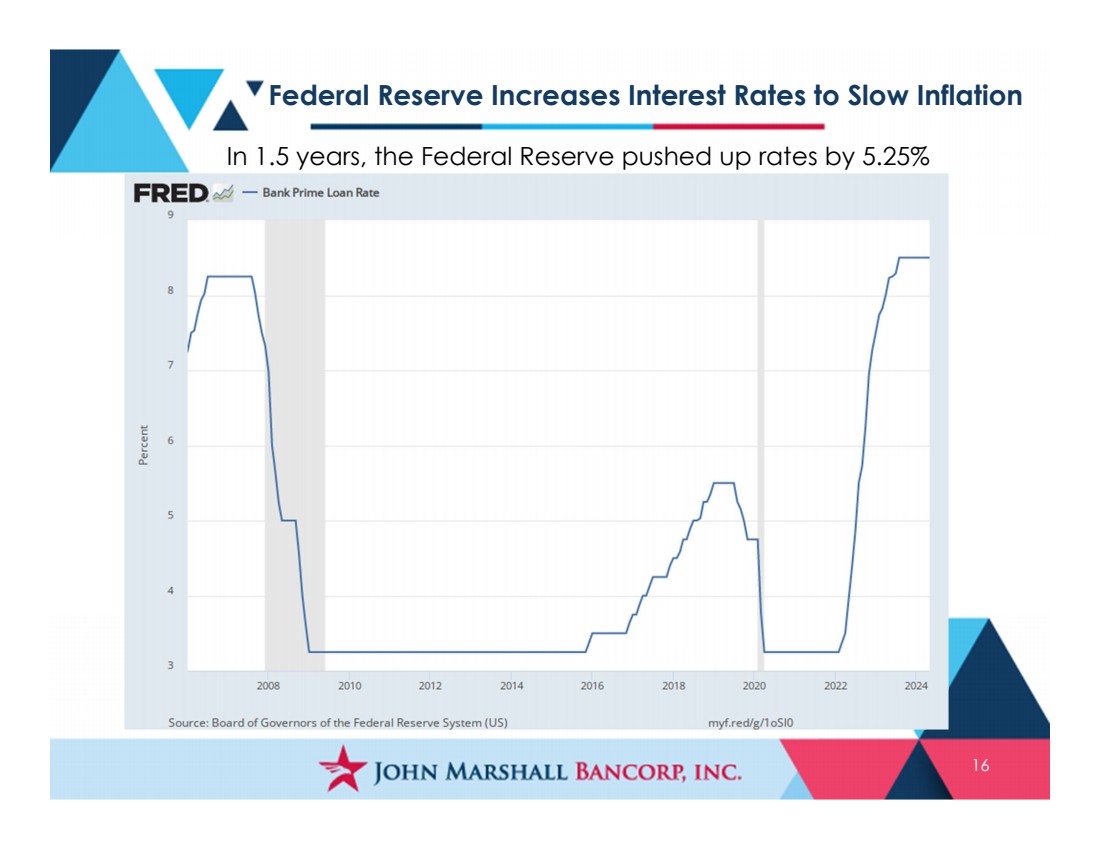
| Federal Reserve Increases Interest Rates to Slow Inflation 16 In 1.5 years, the Federal Reserve pushed up rates by 5.25% |
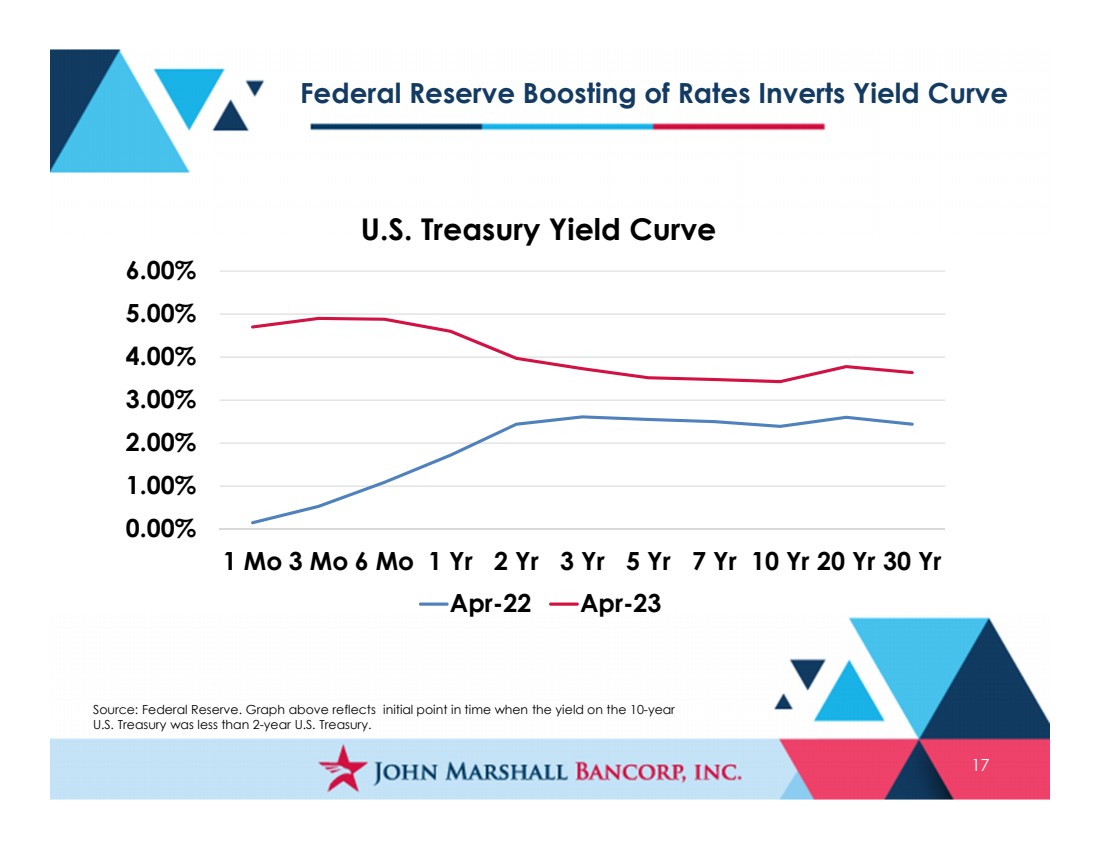
| Federal Reserve Boosting of Rates Inverts Yield Curve 17 Source: Federal Reserve. Graph above reflects initial point in time when the yield on the 10-year U.S. Treasury was less than 2-year U.S. Treasury. 0.00% 1.00% 2.00% 3.00% 4.00% 5.00% 6.00% 1 Mo 3 Mo 6 Mo 1 Yr 2 Yr 3 Yr 5 Yr 7 Yr 10 Yr 20 Yr 30 Yr U.S. Treasury Yield Curve Apr-22 Apr-23 |
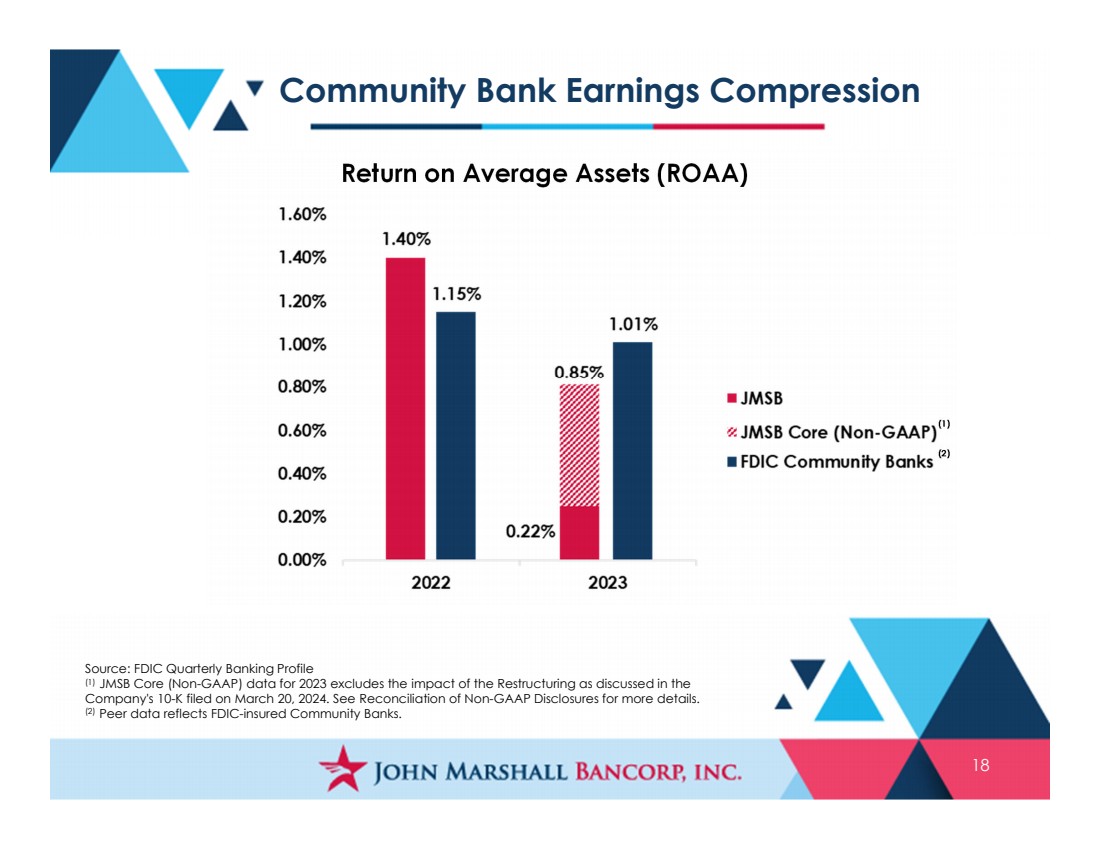
| Community Bank Earnings Compression 18 Return on Average Assets (ROAA) Source: FDIC Quarterly Banking Profile (1) JMSB Core (Non-GAAP) data for 2023 excludes the impact of the Restructuring as discussed in the Company's 10-K filed on March 20, 2024. See Reconciliation of Non-GAAP Disclosures for more details. (2) Peer data reflects FDIC-insured Community Banks. (1) (2) |
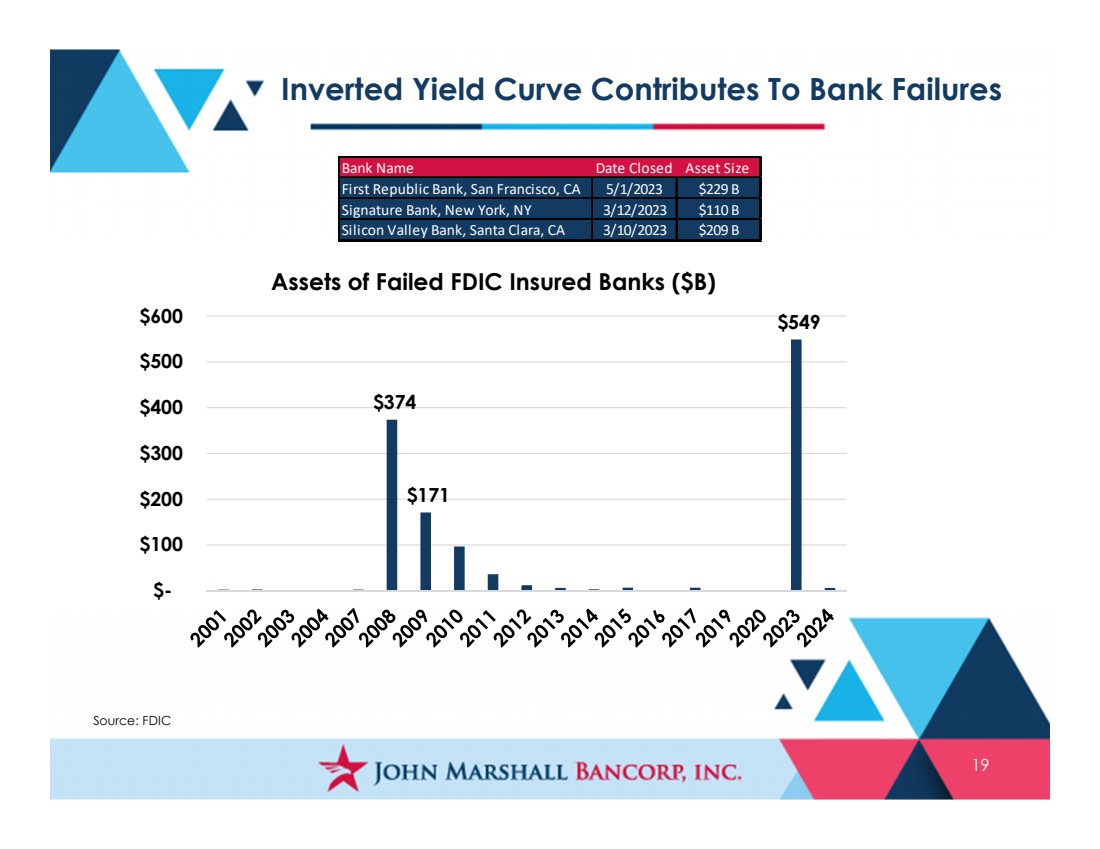
| Inverted Yield Curve Contributes To Bank Failures 19 Bank Name Date Closed Asset Size First Republic Bank, San Francisco, CA 5/1/2023 $229 B Signature Bank, New York, NY 3/12/2023 $110 B Silicon Valley Bank, Santa Clara, CA 3/10/2023 $209 B Source: FDIC $374 $171 $549 $- $100 $200 $300 $400 $500 $600 Assets of Failed FDIC Insured Banks ($B) |
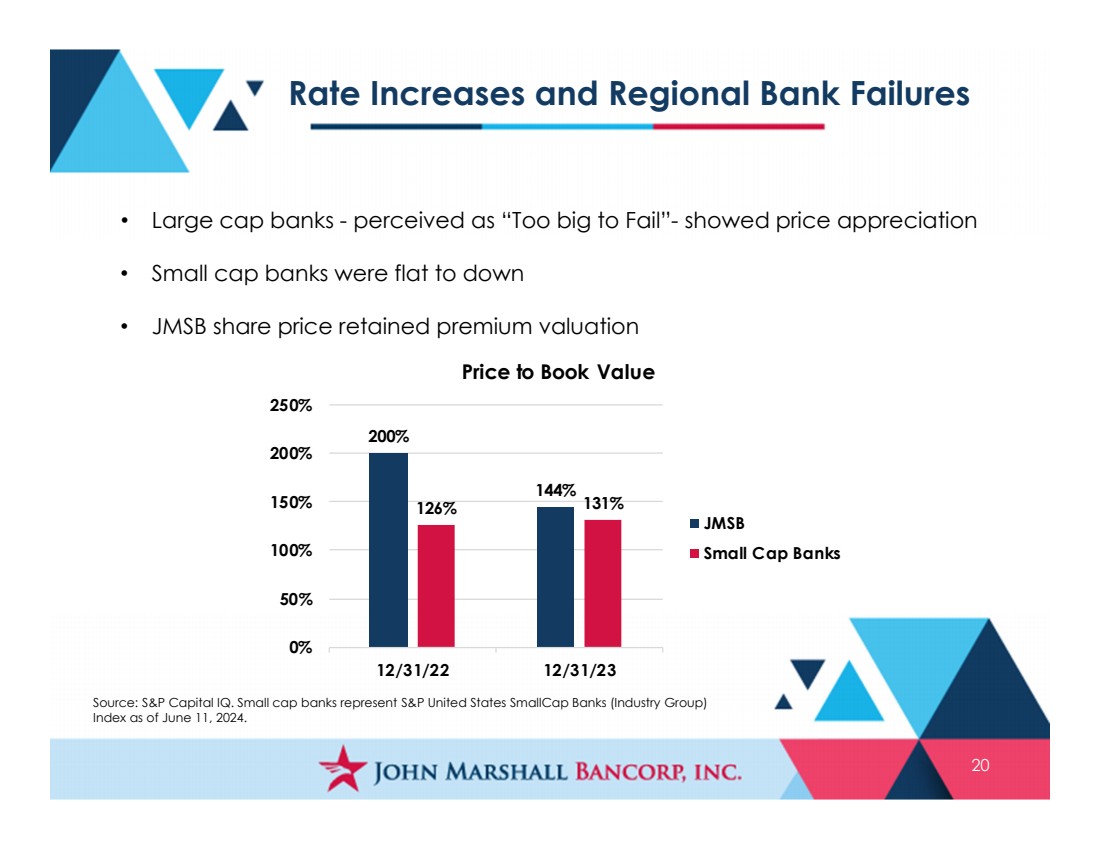
| Rate Increases and Regional Bank Failures 20 • Large cap banks - perceived as “Too big to Fail”- showed price appreciation • Small cap banks were flat to down • JMSB share price retained premium valuation 200% 144% 126% 131% 0% 50% 100% 150% 200% 250% 12/31/22 12/31/23 Price to Book Value JMSB Small Cap Banks Source: S&P Capital IQ. Small cap banks represent S&P United States SmallCap Banks (Industry Group) Index as of June 11, 2024. |
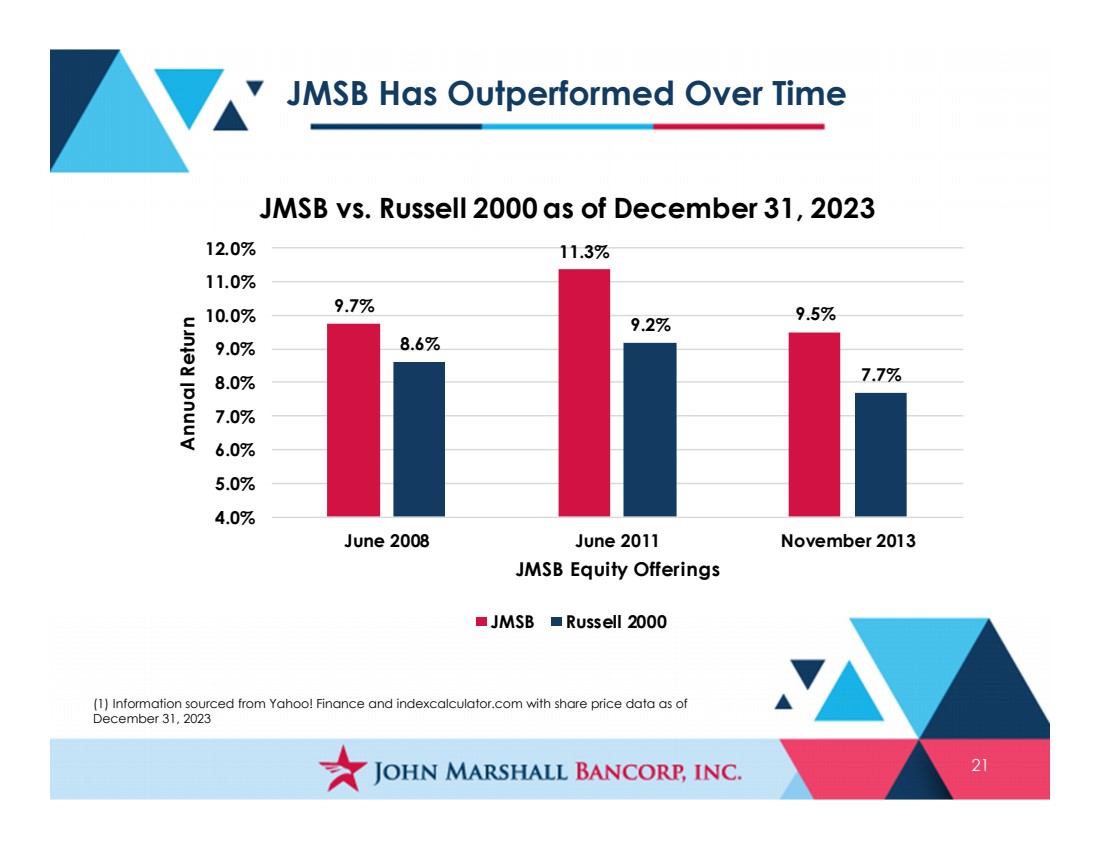
| JMSB Has Outperformed Over Time 21 (1) Information sourced from Yahoo! Finance and indexcalculator.com with share price data as of December 31, 2023 9.7% 11.3% 9.5% 8.6% 9.2% 7.7% 4.0% 5.0% 6.0% 7.0% 8.0% 9.0% 10.0% 11.0% 12.0% June 2008 June 2011 November 2013 Annual Return JMSB Equity Offerings JMSB vs. Russell 2000 as of December 31, 2023 JMSB Russell 2000 |
| 22 Year in Review |

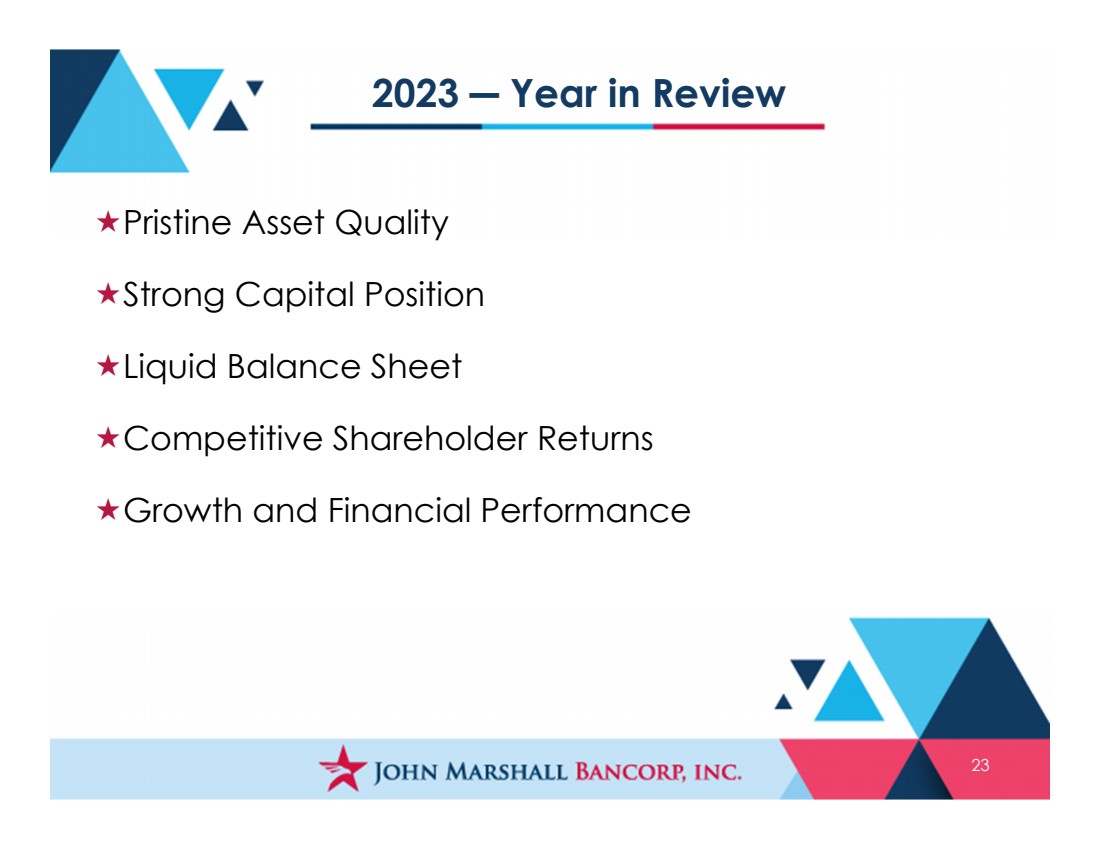
| 2023 ― Year in Review 23 Pristine Asset Quality Strong Capital Position Liquid Balance Sheet Competitive Shareholder Returns Growth and Financial Performance |
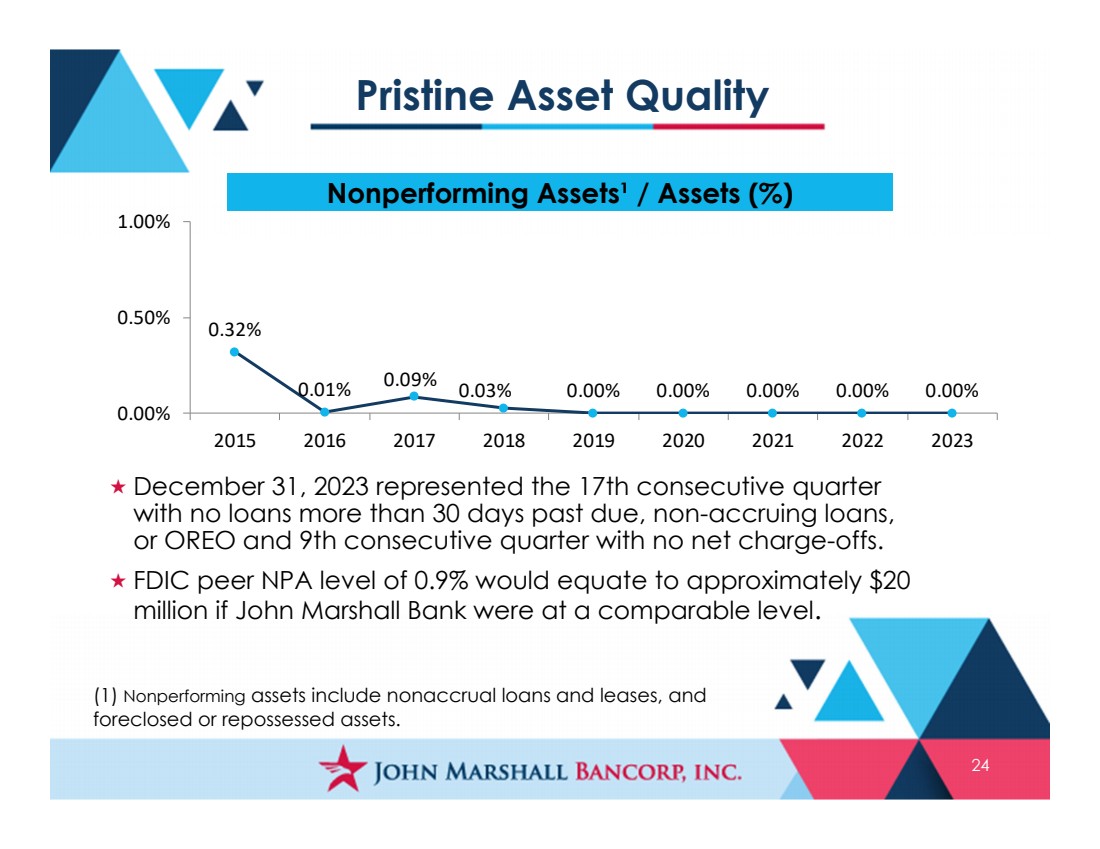
| Pristine Asset Quality 24 Nonperforming Assets¹ / Assets (%) (1) Nonperforming assets include nonaccrual loans and leases, and foreclosed or repossessed assets. 0.32% 0.01% 0.09% 0.03% 0.00% 0.00% 0.00% 0.00% 0.00% 0.00% 0.50% 1.00% 2015 2016 2017 2018 2019 2020 2021 2022 2023 December 31, 2023 represented the 17th consecutive quarter with no loans more than 30 days past due, non-accruing loans, or OREO and 9th consecutive quarter with no net charge-offs. FDIC peer NPA level of 0.9% would equate to approximately $20 million if John Marshall Bank were at a comparable level. |
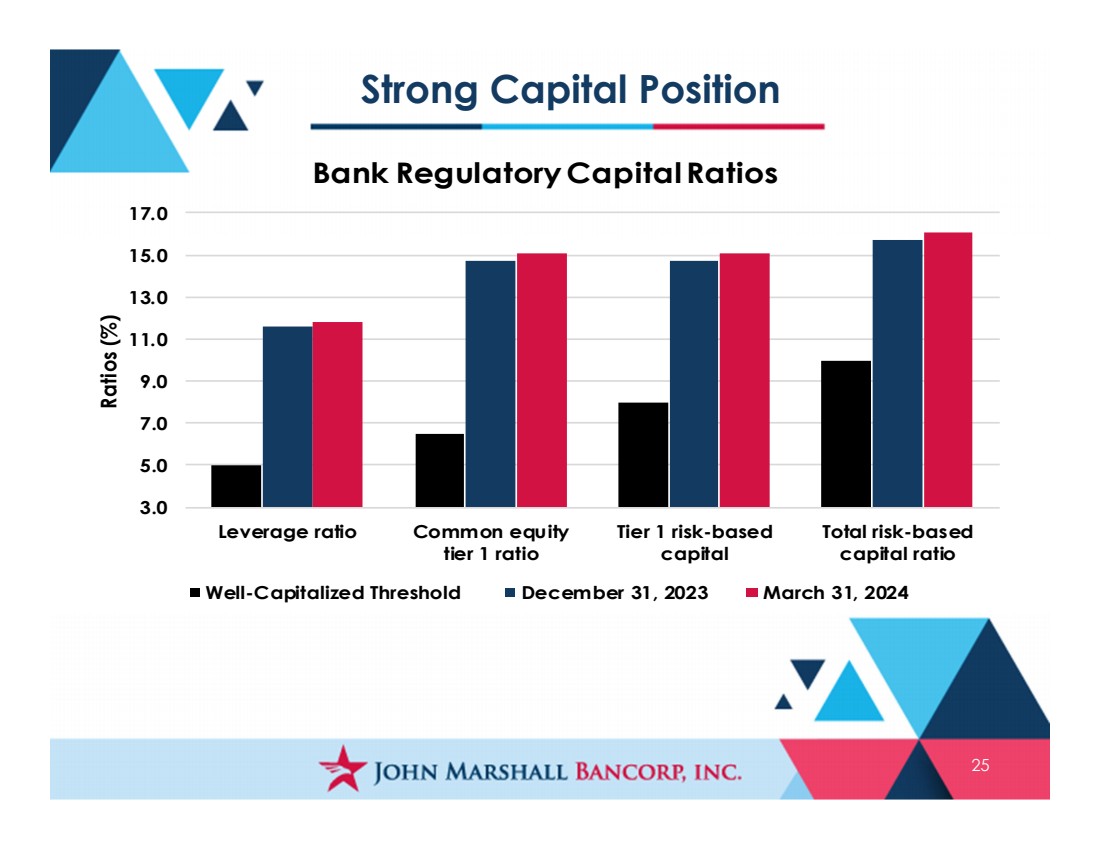
| Strong Capital Position 25 3.0 5.0 7.0 9.0 11.0 13.0 15.0 17.0 Leverage ratio Common equity tier 1 ratio Tier 1 risk-based capital Total risk-based capital ratio Ratios (%) Bank Regulatory Capital Ratios Well-Capitalized Threshold December 31, 2023 March 31, 2024 |
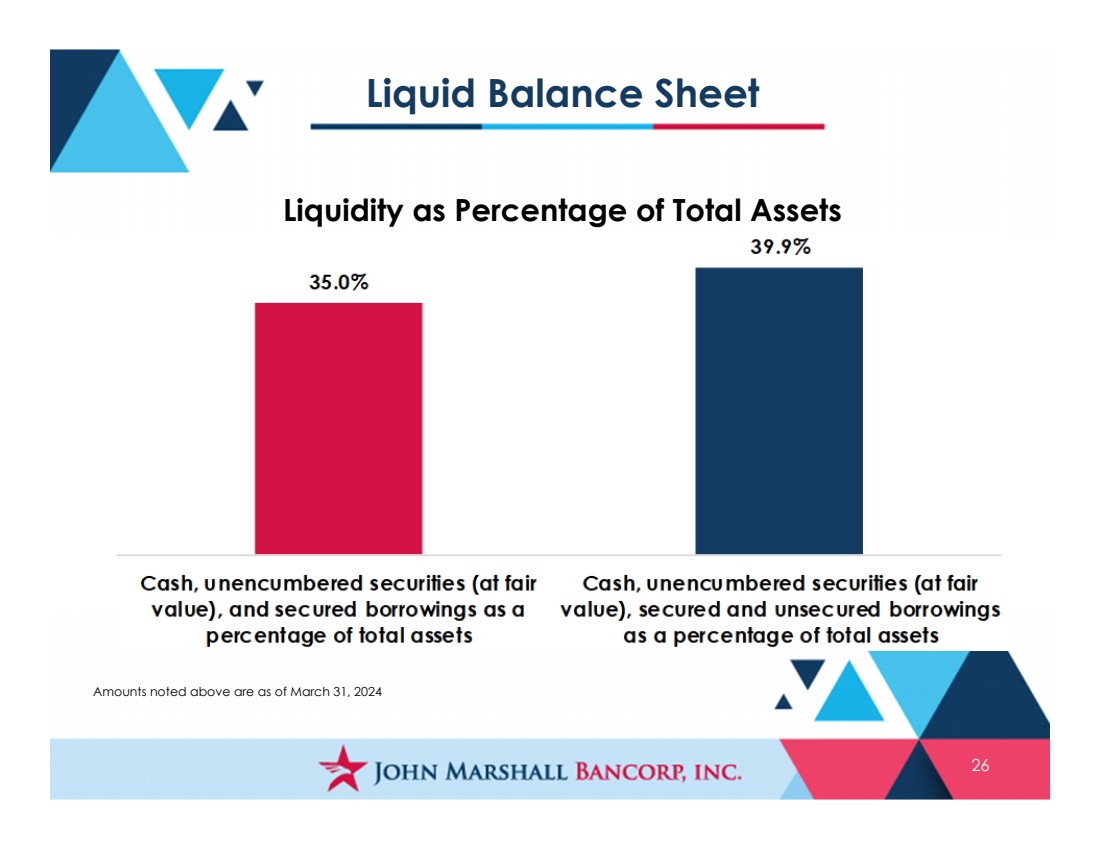
| Liquid Balance Sheet 26 Amounts noted above are as of March 31, 2024 Liquidity as Percentage of Total Assets |
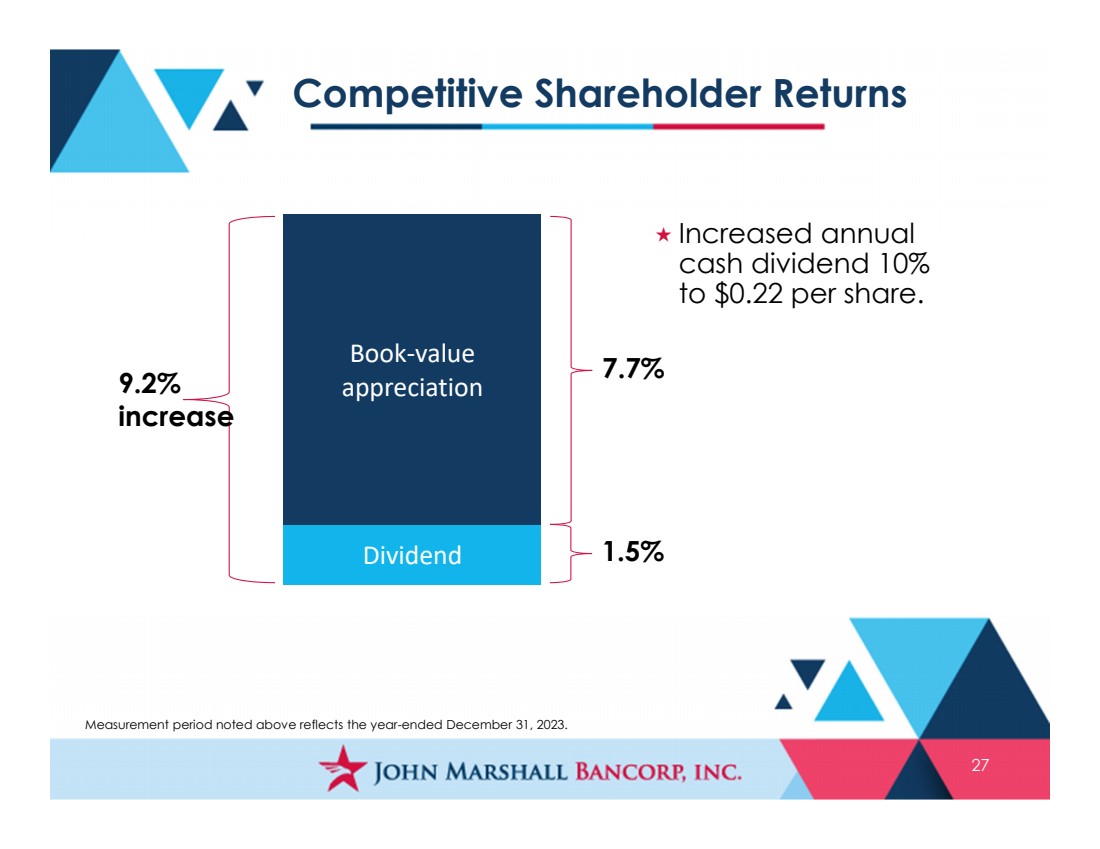
| Competitive Shareholder Returns 27 Dividend Book ‐value appreciation 1.5% 9.2% increase 7.7% Increased annual cash dividend 10% to $0.22 per share. Measurement period noted above reflects the year-ended December 31, 2023. |
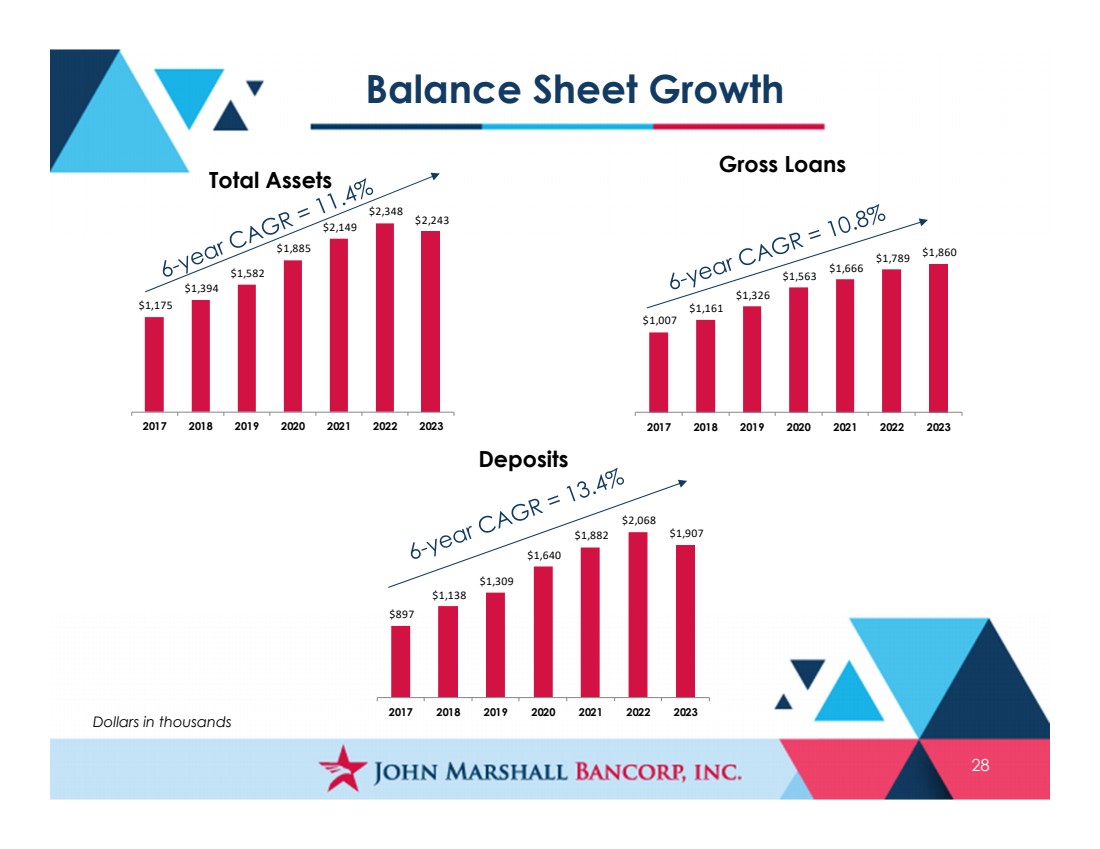
| Balance Sheet Growth 28 Dollars in thousands Total Assets $1,175 $1,394 $1,582 $1,885 $2,149 $2,348 $2,243 2017 2018 2019 2020 2021 2022 2023 Gross Loans $1,007 $1,161 $1,326 $1,563 $1,666 $1,789 $1,860 2017 2018 2019 2020 2021 2022 2023 Deposits $897 $1,138 $1,309 $1,640 $1,882 $2,068 $1,907 2017 2018 2019 2020 2021 2022 2023 |
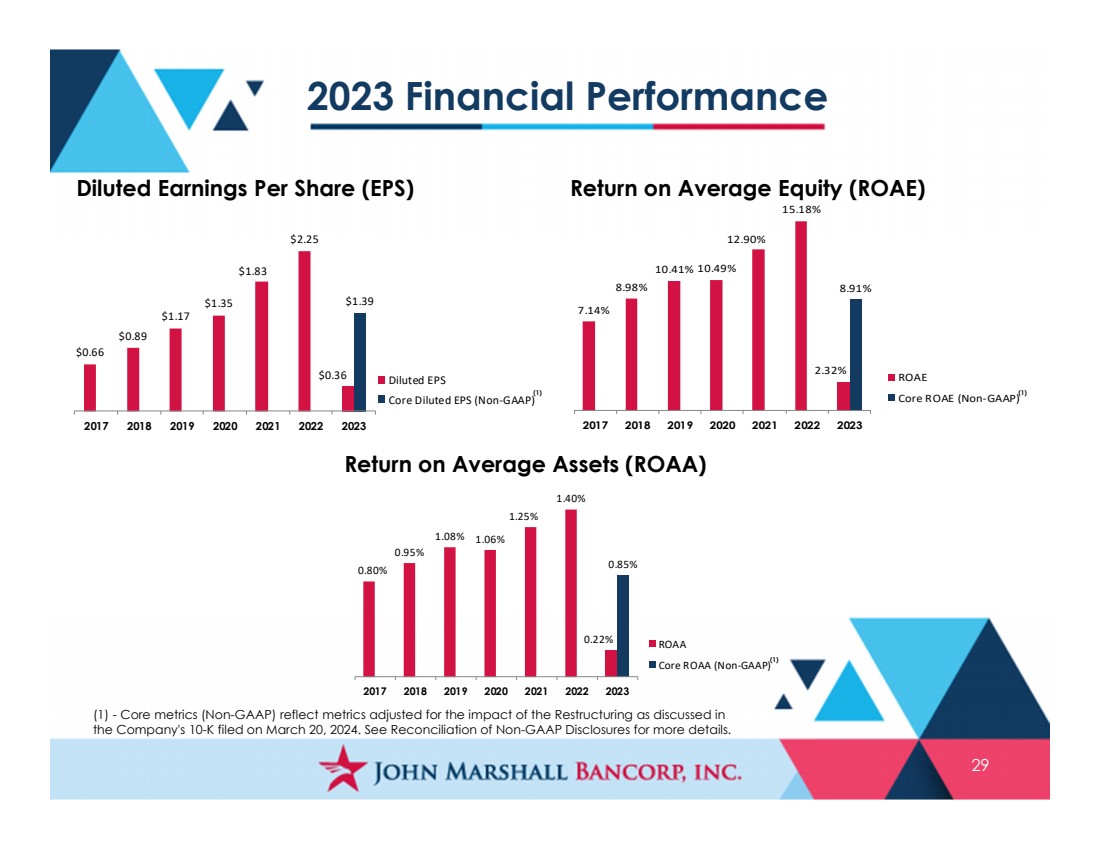
| 2023 Financial Performance 29 0.80% 0.95% 1.08% 1.06% 1.25% 1.40% 0.22% 0.85% 2017 2018 2019 2020 2021 2022 2023 ROAA Core ROAA (Non‐GAAP) Return on Average Assets (ROAA) 7.14% 8.98% 10.41% 10.49% 12.90% 15.18% 2.32% 8.91% 2017 2018 2019 2020 2021 2022 2023 ROAE Core ROAE (Non‐GAAP) Return on Average Equity (ROAE) $0.66 $0.89 $1.17 $1.35 $1.83 $2.25 $0.36 $1.39 2017 2018 2019 2020 2021 2022 2023 Diluted EPS Core Diluted EPS (Non‐GAAP) Diluted Earnings Per Share (EPS) (1) - Core metrics (Non-GAAP) reflect metrics adjusted for the impact of the Restructuring as discussed in the Company's 10-K filed on March 20, 2024. See Reconciliation of Non-GAAP Disclosures for more details. (1) (1) (1) |
| 30 First Quarter 2024 Highlights & Outlook |

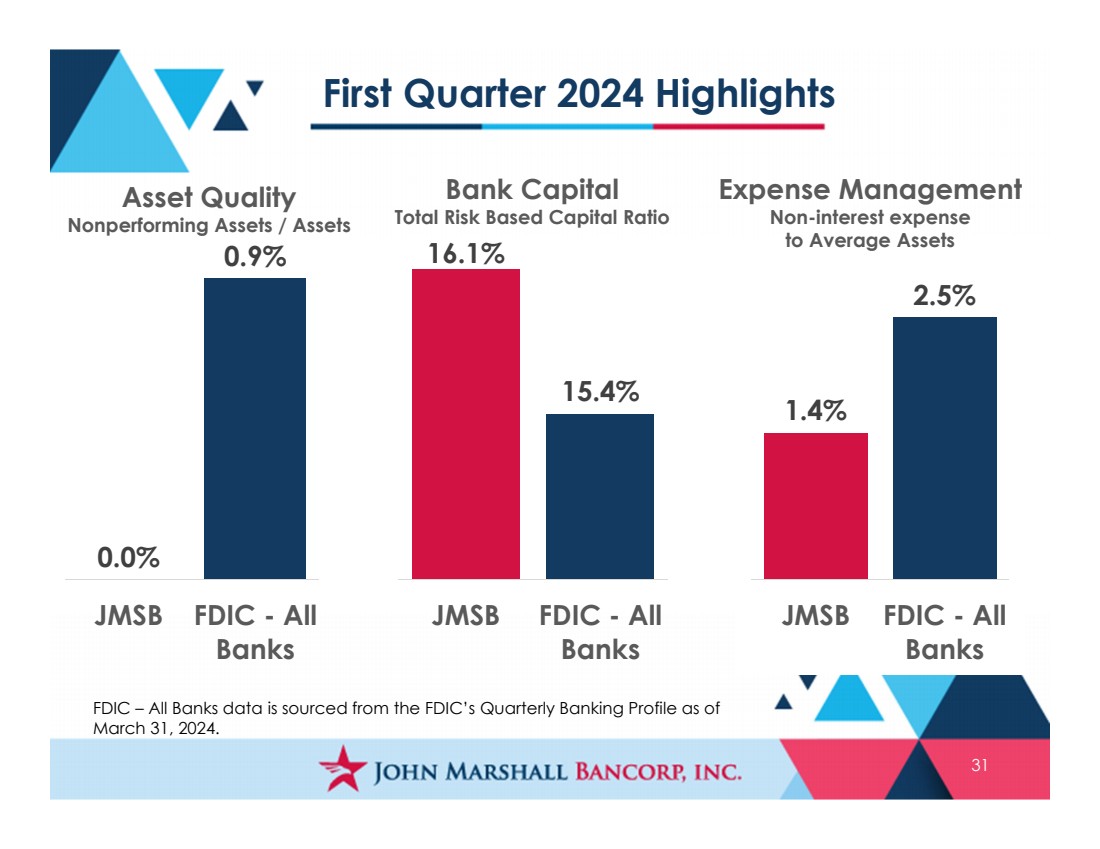
| First Quarter 2024 Highlights 31 0.0% 0.9% JMSB FDIC - All Banks 16.1% 15.4% JMSB FDIC - All Banks 1.4% 2.5% JMSB FDIC - All Banks FDIC – All Banks data is sourced from the FDIC’s Quarterly Banking Profile as of March 31, 2024. Asset Quality Nonperforming Assets / Assets Bank Capital Total Risk Based Capital Ratio Expense Management Non-interest expense to Average Assets |
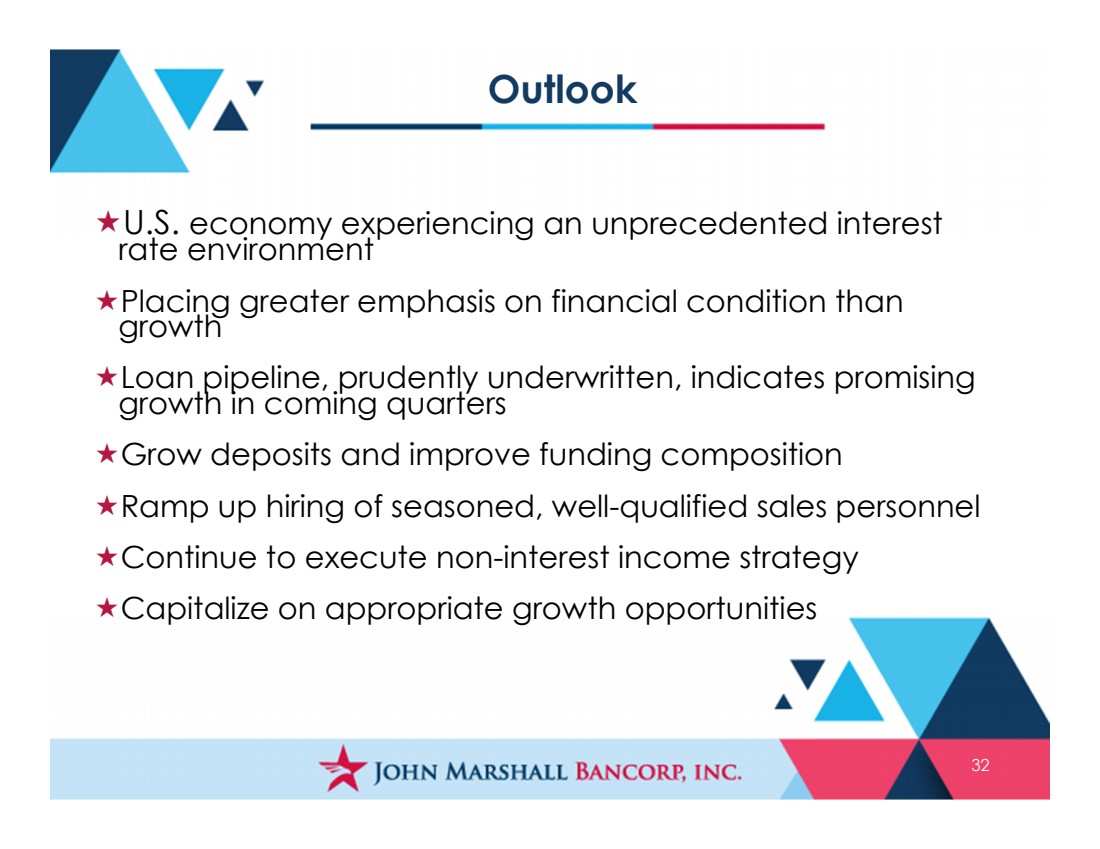
| Outlook 32 U.S. economy experiencing an unprecedented interest rate environment Placing greater emphasis on financial condition than growth Loan pipeline, prudently underwritten, indicates promising growth in coming quarters Grow deposits and improve funding composition Ramp up hiring of seasoned, well-qualified sales personnel Continue to execute non-interest income strategy Capitalize on appropriate growth opportunities |
| Appendix 33 |

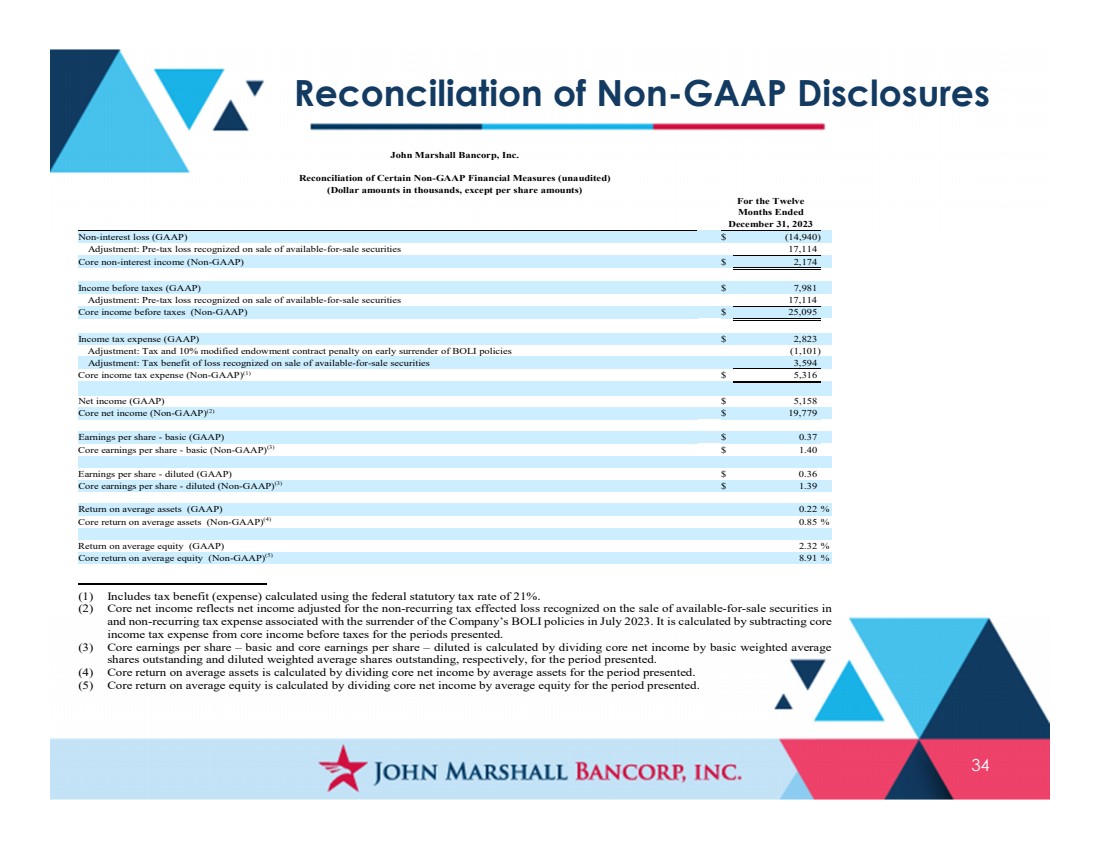
| Reconciliation of Non-GAAP Disclosures 34 John Marshall Bancorp, Inc. Reconciliation of Certain Non-GAAP Financial Measures (unaudited) (Dollar amounts in thousands, except per share amounts) For the Twelve Months Ended December 31, 2023 Non-interest loss (GAAP) $ (14,940) Adjustment: Pre-tax loss recognized on sale of available-for-sale securities 17,114 Core non-interest income (Non-GAAP) $ 2,174 Income before taxes (GAAP) $ 7,981 Adjustment: Pre-tax loss recognized on sale of available-for-sale securities 17,114 Core income before taxes (Non-GAAP) $ 25,095 Income tax expense (GAAP) $ 2,823 Adjustment: Tax and 10% modified endowment contract penalty on early surrender of BOLI policies (1,101) Adjustment: Tax benefit of loss recognized on sale of available-for-sale securities 3,594 Core income tax expense (Non-GAAP)(1) $ 5,316 Net income (GAAP) $ 5,158 Core net income (Non-GAAP)(2) $ 19,779 Earnings per share - basic (GAAP) $ 0.37 Core earnings per share - basic (Non-GAAP)(3) $ 1.40 Earnings per share - diluted (GAAP) $ 0.36 Core earnings per share - diluted (Non-GAAP)(3) $ 1.39 Return on average assets (GAAP) 0.22 % Core return on average assets (Non-GAAP)(4) 0.85 % Return on average equity (GAAP) 2.32 % Core return on average equity (Non-GAAP)(5) 8.91 % (1) Includes tax benefit (expense) calculated using the federal statutory tax rate of 21%. (2) Core net income reflects net income adjusted for the non-recurring tax effected loss recognized on the sale of available-for-sale securities i n and non-recurring tax expense associated with the surrender of the Company’s BOLI policies in July 2023. It is calculated by subtracting core income tax expense from core income before taxes for the periods presented. (3) Core earnings per share – basic and core earnings per share – diluted is calculated by dividing core net income by basic weighted average shares outstanding and diluted weighted average shares outstanding, respectively, for the period presented. (4) Core return on average assets is calculated by dividing core net income by average assets for the period presented. (5) Core return on average equity is calculated by dividing core net income by average equity for the period presented. |