Lsi Industries Inc 8-K, filed Jan 23, 2025
Lsi Industries Inc (LYTS)
About this 8-K
Lsi Industries Inc filed this 8-K on January 23, 2025.
Items reported
- Item 2.02: Financial results
- Item 7.01: Regulation FD disclosure
- Item 9.01: Financial statements and exhibits

|
|
|
|
||
|
(State or Other Jurisdiction of Incorporation)
|
(Commission File Number)
|
(IRS Employer Identification No.)
|
|
|
|
|
(Address of Principal Executive Offices)
|
(Zip Code)
|
|
|
Written communications pursuant to Rule 425 under the Securities Act (17 CFR 230.425)
|
|
|
|
|
|
Soliciting material pursuant to Rule 14a-12 under the Exchange Act (17 CFR 240.14a-12)
|
|
|
|
|
|
Pre-commencement communications pursuant to Rule 14d-2(b) under the Exchange Act (17 CFR 240.14d-2(b))
|
|
|
|
|
|
Pre-commencement communications pursuant to Rule 13e-4(c) under the Exchange Act (17 CFR 240.13e-4(c))
|
| Title of each class | Trading Symbol(s) | Name of each exchange on which registered |
|
(d)
|
Exhibits
|
|
ExhibitNo.
|
Description
|
|
|
99.1
|
||
|
99.2
|
||
|
104
|
Cover Page Interactive Data File (embedded within the Inline XBRL document)
|
|
LSI INDUSTRIES INC.
|
||
|
BY:/s/ James E. Galeese
|
||
|
James E. Galeese
|
||
|
Executive Vice President, Chief
Financial Officer
|
||
Exhibit 99.1

LSI INDUSTRIES REPORTS FISCAL 2025 SECOND QUARTER RESULTS
AND DECLARES QUARTERLY CASH DIVIDEND
CINCINNATI, January 23, 2025 – LSI Industries Inc. (Nasdaq: LYTS, “LSI” or the “Company”) a leading U.S. based manufacturer of commercial lighting and display solutions, today reported financial results for the fiscal 2025 second quarter ended December 31, 2024.
FISCAL 2025 SECOND QUARTER RESULTS
|
● |
Net sales of $147.7 million, + 36% y/y |
|
● |
Organic net sales +14% y/y |
|
● |
Net income of $5.6 million, or $0.18 per diluted share |
|
● |
Adjusted Net Income $8.0 million or $0.26 per diluted share |
|
● |
EBITDA of $11.5 million; Adjusted EBITDA of $13.3 million |
|
● |
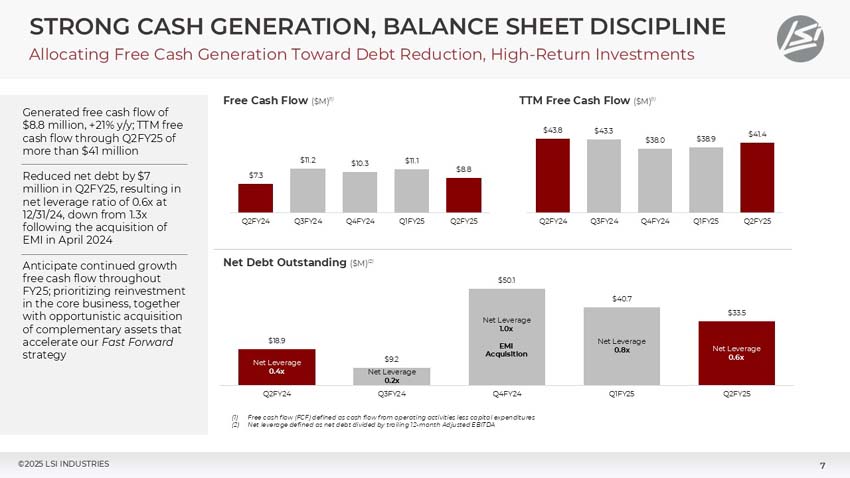
Free cash flow of $8.8 million |
|
● |
Ratio of net debt to TTM Adjusted EBITDA of 0.6x |
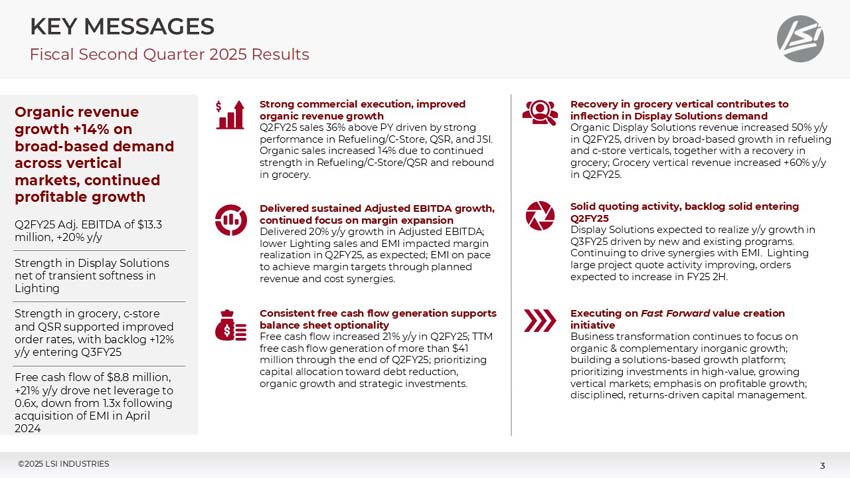
LSI delivered significant year-over-year growth in sales and profitability in the fiscal second quarter, driven by broad-based demand strength across its vertical markets. Fiscal second quarter results benefitted from solid organic growth within the Display Solutions segment, together with contributions from the EMI acquisition completed in April 2024.
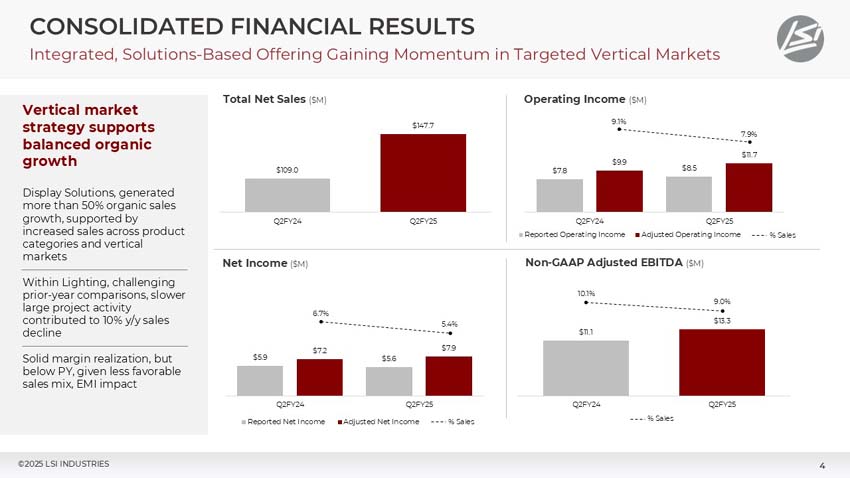
The Company reported net sales of $147.7 million in the fiscal second quarter, an increase of 36% versus the prior year period. Net sales, excluding contributions from the EMI acquisition, increased 14% versus the fiscal second quarter of 2024.
LSI reported net income of $5.6 million, or $0.18 per diluted share, in the second quarter, while adjusted net income was $8.0 million, or $0.26 per diluted share. The Company generated adjusted EBITDA of $13.3 million or 9.0% of net sales, an increase of more than 20% versus the year-ago period. A reconciliation of GAAP and non-GAAP financial results is included in this press release.
The Company generated free cash flow of $8.8 million in the second quarter, or nearly $41.4 million on a trailing twelve-month basis. Given continued strength in cash generation, LSI reduced its ratio of net debt to trailing twelve-month Adjusted EBITDA to 0.6x, down from 1.3x at the time of the EMI acquisition in April 2024. At the end of the second quarter, LSI had cash and availability on its credit facility totaling $67 million.
The Company declared a regular cash dividend of $0.05 per share payable on February 11, 2025, to shareholders of record on February 3, 2025.
MANAGEMENT COMMENTARY
“LSI delivered 14% organic sales growth in the fiscal second quarter, supported by strong demand across our core refueling, c-store, and grocery verticals,” stated James A. Clark, President and Chief Executive Officer of LSI.” “Including contributions from our most recent acquisition of EMI, which continues to perform ahead of initial expectations, LSI generated total sales growth of 36% in the second quarter, while adjusted net income, adjusted EBITDA and free cash flow generation all increased on-a-year-over-year basis.
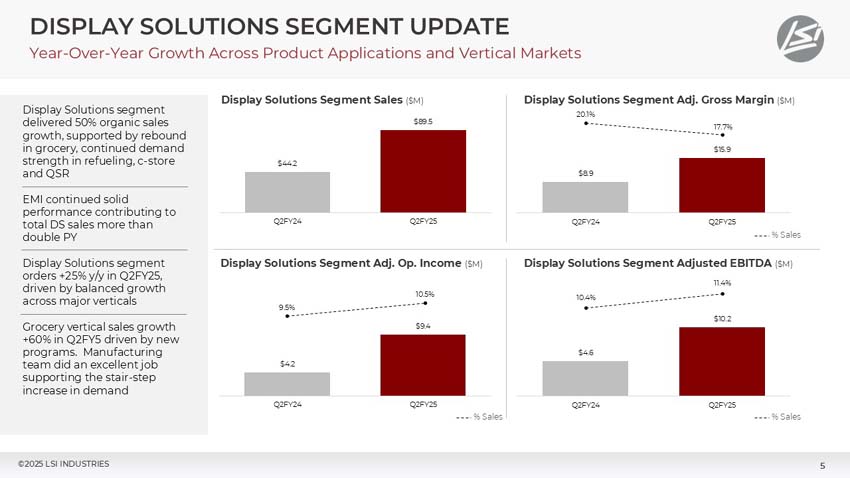
“Our integrated, solutions-based model is gaining significant traction in the marketplace, positioning us for a solid start to our fiscal third quarter,” continued Clark. “Second quarter order rates increased versus the prior year, resulting in a 12% year-over-year increase in backlog entering the fiscal third quarter. Display Solutions segment orders increased 25% on a year-over-year basis in the second quarter driven by balanced growth across all major verticals. We anticipate that order rates will remain positive into the second half of our fiscal year, given current and projected customer activity across our vertical markets.
“Our Display Solutions segment generated organic sales growth of 50% in the second quarter, driven by increased sales across product categories and vertical markets. We continue to execute on a significant backlog of multi-year contracts with large national and international refueling/c-store customer programs where our integrated solutions remain in high demand. Notably, second quarter sales to refueling/c-store customers increased by more than 60%, when compared to the year-ago period. We enter the third quarter with an increased backlog and expect strong sales growth to continue into the fiscal second half.
“The grocery vertical generated sales growth over 50% in the quarter driven by the resurgence in refrigerated and non-refrigerated display case demand,” stated Clark. “Termination of the proposed merger between two large grocery industry participants was announced in December 2024. Uncertainty over the proposed merger caused the industry to defer both maintenance and key program investments over the last eighteen months. We began to experience a resurgence in demand during the fiscal first quarter, which accelerated in the second quarter, as expectations that a judicial decision was imminent.
“In the fiscal second quarter, we successfully managed the Department of Energy legislation requiring end of life production for refrigerated display cases utilizing the current R448 technology at calendar year-end, with conversion to R290 and other technologies effective January 1, 2025. We worked closely with our customers to proactively plan and adopt the technology transition, including the launch of our new R290 product line. We are well positioned to capitalize on increased demand levels for display case products throughout the calendar year.
“EMI delivered a solid performance in the second quarter, contributing to the over 100% total sales growth for Display Solutions. EMI sales were $23.4 million, substantially above what is historically a softer period for store renovations as our customers focus on the critical holiday shopping season. Sales were driven by favorable performance in the QSR, refueling/c-store and Grocery verticals.
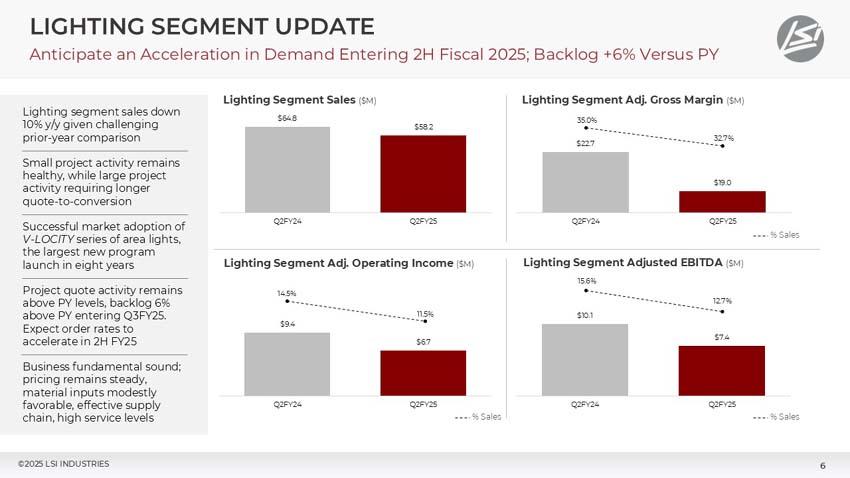
“Within the Lighting segment, overall sales were lower year-over-year against a challenging prior year comparison. Last year, we had several large lighting projects, including a multi-million-dollar installation at a new EV battery plant complex, that did not recur in the current year. While small project activity levels were healthy during the second quarter, those projects were not sufficient to offset softness in large project activity, resulting in a 10% year-over-year decline in Lighting segment sales.
“Importantly, Lighting segment project quote activity remains above prior-year levels, contributing to a segment book-to-bill of 1.1 exiting the second quarter which, on a historical basis, is elevated entering a seasonally slower period for our construction markets. While our Lighting segment backlog was 6% above the prior year exiting the second quarter, we expect order rates to accelerate as we enter the second half of our fiscal year.
“Innovation and new product vitality remains a central focus for our business. Over the last four years, we’ve launched more than 30 new products each year. In fiscal 2025, we anticipate more than 40 new product launches and refreshes, consistent with an innovation roadmap created to exceed specific customer requirements across each vertical market. During the second quarter, we launched multiple commercial programs designed to further accelerate adoption of our recent product launches, including our V-LOCITY series of outdoor area lights, new continuous indoor Linear fixtures, and Zone High Bay for sports court applications. Enhanced training and marketing programs for our sales force, agency partners, and customers have led to accelerated adoption of new products, consistent with our commercial strategy.”
Clark concluded, “LSI remains well positioned to drive continued, profitable growth entering the second half of our fiscal year 2025. Order rates and backlog remain strong; demand conditions across most end-markets are robust; and we’re capitalizing on favorable, multi-year secular opportunities where our vertically integrated, solutions-based model is uniquely suited to support our growing base of customers. We also continue to prioritize a combination of organic and inorganic growth, as outlined within our Fast Forward strategy, while maintaining our disciplined, returns-driven approach toward capital deployment.”
FISCAL 2025 SECOND QUARTER CONFERENCE CALL
A conference call will be held today at 11:00 A.M. ET to review the Company’s financial results and conduct a question-and-answer session.
A webcast of the conference call and accompanying presentation materials will be available in the Investor Relations section of LSI Industries’ website at www.lsicorp.com. Individuals can also participate by teleconference dial-in. To listen to a live broadcast, go to the site at least 15 minutes prior to the scheduled start time to register, download and install any necessary audio software.
| Domestic Live: | 877-407-4018 |
| International Live: | 201-689-8471 |
To listen to a replay of the teleconference, which subsequently will be available through November 21, 2024
| Domestic Replay: | 844-512-2921 |
| International Replay: | 412-317-6671 |
| Conference ID: | 13751021 |
ABOUT LSI INDUSTRIES
Headquartered in Cincinnati, LSI Industries (NASDAQ: LYTS) specializes in the creation of advanced lighting, graphics, and display solutions. The Company’s American-made products, which include lighting, print graphics, digital graphics, millwork, metal and refrigerated products, and custom displays, are engineered to elevate brands in competitive markets. With a workforce of approximately 1,900 employees and 16 facilities throughout North America, LSI is dedicated to providing top-quality solutions to its clients. Additional information about LSI is available at www.lsicorp.com.
FORWARD-LOOKING STATEMENTS
For details on the uncertainties that may cause our actual results to be materially different than those expressed in our forward-looking statements, visit https://investors.lsicorp.com as well as our Annual Reports on Form 10-K and Quarterly Reports on Form 10-Q which contain risk factors.
INVESTOR & MEDIA CONTACT
Noel Ryan, IRC
720.778.2415
LYTS@vallumadvisors.com
|
Three Months Ended |
Six Months Ended |
|||||||
|
(Unaudited) |
||||||||
|
2024 |
2023 |
(In thousands, except per share data) |
2024 |
2023 |
||||
|
$ 147,734 |
$ 109,005 |
Net sales |
$ 285,829 |
$ 232,446 |
||||
|
112,804 |
77,438 |
Cost of products sold |
217,147 |
163,943 |
||||
|
69 |
- |
Expense on step-up basis of acquired lease |
136 |
- |
||||
|
- |
31 |
Severance costs and restructuring costs |
38 |
378 |
||||
|
34,861 |
31,536 |
Gross profit |
68,508 |
68,125 |
||||
|
1,669 |
849 |
Long-term performance based compensation |
2,853 |
2,174 |
||||
|
- |
4 |
Severance costs and restructuring costs |
22 |
10 |
||||
|
1,408 |
1,190 |
Amortization expense of acquired intangible assets |
2,816 |
2,380 |
||||
|
- |
- |
Acquisition costs |
48 |
- |
||||
|
81 |
- |
Consulting expense: commercial growth initiatives |
81 |
19 |
||||
|
23,244 |
21,674 |
Selling and administrative costs |
45,098 |
44,695 |
||||
|
8,459 |
# |
7,819 |
Operating Income |
17,590 |
# |
18,847 |
||
|
382 |
(29) |
Other (income) expense |
322 |
67 |
||||
|
728 |
453 |
Interest expense, net |
1,603 |
1,019 |
||||
|
7,349 |
7,395 |
Income before taxes |
15,665 |
17,761 |
||||
|
1,702 |
1,489 |
Income tax |
3,336 |
3,827 |
||||
|
$ 5,647 |
$ 5,906 |
Net income |
$ 12,329 |
$ 13,934 |
||||
|
Weighted Average Common Shares Outstanding |
||||||||
|
29,930 |
29,024 |
Basic |
29,761 |
28,890 |
||||
|
30,876 |
30,043 |
Diluted |
30,709 |
29,949 |
||||
|
Earnings Per Share |
||||||||
|
$ 0.19 |
$ 0.20 |
Basic |
$ 0.41 |
$ 0.48 |
||||
|
$ 0.18 |
$ 0.20 |
Diluted |
$ 0.40 |
$ 0.47 |
||||
|
(amounts in thousands) |
||||||||
|
Decmber 31 |
June 30, |
|||||||
|
2024 |
2024 |
|||||||
|
Current assets |
$ | 163,405 | $ | 162,499 | ||||
|
Property, plant and equipment, net |
31,534 | 32,959 | ||||||
|
Other assets |
149,606 | 153,342 | ||||||
|
Total assets |
$ | 344,545 | $ | 348,800 | ||||
|
Current maturities of long-term debt |
$ | 3,571 | $ | 3,571 | ||||
|
Other current liabilities |
74,977 | 75,636 | ||||||
|
Long-term debt |
34,615 | 50,658 | ||||||
|
Other long-term liabilities |
14,267 | 14,580 | ||||||
|
Shareholders' equity |
217,115 | 204,355 | ||||||
| $ | 344,545 | $ | 348,800 | |||||
Three Months Ended December 31, 2024 Results
Net sales for the three months ended December 31, 2024, were $147.7 million representing an increase of 36% compared to the three months ended December 31, 2023, net sales of $109.0 million. Lighting Segment net sales of $58.2 million decreased 10% and Display Solutions Segment net sales of $89.5 million increased 103% from last year’s second quarter net sales. Net income for the three months ended December 31, 2024, was $5.6 million, or $0.18 per share, compared to $5.9 million or $0.20 per share for the three months ended December 31, 2023. Earnings per share represents diluted earnings per share.
Six Months Ended December 31, 2023 Results
Net sales for the six months ended December 31, 2024, were $285.8 million representing a 23% increase from the six months ended December 31, 2023, net sales of $232.4 million. Lighting Segment net sales of $116.6 million decreased 12% and Display Solutions Segment net sales of $169.2 million increased 69% from last year’s net sales. Net income for the six months ended December 31, 2024, was $12.3 million, or $0.40 per share, compared to $13.9 million or $0.47 per share for the six months ended December 31, 2023. Earnings per share represents diluted earnings per share.
Balance Sheet
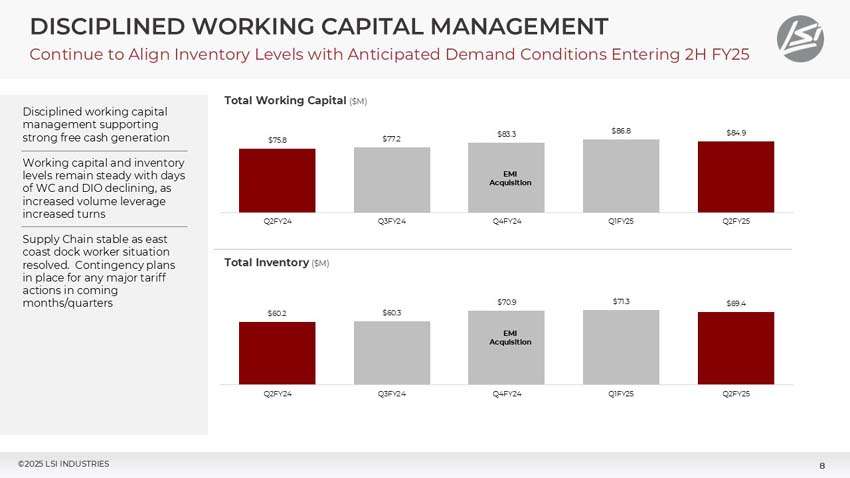
The balance sheet at December 31, 2024, included current assets of $163.4 million, current liabilities of $78.5 million and working capital of $84.9 million, which includes cash of $4.7 million. The current ratio was 2.1 to 1. The balance sheet also included shareholders’ equity of $217.1 million and long-term debt of $34.6 million. It is the Company’s priority to continuously generate sufficient cash flow, coupled with an approved credit facility, to adequately fund operations.
Cash Dividend Actions
The Board of Directors declared a regular quarterly cash dividend of $0.05 per share in connection with the second quarter of fiscal 2025, payable February 11, 2025, to shareholders of record as of the close of business on February 3, 2025. The indicated annual cash dividend rate is $0.20 per share. The Board of Directors has adopted a policy regarding dividends which provides that dividends will be determined by the Board of Directors in its discretion based upon its evaluation of earnings both on a GAAP and non-GAAP basis, cash flow requirements, financial condition, debt levels, stock repurchases, future business developments and opportunities, and other factors deemed relevant by the Board.
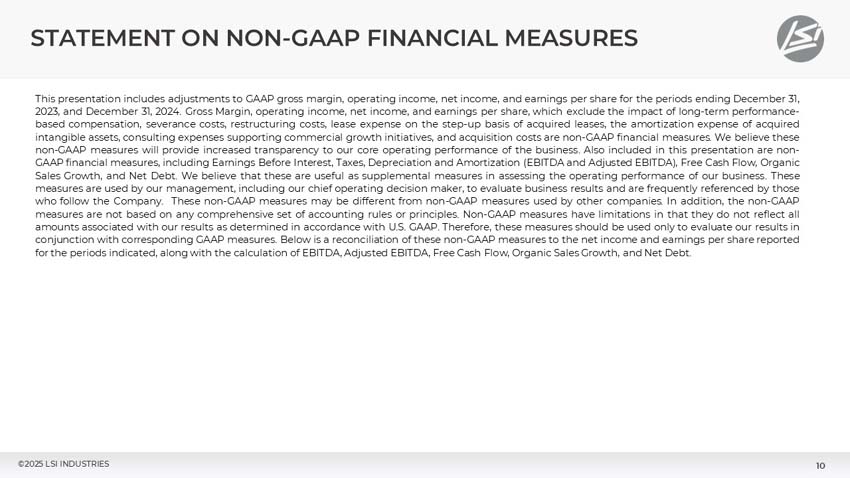
Non-GAAP Financial Measures
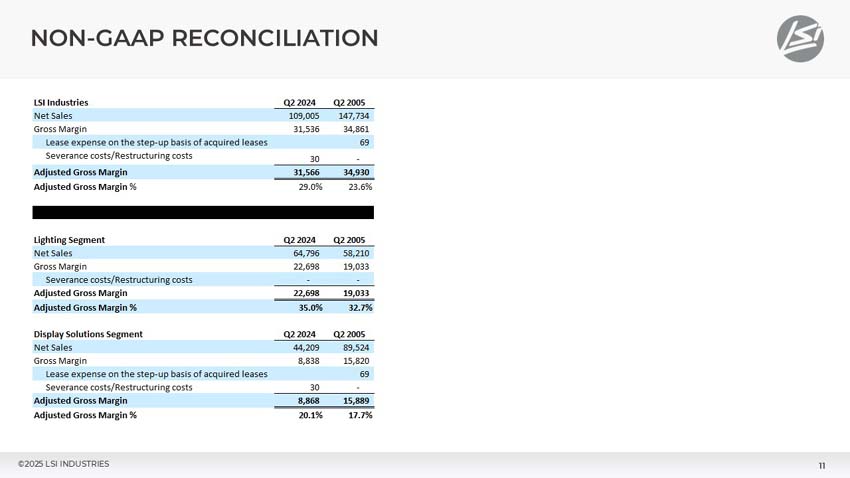
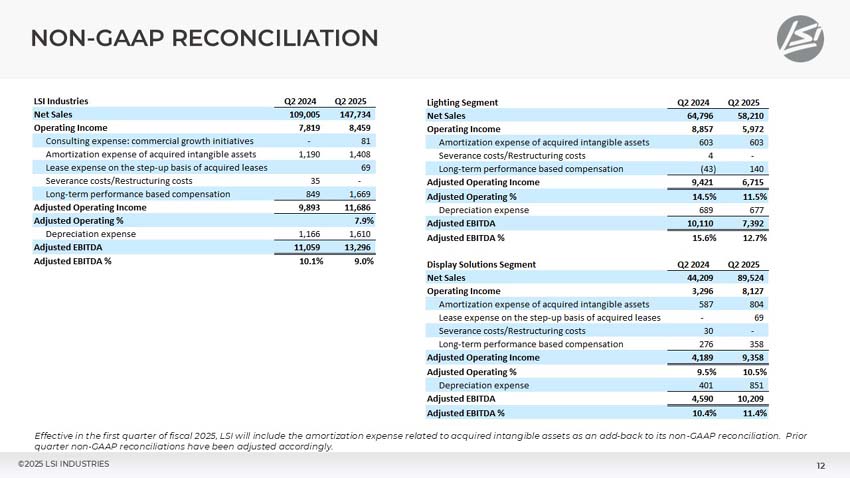
This press release includes adjustments to GAAP operating income, net income, and earnings per share for the three and six months ended December 31, 2024, and 2023. Operating income, net income, and earnings per share, which exclude the impact of long-term performance based compensation expense, the amortization expense of acquired intangible assets, commercial growth opportunity expense, acquisition costs, the lease expense on the step-up basis of acquired leases, and restructuring and severance costs, are non-GAAP financial measures. We further note that while the amortization expense of acquired intangible assets is excluded from the measures, the revenue of the acquired companies is reflected in the measures and the acquired assets contribute to revenue generation. We exclude these items because we believe they are not representative of the ongoing results of the operations of the business. Also included in this press release are non-GAAP financial measures, including Earnings Before Interest, Taxes, Depreciation and Amortization (EBITDA and Adjusted EBITDA), Net Debt to Adjusted EBITDA, Free Cash Flow, and organic sales growth. We believe that these are useful as supplemental measures in assessing the operating performance of our business. These measures are used by our management, including our chief operating decision maker, to evaluate business results, and are frequently referenced by those who follow the Company. These non-GAAP measures may be different from non-GAAP measures used by other companies. In addition, the non-GAAP measures are not based on any comprehensive set of accounting rules or principles. Non-GAAP measures have limitations, in that they do not reflect all amounts associated with our results as determined in accordance with U.S. GAAP. Therefore, these measures should be used only to evaluate our results in conjunction with corresponding GAAP measures. Below is a reconciliation of these non-GAAP measures to net income and earnings per share reported for the periods indicated along with the calculation of EBITDA, Adjusted EBITDA, Free Cash Flow, Net Debt to Adjusted EBITDA, and organic sales growth.
|
Three Months Ended |
Six Months Ended |
|||||||||||
|
(Unaudited) |
||||||||||||
|
2024 |
2023 |
% Change |
(In thousands, except per share data) |
2024 |
2023 |
% Change |
||||||
|
$ 147,734 |
$ 109,005 |
36% |
Net sales |
$ 285,829 |
$ 232,446 |
23% |
||||||
|
8,459 |
7,819 |
8% |
Operating income as reported |
17,590 |
18,847 |
-7% |
||||||
|
1,669 |
849 |
Long-term performance based compensation |
2,853 |
2,174 |
||||||||
|
81 |
- |
Consulting expense: commercial growth initiatives |
81 |
19 |
||||||||
|
- |
- |
Acquisition costs |
48 |
- |
||||||||
|
1,408 |
1,190 |
Amortization expense of acquired intangible assets |
2,816 |
2,380 |
||||||||
|
69 |
- |
Expense on step-up basis of acquired lease |
136 |
- |
||||||||
|
- |
35 |
Severance costs and Restructuring costs |
60 |
388 |
||||||||
|
$ 11,686 |
$ 9,893 |
18% |
Operating income as adjusted |
$ 23,584 |
$ 23,808 |
-1% |
||||||
|
$ 5,647 |
$ 5,906 |
-4% |
Net income as reported |
$ 12,329 |
$ 13,934 |
-12% |
||||||
|
$ 7,996 |
$ 7,249 |
10% |
Net income as adjusted |
$ 15,977 |
$ 16,859 |
-5% |
||||||
|
$ 0.18 |
$ 0.20 |
-7% |
Earnings per share (diluted) as reported |
$ 0.40 |
$ 0.47 |
-14% |
||||||
|
$ 0.26 |
$ 0.24 |
7% |
Earnings per share (diluted) as adjusted |
$ 0.52 |
$ 0.56 |
-8% |
||||||
|
Three Months Ended |
Six Months Ended |
|||||||||||
|
December 31 |
December 31 |
|||||||||||
|
2024 |
2023 |
(In thousands, except per share data) |
2024 |
2023 |
||||||||
|
Diluted EPS |
Diluted EPS |
Reconciliation of net income to adjusted net income |
Diluted EPS |
Diluted EPS |
||||||||
|
$ 5,647 |
$ 0.18 |
$ 5,906 |
$ 0.20 |
Net income as reported |
$ 12,329 |
$ 0.40 |
$ 13,934 |
$ 0.47 |
||||
|
1,294 |
0.04 |
625 |
0.02 |
Long-term performance based compensation |
2,161 |
$ 0.07 |
1,599 |
0.05 |
||||
|
1,090 |
0.04 |
885 |
0.03 |
Amortization expense of acquired intangible assets |
2,132 |
$ 0.07 |
1,755 |
0.06 |
||||
|
62 |
- |
- |
- |
Consulting expense: commercial growth initiatives |
62 |
$ - |
13 |
- |
||||
|
- |
- |
34 |
- |
Severance costs and Restructuring costs |
45 |
$ - |
290 |
0.01 |
||||
|
- |
- |
- |
- |
Acquisition costs |
50 |
- |
- |
|||||
|
53 |
- |
- |
- |
Expense on step-up basis of acquired lease |
103 |
$ 0.01 |
- |
- |
||||
|
(150) |
- |
(201) |
(0.01) |
Tax rate difference between reported and adjusted |
(905) |
$ (0.03) |
(732) |
(0.03) |
||||
|
$ 7,996 |
$ 0.26 |
$ 7,249 |
$ 0.24 |
Net income adjusted |
$ 15,977 |
$ 0.52 |
$ 16,859 |
$ 0.56 |
||||
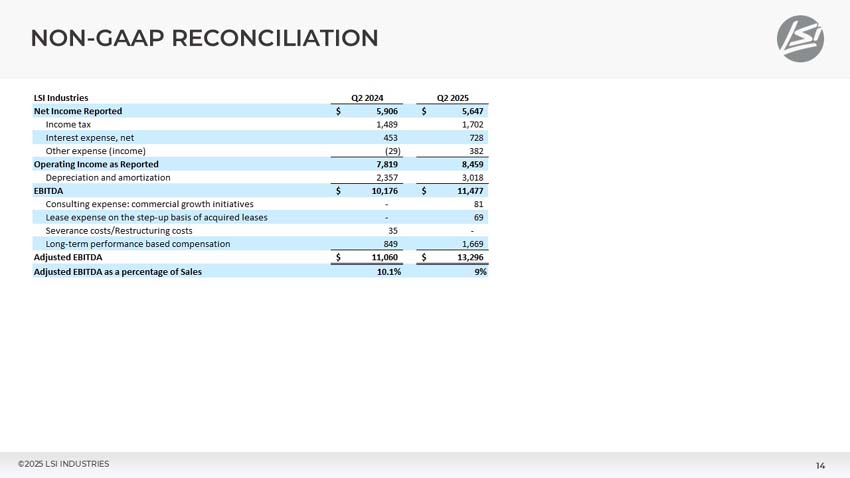
|
Three Months Ended |
(Unaudited; In thousands) |
Six Months Ended |
||||||||||
|
Net Income to Adjusted EBITDA |
||||||||||||
|
2024 |
2023 |
% Change |
2024 |
2023 |
% Change |
|||||||
|
$ 5,647 |
$ 5,906 |
Net income as reported |
$ 12,329 |
$ 13,934 |
||||||||
|
1,702 |
1,489 |
Income tax |
3,336 |
3,827 |
||||||||
|
728 |
453 |
Interest expense, net |
1,603 |
1,019 |
||||||||
|
382 |
(29) |
Other (income) expense |
322 |
67 |
||||||||
|
$ 8,459 |
$ 7,819 |
8% |
Operating Income as reported |
$ 17,590 |
$ 18,847 |
-7% |
||||||
|
3,018 |
2,357 |
Depreciation and amortization |
5,958 |
4,728 |
||||||||
|
$ 11,477 |
$ 10,176 |
13% |
EBITDA |
$ 23,548 |
$ 23,575 |
0% |
||||||
|
1,669 |
849 |
Long-term performance based compensation |
2,853 |
2,174 |
||||||||
|
81 |
- |
Consulting expense: commercial growth initiatives |
81 |
19 |
||||||||
|
- |
- |
Acquisition costs |
48 |
- |
||||||||
|
69 |
- |
Expense on step-up basis of acquired lease |
136 |
- |
||||||||
|
- |
35 |
Severance costs and Restructuring costs |
60 |
388 |
||||||||
|
$ 13,296 |
$ 11,060 |
20% |
Adjusted EBITDA |
$ 26,726 |
$ 26,156 |
2% |
||||||
|
9.0% |
10.1% |
Adjusted EBITDA as a percentage of sales |
9.4% |
11.3% |
||||||||
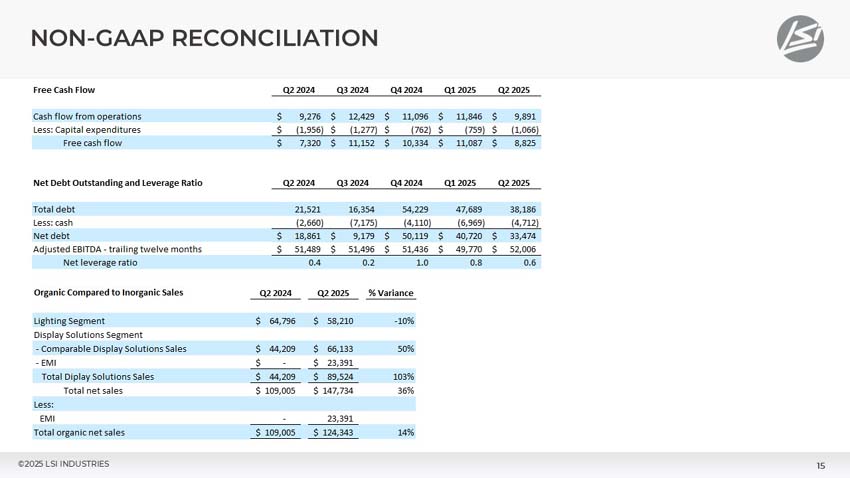
|
Three Months Ended |
(Unaudited; In thousands) |
Six Months Ended |
||||||||||
|
Free Cash Flow |
||||||||||||
|
2024 |
2023 |
% Change |
2024 |
2023 |
% Change |
|||||||
|
$ 9,891 |
$ 9,276 |
7% |
Cash flow from operations |
$ 21,737 |
$ 19,868 |
9% |
||||||
|
(1,066) |
(1,956) |
Capital expenditures |
(1,825) |
(3,349) |
||||||||
|
$ 8,825 |
$ 7,320 |
21% |
Free cash flow |
$ 19,912 |
$ 16,519 |
21% |
||||||
|
Net Debt to Adjusted EBITDA Ratio |
December 31 |
June 30 |
||||||
|
(amounts in thousands) |
2024 |
2024 |
||||||
|
Current maturity of debt |
$ | 3,571 | $ | 3,571 | ||||
|
Long-term debt |
34,615 | 50,658 | ||||||
|
Total debt |
$ | 38,186 | $ | 54,229 | ||||
|
Less: cash |
(4,712 | ) | (4,110 | ) | ||||
|
Net debt |
$ | 33,474 | $ | 50,119 | ||||
|
Adjusted EBITDA - trailing twelve months |
$ | 52,006 | $ | 51,436 | ||||
|
Net debt to adjusted EBITDA ratio |
0.6 | 1.0 | ||||||
|
Organic compared to Inorganic Sales |
Q2 2024 |
Q2 2025 |
% Variance |
|||||||||
|
Lighting Segment |
$ | 64,796 | $ | 58,210 | -10 | % | ||||||
|
Display Solutions Segment |
||||||||||||
|
- Comparable Display Solutions Sales |
$ | 44,209 | $ | 66,133 | 50 | % | ||||||
|
- EMI |
$ | - | $ | 23,391 | ||||||||
|
Total Diplay Solutions Sales |
$ | 44,209 | $ | 89,524 | 103 | % | ||||||
|
Total net sales |
$ | 109,005 | $ | 147,734 | 36 | % | ||||||
|
Less: |
||||||||||||
|
EMI |
- | 23,391 | ||||||||||
|
Total organic net sales |
$ | 109,005 | $ | 124,343 | 14 | % | ||||||
|
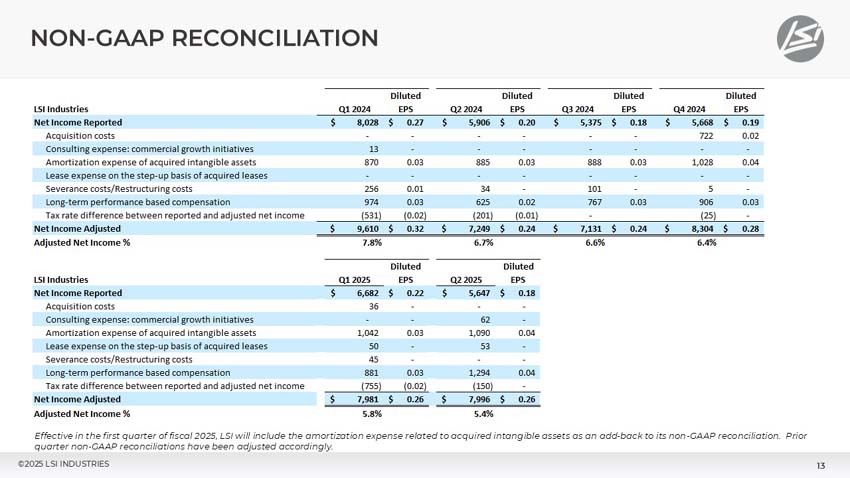
Reconciliation of net income to adjusted net income - Six quarter view |
|
FY 2024 |
||||||||||||||||
|
Q1 2024 |
Diluted EPS |
Q2 2024 |
Diluted EPS |
|||||||||||||
|
Net income reported |
$ | 8,028 | $ | 0.27 | $ | 5,906 | $ | 0.20 | ||||||||
|
Consulting expense: commercial growth initiatives |
13 | - | - | - | ||||||||||||
|
Amortization expense of acquired intangible assets |
870 | 0.03 | 885 | 0.03 | ||||||||||||
|
Severance costs/Restructuring costs |
256 | 0.01 | 34 | - | ||||||||||||
|
Long-term performance based compensation |
974 | 0.03 | 625 | 0.02 | ||||||||||||
|
Tax rate difference between reported and adjusted net income |
(531 | ) | (0.02 | ) | (201 | ) | (0.01 | ) | ||||||||
|
Net income adjusted |
$ | 9,610 | $ | 0.32 | $ | 7,249 | $ | 0.24 | ||||||||
|
Adjusted net income % |
7.8 | % | 6.7 | % | ||||||||||||
|
FY 2024 |
||||||||||||||||
|
Q3 2024 |
Diluted EPS |
Q4 2024 |
Diluted EPS |
|||||||||||||
|
Net income reported |
$ | 5,375 | $ | 0.18 | $ | 5,668 | $ | 0.19 | ||||||||
|
Acquisition costs |
- | - | 722 | 0.02 | ||||||||||||
|
Amortization expense of acquired intangible assets |
888 | 0.03 | 1,028 | 0.04 | ||||||||||||
|
Severance costs/Restructuring costs |
101 | - | 5 | - | ||||||||||||
|
Long-term performance based compensation |
767 | 0.03 | 906 | 0.03 | ||||||||||||
|
Tax rate difference between reported and adjusted net income |
- | (25 | ) | - | ||||||||||||
|
Net income adjusted |
$ | 7,131 | $ | 0.24 | $ | 8,304 | $ | 0.28 | ||||||||
|
Adjusted net income % |
6.6 | % | 6.4 | % | ||||||||||||
|
FY 2025 |
||||||||||||||||
|
Q1 2025 |
Diluted EPS |
Q2 2025 |
Diluted EPS |
|||||||||||||
|
Net income reported |
$ | 6,682 | $ | 0.22 | $ | 5,647 | $ | 0.18 | ||||||||
|
Acquisition costs |
36 | - | - | - | ||||||||||||
|
Consulting expense: commercial growth initiatives |
- | - | 62 | - | ||||||||||||
|
Amortization expense of acquired intangible assets |
1,042 | 0.03 | 1,090 | 0.04 | ||||||||||||
|
Lease expense on the step-up basis of acquired leases |
50 | - | 53 | - | ||||||||||||
|
Severance costs/Restructuring costs |
45 | - | - | - | ||||||||||||
|
Long-term performance based compensation |
881 | 0.03 | 1,294 | 0.04 | ||||||||||||
|
Tax rate difference between reported and adjusted net income |
(755 | ) | (0.02 | ) | (150 | ) | - | |||||||||
|
Net income adjusted |
$ | 7,981 | $ | 0.26 | $ | 7,996 | $ | 0.26 | ||||||||
|
Adjusted net income % |
5.8 | % | 5.4 | % | ||||||||||||
Exhibit 99.2